International Seminar on Deep Foundations Seminario Internacional de Fundaciones Profundas Pile Prediction Event Evento de Prediccion -- Pilotes Santa Cruz, Bolivia, April 23 – 25, 2013 Bengt H. Fellenius

Welcome message from author
This document is posted to help you gain knowledge. Please leave a comment to let me know what you think about it! Share it to your friends and learn new things together.
Transcript

International Seminar on Deep Foundations
Seminario Internacional de Fundaciones Profundas
Pile Prediction Event
Evento de Prediccion -- Pilotes
Santa Cruz, Bolivia, April 23 – 25, 2013
Bengt H. Fellenius


0
5
10
15
20
25
DE
PT
H (
m) 1.2 m
17.5 m 2.5 m
15.0
m
O-cell
EB
EB
600 mm
2.9 m GW1.0 m
4.0 m
7.0 m
10.0 m
13.0 m
16.0 m
1.8 m
4.1 m
7.1 m8.6 m
9.6 m
Groundsurface
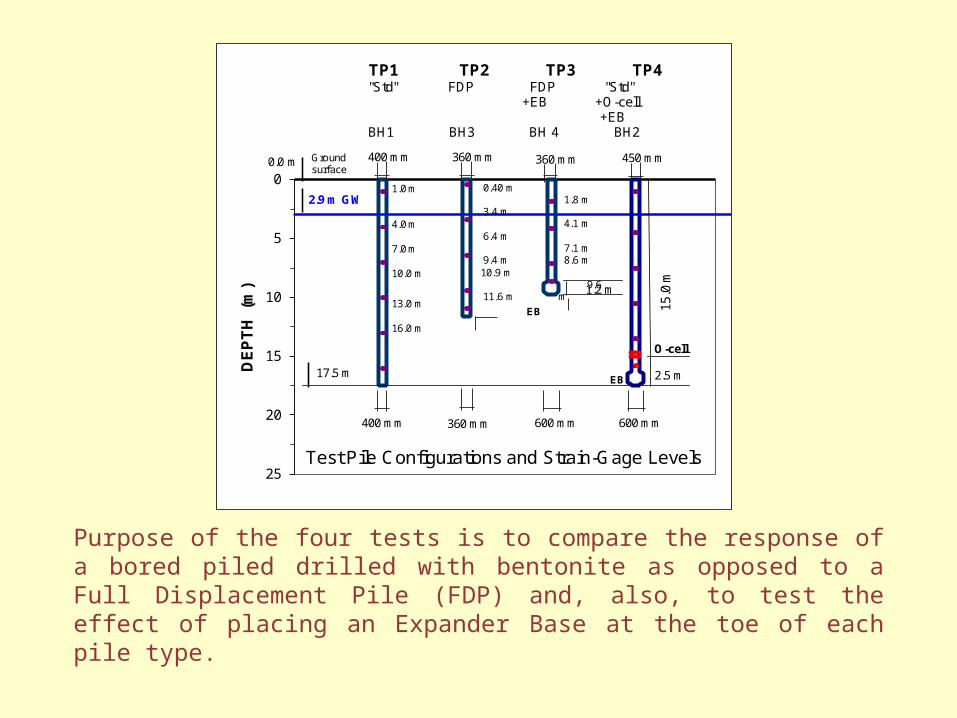
Test Pile Configurations and Strain-Gage Levels
360 mm400 mm 600 mm
TP1 TP2 TP3 TP4"Std" FDP FDP "Std"
+EB +O-cell+EB
BH1 BH3 BH 4 BH2
0.0 m 400 mm 360 mm 360 mm 450 mm
0.40 m
3.4 m
6.4 m
9.4 m10.9 m
11.6 m
Purpose of the four tests is to compare the response of a bored piled drilled with bentonite as opposed to a Full Displacement Pile (FDP) and, also, to test the effect of placing an Expander Base at the toe of each pile type.
0
5
10
15
20
5 10 15 20 25 30
NO
RT
H-S
OU
TH
EAST-WEST
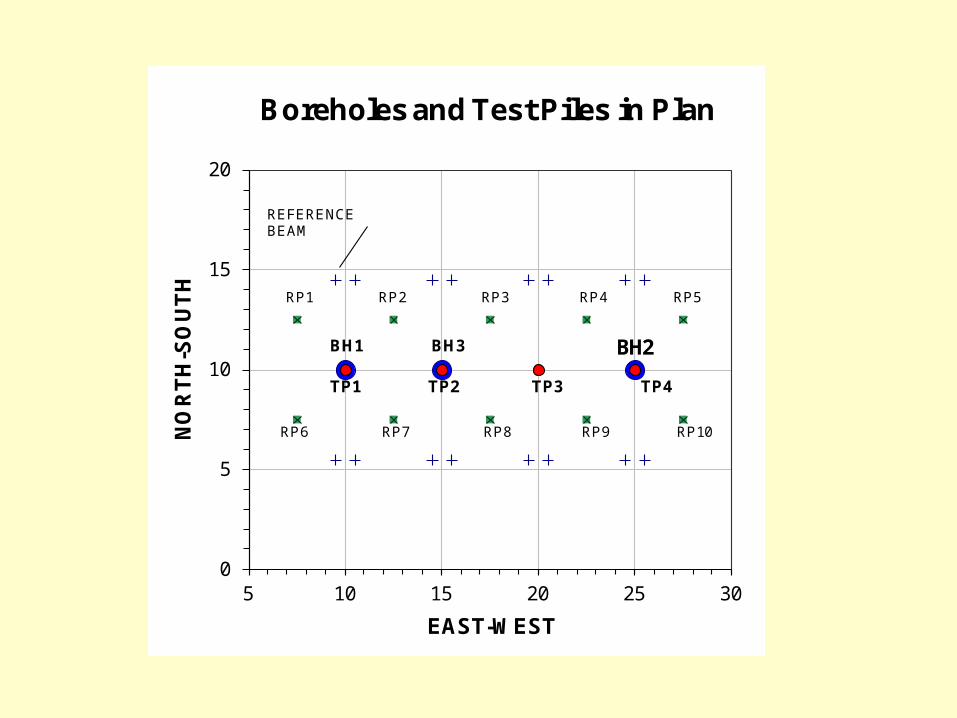
BH1 BH3
TP1 TP2 TP3 TP4
Boreholes and Test Piles in Plan
RP1 RP2 RP3 RP4 RP5
RP6 RP7 RP8 RP9 RP10
REFERENCE BEAM
BH2

0
2
4
6
8
10
12
14
16
18
20
0 10 20 30 40 50
DE
PT
H (
m)
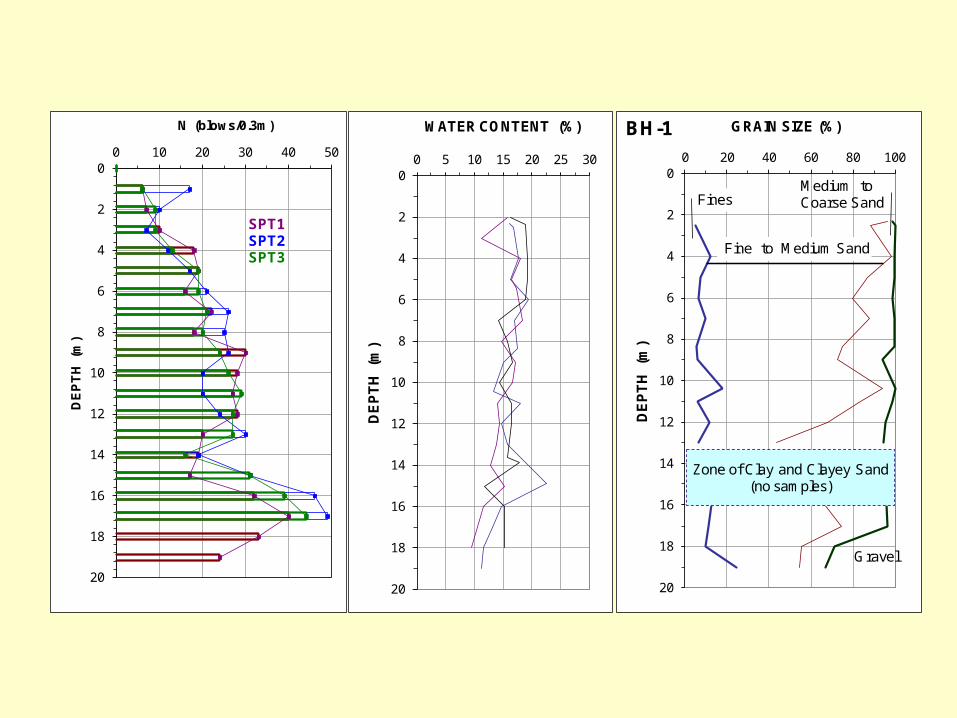
N (blows/0.3m)
SPT1SPT2SPT3
0
2
4
6
8
10
12
14
16
18
20
0 5 10 15 20 25 30
DE
PT
H (
m)
WATER CONTENT (%)
0
2
4
6
8
10
12
14
16
18
20
0 20 40 60 80 100
DE
PT
H (
m)
GRAIN SIZE (%)
Fine to Medium Sand
Medium to Coarse SandFines
Gravel
Zone of Clay and Clayey Sand (no samples)
BH-1


0
1
2
3
4
5
6
7
8
9
10
11
12
0 10 20 30
CONE STRESS, qc (MPa)
DE
PT
H (
m)
CPT1 CPT2
CPT3 CPT4

Bengt’s Rule
Never miss a chance to share a challenge with good friends
The Prediction
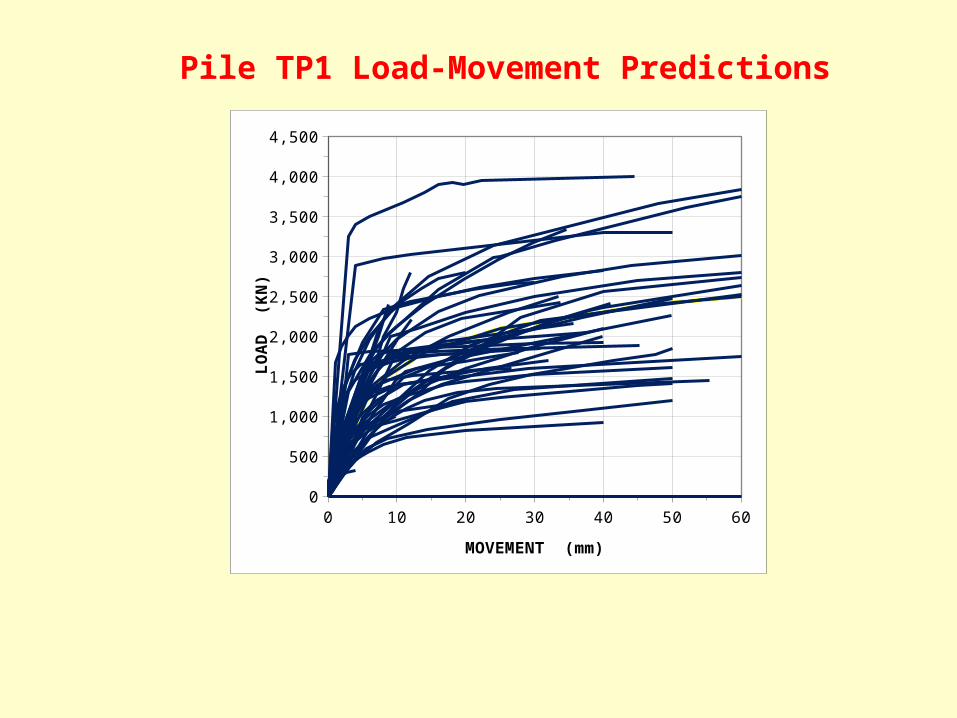
Predict the pile-head load-movement curve for the four test piles
and
Determine the capacity of the pile from each load-movement curve
Bengt’s Philosophy
If my prediction is wrong, I expect my friends to forget it.
If I am right, I will not let them forget it!
0 10 20 30 40 50 600
500
1,000
1,500
2,000
2,500
3,000
3,500
4,000
4,500
MOVEMENT (mm)
LO
AD
(K
N)
Pile TP1 Load-Movement Predictions

Pile TP1 Capacity Evaluations
0
500
1,000
1,500
2,000
2,500
3,000
3,500
4,000
4,500
0 10 20 30 40 50 60
LOAD
(KN
)
MOVEMENT (mm)
18
Rea
ltiv
e F
req
uen
cy
Values
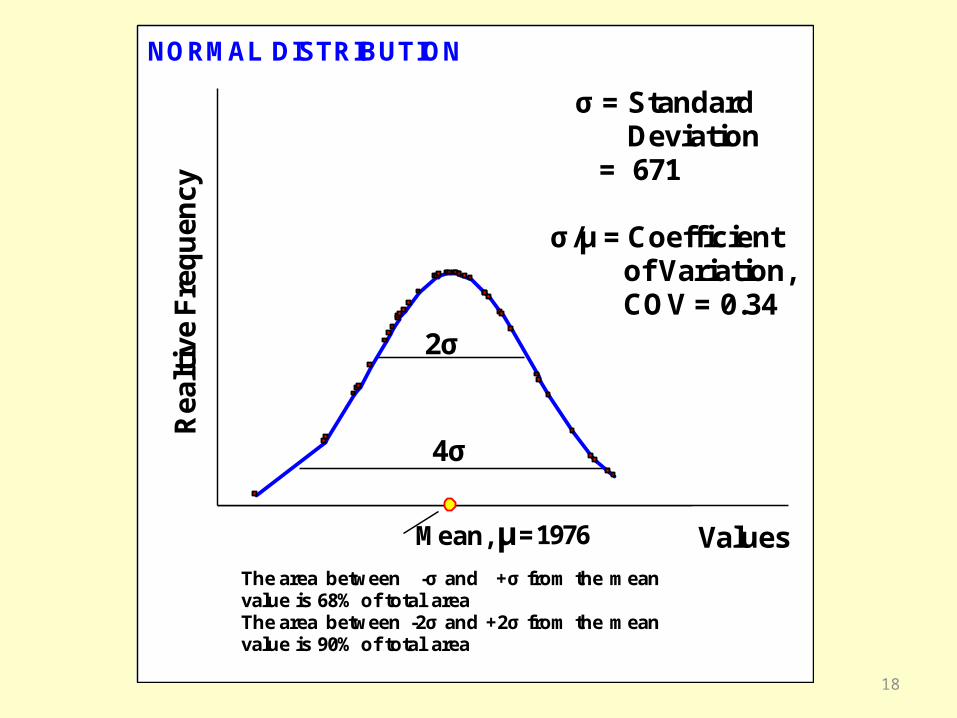
σ = StandardDeviation
= 671
σ/µ = Coefficient of Variation,COV = 0.34
The area between -σ and +σ from the mean value is 68% of total areaThe area between -2σ and +2σ from the mean value is 90% of total area
Mean, µ
NORMAL DISTRIBUTION
2σ
4σ
= 1976
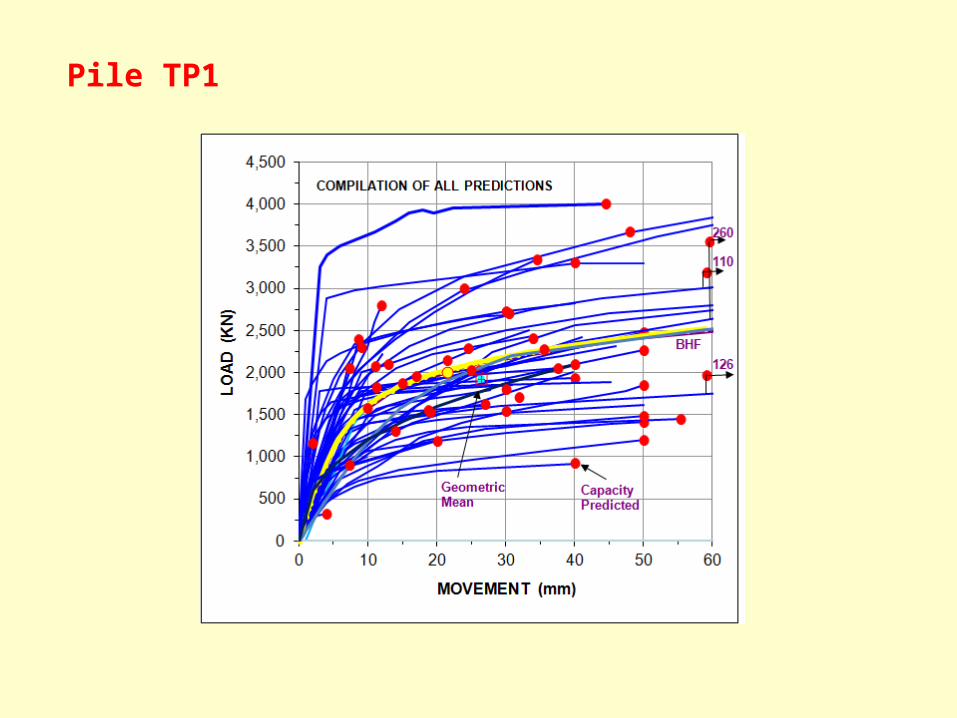
Pile TP1

20
0
500
1,000
1,500
2,000
2,500
3,000
0 25 50 75 100 125 150
LO
AD
(K
N)
MOVEMENT (mm)
UniPile Calculations
TP1
Head
Shaft
Toe
"Capacity"
21
0
100
200
0 10 20 30 40 50 60 70 80 90 100PR
ED
ICT
ED
CA
PA
CIT
Y
= 1
00
MOVEMENT (mm)
220130
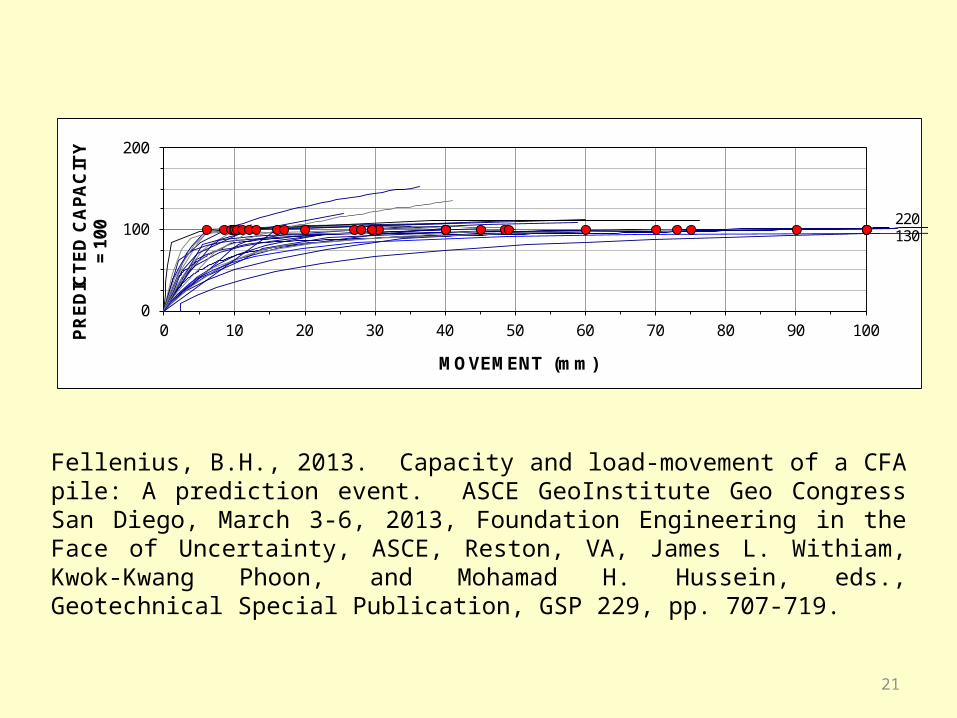
Fellenius, B.H., 2013. Capacity and load-movement of a CFA pile: A prediction event. ASCE GeoInstitute Geo Congress San Diego, March 3-6, 2013, Foundation Engineering in the Face of Uncertainty, ASCE, Reston, VA, James L. Withiam, Kwok-Kwang Phoon, and Mohamad H. Hussein, eds., Geotechnical Special Publication, GSP 229, pp. 707-719.

Pile TP1 Now with the results of the static loading test
0
500
1,000
1,500
2,000
2,500
3,000
3,500
4,000
4,500
0 10 20 30 40 50 60
LO
AD
(K
N)
MOVEMENT (mm)
BHF
Geometric Mean
260
110
126
COMPILATION OF ALL PREDICTIONS
Capacity Predicted

Pile TP2
0
500
1,000
1,500
2,000
2,500
3,000
3,500
0 10 20 30 40 50 60
LO
AD
(K
N)
MOVEMENT (mm)
BHF
Geometric Mean
95
6368
COMPILATION OF ALL PREDICTIONS, TP2
Capacity Predicted

Pile TP2
0
500
1,000
1,500
2,000
2,500
3,000
3,500
0 10 20 30 40 50 60
LO
AD
(K
N)
MOVEMENT (mm)
BHF
Geometric Mean
95
6368
COMPILATION OF ALL PREDICTIONS, TP2
Capacity Predicted
Now with the results of the static loading test
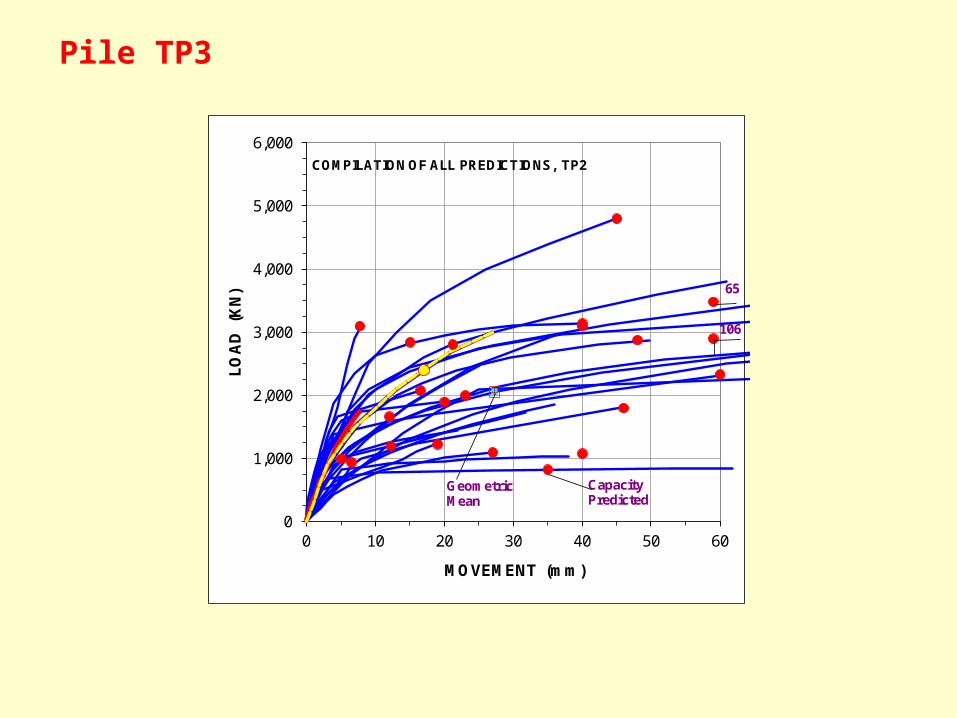
Pile TP3
0
1,000
2,000
3,000
4,000
5,000
6,000
0 10 20 30 40 50 60
LO
AD
(K
N)
MOVEMENT (mm)
Geometric Mean
65
106
COMPILATION OF ALL PREDICTIONS, TP2
Capacity Predicted

0
1,000
2,000
3,000
4,000
5,000
6,000
7,000
8,000
9,000
10,000
0 10 20 30 40 50 60
LO
AD
(K
N)
MOVEMENT (mm)
82
COMPILATION OF ALL PREDICTIONS
O-cell upward
O-cell upward
Pile TP4
O-cell downward


0
2
4
6
8
10
12
14
16
18
20
0 500 1,000 1,500 2,000 2,500
DE
PT
H (
m)
LOAD (KN)
Pile TP1 – Bored with Bentonite Pile TP2 -- FDP

Pile TP2 Pile TP3 – with Expander Base

Pile TP1

Pile TP2

Pile TP3

CONCLUSIONS
The shaft resistance of the FDP pile was about twice or more than the pile drilled with bentonite.
The stiffness of the about 10 m long FDP pile was about equal to or better than that of the about twice as long pile drilled with bentonite.
The Expander Base provided a significantly increased stiffness to both the pile drilled with bentonite and the FDP pile.
We need to decide on how we determine pile capacity, or the various factors of safety and LRFD-values could be rather meaningless.
The prediction event and my participation in the test have been most enjoyable. I hoped I have been able to convey this to you.
Thank You

Related Documents


