Feeding of western gray whales during a seismic survey near Sakhalin Island, Russia S. B. Yazvenko & T. L. McDonald & S. A. Blokhin & S. R. Johnson & H. R. Melton & M. W. Newcomer & R. Nielson & P. W. Wainwright Received: 21 April 2006 / Accepted: 11 April 2007 / Published online: 7 August 2007 # Springer Science + Business Media B.V. 2007 Abstract Exxon Neftegas Limited, as operator of the Sakhalin-1 consortium, is developing oil and gas re- serves on the continental shelf off northeast Sakhalin Island, Russia. DalMorNefteGeofizika (DMNG) on be- half of the Sakhalin-1 consortium conducted a 3-D seismic survey of the Odoptu license area during 17 August–9 September 2001. A portion of the primary feeding area of the endangered western gray whale (Eschrichtius robustus) is located in the vicinity of the seismic survey. This paper presents data to assess wheth- er western gray whale bottom feeding activity, as indicated by visible mud plumes, was affected by seismic operations. The mitigation and monitoring pro- gram associated with the seismic survey included aerial surveys during 19 July–19 November 2001. These aerial surveys documented the local and regional distribution, abundance, and bottom feeding activity of western gray whales. Data on gray whale feeding activity before, during and after the seismic survey were collected, with the whales assumed to be feeding on the benthos if mud plumes were observed on the surface. The data were used to assess the influence of seismic survey and other factors (including environmental) on feeding activity of western gray whales. A stepwise multiple regression analysis failed to find a statistically significant effect (a =0.05) of the seismic survey on frequency of occurrence of mud plumes of western gray whales used as a proxy to evaluate bottom feeding activity in Piltun feeding area. The regression indicated that transect number (a proxy for water depth, related to distance from shore) and swell height (a proxy for sea state) were the only variables that had a significant ef- fect on frequency of whale mud plumes. It is concluded that the 2001 seismic survey had no measurable effect (a =0.05) on bottom feeding activity of western gray whales off Sakhalin Island. Environ Monit Assess (2007) 134:93–106 DOI 10.1007/s10661-007-9810-3 M.W. Newcomer, deceased S. B. Yazvenko (*) : S. R. Johnson : P. W. Wainwright LGL Limited, environmental research associates, 9768 Second Street, Sidney, BC V8L 3Y8, Canada e-mail: [email protected] T. L. McDonald : R. Nielson Western EcoSystems Technology, 2003 Central Avenue, Cheyenne, WY 82001, USA S. A. Blokhin Pacific Research Center for Fisheries and Oceanography (TINRO-Center), 4 Shevchenko Alley, Vladivostok 690950, Russia H. R. Melton ExxonMobil Upstream Research, P.O. Box 2189, 3319 Mercer Street, Houston, TX 77252-2189, USA M. W. Newcomer 22371 Hartman Dr., Los Altos, CA 94024, USA

Welcome message from author
This document is posted to help you gain knowledge. Please leave a comment to let me know what you think about it! Share it to your friends and learn new things together.
Transcript
Feeding of western gray whales during a seismic survey nearSakhalin Island, Russia
S. B. Yazvenko & T. L. McDonald & S. A. Blokhin &
S. R. Johnson & H. R. Melton & M. W. Newcomer &
R. Nielson & P. W. Wainwright
Received: 21 April 2006 /Accepted: 11 April 2007 / Published online: 7 August 2007# Springer Science + Business Media B.V. 2007
Abstract Exxon Neftegas Limited, as operator of theSakhalin-1 consortium, is developing oil and gas re-serves on the continental shelf off northeast SakhalinIsland, Russia. DalMorNefteGeofizika (DMNG) on be-half of the Sakhalin-1 consortium conducted a 3-Dseismic survey of the Odoptu license area during 17
August–9 September 2001. A portion of the primaryfeeding area of the endangered western gray whale(Eschrichtius robustus) is located in the vicinity of theseismic survey. This paper presents data to assess wheth-er western gray whale bottom feeding activity, asindicated by visible mud plumes, was affected byseismic operations. The mitigation and monitoring pro-gram associated with the seismic survey included aerialsurveys during 19 July–19November 2001. These aerialsurveys documented the local and regional distribution,abundance, and bottom feeding activity of western graywhales. Data on gray whale feeding activity before,during and after the seismic survey were collected, withthe whales assumed to be feeding on the benthos if mudplumes were observed on the surface. The data wereused to assess the influence of seismic survey and otherfactors (including environmental) on feeding activity ofwestern gray whales. A stepwise multiple regressionanalysis failed to find a statistically significant effect(a=0.05) of the seismic survey on frequency ofoccurrence of mud plumes of western gray whalesused as a proxy to evaluate bottom feeding activity inPiltun feeding area. The regression indicated thattransect number (a proxy for water depth, related todistance from shore) and swell height (a proxy for seastate) were the only variables that had a significant ef-fect on frequency of whale mud plumes. It is concludedthat the 2001 seismic survey had no measurable effect(a=0.05) on bottom feeding activity of western graywhales off Sakhalin Island.
Environ Monit Assess (2007) 134:93–106DOI 10.1007/s10661-007-9810-3
M.W. Newcomer, deceased
S. B. Yazvenko (*) : S. R. Johnson : P. W. WainwrightLGL Limited, environmental research associates,9768 Second Street,Sidney, BC V8L 3Y8, Canadae-mail: [email protected]
T. L. McDonald :R. NielsonWestern EcoSystems Technology,2003 Central Avenue,Cheyenne, WY 82001, USA
S. A. BlokhinPacific Research Center for Fisheries and Oceanography(TINRO-Center),4 Shevchenko Alley,Vladivostok 690950, Russia
H. R. MeltonExxonMobil Upstream Research,P.O. Box 2189, 3319 Mercer Street,Houston, TX 77252-2189, USA
M. W. Newcomer22371 Hartman Dr.,Los Altos, CA 94024, USA
Keywords Feeding activity . Mud plume .
Multiple regression . Sakhalin Island . Odoptu .
Seismic survey . Air gun .Western gray whales .
Environment . Oil . Continental shelf
Introduction
The Western North Pacific population of gray whale(Eschrichtius robustus), hereinafter western gray whale,feeds off northeastern Sakhalin Island, Russia. Aprimary feeding area (Piltun feeding area) lies parallelto shore from 52°37.5′ N to 53°37.5′ N in a narrowstrip (ca. 100×5 km) mainly within the 20-m isobathalong the coast of northeast Sakhalin Island andadjacent to Piltun Bay. Western gray whales are oneof the most endangered populations of large cetaceans.The International Union for the Conservation of Nature(IUCN) listed the western gray whale as critically en-dangered, based on its geographic and genetic separa-tion from the eastern population (LeDuc et al. 2002)and because of the likelihood that fewer than 50 repro-ductively active individuals remain in the population(Hilton-Taylor 2000). This population is also listed asCategory 1 (“threatened by extinction”) in the Red Bookof the Russian Federation (Anonymous 2001).
Exxon Neftegas Limited, as operator of the Sakhalin-1consortium, is developing oil and gas reserves onthe nearshore continental shelf off northeast SakhalinIsland, Russia. DalMorNefteGeofizika (DMNG) onbehalf of the Sakhalin-1 consortium conducted a 3-Dseismic survey of the Odoptu license area during 17August–9 September 2001. The data presented herewere collected to evaluate whether the feeding activi-ty of western gray whales was affected during thisseismic survey. Feeding activity index is defined asthe proportion of gray whale groups observed withmud plumes relative to the total number of gray whalegroups recorded in the Piltun survey grid. To reduceand assess potential impacts of the seismic survey onwestern gray whales, mitigation and monitoring pro-grams were designed and implemented (Johnson 2002;Johnson et al. 2007). One component of the monitor-ing program included replicated and systematic aerialsurveys. The aerial surveys determined the local andregional distribution, abundance and bottom feeding-related activity of western gray whales. The distribu-tion and abundance of gray whales in relation to the
2001 Odoptu 3-D seismic survey are addressed else-where (Yazvenko et al. 2007).
This paper presents the results of observations ofgray whale bottom feeding-related activity before,during and after the seismic survey in 2001. The goalof this study was to determine whether the feedingactivity index changed in relation to the seismic sur-vey. Specifically, the objectives were (1) to determineif bottom feeding activity of gray whales was affectedby the seismic survey in the Odoptu Block area andassess the influence of various environmental factorsand seismic-survey related parameters on this activity,and (2) to characterize the spatial and temporal var-iability of feeding activity of gray whales within thestudy area. “Feeding” is used throughout the paper toindicate the activity resulting in visible mud plumes.No inference is made related to the quantity and qualityof food intake resulting from this activity.
Materials and methods
Aerial survey area
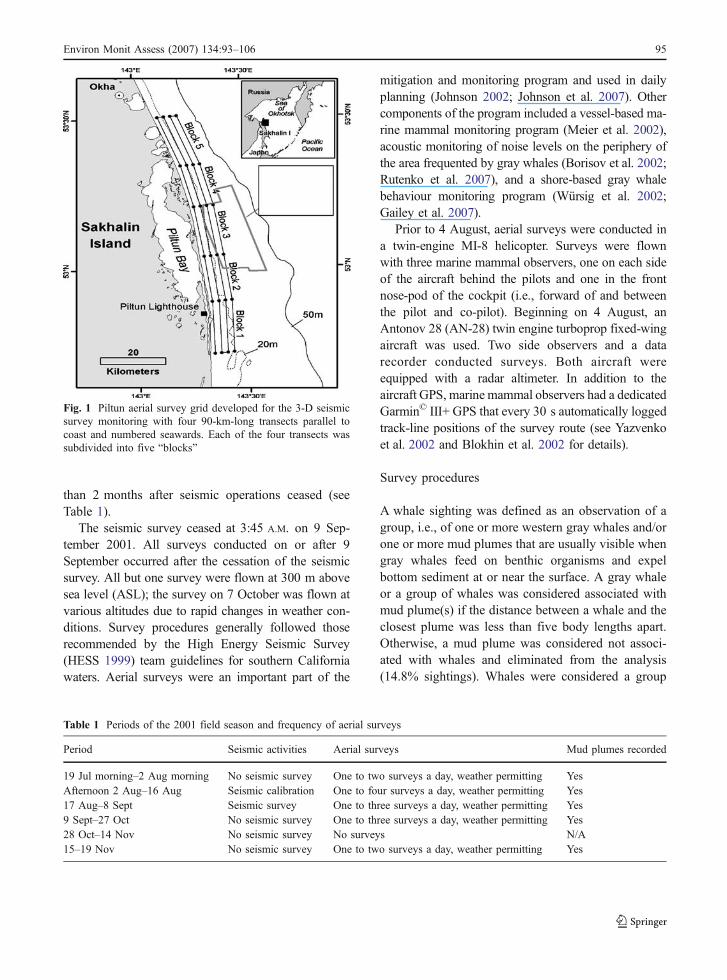
The Piltun aerial survey grid developed for the 3-Dseismic survey covered coastal areas, (two transects inwaters <20 m deep; two transect lines (hereinafterBlines”) outside the 20 m isobath), near and seawardof Piltun Bay and adjacent to the Odoptu seismicblock, i.e., areas where gray whales have been foundto aggregate to feed (Blokhin et al. 1985, 2002, 2003,2004; Berzin et al. 1988, 1990, 1991; Blokhin 1996;Sobolevsky 2000, 2001; Weller et al. 2000, 2001;Yazvenko et al. 2002; Vladimirov et al. 2005; Meieret al. 2007). Four ∼90-km long lines were establishedparallel to the shore, spaced 2 km apart covering from52° 43′ N to 53° 31′ N; each line was subdivided intofive “blocks” numbered sequentially from south tonorth (Fig. 1). This sampling grid included all areaswhere western gray whales were known to feed in thePiltun feeding area prior to 2001.
Survey design
After several attempts failed due to weather, the firstsuccessful aerial survey was flown on 19 July. Sur-veys were usually conducted daily or several timesper day, weather permitting, until 19 November, more
94 Environ Monit Assess (2007) 134:93–106
than 2 months after seismic operations ceased (seeTable 1).
The seismic survey ceased at 3:45 A.M. on 9 Sep-tember 2001. All surveys conducted on or after 9September occurred after the cessation of the seismicsurvey. All but one survey were flown at 300 m abovesea level (ASL); the survey on 7 October was flown atvarious altitudes due to rapid changes in weather con-ditions. Survey procedures generally followed thoserecommended by the High Energy Seismic Survey(HESS 1999) team guidelines for southern Californiawaters. Aerial surveys were an important part of the
mitigation and monitoring program and used in dailyplanning (Johnson 2002; Johnson et al. 2007). Othercomponents of the program included a vessel-based ma-rine mammal monitoring program (Meier et al. 2002),acoustic monitoring of noise levels on the periphery ofthe area frequented by gray whales (Borisov et al. 2002;Rutenko et al. 2007), and a shore-based gray whalebehaviour monitoring program (Würsig et al. 2002;Gailey et al. 2007).
Prior to 4 August, aerial surveys were conducted ina twin-engine MI-8 helicopter. Surveys were flownwith three marine mammal observers, one on each sideof the aircraft behind the pilots and one in the frontnose-pod of the cockpit (i.e., forward of and betweenthe pilot and co-pilot). Beginning on 4 August, anAntonov 28 (AN-28) twin engine turboprop fixed-wingaircraft was used. Two side observers and a datarecorder conducted surveys. Both aircraft wereequipped with a radar altimeter. In addition to theaircraft GPS, marine mammal observers had a dedicatedGarmin© III+ GPS that every 30 s automatically loggedtrack-line positions of the survey route (see Yazvenkoet al. 2002 and Blokhin et al. 2002 for details).
Survey procedures
A whale sighting was defined as an observation of agroup, i.e., of one or more western gray whales and/orone or more mud plumes that are usually visible whengray whales feed on benthic organisms and expelbottom sediment at or near the surface. A gray whaleor a group of whales was considered associated withmud plume(s) if the distance between a whale and theclosest plume was less than five body lengths apart.Otherwise, a mud plume was considered not associ-ated with whales and eliminated from the analysis(14.8% sightings). Whales were considered a group
Table 1 Periods of the 2001 field season and frequency of aerial surveys
Period Seismic activities Aerial surveys Mud plumes recorded
19 Jul morning–2 Aug morning No seismic survey One to two surveys a day, weather permitting YesAfternoon 2 Aug–16 Aug Seismic calibration One to four surveys a day, weather permitting Yes17 Aug–8 Sept Seismic survey One to three surveys a day, weather permitting Yes9 Sept–27 Oct No seismic survey One to three surveys a day, weather permitting Yes28 Oct–14 Nov No seismic survey No surveys N/A15–19 Nov No seismic survey One to two surveys a day, weather permitting Yes
Fig. 1 Piltun aerial survey grid developed for the 3-D seismicsurvey monitoring with four 90-km-long transects parallel tocoast and numbered seawards. Each of the four transects wassubdivided into five “blocks”
Environ Monit Assess (2007) 134:93–106 95
using the same criterion (less than five body lengthsbetween whales). GPS coordinates were recorded asway-points at the point of closest approach to a graywhale/plume sighted during the survey, i.e., when thewhale and/or plume was directly perpendicular to theaircraft. Clinometers were used to measure the ver-tical angle to gray whale individuals and groups, aswell as to mud plumes. These angles were used todetermine the distance of the sighting from the air-craft. Location information for seismic support ves-sels and small craft was recorded in the same manneras for whales and mud plumes.
During an average 4.1 min surface-respiration-divecycle recorded in 2001 in the Piltun feeding area(“surface time” plus “dive time” in Würsig et al. 2002),gray whales spent approximately 1.6±1.84 min onthe surface (“surface time”) and 2.5±0.92 min under-water (“dive time”). Thus, gray whales were on thesurface for about 40% of the time in the Piltun feed-ing area, though the variability of “surface time” washigh. At ground speeds of ∼180 km/h for the MI-8 and∼200 km/h for the AN-28, the availability of graywhales (Buckland et al. 1993) averaged 0.446 for bothaircraft and all sightability conditions (J. Muir, LGLLimited, unpublished data).
Data analysis
The geographic areas defined by each of the fiveblocks×four line combinations (Fig. 1) were viewed asthe main experimental units upon which whale sightings,environmental variables, and seismic survey variableswere measured. Only 3.5% of gray whales were sightedon lines 3 (covering the strip 4–6 km offshore) and 4(covering the strip 6–8 km offshore), the two linesfarthest offshore, which lie for the most part outside the20-m isobath (Yazvenko et al. 2002). Therefore, 96.5%of the sighted gray whales were located within 4 km ofshore. Because a high proportion of zeros (surveyswithout whale sightings) on lines 3 and 4 wouldadversely influence the stability of the analyses, lines3 and 4 were excluded from the analyses. Similarly,only 1% of whales were sighted on all lines in block 5,the northernmost of the five surveyed blocks (Fig. 1);therefore, data from this block were omitted from theanalyses.
The response variable for this analysis was theproportion of feeding groups of whales observedduring each survey of each of the eight blocks
(geographic areas). Whale groups engaged in feedingbehavior were defined to be those observed in closeproximity to a feeding plume. If a group of whales wasassociated with a feeding plume, it was assumed thatall members of the group were feeding. The responseof the logistic regression analysis can be written,
Feeding Index ¼ pi ¼ fi=wi;
where fi was the number of groups of whales observedon survey i definitely associated with a feeding plume,and wi was the number of groups of whales on survey ithat were associated with a feeding plume (i.e., fi) plusthe number of groups of whales definitely notassociated with a feeding plume. A survey was definedas one flight over one of the geographic areas.
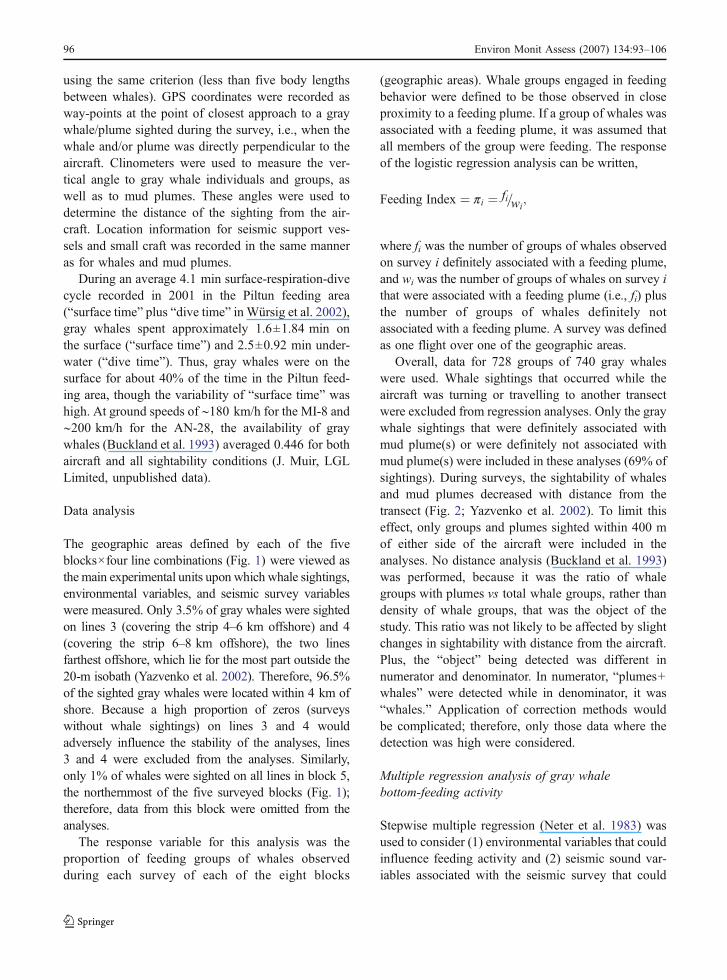
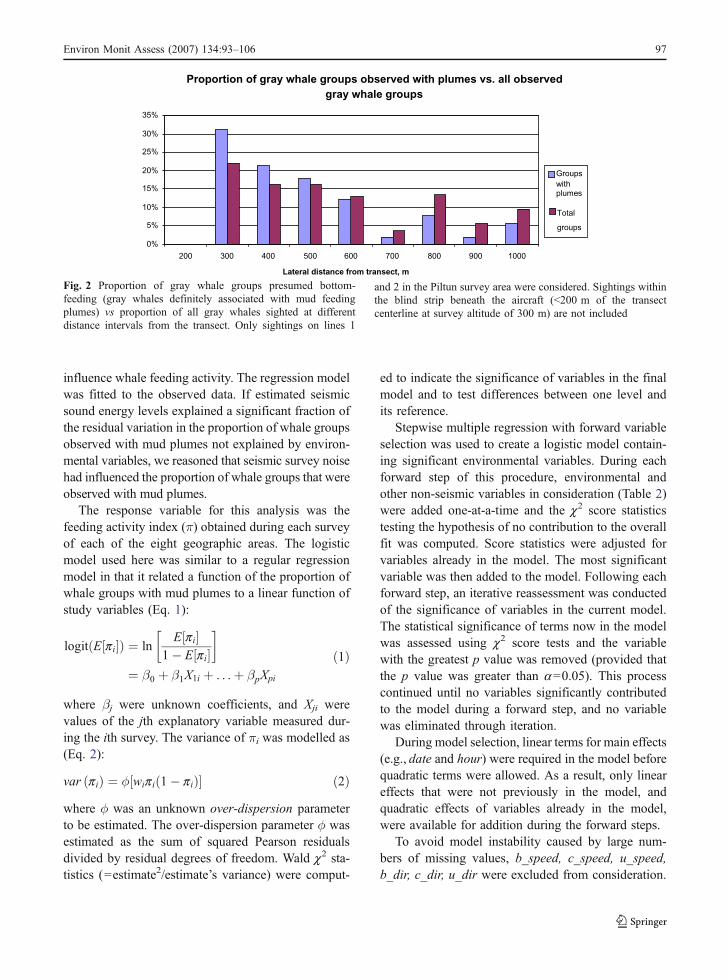
Overall, data for 728 groups of 740 gray whaleswere used. Whale sightings that occurred while theaircraft was turning or travelling to another transectwere excluded from regression analyses. Only the graywhale sightings that were definitely associated withmud plume(s) or were definitely not associated withmud plume(s) were included in these analyses (69% ofsightings). During surveys, the sightability of whalesand mud plumes decreased with distance from thetransect (Fig. 2; Yazvenko et al. 2002). To limit thiseffect, only groups and plumes sighted within 400 mof either side of the aircraft were included in theanalyses. No distance analysis (Buckland et al. 1993)was performed, because it was the ratio of whalegroups with plumes vs total whale groups, rather thandensity of whale groups, that was the object of thestudy. This ratio was not likely to be affected by slightchanges in sightability with distance from the aircraft.Plus, the “object” being detected was different innumerator and denominator. In numerator, “plumes+whales” were detected while in denominator, it was“whales.” Application of correction methods wouldbe complicated; therefore, only those data where thedetection was high were considered.
Multiple regression analysis of gray whalebottom-feeding activity
Stepwise multiple regression (Neter et al. 1983) wasused to consider (1) environmental variables that couldinfluence feeding activity and (2) seismic sound var-iables associated with the seismic survey that could
96 Environ Monit Assess (2007) 134:93–106
influence whale feeding activity. The regression modelwas fitted to the observed data. If estimated seismicsound energy levels explained a significant fraction ofthe residual variation in the proportion of whale groupsobserved with mud plumes not explained by environ-mental variables, we reasoned that seismic survey noisehad influenced the proportion of whale groups that wereobserved with mud plumes.
The response variable for this analysis was thefeeding activity index (π) obtained during each surveyof each of the eight geographic areas. The logisticmodel used here was similar to a regular regressionmodel in that it related a function of the proportion ofwhale groups with mud plumes to a linear function ofstudy variables (Eq. 1):
logit E pi½ �ð Þ ¼ lnE pi½ �
1� E pi½ �� �
¼ β0 þ β1X1i þ . . .þ βpXpi
ð1Þ
where βj were unknown coefficients, and Xji werevalues of the jth explanatory variable measured dur-ing the ith survey. The variance of πi was modelled as(Eq. 2):
var pið Þ ¼ φ wipi 1� pið Þ½ � ð2Þwhere φ was an unknown over-dispersion parameterto be estimated. The over-dispersion parameter φ wasestimated as the sum of squared Pearson residualsdivided by residual degrees of freedom. Wald c2 sta-tistics (=estimate2/estimate’s variance) were comput-
ed to indicate the significance of variables in the finalmodel and to test differences between one level andits reference.
Stepwise multiple regression with forward variableselection was used to create a logistic model contain-ing significant environmental variables. During eachforward step of this procedure, environmental andother non-seismic variables in consideration (Table 2)were added one-at-a-time and the c2 score statisticstesting the hypothesis of no contribution to the overallfit was computed. Score statistics were adjusted forvariables already in the model. The most significantvariable was then added to the model. Following eachforward step, an iterative reassessment was conductedof the significance of variables in the current model.The statistical significance of terms now in the modelwas assessed using c2 score tests and the variablewith the greatest p value was removed (provided thatthe p value was greater than a=0.05). This processcontinued until no variables significantly contributedto the model during a forward step, and no variablewas eliminated through iteration.
During model selection, linear terms for main effects(e.g., date and hour) were required in the model beforequadratic terms were allowed. As a result, only lineareffects that were not previously in the model, andquadratic effects of variables already in the model,were available for addition during the forward steps.
To avoid model instability caused by large num-bers of missing values, b_speed, c_speed, u_speed,b_dir, c_dir, u_dir were excluded from consideration.
Proportion of gray whale groups observed with plumes vs. all observedgray whale groups
0%
5%
10%
15%
20%
25%
30%
35%
200 300 400 500 600 700 800 900 1000
Lateral distance from transect, m
Groupswithplumes
Total
groups
Fig. 2 Proportion of gray whale groups presumed bottom-feeding (gray whales definitely associated with mud feedingplumes) vs proportion of all gray whales sighted at differentdistance intervals from the transect. Only sightings on lines 1
and 2 in the Piltun survey area were considered. Sightings withinthe blind strip beneath the aircraft (<200 m of the transectcenterline at survey altitude of 300 m) are not included
Environ Monit Assess (2007) 134:93–106 97
Multiple collinearity (Neter et al. 1983) existed be-tween line and depth (Pearson correlation coefficientr=0.88) and between sun and overcast (r=−0.824);therefore, depth and sun were dropped from consid-eration. Because wave_height was included in themodel and served as a reliable measure of sea state,
sea state was subsequently removed. The variableB2T1, shoreward distance from the center of the blockto the point where sound energy estimates werecalculated, was unique to every block and therebywas confounded with the block variable. B2T1 wasdropped from consideration because block was easier
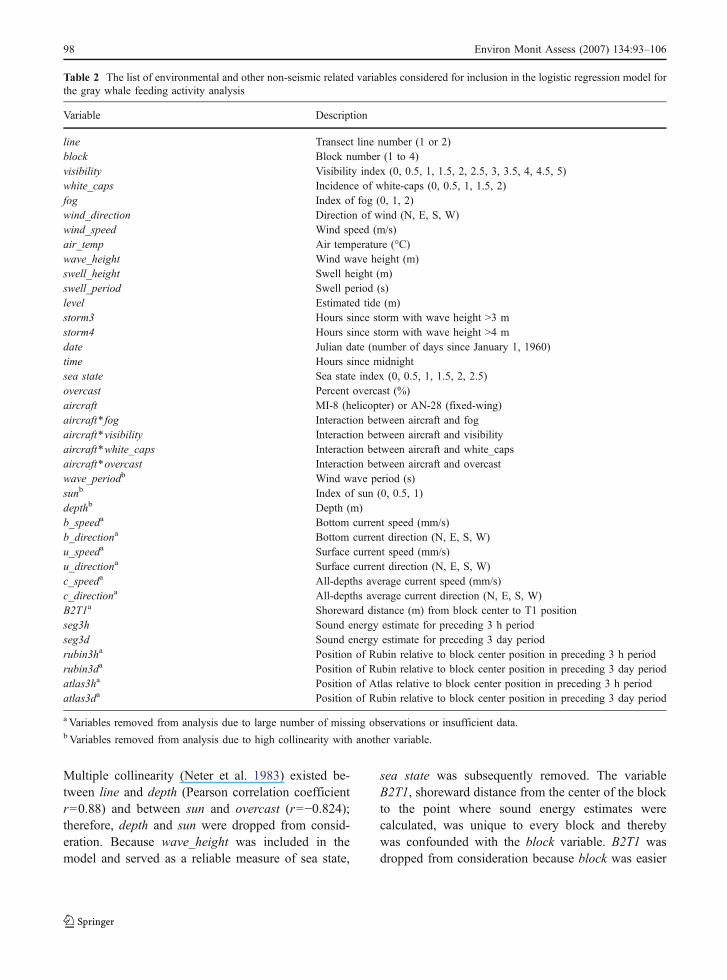
Table 2 The list of environmental and other non-seismic related variables considered for inclusion in the logistic regression model forthe gray whale feeding activity analysis
Variable Description
line Transect line number (1 or 2)block Block number (1 to 4)visibility Visibility index (0, 0.5, 1, 1.5, 2, 2.5, 3, 3.5, 4, 4.5, 5)white_caps Incidence of white-caps (0, 0.5, 1, 1.5, 2)fog Index of fog (0, 1, 2)wind_direction Direction of wind (N, E, S, W)wind_speed Wind speed (m/s)air_temp Air temperature (°C)wave_height Wind wave height (m)swell_height Swell height (m)swell_period Swell period (s)level Estimated tide (m)storm3 Hours since storm with wave height >3 mstorm4 Hours since storm with wave height >4 mdate Julian date (number of days since January 1, 1960)time Hours since midnightsea state Sea state index (0, 0.5, 1, 1.5, 2, 2.5)overcast Percent overcast (%)aircraft MI-8 (helicopter) or AN-28 (fixed-wing)aircraft*fog Interaction between aircraft and fogaircraft*visibility Interaction between aircraft and visibilityaircraft*white_caps Interaction between aircraft and white_capsaircraft*overcast Interaction between aircraft and overcastwave_periodb Wind wave period (s)sunb Index of sun (0, 0.5, 1)depthb Depth (m)b_speeda Bottom current speed (mm/s)b_directiona Bottom current direction (N, E, S, W)u_speeda Surface current speed (mm/s)u_directiona Surface current direction (N, E, S, W)c_speeda All-depths average current speed (mm/s)c_directiona All-depths average current direction (N, E, S, W)B2T1a Shoreward distance (m) from block center to T1 positionseg3h Sound energy estimate for preceding 3 h periodseg3d Sound energy estimate for preceding 3 day periodrubin3ha Position of Rubin relative to block center position in preceding 3 h periodrubin3da Position of Rubin relative to block center position in preceding 3 day periodatlas3ha Position of Atlas relative to block center position in preceding 3 h periodatlas3da Position of Rubin relative to block center position in preceding 3 day period
a Variables removed from analysis due to large number of missing observations or insufficient data.b Variables removed from analysis due to high collinearity with another variable.
98 Environ Monit Assess (2007) 134:93–106
to interpret. To avoid fitting too many parameters inthe model, interactions between any of the categoricalvariables – aircraft, visibility, white_caps, fog, andovercast – were not considered in this analysis. One ofthe important variables that would be beneficial to thelogistic regression analysis, prey availability, was notconsidered because of the lack of site-specific data.
Certain variables listed in Table 2 represented in-dustrial effects and were not considered for inclusionin model as environmental variables. Some of theseindustrial variables relied on definition of a ‘T1’point. The T1 point for each of the 20 geographicareas in the study area (Fig. 1) was the geographiccenter of the area, except in cases where thegeographic center was in water less than 20 m deep.In those cases, the T1 point was moved perpendic-ularly offshore to the closest point on the 20-misobath (Yazvenko et al. 2002). Autonomous sono-buoys with bottom-mounted hydrophones were used tomeasure received sound levels in the study area in thefrequency band 10–5000 Hz and to transmit them to ashore station where the signals were monitored in realtime. Sonobuoys were deployed along the 20-misobath, at the offshore edge of the Piltun feedingarea (Rutenko et al. 2007). The shift of the T1 pointfarther offshore towards the seismic source was aconservative step to allow for a more specific andaccurate determination of estimated seismic energyreaching the block. This determination was based oncase-by-case modelling of propagation from the offsetT1 point to the geographic center of the geographic area.
Seismic survey-related variables of interest includ-ed estimates of total sound energy, seg, at T1 duringthe 3-h (seg3h) and 3-day (seg3d) period preceding anaerial survey (Yazvenko et al. 2002). An estimate ofsound energy from the seismic survey for specificlocations and time periods was computed based onthe gun volume of the shots during that period. Theseestimates were computed by (1) computation of soundenergy per shot at 1 m from the source, (2) compu-tation of sound attenuation through the water col-umn using a simple spreading model, specifically 25×log10(distance), (3) computation of received energyfor each seismic shot by applying the spreading mod-el to the distance between the sound source and T1locations, and (4) summation of the resulting esti-mates of received energy per shot at T1 locations overthe time period of interest.
Sound energy 1 m from the source during both thecalibration and seismic survey was estimated for100 in3 (55% of the shots), 370 in3 (2.5%), 1,640 in3
(40%) and 3,090 in3 (2.5%) air gun volumes (Borisovet al. 2002; Rutenko et al. 2007). Sound energy 1 mfrom source was estimated for the remaining air gunvolumes by interpolation. Average energy received atT1 locations per shot for all shots in a given periodwas estimated by dividing the sum of the individualshot energies (from the previous steps) by the numberof shots fired during the relevant period.
Following stepwise selection of a model containingenvironmental variables, seg3h and seg3d were addedseparately to the model containing significant environ-mental variables. The “best” of the three models wasdetermined by inspection of individual Wald t tests forseg3h and seg3d and choosing the one with thesmallest p value (a≤0.05). If both seismic variableshad p values greater than a=0.05, i.e., their effects onthe model were statistically insignificant at a=0.05,and the model containing only environmental variableswas chosen as the “best” of the three models. Signifi-cance of any seismic sound term would indicate aseismic survey effect if a statistically significant portionof the variation of whale feeding activity could beexplained by sound energy variables that could nototherwise be explained by environmental conditions.
To check that temporal autocorrelation in the pro-portion of whales with mud plumes was not adverselyaffecting significance levels of terms in the finallogistic model, deviance residuals from the final modelwere assessed for temporal correlation using Moran’s Istatistic (Moran 1950). The Moran’s I varies between−1.0 and +1.0. If the points that are close together intime have similar values, the Moran’s I value is high. Iftemporal correlation was found in the residuals,generalized mixed linear model estimation procedureswere used to specifically allow for temporal correla-tion. However, generalized mixed linear models weredifficult to construct and were avoided when possible.
Results
To more closely examine trends in feeding activityduring the study period, the mud-plume dive datawere partitioned into time periods that correspondedto the different seismic survey regimes (Fig. 3).
Environ Monit Assess (2007) 134:93–106 99
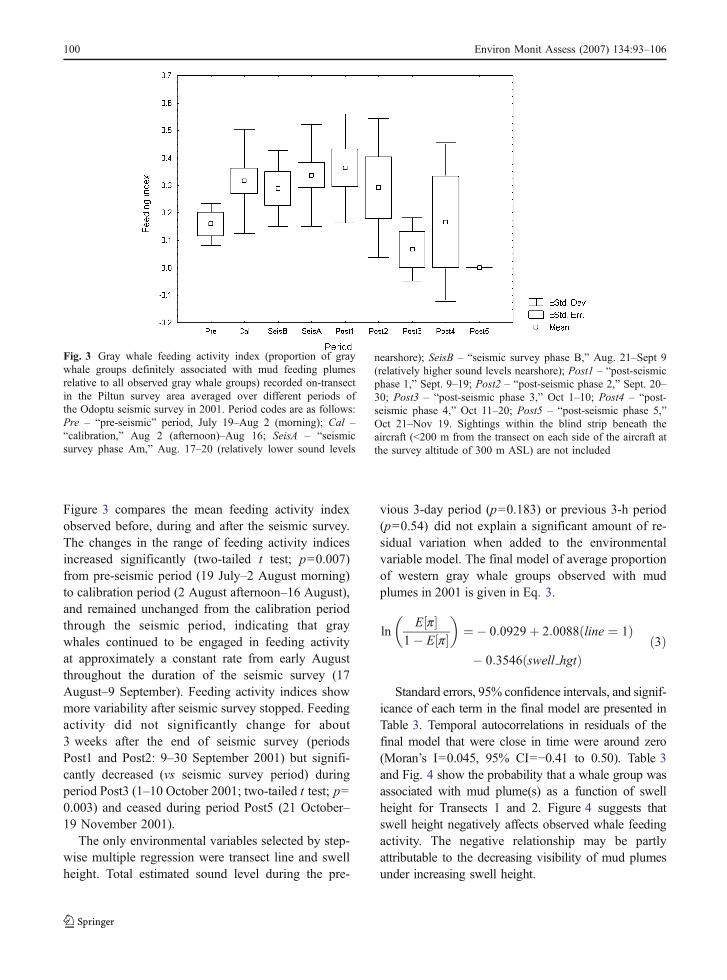
Figure 3 compares the mean feeding activity indexobserved before, during and after the seismic survey.The changes in the range of feeding activity indicesincreased significantly (two-tailed t test; p=0.007)from pre-seismic period (19 July–2 August morning)to calibration period (2 August afternoon–16 August),and remained unchanged from the calibration periodthrough the seismic period, indicating that graywhales continued to be engaged in feeding activityat approximately a constant rate from early Augustthroughout the duration of the seismic survey (17August–9 September). Feeding activity indices showmore variability after seismic survey stopped. Feedingactivity did not significantly change for about3 weeks after the end of seismic survey (periodsPost1 and Post2: 9–30 September 2001) but signifi-cantly decreased (vs seismic survey period) duringperiod Post3 (1–10 October 2001; two-tailed t test; p=0.003) and ceased during period Post5 (21 October–19 November 2001).
The only environmental variables selected by step-wise multiple regression were transect line and swellheight. Total estimated sound level during the pre-
vious 3-day period (p=0.183) or previous 3-h period(p=0.54) did not explain a significant amount of re-sidual variation when added to the environmentalvariable model. The final model of average proportionof western gray whale groups observed with mudplumes in 2001 is given in Eq. 3.
lnE p½ �
1� E p½ �� �
¼� 0:0929þ 2:0088 line ¼ 1ð Þ
� 0:3546 swell hgtð Þð3Þ
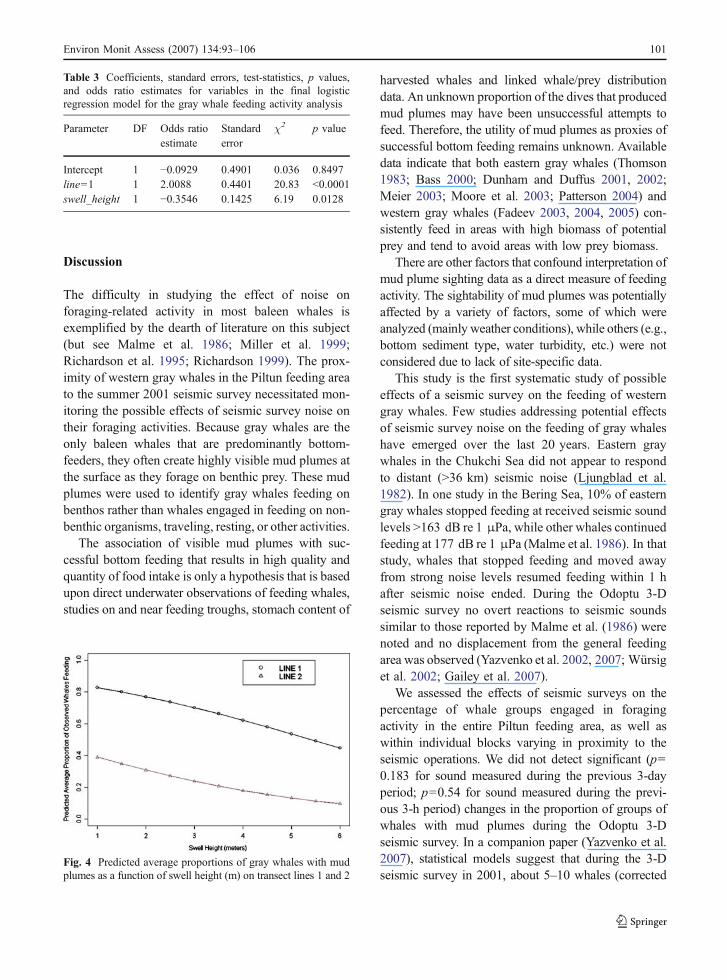
Standard errors, 95% confidence intervals, and signif-icance of each term in the final model are presented inTable 3. Temporal autocorrelations in residuals of thefinal model that were close in time were around zero(Moran’s I=0.045, 95% CI=−0.41 to 0.50). Table 3and Fig. 4 show the probability that a whale group wasassociated with mud plume(s) as a function of swellheight for Transects 1 and 2. Figure 4 suggests thatswell height negatively affects observed whale feedingactivity. The negative relationship may be partlyattributable to the decreasing visibility of mud plumesunder increasing swell height.
Fig. 3 Gray whale feeding activity index (proportion of graywhale groups definitely associated with mud feeding plumesrelative to all observed gray whale groups) recorded on-transectin the Piltun survey area averaged over different periods ofthe Odoptu seismic survey in 2001. Period codes are as follows:Pre – “pre-seismic” period, July 19–Aug 2 (morning); Cal –“calibration,” Aug 2 (afternoon)–Aug 16; SeisA – “seismicsurvey phase Am,” Aug. 17–20 (relatively lower sound levels
nearshore); SeisB – “seismic survey phase B,” Aug. 21–Sept 9(relatively higher sound levels nearshore); Post1 – “post-seismicphase 1,” Sept. 9–19; Post2 – “post-seismic phase 2,” Sept. 20–30; Post3 – “post-seismic phase 3,” Oct 1–10; Post4 – “post-seismic phase 4,” Oct 11–20; Post5 – “post-seismic phase 5,”Oct 21–Nov 19. Sightings within the blind strip beneath theaircraft (<200 m from the transect on each side of the aircraft atthe survey altitude of 300 m ASL) are not included
100 Environ Monit Assess (2007) 134:93–106
Discussion
The difficulty in studying the effect of noise onforaging-related activity in most baleen whales isexemplified by the dearth of literature on this subject(but see Malme et al. 1986; Miller et al. 1999;Richardson et al. 1995; Richardson 1999). The prox-imity of western gray whales in the Piltun feeding areato the summer 2001 seismic survey necessitated mon-itoring the possible effects of seismic survey noise ontheir foraging activities. Because gray whales are theonly baleen whales that are predominantly bottom-feeders, they often create highly visible mud plumes atthe surface as they forage on benthic prey. These mudplumes were used to identify gray whales feeding onbenthos rather than whales engaged in feeding on non-benthic organisms, traveling, resting, or other activities.
The association of visible mud plumes with suc-cessful bottom feeding that results in high quality andquantity of food intake is only a hypothesis that is basedupon direct underwater observations of feeding whales,studies on and near feeding troughs, stomach content of
harvested whales and linked whale/prey distributiondata. An unknown proportion of the dives that producedmud plumes may have been unsuccessful attempts tofeed. Therefore, the utility of mud plumes as proxies ofsuccessful bottom feeding remains unknown. Availabledata indicate that both eastern gray whales (Thomson1983; Bass 2000; Dunham and Duffus 2001, 2002;Meier 2003; Moore et al. 2003; Patterson 2004) andwestern gray whales (Fadeev 2003, 2004, 2005) con-sistently feed in areas with high biomass of potentialprey and tend to avoid areas with low prey biomass.
There are other factors that confound interpretation ofmud plume sighting data as a direct measure of feedingactivity. The sightability of mud plumes was potentiallyaffected by a variety of factors, some of which wereanalyzed (mainly weather conditions), while others (e.g.,bottom sediment type, water turbidity, etc.) were notconsidered due to lack of site-specific data.
This study is the first systematic study of possibleeffects of a seismic survey on the feeding of westerngray whales. Few studies addressing potential effectsof seismic survey noise on the feeding of gray whaleshave emerged over the last 20 years. Eastern graywhales in the Chukchi Sea did not appear to respondto distant (>36 km) seismic noise (Ljungblad et al.1982). In one study in the Bering Sea, 10% of easterngray whales stopped feeding at received seismic soundlevels >163 dB re 1 μPa, while other whales continuedfeeding at 177 dB re 1 μPa (Malme et al. 1986). In thatstudy, whales that stopped feeding and moved awayfrom strong noise levels resumed feeding within 1 hafter seismic noise ended. During the Odoptu 3-Dseismic survey no overt reactions to seismic soundssimilar to those reported by Malme et al. (1986) werenoted and no displacement from the general feedingarea was observed (Yazvenko et al. 2002, 2007; Würsiget al. 2002; Gailey et al. 2007).
We assessed the effects of seismic surveys on thepercentage of whale groups engaged in foragingactivity in the entire Piltun feeding area, as well aswithin individual blocks varying in proximity to theseismic operations. We did not detect significant (p=0.183 for sound measured during the previous 3-dayperiod; p=0.54 for sound measured during the previ-ous 3-h period) changes in the proportion of groups ofwhales with mud plumes during the Odoptu 3-Dseismic survey. In a companion paper (Yazvenko et al.2007), statistical models suggest that during the 3-Dseismic survey in 2001, about 5–10 whales (corrected
Fig. 4 Predicted average proportions of gray whales with mudplumes as a function of swell height (m) on transect lines 1 and 2
Table 3 Coefficients, standard errors, test-statistics, p values,and odds ratio estimates for variables in the final logisticregression model for the gray whale feeding activity analysis
Parameter DF Odds ratioestimate
Standarderror
χ2 p value
Intercept 1 −0.0929 0.4901 0.036 0.8497line=1 1 2.0088 0.4401 20.83 <0.0001swell_height 1 −0.3546 0.1425 6.19 0.0128
Environ Monit Assess (2007) 134:93–106 101
for availability) may have moved from the portion ofthe Piltun feeding area immediately west of the Odoptublock southward to the portion of the Piltun feedingarea nearer the mouth of Piltun Bay.
The analysis was structured to investigate possibleeffects on an hourly, daily and weekly temporal scales.Possible short-term (h) and mid-term (several days)changes in whale feeding activity index were examinedusing a set of seismic survey-related variables (Table 2).None of the hour-scale or day-scale seismic survey-related variables that were tested were found to haveeffect on feeding activity of whales at a=0.05. How-ever, the power of the analyses presented here may belimited, judging by the high variability in the feedingactivity index data (Fig. 3).
A companion study of the distribution of westerngray whales found that hour-scale seismic survey-related variables were not correlated with the distri-bution of whales (Yazvenko et al. 2007). Only oneseismic survey-related variable, sound energy accumu-lated over the preceding 3 days, was significantlycorrelated with the distribution of gray whales, indicat-ing that thenoisewashaving an effect on the distributionof whales on the scale of days but not of hours.
Another companion study investigated the effect ofthe 2001 seismic survey on onshore western gray whalecounts. None of the seismic survey-related variablesexamined in this analysis explained a significantamount (p<0.05) of residual variation in whale counts.P values ranged from 0.24 to 0.95 (Würsig et al. 2002;Gailey et al. 2007).
In the study of gray whale behavior (Gailey et al.2007) changes in 5 out of 11 monitored behavioraltraits were found to be significantly correlated withseismic survey variables, which may indicate thatwhales traveled more during periods of higher seismicsound energy exposure.
The mitigation strategy employed during the 2001Odoptu 3-D seismic survey (Johnson et al. 2007) wasbased on the existing literature on gray whales andother cetaceans, and calibrations were made to deter-mine the buffer distance needed to reduce exposurelevels below those known to cause cessation of feedingand avoidance responses. Mitigation minimized thenumber of gray whales that were exposed to seismicsound levels above 163 dBrms re 1 μPa (Johnson et al.2007). Throughout the 2001 feeding season, graywhales continued to occupy the main feeding area
along the northeast Sakhalin Island coast adjacent toPiltun Bay, and no data indicated displacementoutside the Piltun feeding area (Yazvenko et al.2002, 2007). This is consistent with other studies thatsuggest gray whales have been using the Piltunlocation as the primary feeding area every year since1984 for which distribution data on gray whales werecollected (Blokhin et al. 1985, 2002, 2003, 2004;Berzin et al. 1988, 1990, 1991; Blokhin 1996; Würsiget al. 1999; Weller et al. 2000, 2001, 2002, 2004;Sobolevsky 2000, 2001; Yazvenko et al. 2002;Vladimirov et al. 2005, 2006). This is also consistentwith the report that there was no indication that westerngray whales exposed to seismic survey noise in 1997were displaced away from the Piltun feeding area(Würsig et al. 1999).
Studies of western gray whales conducted in 2002–2005 indicate no apparent population-level, or biolog-ically significant (NRC 2005) effects of the 2001seismic survey either on the number of gray whalespresent in subsequent years (Blokhin et al. 2003, 2004;Vladimirov et al. 2005, Meier et al. 2007), bodycondition (Weller et al. 2002, 2004; Yakovlev andTyurneva 2003, 2004, 2005), or reproductive success(Weller et al. 2002, 2004; Yakovlev and Tyurneva2003, 2004, 2005). Comparisons among years for allmonitored behavioral parameters revealed no statisti-cally significant differences between the results of2001 and 2002–2003, years in which no industrialactivity took place near the Piltun feeding area(Würsig et al. 2002, 2003, 2004). Recent estimatesof the size of the non-calf component of the westerngray whale population indicate 122 individuals in thepopulation in 2005 vs ca. 100 in 2001 (Weller et al.2002; Cooke et al. 2006). In spite of this encouragingevidence, the population remains severely endan-gered, and its future is highly uncertain.
Conclusions
Available data do not show statistically significanteffects of the Odoptu 3-D seismic survey on thebottom feeding activity of western gray whales in thevicinity of Piltun Bay:
1. The overall feeding activity index (proportion ofwhale groups with visible mud plumes per all
102 Environ Monit Assess (2007) 134:93–106
observed groups) of western gray whales in thevicinity of the Piltun Bay in 2001 did not showstatistically significant (!=0.05) correlation withthe Odoptu 3-D seismic survey (Fig. 3). One ofthe goals of the mitigation strategy was to ensurethat gray whales did not significantly change theirfeeding activity during the seismic survey. Avail-able data suggest that the whales continued to beengaged in bottom feeding activity during theseismic period at levels that were similar to orhigher than those in the pre- and post-seismicsurvey period.
2. The only environmental variables selected by thestepwise multiple regression that explained astatistically significant proportion of variation inthe whale feeding index data were transect line(proxy for depth) and swell height (proxy foroverall sea condition). Seismic survey-relatedvariables, viz., total estimated sound level duringthe previous 3-day period or previous 3-h period,did not explain a significant amount of residualvariation when added to the environmentalvariable model. The p values for these twovariables were 0.183 and 0.54, respectively.
Acknowledgements Many people helped in the collectionand analysis of the data and preparation of this report, andmany of our Russian colleagues participated in the organizationof this project. Alexander Burdin (Alaska Sea Life, Seward,Alaska) and Vyacheslav Shuntov (TINRO-Center, Vladivostok,Russia), provided valuable advice regarding the initial designand suggested participants for the project. We especiallyacknowledge the support of Yuri Blinov (TINRO-Center),Vladimir Radchenko (SakhNIRO, Yuzhno-Sakhalinsk, Russia)and Anatoly Vyalov (SakhNIRO).
Field support was provided by Exxon Neftegas Limited(Yuzhno-Sakhalinsk). We thank David Simerka, Brien Reep,Greg Manelick, Michael Allen, Dmitry Mayorov, AlexeiKovalev, Julian Skaretski (all from Exxon Neftegas Limited),and Julia Iazvenko (PICES, Canada) for their assistance in thefield program. Valery Vladimirov (VNIRO, Moscow, Russia)and Gennady Fedoseev provided valuable advice and consul-tation during the field program. Robin Tamasi and LuciaFerreira (LGL) provided assistance with mapping and dataanalysis, both in the field and during report preparation. W.John Richardson (LGL) provided valuable advice throughoutthe project. Michael Jenkerson (ExxonMobil) provided infor-mation on acoustic aspects of the study and gave criticalassistance both in the field and during data analysis. DanielEgging and Caroline Martin (ExxonMobil) gave advice andsupport throughout this project. The authors would like to thankGary Searing (LGL), Sonya Meier (LGL), James Hall (Exxon-
Mobil), Gordon Glova (LGL) and Judy Muir (LGL) for theirinput and review of this manuscript.
This study was supported by Exxon Neftegas Limited(ENL), Yuzhno-Sakhalinsk, Russia. The preparation of thispaper was jointly supported by ENL and Sakhalin EnergyInvestment Company, Yuzhno-Sakhalinsk, Russia.
References
Anonymous (2001). Krasnaya Kniga Rossiiskoi Federatsii.Zhivotnye, [The Red Book of Russian Federation. Ani-mals], Ast and Astrel, Balashikha, Aginskoe (862 pp.).Available at http://www.biodat.ru/db/rb/index.htm.
Bass, J. (2000). Variations in gray whale feeding behaviour inthe presence of whale-watching vessels in ClayoquotSound, 1993–1995. Ph.D. Thesis, University of Victoria,Victoria, BC (156 pp.).
Berzin, A. A., Vladimirov, V. L., & Doroshenko, N. V. (1988).Results of aerial surveys to study the distribution andabundance of cetaceans in the coastal waters of the Sea ofOkhotsk in 1986–1987. In N. S. Chernysheva (Ed.),Nauchno-issledovatel'skie raboty po morskim mlekopi-tayushchim severnoi chasti Tikhogo okeana v 1986–1987(pp. 18–25). Moscow, USSR: All-Union Research Insti-tute for Fisheries and Oceanography (VNIRO).
Berzin, A. A., Vladimirov, V. L., & Doroshenko, N. V. (1990).Aerial surveys to determine the distribution and number ofpolar whales, gray whales and beluga whales in the Sea ofOkhotsk in 1985–1989. Izvestiya TikhookeanskogoNauchno-Issledovatelskogo Instituta Rybnogo KhozyaistvaI Okeanografii (TINRO), 112, 51–60.
Berzin, A. A., Vladimirov, V. L., & Doroshenko, N. V. (1991).Results of aerial surveys to study the distribution andabundance of whales in the Sea of Okhotsk in 1988–1990.In L. A. Popov (Ed.), Nauchno-issledovatel'skie raboty pomorskim mlekopitayushchim severnoi chasti Tikhogo okeanav 1989–1990 (pp. 6–17). Moscow, USSR: All-UnionResearch Institute for Fisheries and Oceanography (VNIRO).
Blokhin, S. A. (1996). Distribution, numbers and behavior ofgray whales (Eschrichtius robustus) of the American andWestern populations in the areas of their distribution offthe coasts of the Far East. Izvestiya TikhookeanskogoNauchno-Issledovatel’skogo Instituta Rybnogo Kho-zyaistva I Okeanografii (TINRO), 121, 36–53.
Blokhin, S. A., Doroshenko, N. V., &Marchenko, I. P. (2003). Theabundance, distribution, and movement patterns of graywhales (Eschrichtius robustus) in coastal waters off thenortheast Sakhalin Island coast in 2002 based on the aerialsurvey data. Report by TINRO-Center, Vladivostok, Russia,to Exxon Neftegas Limited and Sakhalin Energy InvestmentCompany, Yuzhno-Sakhalinsk, Russia (pp. 29). Available athttp://www.sakhalinenergy.com/en/library.asp?p=lib_sel_western_gray_whale&l=whale_recent_research.
Blokhin, S. A., Doroshenko, N. V., & Yazvenko, S. B. (2004). Theabundance, distribution, and movement patterns of graywhales (Eschrichtius robustus) off the coast of NortheasternSakhalin Island in June–December 2003 based on aerialsurvey data. Report by TINRO-Center, Vladivostok, Russia,
Environ Monit Assess (2007) 134:93–106 103
to Exxon Neftegas Limited and Sakhalin Energy InvestmentCompany, Yuzhno-Sakhalinsk, Russia (140 pp.). Availableat http://www.sakhalinenergy.com/en/library.asp?p=lib_sel_western_gray_whale&l=whale_recent_research.
Blokhin, S. A., Maminov, M. K., & Kosygin, G. M. (1985). Onthe Korean-Okhotsk population of gray whales. Report ofthe International Whaling Commission, 35, 375–376.
Blokhin, S. A., Vladimirov, V. L., Lagerev, S. I., & Yazvenko,S. B. (2002). Abundance, distribution, and behavior of thegray whales (Eschrichtius robustus), based on aerialsurveys off northeast coast of Sakhalin from July toNovember 2001 (41 pp.). Report SC/02/WG03 to WesternGray Whale Technical Committee. Ulsan, South Korea:International Whaling Commission.
Borisov, S.V., Gritsenko,A.V., Jenkerson,M.R., Rutenko,A.N.,& Hodzevich, A. V. (2002). Evaluating and monitoringacoustic transmission from the Odoptu 3D seismic survey,5 August–9 September, 2001. Report by V. I. Il`icevPacific Oceanological Institute, Far East Branch of RussianAcademy of Sciences, Vladivostok, Russia,and ExxonMo-bil Upstream Research Company, Houston, TX, for ExxonNeftegas Limited, Yuzhno-Sakhalinsk, Russia. Availablefrom Exxon Neftegas Limited, c/o ExxonMobil Develop-ment Company, 17001 Northchase Drive #466, Houston,TX 77060, Attn: Daniel Egging.
Buckland, S. T., Anderson, D. R., Burnham, K. P., & Laake, J. L.(1993). Distance sampling: estimating abundance ofbiological populations (446 pp.). London, United King-dom: Chapman &Hall.
Cooke, J. G., Weller, D. W., Bradford, A. L., Burdin, A. M., &Brownell, R. L., Jr. (2006). Population assessment ofWestern Gray Whales in 2006. Paper SC/58/BRG30presented to the Scientific Committee, InternationalWhaling Commission (10 pp.).
Dunham, J. S., & Duffus, D. A. (2001). Foraging patterns of graywhales in central Clayoquot Sound, British Columbia,Canada. Marine Ecology Progress Series, 223, 299–310.
Dunham, J. S., & Duffus, D. A. (2002). Diet of gray whales(Eschrichtius robustus) in Clayoquot Sound, BritishColumbia, Canada. Marine Mammal Science, 18,419–437.
Fadeev, V. I. (2003). Benthos and prey studies in feedinggrounds of the Okhotsk-Korean population of gray whales.Report on materials from field studies on the research vesselNevelskoy in 2002. Report by the Institute of MarineBiology, Far East Branch of Russian Academy ofSciences, Vladivostok, Russia, for Exxon Neftegas Lim-ited and Sakhalin Energy Investment Company, Yuzhno-Sakhalinsk, Russia (118 pp.). Available at http://www.sakhalinenergy.com/en/library.asp?p=lib_sel_western_gray_whale&l=whale_recent_research.
Fadeev, V. I. (2004). Benthos and prey studies in feedinggrounds of the Okhotsk-Korean population of gray whales.Report on materials from field studies on the research vesselNevelskoy in 2003. Report by the Institute of MarineBiology, Far East Branch of Russian Academy ofSciences, Vladivostok, Russia, for Exxon Neftegas Lim-ited and Sakhalin Energy Investment Company, Yuzhno-Sakhalinsk, Russia (191 pp.). Available at http://www.sakhalinenergy.com/en/library.asp?p=lib_sel_western_gray_whale&l=whale_recent_research.
Fadeev, V. I. (2005). Benthos and food supply studies in feedingareas of the Okhotsk-Korean gray whale population. Reporton materials from field work aboard the research vesselAkademicOparin.Report by the Institute ofMarineBiology,Far East Branch of Russian Academy of Sciences,Vladivostok, Russia, for Exxon Neftegas Limited andSakhalin Energy Investment Company, Yuzhno-Sakhalinsk,Russia (157 pp.). Available at http://www.sakhalinenergy.com/en/library.asp?p=lib_sel_western_ gray_whale&l=whale_ recent_research.
Gailey, G., Sychenko, O., & Würsig, B. (2004). Western graywhale behavior and movement patterns: Shore-based obser-vations off Sakhalin Island, July–September 2003. Report byTexas A&M University, Galveston, TX, for Sakhalin EnergyInvestment Company Limited and Exxon Neftegas Limited,Yuzhno-Sakhalinsk, Russia (79 pp.). Available at http://www.sakhalinenergy.com/en/library.asp?p=lib_sel_western_gray_whale&l=whale_recent_research.
Gailey, G., Würsig, B., & McDonald, T. L. (2007). Abundance,behavior, and movement patterns of western gray whalesin relation to a 3-D seismic survey, Northeast SakhalinIsland, Russia. Environmental Monitoring and Assessment(this issue).
HESS (1999). High Energy Seismic Survey (HESS) reviewprocess and interim operational guidelines for marinesurveys offshore southern California. Report from HighEnergy Seismic Survey Team for California State LandsCommission and the U.S. Minerals Management Service,Camarillo, CA (39 pp.). Available at www.mms.gov.omm/pacific/lease/fullhessrept.pdf.
Hilton-Taylor, C. (2000). 2000 IUCN red list of threatened species.IUCN/SSC, Gland, Switzerland, and Cambridge, UnitedKingdom (61 pp.). (with 1 CD-ROM).
Johnson, S. R. (2002). Marine mammal mitigation andmonitoring program for the 2001 Odoptu 3-D seismicsurvey, Sakhalin Island, Russia. Report SC/02/WGW19 tothe Western Gray Whale Technical Committee, Interna-tional Whaling Commission, Ulsan, South Korea (47 pp.).
Johnson, S. R., Richardson, W. J., Yazvenko, S. B., Blokhin, S.A., Gailey, G., Jenkerson, M. R., et al. (2007). A westerngray whale mitigation and monitoring program for a 3-Dseismic survey, Sakhalin Island, Russia. EnvironmentalMonitoring and Assessment (this issue).
LeDuc, R. G.,Weller, D.W., Hyde, J., Burdin, A.M., Rosel, P. E.,Brownell, R. L., Jr., et al. (2002). Genetic differencesbetween western and eastern North Pacific gray whales(Eschrichtius robustus). Journal of Cetacean Researchand Management, 4, 1–5.
Ljungblad, D. K., Moore, S. E., Van Schoik, D. R., & Winchell,C. S. (1982). Aerial surveys of endangered whales in theBeaufort, Chukchi, and northern Bering seas. NOSC TD486, U.S. Naval Ocean Systems Center, San Diego, CA(406 pp.). NTIS AD-A126542/0.
Malme, C. I., Würsig, B., Bird, J. E., & Tyack, P. (1986).Behavioral responses of gray whales to industrial noise:Feeding observations and predictive modelling. OuterContinental Shelf Environmental Assessment Program,Final Report of Principal Investigators, 56, 393–600.Report 6265 (OCS Study MMS 88-0048) by BoltBeranek, & Newman, Inc., Cambridge, MA, for NationalOceanic and Atmospheric Administration, Anchorage,
104 Environ Monit Assess (2007) 134:93–106
AK. Available as NTIS PB88-249008 from U.S. NationalTechnical Information Service, 5285 Port Royal Road,Springfield, VA.
Meier, S. K. (2003). A multi-scale analysis of habitat use bygray whales (Eschrichtius robustus) in Clayoquot Sound,British Columbia, 1997–99. M.Sc. Thesis, University ofVictoria, Victoria, BC (140 pp.).
Meier, S.K.,Lawson, J.,Yazvenko,S.B.,Perlov,A.S.,Maminov,M. K., Johnson, S. R., et al. (2002). Vessel-based marinemammal monitoring during the 2001 3-D seismic survey ofthe Odoptu block, northeast Sakhalin Island, Okhotsk Sea,Russia. Report by LGL Limited, Sidney, BC, for ExxonNeftegas Limited, Yuzhno-Sakhalinsk, Russia (38 pp.).Available from Exxon Neftegas Limited, c/o ExxonMobilDevelopment Company, 17001 Northchase Drive #466,Houston, TX 77060, Attn: Daniel Egging.
Meier, S. K., Yazvenko, S. B., Blokhin, S. A., Wainwright,P. W., Maminov, M. K., & Yakovlev, Yu. M. (2007).Distribution and abundance of western gray whales,northeast Sakhalin Island, Russia, 2001–2003. Environ-mental Monitoring and Assessment (this issue).
Miller, G. W., Elliott, R. E., Koski, W. R., Moulton, V. D., &Richardson, W. J. (1999). Whales. In W. J. Richardson(Ed.), Marine mammal and acoustical monitoring ofWestern Geophysicals open-water seismic program in theAlaskan Beaufort Sea, 1998. Report TA2230-3 by LGLLimited, King City, ON, and Greeneridge Sciences Inc.,Santa Barbara, CA, for Western Geophysical, Houston, TX,and US National Marine Fisheries Service, Anchorage, AK,and Silver Spring, MD (pp 5-1–5-109).
Moore, S. E., Grebmeier, J. M., & Davies, J. R. (2003). Graywhale distribution relative to forage habitat in the northernBering Sea: Current conditions and retrospective summa-ry. Canadian Journal of Zoology, 81, 734–742.
Moran, P. A. P. (1950). Notes on continuous stochasticphenomena. Biometrika, 37, 17–23.
Neter, J., Wasserman, W., & Kutner, M. H. (1983). Appliedlinear regression models (547 pp.). Homewood, IL: Irwin.
NRC (National Research Council) (2005). Marine mammalpopulations and ocean noise: Determining when noisecauses biologically significant effects (135 pp.). Washington,DC: National Academy.
Patterson, H. M. (2004). Small-scale distributions and dynam-ics of the mysid prey of grey whales (Eschrichtiusrobustus) in Clayoquot Sound, British Columbia, Canada.M.Sc. Thesis, University of Victoria, Victoria, BC(170 pp.).
Richardson, W. J. (Ed.) (1999). Marine mammal and acousticalmonitoring of Western Geophysicals open-water seismicprogram in the Alaskan Beaufort Sea, 1998. ReportTA2230-3 by LGL Limited, King City, ON, andGreeneridge Sciences Inc., Santa Barbara, CA, for WesternGeo-physical, Houston, TX, and US National MarineFisheries Service, Anchorage, AK, and Silver Spring,MD (390 pp.).
Richardson, W. J., Greene, C. R., Jr., Malme, C. I., & Thomson,D. H. (1995). Marine mammals and noise (576 pp.). SanDiego, CA: Academic.
Rutenko, A. N., Borisov, S. V., Gritsenko, A. V., & Jenkerson,M. R. (2007). Calibrating and monitoring the mitigationzone and estimating acoustic transmission for the 2001 3D
seismic survey. Environmental Monitoring and Assess-ment (this issue).
Sobolevsky, E. I. (2000). Marine mammal studies offshorenortheast Sakhalin, 1999. Report by the Institute of MarineBiology, Far East Branch Russian Academy of Sciences,Vladivostok, for Sakhalin Energy Investment CompanyLimited, Yuzhno-Sakhalinsk, Russia, (149 pp.). Availableat http://www.sakhalinenergy.com/en/library.asp?p=lib_sel_ western_gray_whale&l=whale_recent_research.
Sobolevsky, E. I. (2001). Marine mammal studies offshorenortheast Sakhalin, 2000. Report by the Institute ofMarine Biology, Far East Branch Russian Academy ofSciences, Vladivostok, for Sakhalin Energy InvestmentCompany Limited, Yuzhno-Sakhalinsk, Russia, (199 pp.).Available at http://www.sakhalinenergy.com/en/library.asp?p=lib_sel_western_gray_whale&l=whale_recent_research.
Thomson, D. H. (Ed.) (1983). Feeding ecology of gray whales(Eschrichtius robustus) in the Chirikof Basin, summer1982. Report by LGL Alaska Research AssociatesAnchorage, AK, for U.S. Department of Commerce,NOAA/OCSEAP, Juno, AK. (Vol. 43, 209–460.)
Vladimirov, V. A., Blokhin, S. A., Vladimirov, A. V., Vladimirov,V. L., Doroshenko, N. V., & Maminov, M. K. (2005).Distribution and abundance of gray whales of the Okhotsk-Korean population in the Northeastern Sakhalin Waters inJuly– September 2004 (based on shore, aerial and vessel-based surveys). Report by the All-Russian ResearchInstitute for Fisheries and Oceanography (VNIRO),Moscow, Russia, and the Pacific Research Center forFisheries and Oceanography (TINRO-Center), Vladivos-tok, Russia, to Exxon Neftegas Limited and SakhalinEnergy Investment Company, Yuzhno-Sakhalinsk, Russia(136 pp.). Available at http://www.sakhalinenergy.com/en/library.asp?p=lib_sel_western_gray_whale&l=whale_recent_research.
Vladimirov, V. A., Blokhin, S. A., Vladimirov, A. V., Maminov,M. K., Starodymov, S. P., & Shvetsov, E. P. (2006).Distribution and abundance of gray whales of theOkhotsk-Korean population off northeastern Sakhalin,June–November 2005 (based on data from onshore, aerialand vessel-based surveys). Report by the All-RussianResearch Institute for Fisheries and Oceanography(VNIRO),Moscow, Russia, and the Pacific Research Centerfor Fisheries and Oceanography (TINRO-Center),Vladivostok, Russia, to Exxon Neftegas Limitedand Sakhalin Energy Investment Company, Yuzhno-Sakhalinsk, Russia (189 pp.). Available at http://www.sakhalinenergy.com/en/library.asp?p=lib_sel_western_-gray_whale&l=whale_recent_research.
Weller, D. W., Burdin, A. M., Bradford, A. L., Ivashchenko,Y. V., Tsidulko, G. A., Lang, A. R., et al. (2004). Westerngray whales off Sakhalin Island, Russia: A joint Russia–US scientific investigation, July–September 2003. Reportby National Marine Fisheries Service, National Oceanicand Atmospheric Administration, Southwest FisheriesScience Center, La Jolla, CA, Kamchatka Branch ofPacific Institute of Geography, Russian Academy ofSciences, Petropavlovsk, Russia, and Alaska SealifeCenter, Seaward, AK (41 pp.). Available at www.ifaw.org/ifaw/dfiles/file_453.pdf.
Environ Monit Assess (2007) 134:93–106 105
Weller, D. W., Burdin, A. M., Bradford, A. L., Tsidulko, G. A.,Ivashchenko, Y. V., & Brownell, R. L., Jr. (2002). Graywhales off Sakhalin Island, Russia: June–September 2001.A joint U.S.-Russian scientific investigation. Report byTexas A&M University, Galveston, TX, Kamchatka Insti-tute of Ecology and Nature Management, Russian Academyof Sciences, Petropavlovsk, Russia, and National MarineFisheries Service, NOAA, Southwest Fisheries ScienceCenter, La Jolla, CA, for Sakhalin Energy InvestmentCompany Limited, Yuzhno-Sakhalinsk, Russia (75 pp.).Available at http://www.sakhalinenergy.com/en/library.asp?p=lib_sel_western_gray_whale&l=whale_recent_research.
Weller, D.W., Burdin, A.M., Bradford, A. L., &Würsig, B. (2001).Gray whales off Sakhalin Island, Russia: June–September2000. A joint U.S.-Russian scientific investigation. Report byTexas A&M University, Galveston, TX, and KamchatkaInstitute of Ecology and Nature Management, RussianAcademy of Sciences, Petropavlovsk, Russia, for SakhalinEnergy Investment Company Limited, Yuzhno-Sakhalinsk,Russia (56 pp.). Available at http://www.sakhalinenergy.com/en/library.asp?p=lib_sel_western_gray_whale&l=whale_recent_research.
Weller, D. W., Würsig, B., Burdin, A. M., Reeve, S. H., &Bradford, A. L. (2000). Gray whales off Sakhalin Island,Russia: June–October 1999. A joint U.S.-Russian scientificinvestigation. Report by Texas A&M University, Galves-ton, TX, and Kamchatka Institute of Ecology and NatureManagement, Russian Academy of Sciences, Petropav-lovsk, Russia, for Sakhalin Energy Investment CompanyLimited, Yuzhno-Sakhalinsk, Russia (69 pp.). Available athttp://www.sakhalinenergy.com/en/library.asp?p=lib_sel_western_gray_whale&l=whale_recent_research.
Würsig, B., Gailey, G., McDonald, T. L., Nielson, R., Ortega-Ortiz, J., Wainwright, P. W., et al. (2002). Western graywhale occurrence patterns and behavior: Shore-basedobservations off Sakhalin Island, August–September2001. Report by Texas A&M University, Galveston, TX,for Exxon Neftegas Limited, Yuzhno-Sakhalinsk, Russia(70 pp.). Available from Exxon Neftegas Limited, c/oExxonMobil Development Company, 17001 NorthchaseDrive #466, Houston, TX 77060, Attention: Daniel Egging.
Würsig, B., Gailey, G., Sychenko, O., & Petersen, H. (2003).Western gray whale occurrence patterns and behavior:Shore-based observations off Sakhalin Island, August–September 2002. Report by Texas A&M University,Galveston, TX, for Sakhalin Energy Investment CompanyLimited and Exxon Neftegas Limited, Yuzhno-Sakhalinsk,Russia (48 pp.). Available at http://www.sakhalinenergy.com/en/library.asp?p=lib_sel_western_gray_whale&l=whale_recent_research.
Würsig, B., Weller, D. W., Burdin, A. M., Blokhin, S. A.,Reeve, S. H., Bradford, A. L., et al. (1999). Gray whalessummering off Sakhalin Island, Far East Russia:
July–October 1997. A joint U.S.-Russian scientificinvestigation. Report by Texas A&M University,Galveston, TX, and Kamchatka Institute of Ecology andNature Management, Russian Academy of Sciences,Petropavlovsk, Russia, for Sakhalin Energy InvestmentCompany Limited and Exxon Neftegaz Limited, Yuzhno-Sakhalinsk, Russia (101 pp.). Available at http://www.sakhalinenergy.com/en/library.asp?p=lib_sel_western_gray_whale&l=whale_ recent_research.
Yakovlev, Yu. M., & Tyurneva, O. Yu. (2003). Photo-identification of the Korean-Okhotsk gray whale(Eschrichtius robustus) population in 2002. Report bythe Institute of Marine Biology, Far East Branch ofRussian Academy of Sciences, Vladivostok, Russia, toExxon Neftegas Limited and Sakhalin Energy InvestmentCompany, Yuzhno-Sakhalinsk, Russia (30 pp.). Availableat http://www.sakhalinenergy.com/en/library.asp?p=lib_sel_western_ gray_whale&l=whale_recent_research.
Yakovlev, Yu. M., & Tyurneva, O. Yu. (2004). Photo-identification of the Korean-Okhotsk gray whale(Eschrichtius robustus) population along the northeastcoast of Sakhalin Island, Russia, 2003. Report by theInstitute of Marine Biology, Far East Branch of RussianAcademy of Sciences, Vladivostok, Russia, to ExxonNeftegas Limited and Sakhalin Energy Investment Com-pany, Yuzhno-Sakhalinsk, Russia (52 pp.). Available athttp://www.sakhalinenergy.com/en/library.asp?p=lib_sel_western_gray_whale&l=whale_recent_research.
Yakovlev, Yu. M., & Tyurneva, O. Yu. (2005). Photographicidentification of gray whales (Eschrichtius robustus) of theKorean-Okhotsk population on the northeast shelf ofSakhalin Island, Russia, 2004. Report by the Institute ofMarine Biology, Far East Branch of Russian Academyof Sciences, Vladivostok, Russia, to Exxon NeftegasLimited and Sakhalin Energy Investment Company,Yuzhno-Sakhalinsk, Russia (75 pp.). Available at http://www.sakhalinenergy.com/en/library.asp?p=lib_sel_wes-tern_ gray_whale&l=whale_recent_research.
Yazvenko, S. B., McDonald, T. L., Blokhin, S. A., Johnson, S.R., Meier, S. K., Melton, H. R., et al. (2007). Distributionand abundance of western gray whales during a seismicsurvey near Sakhalin Island, Russia. EnvironmentalMonitoring and Assessment (this issue).
Yazvenko, S., McDonald, T. L, Meier, S. K., Blokhin, S. A.,Johnson, S. R., Vladimirov, V. L., et al. (2002). Aerialmarine mammal monitoring during the 2001 3-Dseismic survey of the Odoptu block, northeast SakhalinIsland, Okhotsk Sea, Russia. Report by LGL Limited,Sidney, BC, for Exxon Neftegas Limited, Yuzhno-Sakhalinsk, Russia (153 pp.). Available from ExxonNeftegas Limited, c/o ExxonMobil DevelopmentCompany, 17001 Northchase Drive #466, Houston, TX,77060, Attn: Daniel Egging.
106 Environ Monit Assess (2007) 134:93–106
Related Documents