Feature extraction of the lesion in mammogram images using segmentation by minimizing the energy and orthogonal transformation adaptive Khalid El Fahssi 1 , Abdelali Elmoufidi 1 , Abdenbi Abenaou 2 ,Said Jai-Andaloussi 1 ,Abderrahim Sekkaki 1 1 Computer Sciences Department, Faculty of Sciences, University of Hassan II Casablanca, Morocco 2 Computer Sciences Department, ENSA,University of ibn Zohr Agadir, Morocco [email protected], elmoufi[email protected], [email protected] [email protected], [email protected] Abstract: Segmentation and classification of breast masses in mammography play a crucial role in Computer Aided Diagnosis system (CAD) . In this paper we propose an approach consisting of two methods. The first is the main stage in image processing which is the mammograms segmentation. This method is based on the theory of all levels and minimization of the energy of the active contour which enables the selection of regions of interest of the mammograms images. While the second method is based on the theory of adaptive orthogonal transformation that will calculate the informative characteristics of regions of interest of mammography images. The characteristics obtained by this computing method allow the increase of the diagnostic certainty. To illustrate the effectiveness of the method we present the results of experiments carried out on the basis of images MIAS mammograms. Key–Words:segmentation; mammography; active contours; levels set;classification 1 Introduction Breast cancer is the second cause of death among women in the world [1], [2], [3]. Prevention of the disease is very difficult because the risk factors are ei- ther poorly understood or not influenced. Scientific studies have provided insight into the development of cancer, but it is not yet clear why such a person de- velops breast cancer. It should be noted that only 5- 10% of breast cancers are hereditary origin related to the transmission of deleterious genes most com- monly implicated are BRCA1 and BRCA2 (acronyms for breast cancer) associated with a predisposition to the disease[4]. Due to its delayed diagnosis, that often results into a heavy treatment, mutilating and costly which is accompanied by a high mortality rate. Vari- ous studies have confirmed that this is the early stage detection which can improve the prognosis and mam- mography in this case it is the best diagnostic tech- nique [5]. However, it remains difficult for expert radiologists to provide a good interpretation of shots mammography due to low differences in densities of various tissues of the breast in the image. The in- terpretation of mammograms by radiologists is per- formed in the aim of finding the anomalies that in- dicate the changes associated with cancer. The in- dicators of probable presence of cancer are the mi- crocalcifications and the opacities [6]. We analyse the mammography for the purpose of finding these indicators to characterize and classify Benign type and malignant, thus the importance of tools of aid to diagnostic (CAD) developed during these last years [7],[8]. Generally, CAD systems of aid to diagnostic based on a range of approaches including the steps of pre-processing, segmentation, extraction of classifica- tion parameters (size, shape, density and grouping in hearth) and finally the classification of anomalies sus- pect [7], [8], [9],[10],[11] and [12]. As general the segmentation of image mammography is a very im- portant step in solving the problem of detecting breast cancer. Currently there are many different methods of segmentation, which are: the segmentation based on regions [13], [14], [15], the segmentation based on contours [16], [13], [18] and the segmentation with thresholding [19], [20], [21]. The analysis of these di- versity methods allows concluding that the application of such a method or another can influence on rates of certainty of diagnostic. Given the low contrast and the WSEAS TRANSACTIONS on BIOLOGY and BIOMEDICINE Khalid El Fahssi, Abdelali Elmoufidi, Abdenbi Abenaou, Said Jai-Andaloussi, Abderrahim Sekkaki E-ISSN: 2224-2902 88 Volume 11, 2014

Welcome message from author
This document is posted to help you gain knowledge. Please leave a comment to let me know what you think about it! Share it to your friends and learn new things together.
Transcript

Feature extraction of the lesion in mammogram images usingsegmentation by minimizing the energy and orthogonal
transformation adaptive
Khalid El Fahssi1, Abdelali Elmoufidi1, Abdenbi Abenaou2,Said Jai-Andaloussi1 ,Abderrahim Sekkaki11 Computer Sciences Department, Faculty of Sciences, University of Hassan II
Casablanca, Morocco2 Computer Sciences Department, ENSA,University of ibn Zohr
Agadir, [email protected], [email protected], [email protected]
[email protected], [email protected]
Abstract: Segmentation and classification of breast masses in mammography play a crucial role in Computer AidedDiagnosis system (CAD) . In this paper we propose an approach consisting of two methods. The first is the mainstage in image processing which is the mammograms segmentation. This method is based on the theory of alllevels and minimization of the energy of the active contour which enables the selection of regions of interest of themammograms images. While the second method is based on the theory of adaptive orthogonal transformation thatwill calculate the informative characteristics of regions of interest of mammography images. The characteristicsobtained by this computing method allow the increase of the diagnostic certainty. To illustrate the effectiveness ofthe method we present the results of experiments carried out on the basis of images MIAS mammograms.
Key–Words:segmentation; mammography; active contours; levels set;classification
1 Introduction
Breast cancer is the second cause of death amongwomen in the world [1], [2], [3]. Prevention of thedisease is very difficult because the risk factors are ei-ther poorly understood or not influenced. Scientificstudies have provided insight into the development ofcancer, but it is not yet clear why such a person de-velops breast cancer. It should be noted that only 5-10% of breast cancers are hereditary origin relatedto the transmission of deleterious genes most com-monly implicated are BRCA1 and BRCA2 (acronymsfor breast cancer) associated with a predisposition tothe disease[4]. Due to its delayed diagnosis, that oftenresults into a heavy treatment, mutilating and costlywhich is accompanied by a high mortality rate. Vari-ous studies have confirmed that this is the early stagedetection which can improve the prognosis and mam-mography in this case it is the best diagnostic tech-nique [5]. However, it remains difficult for expertradiologists to provide a good interpretation of shotsmammography due to low differences in densities ofvarious tissues of the breast in the image. The in-terpretation of mammograms by radiologists is per-
formed in the aim of finding the anomalies that in-dicate the changes associated with cancer. The in-dicators of probable presence of cancer are the mi-crocalcifications and the opacities [6]. We analysethe mammography for the purpose of finding theseindicators to characterize and classify Benign typeand malignant, thus the importance of tools of aid todiagnostic (CAD) developed during these last years[7],[8]. Generally, CAD systems of aid to diagnosticbased on a range of approaches including the steps ofpre-processing, segmentation, extraction of classifica-tion parameters (size, shape, density and grouping inhearth) and finally the classification of anomalies sus-pect [7], [8], [9],[10],[11] and [12]. As general thesegmentation of image mammography is a very im-portant step in solving the problem of detecting breastcancer. Currently there are many different methodsof segmentation, which are: the segmentation basedon regions [13], [14], [15], the segmentation based oncontours [16], [13], [18] and the segmentation withthresholding [19], [20], [21]. The analysis of these di-versity methods allows concluding that the applicationof such a method or another can influence on rates ofcertainty of diagnostic. Given the low contrast and the
WSEAS TRANSACTIONS on BIOLOGY and BIOMEDICINEKhalid El Fahssi, Abdelali Elmoufidi, Abdenbi Abenaou, Said Jai-Andaloussi, Abderrahim Sekkaki
E-ISSN: 2224-2902 88 Volume 11, 2014
highly textured nature of the images mammography,all segmentation methods proposed depend on the val-ues of selected parameters (thresholds, mean values,variances, etc..) And the models exploited by thesemethods (probability of density, function of belong-ing ...). Therefore, a low error of estimation of theseparameters or these models can lead to segmentationresults of poor qualities in terms of error rate at thepixel level. This bad estimation may also jeopardizethe detection of small parts contained in the mammog-raphy images. So, this opens in a path to propose an-other method that can lead to a correct interpretation.In this article we propose a method for segmentationthe image mammography based on theory of Level Setand the principle of the minimization of the energy ofactive contours.
This paper is organized as follows: Section 2.1describes the database used for evaluation, section 2.2we give a reminder on the theory of level sets, section2.3 and section 2.4 present the formulation of problemand method proposed for minimizing the energy forthe segmentation of mammography image.Section 2.5present the segmentation algorithm and we proposedin section 3 method for classification and detection ofthe lesion. The result is presented in section 4 and weend with a conclusion and perspective in section 5.
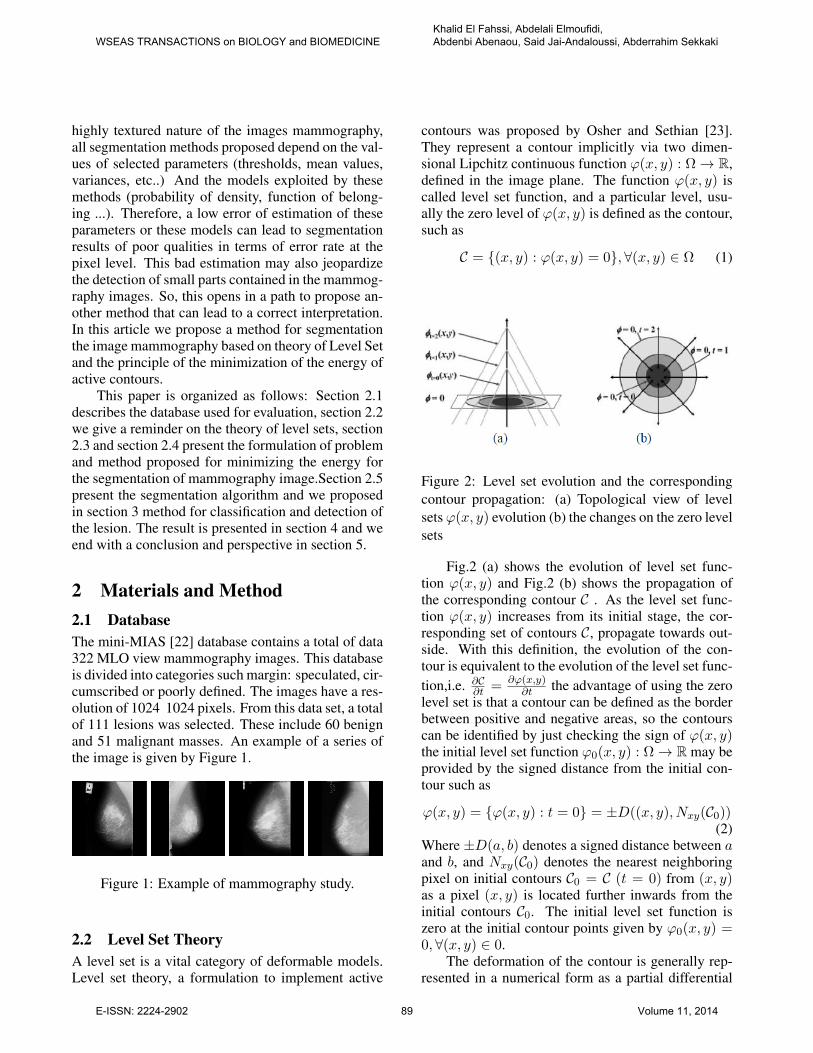
2 Materials and Method2.1 DatabaseThe mini-MIAS [22] database contains a total of data322 MLO view mammography images. This databaseis divided into categories such margin: speculated, cir-cumscribed or poorly defined. The images have a res-olution of 1024 1024 pixels. From this data set, a totalof 111 lesions was selected. These include 60 benignand 51 malignant masses. An example of a series ofthe image is given by Figure 1.
Figure 1: Example of mammography study.
2.2 Level Set TheoryA level set is a vital category of deformable models.Level set theory, a formulation to implement active
contours was proposed by Osher and Sethian [23].They represent a contour implicitly via two dimen-sional Lipchitz continuous function ϕ(x, y) : Ω→ R,defined in the image plane. The function ϕ(x, y) iscalled level set function, and a particular level, usu-ally the zero level of ϕ(x, y) is defined as the contour,such as
C = (x, y) : ϕ(x, y) = 0,∀(x, y) ∈ Ω (1)
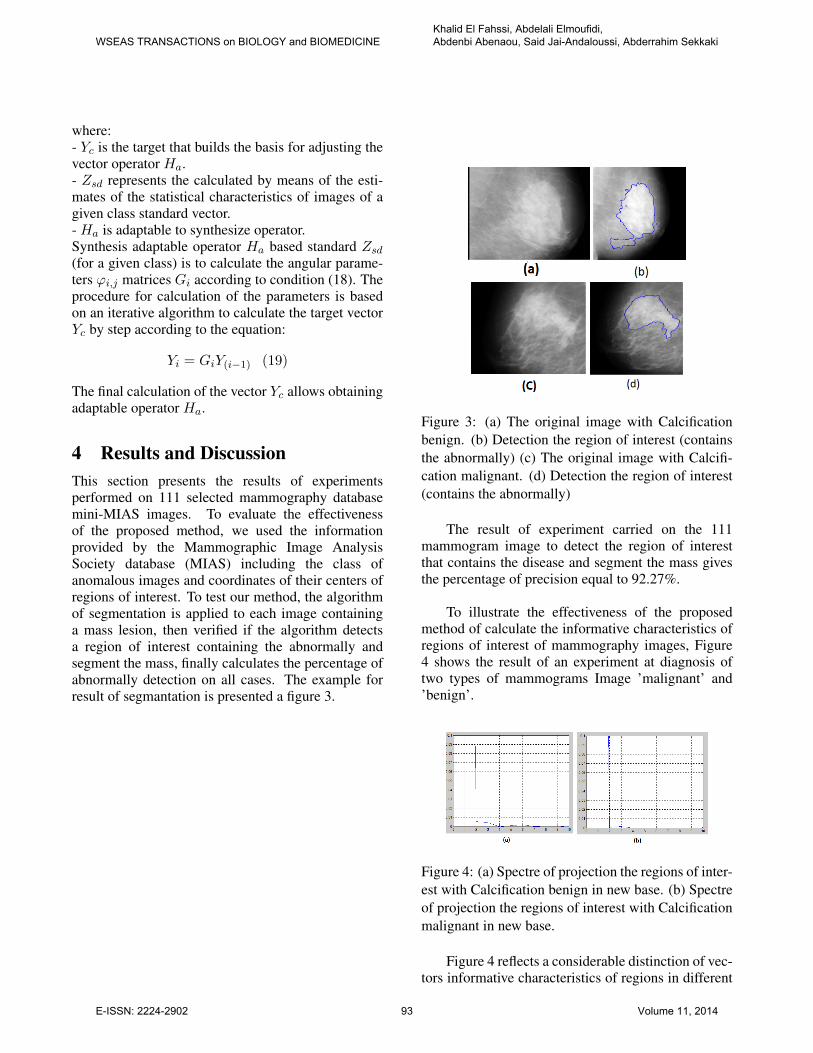
Figure 2: Level set evolution and the correspondingcontour propagation: (a) Topological view of levelsets ϕ(x, y) evolution (b) the changes on the zero levelsets
Fig.2 (a) shows the evolution of level set func-tion ϕ(x, y) and Fig.2 (b) shows the propagation ofthe corresponding contour C . As the level set func-tion ϕ(x, y) increases from its initial stage, the cor-responding set of contours C, propagate towards out-side. With this definition, the evolution of the con-tour is equivalent to the evolution of the level set func-tion,i.e. ∂C
∂t = ∂ϕ(x,y)∂t the advantage of using the zero
level set is that a contour can be defined as the borderbetween positive and negative areas, so the contourscan be identified by just checking the sign of ϕ(x, y)the initial level set function ϕ0(x, y) : Ω→ R may beprovided by the signed distance from the initial con-tour such as
ϕ(x, y) = ϕ(x, y) : t = 0 = ±D((x, y), Nxy(C0))(2)
Where ±D(a, b) denotes a signed distance between aand b, and Nxy(C0) denotes the nearest neighboringpixel on initial contours C0 = C (t = 0) from (x, y)as a pixel (x, y) is located further inwards from theinitial contours C0. The initial level set function iszero at the initial contour points given by ϕ0(x, y) =0,∀(x, y) ∈ 0.
The deformation of the contour is generally rep-resented in a numerical form as a partial differential
WSEAS TRANSACTIONS on BIOLOGY and BIOMEDICINEKhalid El Fahssi, Abdelali Elmoufidi, Abdenbi Abenaou, Said Jai-Andaloussi, Abderrahim Sekkaki
E-ISSN: 2224-2902 89 Volume 11, 2014

equation. A formulation of contour evolution usingthe magnitude of the gradient of ϕ(x, y) was initiallyproposed by Osher and Sethian [24] and is given by:
∂ϕ(x, y)
∂t= |∇ϕ(x, y)| = (ϑ+ εk(ϕ(x, y))) (3)
Where ϑ denotes a constant speed term to push orpull the contour,k denotes the mean curvature of thelevel set function ϕ(x, y) and ε controls the balancebetween the regularity and robustness of the contourevolution.
2.3 Image Model and Problem FormulationTo cope with intensity inhomogeneity in image seg-mentation, we formulate our method based on an im-age model which describes the composition of im-ages of the real-world, in which inhomogeneity of in-tensity is assigned to a component of an image. Inthis paper, we consider the following inhomogene-ity intensity multiplicative model. From the physicsof imaging in a variety of modalities (Mammographyimages), an observed image can be modeled as
I = bJ + n (4)
Where J is the true image, b is the component thataccounts for the intensity inhomogeneity, and n is ad-ditive noise. The component b is designated as a biasfield (or shading image). The real image J measuresan intrinsic physical property of the objects to be im-aged, which is therefore assumed to be piecewise (ap-proximately) constant. The bias field b is assumed tobe slowly varying. The additive noise n can be con-sidered to be zero-mean Gaussian noise.
In this paper, we consider the image I : Ω →R as defined on a continuous domain function. Theassumptions about the true image and the bias fieldcan be stated more precisely as follows:
• b Bias field varies slowly, which means that b canbe well approximated by a constant in a neigh-borhood of each point in the image domain. (a1)
• The real image J approximately takes about Ndistinct values constant C1, C2, ..., CN in disjointregions Ω1....ΩN respectively, where ΩiNi=1forms a partition of the image domain, i.e Ω =⋃Ni=1 Ωi and Ωi
⋂Ωj = ∅ for i 6= j.(a2)
Based on the model in (4) and the assumptionsa1 and a2, we suggest a method for estimating re-gions ΩiNi=1, the constants CiNi=1, and the bias
field b. The resulting estimates of them are appointedby ΩiNi=1, the constants CiNi=1, and the bias fieldb, respectively. The obtained bias field b should beslowly varying and the regions Ω1...ΩN should sat-isfy certain regularity property to avoid spurious seg-mentation results caused by image noise. We will de-fine a criterion for the search of this estimates basedon the model and assumptions of the above image a1and a2. This criterion will be defined in terms of theregion, constants, and function, as energy in a varia-tional framework, which is minimized to find the op-timal regions ΩiNi=1 , constants CiNi=1, and biasfield b. Consequently, the image segmentation andbias field estimation are simultaneously achieved.
2.4 Energy FormulationLet Ω be the image domain, and I : Ω → R be agray level image. In [25], a segmentation of the im-age I is carried out by finding a contour C, which di-vides the area of the image domain into disjoint re-gions Ωi...ΩN , and a piecewise smooth function u thatapproximates the image I and is smooth within eachregion Ωi. This can be formulated as a problem ofminimizing the following Mumford-Shah functional
FMS(u, C) =
∫Ω
(I − u)2dx+ u
∫Ω/C∇u2dx+ ϑ|C|
(5)Where |C| is the length of the contour C.In the rightpart of (5), the first term is the term data, which re-quires u to be close to the image I , and the secondterm is the term of smoothness, which causes it to besmooth in each of the regions separated by the con-tour C. The third term is introduced to regularize thecontour C.
To be written in a continuously the local inten-sity property combination indicates that the intensitiesin the neighborhood oy can be classified into N clus-ters, with centers mi
∼= b(y)Ci, i = 1...N , this allowsto apply the K-means clustering standard to classifythese local intensities.More specifically, the intensi-ties I(x) in the neighborhood oy, the K-means algo-rithm is an iterative process to minimize the clusteringcriterion [26], which can form as
Fy =
N∑i=1
∫oy
|I(x)−mi|2ui(x)dx (6)
We can rewrite as
Fy =
N∑i=1
∫Ωi
⋂Ωy
|I(x)−mi|2dx (7)
WSEAS TRANSACTIONS on BIOLOGY and BIOMEDICINEKhalid El Fahssi, Abdelali Elmoufidi, Abdenbi Abenaou, Said Jai-Andaloussi, Abderrahim Sekkaki
E-ISSN: 2224-2902 90 Volume 11, 2014

Therefore, we define the energy
ε ,∫εydy (8)
i.e
ε =
∫(
N∑i=0
∫Ωi
k(y − x)|I(x)− b(y)Ci|2dx)dy (9)
In this paper, omit the domain Ω in the index in-tegral symbol (as in the first integral above) if the in-tegration is over the entire domain Ω the mammogra-phy Image segmentation by minimizing energy withrespect to the region Ωi...ΩN , constants Ci...CN andbias field b. The kernel functionK is chosen as a trun-cated Gaussian function defined by
K(u) = 1ae−|u|22σ
0,otherwise (10)
Where a is a normalization constant such that∫K(u) = 1, σ is the standard deviation (or the scale
parameter) of the Gaussian function.Our suggested energy in (9) is expressed in terms
of the regions Ω1...ΩN . It is difficult to draw a so-lution to the energy minimization problem from thisexpression. In this section, the energy ε is convertedto a level set formulation by representing the disjointregions Ω1...ΩN with a number of level set functions,with a regularization term on these level set functions.In the level set formulation, the energy minimizationcan be solved by using well-established variationalmethods [27].
Note that for a given C, there is more than onepossible level set representation: if ϕ is a level setfunction for Ω. ϕ Can only represent two regions, in-side and outside the contour C, as Ω1 = inside(C) =ϕ > 0 and Ω2 = outside(C) = ϕ < 0, re-spectively. In this case, a level set function is usedto represent the two regions Ω1 and Ω2. The regionsΩ1 and Ω2 can be represented with their membershipfunctions defined by
TwoPhaseM1(ϕ)=H(ϕ)M2(ϕ)=1−H(ϕ) (11)
Where H(•) is the Heaviside functional, ϕ representsthe set of the level set functions such that ϕ = ϕ forthe Two-Phase model and ϕ = ϕ1, ϕ2 for the Four-Phase model.
FourPhase
M1(ϕ) = H(ϕ1)H(ϕ2)M2(ϕ) = H(ϕ1)(1−H(ϕ2))M3(ϕ) = (1−H(ϕ1))H(ϕ2)M4(ϕ) = (1−H(ϕ1))(1−H(ϕ2))
(12)Where
H(ϕ) = [1
2[1 +
2
πarctan(
ϕ
ε)]] (13)
Thus, for the case of N ≥ 2, the energy in (9) canbe re-written as:
ε ,∫
(
N∑i=0
k(y−x)|I(x)− b(y)Ci|2Mi(ϕ(x))dx)dy
(14)
2.5 Algorithm of segmentation
Enter :I Initial Imageµ Regularization parameter4t the Pas in timeγ Proportionality constantIterNum Number of iterationsυ speed constantInitialisation :
ϕ0 =
+1 where (x, y) is inside C,−1 where (x, y) is outside C.
estimate :For n ranging from 1 to IterNum do. - Calculate the contour carte by Algorithm ofCanny. - Calculate the gradient carte ϕ(x, y)
. ϕ(x, y) =√∑
s∈ηs |Ip − Is|2
. - Calculate the gradient g
. For i ranging from 1 to nl do
. For j ranging from 1 to nc do
. g(ϕ(x, y)) = 11+ϕ(x,y)
. - Calculate the mean curvature term K
. For i ranging from 1 to nl do
. For j ranging from 1 to nc do
. K(i, j) = div( ∇ϕ(i,j)|∇ϕ(i,j)|)
. - Calculate ϕn+1(i, j)
ϕn+1i,j = ϕni,j
+ 4 t[−γδε(ϕ)(c1 − c2)
(I(ϕ)− c1+c2
2
)
WSEAS TRANSACTIONS on BIOLOGY and BIOMEDICINEKhalid El Fahssi, Abdelali Elmoufidi, Abdenbi Abenaou, Said Jai-Andaloussi, Abderrahim Sekkaki
E-ISSN: 2224-2902 91 Volume 11, 2014

+ µ(4ϕ− div
(∇ϕ|∇ϕ|
))+ υδε(ϕ)div
(g. ∇ϕ|∇ϕ|
)]. -end.
wherec1 = Kσ∗[Hε(ϕ)I]
Kε∗Hε(ϕ)
andc2 = Kσ∗I−Kσ∗[Hε(ϕ)I]
Kσ∗1−Kσ∗Hε(ϕ)
(1 is a function with a constant value of 1).
Hε(ϕ) is the Heaviside function.σε is the Dirac function smoothed given by
σε(ϕ) = H ′(ϕ) =
[1
2[1 +
2
πarctan(
ϕ
ε)]
]′=
1
π.
ε
ε2 + ϕ2
3 The Proposed Method for Classifi-cation
The first part of the approach proposed in this arti-cle has allowed the segmentation and selection of re-gions of interest of mammography images of varioustypes of disease. The classification of mammogramsdepending on the type of disease images requires theextraction of the most relevant features in these re-gions of interest [28],[11].
the calculation of characteristics vectors informa-tive regions is ensured by the use of an adaptableorthogonal transformation [29]for each class regions(type of disease). The spectrum of informative char-acteristics of a given area (class) obtained decreasesrapidly. In other words, the analysis of the spectraobtained allows a considerable difference between theclasses of regions. This property will subsequentlydevelop a simple decision rule which ensured a highcertainty of classification.
The principle of the proposed method is to syn-thesize an adaptable operator orthogonal transforma-tion to generate functions of bases parameterizable.Using these transformations [29],[30] is favored bythe ability to adapt to the shape of their basic functionsdepending on the nature of the standard vector formedby mammograms each class images. In other words,for each type of disease a system of basis functions areassociated parameterizable for showing his images. Inaddition, these functions of base parameterizable meetthe criteria for completeness of the system ensuringthe transformation of vectors without loss of informa-tion content. The system of basis functions formed is
expressed as a factorisable orthonormal matrix oper-ator, which therefore allows a transformation with afast calculation algorithm:
Y =1
NHX (15)
where:- X = [x1, x2, ..., xN ]T is the vector representing theregion of interest in the segmented image mammogra-phy given initial vector transform (of size N = 2n).- Y = [y1, y2, ..., yN ]T is the vector of informationalcharacteristics calculated by the spectral operator or-thogonal H of dimension N x N.Factorization of Good [31] showed a possibility ofrepresenting the matrix operatorH as productGi (16)Sparse matrix with a higher proportion of zero whichhas allowed the construction the quick transformationalgorithms of Fourier , Haar and Walsh. The matricesGi(i = 1, ..., n) are constructed by blocks of matri-ces Vi,j of minimum dimension that is called spectralnuclei [29]:
With
Hence equation (15) can be written as follows:
Y =1
NHX =
1
NG1G2....GNX =
1
NΠNi=1Gi (17)
By defining the parametersϕi,j and θi,j can train oper-ators orthogonal of transformations with basic func-tions complex , and θi,j = 0 operators with real func-tions. Adapting Operator H in (15) is provided by thecondition:
1
NHaZsd = Yc = [Yc,1, 0, 0, ..., 0], Yc,1 6= 0 (18)
WSEAS TRANSACTIONS on BIOLOGY and BIOMEDICINEKhalid El Fahssi, Abdelali Elmoufidi, Abdenbi Abenaou, Said Jai-Andaloussi, Abderrahim Sekkaki
E-ISSN: 2224-2902 92 Volume 11, 2014
where:- Yc is the target that builds the basis for adjusting thevector operator Ha.- Zsd represents the calculated by means of the esti-mates of the statistical characteristics of images of agiven class standard vector.- Ha is adaptable to synthesize operator.Synthesis adaptable operator Ha based standard Zsd(for a given class) is to calculate the angular parame-ters ϕi,j matrices Gi according to condition (18). Theprocedure for calculation of the parameters is basedon an iterative algorithm to calculate the target vectorYc by step according to the equation:
Yi = GiY(i−1) (19)
The final calculation of the vector Yc allows obtainingadaptable operator Ha.
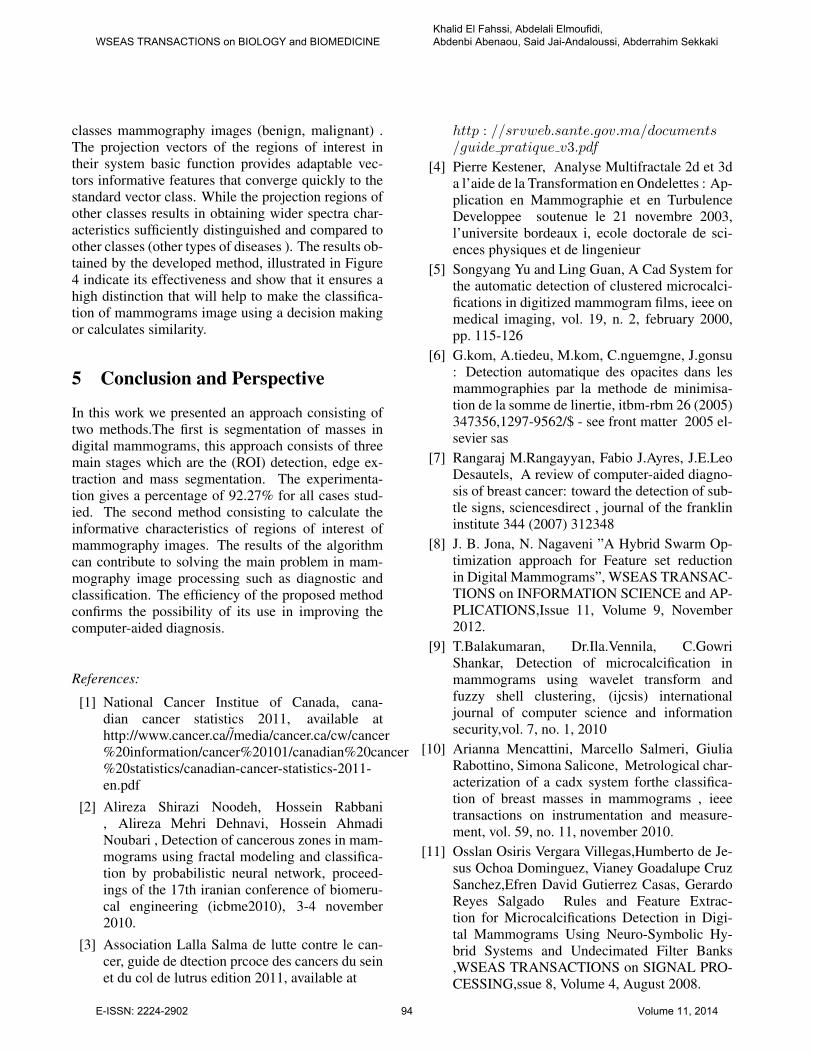
4 Results and DiscussionThis section presents the results of experimentsperformed on 111 selected mammography databasemini-MIAS images. To evaluate the effectivenessof the proposed method, we used the informationprovided by the Mammographic Image AnalysisSociety database (MIAS) including the class ofanomalous images and coordinates of their centers ofregions of interest. To test our method, the algorithmof segmentation is applied to each image containinga mass lesion, then verified if the algorithm detectsa region of interest containing the abnormally andsegment the mass, finally calculates the percentage ofabnormally detection on all cases. The example forresult of segmantation is presented a figure 3.
Figure 3: (a) The original image with Calcificationbenign. (b) Detection the region of interest (containsthe abnormally) (c) The original image with Calcifi-cation malignant. (d) Detection the region of interest(contains the abnormally)
The result of experiment carried on the 111mammogram image to detect the region of interestthat contains the disease and segment the mass givesthe percentage of precision equal to 92.27%.
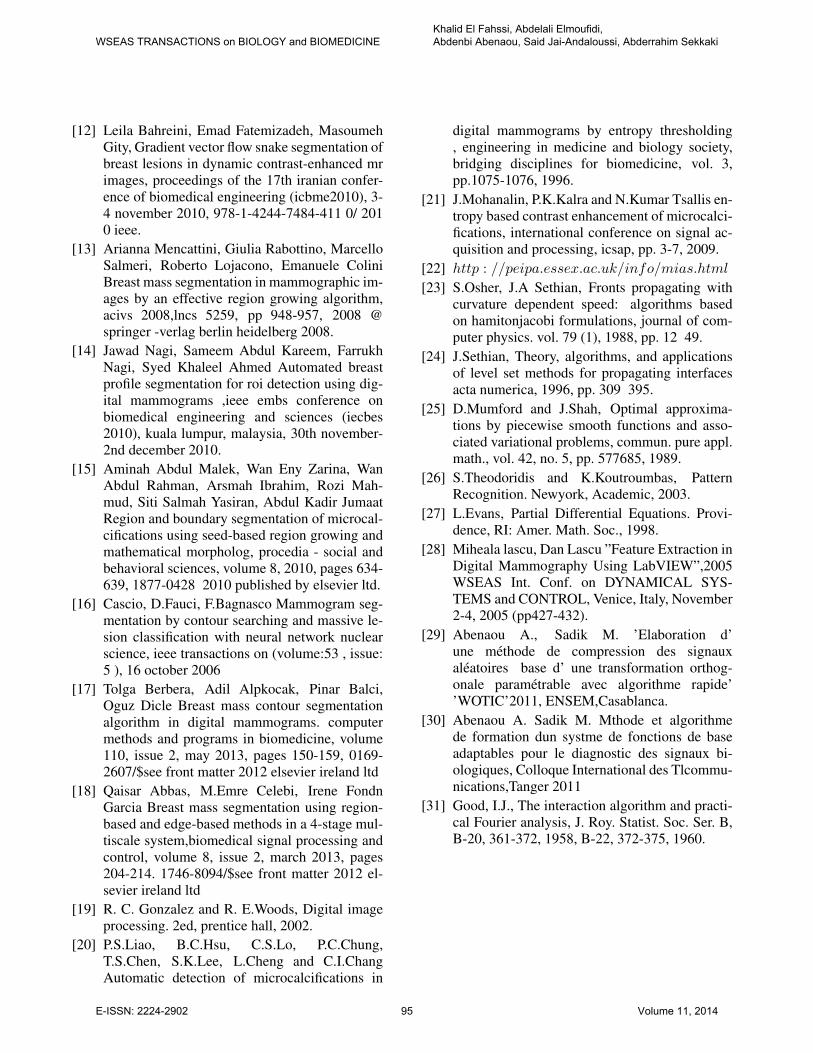
To illustrate the effectiveness of the proposedmethod of calculate the informative characteristics ofregions of interest of mammography images, Figure4 shows the result of an experiment at diagnosis oftwo types of mammograms Image ’malignant’ and’benign’.
Figure 4: (a) Spectre of projection the regions of inter-est with Calcification benign in new base. (b) Spectreof projection the regions of interest with Calcificationmalignant in new base.
Figure 4 reflects a considerable distinction of vec-tors informative characteristics of regions in different
WSEAS TRANSACTIONS on BIOLOGY and BIOMEDICINEKhalid El Fahssi, Abdelali Elmoufidi, Abdenbi Abenaou, Said Jai-Andaloussi, Abderrahim Sekkaki
E-ISSN: 2224-2902 93 Volume 11, 2014
classes mammography images (benign, malignant) .The projection vectors of the regions of interest intheir system basic function provides adaptable vec-tors informative features that converge quickly to thestandard vector class. While the projection regions ofother classes results in obtaining wider spectra char-acteristics sufficiently distinguished and compared toother classes (other types of diseases ). The results ob-tained by the developed method, illustrated in Figure4 indicate its effectiveness and show that it ensures ahigh distinction that will help to make the classifica-tion of mammograms image using a decision makingor calculates similarity.
5 Conclusion and Perspective
In this work we presented an approach consisting oftwo methods.The first is segmentation of masses indigital mammograms, this approach consists of threemain stages which are the (ROI) detection, edge ex-traction and mass segmentation. The experimenta-tion gives a percentage of 92.27% for all cases stud-ied. The second method consisting to calculate theinformative characteristics of regions of interest ofmammography images. The results of the algorithmcan contribute to solving the main problem in mam-mography image processing such as diagnostic andclassification. The efficiency of the proposed methodconfirms the possibility of its use in improving thecomputer-aided diagnosis.
References:
[1] National Cancer Institue of Canada, cana-dian cancer statistics 2011, available athttp://www.cancer.ca//media/cancer.ca/cw/cancer%20information/cancer%20101/canadian%20cancer%20statistics/canadian-cancer-statistics-2011-en.pdf
[2] Alireza Shirazi Noodeh, Hossein Rabbani, Alireza Mehri Dehnavi, Hossein AhmadiNoubari , Detection of cancerous zones in mam-mograms using fractal modeling and classifica-tion by probabilistic neural network, proceed-ings of the 17th iranian conference of biomeru-cal engineering (icbme2010), 3-4 november2010.
[3] Association Lalla Salma de lutte contre le can-cer, guide de dtection prcoce des cancers du seinet du col de lutrus edition 2011, available at
http : //srvweb.sante.gov.ma/documents/guide pratique v3.pdf
[4] Pierre Kestener, Analyse Multifractale 2d et 3da l’aide de la Transformation en Ondelettes : Ap-plication en Mammographie et en TurbulenceDeveloppee soutenue le 21 novembre 2003,l’universite bordeaux i, ecole doctorale de sci-ences physiques et de lingenieur
[5] Songyang Yu and Ling Guan, A Cad System forthe automatic detection of clustered microcalci-fications in digitized mammogram films, ieee onmedical imaging, vol. 19, n. 2, february 2000,pp. 115-126
[6] G.kom, A.tiedeu, M.kom, C.nguemgne, J.gonsu: Detection automatique des opacites dans lesmammographies par la methode de minimisa-tion de la somme de linertie, itbm-rbm 26 (2005)347356,1297-9562/$ - see front matter 2005 el-sevier sas
[7] Rangaraj M.Rangayyan, Fabio J.Ayres, J.E.LeoDesautels, A review of computer-aided diagno-sis of breast cancer: toward the detection of sub-tle signs, sciencesdirect , journal of the franklininstitute 344 (2007) 312348
[8] J. B. Jona, N. Nagaveni ”A Hybrid Swarm Op-timization approach for Feature set reductionin Digital Mammograms”, WSEAS TRANSAC-TIONS on INFORMATION SCIENCE and AP-PLICATIONS,Issue 11, Volume 9, November2012.
[9] T.Balakumaran, Dr.Ila.Vennila, C.GowriShankar, Detection of microcalcification inmammograms using wavelet transform andfuzzy shell clustering, (ijcsis) internationaljournal of computer science and informationsecurity,vol. 7, no. 1, 2010
[10] Arianna Mencattini, Marcello Salmeri, GiuliaRabottino, Simona Salicone, Metrological char-acterization of a cadx system forthe classifica-tion of breast masses in mammograms , ieeetransactions on instrumentation and measure-ment, vol. 59, no. 11, november 2010.
[11] Osslan Osiris Vergara Villegas,Humberto de Je-sus Ochoa Dominguez, Vianey Goadalupe CruzSanchez,Efren David Gutierrez Casas, GerardoReyes Salgado Rules and Feature Extrac-tion for Microcalcifications Detection in Digi-tal Mammograms Using Neuro-Symbolic Hy-brid Systems and Undecimated Filter Banks,WSEAS TRANSACTIONS on SIGNAL PRO-CESSING,ssue 8, Volume 4, August 2008.
WSEAS TRANSACTIONS on BIOLOGY and BIOMEDICINEKhalid El Fahssi, Abdelali Elmoufidi, Abdenbi Abenaou, Said Jai-Andaloussi, Abderrahim Sekkaki
E-ISSN: 2224-2902 94 Volume 11, 2014
[12] Leila Bahreini, Emad Fatemizadeh, MasoumehGity, Gradient vector flow snake segmentation ofbreast lesions in dynamic contrast-enhanced mrimages, proceedings of the 17th iranian confer-ence of biomedical engineering (icbme2010), 3-4 november 2010, 978-1-4244-7484-411 0/ 2010 ieee.
[13] Arianna Mencattini, Giulia Rabottino, MarcelloSalmeri, Roberto Lojacono, Emanuele ColiniBreast mass segmentation in mammographic im-ages by an effective region growing algorithm,acivs 2008,lncs 5259, pp 948-957, 2008 @springer -verlag berlin heidelberg 2008.
[14] Jawad Nagi, Sameem Abdul Kareem, FarrukhNagi, Syed Khaleel Ahmed Automated breastprofile segmentation for roi detection using dig-ital mammograms ,ieee embs conference onbiomedical engineering and sciences (iecbes2010), kuala lumpur, malaysia, 30th november-2nd december 2010.
[15] Aminah Abdul Malek, Wan Eny Zarina, WanAbdul Rahman, Arsmah Ibrahim, Rozi Mah-mud, Siti Salmah Yasiran, Abdul Kadir JumaatRegion and boundary segmentation of microcal-cifications using seed-based region growing andmathematical morpholog, procedia - social andbehavioral sciences, volume 8, 2010, pages 634-639, 1877-0428 2010 published by elsevier ltd.
[16] Cascio, D.Fauci, F.Bagnasco Mammogram seg-mentation by contour searching and massive le-sion classification with neural network nuclearscience, ieee transactions on (volume:53 , issue:5 ), 16 october 2006
[17] Tolga Berbera, Adil Alpkocak, Pinar Balci,Oguz Dicle Breast mass contour segmentationalgorithm in digital mammograms. computermethods and programs in biomedicine, volume110, issue 2, may 2013, pages 150-159, 0169-2607/$see front matter 2012 elsevier ireland ltd
[18] Qaisar Abbas, M.Emre Celebi, Irene FondnGarcia Breast mass segmentation using region-based and edge-based methods in a 4-stage mul-tiscale system,biomedical signal processing andcontrol, volume 8, issue 2, march 2013, pages204-214. 1746-8094/$see front matter 2012 el-sevier ireland ltd
[19] R. C. Gonzalez and R. E.Woods, Digital imageprocessing. 2ed, prentice hall, 2002.
[20] P.S.Liao, B.C.Hsu, C.S.Lo, P.C.Chung,T.S.Chen, S.K.Lee, L.Cheng and C.I.ChangAutomatic detection of microcalcifications in
digital mammograms by entropy thresholding, engineering in medicine and biology society,bridging disciplines for biomedicine, vol. 3,pp.1075-1076, 1996.
[21] J.Mohanalin, P.K.Kalra and N.Kumar Tsallis en-tropy based contrast enhancement of microcalci-fications, international conference on signal ac-quisition and processing, icsap, pp. 3-7, 2009.
[22] http : //peipa.essex.ac.uk/info/mias.html
[23] S.Osher, J.A Sethian, Fronts propagating withcurvature dependent speed: algorithms basedon hamitonjacobi formulations, journal of com-puter physics. vol. 79 (1), 1988, pp. 12 49.
[24] J.Sethian, Theory, algorithms, and applicationsof level set methods for propagating interfacesacta numerica, 1996, pp. 309 395.
[25] D.Mumford and J.Shah, Optimal approxima-tions by piecewise smooth functions and asso-ciated variational problems, commun. pure appl.math., vol. 42, no. 5, pp. 577685, 1989.
[26] S.Theodoridis and K.Koutroumbas, PatternRecognition. Newyork, Academic, 2003.
[27] L.Evans, Partial Differential Equations. Provi-dence, RI: Amer. Math. Soc., 1998.
[28] Miheala lascu, Dan Lascu ”Feature Extraction inDigital Mammography Using LabVIEW”,2005WSEAS Int. Conf. on DYNAMICAL SYS-TEMS and CONTROL, Venice, Italy, November2-4, 2005 (pp427-432).
[29] Abenaou A., Sadik M. ’Elaboration d’une methode de compression des signauxaleatoires base d’ une transformation orthog-onale parametrable avec algorithme rapide’’WOTIC’2011, ENSEM,Casablanca.
[30] Abenaou A. Sadik M. Mthode et algorithmede formation dun systme de fonctions de baseadaptables pour le diagnostic des signaux bi-ologiques, Colloque International des Tlcommu-nications,Tanger 2011
[31] Good, I.J., The interaction algorithm and practi-cal Fourier analysis, J. Roy. Statist. Soc. Ser. B,B-20, 361-372, 1958, B-22, 372-375, 1960.
WSEAS TRANSACTIONS on BIOLOGY and BIOMEDICINEKhalid El Fahssi, Abdelali Elmoufidi, Abdenbi Abenaou, Said Jai-Andaloussi, Abderrahim Sekkaki
E-ISSN: 2224-2902 95 Volume 11, 2014
Related Documents