FEASIBILITY STUDY FOR A PROPOSED HOTEL IN SOUTH LAKE TAHOE, CALIFORNIA A Thesis Presented to the Faculty of California State University, Stanislaus In Partial Fulfillment of the Requirements for the Degree of Master of Business Administration By Caleb Flora October 2020

Welcome message from author
This document is posted to help you gain knowledge. Please leave a comment to let me know what you think about it! Share it to your friends and learn new things together.
Transcript
FEASIBILITY STUDY FOR A PROPOSED HOTEL IN
SOUTH LAKE TAHOE, CALIFORNIA
A Thesis Presented to the Faculty
of
California State University, Stanislaus
In Partial Fulfillment
of the Requirements for the Degree
of Master of Business Administration
By
Caleb Flora
October 2020
CERTIFICATION OF APPROVAL
FEASIBILITY STUDY FOR A PROPOSED HOTEL IN
SOUTH LAKE TAHOE, CALIFORNIA
by
Caleb Flora
Dr. Yili Lian, Faculty Advisor
Associate Professor of Finance
Ms. Katrina Kidd, Director
Graduate Business Programs
Dr. Tomas Gomez-Arias, Dean
College of Business Administration
Date
Date
Date
Signed Certification of Approval page
is on file with the University Library

© 2020
Caleb Flora
ALL RIGHTS RESERVED
iv
DEDICATION
I wish to dedicate this project to the following people:
My parents, whose love, unselfish support, and example over many years laid
the foundations for the discipline and application necessary to complete this work.
My wife, whose steadfast love, unwavering support, and never-ending
patience has allowed me to dedicate the time necessary to complete this work.
My son, who inspires me every day to strive to be the best version of myself.

v
ACKNOWLEDGEMENTS
This project has become reality with the kind support and help of many
individuals. I would like to extend my sincere appreciation to all of them.
First and foremost, I must acknowledge and thank God for His provisions and
grace in my life and for granting me the opportunity to pursue a graduate degree in
business administration. My goal is to use the knowledge gained in this program, to
be a humble and effective servant leader not only in my professional and business
dealings, but also in my family and my community.
I would like to express my gratitude to my family for their encouragement
which helped me in the completion of this paper and ultimately, this program. My
amazing and supportive wife, who has supported and encouraged me through both
undergraduate studies and now graduate school, is the primary reason I did not give
up when the going got tough. To my son, I love you. News of your addition to our
family was the final push I needed to enroll in graduate school.
I would like to express my sincere gratitude to my advisor, Dr. Yili Lian for
imparting his knowledge and expertise in this study.
My thanks and appreciation also go to my colleagues and others who have
willingly helped out with their abilities throughout this study and throughout the
entirety of the graduate program.
vi
TABLE OF CONTENTS
PAGE
Dedication ............................................................................................................... iv
Acknowledgements ................................................................................................. v
List of Tables .......................................................................................................... viii
List of Figures ......................................................................................................... ix
Abstract ................................................................................................................... x
Introduction ............................................................................................................. 1
Project Scope .............................................................................................. 1
Vision .......................................................................................................... 2
Mission ........................................................................................................ 2
Supply and Demand ................................................................................................ 3
Potential Volume ........................................................................................ 3
Seasonal Attractions.................................................................................... 7
SWOT Analysis .......................................................................................... 10
Market Analysis ...................................................................................................... 11
Competition................................................................................................. 11
Target Market.............................................................................................. 13
Rates ............................................................................................................ 13
Seasonal Occupancy Rates ......................................................................... 16
Pro Forma Financials .............................................................................................. 17
Balance Sheet .............................................................................................. 17
Income Statement........................................................................................ 19
Cash Flow Statement .................................................................................. 21
Initial Investment .................................................................................................... 24
Purchase and Renovate ............................................................................... 24
Ground Up Construction ............................................................................. 27
vii
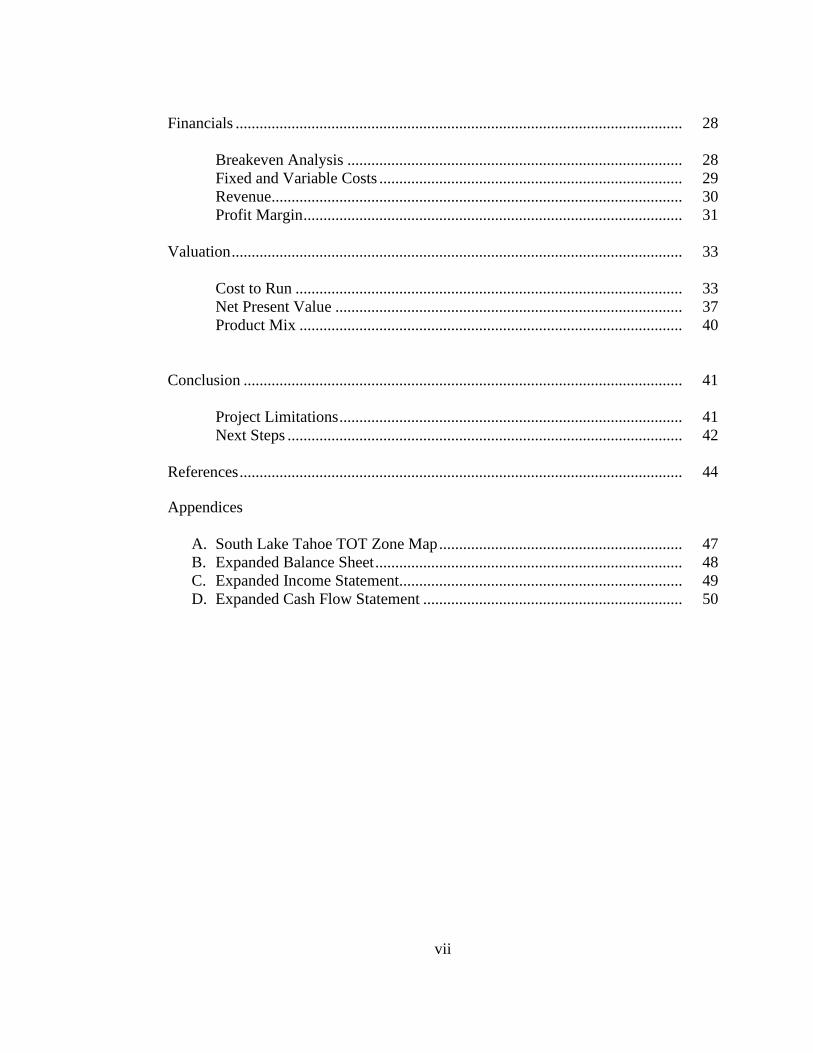
Financials ................................................................................................................ 28
Breakeven Analysis .................................................................................... 28
Fixed and Variable Costs ............................................................................ 29
Revenue....................................................................................................... 30
Profit Margin ............................................................................................... 31
Valuation ................................................................................................................. 33
Cost to Run ................................................................................................. 33
Net Present Value ....................................................................................... 37
Product Mix ................................................................................................ 40
Conclusion .............................................................................................................. 41
Project Limitations ...................................................................................... 41
Next Steps ................................................................................................... 42
References ............................................................................................................... 44
Appendices
A. South Lake Tahoe TOT Zone Map ............................................................. 47
B. Expanded Balance Sheet ............................................................................. 48
C. Expanded Income Statement....................................................................... 49
D. Expanded Cash Flow Statement ................................................................. 50
viii
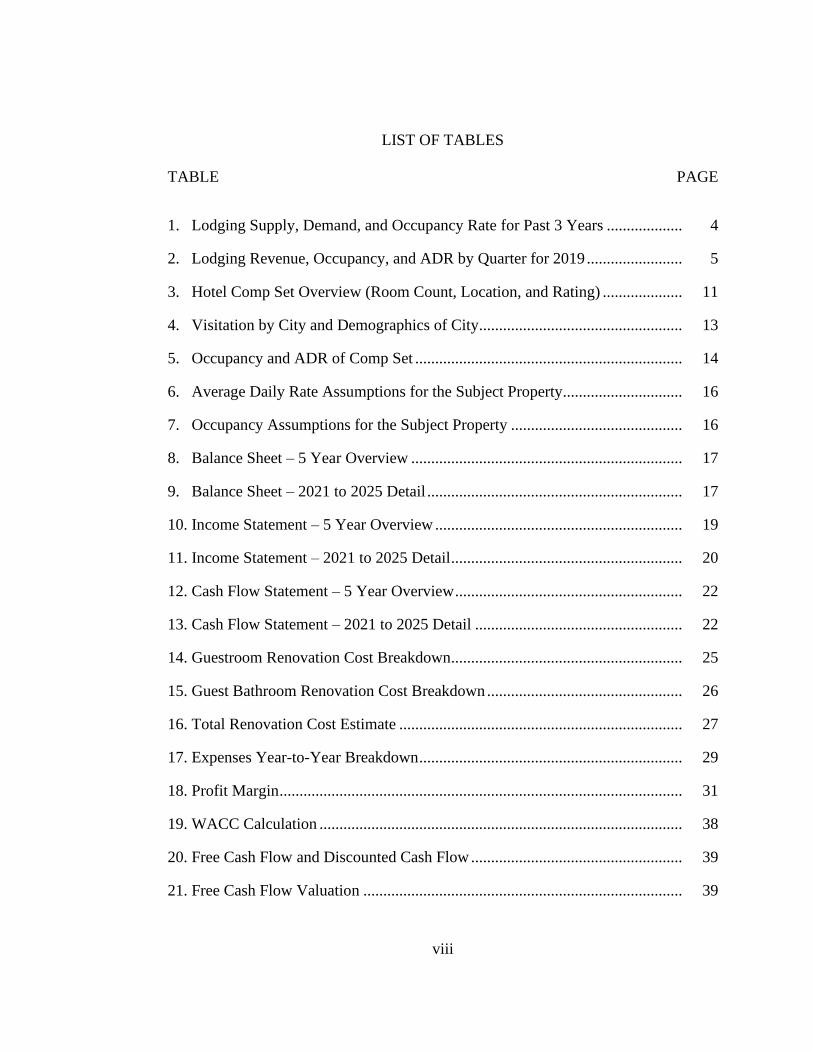
LIST OF TABLES
TABLE PAGE
1. Lodging Supply, Demand, and Occupancy Rate for Past 3 Years ................... 4
2. Lodging Revenue, Occupancy, and ADR by Quarter for 2019 ........................ 5
3. Hotel Comp Set Overview (Room Count, Location, and Rating) .................... 11
4. Visitation by City and Demographics of City................................................... 13
5. Occupancy and ADR of Comp Set ................................................................... 14
6. Average Daily Rate Assumptions for the Subject Property.............................. 16
7. Occupancy Assumptions for the Subject Property ........................................... 16
8. Balance Sheet – 5 Year Overview .................................................................... 17
9. Balance Sheet – 2021 to 2025 Detail ................................................................ 17
10. Income Statement – 5 Year Overview .............................................................. 19
11. Income Statement – 2021 to 2025 Detail .......................................................... 20
12. Cash Flow Statement – 5 Year Overview ......................................................... 22
13. Cash Flow Statement – 2021 to 2025 Detail .................................................... 22
14. Guestroom Renovation Cost Breakdown.......................................................... 25
15. Guest Bathroom Renovation Cost Breakdown ................................................. 26
16. Total Renovation Cost Estimate ....................................................................... 27
17. Expenses Year-to-Year Breakdown .................................................................. 29
18. Profit Margin ..................................................................................................... 31
19. WACC Calculation ........................................................................................... 38
20. Free Cash Flow and Discounted Cash Flow ..................................................... 39
21. Free Cash Flow Valuation ................................................................................ 39
ix
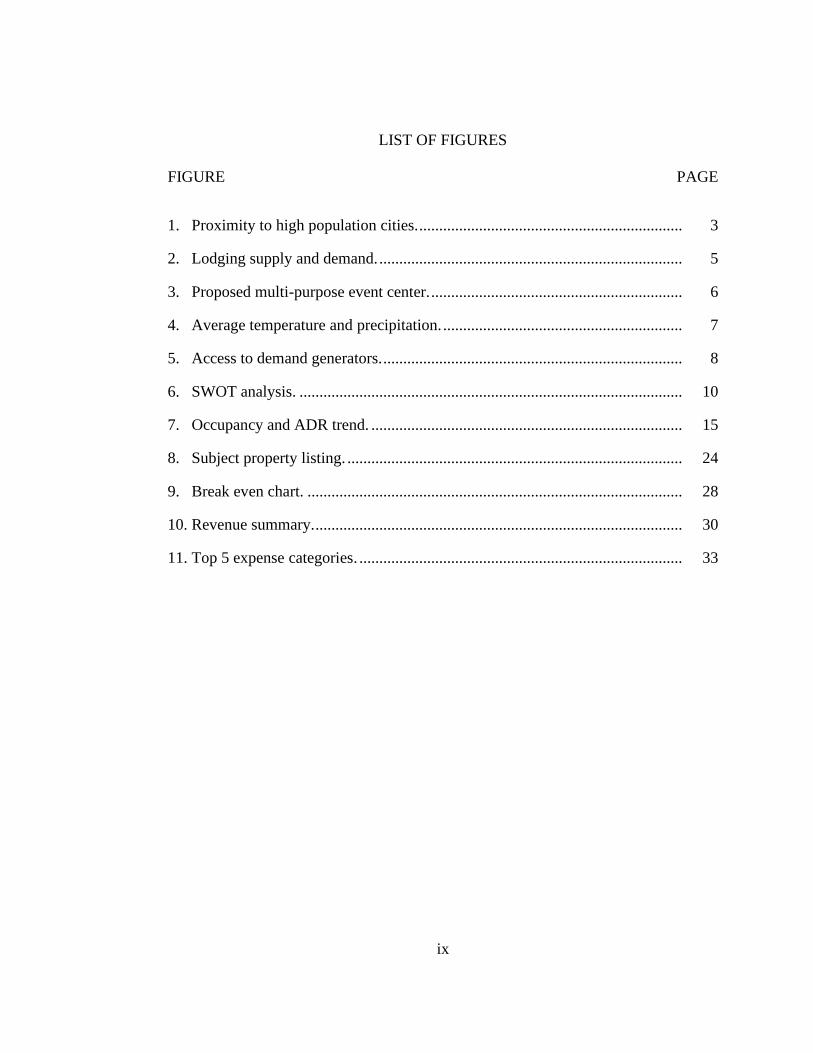
LIST OF FIGURES
FIGURE PAGE
1. Proximity to high population cities. .................................................................. 3
2. Lodging supply and demand. ............................................................................ 5
3. Proposed multi-purpose event center. ............................................................... 6
4. Average temperature and precipitation. ............................................................ 7
5. Access to demand generators. ........................................................................... 8
6. SWOT analysis. ................................................................................................ 10
7. Occupancy and ADR trend. .............................................................................. 15
8. Subject property listing. .................................................................................... 24
9. Break even chart. .............................................................................................. 28
10. Revenue summary. ............................................................................................ 30
11. Top 5 expense categories. ................................................................................. 33
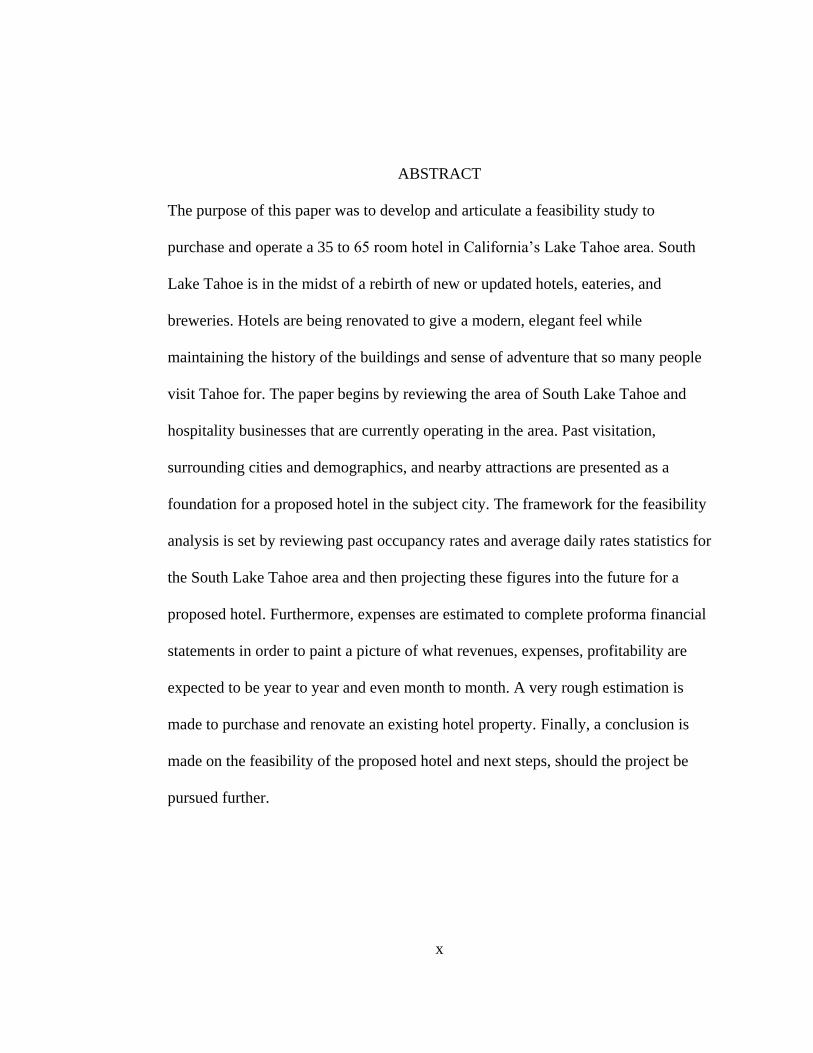
ABSTRACT
The purpose of this paper was to develop and articulate a feasibility study to
purchase and operate a 35 to 65 room hotel in California’s Lake Tahoe area. South
Lake Tahoe is in the midst of a rebirth of new or updated hotels, eateries, and
breweries. Hotels are being renovated to give a modern, elegant feel while
maintaining the history of the buildings and sense of adventure that so many people
visit Tahoe for. The paper begins by reviewing the area of South Lake Tahoe and
hospitality businesses that are currently operating in the area. Past visitation,
surrounding cities and demographics, and nearby attractions are presented as a
foundation for a proposed hotel in the subject city. The framework for the feasibility
analysis is set by reviewing past occupancy rates and average daily rates statistics for
the South Lake Tahoe area and then projecting these figures into the future for a
proposed hotel. Furthermore, expenses are estimated to complete proforma financial
statements in order to paint a picture of what revenues, expenses, profitability are
expected to be year to year and even month to month. A very rough estimation is
made to purchase and renovate an existing hotel property. Finally, a conclusion is
made on the feasibility of the proposed hotel and next steps, should the project be
pursued further.
x
1
INTRODUCTION
Project Scope
The goal of this project is to conduct, formulate, and then concisely present, a
feasibility study to acquire and operate a full service, boutique lodging facility in
South Lake Tahoe California. This report will make a conclusion of the feasibility of
the endeavor by reviewing data and projections related to market demand, local
seasonal attractions, future growth plans for the area, current hospitality market
analysis, purchase and renovation estimates, and pro forma financial projections. The
report focuses on acquiring and renovating a 22,794 sq ft vintage motel for sale in the
Tourist Core Area of South Lake Tahoe and consisting of 58 lodging rooms.
However, the data report is compiled in such a way that it could be quickly updated to
input new information based on a new property that becomes available.
It is necessary, first, to briefly introduce the subject city – South Lake Tahoe.
The city, located on the southern shore of Lake Tahoe in California’s Sierra Nevada
mountains, is known for being surrounded by stunningly beautiful, natural scenery. It
sits on the California–Nevada border and is primarily geared toward tourism thanks to
the beautiful scenery in addition to year-round attractions that will be covered in more
detail throughout this paper. The city is directly adjacent to the census-designated
place of Stateline, Nevada, known for its world class casinos with big name
entertainment.
2
South Lake Tahoe is a vibrant mountain community with a population of
residents and visitors who enjoy exploring beautiful outdoor locations. Lake Tahoe’s
South Shore is in the midst of a revival – old motels are transforming into trendy
lodgings, a growing craft brewery scene has emerged, new restaurants are popping up
and luxury condos are being built on the lake front. Technology is attracting business
owners and workers who are devoted to fostering a unique, active lifestyle centered
around the Sierra Nevada mountains and the largest alpine lake in North America –
an unparalleled combination that has South Lake Tahoe dubbed “the outdoor capital
of the world.”
Vision
The vision of this hotel project is to leverage the growing trend of revitalized,
midcentury motels into a style-conscious and contemporary experience that caters to
the values of the millennial adventurer.
Mission
The mission of our hotel is to provide outstanding lodging facilities and
services to our guests with a focus on providing the opportunity to experience unique
social connections and interactions with other guests in our common gathering areas.
We emphasize high quality standards in our rooms and food and beverage divisions.
We seek to provide a fair return on investment for our owners and recognize that this
cannot be done without well trained, motivated, and enthusiastic team members.
3
SUPPLY AND DEMAND
Potential Volume
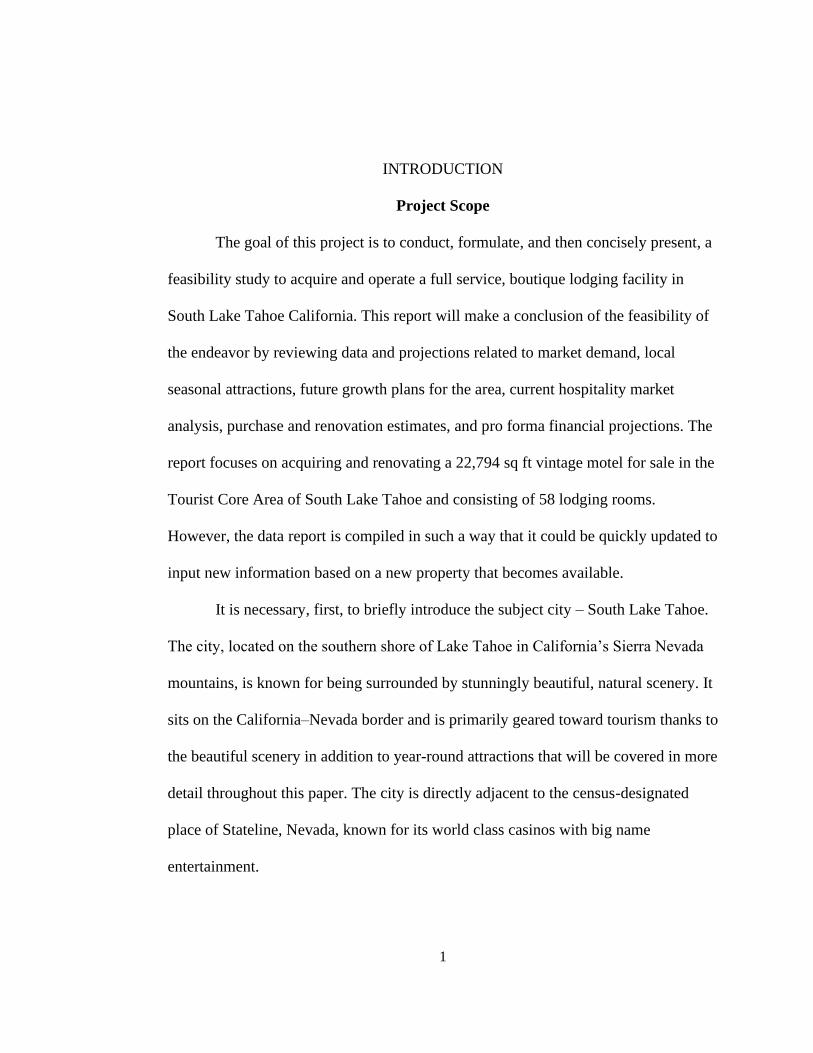
The Lake Tahoe area offers year-round attractions and is less than 4 hours
away by car for 8 million to 12 million people in large cities like Sacramento, San
Francisco, San Jose, Oakland, and other smaller towns in California’s Central Valley
like Stockton, Modesto, and others. It is experiencing an awakening of new
restaurants, breweries, and entertainment activities which, in combination with
unparalleled beautiful scenery, continues to attract vacationers from surrounding
cities and all around the world.
Figure 1. Proximity to high population cities. This figure shows proximity of the subject city
to high population areas.
4
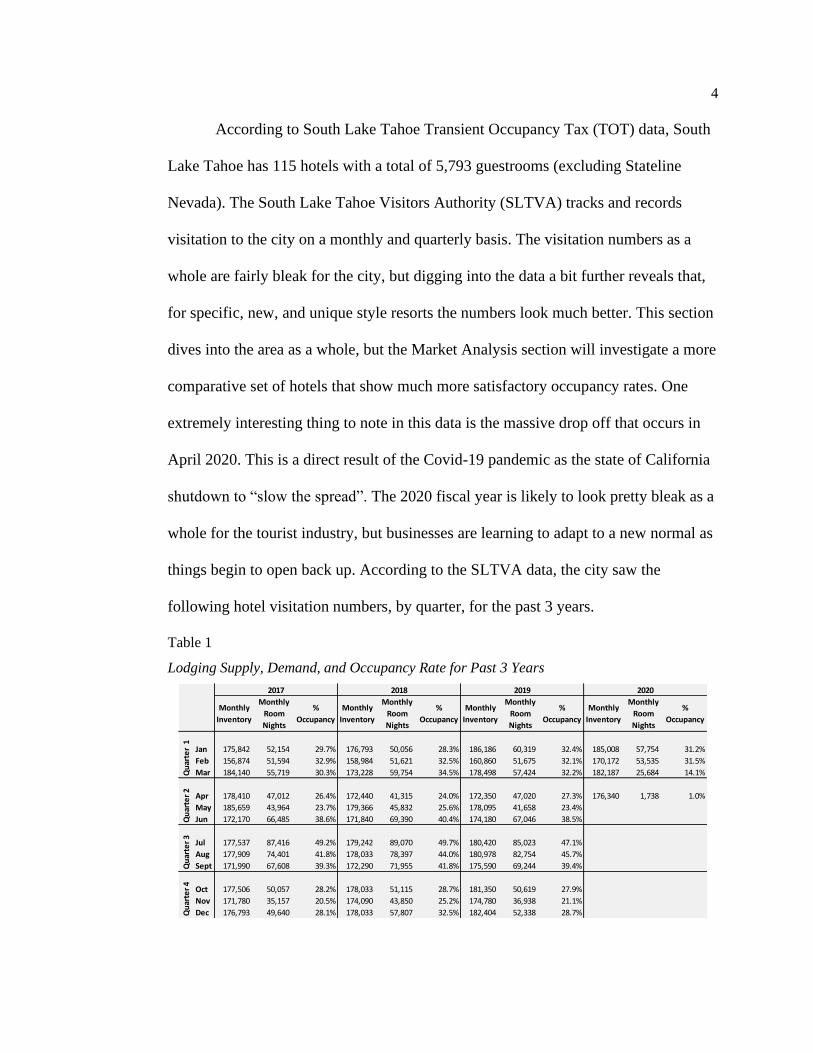
According to South Lake Tahoe Transient Occupancy Tax (TOT) data, South
Lake Tahoe has 115 hotels with a total of 5,793 guestrooms (excluding Stateline
Nevada). The South Lake Tahoe Visitors Authority (SLTVA) tracks and records
visitation to the city on a monthly and quarterly basis. The visitation numbers as a
whole are fairly bleak for the city, but digging into the data a bit further reveals that,
for specific, new, and unique style resorts the numbers look much better. This section
dives into the area as a whole, but the Market Analysis section will investigate a more
comparative set of hotels that show much more satisfactory occupancy rates. One
extremely interesting thing to note in this data is the massive drop off that occurs in
April 2020. This is a direct result of the Covid-19 pandemic as the state of California
shutdown to “slow the spread”. The 2020 fiscal year is likely to look pretty bleak as a
whole for the tourist industry, but businesses are learning to adapt to a new normal as
things begin to open back up. According to the SLTVA data, the city saw the
following hotel visitation numbers, by quarter, for the past 3 years.
Table 1
Lodging Supply, Demand, and Occupancy Rate for Past 3 Years
Monthly
Inventory
Monthly
Room
Nights
%
Occupancy
Monthly
Inventory
Monthly
Room
Nights
%
Occupancy
Monthly
Inventory
Monthly
Room
Nights
%
Occupancy
Monthly
Inventory
Monthly
Room
Nights
%
Occupancy
Jan 175,842 52,154 29.7% 176,793 50,056 28.3% 186,186 60,319 32.4% 185,008 57,754 31.2%
Feb 156,874 51,594 32.9% 158,984 51,621 32.5% 160,860 51,675 32.1% 170,172 53,535 31.5%
Mar 184,140 55,719 30.3% 173,228 59,754 34.5% 178,498 57,424 32.2% 182,187 25,684 14.1%
Apr 178,410 47,012 26.4% 172,440 41,315 24.0% 172,350 47,020 27.3% 176,340 1,738 1.0%
May 185,659 43,964 23.7% 179,366 45,832 25.6% 178,095 41,658 23.4%
Jun 172,170 66,485 38.6% 171,840 69,390 40.4% 174,180 67,046 38.5%
Jul 177,537 87,416 49.2% 179,242 89,070 49.7% 180,420 85,023 47.1%
Aug 177,909 74,401 41.8% 178,033 78,397 44.0% 180,978 82,754 45.7%
Sept 171,990 67,608 39.3% 172,290 71,955 41.8% 175,590 69,244 39.4%
Oct 177,506 50,057 28.2% 178,033 51,115 28.7% 181,350 50,619 27.9%
Nov 171,780 35,157 20.5% 174,090 43,850 25.2% 174,780 36,938 21.1%
Dec 176,793 49,640 28.1% 178,033 57,807 32.5% 182,404 52,338 28.7%
Qu
arte
r 1
Qu
arte
r 2
Qu
arte
r 3
Qu
arte
r 4
2020201920182017
5
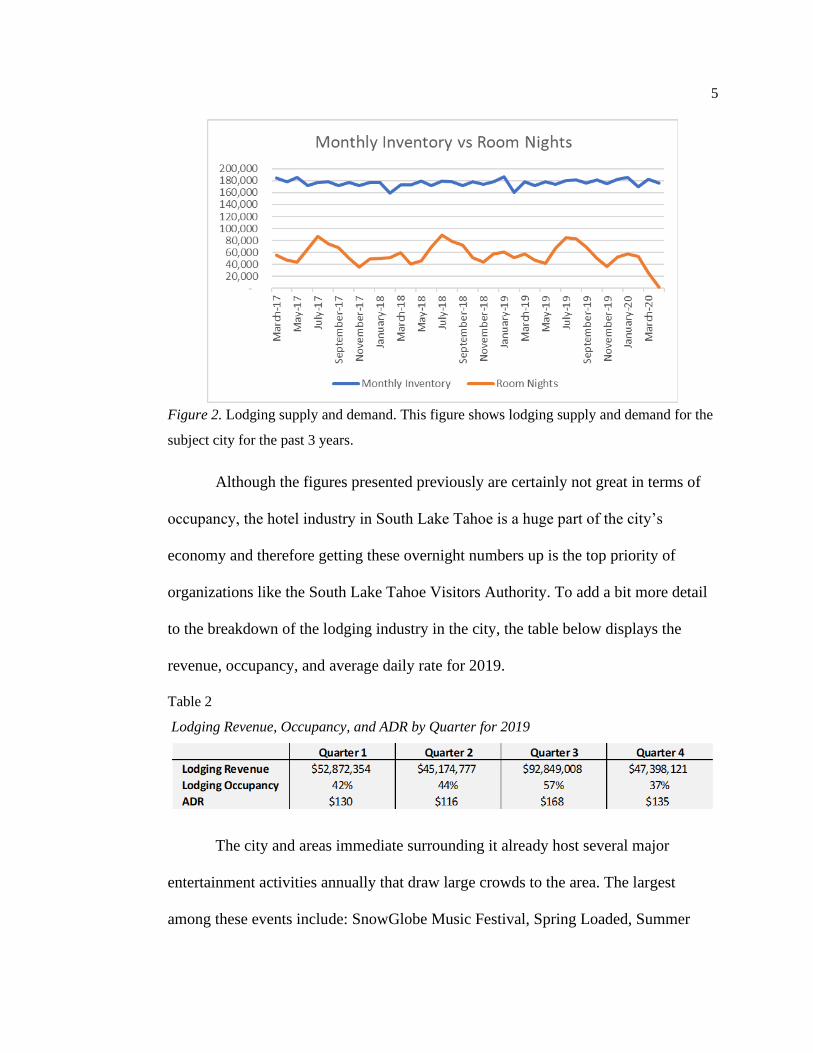
Figure 2. Lodging supply and demand. This figure shows lodging supply and demand for the
subject city for the past 3 years.
Although the figures presented previously are certainly not great in terms of
occupancy, the hotel industry in South Lake Tahoe is a huge part of the city’s
economy and therefore getting these overnight numbers up is the top priority of
organizations like the South Lake Tahoe Visitors Authority. To add a bit more detail
to the breakdown of the lodging industry in the city, the table below displays the
revenue, occupancy, and average daily rate for 2019.
Table 2
Lodging Revenue, Occupancy, and ADR by Quarter for 2019
The city and areas immediate surrounding it already host several major
entertainment activities annually that draw large crowds to the area. The largest
among these events include: SnowGlobe Music Festival, Spring Loaded, Summer
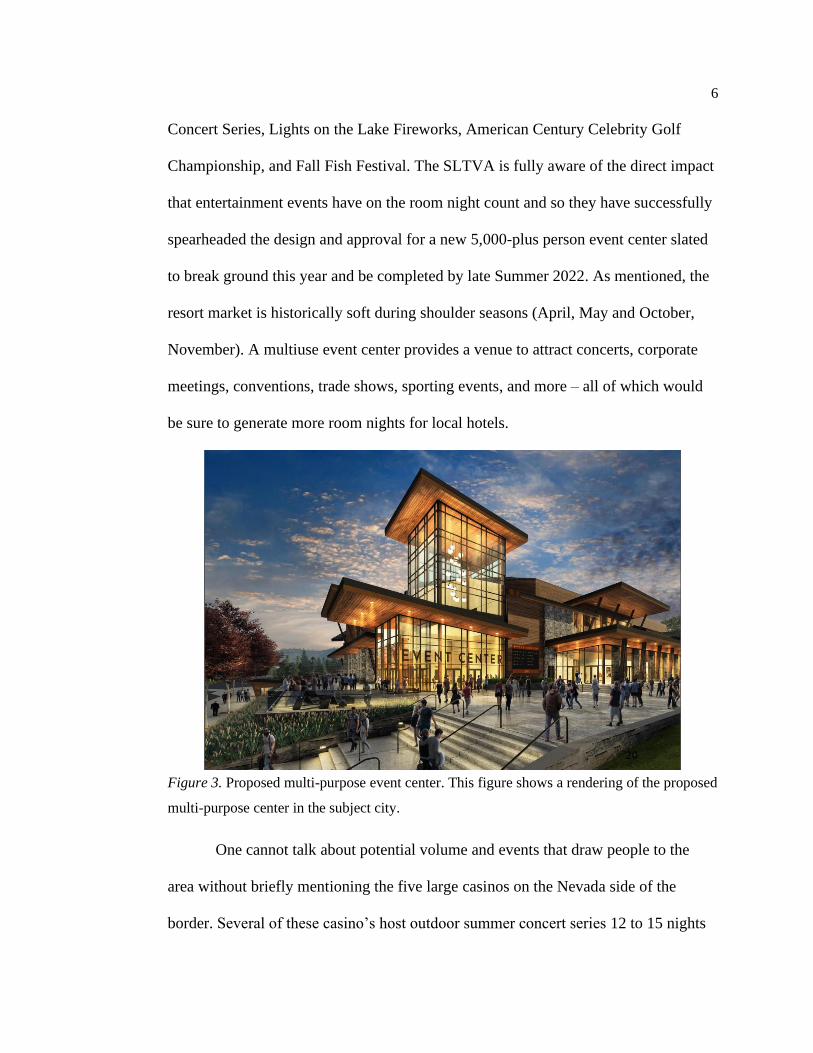
6
Concert Series, Lights on the Lake Fireworks, American Century Celebrity Golf
Championship, and Fall Fish Festival. The SLTVA is fully aware of the direct impact
that entertainment events have on the room night count and so they have successfully
spearheaded the design and approval for a new 5,000-plus person event center slated
to break ground this year and be completed by late Summer 2022. As mentioned, the
resort market is historically soft during shoulder seasons (April, May and October,
November). A multiuse event center provides a venue to attract concerts, corporate
meetings, conventions, trade shows, sporting events, and more – all of which would
be sure to generate more room nights for local hotels.
Figure 3. Proposed multi-purpose event center. This figure shows a rendering of the proposed
multi-purpose center in the subject city.
One cannot talk about potential volume and events that draw people to the
area without briefly mentioning the five large casinos on the Nevada side of the
border. Several of these casino’s host outdoor summer concert series 12 to 15 nights
7
during the summer months and according to the LTVA, have demonstrated that
entertainment is a significant room night generator.
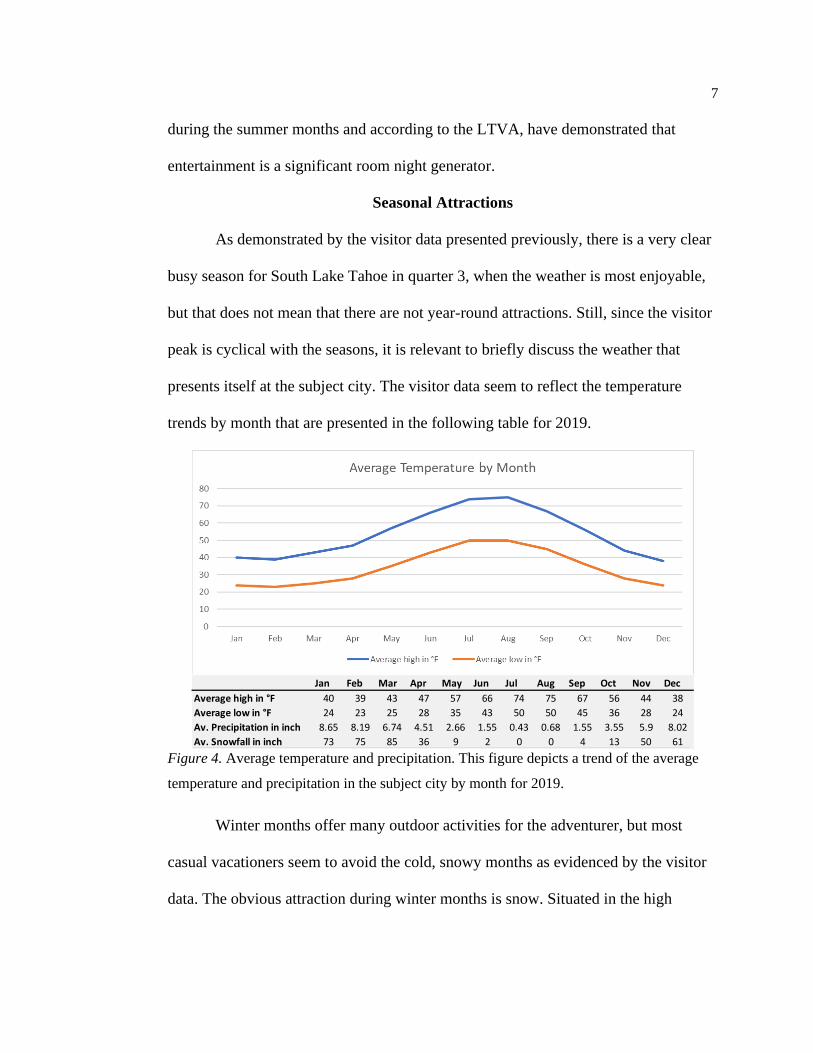
Seasonal Attractions
As demonstrated by the visitor data presented previously, there is a very clear
busy season for South Lake Tahoe in quarter 3, when the weather is most enjoyable,
but that does not mean that there are not year-round attractions. Still, since the visitor
peak is cyclical with the seasons, it is relevant to briefly discuss the weather that
presents itself at the subject city. The visitor data seem to reflect the temperature
trends by month that are presented in the following table for 2019.
Figure 4. Average temperature and precipitation. This figure depicts a trend of the average
temperature and precipitation in the subject city by month for 2019.
Winter months offer many outdoor activities for the adventurer, but most
casual vacationers seem to avoid the cold, snowy months as evidenced by the visitor
data. The obvious attraction during winter months is snow. Situated in the high
Jan Feb Mar Apr May Jun Jul Aug Sep Oct Nov Dec
Average high in °F 40 39 43 47 57 66 74 75 67 56 44 38
Average low in °F 24 23 25 28 35 43 50 50 45 36 28 24
Av. Precipitation in inch 8.65 8.19 6.74 4.51 2.66 1.55 0.43 0.68 1.55 3.55 5.9 8.02
Av. Snowfall in inch 73 75 85 36 9 2 0 0 4 13 50 61
8
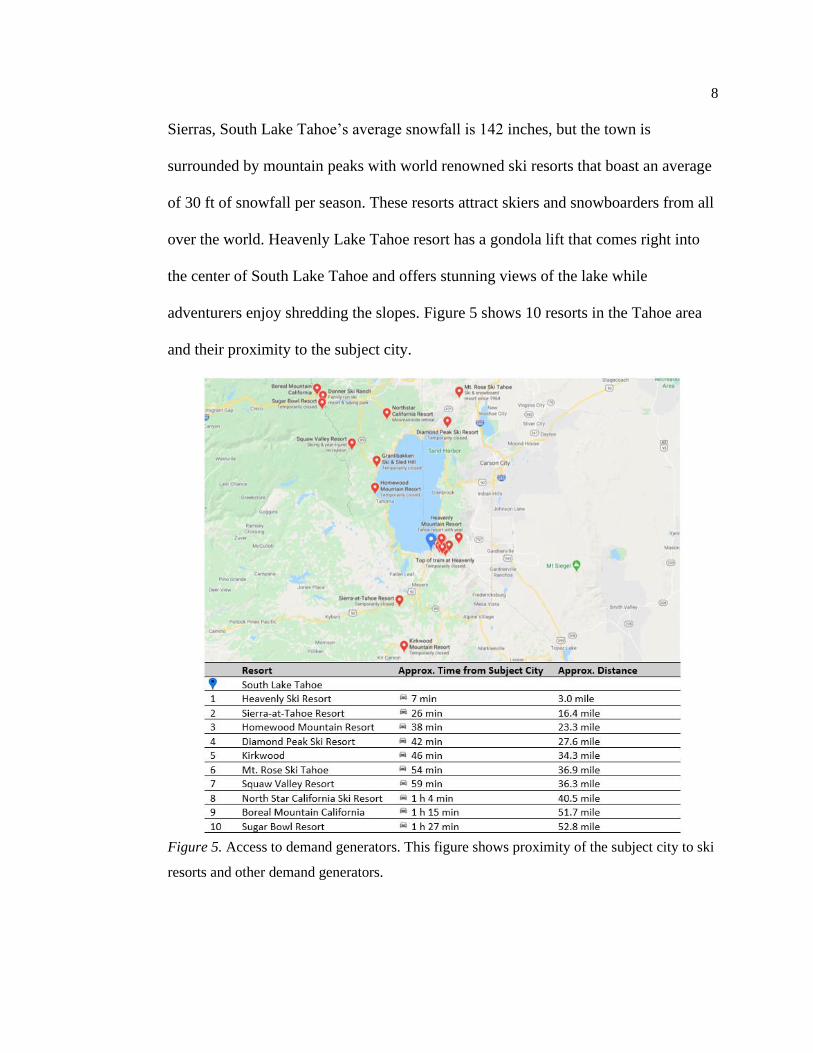
Sierras, South Lake Tahoe’s average snowfall is 142 inches, but the town is
surrounded by mountain peaks with world renowned ski resorts that boast an average
of 30 ft of snowfall per season. These resorts attract skiers and snowboarders from all
over the world. Heavenly Lake Tahoe resort has a gondola lift that comes right into
the center of South Lake Tahoe and offers stunning views of the lake while
adventurers enjoy shredding the slopes. Figure 5 shows 10 resorts in the Tahoe area
and their proximity to the subject city.
Figure 5. Access to demand generators. This figure shows proximity of the subject city to ski
resorts and other demand generators.
9
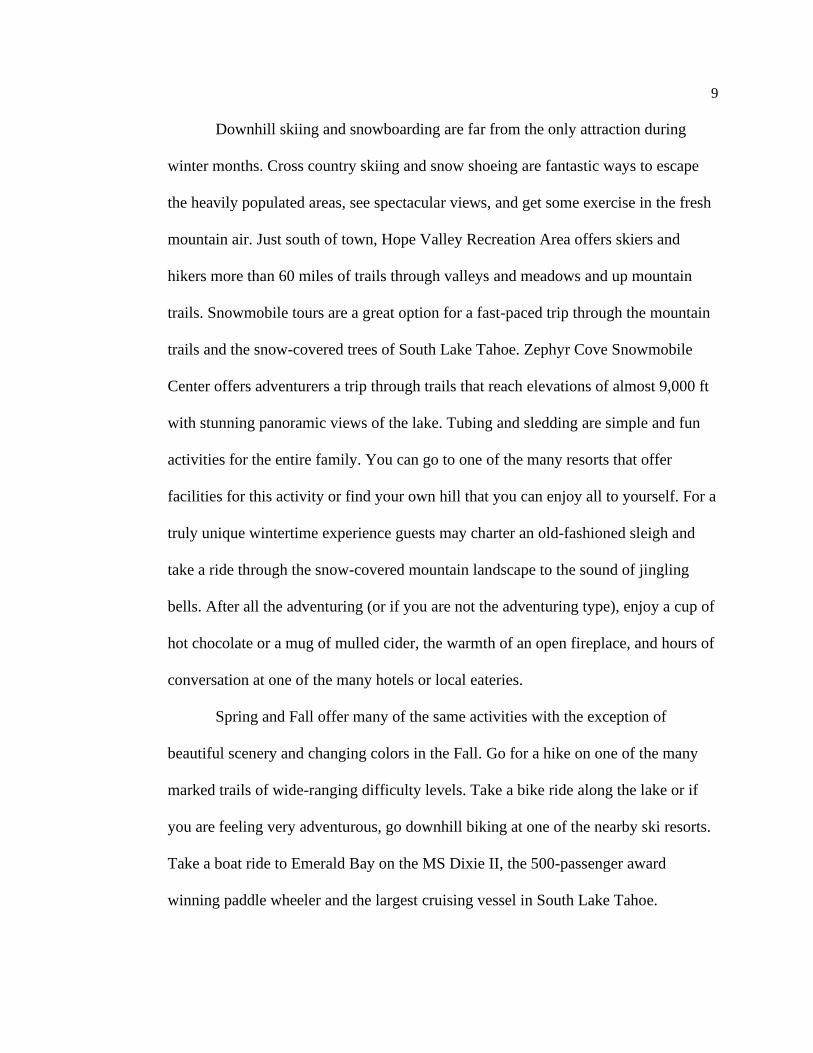
Downhill skiing and snowboarding are far from the only attraction during
winter months. Cross country skiing and snow shoeing are fantastic ways to escape
the heavily populated areas, see spectacular views, and get some exercise in the fresh
mountain air. Just south of town, Hope Valley Recreation Area offers skiers and
hikers more than 60 miles of trails through valleys and meadows and up mountain
trails. Snowmobile tours are a great option for a fast-paced trip through the mountain
trails and the snow-covered trees of South Lake Tahoe. Zephyr Cove Snowmobile
Center offers adventurers a trip through trails that reach elevations of almost 9,000 ft
with stunning panoramic views of the lake. Tubing and sledding are simple and fun
activities for the entire family. You can go to one of the many resorts that offer
facilities for this activity or find your own hill that you can enjoy all to yourself. For a
truly unique wintertime experience guests may charter an old-fashioned sleigh and
take a ride through the snow-covered mountain landscape to the sound of jingling
bells. After all the adventuring (or if you are not the adventuring type), enjoy a cup of
hot chocolate or a mug of mulled cider, the warmth of an open fireplace, and hours of
conversation at one of the many hotels or local eateries.
Spring and Fall offer many of the same activities with the exception of
beautiful scenery and changing colors in the Fall. Go for a hike on one of the many
marked trails of wide-ranging difficulty levels. Take a bike ride along the lake or if
you are feeling very adventurous, go downhill biking at one of the nearby ski resorts.
Take a boat ride to Emerald Bay on the MS Dixie II, the 500-passenger award
winning paddle wheeler and the largest cruising vessel in South Lake Tahoe.
10
The Summer months see by far the highest number of visitors compared to
any other season. All the same activities of the Spring and Fall months can still be
enjoyed as well as additional lake activities available because of warmer weather.
South Lake Tahoe has some beautiful sandy beaches that are perfect for just relaxing
with a good book or playing with the family on the beach or in the water. Rent a
kayak or a paddle board for a relaxing cruise on the lake or a ski boat or jet ski for a
bit more speed. Go scuba diving at Emerald Bay Underwater State Park.
SWOT Analysis
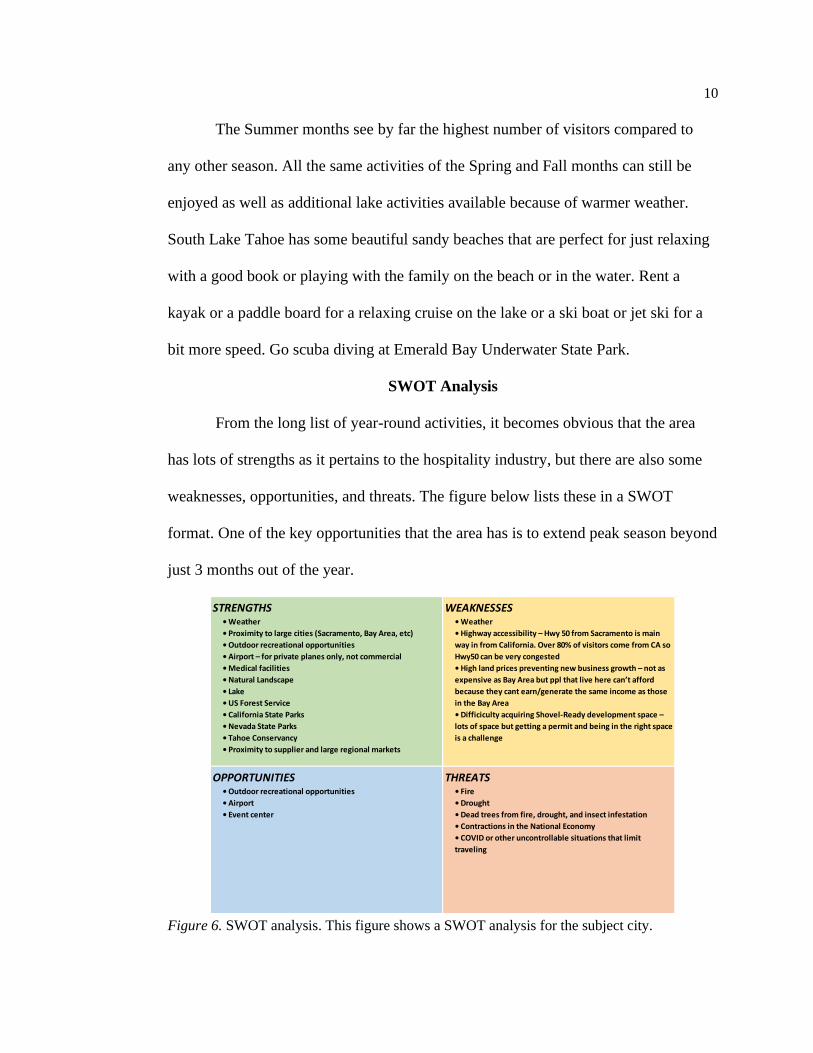
From the long list of year-round activities, it becomes obvious that the area
has lots of strengths as it pertains to the hospitality industry, but there are also some
weaknesses, opportunities, and threats. The figure below lists these in a SWOT
format. One of the key opportunities that the area has is to extend peak season beyond
just 3 months out of the year.
Figure 6. SWOT analysis. This figure shows a SWOT analysis for the subject city.
STRENGTHS WEAKNESSES• Weather
• Proximity to large cities (Sacramento, Bay Area, etc)
• Outdoor recreational opportunities
• Airport – for private planes only, not commercial
• Medical facilities
• Natural Landscape
• Lake
• US Forest Service
• California State Parks
• Nevada State Parks
• Tahoe Conservancy
• Proximity to supplier and large regional markets
• Weather
• Highway accessibility – Hwy 50 from Sacramento is main
way in from California. Over 80% of visitors come from CA so
Hwy50 can be very congested
• High land prices preventing new business growth – not as
expensive as Bay Area but ppl that live here can’t afford
because they cant earn/generate the same income as those
in the Bay Area
• Difficiculty acquiring Shovel-Ready development space –
lots of space but getting a permit and being in the right space
is a challenge
OPPORTUNITIES THREATS• Outdoor recreational opportunities
• Airport
• Event center
• Fire
• Drought
• Dead trees from fire, drought, and insect infestation
• Contractions in the National Economy
• COVID or other uncontrollable situations that limit
traveling
11
MARKET ANALYSIS
Competition
Since the economy of South Lake Tahoe is almost exclusively tourism, there
is plenty of competition to be found for the hotel industry within the city limits.
Between hotels, Airbnbs, VRBOs (vacation rental by owner), and others, there is no
shortage of options for tourists looking for a place to stay.
According to South Lake Tahoe Transient Occupancy Tax (TOT) data there
are 115 different lodging options inside the city limits. These combined lodging
options bring the grand total of available rooms to 5,793 with an average occupancy
percentage of 53.5%. However, for a like comparison, the author has selected a group
of hotels that will be primary competitors based on factors such as location within the
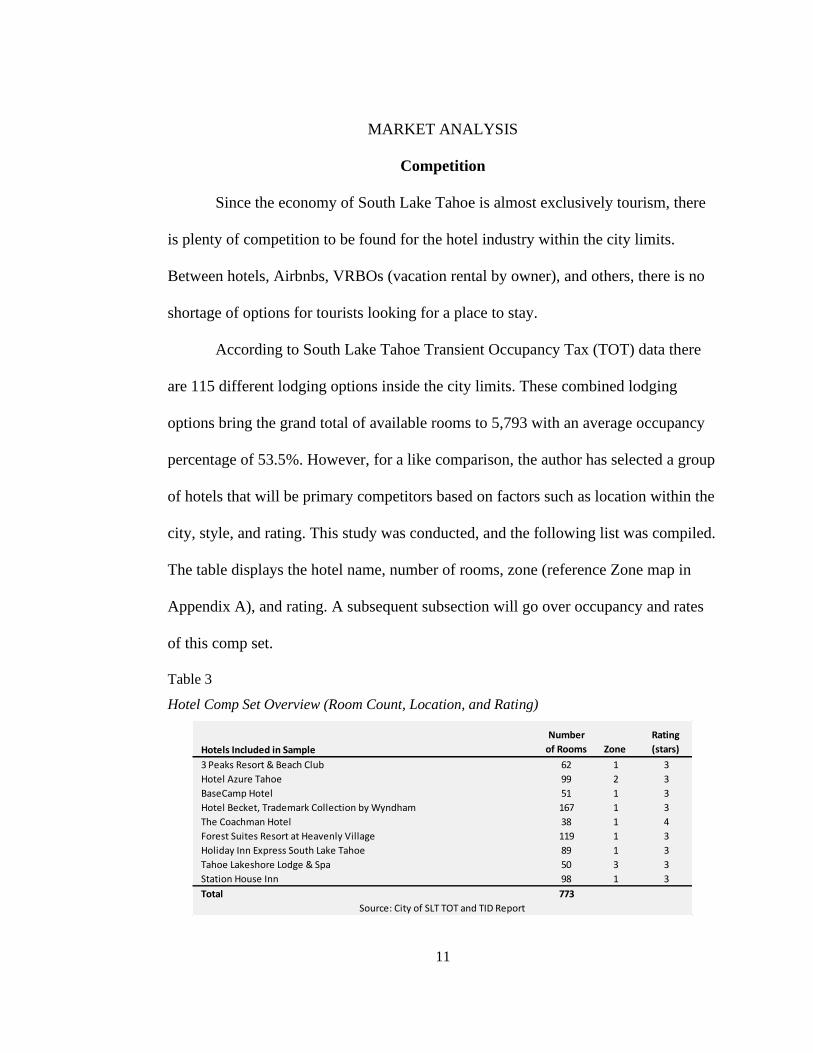
city, style, and rating. This study was conducted, and the following list was compiled.
The table displays the hotel name, number of rooms, zone (reference Zone map in
Appendix A), and rating. A subsequent subsection will go over occupancy and rates
of this comp set.
Table 3
Hotel Comp Set Overview (Room Count, Location, and Rating)
Hotels Included in Sample
Number
of Rooms Zone
Rating
(stars)
3 Peaks Resort & Beach Club 62 1 3
Hotel Azure Tahoe 99 2 3
BaseCamp Hotel 51 1 3
Hotel Becket, Trademark Collection by Wyndham 167 1 3
The Coachman Hotel 38 1 4
Forest Suites Resort at Heavenly Village 119 1 3
Holiday Inn Express South Lake Tahoe 89 1 3
Tahoe Lakeshore Lodge & Spa 50 3 3
Station House Inn 98 1 3
Total 773
Source: City of SLT TOT and TID Report
12
A comp set is an important set of data for a hotel to use to compare against
similar, nearby competing hotels. The selection criteria for this comp set includes but
is not necessarily limited to the following: scale and quality, geographical location
and accessibility, and leisure facilities. One of the primary selection criteria is the
style and feel of the hotel. All of these, with the exception of the Holiday Inn Express,
are boutique hotels which sets them uniquely apart from traditional hotels. This type
of hotel is furnished in a central theme and offers unique character, a personalized
touch, and value-added service that meet customers’ lifestyles (Ahmad, Hemdi, &
Othman, 2017). Lim and Endean (2009) describe the boutique hotel as “the
combination of service quality characteristics, individual design, location, and
facilities.” From a different perspective, Teo and Chang (2009) consider that central
to the concept of the boutique hotel “is the importance of the touristic experience of
place histories and cultural identities.” According to Van Hartesvelt (2006), the
defining characteristics of boutique hotels are that they typically range from 20–150
rooms, are at least four stars, have a successful restaurant on the premises, are
exclusive, and are typically “housed in older, unique structures that have been
converted from another use”. The conclusion of the overview of Aggett (2007) of
international definitions of boutique hotels was that “boutique hotels are
contemporary design-led hotels with up to 100 bedrooms, which offer unique levels
of personalized service and high-tech facilities.”
13
Target Market
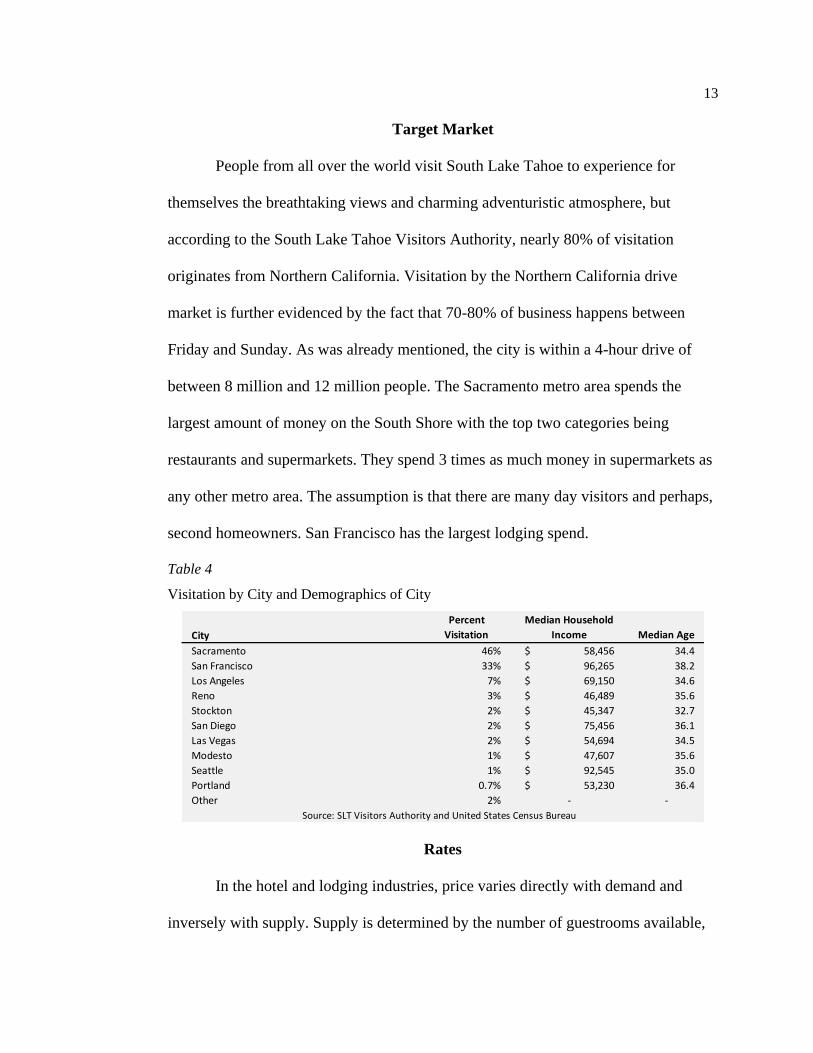
People from all over the world visit South Lake Tahoe to experience for
themselves the breathtaking views and charming adventuristic atmosphere, but
according to the South Lake Tahoe Visitors Authority, nearly 80% of visitation
originates from Northern California. Visitation by the Northern California drive
market is further evidenced by the fact that 70-80% of business happens between
Friday and Sunday. As was already mentioned, the city is within a 4-hour drive of
between 8 million and 12 million people. The Sacramento metro area spends the
largest amount of money on the South Shore with the top two categories being
restaurants and supermarkets. They spend 3 times as much money in supermarkets as
any other metro area. The assumption is that there are many day visitors and perhaps,
second homeowners. San Francisco has the largest lodging spend.
Table 4
Visitation by City and Demographics of City
Rates
In the hotel and lodging industries, price varies directly with demand and
inversely with supply. Supply is determined by the number of guestrooms available,
City
Percent
Visitation
Median Household
Income Median Age
Sacramento 46% 58,456$ 34.4
San Francisco 33% 96,265$ 38.2
Los Angeles 7% 69,150$ 34.6
Reno 3% 46,489$ 35.6
Stockton 2% 45,347$ 32.7
San Diego 2% 75,456$ 36.1
Las Vegas 2% 54,694$ 34.5
Modesto 1% 47,607$ 35.6
Seattle 1% 92,545$ 35.0
Portland 0.7% 53,230$ 36.4
Other 2% - -
Source: SLT Visitors Authority and United States Census Bureau
14
while demand is determined by the number of rooms occupied. Average daily rate
(ADR) is a metric used in the hotel industry to show how much revenue is made per
room on average. ADR is simply a ratio of the total room revenue earned divided by
the number of rooms rented.
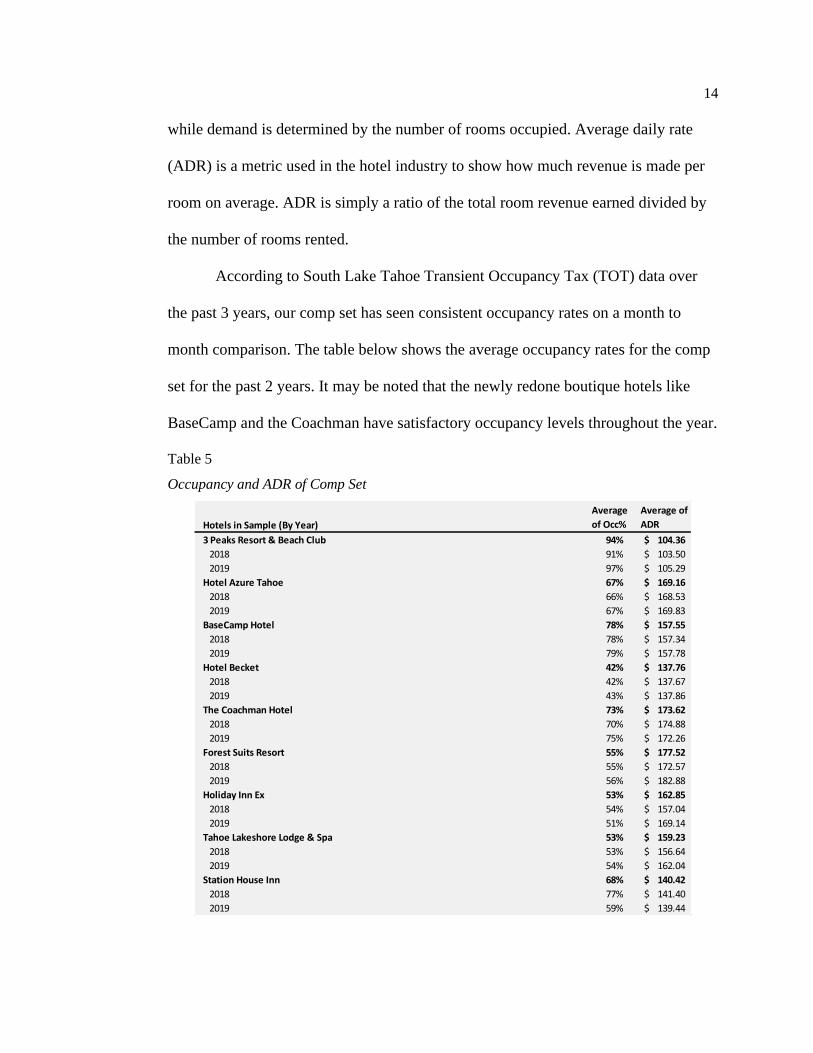
According to South Lake Tahoe Transient Occupancy Tax (TOT) data over
the past 3 years, our comp set has seen consistent occupancy rates on a month to
month comparison. The table below shows the average occupancy rates for the comp
set for the past 2 years. It may be noted that the newly redone boutique hotels like
BaseCamp and the Coachman have satisfactory occupancy levels throughout the year.
Table 5
Occupancy and ADR of Comp Set
Hotels in Sample (By Year)
Average
of Occ%
Average of
ADR
3 Peaks Resort & Beach Club 94% 104.36$
2018 91% 103.50$
2019 97% 105.29$
Hotel Azure Tahoe 67% 169.16$
2018 66% 168.53$
2019 67% 169.83$
BaseCamp Hotel 78% 157.55$
2018 78% 157.34$
2019 79% 157.78$
Hotel Becket 42% 137.76$
2018 42% 137.67$
2019 43% 137.86$
The Coachman Hotel 73% 173.62$
2018 70% 174.88$
2019 75% 172.26$
Forest Suits Resort 55% 177.52$
2018 55% 172.57$
2019 56% 182.88$
Holiday Inn Ex 53% 162.85$
2018 54% 157.04$
2019 51% 169.14$
Tahoe Lakeshore Lodge & Spa 53% 159.23$
2018 53% 156.64$
2019 54% 162.04$
Station House Inn 68% 140.42$
2018 77% 141.40$
2019 59% 139.44$
15
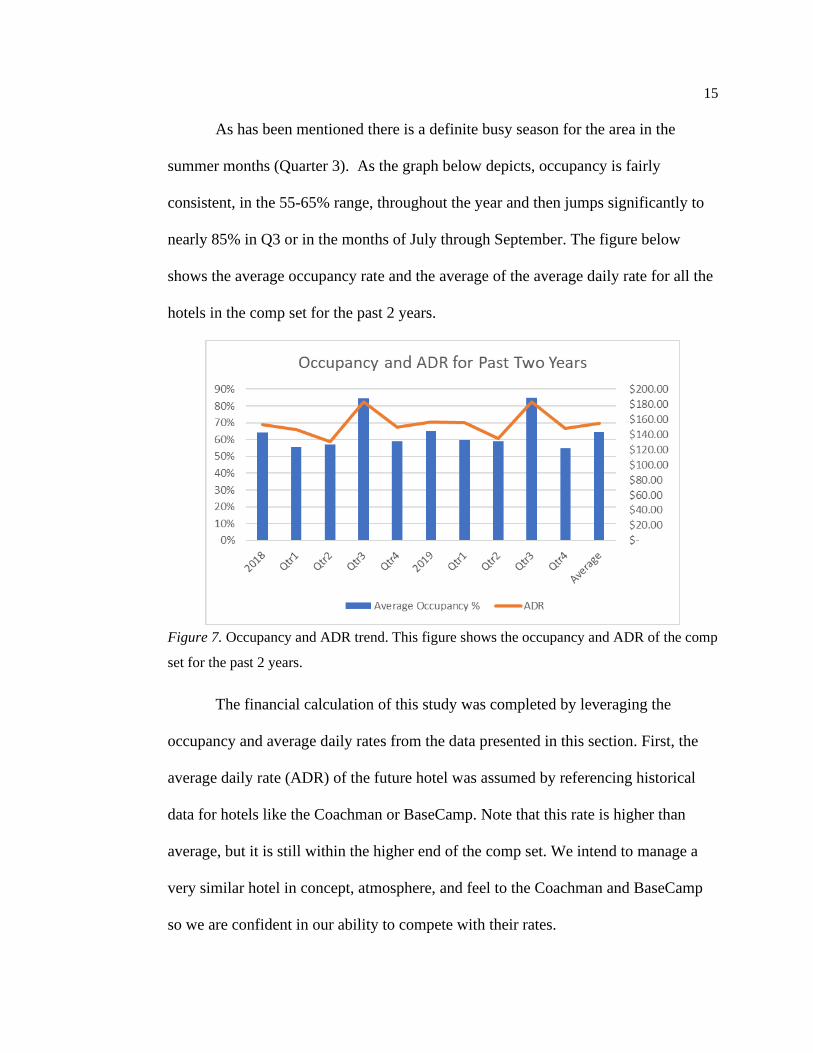
As has been mentioned there is a definite busy season for the area in the
summer months (Quarter 3). As the graph below depicts, occupancy is fairly
consistent, in the 55-65% range, throughout the year and then jumps significantly to
nearly 85% in Q3 or in the months of July through September. The figure below
shows the average occupancy rate and the average of the average daily rate for all the
hotels in the comp set for the past 2 years.
Figure 7. Occupancy and ADR trend. This figure shows the occupancy and ADR of the comp
set for the past 2 years.
The financial calculation of this study was completed by leveraging the
occupancy and average daily rates from the data presented in this section. First, the
average daily rate (ADR) of the future hotel was assumed by referencing historical
data for hotels like the Coachman or BaseCamp. Note that this rate is higher than
average, but it is still within the higher end of the comp set. We intend to manage a
very similar hotel in concept, atmosphere, and feel to the Coachman and BaseCamp
so we are confident in our ability to compete with their rates.
16
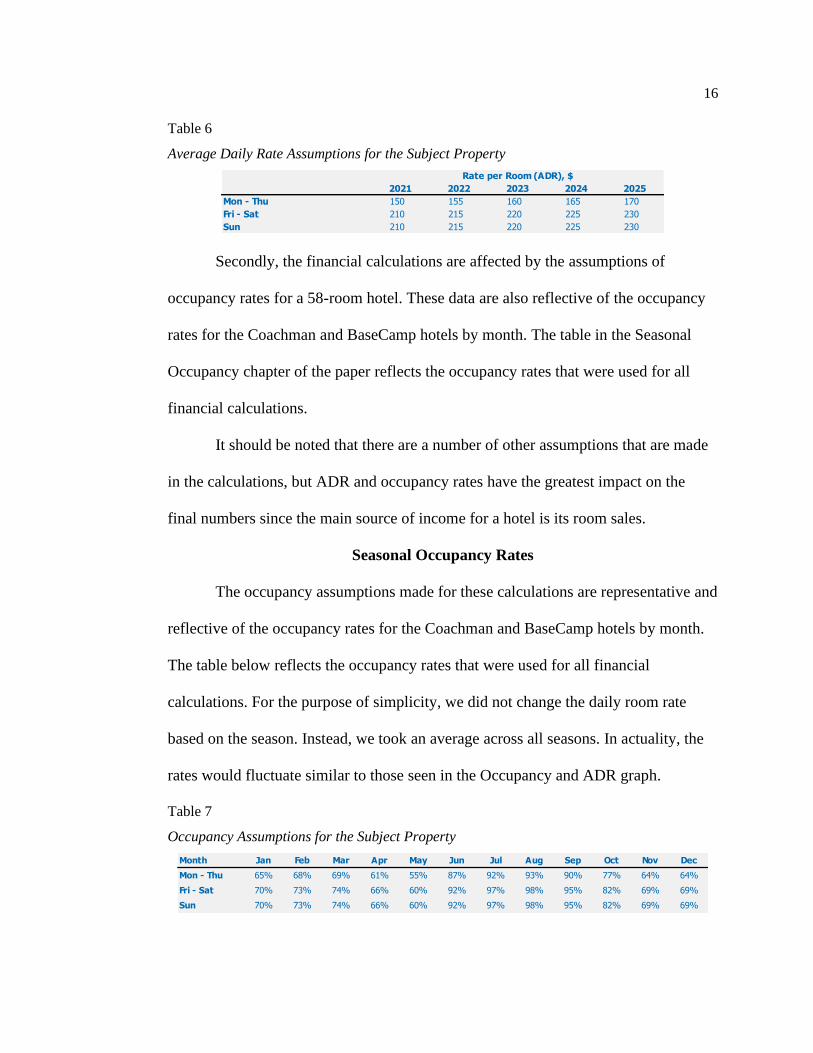
Table 6
Average Daily Rate Assumptions for the Subject Property
Secondly, the financial calculations are affected by the assumptions of
occupancy rates for a 58-room hotel. These data are also reflective of the occupancy
rates for the Coachman and BaseCamp hotels by month. The table in the Seasonal
Occupancy chapter of the paper reflects the occupancy rates that were used for all
financial calculations.
It should be noted that there are a number of other assumptions that are made
in the calculations, but ADR and occupancy rates have the greatest impact on the
final numbers since the main source of income for a hotel is its room sales.
Seasonal Occupancy Rates
The occupancy assumptions made for these calculations are representative and
reflective of the occupancy rates for the Coachman and BaseCamp hotels by month.
The table below reflects the occupancy rates that were used for all financial
calculations. For the purpose of simplicity, we did not change the daily room rate
based on the season. Instead, we took an average across all seasons. In actuality, the
rates would fluctuate similar to those seen in the Occupancy and ADR graph.
Table 7
Occupancy Assumptions for the Subject Property
2021 2022 2023 2024 2025
Mon - Thu 150 155 160 165 170
Fri - Sat 210 215 220 225 230
Sun 210 215 220 225 230
Rate per Room (ADR), $
Month Jan Feb Mar Apr May Jun Jul Aug Sep Oct Nov Dec
Mon - Thu 65% 68% 69% 61% 55% 87% 92% 93% 90% 77% 64% 64%
Fri - Sat 70% 73% 74% 66% 60% 92% 97% 98% 95% 82% 69% 69%
Sun 70% 73% 74% 66% 60% 92% 97% 98% 95% 82% 69% 69%
17
PRO FORMA FINANCIALS
Balance Sheet
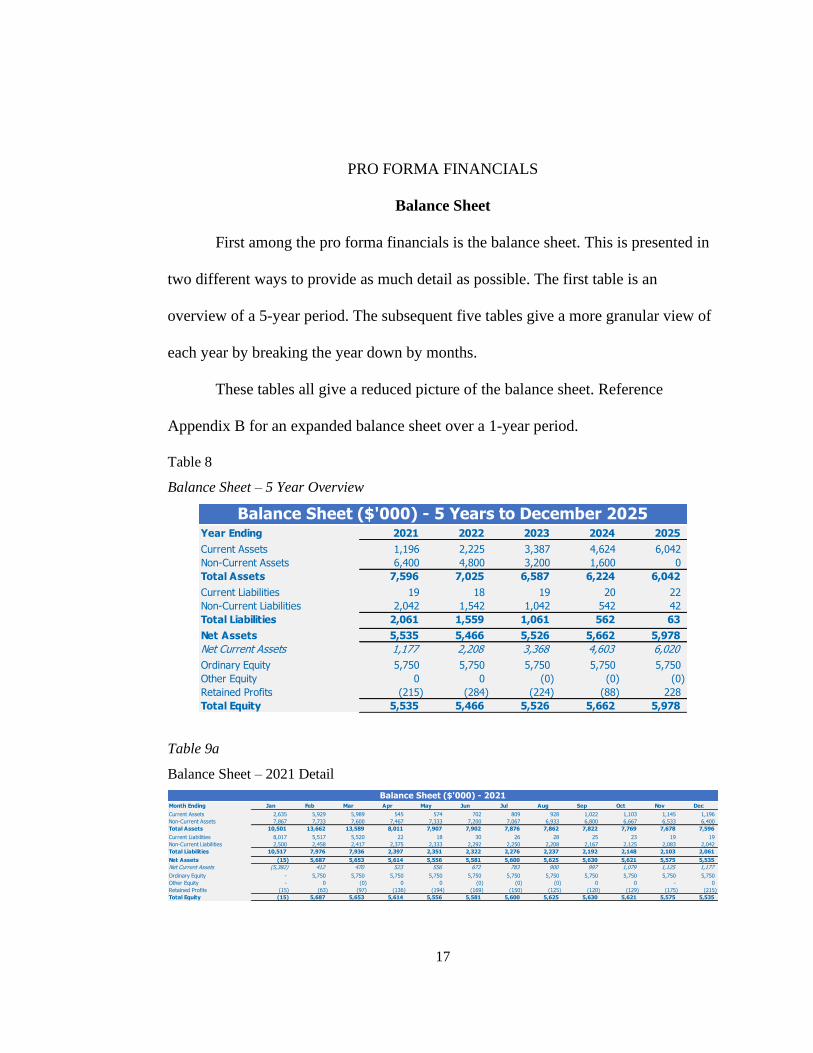
First among the pro forma financials is the balance sheet. This is presented in
two different ways to provide as much detail as possible. The first table is an
overview of a 5-year period. The subsequent five tables give a more granular view of
each year by breaking the year down by months.
These tables all give a reduced picture of the balance sheet. Reference
Appendix B for an expanded balance sheet over a 1-year period.
Table 8
Balance Sheet – 5 Year Overview
Table 9a
Balance Sheet – 2021 Detail
Year Ending 2021 2022 2023 2024 2025
Current Assets 1,196 2,225 3,387 4,624 6,042
Non-Current Assets 6,400 4,800 3,200 1,600 0
Total Assets 7,596 7,025 6,587 6,224 6,042
Current Liabilities 19 18 19 20 22
Non-Current Liabilities 2,042 1,542 1,042 542 42
Total Liabilities 2,061 1,559 1,061 562 63
Net Assets 5,535 5,466 5,526 5,662 5,978
Net Current Assets 1,177 2,208 3,368 4,603 6,020
Ordinary Equity 5,750 5,750 5,750 5,750 5,750
Other Equity 0 0 (0) (0) (0)
Retained Profits (215) (284) (224) (88) 228
Total Equity 5,535 5,466 5,526 5,662 5,978
Balance Sheet ($'000) - 5 Years to December 2025
Month Ending Jan Feb Mar Apr May Jun Jul Aug Sep Oct Nov Dec
Current Assets 2,635 5,929 5,989 545 574 702 809 928 1,022 1,103 1,145 1,196
Non-Current Assets 7,867 7,733 7,600 7,467 7,333 7,200 7,067 6,933 6,800 6,667 6,533 6,400
Total Assets 10,501 13,662 13,589 8,011 7,907 7,902 7,876 7,862 7,822 7,769 7,678 7,596
Current Liabilities 8,017 5,517 5,520 22 18 30 26 28 25 23 19 19
Non-Current Liabilities 2,500 2,458 2,417 2,375 2,333 2,292 2,250 2,208 2,167 2,125 2,083 2,042
Total Liabilities 10,517 7,976 7,936 2,397 2,351 2,322 2,276 2,237 2,192 2,148 2,103 2,061
Net Assets (15) 5,687 5,653 5,614 5,556 5,581 5,600 5,625 5,630 5,621 5,575 5,535
Net Current Assets (5,382) 412 470 523 556 672 783 900 997 1,079 1,125 1,177
Ordinary Equity - 5,750 5,750 5,750 5,750 5,750 5,750 5,750 5,750 5,750 5,750 5,750
Other Equity - 0 (0) 0 0 (0) (0) (0) 0 0 - 0
Retained Profits (15) (63) (97) (136) (194) (169) (150) (125) (120) (129) (175) (215)
Total Equity (15) 5,687 5,653 5,614 5,556 5,581 5,600 5,625 5,630 5,621 5,575 5,535
Balance Sheet ($'000) - 2021
18
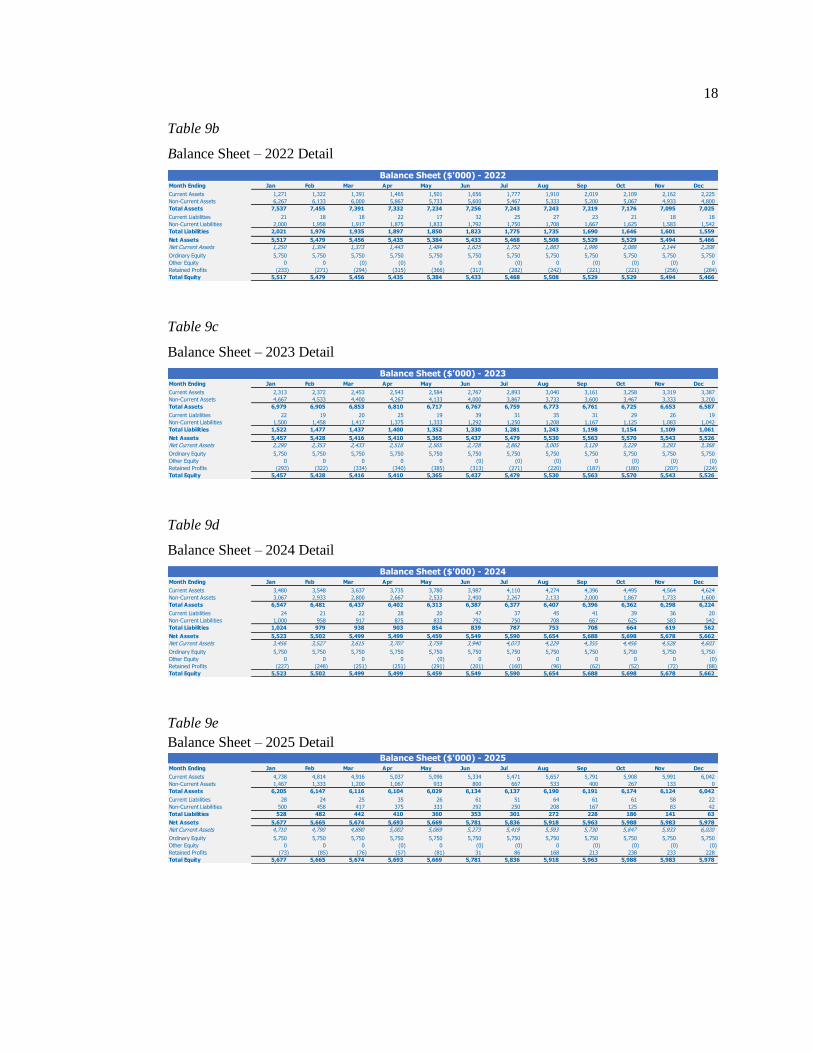
Table 9b
Balance Sheet – 2022 Detail
Table 9c
Balance Sheet – 2023 Detail
Table 9d
Balance Sheet – 2024 Detail
Table 9e
Balance Sheet – 2025 Detail
Month Ending Jan Feb Mar Apr May Jun Jul Aug Sep Oct Nov Dec
Current Assets 1,271 1,322 1,391 1,465 1,501 1,656 1,777 1,910 2,019 2,109 2,162 2,225
Non-Current Assets 6,267 6,133 6,000 5,867 5,733 5,600 5,467 5,333 5,200 5,067 4,933 4,800
Total Assets 7,537 7,455 7,391 7,332 7,234 7,256 7,243 7,243 7,219 7,176 7,095 7,025
Current Liabilities 21 18 18 22 17 32 25 27 23 21 18 18
Non-Current Liabilities 2,000 1,958 1,917 1,875 1,833 1,792 1,750 1,708 1,667 1,625 1,583 1,542
Total Liabilities 2,021 1,976 1,935 1,897 1,850 1,823 1,775 1,735 1,690 1,646 1,601 1,559
Net Assets 5,517 5,479 5,456 5,435 5,384 5,433 5,468 5,508 5,529 5,529 5,494 5,466
Net Current Assets 1,250 1,304 1,373 1,443 1,484 1,625 1,752 1,883 1,996 2,088 2,144 2,208
Ordinary Equity 5,750 5,750 5,750 5,750 5,750 5,750 5,750 5,750 5,750 5,750 5,750 5,750
Other Equity 0 0 (0) (0) 0 0 (0) 0 (0) (0) (0) 0
Retained Profits (233) (271) (294) (315) (366) (317) (282) (242) (221) (221) (256) (284)
Total Equity 5,517 5,479 5,456 5,435 5,384 5,433 5,468 5,508 5,529 5,529 5,494 5,466
Balance Sheet ($'000) - 2022
Month Ending Jan Feb Mar Apr May Jun Jul Aug Sep Oct Nov Dec
Current Assets 2,313 2,372 2,453 2,543 2,584 2,767 2,893 3,040 3,161 3,258 3,319 3,387
Non-Current Assets 4,667 4,533 4,400 4,267 4,133 4,000 3,867 3,733 3,600 3,467 3,333 3,200
Total Assets 6,979 6,905 6,853 6,810 6,717 6,767 6,759 6,773 6,761 6,725 6,653 6,587
Current Liabilities 22 19 20 25 19 39 31 35 31 29 26 19
Non-Current Liabilities 1,500 1,458 1,417 1,375 1,333 1,292 1,250 1,208 1,167 1,125 1,083 1,042
Total Liabilities 1,522 1,477 1,437 1,400 1,352 1,330 1,281 1,243 1,198 1,154 1,109 1,061
Net Assets 5,457 5,428 5,416 5,410 5,365 5,437 5,479 5,530 5,563 5,570 5,543 5,526
Net Current Assets 2,290 2,353 2,433 2,518 2,565 2,728 2,862 3,005 3,129 3,229 3,293 3,368
Ordinary Equity 5,750 5,750 5,750 5,750 5,750 5,750 5,750 5,750 5,750 5,750 5,750 5,750
Other Equity 0 0 0 0 0 (0) (0) (0) 0 (0) (0) (0)
Retained Profits (293) (322) (334) (340) (385) (313) (271) (220) (187) (180) (207) (224)
Total Equity 5,457 5,428 5,416 5,410 5,365 5,437 5,479 5,530 5,563 5,570 5,543 5,526
Balance Sheet ($'000) - 2023
Month Ending Jan Feb Mar Apr May Jun Jul Aug Sep Oct Nov Dec
Current Assets 3,480 3,548 3,637 3,735 3,780 3,987 4,110 4,274 4,396 4,495 4,564 4,624
Non-Current Assets 3,067 2,933 2,800 2,667 2,533 2,400 2,267 2,133 2,000 1,867 1,733 1,600
Total Assets 6,547 6,481 6,437 6,402 6,313 6,387 6,377 6,407 6,396 6,362 6,298 6,224
Current Liabilities 24 21 22 28 20 47 37 45 41 39 36 20
Non-Current Liabilities 1,000 958 917 875 833 792 750 708 667 625 583 542
Total Liabilities 1,024 979 938 903 854 839 787 753 708 664 619 562
Net Assets 5,523 5,502 5,499 5,499 5,459 5,549 5,590 5,654 5,688 5,698 5,678 5,662
Net Current Assets 3,456 3,527 3,615 3,707 3,759 3,940 4,073 4,229 4,355 4,456 4,528 4,603
Ordinary Equity 5,750 5,750 5,750 5,750 5,750 5,750 5,750 5,750 5,750 5,750 5,750 5,750
Other Equity 0 0 0 0 (0) 0 0 0 0 0 0 (0)
Retained Profits (227) (248) (251) (251) (291) (201) (160) (96) (62) (52) (72) (88)
Total Equity 5,523 5,502 5,499 5,499 5,459 5,549 5,590 5,654 5,688 5,698 5,678 5,662
Balance Sheet ($'000) - 2024
Month Ending Jan Feb Mar Apr May Jun Jul Aug Sep Oct Nov Dec
Current Assets 4,738 4,814 4,916 5,037 5,096 5,334 5,471 5,657 5,791 5,908 5,991 6,042
Non-Current Assets 1,467 1,333 1,200 1,067 933 800 667 533 400 267 133 0
Total Assets 6,205 6,147 6,116 6,104 6,029 6,134 6,137 6,190 6,191 6,174 6,124 6,042
Current Liabilities 28 24 25 35 26 61 51 64 61 61 58 22
Non-Current Liabilities 500 458 417 375 333 292 250 208 167 125 83 42
Total Liabilities 528 482 442 410 360 353 301 272 228 186 141 63
Net Assets 5,677 5,665 5,674 5,693 5,669 5,781 5,836 5,918 5,963 5,988 5,983 5,978
Net Current Assets 4,710 4,790 4,890 5,002 5,069 5,273 5,419 5,593 5,730 5,847 5,933 6,020
Ordinary Equity 5,750 5,750 5,750 5,750 5,750 5,750 5,750 5,750 5,750 5,750 5,750 5,750
Other Equity 0 0 0 (0) 0 (0) (0) 0 (0) (0) (0) (0)
Retained Profits (73) (85) (76) (57) (81) 31 86 168 213 238 233 228
Total Equity 5,677 5,665 5,674 5,693 5,669 5,781 5,836 5,918 5,963 5,988 5,983 5,978
Balance Sheet ($'000) - 2025
19
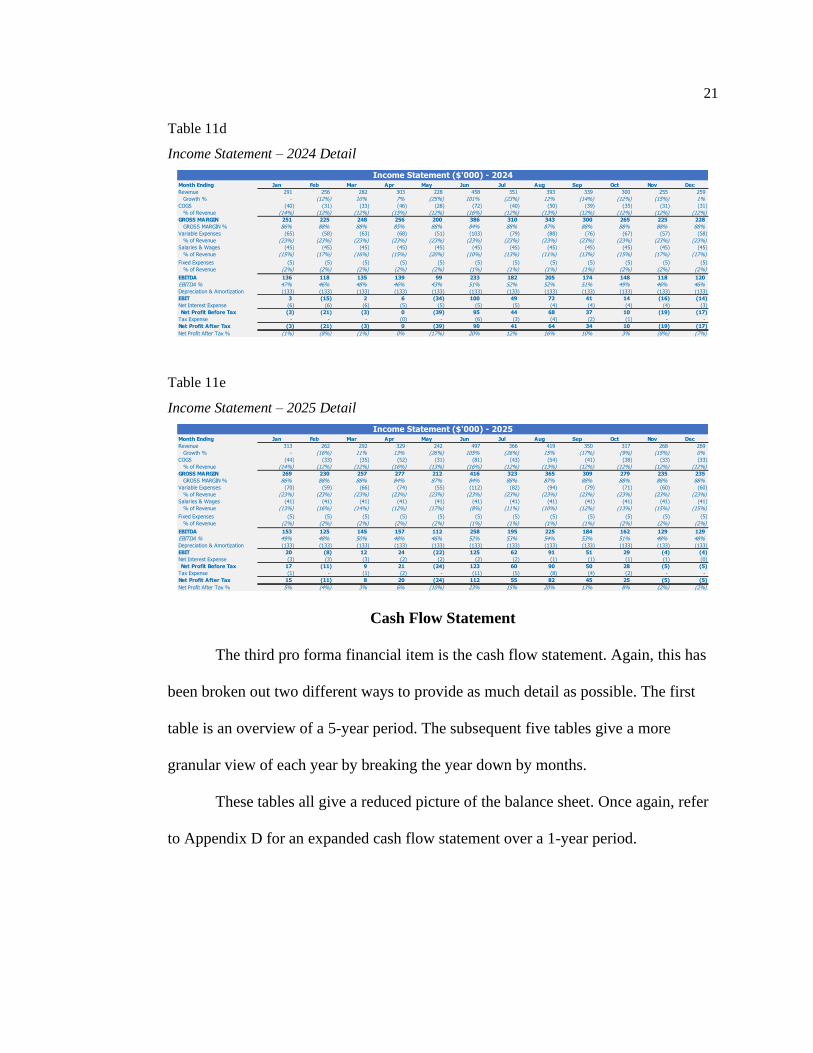
Income Statement
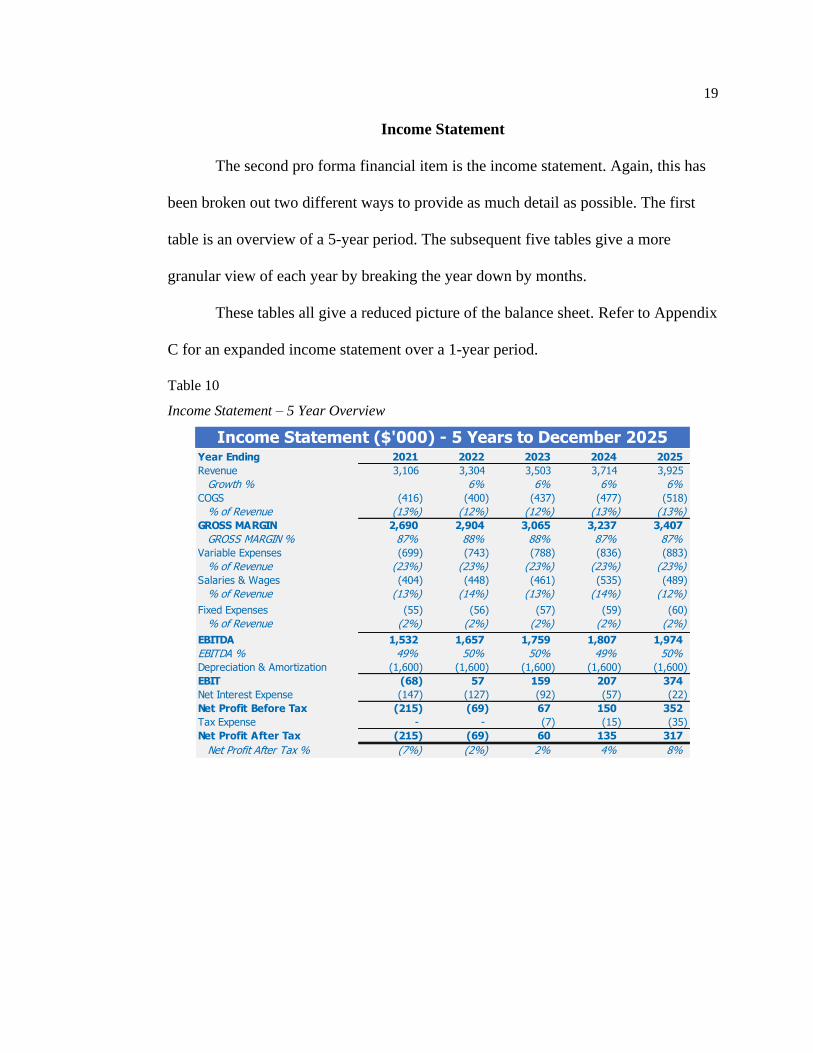
The second pro forma financial item is the income statement. Again, this has
been broken out two different ways to provide as much detail as possible. The first
table is an overview of a 5-year period. The subsequent five tables give a more
granular view of each year by breaking the year down by months.
These tables all give a reduced picture of the balance sheet. Refer to Appendix
C for an expanded income statement over a 1-year period.
Table 10
Income Statement – 5 Year Overview
Year Ending 2021 2022 2023 2024 2025
Revenue 3,106 3,304 3,503 3,714 3,925
Growth % 6% 6% 6% 6%
COGS (416) (400) (437) (477) (518)
% of Revenue (13%) (12%) (12%) (13%) (13%)
GROSS MARGIN 2,690 2,904 3,065 3,237 3,407
GROSS MARGIN % 87% 88% 88% 87% 87%
Variable Expenses (699) (743) (788) (836) (883)
% of Revenue (23%) (23%) (23%) (23%) (23%)
Salaries & Wages (404) (448) (461) (535) (489)
% of Revenue (13%) (14%) (13%) (14%) (12%)
Fixed Expenses (55) (56) (57) (59) (60)
% of Revenue (2%) (2%) (2%) (2%) (2%)
EBITDA 1,532 1,657 1,759 1,807 1,974
EBITDA % 49% 50% 50% 49% 50%
Depreciation & Amortization (1,600) (1,600) (1,600) (1,600) (1,600)
EBIT (68) 57 159 207 374
Net Interest Expense (147) (127) (92) (57) (22)
Net Profit Before Tax (215) (69) 67 150 352
Tax Expense - - (7) (15) (35)
Net Profit After Tax (215) (69) 60 135 317
Net Profit After Tax % (7%) (2%) 2% 4% 8%
Income Statement ($'000) - 5 Years to December 2025
20
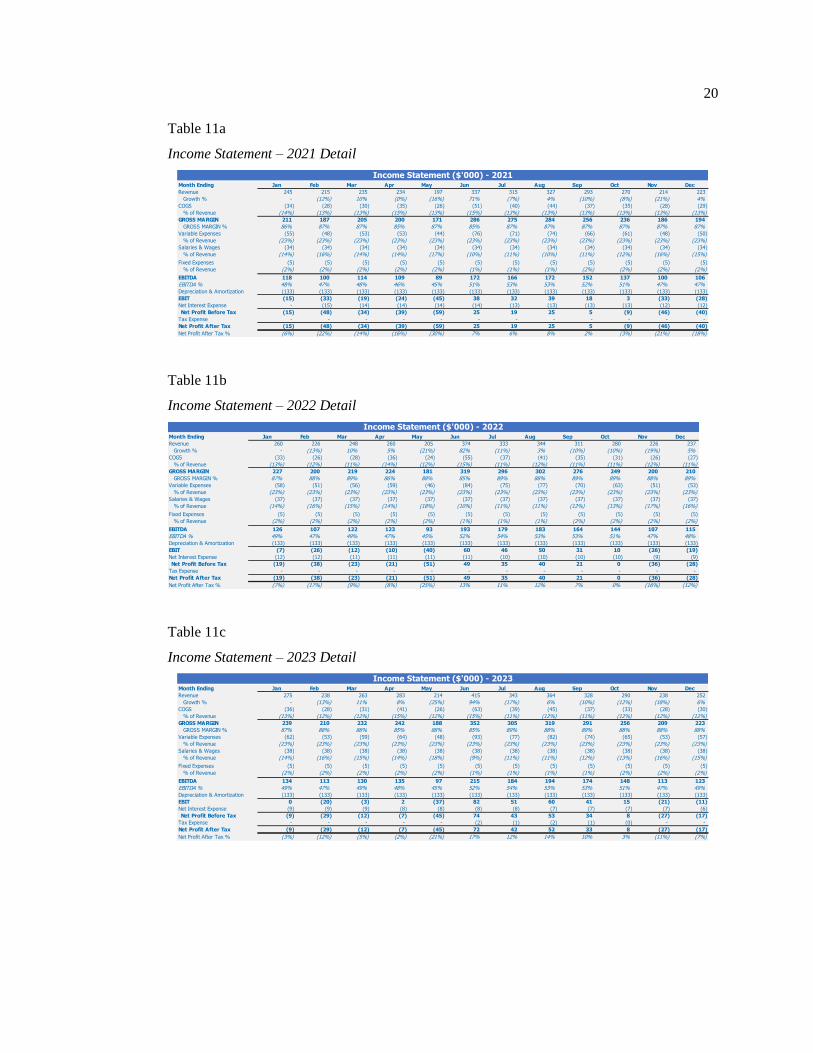
Table 11a
Income Statement – 2021 Detail
Table 11b
Income Statement – 2022 Detail
Table 11c
Income Statement – 2023 Detail
Month Ending Jan Feb Mar Apr May Jun Jul Aug Sep Oct Nov Dec
Revenue 245 215 235 234 197 337 315 327 293 270 214 223
Growth % - (12%) 10% (0%) (16%) 71% (7%) 4% (10%) (8%) (21%) 4%
COGS (34) (28) (30) (35) (26) (51) (40) (44) (37) (35) (28) (29)
% of Revenue (14%) (13%) (13%) (15%) (13%) (15%) (13%) (13%) (13%) (13%) (13%) (13%)
GROSS MARGIN 211 187 205 200 171 286 275 284 256 236 186 194
GROSS MARGIN % 86% 87% 87% 85% 87% 85% 87% 87% 87% 87% 87% 87%
Variable Expenses (55) (48) (53) (53) (44) (76) (71) (74) (66) (61) (48) (50)
% of Revenue (23%) (23%) (23%) (23%) (23%) (23%) (23%) (23%) (23%) (23%) (23%) (23%)
Salaries & Wages (34) (34) (34) (34) (34) (34) (34) (34) (34) (34) (34) (34)
% of Revenue (14%) (16%) (14%) (14%) (17%) (10%) (11%) (10%) (11%) (12%) (16%) (15%)
Fixed Expenses (5) (5) (5) (5) (5) (5) (5) (5) (5) (5) (5) (5)
% of Revenue (2%) (2%) (2%) (2%) (2%) (1%) (1%) (1%) (2%) (2%) (2%) (2%)
EBITDA 118 100 114 109 89 172 166 172 152 137 100 106
EBITDA % 48% 47% 48% 46% 45% 51% 53% 53% 52% 51% 47% 47%
Depreciation & Amortization (133) (133) (133) (133) (133) (133) (133) (133) (133) (133) (133) (133)
EBIT (15) (33) (19) (24) (45) 38 32 39 18 3 (33) (28)
Net Interest Expense - (15) (14) (14) (14) (14) (13) (13) (13) (13) (12) (12)
Net Profit Before Tax (15) (48) (34) (39) (59) 25 19 25 5 (9) (46) (40)
Tax Expense - - - - - - - - - - - -
Net Profit After Tax (15) (48) (34) (39) (59) 25 19 25 5 (9) (46) (40)
Net Profit After Tax % (6%) (22%) (14%) (16%) (30%) 7% 6% 8% 2% (3%) (21%) (18%)
Income Statement ($'000) - 2021
Month Ending Jan Feb Mar Apr May Jun Jul Aug Sep Oct Nov Dec
Revenue 260 226 248 260 205 374 333 344 311 280 226 237
Growth % - (13%) 10% 5% (21%) 82% (11%) 3% (10%) (10%) (19%) 5%
COGS (33) (26) (28) (36) (24) (55) (37) (41) (35) (31) (26) (27)
% of Revenue (13%) (12%) (11%) (14%) (12%) (15%) (11%) (12%) (11%) (11%) (12%) (11%)
GROSS MARGIN 227 200 219 224 181 319 296 302 276 249 200 210
GROSS MARGIN % 87% 88% 89% 86% 88% 85% 89% 88% 89% 89% 88% 89%
Variable Expenses (58) (51) (56) (59) (46) (84) (75) (77) (70) (63) (51) (53)
% of Revenue (23%) (23%) (23%) (23%) (23%) (23%) (23%) (23%) (23%) (23%) (23%) (23%)
Salaries & Wages (37) (37) (37) (37) (37) (37) (37) (37) (37) (37) (37) (37)
% of Revenue (14%) (16%) (15%) (14%) (18%) (10%) (11%) (11%) (12%) (13%) (17%) (16%)
Fixed Expenses (5) (5) (5) (5) (5) (5) (5) (5) (5) (5) (5) (5)
% of Revenue (2%) (2%) (2%) (2%) (2%) (1%) (1%) (1%) (2%) (2%) (2%) (2%)
EBITDA 126 107 122 123 93 193 179 183 164 144 107 115
EBITDA % 49% 47% 49% 47% 45% 52% 54% 53% 53% 51% 47% 48%
Depreciation & Amortization (133) (133) (133) (133) (133) (133) (133) (133) (133) (133) (133) (133)
EBIT (7) (26) (12) (10) (40) 60 46 50 31 10 (26) (19)
Net Interest Expense (12) (12) (11) (11) (11) (11) (10) (10) (10) (10) (9) (9)
Net Profit Before Tax (19) (38) (23) (21) (51) 49 35 40 21 0 (36) (28)
Tax Expense - - - - - - - - - - - -
Net Profit After Tax (19) (38) (23) (21) (51) 49 35 40 21 0 (36) (28)
Net Profit After Tax % (7%) (17%) (9%) (8%) (25%) 13% 11% 12% 7% 0% (16%) (12%)
Income Statement ($'000) - 2022
Month Ending Jan Feb Mar Apr May Jun Jul Aug Sep Oct Nov Dec
Revenue 275 238 263 283 214 415 343 364 328 290 238 252
Growth % - (13%) 11% 8% (25%) 94% (17%) 6% (10%) (12%) (18%) 6%
COGS (36) (28) (31) (41) (26) (63) (39) (45) (37) (33) (28) (30)
% of Revenue (13%) (12%) (12%) (15%) (12%) (15%) (11%) (12%) (11%) (12%) (12%) (12%)
GROSS MARGIN 239 210 232 242 188 352 305 319 291 256 209 223
GROSS MARGIN % 87% 88% 88% 85% 88% 85% 89% 88% 89% 88% 88% 88%
Variable Expenses (62) (53) (59) (64) (48) (93) (77) (82) (74) (65) (53) (57)
% of Revenue (23%) (23%) (23%) (23%) (23%) (23%) (23%) (23%) (23%) (23%) (23%) (23%)
Salaries & Wages (38) (38) (38) (38) (38) (38) (38) (38) (38) (38) (38) (38)
% of Revenue (14%) (16%) (15%) (14%) (18%) (9%) (11%) (11%) (12%) (13%) (16%) (15%)
Fixed Expenses (5) (5) (5) (5) (5) (5) (5) (5) (5) (5) (5) (5)
% of Revenue (2%) (2%) (2%) (2%) (2%) (1%) (1%) (1%) (1%) (2%) (2%) (2%)
EBITDA 134 113 130 135 97 215 184 194 174 148 113 123
EBITDA % 49% 47% 49% 48% 45% 52% 54% 53% 53% 51% 47% 49%
Depreciation & Amortization (133) (133) (133) (133) (133) (133) (133) (133) (133) (133) (133) (133)
EBIT 0 (20) (3) 2 (37) 82 51 60 41 15 (21) (11)
Net Interest Expense (9) (9) (9) (8) (8) (8) (8) (7) (7) (7) (7) (6)
Net Profit Before Tax (9) (29) (12) (7) (45) 74 43 53 34 8 (27) (17)
Tax Expense - - - - - (2) (1) (2) (1) (0) - -
Net Profit After Tax (9) (29) (12) (7) (45) 72 42 52 33 8 (27) (17)
Net Profit After Tax % (3%) (12%) (5%) (2%) (21%) 17% 12% 14% 10% 3% (11%) (7%)
Income Statement ($'000) - 2023
21
Table 11d
Income Statement – 2024 Detail
Table 11e
Income Statement – 2025 Detail
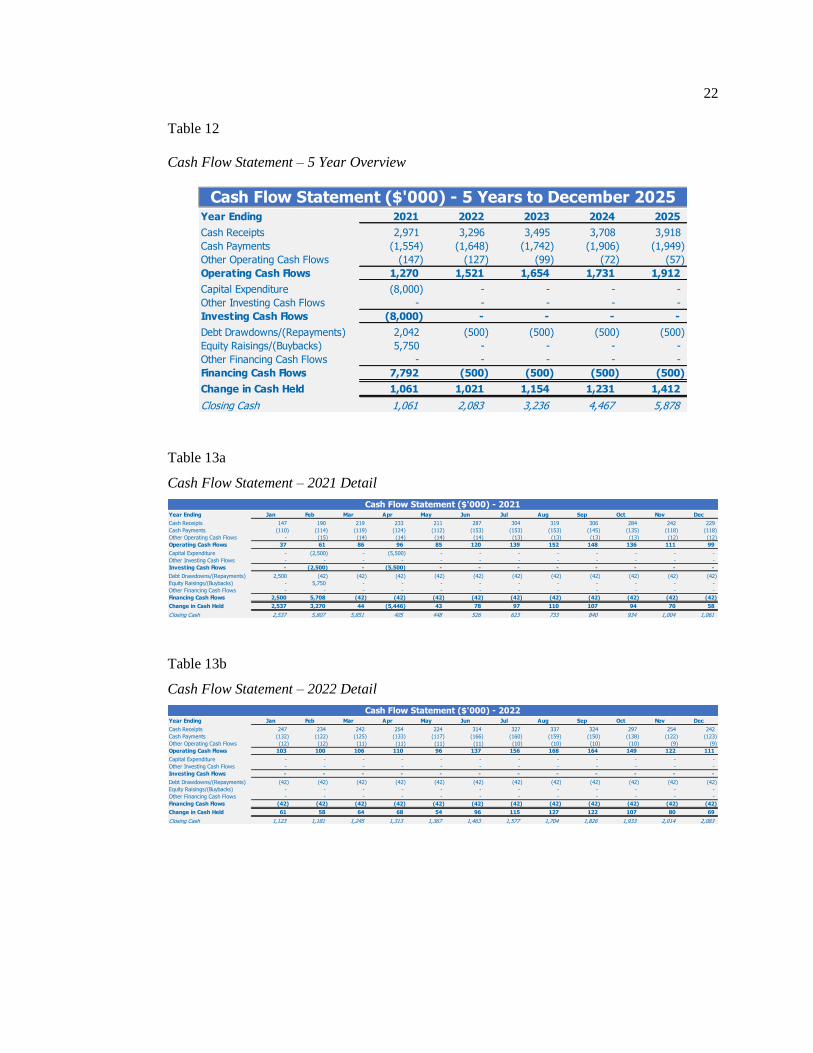
Cash Flow Statement
The third pro forma financial item is the cash flow statement. Again, this has
been broken out two different ways to provide as much detail as possible. The first
table is an overview of a 5-year period. The subsequent five tables give a more
granular view of each year by breaking the year down by months.
These tables all give a reduced picture of the balance sheet. Once again, refer
to Appendix D for an expanded cash flow statement over a 1-year period.
Month Ending Jan Feb Mar Apr May Jun Jul Aug Sep Oct Nov Dec
Revenue 291 256 282 303 228 458 351 393 339 300 255 259
Growth % - (12%) 10% 7% (25%) 101% (23%) 12% (14%) (12%) (15%) 1%
COGS (40) (31) (33) (46) (28) (72) (40) (50) (39) (35) (31) (31)
% of Revenue (14%) (12%) (12%) (15%) (12%) (16%) (12%) (13%) (12%) (12%) (12%) (12%)
GROSS MARGIN 251 225 248 256 200 386 310 343 300 265 225 228
GROSS MARGIN % 86% 88% 88% 85% 88% 84% 88% 87% 88% 88% 88% 88%
Variable Expenses (65) (58) (63) (68) (51) (103) (79) (88) (76) (67) (57) (58)
% of Revenue (23%) (23%) (23%) (23%) (23%) (23%) (23%) (23%) (23%) (23%) (23%) (23%)
Salaries & Wages (45) (45) (45) (45) (45) (45) (45) (45) (45) (45) (45) (45)
% of Revenue (15%) (17%) (16%) (15%) (20%) (10%) (13%) (11%) (13%) (15%) (17%) (17%)
Fixed Expenses (5) (5) (5) (5) (5) (5) (5) (5) (5) (5) (5) (5)
% of Revenue (2%) (2%) (2%) (2%) (2%) (1%) (1%) (1%) (1%) (2%) (2%) (2%)
EBITDA 136 118 135 139 99 233 182 205 174 148 118 120
EBITDA % 47% 46% 48% 46% 43% 51% 52% 52% 51% 49% 46% 46%
Depreciation & Amortization (133) (133) (133) (133) (133) (133) (133) (133) (133) (133) (133) (133)
EBIT 3 (15) 2 6 (34) 100 49 72 41 14 (16) (14)
Net Interest Expense (6) (6) (6) (5) (5) (5) (5) (4) (4) (4) (4) (3)
Net Profit Before Tax (3) (21) (3) 0 (39) 95 44 68 37 10 (19) (17)
Tax Expense - - - (0) - (6) (3) (4) (2) (1) - -
Net Profit After Tax (3) (21) (3) 0 (39) 90 41 64 34 10 (19) (17)
Net Profit After Tax % (1%) (8%) (1%) 0% (17%) 20% 12% 16% 10% 3% (8%) (7%)
Income Statement ($'000) - 2024
Month Ending Jan Feb Mar Apr May Jun Jul Aug Sep Oct Nov Dec
Revenue 313 262 292 329 242 497 366 419 350 317 268 269
Growth % - (16%) 11% 13% (26%) 105% (26%) 15% (17%) (9%) (15%) 0%
COGS (44) (33) (35) (52) (31) (81) (43) (54) (41) (38) (33) (33)
% of Revenue (14%) (12%) (12%) (16%) (13%) (16%) (12%) (13%) (12%) (12%) (12%) (12%)
GROSS MARGIN 269 230 257 277 212 416 323 365 309 279 235 235
GROSS MARGIN % 86% 88% 88% 84% 87% 84% 88% 87% 88% 88% 88% 88%
Variable Expenses (70) (59) (66) (74) (55) (112) (82) (94) (79) (71) (60) (60)
% of Revenue (23%) (23%) (23%) (23%) (23%) (23%) (23%) (23%) (23%) (23%) (23%) (23%)
Salaries & Wages (41) (41) (41) (41) (41) (41) (41) (41) (41) (41) (41) (41)
% of Revenue (13%) (16%) (14%) (12%) (17%) (8%) (11%) (10%) (12%) (13%) (15%) (15%)
Fixed Expenses (5) (5) (5) (5) (5) (5) (5) (5) (5) (5) (5) (5)
% of Revenue (2%) (2%) (2%) (2%) (2%) (1%) (1%) (1%) (1%) (2%) (2%) (2%)
EBITDA 153 125 145 157 112 258 195 225 184 162 129 129
EBITDA % 49% 48% 50% 48% 46% 52% 53% 54% 53% 51% 48% 48%
Depreciation & Amortization (133) (133) (133) (133) (133) (133) (133) (133) (133) (133) (133) (133)
EBIT 20 (8) 12 24 (22) 125 62 91 51 29 (4) (4)
Net Interest Expense (3) (3) (3) (2) (2) (2) (2) (1) (1) (1) (1) (0)
Net Profit Before Tax 17 (11) 9 21 (24) 123 60 90 50 28 (5) (5)
Tax Expense (1) - (1) (2) - (11) (5) (8) (4) (2) - -
Net Profit After Tax 15 (11) 8 20 (24) 112 55 82 45 25 (5) (5)
Net Profit After Tax % 5% (4%) 3% 6% (10%) 23% 15% 20% 13% 8% (2%) (2%)
Income Statement ($'000) - 2025
22
Table 12
Cash Flow Statement – 5 Year Overview
Table 13a
Cash Flow Statement – 2021 Detail
Table 13b
Cash Flow Statement – 2022 Detail
Year Ending 2021 2022 2023 2024 2025
Cash Receipts 2,971 3,296 3,495 3,708 3,918
Cash Payments (1,554) (1,648) (1,742) (1,906) (1,949)
Other Operating Cash Flows (147) (127) (99) (72) (57)
Operating Cash Flows 1,270 1,521 1,654 1,731 1,912
Capital Expenditure (8,000) - - - -
Other Investing Cash Flows - - - - -
Investing Cash Flows (8,000) - - - -
Debt Drawdowns/(Repayments) 2,042 (500) (500) (500) (500)
Equity Raisings/(Buybacks) 5,750 - - - -
Other Financing Cash Flows - - - - -
Financing Cash Flows 7,792 (500) (500) (500) (500)
Change in Cash Held 1,061 1,021 1,154 1,231 1,412
Closing Cash 1,061 2,083 3,236 4,467 5,878
Cash Flow Statement ($'000) - 5 Years to December 2025
Year Ending Jan Feb Mar Apr May Jun Jul Aug Sep Oct Nov Dec
Cash Receipts 147 190 219 233 211 287 304 319 306 284 242 229
Cash Payments (110) (114) (119) (124) (112) (153) (153) (153) (145) (135) (118) (118)
Other Operating Cash Flows - (15) (14) (14) (14) (14) (13) (13) (13) (13) (12) (12)
Operating Cash Flows 37 61 86 96 85 120 139 152 148 136 111 99
Capital Expenditure - (2,500) - (5,500) - - - - - - - -
Other Investing Cash Flows - - - - - - - - - - - -
Investing Cash Flows - (2,500) - (5,500) - - - - - - - -
Debt Drawdowns/(Repayments) 2,500 (42) (42) (42) (42) (42) (42) (42) (42) (42) (42) (42)
Equity Raisings/(Buybacks) - 5,750 - - - - - - - - - -
Other Financing Cash Flows - - - - - - - - - - - -
Financing Cash Flows 2,500 5,708 (42) (42) (42) (42) (42) (42) (42) (42) (42) (42)
Change in Cash Held 2,537 3,270 44 (5,446) 43 78 97 110 107 94 70 58
Closing Cash 2,537 5,807 5,851 405 448 526 623 733 840 934 1,004 1,061
Cash Flow Statement ($'000) - 2021
Year Ending Jan Feb Mar Apr May Jun Jul Aug Sep Oct Nov Dec
Cash Receipts 247 234 242 254 224 314 327 337 324 297 254 242
Cash Payments (132) (122) (125) (133) (117) (166) (160) (159) (150) (138) (122) (123)
Other Operating Cash Flows (12) (12) (11) (11) (11) (11) (10) (10) (10) (10) (9) (9)
Operating Cash Flows 103 100 106 110 96 137 156 168 164 149 122 111
Capital Expenditure - - - - - - - - - - - -
Other Investing Cash Flows - - - - - - - - - - - -
Investing Cash Flows - - - - - - - - - - - -
Debt Drawdowns/(Repayments) (42) (42) (42) (42) (42) (42) (42) (42) (42) (42) (42) (42)
Equity Raisings/(Buybacks) - - - - - - - - - - - -
Other Financing Cash Flows - - - - - - - - - - - -
Financing Cash Flows (42) (42) (42) (42) (42) (42) (42) (42) (42) (42) (42) (42)
Change in Cash Held 61 58 64 68 54 96 115 127 122 107 80 69
Closing Cash 1,123 1,181 1,245 1,313 1,367 1,463 1,577 1,704 1,826 1,933 2,014 2,083
Cash Flow Statement ($'000) - 2022
23
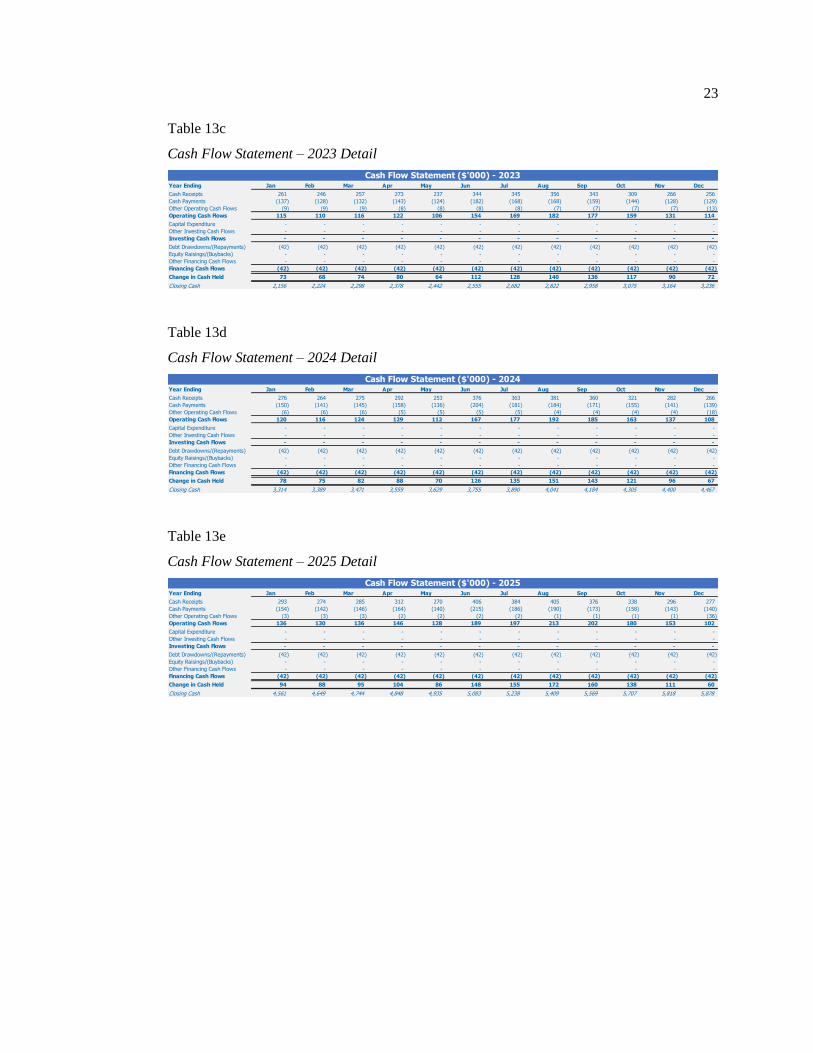
Table 13c
Cash Flow Statement – 2023 Detail
Table 13d
Cash Flow Statement – 2024 Detail
Table 13e
Cash Flow Statement – 2025 Detail
Year Ending Jan Feb Mar Apr May Jun Jul Aug Sep Oct Nov Dec
Cash Receipts 261 246 257 273 237 344 345 356 343 309 266 256
Cash Payments (137) (128) (132) (143) (124) (182) (168) (168) (159) (144) (128) (129)
Other Operating Cash Flows (9) (9) (9) (8) (8) (8) (8) (7) (7) (7) (7) (13)
Operating Cash Flows 115 110 116 122 106 154 169 182 177 159 131 114
Capital Expenditure - - - - - - - - - - - -
Other Investing Cash Flows - - - - - - - - - - - -
Investing Cash Flows - - - - - - - - - - - -
Debt Drawdowns/(Repayments) (42) (42) (42) (42) (42) (42) (42) (42) (42) (42) (42) (42)
Equity Raisings/(Buybacks) - - - - - - - - - - - -
Other Financing Cash Flows - - - - - - - - - - - -
Financing Cash Flows (42) (42) (42) (42) (42) (42) (42) (42) (42) (42) (42) (42)
Change in Cash Held 73 68 74 80 64 112 128 140 136 117 90 72
Closing Cash 2,156 2,224 2,298 2,378 2,442 2,555 2,682 2,822 2,958 3,075 3,164 3,236
Cash Flow Statement ($'000) - 2023
Year Ending Jan Feb Mar Apr May Jun Jul Aug Sep Oct Nov Dec
Cash Receipts 276 264 275 292 253 376 363 381 360 321 282 266
Cash Payments (150) (141) (145) (158) (136) (204) (181) (184) (171) (155) (141) (139)
Other Operating Cash Flows (6) (6) (6) (5) (5) (5) (5) (4) (4) (4) (4) (18)
Operating Cash Flows 120 116 124 129 112 167 177 192 185 163 137 108
Capital Expenditure - - - - - - - - - - - -
Other Investing Cash Flows - - - - - - - - - - - -
Investing Cash Flows - - - - - - - - - - - -
Debt Drawdowns/(Repayments) (42) (42) (42) (42) (42) (42) (42) (42) (42) (42) (42) (42)
Equity Raisings/(Buybacks) - - - - - - - - - - - -
Other Financing Cash Flows - - - - - - - - - - - -
Financing Cash Flows (42) (42) (42) (42) (42) (42) (42) (42) (42) (42) (42) (42)
Change in Cash Held 78 75 82 88 70 126 135 151 143 121 96 67
Closing Cash 3,314 3,389 3,471 3,559 3,629 3,755 3,890 4,041 4,184 4,305 4,400 4,467
Cash Flow Statement ($'000) - 2024
Year Ending Jan Feb Mar Apr May Jun Jul Aug Sep Oct Nov Dec
Cash Receipts 293 274 285 312 270 406 384 405 376 338 296 277
Cash Payments (154) (142) (146) (164) (140) (215) (186) (190) (173) (158) (143) (140)
Other Operating Cash Flows (3) (3) (3) (2) (2) (2) (2) (1) (1) (1) (1) (36)
Operating Cash Flows 136 130 136 146 128 189 197 213 202 180 153 102
Capital Expenditure - - - - - - - - - - - -
Other Investing Cash Flows - - - - - - - - - - - -
Investing Cash Flows - - - - - - - - - - - -
Debt Drawdowns/(Repayments) (42) (42) (42) (42) (42) (42) (42) (42) (42) (42) (42) (42)
Equity Raisings/(Buybacks) - - - - - - - - - - - -
Other Financing Cash Flows - - - - - - - - - - - -
Financing Cash Flows (42) (42) (42) (42) (42) (42) (42) (42) (42) (42) (42) (42)
Change in Cash Held 94 88 95 104 86 148 155 172 160 138 111 60
Closing Cash 4,561 4,649 4,744 4,848 4,935 5,083 5,238 5,409 5,569 5,707 5,818 5,878
Cash Flow Statement ($'000) - 2025
24
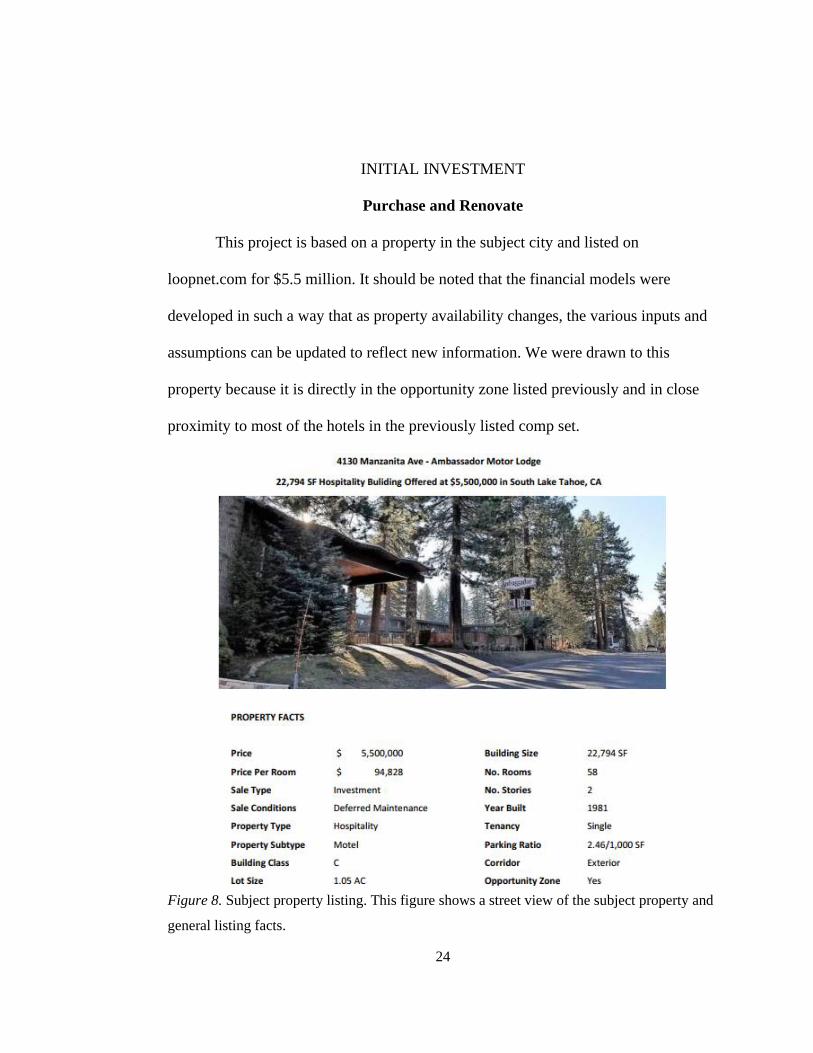
INITIAL INVESTMENT
Purchase and Renovate
This project is based on a property in the subject city and listed on
loopnet.com for $5.5 million. It should be noted that the financial models were
developed in such a way that as property availability changes, the various inputs and
assumptions can be updated to reflect new information. We were drawn to this
property because it is directly in the opportunity zone listed previously and in close
proximity to most of the hotels in the previously listed comp set.
Figure 8. Subject property listing. This figure shows a street view of the subject property and
general listing facts.
25
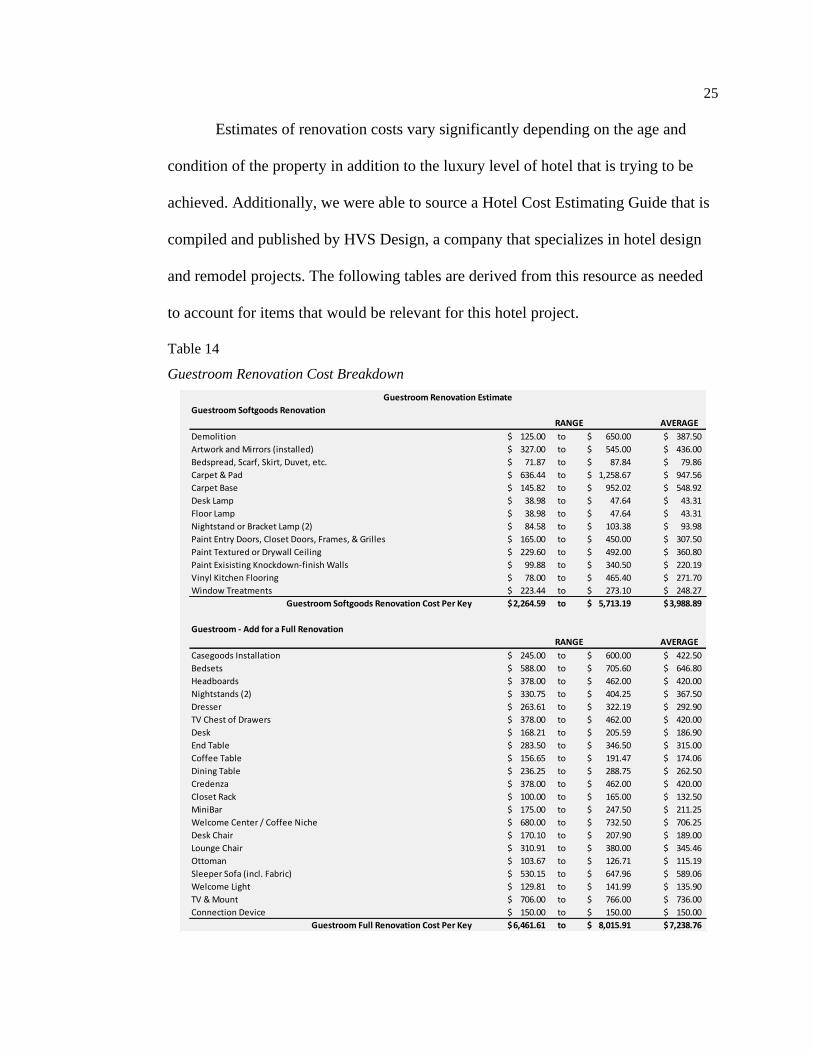
Estimates of renovation costs vary significantly depending on the age and
condition of the property in addition to the luxury level of hotel that is trying to be
achieved. Additionally, we were able to source a Hotel Cost Estimating Guide that is
compiled and published by HVS Design, a company that specializes in hotel design
and remodel projects. The following tables are derived from this resource as needed
to account for items that would be relevant for this hotel project.
Table 14
Guestroom Renovation Cost Breakdown
Guestroom Softgoods Renovation
AVERAGE
Demolition 125.00$ to 650.00$ 387.50$
Artwork and Mirrors (installed) 327.00$ to 545.00$ 436.00$
Bedspread, Scarf, Skirt, Duvet, etc. 71.87$ to 87.84$ 79.86$
Carpet & Pad 636.44$ to 1,258.67$ 947.56$
Carpet Base 145.82$ to 952.02$ 548.92$
Desk Lamp 38.98$ to 47.64$ 43.31$
Floor Lamp 38.98$ to 47.64$ 43.31$
Nightstand or Bracket Lamp (2) 84.58$ to 103.38$ 93.98$
Paint Entry Doors, Closet Doors, Frames, & Grilles 165.00$ to 450.00$ 307.50$
Paint Textured or Drywall Ceiling 229.60$ to 492.00$ 360.80$
Paint Exisisting Knockdown-finish Walls 99.88$ to 340.50$ 220.19$
Vinyl Kitchen Flooring 78.00$ to 465.40$ 271.70$
Window Treatments 223.44$ to 273.10$ 248.27$
Guestroom Softgoods Renovation Cost Per Key 2,264.59$ to 5,713.19$ 3,988.89$
Guestroom - Add for a Full Renovation
AVERAGE
Casegoods Installation 245.00$ to 600.00$ 422.50$
Bedsets 588.00$ to 705.60$ 646.80$
Headboards 378.00$ to 462.00$ 420.00$
Nightstands (2) 330.75$ to 404.25$ 367.50$
Dresser 263.61$ to 322.19$ 292.90$
TV Chest of Drawers 378.00$ to 462.00$ 420.00$
Desk 168.21$ to 205.59$ 186.90$
End Table 283.50$ to 346.50$ 315.00$
Coffee Table 156.65$ to 191.47$ 174.06$
Dining Table 236.25$ to 288.75$ 262.50$
Credenza 378.00$ to 462.00$ 420.00$
Closet Rack 100.00$ to 165.00$ 132.50$
MiniBar 175.00$ to 247.50$ 211.25$
Welcome Center / Coffee Niche 680.00$ to 732.50$ 706.25$
Desk Chair 170.10$ to 207.90$ 189.00$
Lounge Chair 310.91$ to 380.00$ 345.46$
Ottoman 103.67$ to 126.71$ 115.19$
Sleeper Sofa (incl. Fabric) 530.15$ to 647.96$ 589.06$
Welcome Light 129.81$ to 141.99$ 135.90$
TV & Mount 706.00$ to 766.00$ 736.00$
Connection Device 150.00$ to 150.00$ 150.00$
Guestroom Full Renovation Cost Per Key 6,461.61$ to 8,015.91$ 7,238.76$
RANGE
RANGE
Guestroom Renovation Estimate
26
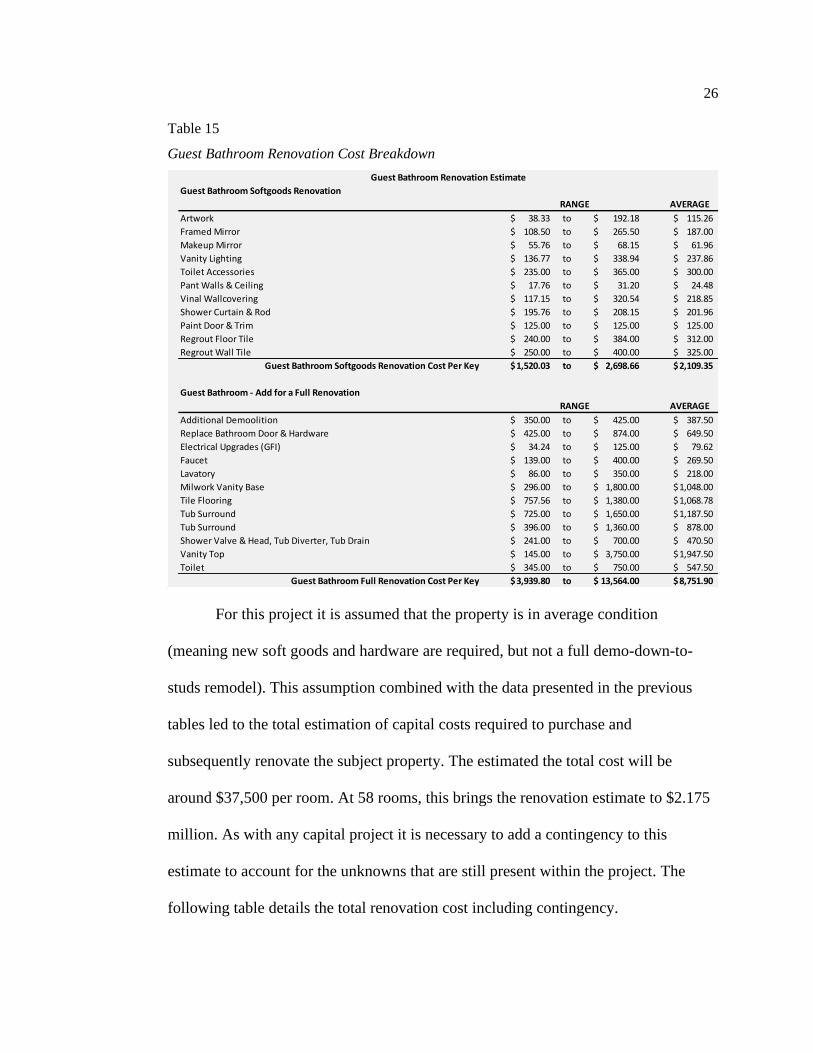
Table 15
Guest Bathroom Renovation Cost Breakdown
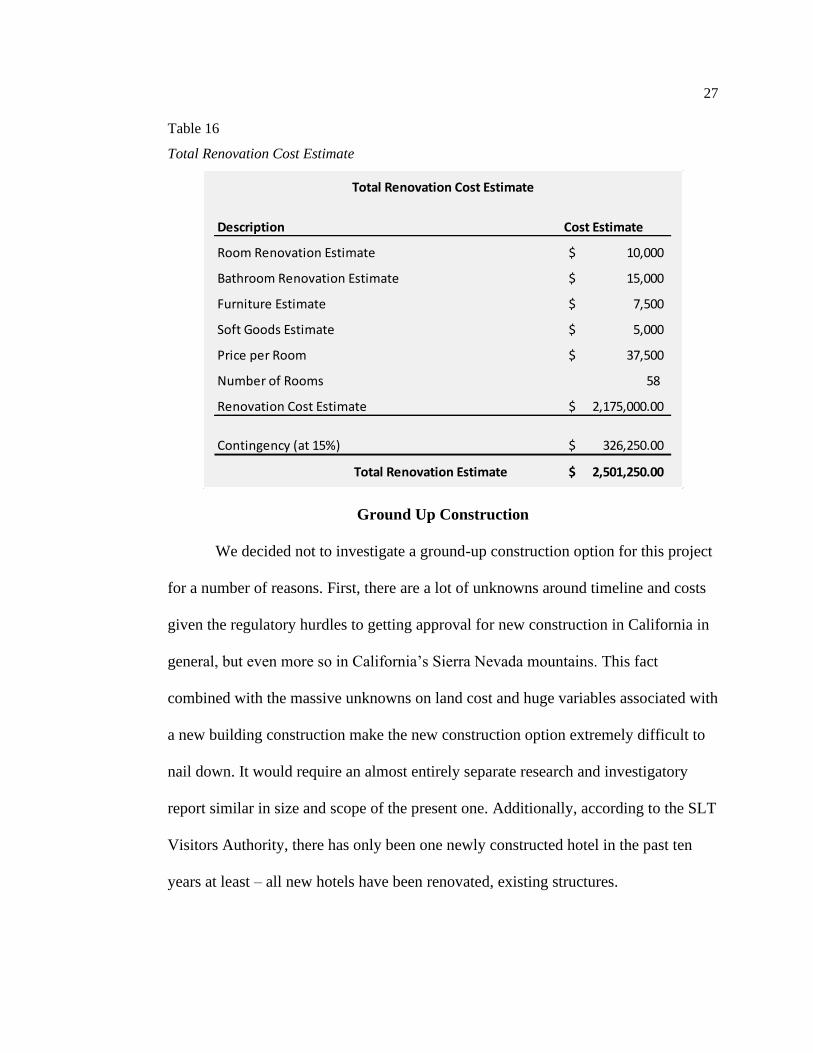
For this project it is assumed that the property is in average condition
(meaning new soft goods and hardware are required, but not a full demo-down-to-
studs remodel). This assumption combined with the data presented in the previous
tables led to the total estimation of capital costs required to purchase and
subsequently renovate the subject property. The estimated the total cost will be
around $37,500 per room. At 58 rooms, this brings the renovation estimate to $2.175
million. As with any capital project it is necessary to add a contingency to this
estimate to account for the unknowns that are still present within the project. The
following table details the total renovation cost including contingency.
Guest Bathroom Softgoods Renovation
AVERAGE
Artwork 38.33$ to 192.18$ 115.26$
Framed Mirror 108.50$ to 265.50$ 187.00$
Makeup Mirror 55.76$ to 68.15$ 61.96$
Vanity Lighting 136.77$ to 338.94$ 237.86$
Toilet Accessories 235.00$ to 365.00$ 300.00$
Pant Walls & Ceiling 17.76$ to 31.20$ 24.48$
Vinal Wallcovering 117.15$ to 320.54$ 218.85$
Shower Curtain & Rod 195.76$ to 208.15$ 201.96$
Paint Door & Trim 125.00$ to 125.00$ 125.00$
Regrout Floor Tile 240.00$ to 384.00$ 312.00$
Regrout Wall Tile 250.00$ to 400.00$ 325.00$
Guest Bathroom Softgoods Renovation Cost Per Key 1,520.03$ to 2,698.66$ 2,109.35$
Guest Bathroom - Add for a Full Renovation
AVERAGE
Additional Demoolition 350.00$ to 425.00$ 387.50$
Replace Bathroom Door & Hardware 425.00$ to 874.00$ 649.50$
Electrical Upgrades (GFI) 34.24$ to 125.00$ 79.62$
Faucet 139.00$ to 400.00$ 269.50$
Lavatory 86.00$ to 350.00$ 218.00$
Milwork Vanity Base 296.00$ to 1,800.00$ 1,048.00$
Tile Flooring 757.56$ to 1,380.00$ 1,068.78$
Tub Surround 725.00$ to 1,650.00$ 1,187.50$
Tub Surround 396.00$ to 1,360.00$ 878.00$
Shower Valve & Head, Tub Diverter, Tub Drain 241.00$ to 700.00$ 470.50$
Vanity Top 145.00$ to 3,750.00$ 1,947.50$
Toilet 345.00$ to 750.00$ 547.50$
Guest Bathroom Full Renovation Cost Per Key 3,939.80$ to 13,564.00$ 8,751.90$
RANGE
RANGE
Guest Bathroom Renovation Estimate
27
Table 16
Total Renovation Cost Estimate
Ground Up Construction
We decided not to investigate a ground-up construction option for this project
for a number of reasons. First, there are a lot of unknowns around timeline and costs
given the regulatory hurdles to getting approval for new construction in California in
general, but even more so in California’s Sierra Nevada mountains. This fact
combined with the massive unknowns on land cost and huge variables associated with
a new building construction make the new construction option extremely difficult to
nail down. It would require an almost entirely separate research and investigatory
report similar in size and scope of the present one. Additionally, according to the SLT
Visitors Authority, there has only been one newly constructed hotel in the past ten
years at least – all new hotels have been renovated, existing structures.
Description Cost Estimate
Room Renovation Estimate 10,000$
Bathroom Renovation Estimate 15,000$
Furniture Estimate 7,500$
Soft Goods Estimate 5,000$
Price per Room 37,500$
Number of Rooms 58
Renovation Cost Estimate 2,175,000.00$
Contingency (at 15%) 326,250.00$
Total Renovation Estimate 2,501,250.00$
Total Renovation Cost Estimate
28
FINANCIALS
Breakeven Analysis
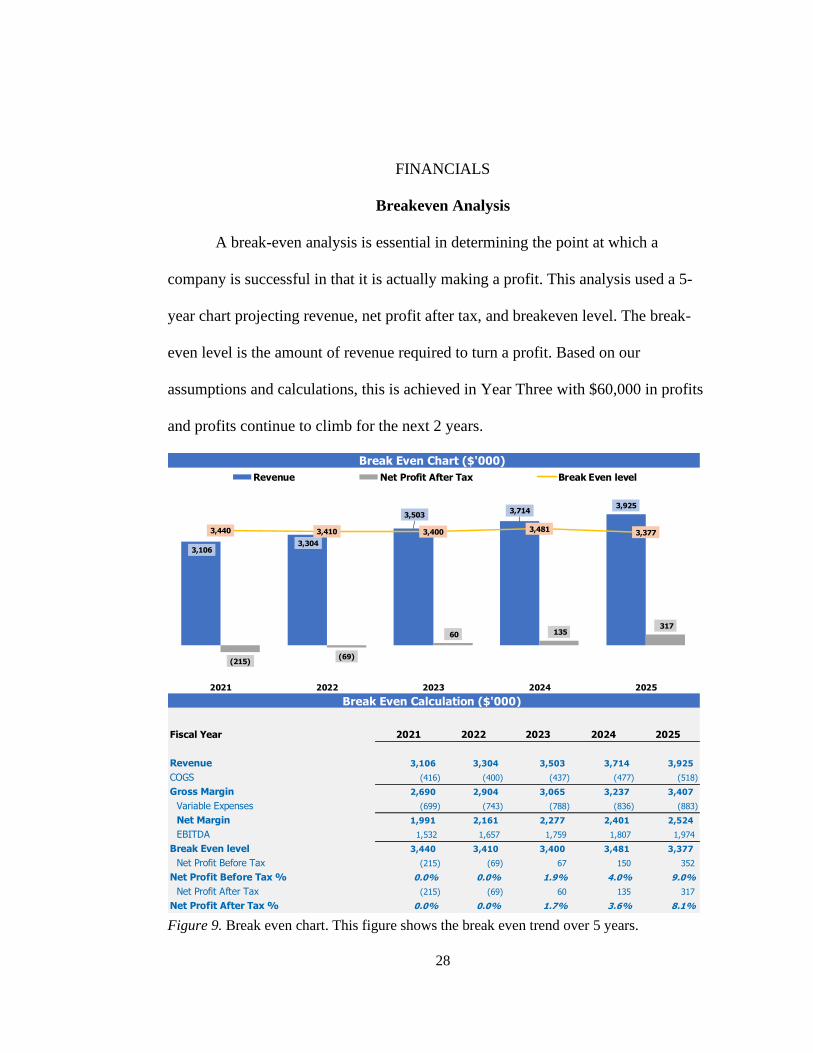
A break-even analysis is essential in determining the point at which a
company is successful in that it is actually making a profit. This analysis used a 5-
year chart projecting revenue, net profit after tax, and breakeven level. The break-
even level is the amount of revenue required to turn a profit. Based on our
assumptions and calculations, this is achieved in Year Three with $60,000 in profits
and profits continue to climb for the next 2 years.
Figure 9. Break even chart. This figure shows the break even trend over 5 years.
Fiscal Year 2021 2022 2023 2024 2025
Revenue 3,106 3,304 3,503 3,714 3,925
COGS (416) (400) (437) (477) (518)
Gross Margin 2,690 2,904 3,065 3,237 3,407
Variable Expenses (699) (743) (788) (836) (883)
Net Margin 1,991 2,161 2,277 2,401 2,524
EBITDA 1,532 1,657 1,759 1,807 1,974
Break Even level 3,440 3,410 3,400 3,481 3,377
Net Profit Before Tax (215) (69) 67 150 352
Net Profit Before Tax % 0.0% 0.0% 1.9% 4.0% 9.0%
Net Profit After Tax (215) (69) 60 135 317
Net Profit After Tax % 0.0% 0.0% 1.7% 3.6% 8.1%
Break Even Chart ($'000)
Break Even Calculation ($'000)
3,1063,304
3,5033,714
3,925
(215)(69)
60 135 317
3,440 3,410 3,400 3,481 3,377
2021 2022 2023 2024 2025
Revenue Net Profit After Tax Break Even level
29
Fixed and Variable Costs
As with any business, there are fixed and variable expenses included in the
model which ultimately predict the proposed hotels revenue and expense. The model
is based on the premise that one piece of the hotel’s expenses varies directly with
occupancy while the other component is fixed. The fixed component is based on
research of similar businesses in similar economies and only increases with the rate of
inflation, while the variable component is directly proportional to the projected guest
volume of the proposed hotel and adjusts accordingly.
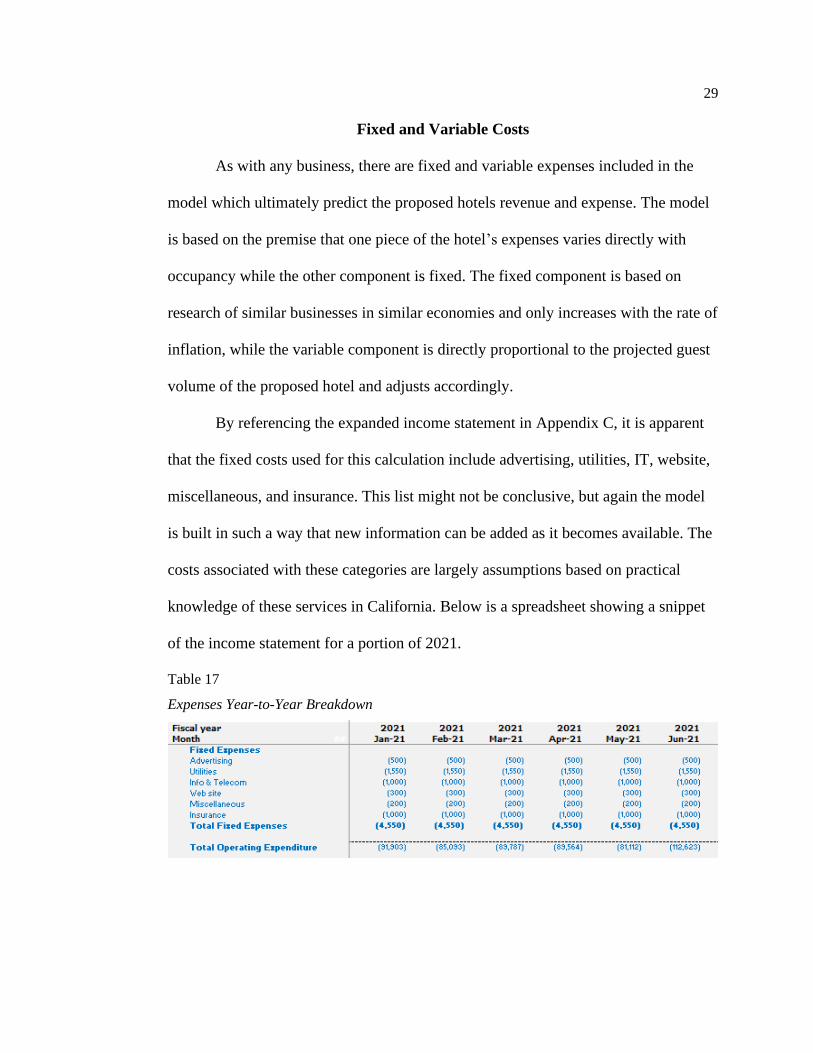
By referencing the expanded income statement in Appendix C, it is apparent
that the fixed costs used for this calculation include advertising, utilities, IT, website,
miscellaneous, and insurance. This list might not be conclusive, but again the model
is built in such a way that new information can be added as it becomes available. The
costs associated with these categories are largely assumptions based on practical
knowledge of these services in California. Below is a spreadsheet showing a snippet
of the income statement for a portion of 2021.
Table 17
Expenses Year-to-Year Breakdown
30
Revenue
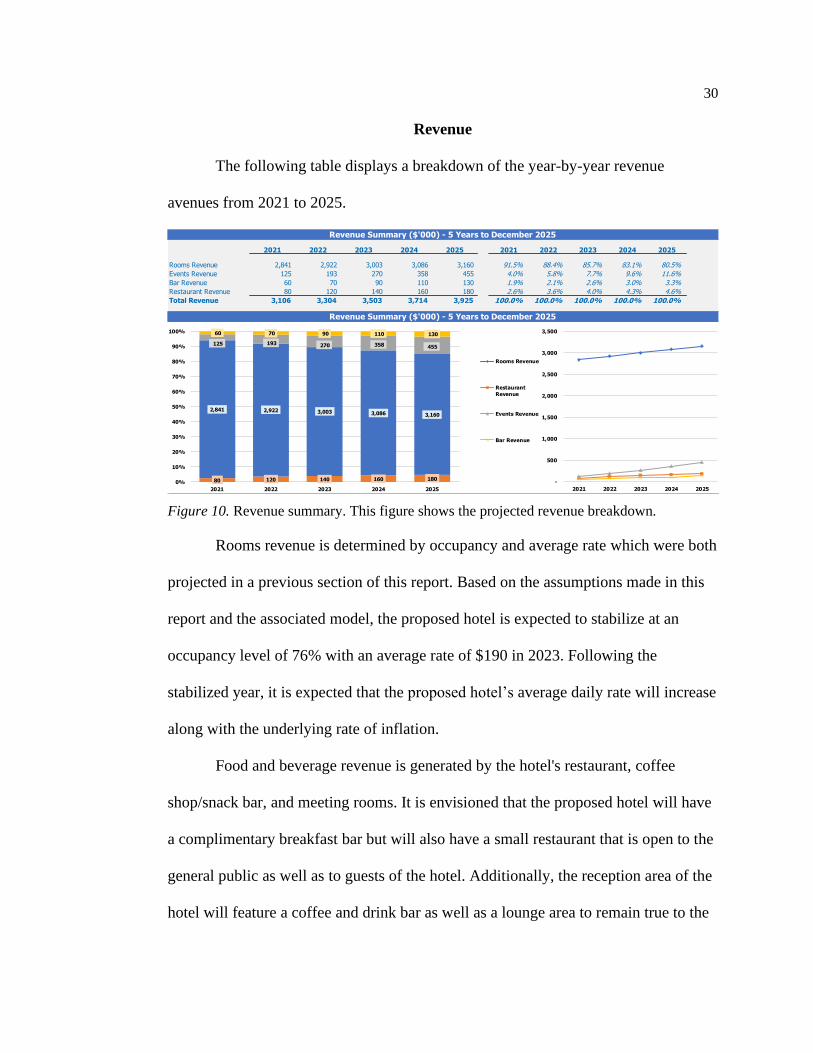
The following table displays a breakdown of the year-by-year revenue
avenues from 2021 to 2025.
Figure 10. Revenue summary. This figure shows the projected revenue breakdown.
Rooms revenue is determined by occupancy and average rate which were both
projected in a previous section of this report. Based on the assumptions made in this
report and the associated model, the proposed hotel is expected to stabilize at an
occupancy level of 76% with an average rate of $190 in 2023. Following the
stabilized year, it is expected that the proposed hotel’s average daily rate will increase
along with the underlying rate of inflation.
Food and beverage revenue is generated by the hotel's restaurant, coffee
shop/snack bar, and meeting rooms. It is envisioned that the proposed hotel will have
a complimentary breakfast bar but will also have a small restaurant that is open to the
general public as well as to guests of the hotel. Additionally, the reception area of the
hotel will feature a coffee and drink bar as well as a lounge area to remain true to the
2021 2022 2023 2024 2025 2021 2022 2023 2024 2025
Rooms Revenue 2,841 2,922 3,003 3,086 3,160 91.5% 88.4% 85.7% 83.1% 80.5%
Events Revenue 125 193 270 358 455 4.0% 5.8% 7.7% 9.6% 11.6%
Bar Revenue 60 70 90 110 130 1.9% 2.1% 2.6% 3.0% 3.3%
Restaurant Revenue 80 120 140 160 180 2.6% 3.6% 4.0% 4.3% 4.6%
Total Revenue 3,106 3,304 3,503 3,714 3,925 100.0% 100.0% 100.0% 100.0% 100.0%
Revenue Summary ($'000) - 5 Years to December 2025
Revenue Summary ($'000) - 5 Years to December 2025
-
500
1,000
1,500
2,000
2,500
3,000
3,500
2021 2022 2023 2024 2025
Rooms Revenue
Restaurant
Revenue
Events Revenue
Bar Revenue
80 120 140 160 180
2,841 2,922 3,003 3,086 3,160
125 193 270 358 455
60 70 90 110 130
0%
10%
20%
30%
40%
50%
60%
70%
80%
90%
100%
2021 2022 2023 2024 2025
31
hotels vision of providing an environment that is conducive to social interactions with
locals and other guests. Meeting rooms will be available to be rented by guests as
well as locals for busines retreats or general business meetings. It is the goal of the
proposed business to feature a large outdoor area that could be used for hosting
unique wedding venues and other celebrations. In addition to providing a source of
revenue, these outlets are expected to serve as an amenity that caters directly to the
intended customer that the proposed hotel seeks to serve.
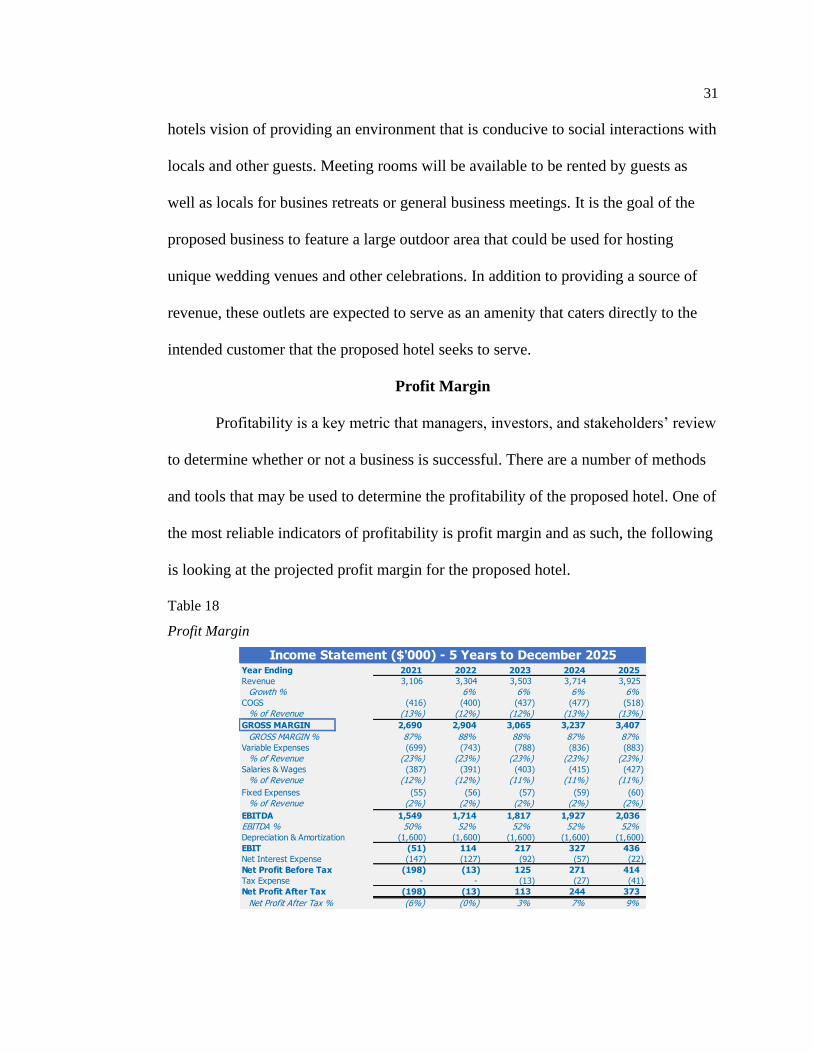
Profit Margin
Profitability is a key metric that managers, investors, and stakeholders’ review
to determine whether or not a business is successful. There are a number of methods
and tools that may be used to determine the profitability of the proposed hotel. One of
the most reliable indicators of profitability is profit margin and as such, the following
is looking at the projected profit margin for the proposed hotel.
Table 18
Profit Margin
Year Ending 2021 2022 2023 2024 2025
Revenue 3,106 3,304 3,503 3,714 3,925
Growth % 6% 6% 6% 6%COGS (416) (400) (437) (477) (518)
% of Revenue (13%) (12%) (12%) (13%) (13%)
GROSS MARGIN 2,690 2,904 3,065 3,237 3,407
GROSS MARGIN % 87% 88% 88% 87% 87%Variable Expenses (699) (743) (788) (836) (883)
% of Revenue (23%) (23%) (23%) (23%) (23%)Salaries & Wages (387) (391) (403) (415) (427)
% of Revenue (12%) (12%) (11%) (11%) (11%)
Fixed Expenses (55) (56) (57) (59) (60)
% of Revenue (2%) (2%) (2%) (2%) (2%)
EBITDA 1,549 1,714 1,817 1,927 2,036
EBITDA % 50% 52% 52% 52% 52%Depreciation & Amortization (1,600) (1,600) (1,600) (1,600) (1,600)
EBIT (51) 114 217 327 436
Net Interest Expense (147) (127) (92) (57) (22)
Net Profit Before Tax (198) (13) 125 271 414
Tax Expense - - (13) (27) (41)
Net Profit After Tax (198) (13) 113 244 373
Net Profit After Tax % (6%) (0%) 3% 7% 9%
Income Statement ($'000) - 5 Years to December 2025
32
Profit margin is a measure of the fraction of each dollar of sales that makes its
way down through the income statement to profits. In essence, it is simply a reflection
on how efficient the proposed hotel will be in using its resources in its operations.
This is calculated using the data from the income statement. Gross margin is equal to
gross profit divided by gross sales. The Income Statement, shown in Table 18,
indicates that the proposed hotel is expected to have a gross margin in the upper 80%
range given the current operating assumptions.
33
VALUATION
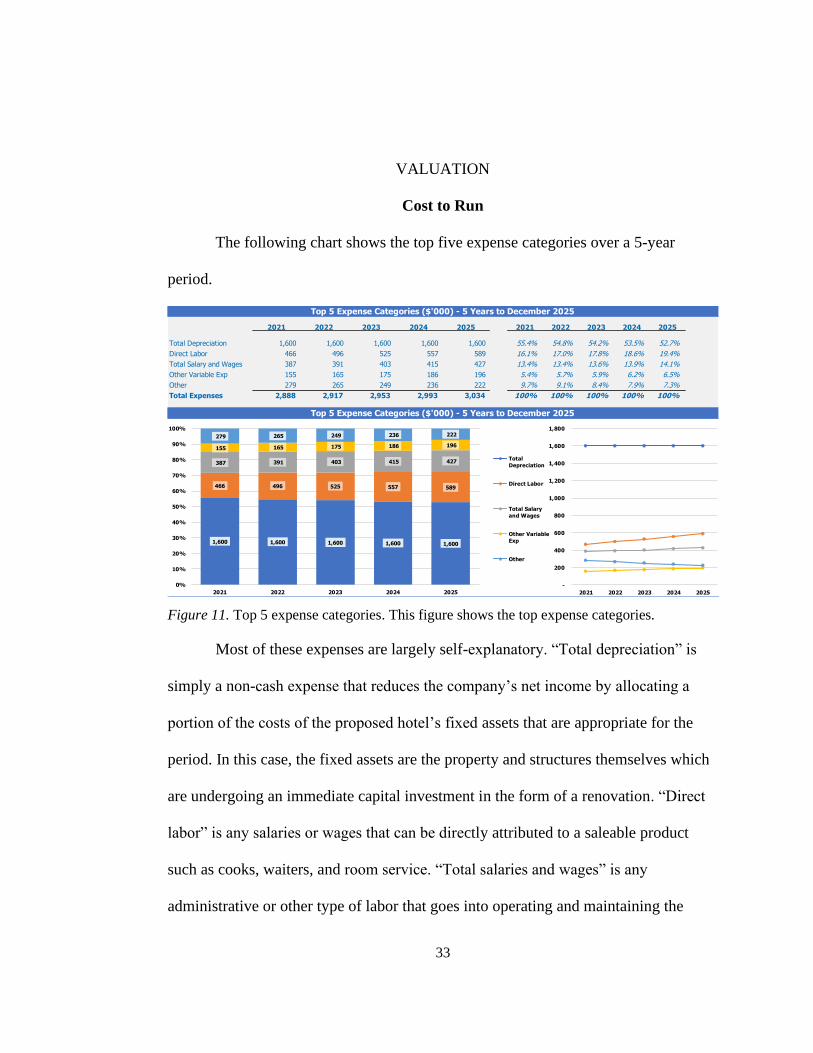
Cost to Run
The following chart shows the top five expense categories over a 5-year
period.
Figure 11. Top 5 expense categories. This figure shows the top expense categories.
Most of these expenses are largely self-explanatory. “Total depreciation” is
simply a non-cash expense that reduces the company’s net income by allocating a
portion of the costs of the proposed hotel’s fixed assets that are appropriate for the
period. In this case, the fixed assets are the property and structures themselves which
are undergoing an immediate capital investment in the form of a renovation. “Direct
labor” is any salaries or wages that can be directly attributed to a saleable product
such as cooks, waiters, and room service. “Total salaries and wages” is any
administrative or other type of labor that goes into operating and maintaining the
2021 2022 2023 2024 2025 2021 2022 2023 2024 2025
Total Depreciation 1,600 1,600 1,600 1,600 1,600 55.4% 54.8% 54.2% 53.5% 52.7%
Direct Labor 466 496 525 557 589 16.1% 17.0% 17.8% 18.6% 19.4%
Total Salary and Wages 387 391 403 415 427 13.4% 13.4% 13.6% 13.9% 14.1%
Other Variable Exp 155 165 175 186 196 5.4% 5.7% 5.9% 6.2% 6.5%
Other 279 265 249 236 222 9.7% 9.1% 8.4% 7.9% 7.3%
Total Expenses 2,888 2,917 2,953 2,993 3,034 100% 100% 100% 100% 100%
Top 5 Expense Categories ($'000) - 5 Years to December 2025
Top 5 Expense Categories ($'000) - 5 Years to December 2025
-
200
400
600
800
1,000
1,200
1,400
1,600
1,800
2021 2022 2023 2024 2025
Total
Depreciation
Direct Labor
Total Salary
and Wages
Other Variable
Exp
Other
1,600 1,600 1,600 1,600 1,600
466 496 525 557 589
387 391 403 415 427
155 165 175 186 196
279 265 249 236 222
0%
10%
20%
30%
40%
50%
60%
70%
80%
90%
100%
2021 2022 2023 2024 2025
34
company and the company’s assets. Although payroll can vary somewhat with
occupancy and the goal is to generally scale the level of staff on hand to meet an
expected occupancy level, much of the proposed hotel’s payroll is fixed. A base level
of front desk personnel, housekeepers, maintenance personnel, and supervisory team
members must always be maintained. Consequently, salaries, wages, and employee
benefits are only moderately sensitive to fluctuations in occupancy rates.
The “other variable expense” and “other” expense categories are catchall
buckets for a number of other business and operating expenses. These include items
like administrative and general expenses, utilities, advertising, info and telecom,
insurance, etc. Administrative and general expenses include items related to the
management and operation of the property and business. This expense category is
assumed to be relatively fixed.
Food expenses are comprised of items required for the operation of the hotel's
restaurant, coffee and alcohol bar, and snack services. Some of the costs associated
with food sales are moderately correlated to food revenues while supplies like
cooking and serving utensils are less dependent on volume. The proposed hotel's
restaurant and bar operation is expected to be efficiently managed and operated at an
expense level that is in line with other comparable operations.
Information and telecommunications systems expenses are made up of all
costs associated with the proposed hotel’s technology infrastructure including the
costs of cell phones, administrative IT services, and complimentary call, television,
and Internet services among other things. Expense levels should be competitive and
35
in line with a typical amount for a property of this type, size, and in a similar
geographical area.
Costs associated with advertising, sales, and promotion fall into the marketing
expense category. These activities are intended to attract and retain customers. In the
age of social media, this cost is expected to be relatively low. However, the company
intends to offer complimentary stays to well-known influencers for the service of
mentioning the hotel on one or more of their platforms – this anticipated cost is
bundled into the marketing expense category. The marketing category is unique in
that all expense items are totally controlled by company management. This means
that if the budget is followed, marketing expenses can be projected accurately.
Property operations and maintenance expense is another expense category that
is largely controlled by management and can be deferred for a time, with the
exception of repairs that are necessary to keep the facility open and prevent further
damage (e.g., plumbing, heating, and electrical items). In this sense, maintenance is
an accumulating expense. If the decision is made to postpone performing a required
repair, the expenditure has not been reduced or eliminated; rather it has deferred
payment until a later date. It is expected that the proposed hotel's maintenance
operation will be well managed, understanding that a lodging facility that operates
with a lower-than-normal maintenance budget is likely to accumulate a considerable
amount of deferred maintenance.
Obviously, the age of a lodging facility has a strong influence on the required
level of maintenance which is a major factor in the proposed hotel since the goal is to
36
renovate an old hotel. A well-organized preventive maintenance system helps delay
deterioration, but it is expected that the proposed hotel will face higher property
operations and maintenance costs each year, with the starting point largely unknown
and depending on the current state of the property at the time of purchase.
The utilities expense category of the proposed hotel takes several forms,
including water and space heating, air conditioning, lighting, cooking fuel, and other
miscellaneous power requirements. Total energy cost is dependent on the source and
quantity of fuel used. It is understood in the hospitality industry that electricity tends
to be the most expensive source, followed by oil and gas. Although all hotels
consume a sizable amount of electricity, many properties supplement their utility
requirements with less expensive sources, such as gas and oil, for heating and
cooking. This will require further investigation upon final sourcing of a property
since many of these energy saving initiatives require a sizable capital investment
which will put an added stress on getting the proposed hotel renovated and
operational.
The insurance expense category consists of the cost of insuring the hotel and
its contents against damage or destruction by fire, weather, sprinkler leakage, and so
forth. General insurance costs also include premiums relating to liability, fidelity, and
theft coverage. Insurance rates are based on many factors, including building design
and construction, fire detection and extinguishing equipment, fire district, distance
from the firehouse, and the area's fire experience. These factors and the final expense
37
amount will need to be assessed and apprised by an insurance provider upon final
sourcing of a property. Insurance expenses do not vary with occupancy.
Net Present Value
There is a science and an art to determining the appropriate measure of risk
that a particular investment will carry. In the case of this feasibility study, this fact
still holds true. In the determination of the appropriate discount rate, the cost of equity
is composed of three factors: the risk-free interest rate, an inflation premium, and a
risk premium. The first two factors (i.e. risk-free interest rate and inflation premium)
are exemplified by the current government bond interest rate. The 10-year
government bond rate will account for inflation in the math of the discount rate. So,
the art to determining the discount rate is in estimating the proposed hotel’s equity
beta and historical market risk premium data. For the purpose of this analysis, a of
1.58 was chosen based on the beta calculations of Dr. Damodaran for the U.S. hotel
sector. Dr. Damodaran published a beta of 1.26 (Damodaran, 2020) for a large hotel
firm. Since the proposed project is a much smaller venture, greater risk is involved
and so we added a factor of 25% to the beta to yield 1.58. A historical market risk
premium of 5.23% was chosen based on the historical risk for the U.S. (Damodaran,
2020) A weighted average for the cost of debt must also be determined by accounting
for the short-term and long-term interest-bearing debt. The book value of debt was
used to find the weights. The long-term rate of 6.0% was used based on the SB long
term loan rate found at nerdwallet.com while the short-term rate of 3.0% was chosen
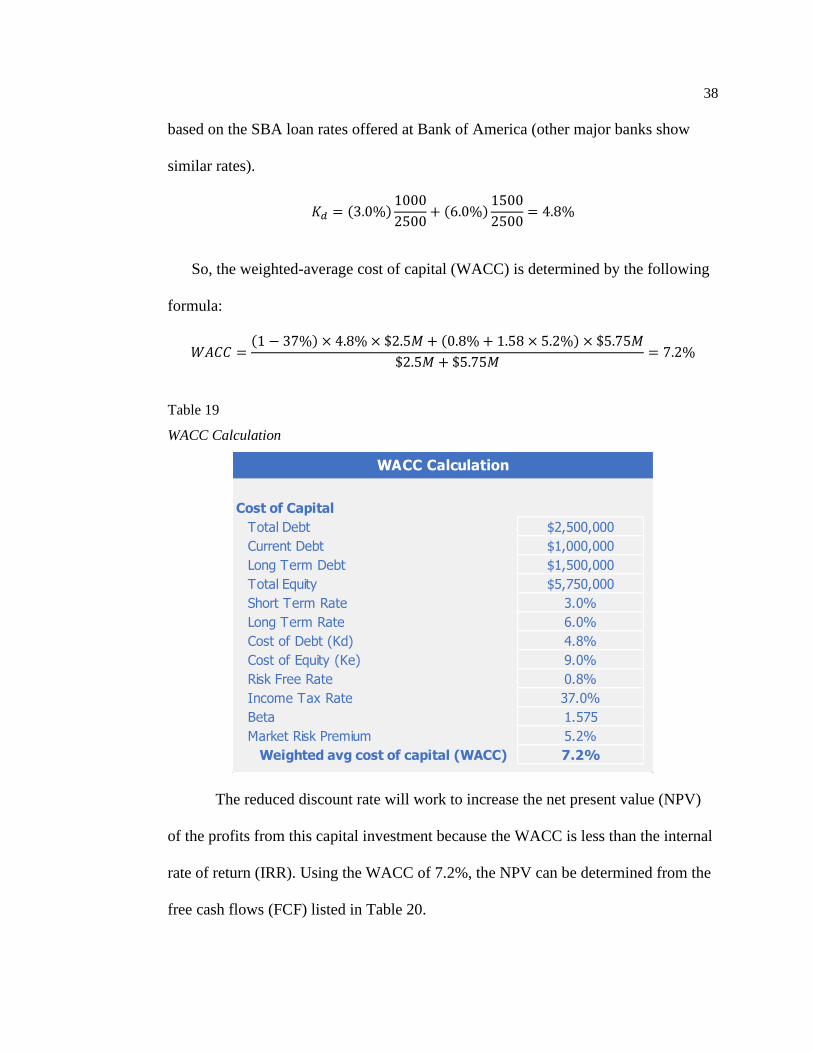
38
based on the SBA loan rates offered at Bank of America (other major banks show
similar rates).
𝐾𝑑 = (3.0%)1000
2500+ (6.0%)
1500
2500= 4.8%
So, the weighted-average cost of capital (WACC) is determined by the following
formula:
𝑊𝐴𝐶𝐶 =(1 − 37%) × 4.8%× $2.5𝑀 + (0.8%+ 1.58 × 5.2%) × $5.75𝑀
$2.5𝑀 + $5.75𝑀= 7.2%
Table 19
WACC Calculation
The reduced discount rate will work to increase the net present value (NPV)
of the profits from this capital investment because the WACC is less than the internal
rate of return (IRR). Using the WACC of 7.2%, the NPV can be determined from the
free cash flows (FCF) listed in Table 20.
Cost of Capital
Total Debt $2,500,000
Current Debt $1,000,000
Long Term Debt $1,500,000
Total Equity $5,750,000
Short Term Rate 3.0%
Long Term Rate 6.0%
Cost of Debt (Kd) 4.8%
Cost of Equity (Ke) 9.0%
Risk Free Rate 0.8%
Income Tax Rate 37.0%
Beta 1.575
Market Risk Premium 5.2%
Weighted avg cost of capital (WACC) 7.2%
WACC Calculation
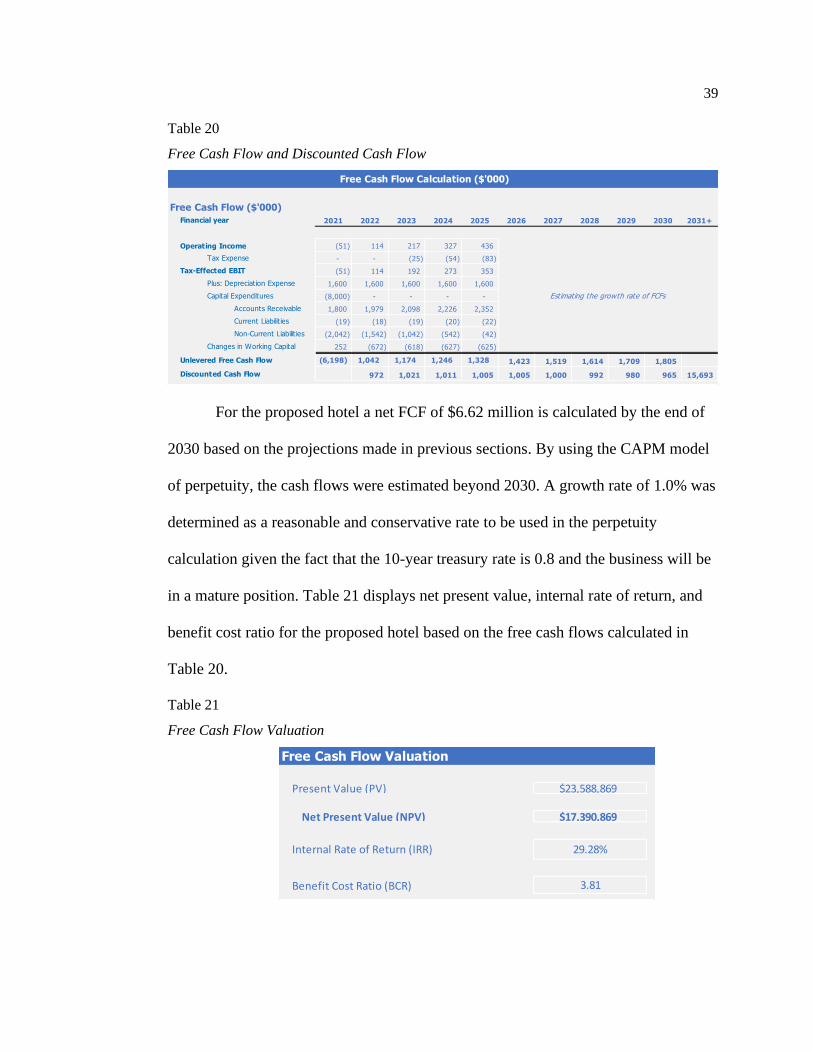
39
Table 20
Free Cash Flow and Discounted Cash Flow
For the proposed hotel a net FCF of $6.62 million is calculated by the end of
2030 based on the projections made in previous sections. By using the CAPM model
of perpetuity, the cash flows were estimated beyond 2030. A growth rate of 1.0% was
determined as a reasonable and conservative rate to be used in the perpetuity
calculation given the fact that the 10-year treasury rate is 0.8 and the business will be
in a mature position. Table 21 displays net present value, internal rate of return, and
benefit cost ratio for the proposed hotel based on the free cash flows calculated in
Table 20.
Table 21
Free Cash Flow Valuation
Free Cash Flow ($'000)
Financial year 2021 2022 2023 2024 2025 2026 2027 2028 2029 2030 2031+
Operating Income (51) 114 217 327 436
Tax Expense - - (25) (54) (83)
Tax-Effected EBIT (51) 114 192 273 353
Plus: Depreciation Expense 1,600 1,600 1,600 1,600 1,600
Capital Expenditures (8,000) - - - -
Accounts Receivable 1,800 1,979 2,098 2,226 2,352
Current Liabilit ies (19) (18) (19) (20) (22)
Non-Current Liabilit ies (2,042) (1,542) (1,042) (542) (42)
Changes in Working Capital 252 (672) (618) (627) (625)
Unlevered Free Cash Flow (6,198) 1,042 1,174 1,246 1,328 1,423 1,519 1,614 1,709 1,805
Discounted Cash Flow 972 1,021 1,011 1,005 1,005 1,000 992 980 965 15,693
Free Cash Flow Calculation ($'000)
Estimating the growth rate of FCFs
Free Cash Flow Valuation
Present Value (PV) $23,588,869
Net Present Value (NPV) $17,390,869
Internal Rate of Return (IRR) 29.28%
Benefit Cost Ratio (BCR) 3.81
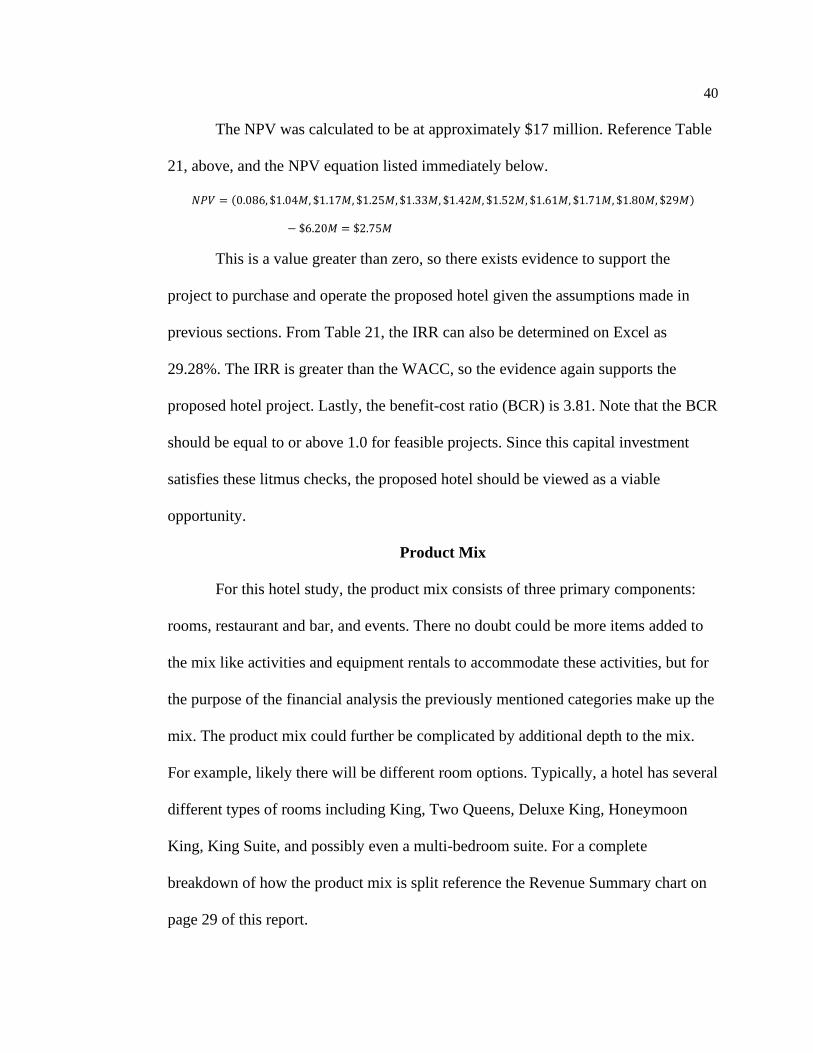
40
The NPV was calculated to be at approximately $17 million. Reference Table
21, above, and the NPV equation listed immediately below.
𝑁𝑃𝑉 = (0.086, $1.04𝑀, $1.17𝑀, $1.25𝑀, $1.33𝑀, $1.42𝑀, $1.52𝑀, $1.61𝑀, $1.71𝑀, $1.80𝑀, $29𝑀)
− $6.20𝑀 = $2.75𝑀
This is a value greater than zero, so there exists evidence to support the
project to purchase and operate the proposed hotel given the assumptions made in
previous sections. From Table 21, the IRR can also be determined on Excel as
29.28%. The IRR is greater than the WACC, so the evidence again supports the
proposed hotel project. Lastly, the benefit-cost ratio (BCR) is 3.81. Note that the BCR
should be equal to or above 1.0 for feasible projects. Since this capital investment
satisfies these litmus checks, the proposed hotel should be viewed as a viable
opportunity.
Product Mix
For this hotel study, the product mix consists of three primary components:
rooms, restaurant and bar, and events. There no doubt could be more items added to
the mix like activities and equipment rentals to accommodate these activities, but for
the purpose of the financial analysis the previously mentioned categories make up the
mix. The product mix could further be complicated by additional depth to the mix.
For example, likely there will be different room options. Typically, a hotel has several
different types of rooms including King, Two Queens, Deluxe King, Honeymoon
King, King Suite, and possibly even a multi-bedroom suite. For a complete
breakdown of how the product mix is split reference the Revenue Summary chart on
page 29 of this report.
41
CONCLUSION
Project Limitations
In determining the potential feasibility of the proposed hotel, the lodging
market was analyzed, the subject area’s economics were researched, the estimated
acquisition and renovation costs were reviewed, and a 5-year forecast of income and
expense was developed from key assumptions in addition to a detailed review of the
current and historical market conditions, as well as comparable income and expense
statements.
The conclusion of this feasibility study indicates that a $5,500,000 property
investment and $2,500,000 renovation cost would be profitable in its third year of
operation. The analysis makes assumptions about the renovation costs that could
drastically change when a final property is settled upon, but the model is built to
allow for these assumptions to be changed to yield updated results. The analysis is
based on the assumption that the described improvements have been completed as of
the stated date of opening. This feasibility study does very little to address
unforeseeable events that could alter the proposed project, or the market conditions
reflected in the analyses. COVID-19 was not a factor at the start of this study and is
only discussed briefly within this report, but it is a great example of such an
“unforeseeable event”.
The COVID-19 pandemic has caused an immense amount of volatility to the
hospitality industry. As was seen in the occupancy trends of the competition chapter,
42
hotels were almost completely shut down through the months of May and June (and
even longer but data were not yet available). The industry is optimistic that once
things open back up fully, we will adjust to a new normal of heightened caution while
occupancy and rates return to pre-COVID levels, but it is difficult to assume or
project what this timeline will be or the accuracy of these views.
Next Steps
The primary next step would be to visit the subject property and do a full
analysis of the costs required for renovation. This is a very large limiting factor of the
project because there are many variables and added cost that could arise depending on
the condition of the property. An analysis should be completed with an architect and a
construction partner. Some conceptual designs should be discussed, and budgetary
quotes submitted. Only then can we begin to get a better idea what the renovation cost
estimates are actually going to be.
Secondly, we need to investigate further the various funding options available
for this project. While $7.5 million is not an excessively high amount for a hotel
project, it is a very high number for a private venture. We would suggest investigating
founding shareholder partners or other investment options that provide additional
capital to get the project off the ground.

REFERENCES
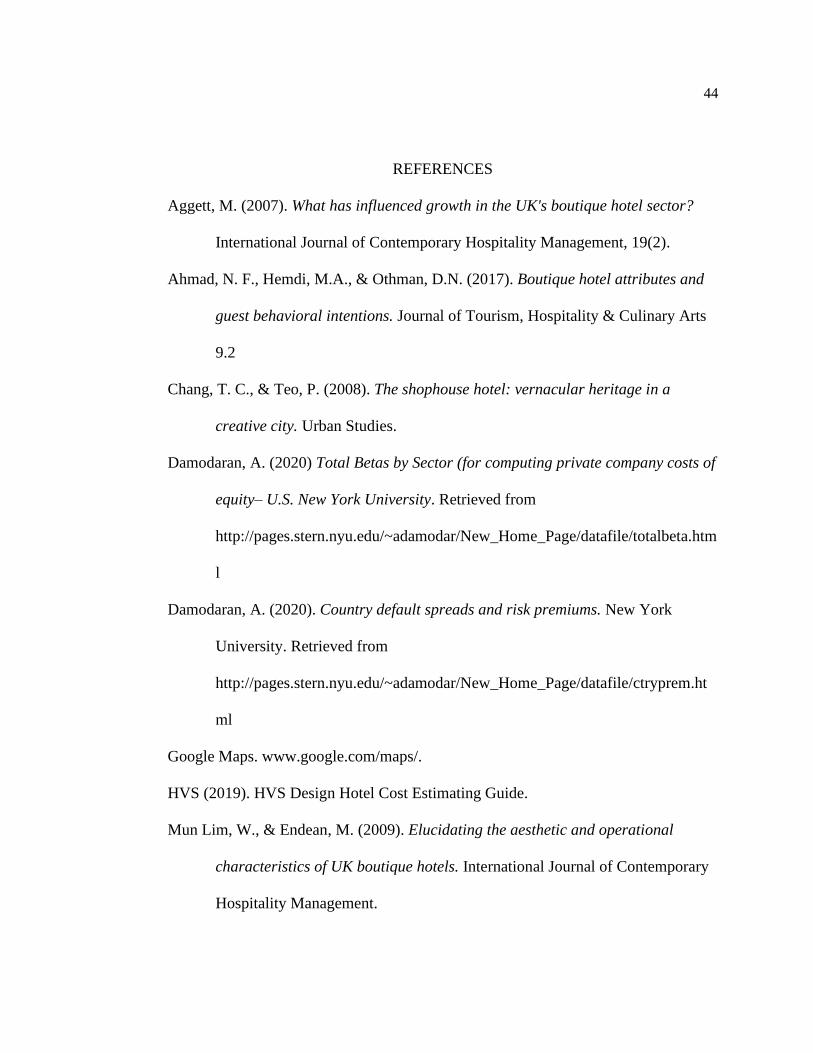
44
REFERENCES
Aggett, M. (2007). What has influenced growth in the UK's boutique hotel sector?
International Journal of Contemporary Hospitality Management, 19(2).
Ahmad, N. F., Hemdi, M.A., & Othman, D.N. (2017). Boutique hotel attributes and
guest behavioral intentions. Journal of Tourism, Hospitality & Culinary Arts
9.2
Chang, T. C., & Teo, P. (2008). The shophouse hotel: vernacular heritage in a
creative city. Urban Studies.
Damodaran, A. (2020) Total Betas by Sector (for computing private company costs of
equity– U.S. New York University. Retrieved from
http://pages.stern.nyu.edu/~adamodar/New_Home_Page/datafile/totalbeta.htm
l
Damodaran, A. (2020). Country default spreads and risk premiums. New York
University. Retrieved from
http://pages.stern.nyu.edu/~adamodar/New_Home_Page/datafile/ctryprem.ht
ml
Google Maps. www.google.com/maps/.
HVS (2019). HVS Design Hotel Cost Estimating Guide.
Mun Lim, W., & Endean, M. (2009). Elucidating the aesthetic and operational
characteristics of UK boutique hotels. International Journal of Contemporary
Hospitality Management.
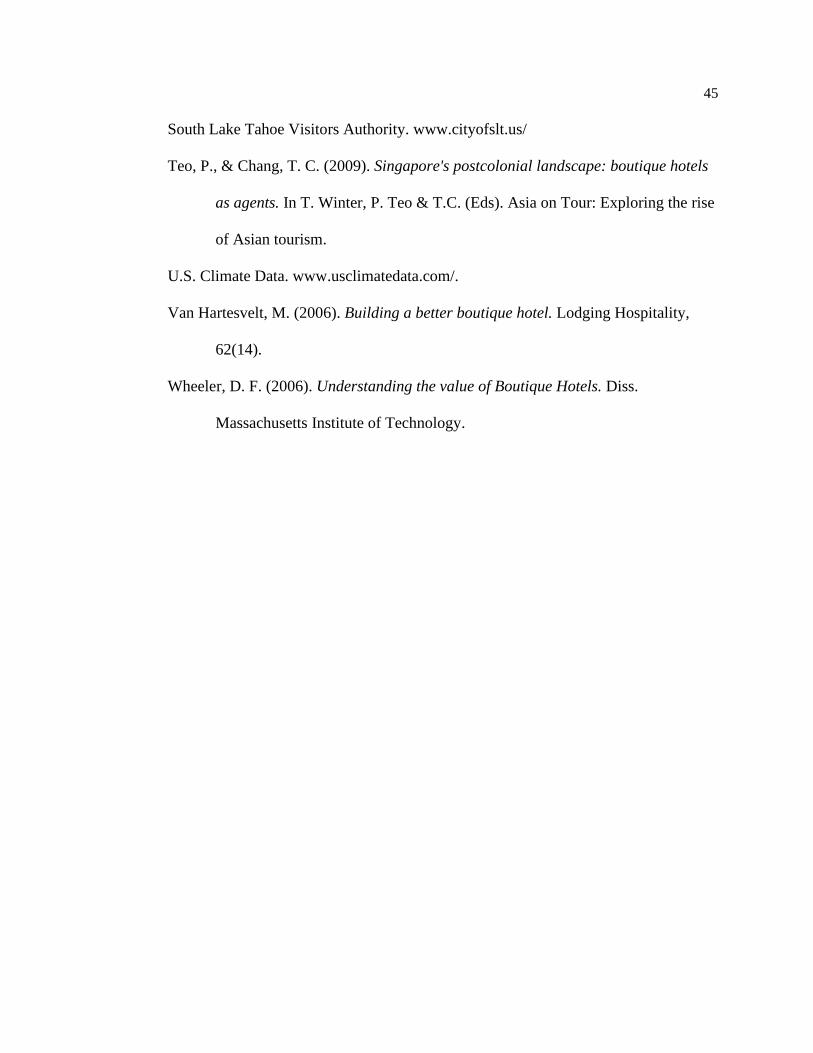
45
South Lake Tahoe Visitors Authority. www.cityofslt.us/
Teo, P., & Chang, T. C. (2009). Singapore's postcolonial landscape: boutique hotels
as agents. In T. Winter, P. Teo & T.C. (Eds). Asia on Tour: Exploring the rise
of Asian tourism.
U.S. Climate Data. www.usclimatedata.com/.
Van Hartesvelt, M. (2006). Building a better boutique hotel. Lodging Hospitality,
62(14).
Wheeler, D. F. (2006). Understanding the value of Boutique Hotels. Diss.
Massachusetts Institute of Technology.

APPENDICES
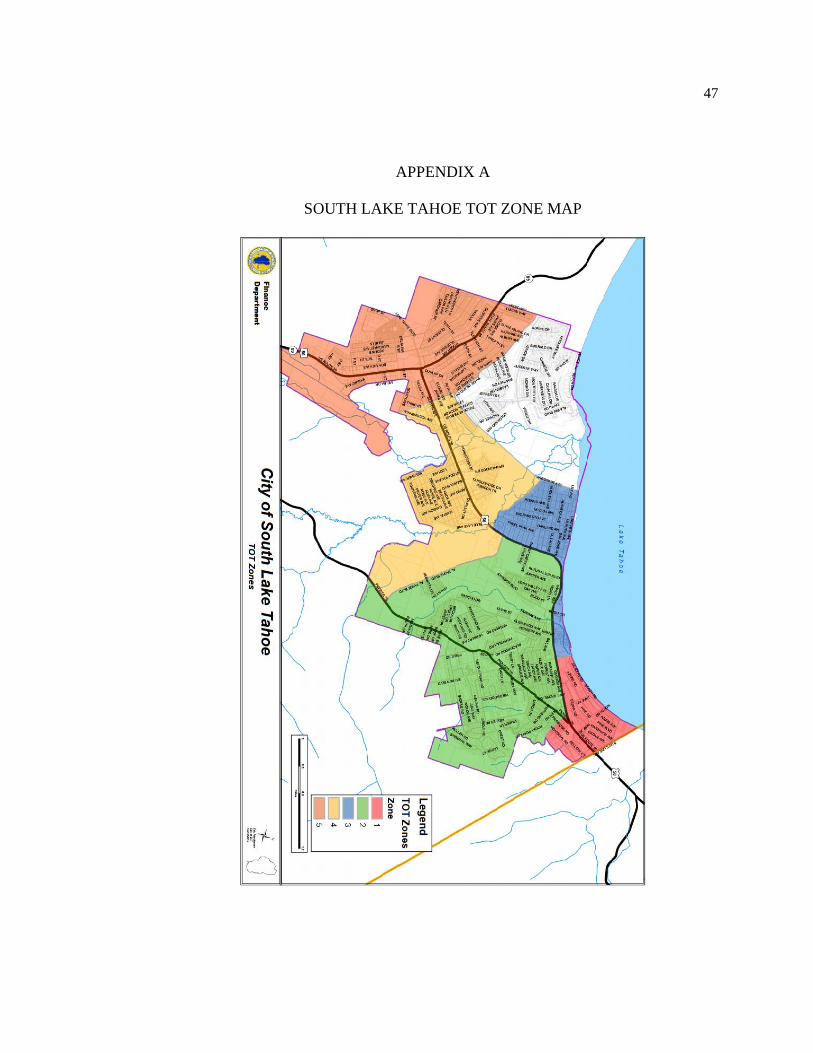
47
APPENDIX A
SOUTH LAKE TAHOE TOT ZONE MAP
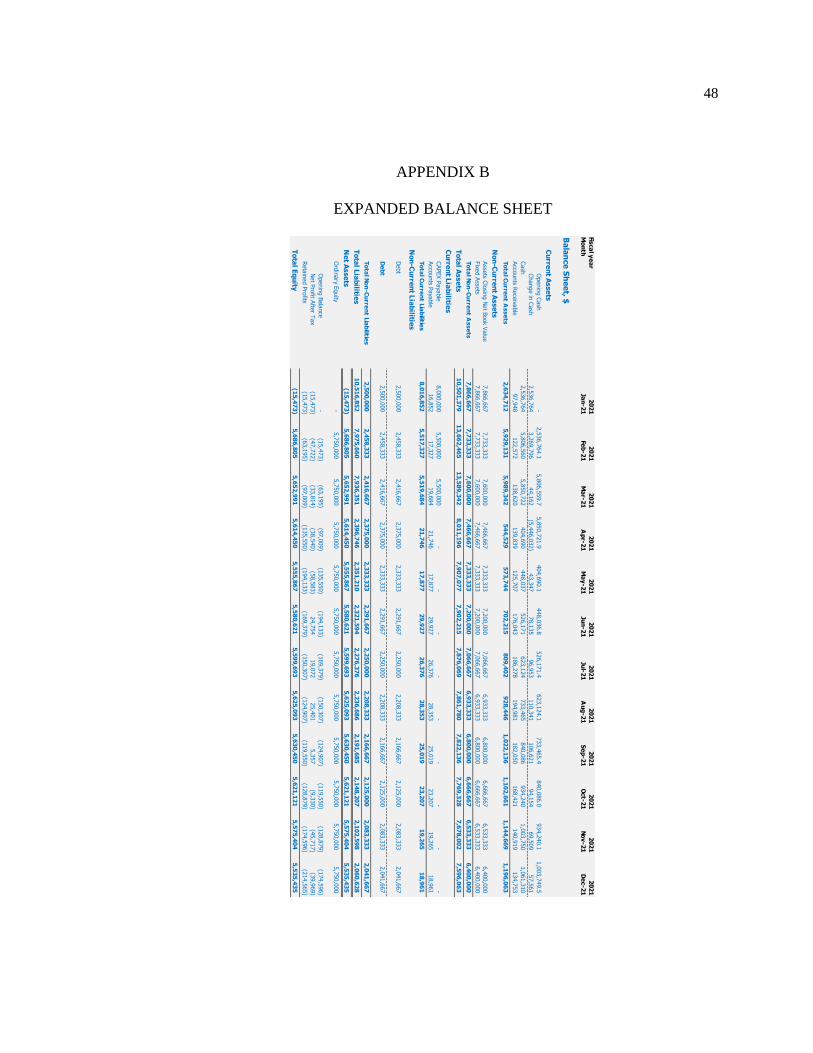
48
APPENDIX B
EXPANDED BALANCE SHEET
Fisca
l ye
ar
20
21
20
21
20
21
20
21
20
21
20
21
20
21
20
21
20
21
20
21
20
21
20
21
Mo
nth
Jan
-21
Feb
-21
Ma
r-21
Ap
r-21
Ma
y-2
1Ju
n-2
1Ju
l-21
Au
g-2
1S
ep
-21
Oct-2
1N
ov
-21
De
c-2
1
Ba
lan
ce
Sh
ee
t, $
Cu
rren
t Asse
ts
Openin
g C
ash
-2,5
36,7
64.1
5,8
06,5
59.7
5,8
50,7
21.9
404,6
90.1
448,0
36.8
526,1
71.4
623,1
24.1
733,4
65.4
840,0
86.0
934,2
40.1
1,0
03,7
49.5
Change in
Cash
2,5
36,7
64
3,2
69,7
96
44,1
62
(5,4
46,0
32)
43,3
47
78,1
35
96,9
53
110,3
41
106,6
21
94,1
54
69,5
09
57,5
61
Cash
2,5
36,7
64
5,8
06,5
60
5,8
50,7
22
404,6
90
448,0
37
526,1
71
623,1
24
733,4
65
840,0
86
934,2
40
1,0
03,7
50
1,0
61,3
10
Acco
unts R
ece
ivable
97,9
48
122,5
72
138,6
20
139,8
39
125,7
07
176,0
43
186,2
78
194,9
81
182,0
50
168,4
21
140,9
19
134,7
53
To
tal C
urre
nt A
sse
ts2
,63
4,7
12
5,9
29
,13
15
,98
9,3
42
54
4,5
29
57
3,7
44
70
2,2
15
80
9,4
02
92
8,4
46
1,0
22
,13
61
,10
2,6
61
1,1
44
,66
91
,19
6,0
63
No
n-C
urre
nt A
sse
ts
Asse
ts Clo
sing N
et B
ook V
alu
e7,8
66,6
67
7,7
33,3
33
7,6
00,0
00
7,4
66,6
67
7,3
33,3
33
7,2
00,0
00
7,0
66,6
67
6,9
33,3
33
6,8
00,0
00
6,6
66,6
67
6,5
33,3
33
6,4
00,0
00
Fixe
d A
ssets
7,8
66,6
67
7,7
33,3
33
7,6
00,0
00
7,4
66,6
67
7,3
33,3
33
7,2
00,0
00
7,0
66,6
67
6,9
33,3
33
6,8
00,0
00
6,6
66,6
67
6,5
33,3
33
6,4
00,0
00
To
tal N
on
-Cu
rren
t Asse
ts7
,86
6,6
67
7,7
33
,33
37
,60
0,0
00
7,4
66
,66
77
,33
3,3
33
7,2
00
,00
07
,06
6,6
67
6,9
33
,33
36
,80
0,0
00
6,6
66
,66
76
,53
3,3
33
6,4
00
,00
0
To
tal A
sse
ts1
0,5
01
,37
91
3,6
62
,46
51
3,5
89
,34
28
,01
1,1
96
7,9
07
,07
77
,90
2,2
15
7,8
76
,06
97
,86
1,7
80
7,8
22
,13
67
,76
9,3
28
7,6
78
,00
27
,59
6,0
63
Cu
rren
t Lia
bilitie
s
CAPEX P
aya
ble
8,0
00,0
00
5,5
00,0
00
5,5
00,0
00
--
--
--
--
-
Acco
unts P
aya
ble
16,8
52
17,3
27
19,6
84
21,7
46
17,8
77
29,9
27
26,3
76
28,3
53
25,0
19
23,2
07
19,2
65
18,9
61
To
tal C
urre
nt L
iab
ilities
8,0
16
,85
25
,51
7,3
27
5,5
19
,68
42
1,7
46
17
,87
72
9,9
27
26
,37
62
8,3
53
25
,01
92
3,2
07
19
,26
51
8,9
61
No
n-C
urre
nt L
iab
ilities
Debt
2,5
00,0
00
2,4
58,3
33
2,4
16,6
67
2,3
75,0
00
2,3
33,3
33
2,2
91,6
67
2,2
50,0
00
2,2
08,3
33
2,1
66,6
67
2,1
25,0
00
2,0
83,3
33
2,0
41,6
67
De
bt
2,5
00,0
00
2,4
58,3
33
2,4
16,6
67
2,3
75,0
00
2,3
33,3
33
2,2
91,6
67
2,2
50,0
00
2,2
08,3
33
2,1
66,6
67
2,1
25,0
00
2,0
83,3
33
2,0
41,6
67
To
tal N
on
-Cu
rren
t Lia
bilitie
s2
,50
0,0
00
2,4
58
,33
32
,41
6,6
67
2,3
75
,00
02
,33
3,3
33
2,2
91
,66
72
,25
0,0
00
2,2
08
,33
32
,16
6,6
67
2,1
25
,00
02
,08
3,3
33
2,0
41
,66
7
To
tal L
iab
ilities
10
,51
6,8
52
7,9
75
,66
07
,93
6,3
51
2,3
96
,74
62
,35
1,2
10
2,3
21
,59
42
,27
6,3
76
2,2
36
,68
62
,19
1,6
85
2,1
48
,20
72
,10
2,5
98
2,0
60
,62
8
Ne
t Asse
ts(1
5,4
73
)5
,68
6,8
05
5,6
52
,99
15
,61
4,4
50
5,5
55
,86
75
,58
0,6
21
5,5
99
,69
35
,62
5,0
93
5,6
30
,45
05
,62
1,1
21
5,5
75
,40
45
,53
5,4
35
Ord
inary E
quity
-5,7
50,0
00
5,7
50,0
00
5,7
50,0
00
5,7
50,0
00
5,7
50,0
00
5,7
50,0
00
5,7
50,0
00
5,7
50,0
00
5,7
50,0
00
5,7
50,0
00
5,7
50,0
00
Openin
g B
ala
nce
-(1
5,4
73)
(63,1
95)
(97,0
09)
(135,5
50)
(194,1
33)
(169,3
79)
(150,3
07)
(124,9
07)
(119,5
50)
(128,8
79)
(174,5
96)
Net P
rofit A
fter T
ax
(15,4
73)
(47,7
22)
(33,8
14)
(38,5
40)
(58,5
83)
24,7
54
19,0
72
25,4
01
5,3
57
(9,3
30)
(45,7
17)
(39,9
69)
Reta
ined P
rofits
(15,4
73)
(63,1
95)
(97,0
09)
(135,5
50)
(194,1
33)
(169,3
79)
(150,3
07)
(124,9
07)
(119,5
50)
(128,8
79)
(174,5
96)
(214,5
65)
To
tal E
qu
ity(1
5,4
73
)5
,68
6,8
05
5,6
52
,99
15
,61
4,4
50
5,5
55
,86
75
,58
0,6
21
5,5
99
,69
35
,62
5,0
93
5,6
30
,45
05
,62
1,1
21
5,5
75
,40
45
,53
5,4
35
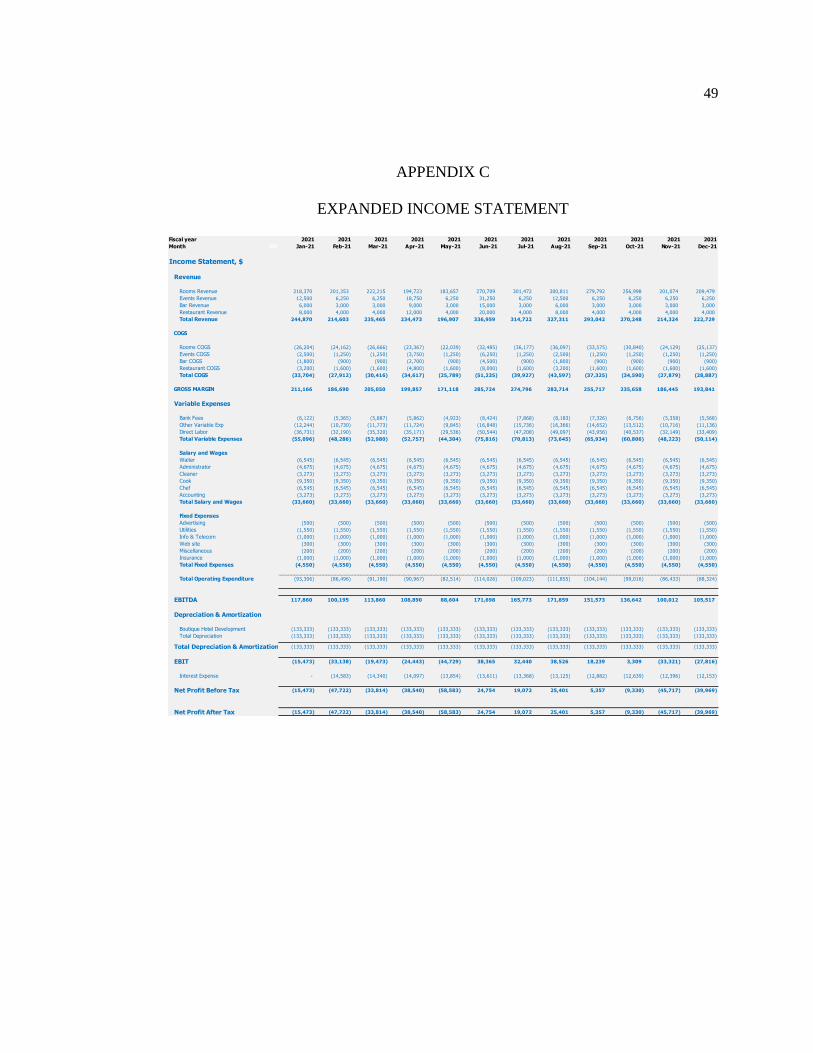
49
APPENDIX C
EXPANDED INCOME STATEMENT
Fiscal year 2021 2021 2021 2021 2021 2021 2021 2021 2021 2021 2021 2021
Month ## Jan-21 Feb-21 Mar-21 Apr-21 May-21 Jun-21 Jul-21 Aug-21 Sep-21 Oct-21 Nov-21 Dec-21
Income Statement, $
Revenue
Rooms Revenue 218,370 201,353 222,215 194,723 183,657 270,709 301,472 300,811 279,792 256,998 201,074 209,479
Events Revenue 12,500 6,250 6,250 18,750 6,250 31,250 6,250 12,500 6,250 6,250 6,250 6,250
Bar Revenue 6,000 3,000 3,000 9,000 3,000 15,000 3,000 6,000 3,000 3,000 3,000 3,000
Restaurant Revenue 8,000 4,000 4,000 12,000 4,000 20,000 4,000 8,000 4,000 4,000 4,000 4,000
Total Revenue 244,870 214,603 235,465 234,473 196,907 336,959 314,722 327,311 293,042 270,248 214,324 222,729
COGS
Rooms COGS (26,204) (24,162) (26,666) (23,367) (22,039) (32,485) (36,177) (36,097) (33,575) (30,840) (24,129) (25,137)
Events COGS (2,500) (1,250) (1,250) (3,750) (1,250) (6,250) (1,250) (2,500) (1,250) (1,250) (1,250) (1,250)
Bar COGS (1,800) (900) (900) (2,700) (900) (4,500) (900) (1,800) (900) (900) (900) (900)
Restaurant COGS (3,200) (1,600) (1,600) (4,800) (1,600) (8,000) (1,600) (3,200) (1,600) (1,600) (1,600) (1,600)
Total COGS (33,704) (27,912) (30,416) (34,617) (25,789) (51,235) (39,927) (43,597) (37,325) (34,590) (27,879) (28,887)
GROSS MARGIN 211,166 186,690 205,050 199,857 171,118 285,724 274,796 283,714 255,717 235,658 186,445 193,841
Variable Expenses
Bank Fees (6,122) (5,365) (5,887) (5,862) (4,923) (8,424) (7,868) (8,183) (7,326) (6,756) (5,358) (5,568)
Other Variable Exp (12,244) (10,730) (11,773) (11,724) (9,845) (16,848) (15,736) (16,366) (14,652) (13,512) (10,716) (11,136)
Direct Labor (36,731) (32,190) (35,320) (35,171) (29,536) (50,544) (47,208) (49,097) (43,956) (40,537) (32,149) (33,409)
Total Variable Expenses (55,096) (48,286) (52,980) (52,757) (44,304) (75,816) (70,813) (73,645) (65,934) (60,806) (48,223) (50,114)
Salary and Wages
Waiter (6,545) (6,545) (6,545) (6,545) (6,545) (6,545) (6,545) (6,545) (6,545) (6,545) (6,545) (6,545)
Administrator (4,675) (4,675) (4,675) (4,675) (4,675) (4,675) (4,675) (4,675) (4,675) (4,675) (4,675) (4,675)
Cleaner (3,273) (3,273) (3,273) (3,273) (3,273) (3,273) (3,273) (3,273) (3,273) (3,273) (3,273) (3,273)
Cook (9,350) (9,350) (9,350) (9,350) (9,350) (9,350) (9,350) (9,350) (9,350) (9,350) (9,350) (9,350)
Chef (6,545) (6,545) (6,545) (6,545) (6,545) (6,545) (6,545) (6,545) (6,545) (6,545) (6,545) (6,545)
Accounting (3,273) (3,273) (3,273) (3,273) (3,273) (3,273) (3,273) (3,273) (3,273) (3,273) (3,273) (3,273)
Total Salary and Wages (33,660) (33,660) (33,660) (33,660) (33,660) (33,660) (33,660) (33,660) (33,660) (33,660) (33,660) (33,660)
Fixed Expenses
Advertising (500) (500) (500) (500) (500) (500) (500) (500) (500) (500) (500) (500)
Utilities (1,550) (1,550) (1,550) (1,550) (1,550) (1,550) (1,550) (1,550) (1,550) (1,550) (1,550) (1,550)
Info & Telecom (1,000) (1,000) (1,000) (1,000) (1,000) (1,000) (1,000) (1,000) (1,000) (1,000) (1,000) (1,000)
Web site (300) (300) (300) (300) (300) (300) (300) (300) (300) (300) (300) (300)
Miscellaneous (200) (200) (200) (200) (200) (200) (200) (200) (200) (200) (200) (200)
Insurance (1,000) (1,000) (1,000) (1,000) (1,000) (1,000) (1,000) (1,000) (1,000) (1,000) (1,000) (1,000)
Total Fixed Expenses (4,550) (4,550) (4,550) (4,550) (4,550) (4,550) (4,550) (4,550) (4,550) (4,550) (4,550) (4,550)
Total Operating Expenditure (93,306) (86,496) (91,190) (90,967) (82,514) (114,026) (109,023) (111,855) (104,144) (99,016) (86,433) (88,324)
EBITDA 117,860 100,195 113,860 108,890 88,604 171,698 165,773 171,859 151,573 136,642 100,012 105,517
Depreciation & Amortization
Boutique Hotel Development (133,333) (133,333) (133,333) (133,333) (133,333) (133,333) (133,333) (133,333) (133,333) (133,333) (133,333) (133,333)
Total Depreciation (133,333) (133,333) (133,333) (133,333) (133,333) (133,333) (133,333) (133,333) (133,333) (133,333) (133,333) (133,333)
Total Depreciation & Amortization (133,333) (133,333) (133,333) (133,333) (133,333) (133,333) (133,333) (133,333) (133,333) (133,333) (133,333) (133,333)
EBIT (15,473) (33,138) (19,473) (24,443) (44,729) 38,365 32,440 38,526 18,239 3,309 (33,321) (27,816)
Interest Expense - (14,583) (14,340) (14,097) (13,854) (13,611) (13,368) (13,125) (12,882) (12,639) (12,396) (12,153)
Net Profit Before Tax (15,473) (47,722) (33,814) (38,540) (58,583) 24,754 19,072 25,401 5,357 (9,330) (45,717) (39,969)
Net Profit After Tax (15,473) (47,722) (33,814) (38,540) (58,583) 24,754 19,072 25,401 5,357 (9,330) (45,717) (39,969)
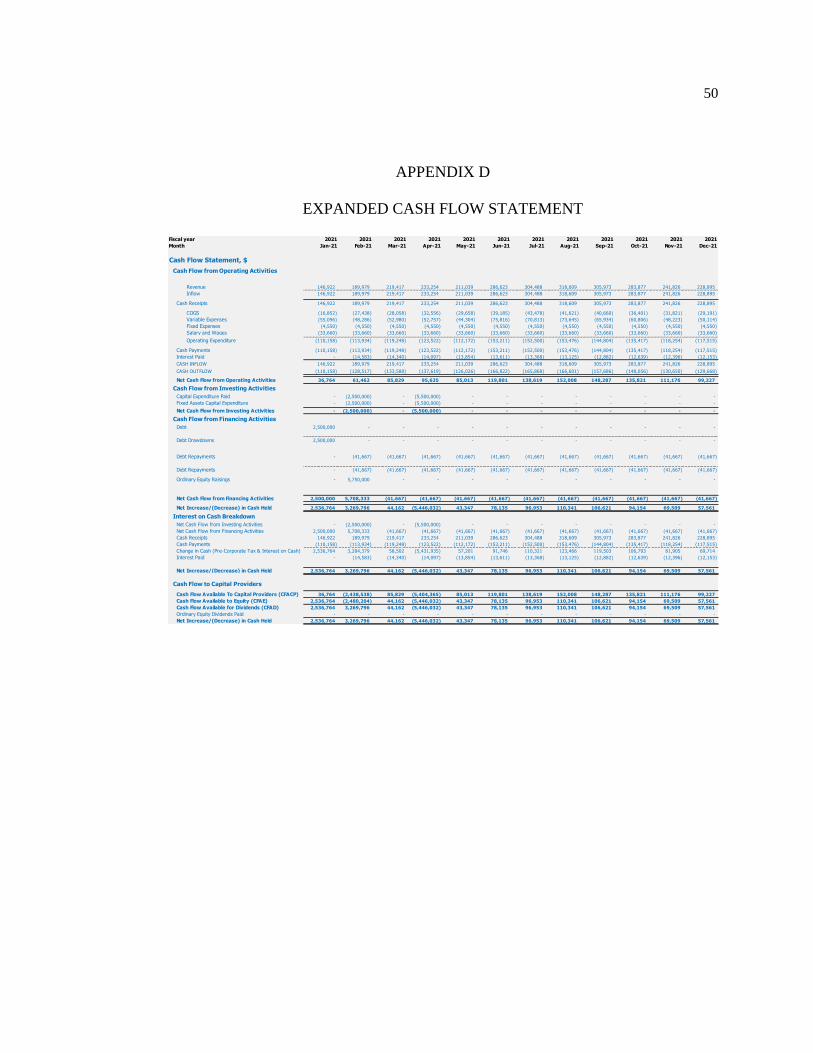
50
APPENDIX D
EXPANDED CASH FLOW STATEMENT
Fiscal year 2021 2021 2021 2021 2021 2021 2021 2021 2021 2021 2021 2021
Month Jan-21 Feb-21 Mar-21 Apr-21 May-21 Jun-21 Jul-21 Aug-21 Sep-21 Oct-21 Nov-21 Dec-21
Cash Flow Statement, $
Cash Flow from Operating Activities
Revenue 146,922 189,979 219,417 233,254 211,039 286,623 304,488 318,609 305,973 283,877 241,826 228,895
Inflow 146,922 189,979 219,417 233,254 211,039 286,623 304,488 318,609 305,973 283,877 241,826 228,895
Cash Receipts 146,922 189,979 219,417 233,254 211,039 286,623 304,488 318,609 305,973 283,877 241,826 228,895
COGS (16,852) (27,438) (28,058) (32,556) (29,658) (39,185) (43,478) (41,621) (40,660) (36,401) (31,821) (29,191)
Variable Expenses (55,096) (48,286) (52,980) (52,757) (44,304) (75,816) (70,813) (73,645) (65,934) (60,806) (48,223) (50,114)
Fixed Expenses (4,550) (4,550) (4,550) (4,550) (4,550) (4,550) (4,550) (4,550) (4,550) (4,550) (4,550) (4,550)
Salary and Wages (33,660) (33,660) (33,660) (33,660) (33,660) (33,660) (33,660) (33,660) (33,660) (33,660) (33,660) (33,660)
Operating Expenditure (110,158) (113,934) (119,248) (123,522) (112,172) (153,211) (152,500) (153,476) (144,804) (135,417) (118,254) (117,515)
Cash Payments (110,158) (113,934) (119,248) (123,522) (112,172) (153,211) (152,500) (153,476) (144,804) (135,417) (118,254) (117,515)
Interest Paid - (14,583) (14,340) (14,097) (13,854) (13,611) (13,368) (13,125) (12,882) (12,639) (12,396) (12,153)
CASH INFLOW 146,922 189,979 219,417 233,254 211,039 286,623 304,488 318,609 305,973 283,877 241,826 228,895
CASH OUTFLOW (110,158) (128,517) (133,588) (137,619) (126,026) (166,822) (165,868) (166,601) (157,686) (148,056) (130,650) (129,668)
Net Cash Flow from Operating Activities 36,764 61,462 85,829 95,635 85,013 119,801 138,619 152,008 148,287 135,821 111,176 99,227
Cash Flow from Investing Activities
Capital Expenditure Paid - (2,500,000) - (5,500,000) - - - - - - - -
Fixed Assets Capital Expenditure - (2,500,000) - (5,500,000) - - - - - - - -
Net Cash Flow from Investing Activities - (2,500,000) - (5,500,000) - - - - - - - -
Cash Flow from Financing Activities
Debt 2,500,000 - - - - - - - - - - -
Debt Drawdowns 2,500,000 - - - - - - - - - - -
Debt Repayments - (41,667) (41,667) (41,667) (41,667) (41,667) (41,667) (41,667) (41,667) (41,667) (41,667) (41,667)
Debt Repayments - (41,667) (41,667) (41,667) (41,667) (41,667) (41,667) (41,667) (41,667) (41,667) (41,667) (41,667)
Ordinary Equity Raisings - 5,750,000 - - - - - - - - - -
Net Cash Flow from Financing Activities 2,500,000 5,708,333 (41,667) (41,667) (41,667) (41,667) (41,667) (41,667) (41,667) (41,667) (41,667) (41,667)
Net Increase/(Decrease) in Cash Held 2,536,764 3,269,796 44,162 (5,446,032) 43,347 78,135 96,953 110,341 106,621 94,154 69,509 57,561
Interest on Cash Breakdown
Net Cash Flow from Investing Activities - (2,500,000) - (5,500,000) - - - - - - - -
Net Cash Flow from Financing Activities 2,500,000 5,708,333 (41,667) (41,667) (41,667) (41,667) (41,667) (41,667) (41,667) (41,667) (41,667) (41,667)
Cash Receipts 146,922 189,979 219,417 233,254 211,039 286,623 304,488 318,609 305,973 283,877 241,826 228,895
Cash Payments (110,158) (113,934) (119,248) (123,522) (112,172) (153,211) (152,500) (153,476) (144,804) (135,417) (118,254) (117,515)
Change in Cash (Pre-Corporate Tax & Interest on Cash) 2,536,764 3,284,379 58,502 (5,431,935) 57,201 91,746 110,321 123,466 119,503 106,793 81,905 69,714
Interest Paid - (14,583) (14,340) (14,097) (13,854) (13,611) (13,368) (13,125) (12,882) (12,639) (12,396) (12,153)
Net Increase/(Decrease) in Cash Held 2,536,764 3,269,796 44,162 (5,446,032) 43,347 78,135 96,953 110,341 106,621 94,154 69,509 57,561
Cash Flow to Capital Providers
Cash Flow Available To Capital Providers (CFACP) 36,764 (2,438,538) 85,829 (5,404,365) 85,013 119,801 138,619 152,008 148,287 135,821 111,176 99,227
Cash Flow Available to Equity (CFAE) 2,536,764 (2,480,204) 44,162 (5,446,032) 43,347 78,135 96,953 110,341 106,621 94,154 69,509 57,561
Cash Flow Available for Dividends (CFAD) 2,536,764 3,269,796 44,162 (5,446,032) 43,347 78,135 96,953 110,341 106,621 94,154 69,509 57,561
Ordinary Equity Dividends Paid - - - - - - - - - - - -
Net Increase/(Decrease) in Cash Held 2,536,764 3,269,796 44,162 (5,446,032) 43,347 78,135 96,953 110,341 106,621 94,154 69,509 57,561
Related Documents