FEASIBILITY STUDY Proposed Extended- StayHotel MARICOPA, ARIZONA SUBMITTED TO:Ms. Denyse Airheart 39700 W Civic Center Plaza Maricopa, Arizona, 85239 +1 (520) 316-6992 PREPARED BY: HVS Consulting & Valuation Division of TS Worldwide, LLC 221 East Indianola Avenue Phoenix, Arizona, 85012 +1 (608) 658-0587 February-2018

Welcome message from author
This document is posted to help you gain knowledge. Please leave a comment to let me know what you think about it! Share it to your friends and learn new things together.
Transcript

FEASIBILITY STUDY
ProposedExtended-StayHotel MARICOPA, ARIZONA
SUBMITTED TO:PR OPOSED
Ms. Denyse Airheart 39700 W Civic Center Plaza Maricopa, Arizona, 85239 +1 (520) 316-6992
PREPARED BY:
HVS Consulting & Valuation Division of TS Worldwide, LLC 221 East Indianola Avenue Phoenix, Arizona, 85012 +1 (608) 658-0587
February-2018

March 2, 2018 Ms. Denyse Airheart 39700 W Civic Center Plaza Maricopa, Arizona, 85239
Re: Proposed Extended-Stay Hotel Maricopa, Arizona HVS Reference: 2017022183
Dear Ms. Airheart: Pursuant to your request, we herewith submit our feasibility study pertaining to the above-captioned property. We have inspected the real estate and analyzed the hotel market conditions in the Maricopa, Arizona area. We have studied the proposed project, and the results of our fieldwork and analysis are presented in this report. We have also reviewed the proposed improvements for this site. Our report was prepared in accordance with the Uniform Standards of Professional Appraisal Practice (USPAP), as provided by the Appraisal Foundation. We hereby certify that we have no undisclosed interest in the property, and our employment and compensation are not contingent upon our findings. This study is subject to the comments made throughout this report and to all assumptions and limiting conditions set forth herein.
Sincerely, TS Worldwide, LLC
Ryan Wall, Director [email protected], +1 (608) 658-0587 State Appraiser License (AZ) 32100
HVS PHOENIX - LOS ANGELES OFFICE
221 East Indianaola Avenue Phoenix, Arizona, 85012 +1 (608) 658-0587 +1 (415) 896-0516 FAX
www.hvs.com
Superior results through unrivaled hospitality intelligence. Everywhere.

Table of Contents
SECTION TITLE PAGE
1. Executive Summary 1 Ownership, Franchise, and Management Assumptions 1 Summary of Hotel Market Trends 2 Summary of Forecast Occupancy and Average Rate 6 Summary of Forecast Income and Expense Statement 6 Feasibility Conclusion 9
2. Description of the Site and Neighborhood 12 Physical Characteristics 12 Access and Visibility 13 Airport Access 15 Neighborhood 15 Flood Zone 17 Zoning 19
3. Market Area Analysis 20 Workforce Characteristics 24 Radial Demographic Snapshot 28 Unemployment Statistics 30 Major Business and Industry 31 Office Space Statistics 34 Convention Activity 34 Airport Traffic 37 Tourist Attractions 39
4. Supply and Demand Analysis 46 Definition of Subject Hotel Market 46 National Trends Overview 46 Historical Supply and Demand Data 50 Seasonality 53

Patterns of Demand 56 Primary Competition 59 Secondary Competitors 68 Supply Changes 70 Demand Analysis Using Market Segmentation 71 Base Demand Growth Rates 73 Latent Demand 74 Accommodated Demand and Market-wide Occupancy 76
5. Description of the Proposed Improvements 78 Project Overview 78 Summary of the Facilities 81 Site Improvements and Hotel Structure 82 Public Areas 83 Guestrooms 85 Construction Budget 88 Conclusion 88
6. Projection of Occupancy and Average Rate 89 Historical Penetration Rates by Market Segment 89 Forecast of Subject Property’s Occupancy 90 Average Rate Analysis 93 Competitive Position 93
7. Projection of Income and Expense 99 Comparable Operating Statements 99 Forecast of Revenue and Expense 103 Rooms Revenue 106 Other Operated Departments Revenue 106 Miscellaneous Income 106 Rooms Expense 107 Other Operated Departments Expense 107 Administrative and General Expense 108 Information and Telecommunications Systems Expense 108
Marketing Expense 108 Franchise Fee 109 Property Operations and Maintenance 109 Utilities Expense 110 Management Fee 111 Property Taxes 111 Insurance Expense 115 Reserve for Replacement 115 Forecast of Revenue and Expense Conclusion 116
8. Feasibility Analysis 117 Construction Cost Estimate 117 Mortgage Component 118 Equity Component 120 Terminal Capitalization Rate 123 Mortgage-Equity Method 125 Conclusion 127
9. Statement of Assumptions and Limiting Conditions 129 10. Certification 132
Addenda
Qualifications Copy of Appraisal License(s)
Flood Zone Map with Base Flood Elevation Determinations

February-2018 Executive Summary Proposed Extended-Stay Hotel – Maricopa, Arizona 1
1. Executive Summary
We have analyzed the potential performance for a nationally branded, extended-stay hotel that is anticipated to be located along the State Route 347 corridor in Maricopa, Arizona. The property, which is expected to open on July 1, 2020, is recommended to feature 100 rooms, a breakfast dining area, 450 square feet of meeting space, an outdoor pool and whirlpool, a fitness room, a lobby workstation, a market pantry, a guest laundry room, and an outdoor patio and barbecue area. The hotel should also contain the appropriate parking capacity (surface) and all necessary back-of-the-house space. The Maricopa market area does not contain any non-casino, overnight lodging accommodations. Although primarily a residential community, greater Maricopa is home to automotive proving grounds, a USDA research facility, a first-class event center, top recreational facilities, and a growing retail/restaurant sector, including the soon-to-be-completed Edison Pointe shopping complex. While a particular brand has yet to be determined for the proposed subject property, our study assumes that the proposed subject hotel will operate as a nationally branded, upper-midscale to upscale, extended-stay hotel. This hotel is expected to enjoy a location along State Route 347, a major thoroughfare connecting Maricopa to the greater Phoenix region and Pinal County. The subject site’s location is anticipated to be along the State Route 347 corridor in Maricopa, Arizona. The effective date of the report is March 2, 2018. The subject market and select prospective sites were inspected by Ryan M. Wall on November 30, 2017. We note that a specific site for hotel development in the City of Maricopa has not been selected at this time. Several available sites exist along State Route 347 and are considered suitable for hotel development, including a city-owned site next to the Copper Sky Recreational Complex. The forecast and assumptions outlined in this report assume that the proposed hotel will be located favorably within the State Route 347 corridor, which offers easy access to transportation linkages, ancillary commercial uses (retail, restaurant, and entertainment), and demand generators in/around the City of Maricopa. Any deviation from these site assumptions could potentially alter the feasibility of this project; however, additional analysis would be required to confirm. Details pertaining to management terms were not yet determined at the time of this report; however, we assume that the proposed hotel will be managed by a professional hotel-operating company, with fees deducted at rates consistent with
Subject of the Feasibility Study
Pertinent Dates
Ownership, Franchise, and Management Assumptions

February-2018 Executive Summary Proposed Extended-Stay Hotel – Maricopa, Arizona 2
current market standards. We have assumed a market-appropriate total management fee of 3.0% of total revenues in our study. We recommend that the proposed subject property operate as an upper-midscale to upscale, extended-stay hotel. While we have placed heavy consideration on the Home2 Suites by Hilton, Staybridge Suites, and TownePlace Suites by Marriott brands, a specific franchise affiliation and/or brand has yet to be finalized. Our projections reflect a nationally branded, upper-midscale to upscale, extended-stay hotel. Based on our review of the agreement’s terms or expected terms, a typical franchise fee for the aforementioned brands is reflected in our forecasts with a royalty fee of 5.0% of rooms revenue, and a marketing assessment of 3.0% of rooms revenue. Following the Great Recession, RevPAR rose 18.0% in 2011, as increased economic activity along Chandler's nearby Price Road Corridor allowed the greater Chandler submarket to recover at a quicker pace than the rest of region that year. Nonetheless, the majority of the selected competitive set is located along the Interstate 10 Corridor in Chandler, set back from the main concentration of commercial demand in the Price Road Corridor. We note that hotels along the Interstate 10 Corridor in Chandler have historically received compression-related room nights during peak periods of demand given the proximity. However, increased commercial demand along the Price Road Corridor from 2012 through 2014 led to increases in new, non-competitive hotel supply that limited the number of compression-related room nights received for the competitive set. This dynamic led to minimal overall RevPAR growth from 2012 through 2014 for the competitive hotels. In 2015, increased demand associated with Super Bowl XLIX in Phoenix helped area hotels to achieve strong average rate (ADR) growth. However, stronger demand growth, coinciding with improvements in the local and state economies, was not enough to offset the modest post-Super Bowl ADR correction and the openings of the Home2 Suites by Hilton and Best Western Plus in 2016. Strong demand growth continued in the year-to-date 2017 period, with the market realizing a 5.6% increase in overall RevPAR. We note that several of the competitive hotels along the Interstate 10 Corridor in Chandler are older structures that feature dated interiors in some instances. Therefore, these hotels have realized modest ADR erosion in the year-to-date period as they seek to provide a more cost-effective alternative to newer hotels opening in the greater Chandler market. The outlook for this market is cautiously optimistic, despite a large amount of new supply, given major office developments and expansions of high-technology firms, such as Intel and Orbital ATK. The following table provides a historical perspective on the supply and demand trends for a selected set of hotels, as provided by STR.
Summary of Hotel Market Trends

February-2018 Executive Summary Proposed Extended-Stay Hotel – Maricopa, Arizona 3
FIGURE 1-1 HISTORICAL SUPPLY AND DEMAND TRENDS (STR)
YearAverage Daily Room Count
Available Room Nights Change
Occupied Room Nights Change Occupancy
Average Rate Change RevPAR Change
2007 597 217,905 — 161,938 — 74.3 % $108.13 — $80.36 — 2008 597 217,905 0.0 % 141,656 (12.5) % 65.0 112.83 4.3 % 73.35 (8.7) %2009 597 217,905 0.0 115,541 (18.4) 53.0 94.67 (16.1) 50.20 (31.6)2010 597 217,905 0.0 121,624 5.3 55.8 84.30 (10.9) 47.05 (6.3)2011 597 217,905 0.0 139,112 14.4 63.8 86.99 3.2 55.54 18.02012 597 217,905 0.0 129,892 (6.6) 59.6 91.13 4.8 54.32 (2.2)2013 596 217,540 (0.2) 135,871 4.6 62.5 91.71 0.6 57.28 5.42014 596 217,540 0.0 133,929 (1.4) 61.6 93.26 1.7 57.41 0.22015 596 217,540 0.0 135,036 0.8 62.1 100.37 7.6 62.31 8.52016 696 254,035 16.8 157,201 16.4 61.9 99.15 (1.2) 61.35 (1.5)
Year-to-Date Through November2016 685 228,956 — 141,768 — 61.9 % $100.54 — $62.26 — 2017 809 270,206 18.0 % 179,329 26.5 % 66.4 99.10 (1.4) % 65.77 5.6 %
Average Annua l Compounded Change:2007 - 2010 0.0 % (9.1) % (8.0) % (16.3) %2010 - 2016 2.6 4.4 2.7 4.5
Hotels Included in Sample
Fa irfie ld Inn & Suites Phoenix Chandl er Upper Mids ca le Cla s s Primary 64 Dec 1995 Dec 1995Hampton Inn Phoenix Chandler Upper Mids ca le Cla s s Primary 101 Ma y 1997 Ma y 1997Homewood Suites Phoenix Chandler Upsca le Cla s s Primary 83 Apr 1998 Apr 1998La Quinta Inns & Sui tes Phoenix Chandler Mids cale Cla ss Secondary 117 Jun 1998 Jun 1998Hol iday Inn Expres s & Sui tes Phoenix Cha ndler Upper Mids ca le Cla s s Primary 125 Oct 1998 Oct 1998Hol iday Inn & Suites Phoeni x Chandl er Upper Mids ca le Cla s s Secondary 106 Mar 2004 Ma r 2004Home2 Suites Phoenix Chandler Upper Mids ca le Cla s s Primary 126 Jul 2016 Jul 2016Bes t Western Plus Chandler Hotel & Suites Upper Mids ca le Cla s s Secondary 87 Aug 2016 Aug 2016
Total 809
Source: STR
ClassNumber
of RoomsYear
OpenedCompetitive Year
Status Affiliated
The following tables reflect our estimates of operating data for hotels on an individual basis. These trends are presented in detail in the Supply and Demand Analysis chapter of this report.

February-2018 Executive Summary Proposed Extended-Stay Hotel – Maricopa, Arizona 4
FIGURE 1-2 PRIMARY COMPETITORS – OPERATING PERFORMANCE
Est. Segmentation Estimated 2015 Estimated 2016
Property Occ. RevPAR RevPAROccupancy Penetration
Yield Penetration
Homewood Sui tes by Hi l ton Phoenix Chandler 83 35 % 40 % 20 % 5 % 83 65 - 70 % $115 - $120 $75 - $80 83 70 - 75 % $115 - $120 $80 - $85 110 - 120 % 110 - 120 %
Home2 Sui tes by Hi l ton Phoenix Chandler 126 50 30 15 5 0 — — — 73 40 - 45 95 - 100 40 - 45 70 - 75 55 - 60
Hampton Inn Phoenix Chandler 101 15 50 25 10 101 65 - 70 105 - 110 65 - 70 101 65 - 70 105 - 110 70 - 75 100 - 110 100 - 110
Fa i rfie ld Inn by Marriott Phoenix Chandler 64 15 50 25 10 64 60 - 65 90 - 95 55 - 60 64 60 - 65 90 - 95 55 - 60 100 - 110 80 - 85
Hol iday Inn Express Hotel & Sui tes Phoenix Chandler
125 15 50 25 10 125 60 - 65 90 - 95 60 - 65 125 60 - 65 90 - 95 55 - 60 100 - 110 80 - 85
Sub-Totals/Averages 499 28 % 43 % 21 % 8 % 373 65.6 % $101.97 $66.89 446 62.9 % $101.24 $63.73 101.1 % 90.8 %
Secondary Competi tors 810 7 % 26 % 36 % 30 % 428 60.0 % $129.57 $77.78 475 61.6 % $123.80 $76.30 99.0 % 108.7 %
Totals/Averages 1,309 18 % 35 % 28 % 19 % 801 62.6 % $116.12 $72.71 921 62.3 % $112.75 $70.21 100.0 % 100.0 %
* Specific occupancy and average rate data were utilized in our analysis, but are presented in ranges in the above table for the purposes of confidentiality.
Weighted Annual Room Count
Weighted Annual Room Count Average RateEx
tend
ed-S
tay
Com
mer
cial
Leisu
re
Grou
pNumber of Rooms Average Rate Occ.

February-2018 Executive Summary Proposed Extended-Stay Hotel – Maricopa, Arizona 5
FIGURE 1-3 SECONDARY COMPETITORS – OPERATING PERFORMANCE
Est. Segmentation Estimated 2015 Estimated 2016
Weighted Weighted
Exte
nded
-Sta
y
Com
mer
cial
PropertyNumber of
Rooms Occ. Average Rate RevPAR Occ. Average Rate RevPAR
Best Western Pl us Chandler Hotel & Suites 87 10 % 45 % 35 % 10 % 80 % 0 — % — — 46 60 - 65 % $85 - $90 $50 - $55
La Quinta Inn & Suites Phoeni x Chandl er 117 10 40 40 10 80 94 60 - 65 80 - 85 50 - 55 94 60 - 65 80 - 85 50 - 55
Hol iday Inn & Suites Phoeni x Chandl er 106 10 30 55 5 80 85 45 - 50 115 - 120 55 - 60 85 55 - 60 115 - 120 65 - 70
Sheraton Wi l d Horse Pass Resort & Spa 500 5 15 30 50 50 250 60 - 65 150 - 160 90 - 95 250 60 - 65 140 - 150 90 - 95
Totals/Averages 810 7 % 26 % 36 % 30 % 61 % 428 60.0 % $129.57 $77.78 475 61.6 % $123.80 $76.30
* Specific occupancy and average rate data was utilized in our analysis, but is presented in ranges in the above table for the purposes of confidentiality.
Grou
p
Total Competitive
Level
Weighted Annual Room Count
Weighted Annual Room CountLe
isure
Exte
nded
-Sta
y
Com
mer
cial

February-2018 Executive Summary Proposed Extended-Stay Hotel – Maricopa, Arizona 6
Based on our analysis presented in the Projection of Occupancy and Average Rate chapter, we have chosen to use a stabilized occupancy level of 70% and a base-year rate position of $103.00 for the proposed subject hotel. The following table reflects a summary of our market-wide and proposed subject hotel occupancy and average rate projections.
FIGURE 1-4 MARKET AND SUBJECT PROPERTY AVERAGE RATE FORECAST
Calendar Year 2017 2018 2019 2020 2021 2022 2023 2024 2025
Market ADR $110.84 $111.94 $114.18 $117.61 $121.14 $124.77 $128.51 $132.37 $136.34Projected Ma rket ADR Growth Ra te — 1.0% 2.0% 3.0% 3.0% 3.0% 3.0% 3.0% 3.0%
Proposed Subject Property ADR (As-If Stabi l ized) $103.00 $104.03 $106.11 $109.29 $112.57 $115.95 $119.43 $123.01 $126.70ADR Growth Rate — 1.0% 2.0% 3.0% 3.0% 3.0% 3.0% 3.0% 3.0%
Proposed Subject Stabi l ized ADR Penetra tion 93% 93% 93% 93% 93% 93% 93% 93% 92.9%
Fiscal Year 2020/21 2021/22 2022/23 2023/24 2024/25 2025/26
Proposed Subject Property Average Ra te $110.92 $114.25 $117.67 $121.21 $124.84 $128.59Opening Discount 2.0% 1.0% 0.0% 0.0% 0.0% 0.0%
Average Rate After Discount $108.70 $114.25 $117.67 $121.21 $124.84 $128.59
Real Avera ge Ra te Growth — 5.1% 3.0% 3.0% 3.0% 3.0%
Market ADR $119.36 $122.94 $126.63 $130.43 $134.34 $138.37Proposed Subject ADR Penetra tion (After Discount) 91% 93% 93% 93% 93% 93%
ADR Expressed in Ba se-Year Dol lars Deflated @ Inflation Rate $100.45 $102.50 $102.50 $102.50 $102.50 $102.50
Our positioning of each revenue and expense level is supported by comparable operations or trends specific to this market. Our forecast of income and expense is presented in the following table.
Summary of Forecast Occupancy and Average Rate
Summary of Forecast Income and Expense Statement

February-2018 Executive Summary Proposed Extended-Stay Hotel – Maricopa, Arizona 7
FIGURE 1-5 DETAILED FORECAST OF INCOME AND EXPENSE
2020/21 Begins July 2021/22 Stabilized 2023/24 2024/25
Number of Rooms: 100 100 100 100 100Occupancy: 62% 67% 70% 70% 70%Average Rate: $108.70 $114.25 $117.67 $121.21 $124.84RevPAR: $67.39 $76.55 $82.37 $84.84 $87.39Days Open: 365 365 365 365 365Occupied Rooms: 22,630 %Gross PAR POR 24,455 %Gross PAR POR 25,550 %Gross PAR POR 25,550 %Gross PAR POR 25,550 %Gross PAR POR OPERATING REVENUERooms $2,460 97.6 % $24,600 $108.71 $2,794 97.8 % $27,940 $114.25 $3,007 97.8 % $30,070 $117.69 $3,097 97.8 % $30,970 $121.21 $3,190 97.8 % $31,900 $124.85Other Operated Departments 34 1.3 339 1.50 36 1.2 357 1.46 37 1.2 372 1.46 38 1.2 383 1.50 39 1.2 395 1.55Miscellaneous Income 27 1.1 271 1.20 29 1.0 285 1.17 30 1.0 298 1.17 31 1.0 307 1.20 32 1.0 316 1.24 Total Operating Revenues 2,521 100.0 25,210 111.40 2,858 100.0 28,582 116.88 3,074 100.0 30,740 120.31 3,166 100.0 31,660 123.91 3,261 100.0 32,611 127.63DEPARTMENTAL EXPENSES *Rooms 568 23.1 5,679 25.10 602 21.6 6,025 24.64 631 21.0 6,314 24.71 650 21.0 6,503 25.45 670 21.0 6,698 26.22Other Operated Departments 30 87.1 295 1.30 31 85.8 306 1.25 32 85.0 316 1.24 33 85.0 326 1.28 34 85.0 336 1.31 Total Expenses 597 23.7 5,974 26.40 633 22.1 6,331 25.89 663 21.6 6,630 25.95 683 21.6 6,829 26.73 703 21.6 7,034 27.53DEPARTMENTAL INCOME 1,924 76.3 19,235 85.00 2,225 77.9 22,251 90.99 2,411 78.4 24,110 94.36 2,483 78.4 24,831 97.19 2,558 78.4 25,577 100.10UNDISTRIBUTED OPERATING EXPENSESAdministrative & General 223 8.9 2,231 9.86 235 8.2 2,350 9.61 245 8.0 2,447 9.58 252 8.0 2,520 9.86 260 8.0 2,596 10.16Info & Telecom Systems 27 1.1 266 1.17 28 1.0 280 1.14 29 0.9 291 1.14 30 0.9 300 1.17 31 0.9 309 1.21Marketing 153 6.1 1,530 6.76 148 5.2 1,477 6.04 140 4.5 1,398 5.47 144 4.5 1,440 5.64 148 4.5 1,483 5.81Franchise Fee 197 7.8 1,968 8.70 224 7.8 2,235 9.14 241 7.8 2,406 9.42 248 7.8 2,478 9.70 255 7.8 2,552 9.99Prop. Operations & Maint. 85 3.4 850 3.76 101 3.5 1,007 4.12 117 3.8 1,165 4.56 120 3.8 1,200 4.70 124 3.8 1,236 4.84Utilities 96 3.8 956 4.23 101 3.5 1,007 4.12 105 3.4 1,049 4.10 108 3.4 1,080 4.23 111 3.4 1,113 4.35 Total Expenses 780 31.1 7,802 34.48 836 29.2 8,358 34.18 876 28.4 8,756 34.27 902 28.4 9,018 35.30 929 28.4 9,289 36.36GROSS HOUSE PROFIT 1,143 45.2 11,434 50.52 1,389 48.7 13,894 56.81 1,535 50.0 15,354 60.09 1,581 50.0 15,813 61.89 1,629 50.0 16,288 63.75Management Fee 76 3.0 756 3.34 86 3.0 857 3.51 92 3.0 922 3.61 95 3.0 950 3.72 98 3.0 978 3.83INCOME BEFORE NON-OPR. INC. & EXP. 1,068 42.2 10,677 47.18 1,304 45.7 13,036 53.31 1,443 47.0 14,432 56.48 1,486 47.0 14,863 58.17 1,531 47.0 15,309 59.92NON-OPERATING INCOME & EXPENSEProperty Taxes 126 5.0 1,262 5.58 159 5.6 1,590 6.50 171 5.6 1,711 6.69 184 5.8 1,840 7.20 190 5.8 1,895 7.42Insurance 27 1.1 275 1.21 28 1.0 283 1.16 29 0.9 291 1.14 30 0.9 300 1.17 31 0.9 309 1.21Reserve for Replacement 50 2.0 504 2.23 86 3.0 857 3.51 123 4.0 1,230 4.81 127 4.0 1,266 4.96 130 4.0 1,304 5.11 Total Expenses 204 8.1 2,041 9.02 273 9.6 2,730 11.17 323 10.5 3,231 12.65 341 10.7 3,407 13.33 351 10.7 3,509 13.73EBITDA LESS RESERVE $864 34.1 % $8,637 $38.16 $1,031 36.1 % $10,306 $42.14 $1,120 36.5 % $11,200 $43.84 $1,146 36.3 % $11,456 $44.84 $1,180 36.3 % $11,801 $46.19
*Departmental expenses are expressed as a percentage of departmental revenues.

February-2018 Executive Summary Proposed Extended-Stay Hotel – Maricopa, Arizona 8
FIGURE 1-6 TEN-YEAR FORECAST OF INCOME AND EXPENSE
2020/21 2021/22 2022/23 2023/24 2024/25 2025/26 2026/27 2027/28 2028/29 2029/30
Number of Rooms: 100 100 100 100 100 100 100 100 100 100Occupied Rooms: 22,630 24,455 25,550 25,550 25,550 25,550 25,550 25,550 25,550 25,550Occupancy: 62% 67% 70% 70% 70% 70% 70% 70% 70% 70%Average Rate: $108.70 % of $114.25 % of $117.67 % of $121.21 % of $124.84 % of $128.59 % of $132.44 % of $136.42 % of $140.51 % of $144.73RevPAR: $67.39 Gross $76.55 Gross $82.37 Gross $84.84 Gross $87.39 Gross $90.01 Gross $92.71 Gross $95.49 Gross $98.36 Gross $101.31OPERATING REVENUERooms $2,460 97.6 % $2,794 97.8 % $3,007 97.8 % $3,097 97.8 % $3,190 97.8 % $3,285 97.8 % $3,384 97.8 % $3,485 97.8 % $3,590 97.8 % $3,698 97.8 %Other Operated Departments 34 1.3 36 1.2 37 1.2 38 1.2 39 1.2 41 1.2 42 1.2 43 1.2 44 1.2 46 1.2Miscellaneous Income 27 1.1 29 1.0 30 1.0 31 1.0 32 1.0 33 1.0 34 1.0 35 1.0 36 1.0 37 1.0 Total Operating Revenues 2,521 100.0 2,858 100.0 3,074 100.0 3,166 100.0 3,261 100.0 3,358 100.0 3,459 100.0 3,563 100.0 3,670 100.0 3,780 100.0DEPARTMENTAL EXPENSES *Rooms 568 23.1 602 21.6 631 21.0 650 21.0 670 21.0 690 21.0 711 21.0 732 21.0 754 21.0 777 21.0Other Operated Departments 30 87.1 31 85.8 32 85.0 33 85.0 34 85.0 35 85.0 36 85.0 37 85.0 38 85.0 39 85.0 Total Expenses 597 23.7 633 22.1 663 21.6 683 21.6 703 21.6 724 21.6 746 21.6 769 21.6 792 21.6 815 21.6DEPARTMENTAL INCOME 1,924 76.3 2,225 77.9 2,411 78.4 2,483 78.4 2,558 78.4 2,634 78.4 2,713 78.4 2,794 78.4 2,878 78.4 2,965 78.4UNDISTRIBUTED OPERATING EXPENSESAdministrative & General 223 8.9 235 8.2 245 8.0 252 8.0 260 8.0 267 8.0 275 8.0 284 8.0 292 8.0 301 8.0Info & Telecom Systems 27 1.1 28 1.0 29 0.9 30 0.9 31 0.9 32 0.9 33 0.9 34 0.9 35 0.9 36 0.9Marketing 153 6.1 148 5.2 140 4.5 144 4.5 148 4.5 153 4.5 157 4.5 162 4.5 167 4.5 172 4.5Franchise Fee 197 7.8 224 7.8 241 7.8 248 7.8 255 7.8 263 7.8 271 7.8 279 7.8 287 7.8 296 7.8Prop. Operations & Maint. 85 3.4 101 3.5 117 3.8 120 3.8 124 3.8 127 3.8 131 3.8 135 3.8 139 3.8 143 3.8Utilities 96 3.8 101 3.5 105 3.4 108 3.4 111 3.4 115 3.4 118 3.4 122 3.4 125 3.4 129 3.4 Total Expenses 780 31.1 836 29.2 876 28.4 902 28.4 929 28.4 957 28.4 985 28.4 1,015 28.4 1,045 28.4 1,077 28.4GROSS HOUSE PROFIT 1,143 45.2 1,389 48.7 1,535 50.0 1,581 50.0 1,629 50.0 1,677 50.0 1,728 50.0 1,779 50.0 1,833 50.0 1,888 50.0Management Fee 76 3.0 86 3.0 92 3.0 95 3.0 98 3.0 101 3.0 104 3.0 107 3.0 110 3.0 113 3.0INCOME BEFORE NON-OPR. INC. & EXP. 1,068 42.2 1,304 45.7 1,443 47.0 1,486 47.0 1,531 47.0 1,576 47.0 1,624 47.0 1,672 47.0 1,723 47.0 1,775 47.0NON-OPERATING INCOME & EXPENSEProperty Taxes 126 5.0 159 5.6 171 5.6 184 5.8 190 5.8 195 5.8 201 5.8 207 5.8 213 5.8 220 5.8Insurance 27 1.1 28 1.0 29 0.9 30 0.9 31 0.9 32 0.9 33 0.9 34 0.9 35 0.9 36 0.9Reserve for Replacement 50 2.0 86 3.0 123 4.0 127 4.0 130 4.0 134 4.0 138 4.0 143 4.0 147 4.0 151 4.0 Total Expenses 204 8.1 273 9.6 323 10.5 341 10.7 351 10.7 361 10.7 372 10.7 383 10.7 395 10.7 407 10.7EBITDA LESS RESERVE $864 34.1 % $1,031 36.1 % $1,120 36.5 % $1,146 36.3 % $1,180 36.3 % $1,215 36.3 % $1,252 36.3 % $1,289 36.3 % $1,328 36.3 % $1,368 36.3 %
1 1 1 1 1 1 1 1 1 1*Departmental expenses are expressed as a percentage of departmental revenues.
% ofGross

February-2018 Executive Summary Proposed Extended-Stay Hotel – Maricopa, Arizona 9
As illustrated, the hotel is expected to stabilize at a profitable level. Please refer to the Forecast of Income and Expense chapter of our report for a detailed explanation of the methodology used in deriving this forecast. The Feasibility Analysis chapter of this report converts these cash flows into a net present value indication assuming set-forth debt and equity requirements. The conclusion of this analysis indicates that an equity investor contributing $3,471,000 (roughly 30% of the $11,600,000 development cost) could expect to receive a 20.3% internal rate of return over a ten-year holding period, assuming that the investor obtains financing at the time of the project’s completion at the loan-to-value ratio and interest rate set forth. The proposed subject hotel has an opportunity to serve an unrepresented niche in the market because the Maricopa area remains underserved by non-casino lodging facilities. Based on our market analysis, there is sufficient market support for the proposed upper-midscale to upscale, extended-stay hotel. Our conclusions are based primarily on the long-term strength of this hotel market. The greater market continues to absorb new supply, and the forecasts related to strong demand and ADR growth indicate that the market should successfully absorb the new supply, including the proposed subject hotel. Our review of investor surveys indicates equity returns ranging from 14.2% to 23.8%, with an average of 19.7%. Based on these parameters, the calculated return to the equity investor, 20.3%, is above the average yet within the range of market-level returns given the anticipated cost of $11,600,000. Based on these parameters, the feasibility of the subject project is confirmed. “Extraordinary Assumption” is defined in USPAP as follows:
An assumption, directly related to a specific assignment, as of the effective date of the assignment results, which, if found to be false, could alter the appraiser’s opinions or conclusions. Comment: Extraordinary assumptions presume as fact otherwise uncertain information about physical, legal, or economic characteristics of the subject property; or about conditions external to the property, such as market conditions or trends; or about the integrity of data used in an analysis.1
The analysis is based on the extraordinary assumption that the described improvements have been completed as of the stated date of opening. The reader should understand that the completed subject property does not yet exist as of the date of this report. Our feasibility study does not address unforeseeable events that could alter the proposed project and/or the market conditions reflected in the analyses; we assume that no significant changes, other than those anticipated and 1 The Appraisal Foundation, Uniform Standards of Professional Appraisal Practice, 2016–2017 ed.
Feasibility Conclusion
Assignment Conditions

February-2018 Executive Summary Proposed Extended-Stay Hotel – Maricopa, Arizona 10
explained in this report, shall take place between the date of inspection and stated date of opening. The use of this extraordinary assumption may have affected the assignment results. We have made no other extraordinary assumptions specific to this feasibility study. However, several important general assumptions have been made that apply to this feasibility study and our studies of proposed hotels in general. These aspects are set forth in the Assumptions and Limiting Conditions chapter of this report. We have assumed the hypothetical condition that the subject site, which has yet to be selected, would be located favorably along the State Route 347 corridor, offering easy access to transportation linkages, ancillary commercial uses (retail, restaurant, and entertainment), and demand generators in/around the City of Maricopa. The reader should understand that the specific subject site has not been chosen, and that any deviation from these site assumptions could potentially alter the feasibility of this project; however, additional analysis would be required to confirm. We have assumed no other significant hypothetical conditions. Furthermore, we have not made any jurisdictional exceptions to the Uniform Standards of Professional Appraisal Practice in our analysis or report. This feasibility report is being prepared for use in the development of the proposed subject hotel. The client for this engagement is City of Maricopa. This report is intended for the addressee firm, and may not be distributed to or relied upon by other persons or entities. The methodology used to develop this study is based on the market research and valuation techniques set forth in the textbooks authored by Hospitality Valuation Services for the American Institute of Real Estate Appraisers and the Appraisal Institute, entitled The Valuation of Hotels and Motels,2 Hotels, Motels and Restaurants: Valuations and Market Studies,3 The Computerized Income Approach to Hotel/Motel Market Studies and Valuations,4 Hotels and Motels: A Guide to Market
2 Stephen Rushmore, The Valuation of Hotels and Motels. (Chicago: American Institute of Real Estate Appraisers, 1978). 3 Stephen Rushmore, Hotels, Motels and Restaurants: Valuations and Market Studies. (Chicago: American Institute of Real Estate Appraisers, 1983). 4 Stephen Rushmore, The Computerized Income Approach to Hotel/Motel Market Studies and Valuations. (Chicago: American Institute of Real Estate Appraisers, 1990).
Intended Use of the Feasibility Study
Identification of the Client and Intended User(s)
Scope of Work
February-2018 Executive Summary Proposed Extended-Stay Hotel – Maricopa, Arizona 11
Analysis, Investment Analysis, and Valuations,5 and Hotels and Motels – Valuations and Market Studies.6
1. All information was collected and analyzed by the staff of TS Worldwide, LLC. Information was supplied by the client and/or the property’s development team.
2. The subject site has yet to be selected. However, a potential site located along the State Route 347 corridor has been evaluated from the viewpoint of its physical utility for the future operation of a hotel, as well as access, visibility, and other relevant factors.
3. The subject property's proposed improvements have been reviewed for their expected quality of construction, design, and layout efficiency.
4. The surrounding economic environment, on both an area and neighborhood level, has been reviewed to identify specific hostelry-related economic and demographic trends that may have an impact on future demand for hotels.
5. Dividing the market for hotel accommodations into individual segments defines specific market characteristics for the types of travelers expected to utilize the area's hotels. The factors investigated include purpose of visit, average length of stay, facilities and amenities required, seasonality, daily demand fluctuations, and price sensitivity.
6. An analysis of existing and proposed competition provides an indication of the current accommodated demand, along with market penetration and the degree of competitiveness. Unless noted otherwise, we have inspected the competitive lodging facilities summarized in this report.
7. Documentation for an occupancy and average rate projection is derived utilizing the build-up approach based on an analysis of lodging activity.
8. A detailed projection of income and expense made in accordance with the Uniform System of Accounts for the Lodging Industry sets forth the anticipated economic benefits of the subject property.
9. A feasibility analysis is performed, in which the market equity yield an investor would expect is compared to the equity yield an investor must accept.
5 Stephen Rushmore, Hotels and Motels: A Guide to Market Analysis, Investment Analysis, and Valuations (Chicago: Appraisal Institute, 1992). 6 Stephen Rushmore and Erich Baum, Hotels and Motels – Valuations and Market Studies. (Chicago: Appraisal Institute, 2001).

February-2018 Description of the Site and Neighborhood Proposed Extended-Stay Hotel – Maricopa, Arizona 12
2. Description of the Site and Neighborhood
The suitability of the land for the operation of a lodging facility is an important consideration affecting the economic viability of a property and its ultimate marketability. Factors such as size, topography, access, visibility, and the availability of utilities have a direct impact on the desirability of a particular site. We note that a specific site for hotel development in the City of Maricopa has not been selected at this time. Several available sites exist along State Route 347 and are considered suitable for hotel development, including a city-owned site next to the Copper Sky Recreational Complex. The forecast and assumptions outlined in this report assume that the proposed hotel will be located favorably along the State Route 347 corridor, which offers easy access to transportation linkages, ancillary commercial uses (retail, restaurant, and entertainment), and demand generators in/around the City of Maricopa. Any deviation from these site assumptions could potentially alter the feasibility of this project; however, additional analysis would be required to confirm. AERIAL PHOTOGRAPH (STATE ROUTE 347 CORRIDOR)
Physical Characteristics
February-2018 Description of the Site and Neighborhood Proposed Extended-Stay Hotel – Maricopa, Arizona 13
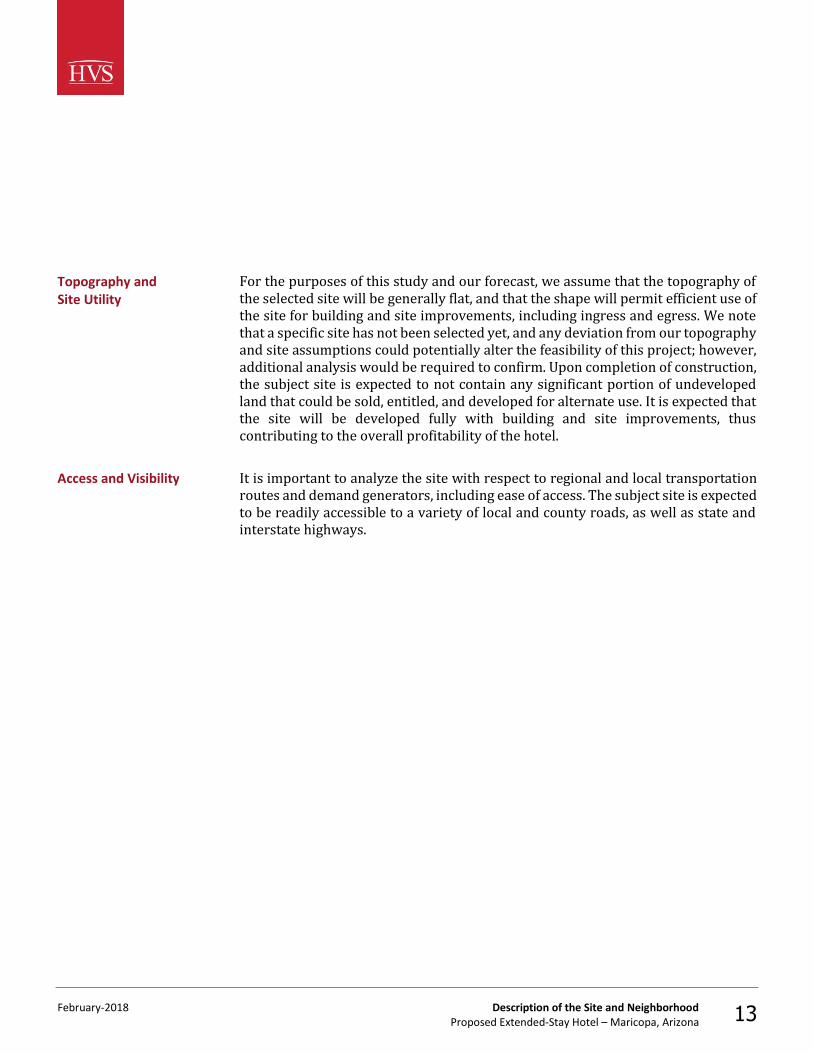
For the purposes of this study and our forecast, we assume that the topography of the selected site will be generally flat, and that the shape will permit efficient use of the site for building and site improvements, including ingress and egress. We note that a specific site has not been selected yet, and any deviation from our topography and site assumptions could potentially alter the feasibility of this project; however, additional analysis would be required to confirm. Upon completion of construction, the subject site is expected to not contain any significant portion of undeveloped land that could be sold, entitled, and developed for alternate use. It is expected that the site will be developed fully with building and site improvements, thus contributing to the overall profitability of the hotel. It is important to analyze the site with respect to regional and local transportation routes and demand generators, including ease of access. The subject site is expected to be readily accessible to a variety of local and county roads, as well as state and interstate highways.
Topography and Site Utility
Access and Visibility

February-2018 Description of the Site and Neighborhood Proposed Extended-Stay Hotel – Maricopa, Arizona 14
MAP OF REGIONAL ACCESS ROUTES
Primary regional access through the area is provided by east/west Interstate 10, which extends to such cities as Tucson to the southeast and Los Angeles, California, to the west. North/south Interstate 17 is another major highway, which provides access to Flagstaff to the north and has its southern terminus in Phoenix. State Route 202, or Loop 202/Santan Freeway, forms a beltway around the cities of Tempe, Chandler, Mesa, and Gilbert. State Route 101, or Loop 101, intersects with Loop 202/Santan Freeway in Chandler and in the northeast corner of Tempe; this freeway forms a beltway around the northern cities of Scottsdale, Phoenix, Glendale, and Peoria. State Route 347 connects the City of Maricopa with Interstate 10 to the north and Interstate 8 (via State Route 84) to the south. The subject market is served by a variety of additional local highways, which are illustrated on the map. For the purposes of this study and our forecast, we assume that the chosen site will be accessible via a main arterial roadway and will be relatively simple to locate from the nearest major intersection and highway. The proposed subject hotel is anticipated to have adequate signage at the street, as well as on its façade. We

February-2018 Description of the Site and Neighborhood Proposed Extended-Stay Hotel – Maricopa, Arizona 15
assume that the selected site will benefit from very good to excellent accessibility; the proposed hotel is expected to enjoy very good to excellent visibility from within its local neighborhood. Any deviation from our access and visibility assumptions could potentially alter the feasibility of this project; however, additional analysis would be required to confirm. The proposed subject hotel will be served by the Sky Harbor International Airport, which is located approximately 30 miles to the north of the assumed area for the subject site, as described previously. Furthermore, we note that the Ak-Chin Regional Airport is a privately owned, public-use airport located approximately 10 miles to the southeast of Maricopa. The neighborhood surrounding a lodging facility often has an impact on a hotel's status, image, class, style of operation, and sometimes its ability to attract and properly serve a particular market segment. This section of the report investigates the subject neighborhood and evaluates any pertinent location factors that could affect its future occupancy, average rate, and overall profitability. The neighborhood that surrounds the assumed area of the subject site is generally defined as the State Route 347 corridor between Smith Enke Road to the north and Farrell Road to the south. The corridor is characterized by a multi-use sports complex, casino resort and entertainment complex, restaurants, and retail shopping centers along the primary thoroughfares, with residential areas located along the secondary roadways. Some specific businesses and entities in the area include Copper Sky Recreational Complex, Harrah’s Ak-Chin Casino Resort, and the Maricopa Amtrak station. Furthermore, restaurants located in this neighborhood include Culver's, Chipotle, and Barros's Pizza; the proximity of these restaurants is considered supportive for the operation of an extended-stay lodging property. While no hotels are currently located within the Maricopa city limits, the Harrah’s Ak-Chin Casino Resort is located in the Ak-Chin Indian Community directly south of Maricopa. In general, this neighborhood is in the growth stage of its life cycle. Notable changes in this neighborhood include increased retail and restaurant development due to the growing population in Maricopa. Vintage Partners began construction on Edison Pointe, a 130,000-square-foot retail development at the northeast corner of Edison Road and State Route 347, in 2017. Tenants include Ross Dress for Less, Burger King, Brakes Plus, Goodwill, Planet Fitness, and Dunkin Donuts; the project is slated to open in early 2018. Work is expected to begin in 2018 on a new road realignment and bridge over the Union Pacific Railroad tracks on the south side of State Route 347. The $55-million project is expected to relieve traffic congestion and encourage development in the southern portion of Maricopa.
Airport Access
Neighborhood

February-2018 Description of the Site and Neighborhood Proposed Extended-Stay Hotel – Maricopa, Arizona 16
MAP OF NEIGHBORHOOD
The proposed subject hotel's opening should be a positive influence on the area; the hotel is expected to be in character with and to complement surrounding land uses. Overall, the supportive nature of the development in the immediate area is considered appropriate for and conducive to the operation of a hotel.
The subject site will reportedly be served by all necessary utilities. For the purposes of this study and our forecast, we assume that no extraordinary soil conditions will exist at the selected development site. However, geological and soil reports will need to be conducted to verify these surface conditions once a site is chosen. Any deviation from our soil and subsoil condition assumptions could potentially alter the feasibility of this project; however, additional analysis would be required to confirm.
Utilities
Soil and Subsoil Conditions

February-2018 Description of the Site and Neighborhood Proposed Extended-Stay Hotel – Maricopa, Arizona 17
For the purposes of this study and our forecast, we assume that there will not be any site-specific nuisances or hazards, including any ground contaminants. However, a hazardous waste inspection will need to be conducted to verify that no nuisances or hazards exist once a site is chosen. Any deviation from our nuisance and hazard assumptions could potentially alter the feasibility of this project; however, additional analysis would be required to confirm. According to the Federal Emergency Management Agency map illustrated below, the assumed subject site is expected to be located in Flood Zone AE.
Nuisances and Hazards
Flood Zone

February-2018 Description of the Site and Neighborhood Proposed Extended-Stay Hotel – Maricopa, Arizona 18
COPY OF FLOOD MAP AND COVER
The flood zone definition for the AE designation is as follows: areas of 100-year flood; base flood elevations and flood hazard factors not determined (flood insurance required; refer to FEMA for more specific information on A codes).

February-2018 Description of the Site and Neighborhood Proposed Extended-Stay Hotel – Maricopa, Arizona 19
Additional flood zone information provided by the City of Maricopa has been included in the addenda of this report. Officials at the City of Maricopa Planning Division revealed that a new zoning code was adopted in December 2014. However, the previous zoning districts are recognized as existing zoning within the City, with the new zoning code largely comprising of new overlay details. Based on a review of existing zoning along the State Route 347 corridor, the subject property will likely be in a Commercial Zone or, which could encompass any of the following commercial zoning districts: Neighborhood Commercial (NC), General Commercial (GC), Shopping Center (SC), or General Office (GO). We note that hotel and motel use is allowed in General Commercial and Shopping Center base zoning districts. Additionally, the General Office zoning district requires an administrative use permit before hotel and motel use is permitted, while it is prohibited under the Neighborhood Commercial zoning district. It was mentioned that the State Route 347 corridor falls under the Transportation Corridor overlay, which is not prohibitive to the development of a lodging facility, however, does require additional design standards, such as massing and placement location of building(s). For the purposes of this study and our forecast, we assume that all necessary permits and approvals have been secured (including the appropriate liquor license if applicable) and that the subject property was constructed in accordance with local zoning ordinances, building codes, and all other applicable regulations. Our zoning analysis should be verified before any physical changes are made to the hotel. For the purposes of this study and our forecast, we assume that there will not be any easements attached to the property that would significantly affect the utility of the site or marketability of this project. Any deviation from our easement and encroachment assumptions could potentially alter the feasibility of this project; however, additional analysis would be required to confirm. We have made general assumptions on the issues of size, topography, access, visibility, and the availability of utilities. The subject site is assumed to be located within the State Route 347 corridor, which is the main roadway connecting Maricopa to the surrounding area. Our forecast assumes that the site will be well suited for future hotel use, with acceptable access, visibility, and topography for an effective operation.
Zoning
Easements and Encroachments
Conclusion

February-2018 Market Area Analysis Proposed Extended-Stay Hotel – Maricopa, Arizona 20
3. Market Area Analysis
The economic vitality of the market area and neighborhood surrounding the subject site is an important consideration in forecasting lodging demand and future income potential. Economic and demographic trends that reflect the amount of visitation provide a basis from which to project lodging demand. The purpose of the market area analysis is to review available economic and demographic data to determine whether the local market will undergo economic growth, stabilize, or decline. In addition to predicting the direction of the economy, the rate of change must be quantified. These trends are then correlated based on their propensity to reflect variations in lodging demand, with the objective of forecasting the amount of growth or decline in visitation by individual market segment (e.g., commercial, meeting and group, and leisure). The market area for a lodging facility is the geographical region where the sources of demand and the competitive supply are located. The subject site is located in the city of Maricopa, the county of Pinal, and the state of Arizona. Maricopa is part of the greater Phoenix MSA economic base. Phoenix is the capital and largest city in the state of Arizona, comprising 15 urban villages that include well-known neighborhoods or districts. Greater Phoenix serves as a hub for aerospace, high-tech, bioscience, advanced business services, and sustainable technologies companies. Forbes Magazine named Phoenix the 15th fastest-growing city in the nation for 2016; however, CBS News recently ranked Phoenix as the third fastest-growing city given the substantial employment increase in the technology industry. Additionally, Realtor.com ranked Phoenix first in the U.S.'s "10 Hottest Housing Markets to Watch in 2017." Tourism is an especially vital part of the economy. With more than 16 million visitors from throughout the United States and Canada annually visiting for the warm weather and sunshine in the Valley of the Sun, Phoenix is an important resort and regional meeting destination. The suburb of Maricopa, home to over 50,000 residents, was incorporated as a city in 2003; today, it features high-capacity utilities, a well-educated workforce, and attractive neighborhoods. As a maturing community on the edge of Metropolitan Phoenix, Maricopa has begun to evolve beyond its bedroom community roots to support growth within the automotive, agri-tech, healthcare, and retail business sectors, further solidifying its growing economic influence in the Pinal County area.
Market Area Definition

February-2018 Market Area Analysis Proposed Extended-Stay Hotel – Maricopa, Arizona 21
MARICOPA
The subject property’s market area can be defined by its Metropolitan Statistical Area (MSA): Phoenix-Mesa-Scottsdale, AZ MSA. The MSA is the most standard definition used in comparative studies of metropolitan areas. The federal government defines an MSA as a large population nucleus, which, together with adjacent counties, has a higher degree of social integration. The following exhibit illustrates the market area.

February-2018 Market Area Analysis Proposed Extended-Stay Hotel – Maricopa, Arizona 22
MAP OF MARKET AREA
A primary source of economic and demographic statistics used in this analysis is the Complete Economic and Demographic Data Source published by Woods & Poole Economics, Inc.—a well-regarded forecasting service based in Washington, D.C. Using a database containing more than 900 variables for each county in the nation, Woods & Poole employs a sophisticated regional model to forecast economic and demographic trends. Historical statistics are based on census data and information published by the Bureau of Economic Analysis. Projections are formulated by Woods & Poole, and all dollar amounts have been adjusted for inflation, thus reflecting real change. These data are summarized in the following table.
Economic and Demographic Review

February-2018 Market Area Analysis Proposed Extended-Stay Hotel – Maricopa, Arizona 23
FIGURE 3-1 ECONOMIC AND DEMOGRAPHIC DATA SUMMARY
Average AnnualCompounded Change
2000 2010 2016 2020 2000-10 2010-16 2016-20
Resident Population (Thousands)Pinal County 181.3 385.7 419.3 456.9 7.8 % 1.4 % 2.2 %Phoenix-Mesa-Scottsdale, AZ MSA 3,273.5 4,209.3 4,650.1 4,996.6 2.5 1.7 1.8State of Ari zona 5,160.6 6,412.0 6,948.7 7,415.5 2.2 1.3 1.6Uni ted States 282,162.4 309,347.1 324,506.9 336,690.4 0.9 0.8 0.9
Per-Capita Personal Income*Pinal County $21,096 $21,959 $24,510 $26,146 0.4 1.8 1.6Phoenix-Mesa-Scottsdale, AZ MSA 35,133 35,360 37,817 40,420 0.1 1.1 1.7State of Ari zona 31,942 33,629 35,985 38,485 0.5 1.1 1.7Uni ted States 36,812 39,622 43,613 46,375 0.7 1.6 1.5
W&P Wealth IndexPinal County 59.0 56.4 57.3 57.4 (0.4) 0.3 0.1Phoenix-Mesa-Scottsdale, AZ MSA 98.6 90.7 88.5 88.8 (0.8) (0.4) 0.1State of Ari zona 90.2 86.2 84.2 84.6 (0.5) (0.4) 0.1Uni ted States 100.0 100.0 100.0 100.0 0.0 0.0 0.0
Food and Beverage Sales (Millions)*Pinal County $113 $209 $262 $295 6.3 3.8 3.0Phoenix-Mesa-Scottsdale, AZ MSA 4,519 6,062 7,560 8,352 3.0 3.7 2.5State of Ari zona 6,682 8,764 10,897 11,984 2.7 3.7 2.4Uni ted States 368,829 447,728 562,999 602,635 2.0 3.9 1.7
Total Retail Sales (Millions)*Pinal County $1,227 $2,405 $2,769 $3,107 7.0 2.4 2.9Phoenix-Mesa-Scottsdale, AZ MSA 48,536 59,852 70,486 77,928 2.1 2.8 2.5State of Ari zona 71,246 85,453 99,155 109,013 1.8 2.5 2.4Uni ted States 3,902,830 4,130,414 4,846,834 5,181,433 0.6 2.7 1.7
* Inflation AdjustedSource: Woods & Poole Economics , Inc.

February-2018 Market Area Analysis Proposed Extended-Stay Hotel – Maricopa, Arizona 24
The U.S. population has grown at an average annual compounded rate of 0.8% from 2010 through 2016. The county’s population has grown at a quicker pace than the nation’s population; the average annual growth rate of 1.4% between 2010 and 2016 reflects a gradually expanding area. Following this population trend, per-capita personal income increased slowly, at 1.8% on average annually for the county between 2010 and 2016. Local wealth indexes have remained stable in recent years, registering a relatively low 57.3 level for the county in 2016. Food and beverage sales totaled $262 million in the county in 2016, versus $209 million in 2010. This reflects a 3.8% average annual change, which is weaker than the 6.3% pace recorded in the prior decade. Over the long term, the pace of growth is forecast to moderate to a more sustainable level of 3.0%, which is forecast through 2020. The retail sales sector demonstrated an annual increase of 7.0% registered in the decade 2000 to 2010, followed by an increase of 2.4% in the period 2010 to 2016. An increase of 2.9% average annual change is expected in county retail sales through 2020. The characteristics of an area's workforce provide an indication of the type and amount of transient visitation likely to be generated by local businesses. Sectors such as finance, insurance, and real estate (FIRE); wholesale trade; and services produce a considerable number of visitors who are not particularly rate-sensitive. The government sector often generates transient room nights, but per-diem reimbursement allowances often limit the accommodations selection to budget and mid-priced lodging facilities. Contributions from manufacturing, construction, transportation, communications, and public utilities (TCPU) employers can also be important, depending on the company type. The following table sets forth the county workforce distribution by business sector in 2000, 2010, and 2016, as well as a forecast for 2020.
Workforce Characteristics

February-2018 Market Area Analysis Proposed Extended-Stay Hotel – Maricopa, Arizona 25
FIGURE 3-2 HISTORICAL AND PROJECTED EMPLOYMENT (000S)
Average AnnualCompounded Change
Percent Percent Percent PercentIndustry 2000 of Total 2010 of Total 2016 of Total 2020 of Total
Farm 2.1 4.1 % 2.1 2.9 % 2.6 2.9 % 2.6 2.7 % 0.4 % 3.2 % 0.5 %Forestry, Fi shing, Related Activi ties And Other 0.7 1.4 0.6 0.8 0.6 0.6 0.6 0.6 (1.4) (1.0) 0.7Mining 1.3 2.6 1.5 2.0 1.7 1.8 1.7 1.7 1.5 1.6 0.3Uti l i ties 0.2 0.4 0.3 0.4 0.3 0.3 0.3 0.3 4.8 (0.9) 0.6Cons truction 2.1 4.2 2.8 3.8 4.1 4.6 4.8 4.8 3.0 6.4 3.7Ma nufacturing 3.1 6.1 3.5 4.7 4.4 4.8 4.5 4.6 1.4 3.6 0.8Tota l Trade 6.8 13.5 8.7 11.7 10.6 11.8 11.5 11.7 2.6 3.2 2.1 Wholesa le Tra de 1.2 2.4 1.3 1.8 1.5 1.7 1.5 1.6 0.9 2.4 0.2 Reta i l Trade 5.6 11.1 7.4 10.0 9.1 10.1 10.0 10.1 2.9 3.4 2.4Tra nsportation And Warehous ing 0.7 1.4 1.9 2.6 2.2 2.4 2.4 2.4 10.6 2.2 2.4Informa tion 0.4 0.7 0.8 1.0 1.1 1.2 1.2 1.2 8.0 5.9 1.8Finance And Insurance 0.9 1.9 2.5 3.3 3.2 3.5 3.8 3.8 10.1 4.1 4.4Real Esta te And Renta l And Leas e 1.6 3.1 3.6 4.8 5.2 5.7 5.7 5.8 8.7 6.1 2.4Tota l Services 14.3 28.4 25.3 33.9 32.3 35.9 36.0 36.6 5.9 4.2 2.8
Profes s ional And Technica l Services 1.1 2.2 2.1 2.9 2.7 3.0 2.9 3.0 6.6 4.0 1.9Ma nagement Of Compa nies And Enterpris es 0.2 0.4 0.3 0.4 0.4 0.5 0.5 0.5 5.2 4.9 2.3Administra tive And Waste Services 3.2 6.4 5.6 7.5 7.8 8.7 8.7 8.8 5.6 5.8 2.8Educational Services 0.2 0.5 1.1 1.5 1.8 2.0 2.2 2.3 16.8 8.7 4.9Heal th Care And Socia l Ass i s tance 3.4 6.8 5.9 7.9 6.5 7.2 7.2 7.3 5.5 1.6 2.9Arts , Enterta inment, And Recreation 0.7 1.4 1.5 2.1 1.9 2.1 2.1 2.2 8.0 3.6 2.7Accommodation And Food Services 2.8 5.5 4.4 5.9 5.1 5.7 5.5 5.6 4.8 2.3 2.1Other Services , Except Publ ic Admini stration 2.6 5.1 4.4 5.8 6.1 6.8 6.8 6.9 5.4 5.8 2.9
Tota l Government 16.2 32.2 20.8 27.9 21.8 24.3 23.4 23.8 2.5 0.8 1.8 Federa l Civi l ia n Government 0.9 1.8 1.7 2.3 1.8 2.0 2.0 2.0 6.8 0.7 2.6 Federa l Mi l i tary 0.4 0.8 0.8 1.1 0.8 0.9 0.8 0.9 6.7 0.9 0.1 State And Loca l Government 14.8 29.6 18.2 24.5 19.2 21.3 20.6 20.9 2.1 0.8 1.8
TOTAL 50.2 100.0 % 74.5 100.0 % 89.9 100.0 % 98.4 100.0 % 4.0 % 3.2 % 2.3 %
MSA 1,933.7 — 2,226.8 — 2,559.6 — 2,781.0 — 1.4 % 2.3 % 2.1 %U.S. 165,370.9 — 173,034.7 — 191,870.8 — 203,418.4 — 0.9 1.7 1.5
Source: Woods & Poole Economics , Inc.
2000-2010
2010-2016
2016-2020

February-2018 Market Area Analysis Proposed Extended-Stay Hotel – Maricopa, Arizona 26
Woods & Poole Economics, Inc. reports that during the period from 2000 to 2010, total employment in the county grew at an average annual rate of 4.0%. This trend was above the growth rate recorded by the MSA and also outpaced the national average. More recently, the pace of total employment growth in the county slowed to 3.2% on an annual average from 2010 to 2016. Of the primary employment sectors, Total Services recorded the highest increase in number of employees during the period from 2010 to 2016, increasing by 6,993 people, or 27.6%, and rising from 33.9% to 35.9% of total employment. Of the various service sub-sectors, administrative and waste services and health care and social assistance were the largest employers. Strong growth was also recorded in the total trade sector, as well as the real estate and rental and lease sector, which expanded by 21.0% and 23.8%, respectively, in the period 2010 to 2016. Forecasts developed by Woods & Poole Economics, Inc. anticipate that total employment in the county will change by 2.3% on average annually through 2020. The trend is above the forecast rate of change for the U.S. as a whole during the same period. The following table illustrates historical and projected employment, households, population and average household income data as provided by REIS for the overall Phoenix market.

February-2018 Market Area Analysis Proposed Extended-Stay Hotel – Maricopa, Arizona 27
FIGURE 3-3 HISTORICAL & PROJECTED EMPLOYMENT, HOUSEHOLDS, POPULATION, AND HOUSEHOLD INCOME STATISTICS
Year
2004 1,723,370 — 558,346 — 235,688 — 1,417,870 — 3,703,010 — $85,947 — 2005 1,827,300 6.0 % 588,681 5.4 % 244,202 3.6 % 1,475,590 4.1 % 3,847,880 3.9 % 92,844 8.0 %2006 1,902,170 4.1 615,154 4.5 249,376 2.1 1,505,230 2.0 3,968,720 3.1 100,277 8.02007 1,922,100 1.0 621,462 1.0 249,861 0.2 1,523,240 1.2 4,066,440 2.5 101,942 1.72008 1,824,470 (5.1) 596,529 (4.0) 236,857 (5.2) 1,537,000 0.9 4,132,070 1.6 98,433 (3.4)2009 1,689,400 (7.4) 557,971 (6.5) 214,204 (9.6) 1,540,710 0.2 4,179,490 1.1 94,334 (4.2)2010 1,696,070 0.4 560,552 0.5 211,154 (1.4) 1,545,730 0.3 4,225,060 1.1 96,659 2.52011 1,729,230 2.0 568,634 1.4 212,795 0.8 1,570,370 1.6 4,284,870 1.4 99,860 3.32012 1,778,330 2.8 586,535 3.1 216,120 1.6 1,601,110 2.0 4,360,950 1.8 104,939 5.12013 1,829,500 2.9 608,785 3.8 216,469 0.2 1,631,340 1.9 4,436,480 1.7 104,405 (0.5)2014 1,871,900 2.3 621,220 2.0 216,954 0.2 1,659,820 1.7 4,523,680 2.0 109,400 4.82015 1,939,130 3.6 642,504 3.4 219,100 1.0 1,682,860 1.4 4,613,480 2.0 112,920 3.22016 1,995,200 2.9 664,728 3.5 219,935 0.4 1,717,180 2.0 4,714,580 2.2 114,488 1.4
Forecasts2017 2,042,570 2.4 % 678,792 2.1 % 222,171 1.0 % 1,757,190 2.3 % 4,821,830 2.3 % $118,406 3.4 %2018 2,097,350 2.7 695,600 2.5 224,331 1.0 1,799,970 2.4 4,930,770 2.3 123,353 4.22019 2,128,520 1.5 704,218 1.2 224,794 0.2 1,842,110 2.3 5,040,670 2.2 127,453 3.32020 2,139,230 0.5 706,860 0.4 223,135 (0.7) 1,884,600 2.3 5,152,050 2.2 130,908 2.72021 2,168,390 1.4 717,408 1.5 222,917 (0.1) 1,928,290 2.3 5,267,980 2.3 134,874 3.0
Average Annual Compound Change2004 - 2016 1.2 % 1.5 % (0.6) % 1.6 % 2.0 % 2.4 %2004 - 2007 3.7 3.6 2.0 2.4 3.2 5.92007 - 2010 (4.1) (3.4) (5.5) 0.5 1.3 (1.8)2010 - 2016 2.7 2.9 0.7 1.8 1.8 4.3
Forecast 2017 - 2021 1.5 % 1.4 % 0.1 % 2.4 % 2.2 % 3.3 %
Household Avg. Income % Chg
Source: REIS Report, 3rd Quarter, 2017
Households % Chg PopulationIndustrial
Employment % ChgTotal
Employment % Chg % Chg% ChgOffice
Employment

February-2018 Market Area Analysis Proposed Extended-Stay Hotel – Maricopa, Arizona 28
For the Phoenix market, of the roughly 2,000,000 persons employed, 33% are categorized as office employees, while 11% are categorized as industrial employees. Total employment decreased by an average annual compound rate of -4.1% during the recession of 2007 to 2010, followed by an increase of 2.7% from 2010 to 2016. By comparison, office employment reflected compound change rates of -3.4% and 2.9%, during the same respective periods. Total employment is expected to expand by 2.4% in 2017, while office employment is forecast to expand by 2.1% in 2017. From 2017 through 2021, REIS anticipates that total employment will expand at an average annual compound rate of 1.5%, while office employment will expand by 1.4% on average annually during the same period. The number of households is forecast to expand by 2.4% on average annually between 2017 and 2021. Population is forecast to expand during this same period, at an average annual compounded rate of 2.2%. Household average income is forecast to grow by 3.3% on average annually from 2017 through 2021. The following table reflects radial demographic trends for our market area measured by three points of distance from the subject site.
Radial Demographic Snapshot

February-2018 Market Area Analysis Proposed Extended-Stay Hotel – Maricopa, Arizona 29
FIGURE 3-4 DEMOGRAPHICS BY RADIUS
Population2022 Projection 12,043 47,479 55,8132017 Estimate 10,818 42,788 50,2862010 Census 8,951 35,759 41,9052000 Census 337 1,007 1,895
Percent Change: 2017 to 2022 11.3% 11.0% 11.0%Percent Change: 2010 to 2017 20.9% 19.7% 20.0%Percent Change: 2000 to 2010 2556.1% 3451.0% 2111.4%
Households2022 Projection 3,546 14,794 17,4482017 Estimate 3,224 13,483 15,8772010 Census 2,769 11,724 13,7122000 Census 103 298 504
Percent Change: 2017 to 2022 10.0% 9.7% 9.9%Percent Change: 2010 to 2017 16.4% 15.0% 15.8%Percent Change: 2000 to 2010 2588.4% 3834.2% 2620.6%
Income2017 Est. Average Household Income $75,935 $76,880 $76,5412017 Est. Median Household Income 65,760 65,867 65,585
2017 Est. Civ. Employed Pop 16+ by OccupationArchi tecture/Engineering 146 539 637Arts/Des ign/Entertainment/Sports /Media 68 203 250Bui lding/Grounds Cleaning/Maintenance 77 503 590Busines s/Financia l Operations 180 690 780Community/Social Services 85 291 338Computer/Mathematica l 141 849 1,013Cons truction/Extraction 81 343 547Education/Training/Library 240 1,101 1,262Farming/Fishing/Fores try 175 356 395Food Preparation/Serving Related 245 973 1,178Heal thcare Practitioner/Technician 281 1,052 1,214Heal thcare Support 76 197 251Ins ta l la tion/Maintenance/Repai r 209 682 791Legal 6 134 154Li fe/Physical /Socia l Science 10 97 115Management 454 1,746 2,000Office/Adminis trative Support 739 3,048 3,602Production 206 1,015 1,159Protective Services 259 797 879Sa les /Related 474 2,122 2,480Persona l Care/Service 305 972 1,201Trans portation/Materia l Moving 164 1,101 1,414
0.00 - 1.00 miles 0.00 - 3.00 miles 0.00 - 5.00 miles
Source: Envi ronics Ana lytics

February-2018 Market Area Analysis Proposed Extended-Stay Hotel – Maricopa, Arizona 30
This source reports a population of 50,286 within a five-mile radius of the subject site, and 15,877 households within this same radius. Average household income within a five-mile radius of the subject site is currently reported at $76,541, while the median is $65,585. The following table presents historical unemployment rates for the proposed subject hotel’s market area. FIGURE 3-5 UNEMPLOYMENT STATISTICS
Year
2007 4.6 % 3.3 % 3.9 % 4.6 %2008 7.4 5.5 6.2 5.82009 12.3 9.3 9.9 9.32010 10.7 9.6 10.4 9.62011 9.8 8.6 9.5 8.92012 8.5 7.4 8.3 8.12013 8.1 6.7 7.7 7.42014 7.0 5.9 6.8 6.22015 6.3 5.2 6.0 5.32016 5.5 4.6 5.3 4.9
Recent Month - Dec2016 4.9 % 4.1 % 4.7 % 4.7 %2017 4.7 3.9 4.6 4.1
* Letters shown next to data points (i f any) reflect revised population controls and/or model re-estimation implemented by the BLS.
Source: U.S. Bureau of Labor Statis tics
MSACounty State U.S.
Current U.S. unemployment levels are now firmly below the annual averages of the last economic cycle peak of 2006 and 2007, when annual averages were 4.6%. National unemployment registered 4.1% in the final three months of 2017, roughly six points below the October 2009 peak of 10.0%. Total nonfarm payroll employment increased by 252,000 and 148,000 jobs in November and December of 2017, respectively. The highest gains were made in the professional and healthcare, manufacturing, and construction sectors. Unemployment has remained under the 5.0% mark since May 2016, reflecting a trend of relative stability and the overall strength of the U.S. economy. Locally, the unemployment rate was 5.5% in 2016; for this same area in 2017, the most recent month’s unemployment rate was registered at 4.7%, versus 4.9% for
Unemployment Statistics

February-2018 Market Area Analysis Proposed Extended-Stay Hotel – Maricopa, Arizona 31
the same month in 2016. Unemployment rose in 2008 as the region entered an economic slowdown, and this trend continued through 2010 as the height of the national recession took hold. However, unemployment declined in 2011 as the economy rebounded, a trend that continued through 2016. The most recent comparative period illustrates improvement, indicated by the lower unemployment rate in the latest available data. Economic development officials expect the county's unemployment rate to continue to fall, concurrent with the anticipated improvements in economic conditions through the near term and planned expansions at several major employers. Providing additional context for understanding the nature of the regional economy, the following table presents a list of the major employers in the subject property’s market. FIGURE 3-6 MAJOR EMPLOYERS
Number ofRank Firm Employees
1 Harrah's Ak-Chin Cas ino Resort 7702 Maricopa Uni fied School District 6503 Ci ty of Maricopa 3404 UltraStar Multi ta inment Center 2605 Walmart 2506 Volkswagen Proving Grounds 2007 Fry's Food Stores 2008 Pinal County Community Col lege 1869 USDA Arid-Land Research Center 9010 Bas ha 's 8511 Legacy Tradi tiona l School 8012 Native New Yorker 75
Source: Ci ty of Maricopa, 2017
The following bullet points highlight major demand generators for this market: • Volkswagen (VW) of America: VW’s Arizona proving grounds serve as a
worldwide, hot weather, testing location. VW test groups from around the world come to the facility for anywhere from a few days to weeks at a time, with the facility itself capable of hosting up to 150 individuals across multiple test teams. In 2017, it was estimated that the facility generated nearly 12,000 room nights for the competitive submarket. Given the facility’s specialization in hot-weather testing, room-night demand related to test teams is highest from mid-April
Major Business and Industry

February-2018 Market Area Analysis Proposed Extended-Stay Hotel – Maricopa, Arizona 32
through October. It was mentioned that test teams have the option to choose their own accommodations from a pre-approved list of lodging providers (across all brands). The most popular hotel selection from the list was reported to be the Sheraton Wild Horse Pass given its proximity to Maricopa and the number of associated retail, dining, and entertainment options nearby. Estimated room rates paid throughout the year were thought to be anywhere from $80 to $130 in the summer, and over $150 in the winter and spring. It was noted that the Sheraton can often accommodate these extended-stay room nights by offering a hospitality suite in the mornings and evenings, as well as an outdoor barbecue area for grilling.
• Nissan Technical Center North America - Arizona Testing Center: Similarly, Nissan’s Arizona proving grounds serve as a hot-weather test track for Nissan and its third-party automotive-part manufacturers. Officials with Nissan confirmed that the facility generates anywhere from 5,000 to 7,500 room nights annually, with demand highest from May through October, with June, July, and August being the busiest. The average length of stay was estimated to be one week, with some overseas travelers from Japan staying for two to three weeks. Travelers to the facility are encouraged by Nissan to choose overnight accommodations from a list of preferred hotels in the area (across all brands), including the Sheraton Wild Horse Pass, as well as limited-service and extended-stay hotels in Chandler along Interstate 10. It was mentioned that any planned hotel for the community should provide a complimentary breakfast, guestrooms with a microwave and a refrigerator, as well as good linkages to ancillary restaurants and entertainment options.
• Apex Motor Club: Currently under construction, the $25-million, 280-acre racetrack and motor club are expected to open near Maricopa in 2019. The facility will have indoor and outdoor restaurants, lounges, game rooms, a fitness center, a fuel station, and an auto shop. Two-hundred vehicle "condominiums," or garages, will also be available for those who want to store their rides at the track. Officials noted that the members-only club already has 66 members and is anticipated to cap out at a target membership base of 400. Most of the members are expected to be either full-time or part-time Phoenix area residents, which would largely preclude their need for overnight accommodations in Maricopa. However, Apex is in talks with several car manufacturers to bring a school to the site that would be open to the public. Often manufacturers of high-end sports cars will offer a free class to their customers as an incentive to purchase the vehicle. Since customers must travel for these classes, they often choose to expand the single free class to the full three- or four-day course. If such a facility were to open at the Apex in Maricopa, it was reported that anywhere from 5,000 to 10,000 students would be served annually.

February-2018 Market Area Analysis Proposed Extended-Stay Hotel – Maricopa, Arizona 33
• U.S. Arid Land Agricultural Research Center (USDA ARS): Management at the USDA ARS indicated that its room-night needs are minimal throughout the year. When accommodations are needed, it is typically for research scientists traveling to the area for anywhere from one day to a week at a time. It was noted that the University of Arizona (a collaborator at the facility) has an onsite dorm facility that will often house many of the people coming in to the facility. No changes were anticipated in terms of room-night demand because the federal discretionary programs that are used to support the facility have either experienced no growth or have declined in recent years.
• Amtrak – Maricopa Station (MRC): The Maricopa Station is the closest Amtrak train station to the Phoenix Metropolitan Area. The station serves as a location for the Sunset Limited (tri-weekly Orlando-New Orleans-Tucson-Los Angeles) and Texas Eagle (daily Chicago-Dallas-San Antonio with through car service tri-weekly via the Sunset Limited to Los Angeles, with stops in Benson, Tucson, Maricopa, and Yuma) national rail networks. According to Amtrak’s 2017 Fiscal Year data, the Maricopa Station was the third busiest location in the state behind Flagstaff and Tucson.
FIGURE 3-7 AMTRAK SERVICE AND RIDERSHIP - ARIZONA
Fiscal Year 2017
Total*
* Up 2.4% from FY16
4,1872,036
111,242
WilliamsYumaWinslowBenson
39,80329,14611,8499,9449,6724,605
Flagstaff
Boardings & AlightingsCity
TucsonMaricopaKingman
The fast-developing Pinal County region of Metropolitan Phoenix, including Maricopa, has grown significantly over the past several years as a result of its diversifying economy and developments in the automotive, agri-tech, healthcare, and retail business sectors. Major companies such as Nissan and VW maintain a strong presence in Maricopa, while the retail sector further supports the local

February-2018 Market Area Analysis Proposed Extended-Stay Hotel – Maricopa, Arizona 34
economy. Additionally, according to the University of Arizona Economics and Business Research Center, economic indicators associated with the Phoenix metropolitan area are expected to register growth over the next few years. Trends in occupied office space are typically among the most reliable indicators of lodging demand, as firms that occupy office space often exhibit a strong propensity to attract commercial visitors. Thus, trends that cause changes in vacancy rates or occupied office space may have a proportional impact on commercial lodging demand and a less direct effect on meeting demand. The following table details office space statistics for the pertinent market area.
FIGURE 3-8 OFFICE SPACE STATISTICS – MARKET OVERVIEW
Submarket
1 North Centra l 57 3,506,000 2,794,300 20.3 % $22.622 East Centra l 47 2,797,000 1,974,700 29.4 24.133 Northwest 160 7,956,000 5,943,100 25.3 20.564 Tempe 166 10,267,000 8,357,300 18.6 23.865 Scottsda le 282 15,851,000 12,284,500 22.5 28.356 Mesa/Chandler 176 7,662,000 5,501,300 28.2 22.997 West 40 1,866,000 1,190,500 36.2 19.968 Uptown 85 9,549,000 7,123,600 25.4 21.889 Downtown 38 6,147,000 4,763,900 22.5 32.76
10 Camelback 149 9,811,000 7,789,900 20.6 27.80
Totals and Averages 1,200 75,412,000 57,723,100 23.5 % $25.21
Inventory Occupied Office Space
Vacancy Rate
Average Asking Lease RateBuildings Square Feet
Source: REIS Report, 3rd Quarter, 2017
The greater Phoenix market comprises a total of 75.4 million square feet of office space. For the 3rd Quarter of 2017, the market reported a vacancy rate of 23.5% and an average asking rent of $25.21. The subject property is located in the greater Mesa/Chandler submarket (as defined by REIS), which houses 7,662,000 square feet of office space. The submarket's vacancy rate of 28.2% is above the overall market average. The average asking lease rate of $22.99 is below the average for the broader market. A convention center serves as a gauge of visitation trends to a particular market. Convention centers also generate significant levels of demand for area hotels and serve as a focal point for community activity. Typically, hotels within the closest proximity to a convention center—up to three miles away—will benefit the most.
Office Space Statistics
Convention Activity
February-2018 Market Area Analysis Proposed Extended-Stay Hotel – Maricopa, Arizona 35
Hotels serving as headquarters for an event benefit the most by way of premium rates and hosting related banquet events. During the largest of conventions, peripheral hotels may benefit from compression within the city as a whole. Due to its location, geography, and climate, the greater Phoenix area is a major convention destination. Convention activity generated by the Phoenix Convention Center predominately affects the Downtown Phoenix submarket. Nevertheless, during peak periods and for citywide conventions generating more than 30,000 room nights, a marginal amount of overflow demand is directed to Scottsdale and other outlying areas of the greater metropolitan area. The $600-million expansion of the Phoenix Convention Center, which opened in January 2009, was a cooperative effort between the City of Phoenix and the State of Arizona that nearly tripled the size of the previous facility. The facility is now one of the 20 largest convention centers in the country. The western Executive Conference Center building received a LEED Silver Certification from the U.S. Green Building Council; the rooftop contains 732 thin-film solar panels. In addition to the Convention Center, events can be held at Symphony Hall, a 2,312-seat concert hall, and the 1,364-seat Orpheum Theatre. The METRO light rail operates a westbound line that runs in between the north and south buildings and an eastbound line along the southern boundary of the site; the METRO connects the Phoenix Convention Center to the Sky Harbor International Airport.

February-2018 Market Area Analysis Proposed Extended-Stay Hotel – Maricopa, Arizona 36
CONVENTION CENTER
The following table illustrates recent use statistics for this facility. FIGURE 3-9 CONVENTION CENTER STATISTICS
Percent PercentYear Change Change
2010 62 — 237,974 — 2011 52 (16.1) % 244,744 2.8 %2012 61 17.3 191,501 (21.8)2013 42 (31.1) 151,249 (21.0)2014 57 35.7 203,180 34.32015 66 15.8 248,678 22.42016 65 (1.5) 221,378 (11.0)
Source: Phoenix Convention Center
Number of Conventions
Number of Delegates
These data illustrate a strong 2009, following the expansion of the facility. However, the recession, negative press regarding corporate travel to luxury destinations, and

February-2018 Market Area Analysis Proposed Extended-Stay Hotel – Maricopa, Arizona 37
the controversial SB 1070 immigration law resulted in the cancelation of some group events, which led to a decline of the number of conventions and room nights in 2010 and 2011. While delegate attendance also decreased in 2010, a slight rebound occurred in 2011. Following a brief resurgence in the number of conventions in 2012, the number of delegates and events both declined in 2013, largely due to the continued fallout from the SB 1070 controversy, as many groups had decided in 2010 not to book future events in the Phoenix market. Statistics for 2014 and 2015 illustrate a strong rebound in both the number of events and delegates, as the impact of SB 1070 began to subside. Local convention officials also noted that the positive exposure from hosting major events related to Super Bowl XLIX in February 2015 allowed the downtown market to showcase itself on a national level. The number of conventions remained level in 2016, while total delegates decreased. Nonetheless, indications for 2017 point to growth in both conventions and delegates, as several large conventions are on the books, such as the Southern Baptist Convention, Berkshire Hathaway Sales Convention, and American Society for Microbiology. This positive momentum is expected to continue over the near term as local and national dynamics strengthen. Airport passenger counts are important indicators of lodging demand. Depending on the type of service provided by a particular airfield, a sizable percentage of arriving passengers may require hotel accommodations. Trends showing changes in passenger counts also reflect local business activity and the overall economic health of the area. Phoenix Sky Harbor International Airport (PHX) is the principal gateway for the Valley of the Sun region of Arizona, with major commercial airlines serving cities in the U.S., Canada, Mexico, and Europe. Growth of the airport has been spurred by a surge of population and job gains in the state over the last decade, as well as the successes of Dallas-based Southwest Airlines and Tempe-based US Airways, which merged with American Airlines in 2015. PHX Sky Train, an automated train stretching from 44th Street and Washington Street to the airport terminals and parking area, opened in 2013. The expansion of the Sky Train to the Rental Car Center is underway and will be operational in 2021. A $590-million Terminal Modernization Program of Terminal 3 began in March 2015. Phase I was completed in December 2016, which included a new security checkpoint, additional ticket counters, and baggage handling facilities. Phase II will add a new, 15-gate concourse with large seating areas and several food and retail concessions; this phase is in progress and expected to be completed in early 2019. Phase III is planned to add new food and beverage facilities and enhanced customer amenities with new finishes to the north concourse; this final phase is scheduled to be completed in 2020.
Airport Traffic

February-2018 Market Area Analysis Proposed Extended-Stay Hotel – Maricopa, Arizona 38
The following table illustrates recent operating statistics for the Phoenix Sky Harbor International Airport, which is the primary airport facility serving the proposed subject hotel’s submarket. FIGURE 3-10 AIRPORT STATISTICS - PHOENIX SKY HARBOR INTERNATIONAL
AIRPORT
Year
2007 42,184,174 — — 2008 39,891,193 (5.4) % (5.4) %2009 37,824,982 (5.2) (5.3)2010 38,554,530 1.9 (3.0)2011 40,592,295 5.3 (1.0)2012 40,448,932 (0.4) (0.8)2013 40,341,614 (0.3) (0.7)2014 42,134,662 4.4 (0.0)2015 44,003,840 4.4 0.52016 43,383,528 (1.4) 0.3
Year-to-date, Nov2016 39,726,167 — — 2017 40,200,418 1.2 % —
*Annual average compounded percentage change from the previous year**Annual average compounded percentage change from fi rs t year of data
Change**Passenger
Change*TrafficPercent Percent
Source: Phoenix Sky Harbor International Ai rport
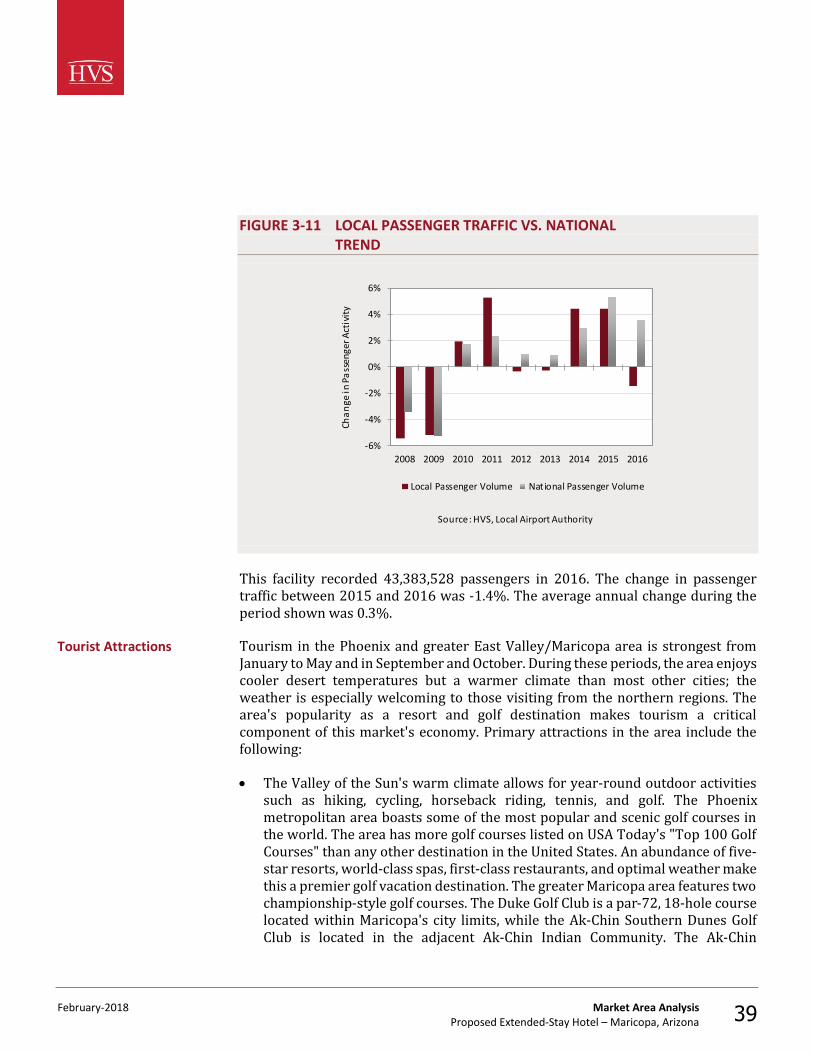
February-2018 Market Area Analysis Proposed Extended-Stay Hotel – Maricopa, Arizona 39
FIGURE 3-11 LOCAL PASSENGER TRAFFIC VS. NATIONAL TREND
-6%
-4%
-2%
0%
2%
4%
6%
2008 2009 2010 2011 2012 2013 2014 2015 2016
Chan
ge in
Pass
enge
r Act
ivity
Source: HVS, Local Airport Authority
Local Passenger Volume National Passenger Volume
This facility recorded 43,383,528 passengers in 2016. The change in passenger traffic between 2015 and 2016 was -1.4%. The average annual change during the period shown was 0.3%. Tourism in the Phoenix and greater East Valley/Maricopa area is strongest from January to May and in September and October. During these periods, the area enjoys cooler desert temperatures but a warmer climate than most other cities; the weather is especially welcoming to those visiting from the northern regions. The area's popularity as a resort and golf destination makes tourism a critical component of this market's economy. Primary attractions in the area include the following: • The Valley of the Sun's warm climate allows for year-round outdoor activities
such as hiking, cycling, horseback riding, tennis, and golf. The Phoenix metropolitan area boasts some of the most popular and scenic golf courses in the world. The area has more golf courses listed on USA Today's "Top 100 Golf Courses" than any other destination in the United States. An abundance of five-star resorts, world-class spas, first-class restaurants, and optimal weather make this a premier golf vacation destination. The greater Maricopa area features two championship-style golf courses. The Duke Golf Club is a par-72, 18-hole course located within Maricopa's city limits, while the Ak-Chin Southern Dunes Golf Club is located in the adjacent Ak-Chin Indian Community. The Ak-Chin
Tourist Attractions

February-2018 Market Area Analysis Proposed Extended-Stay Hotel – Maricopa, Arizona 40
Southern Dunes Golf Club is the host site for the annual Southwest Section PGA Section Championship through 2020; it has held numerous other PGA qualifying events in its history.
• The Copper Sky Recreational Complex attracts numerous youth sports tournaments despite the lack of hotel rooms in the community. Out-of-state tournaments typically host events in the winter months, with more local and regional tournaments taking place during the summer months. Tournaments usually last from Friday through Sunday during these periods, with patrons often choosing to stay at hotels in the Chandler I-10 submarket. Furthermore, the facility has received an increased number of event requests in recent months. While no new events have been finalized, the facility already hosts the annual Relay for Life, as well as numerous concerts and community events. The following table provides a list of amateur sports tournaments held at the facility from 2015 through 2017. We note that City representatives at Copper Sky indicates the facility does not track the number of attendees for non-city sponsored events.
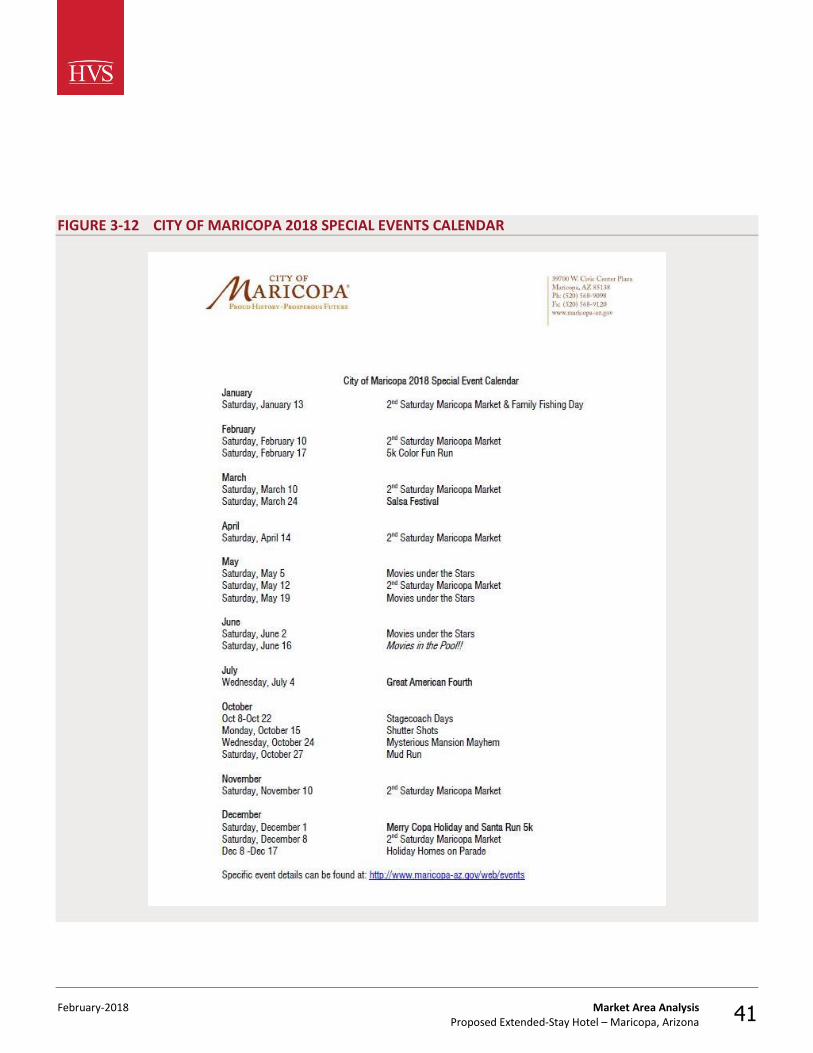
February-2018 Market Area Analysis Proposed Extended-Stay Hotel – Maricopa, Arizona 41
FIGURE 3-12 CITY OF MARICOPA 2018 SPECIAL EVENTS CALENDAR

February-2018 Market Area Analysis Proposed Extended-Stay Hotel – Maricopa, Arizona 42
FIGURE 3-13 REVIEW OF AMATEUR SPORTS TOURNAMENTS AT COPPER SKY SINCE 2015
February 7 & 21 LacrosseMarch 14 Lacrosse
November 21 - 22 Sereno Soccer TournamentDecember 12 Lacrosse
June 9-25 MLL All Stars TournamentDecember 12 Freedom Adult Softball Tournament
December 19-20 ASA Adult Softball Tournament
November 18-20 AYSO Soccer Tournament
January 23-24 ASA Softball TournamentFebruary 27 Freedom Adult Softball TournamentMarch 12-13 Baseball Legends Youth Baseball Tournament
April 2-3 All World Adult Softball TournamentApril 16-17 Baseball Legends Youth Baseball Tournament
May 7-8 Baseball Legends Youth Baseball TournamentMay 14-15 Sandlot Youth Baseball Tournament
July 9 ATP Adult Softball TournamentJuly 23-24 All World Adult Softball TournamentAugust 20 ATP Adult Softball Tournament
October 29 ATP Adult Softball Tournament
February 4 Lacrosse March 11 Lacrosse
November 11-12 AYSO Soccer TournamentDecember 9 Lacrosse
February 4 Charter School State PlayoffsApril 29-30 KOAS Youth Softball Tournament
August 19-20 Sandlot Softball TournamentAugust 26-27 Sandlot Softball Tournament
November 10-12 Showcase Youth Baseball TournamentNovember 18-19 Showcase Youth Baseball Tournament
December 9-10 USSSA Youth Baseball TournamentDecember 16-17 USSSA Youth Baseball Tournament
Copper Sky Recreational Complex
2017 Softball & Baseball Tournaments
2017 Multi-Purpose Field Tournament
2016 Softball & Baseball Tournaments
2016 Multi-Purpose Field Tournament
2015 Softball & Baseball Tournaments
2015 Multi-Purpose Field Tournament

February-2018 Market Area Analysis Proposed Extended-Stay Hotel – Maricopa, Arizona 43
• UltraStar Multi-tainment manages the entertainment operations at Ak-Chin Circle adjacent to Harrah’s Ak-Chin Casino Resort (Caesars Entertainment). The UltraStar site includes the 11,000- square-foot indoor/outdoor Elements Event Center. The multi-faceted space, which can host up to 350 guests, is a popular venue for weddings, quinceañeras, holiday parties, corporate events, trainings, seminars, and meetings. For 2017, management noted that the facility hosted 17 multi-day events that required overnight room accommodations. It was mentioned that groups who book the facility often stay at hotels in the Chandler submarket along Interstate 10. Similarly, the facility will host two weddings and three multi-day events in first quarter of 2018, with these events requiring hotel accommodations beyond the Harrah’s Ak-Chin Casino Resort. According to management at UltraStar, a total of 13 events with 100+ attendees were lost in 2017 due to the lack of non-casino hotel accommodations in the community. These events were mostly considered to be weddings and quinceañeras. Also included in this list was a 400-attendee, multi-day, youth conference for the Gila River Indian Community. It was important for this group, like many others, to have locational synergies between non-casino overnight lodging accommodations and the meeting venue. Furthermore, the facility was reportedly in negotiations for another Gila River Indian Community event, but has since been dropped from consideration because of the lack of non-casino hotel rooms. In tandem with the opportunity to capture group demand throughout the year, management at UltraStar indicated that the Harrah’s Ak-Chin Casino Resort regularly sells out and cannot accommodate all its transient-leisure casino visitors. While a guestroom expansion is currently under construction at the property, it was noted that there would still be room-night-compression opportunities during peak periods for a non-casino hotel in the Maricopa community.

February-2018 Market Area Analysis Proposed Extended-Stay Hotel – Maricopa, Arizona 44
COPPER SKY RECREATIONAL COMPLEX
This section discussed a wide variety of economic indicators for the pertinent market area. Greater Phoenix is experiencing a period of continued economic recovery and growth, led by the financial industry and the higher education and healthcare sectors. The area also benefits from its reputation as a popular tourist destination and its variety of popular events throughout the year. Maricopa is experiencing a period of economic strength and expansion, led by automotive proving grounds, a USDA research facility, a first-class event center, top recreational facilities, and a growing retail/restaurant sector, including the soon-to-be-completed Edison Pointe shopping complex. Furthermore, the City of Maricopa has issued two Request for Proposals, one for the mixed-use commercial development of 18 acres along SR347 and the other is for the City's first light industrial business park, which will allow for the expansion of existing businesses and attraction of new ones. As such, the outlook for the Maricopa market area is optimistic. Our analysis of the outlook for this specific market also considers the broader context of the national economy. The U.S. economy expanded during the last three years, with a relatively low point in growth occurring during the fourth quarter of 2015 and the first quarter of 2016, as well as the first quarter of 2017. Most recently, the U.S. economy expanded by 3.1% and 3.0% in the second and third quarters of 2017, respectively. The recent acceleration reflected strong personal consumption
Conclusion

February-2018 Market Area Analysis Proposed Extended-Stay Hotel – Maricopa, Arizona 45
expenditures (PCE), private inventory investment, nonresidential fixed investment, exports, and federal government spending.
FIGURE 3-14 UNITED STATES GDP GROWTH RATE
1.91.1
3.14.0
-1.2
4.05.0
2.0
3.22.7
1.6
0.5 0.6
2.22.8
1.81.2
3.1 3.0
-2.0-1.00.01.02.03.04.05.06.0
2013 2014 2015 2016 2017Source: tradingeconomics.com, Bureau of Economic Analysis
U.S. economic growth continues to support expansion of lodging demand. In 2017, demand growth through November registered 2.7%, stronger than the 1.6% level recorded in 2016. The economic growth, low unemployment, higher levels of personal income, and stability in the U.S. economy as of early 2018 is helping to maintain strong interest in hotel investments by a diverse array of market participants.

February-2018 Supply and Demand Analysis Proposed Extended-Stay Hotel – Maricopa, Arizona 46
4. Supply and Demand Analysis
In the lodging industry, price varies directly, but not proportionately, with demand and inversely, but not proportionately, with supply. Supply is measured by the number of guestrooms available, and demand is measured by the number of rooms occupied; the net effect of supply and demand toward equilibrium results in a prevailing price, or average rate. The purpose of this section is to investigate current supply and demand trends, as indicated by the current competitive market, and to set forth a basis for the projection of future supply and demand growth. The subject site is located in the greater Maricopa/Chandler lodging market. This greater lodging market spans over 80 open and operating lodging facilities totaling roughly 8,700 guestrooms. The proposed subject hotel is expected to compete with five hotels on a primary level based on similar product type, location, and/or focus on capturing longer-term stays. We have considered an additional four hotels as future secondary competitors given differences in product type, location, and price point. The subject property’s local lodging market is most directly affected by the supply and demand trends within the immediate area. However, individual markets are also influenced by conditions in the national lodging market. We have reviewed national lodging trends to provide a context for the forecast of the supply and demand for the proposed subject hotel’s competitive set. STR is an independent research firm that compiles and publishes data on the lodging industry, and this information is routinely used by typical hotel buyers. The following STR diagram presents annual hotel occupancy and average rate data since 1987. The next two tables contain information that is more recent; the data are categorized by geographical region, price point, type of location, and chain scale, and the statistics include occupancy, average rate, and rooms revenue per available room (RevPAR). RevPAR is calculated by multiplying occupancy by average rate and provides an indication of how well rooms revenue is being maximized.
Definition of Subject Hotel Market
National Trends Overview

February-2018 Supply and Demand Analysis Proposed Extended-Stay Hotel – Maricopa, Arizona 47
FIGURE 4-1 NATIONAL OCCUPANCY AND AVERAGE RATE TRENDS
45.0%
50.0%
55.0%
60.0%
65.0%
70.0%
$0
$20
$40
$60
$80
$100
$120
1988
1989
1990
1991
1992
1993
1994
1995
1996
1997
1998
1999
2000
2001
2002
2003
2004
2005
2006
2007
2008
2009
2010
2011
2012
2013
2014
2015
2016
Source: STR
RevPAR Average Rate Occupancy

February-2018 Supply and Demand Analysis Proposed Extended-Stay Hotel – Maricopa, Arizona 48
FIGURE 4-2 NATIONAL OCCUPANCY AND AVERAGE RATE TRENDS – YEAR-TO-DATE DATA
United States 66.5 % 67.1 % 0.8 % $124.49 $127.07 2.1 % $82.85 $85.22 2.9 % 1.8 % 2.6 %
RegionNew Engl and 65.6 % 66.2 % 0.9 % $152.85 $155.59 1.8 % $100.30 $103.02 2.7 % 1.5 % 2.5 %Middle Atlantic 68.1 68.7 0.7 162.14 161.49 (0.4) 110.49 110.87 0.3 2.9 3.6South Atla ntic 68.1 69.0 1.3 120.34 123.58 2.7 81.91 85.21 4.0 1.5 2.8East North Central 62.5 62.8 0.4 109.22 110.48 1.2 68.29 69.38 1.6 1.9 2.3East South Central 62.6 62.7 0.2 95.46 98.76 3.5 59.72 61.90 3.6 1.9 2.0West North Centra l 60.4 59.4 (1.8) 96.65 98.01 1.4 58.40 58.18 (0.4) 1.4 (0.4)West South Centra l 62.4 63.4 1.5 99.43 100.83 1.4 62.07 63.91 3.0 3.0 4.6Mountain 66.6 67.7 1.7 114.44 119.01 4.0 76.17 80.55 5.8 1.1 2.8Paci fic 74.8 75.0 0.3 159.33 163.38 2.5 119.25 122.59 2.8 1.6 1.8
Cl assLuxury 71.8 % 72.0 % 0.3 % $280.61 $284.35 1.3 % $201.40 $204.60 1.6 % 2.2 % 2.4 %Upper-Upscale 73.8 74.0 0.2 178.90 181.83 1.6 132.04 134.49 1.9 1.7 1.9Upscale 73.2 73.6 0.5 139.62 141.78 1.5 102.17 104.31 2.1 4.3 4.8Upper-Mi dsca le 68.5 68.9 0.6 114.74 116.53 1.6 78.57 80.29 2.2 4.0 4.7Mids cale 60.9 61.6 1.2 92.65 94.81 2.3 56.44 58.45 3.6 0.3 1.4Economy 59.3 59.8 0.8 70.15 72.29 3.1 41.63 43.24 3.9 (0.4) 0.4
LocationUrba n 74.3 % 74.7 % 0.5 % $177.94 $179.60 0.9 % $132.13 $134.09 1.5 % 3.1 % 3.6 %Suburban 68.0 68.2 0.3 106.48 108.82 2.2 72.37 74.22 2.6 1.9 2.3Airport 74.4 74.8 0.5 114.48 116.97 2.2 85.18 87.50 2.7 1.4 2.0Interstate 57.6 58.4 1.3 83.53 85.39 2.2 48.15 49.85 3.5 1.5 2.8Resort 69.3 70.5 1.7 168.08 172.54 2.7 116.41 121.59 4.4 0.9 2.7Smal l Metro/Town 58.0 58.5 0.9 100.44 102.81 2.4 58.28 60.19 3.3 1.5 2.4
Chain ScaleLuxury 74.7 % 74.7 % 0.1 % $314.64 $320.99 2.0 % $234.88 $239.93 2.2 % 1.6 % 1.7 %Upper-Upscale 75.5 75.5 (0.1) 180.50 183.00 1.4 136.32 138.13 1.3 2.1 2.0Upscale 75.0 74.9 (0.1) 138.99 140.87 1.4 104.31 105.58 1.2 6.0 5.9Upper-Mi dsca le 68.8 69.2 0.6 112.15 113.81 1.5 77.21 78.80 2.1 3.2 3.8Mids cale 60.5 61.1 1.1 85.73 87.45 2.0 51.84 53.47 3.2 1.3 2.4Economy 58.7 59.0 0.5 61.20 62.77 2.6 35.92 37.04 3.1 0.1 0.7Independents 63.1 64.0 1.4 123.06 126.63 2.9 77.64 81.00 4.3 0.0 1.4
2016 20172017%
Change%
Change%
Change
Occupancy - YTD November Average Rate - YTD November RevPAR - YTD November Percent Change
Source: STR - November 2017 Lodging Review
20162016 2017Rms. Avail. Rms. Sold

February-2018 Supply and Demand Analysis Proposed Extended-Stay Hotel – Maricopa, Arizona 49
FIGURE 4-3 NATIONAL OCCUPANCY AND AVERAGE RATE TRENDS – CALENDAR YEAR DATA
Uni ted Sta tes 65.4 % 65.5 % 0.1 % $120.30 $123.97 3.1 % $78.68 $81.19 3.2 % 1.6 % 1.7 %
RegionNew England 64.5 % 64.3 % (0.4) % $146.41 $150.70 2.9 % $94.49 $96.89 2.5 % 1.3 % 1.0 %Middle Atlantic 67.3 67.3 0.0 162.29 163.41 0.7 109.22 109.99 0.7 2.8 2.8South Atlantic 66.5 67.2 1.1 116.65 119.77 2.7 77.53 80.44 3.8 1.3 1.3East North Centra l 61.3 61.2 (0.2) 105.20 108.09 2.7 64.45 66.10 2.6 1.6 1.4East South Centra l 61.0 61.4 0.7 90.91 94.87 4.4 55.43 58.26 5.1 1.7 2.5West North Centra l 59.6 59.1 (0.8) 93.28 95.91 2.8 55.58 56.68 2.0 1.5 0.7West South Centra l 62.9 61.5 (2.3) 98.43 98.66 0.2 61.93 60.63 (2.1) 2.7 0.3Mountai n 65.0 65.5 0.7 108.77 114.24 5.0 70.68 74.79 5.8 0.8 1.5Paci fic 73.2 73.9 0.9 151.10 158.44 4.9 110.57 117.04 5.8 0.9 1.9
Cla ssLuxury 70.8 % 71.0 % 0.3 % $278.39 $283.05 1.7 % $196.98 $200.95 2.0 % 2.8 % 3.1 %Upper-Upscale 72.7 72.6 (0.1) 173.53 177.77 2.4 126.08 129.07 2.4 1.2 1.2Upscale 72.0 72.0 0.1 135.70 139.47 2.8 97.72 100.49 2.8 3.9 3.9Upper-Midscale 67.1 67.1 0.0 110.95 113.84 2.6 74.48 76.38 2.6 3.3 3.2Midscale 59.9 59.9 0.1 90.13 92.61 2.7 53.96 55.50 2.9 0.4 0.6Economy 58.6 58.6 0.0 67.60 70.17 3.8 39.63 41.13 3.8 (0.4) (0.4)
LocationUrban 73.0 % 73.1 % 0.1 % $173.99 $177.37 1.9 % $127.04 $129.69 2.1 % 2.9 % 3.0 %Suburba n 66.7 66.8 0.2 101.91 105.70 3.7 67.97 70.63 3.9 1.4 1.6Airport 73.6 73.4 (0.2) 109.78 113.56 3.4 80.78 83.40 3.3 1.0 0.8Interstate 57.2 56.6 (1.1) 81.35 83.04 2.1 46.53 46.97 0.9 1.5 0.4Resort 67.9 68.6 0.9 164.10 168.76 2.8 111.51 115.76 3.8 0.9 1.8Smal l Metro/Town 56.9 56.9 0.1 96.63 99.45 2.9 54.95 56.64 3.1 1.4 1.5
Cha in Scal eLuxury 75.2 % 74.9 % (0.3) % $317.58 $322.84 1.7 % $238.70 $241.82 1.3 % 2.8 % 2.4 %Upper-Upscale 74.3 74.2 (0.2) 174.98 178.82 2.2 130.08 132.63 2.0 1.6 1.4Upscale 74.3 73.8 (0.6) 134.82 138.50 2.7 100.13 102.27 2.1 5.6 5.0Upper-Midscale 67.5 67.4 (0.2) 108.75 111.43 2.5 73.46 75.14 2.3 2.1 1.9Midscale 59.4 59.4 (0.1) 83.32 85.43 2.5 49.52 50.74 2.5 1.2 1.1Economy 58.1 57.9 (0.4) 58.82 60.84 3.4 34.16 35.20 3.1 0.3 (0.1)Independents 61.8 62.3 0.8 118.73 123.22 3.8 73.36 76.75 4.6 0.2 1.0
Occupancy Average Rate
2016%
Change2015 20152015 2016
Source: STR - December 2016 Lodging Review
% Change
RevPAR%
ChangeRms. Avail. Rms. Sold
Percent Change
2016

February-2018 Supply and Demand Analysis Proposed Extended-Stay Hotel – Maricopa, Arizona 50
Following the significant RevPAR decline experienced during the last recession, demand growth resumed in 2010, led by select markets that had recorded growth trends in the fourth quarter of 2009. A return of business travel and some group activity contributed to these positive trends. The resurgence in demand was partly fueled by the significant price discounts that were widely available in the first half of 2010. These discounting policies were largely phased out in the latter half of the year, balancing much of the early rate loss. Demand growth remained strong, but decelerated from 2011 through 2013, increasing at rates of 4.7%, 2.8%, and 2.0%, respectively. Demand growth then surged to 4.0% in 2014, driven by a strong economy, a robust oil and gas sector, and limited new supply, among other factors. By 2014, occupancy had surpassed the 64% mark. Average rate rebounded similarly during this time, bracketing 4.0% annual gains from 2011 through 2014. In 2015, demand growth continued to outpace supply growth, a relationship that has been in place since 2010. With a 2.9% increase in room nights, the nation's occupancy level reached a record high of 65.4% in 2015. Supply growth intensified modestly in 2015 (at 1.1%), following annual supply growth levels of 0.7% and 0.9% in 2013 and 2014, respectively. Average rate posted another strong year of growth, at 4.4% in 2015, in pace with the annual growth of the last four years. Robust job growth, heightened group and leisure travel, and waning price-sensitivity all contributed to the gains. In 2016, occupancy increased minimally (by 0.1%) to 65.5%, as demand growth modestly exceeded supply growth. Average rate increased 3.1% for the year, and the net change in RevPAR was 3.2%, reflecting a healthy lodging market overall. Year-to-date November 2017 data show this trend continuing, with a 0.6-point occupancy increase to 67.1%, while average rate increased by just over $2.50 to roughly $127.00, resulting in a 2.9% upward change in RevPAR. As previously noted, STR is an independent research firm that compiles and publishes data on the lodging industry, routinely used by typical hotel buyers. HVS has ordered and analyzed an STR Trend Report of historical supply and demand data for a group of hotels considered applicable to this analysis for the proposed subject hotel. This information is presented in the following table, along with the market-wide occupancy, average rate, and rooms revenue per available room (RevPAR). RevPAR is calculated by multiplying occupancy by average rate and provides an indication of how well rooms revenue is being maximized.
Historical Supply and Demand Data

February-2018 Supply and Demand Analysis Proposed Extended-Stay Hotel – Maricopa, Arizona 51
FIGURE 4-4 HISTORICAL SUPPLY AND DEMAND TRENDS
YearAverage Daily Room Count
Available Room Nights Change
Occupied Room Nights Change Occupancy
Average Rate Change RevPAR Change
2007 597 217,905 — 161,938 — 74.3 % $108.13 — $80.36 — 2008 597 217,905 0.0 % 141,656 (12.5) % 65.0 112.83 4.3 % 73.35 (8.7) %2009 597 217,905 0.0 115,541 (18.4) 53.0 94.67 (16.1) 50.20 (31.6)2010 597 217,905 0.0 121,624 5.3 55.8 84.30 (10.9) 47.05 (6.3)2011 597 217,905 0.0 139,112 14.4 63.8 86.99 3.2 55.54 18.02012 597 217,905 0.0 129,892 (6.6) 59.6 91.13 4.8 54.32 (2.2)2013 596 217,540 (0.2) 135,871 4.6 62.5 91.71 0.6 57.28 5.42014 596 217,540 0.0 133,929 (1.4) 61.6 93.26 1.7 57.41 0.22015 596 217,540 0.0 135,036 0.8 62.1 100.37 7.6 62.31 8.52016 696 254,035 16.8 157,201 16.4 61.9 99.15 (1.2) 61.35 (1.5)
Year-to-Date Through November2016 685 228,956 — 141,768 — 61.9 % $100.54 — $62.26 — 2017 809 270,206 18.0 % 179,329 26.5 % 66.4 99.10 (1.4) % 65.77 5.6 %
Average Annua l Compounded Change:2007 - 2010 0.0 % (9.1) % (8.0) % (16.3) %2010 - 2016 2.6 4.4 2.7 4.5
Hotels Included in Sample
Fai rfi eld Inn & Suites Phoenix Cha ndl er Upper Midscal e Cla ss Primary 64 Dec 1995 Dec 1995Hampton Inn Phoeni x Chandler Upper Midscal e Cla ss Primary 101 May 1997 May 1997Homewood Suites Phoenix Chandler Upsca le Cl ass Primary 83 Apr 1998 Apr 1998La Quinta Inns & Suites Phoenix Chandler Midsca le Cla ss Secondary 117 Jun 1998 Jun 1998Hol i day Inn Express & Suites Phoenix Chandler Upper Midscal e Cla ss Primary 125 Oct 1998 Oct 1998Hol i day Inn & Suites Phoenix Chandler Upper Midscal e Cla ss Secondary 106 Ma r 2004 Ma r 2004Home2 Suites Phoenix Chandler Upper Midscal e Cla ss Primary 126 Jul 2016 Jul 2016Best Western Plus Chandler Hotel & Sui tes Upper Midscal e Cla ss Secondary 87 Aug 2016 Aug 2016
Total 809
Source: STR
ClassNumber
of RoomsYear
OpenedCompetitive Year
Status Affiliated

February-2018 Supply and Demand Analysis Proposed Extended-Stay Hotel – Maricopa, Arizona 52
It is important to note some limitations of the STR data. Hotels are occasionally added to or removed from the sample; furthermore, not every property reports data in a consistent and timely manner. These factors can influence the overall quality of the information by skewing the results, and these inconsistencies may also cause the STR data to differ from the results of our competitive survey. Nonetheless, STR data provide the best indication of aggregate growth or decline in existing supply and demand; thus, these trends have been considered in our analysis. Opening dates, as available, are presented for each reporting hotel in the previous table. The STR data for the competitive set reflect a market-wide occupancy level of 2016 in 61.9%, which compares to 62.1% for 2015. The overall average occupancy level for the calendar years presented equates to 61.9%. The STR data for the competitive set reflect a market-wide average rate level of $99.15 in 2016, which compares to $100.37 For 2015. The average across all calendar years presented for average rate equates to $93.89. These occupancy and average rate trends resulted in a RevPAR level of $61.35 in 2016. Following the Great Recession, RevPAR rose 18.0% in 2011, as increased economic activity along Chandler's nearby Price Road Corridor allowed the greater Chandler submarket to recover at a quicker pace than the rest of region that year. Nonetheless, the majority of the selected competitive set is located along the Interstate 10 Corridor in Chandler, set back from the main concentration of commercial demand in the Price Road Corridor. We note that hotels along the Interstate 10 Corridor in Chandler have historically received compression-related room nights during peak periods of demand given the proximity. However, increased commercial demand along the Price Road Corridor from 2012 through 2014 led to increases in new, non-competitive hotel supply that limited the number of compression-related room nights received for the competitive set. This dynamic led to minimal overall RevPAR growth from 2012 through 2014 for the competitive hotels. In 2015, increased demand associated with Super Bowl XLIX in Phoenix helped area hotels to achieve strong average rate (ADR) growth. However, stronger demand growth, coinciding with improvements in the local and state economies, was not enough to offset the modest post-Super Bowl ADR correction and the openings of the Home2 Suites by Hilton and Best Western Plus in 2016. Strong demand growth continued in the year-to-date 2017 period, with the market realizing a 5.6% increase in overall RevPAR. We note that several of the competitive hotels along the Interstate 10 Corridor in Chandler are older structures that feature dated interiors in some instances. Therefore, these hotels have realized modest ADR erosion in the year-to-date period as they seek to provide a more cost-effective alternative to newer hotels opening in the greater Chandler market. The outlook for this market is cautiously optimistic, despite a large amount of new supply, given

February-2018 Supply and Demand Analysis Proposed Extended-Stay Hotel – Maricopa, Arizona 53
major office developments and expansions of high-technology firms, such as Intel and Orbital ATK. Monthly occupancy and average rate trends are presented in the following tables.
Seasonality

February-2018 Supply and Demand Analysis Proposed Extended-Stay Hotel – Maricopa, Arizona 54
FIGURE 4-5 MONTHLY OCCUPANCY TRENDS
Month 2007 2008 2009 2010 2011 2012 2013 2014 2015 2016 2017
January 82.0 % 72.2 % 56.6 % 56.7 % 73.3 % 67.4 % 59.7 % 67.7 % 65.8 % 67.0 % 67.6 %February 88.1 82.3 70.3 71.6 82.4 81.6 75.8 86.8 83.8 80.8 81.0Ma rch 93.5 78.4 67.0 77.2 89.6 90.8 83.9 89.9 89.3 87.1 87.2Apri l 80.9 76.9 55.1 58.9 66.6 63.7 62.9 70.0 61.5 68.4 71.5Ma y 71.5 61.3 46.0 48.1 63.9 57.2 55.5 59.6 54.6 60.8 57.5June 68.0 56.3 45.5 42.4 54.5 50.5 50.7 47.5 51.0 54.2 53.1July 61.0 54.8 40.9 41.5 49.8 45.1 52.1 46.3 48.4 40.1 51.9August 66.8 52.5 42.6 39.4 52.9 48.5 53.8 46.1 48.5 41.8 55.7September 63.4 62.2 53.4 46.3 52.4 47.6 54.4 50.3 51.1 53.6 58.4October 77.6 68.6 52.6 58.4 62.8 56.1 68.8 61.5 64.2 68.3 71.9November 76.2 66.9 61.8 68.9 65.1 58.7 74.3 63.2 72.7 70.4 75.4December 63.8 49.6 46.4 61.8 54.1 49.8 58.6 51.9 55.6 61.5 —
Annual Occupancy 74.3 % 65.0 % 53.0 % 55.8 % 63.8 % 59.6 % 62.5 % 61.6 % 62.1 % 61.9 % —
Year-to-Date 75.3 % 66.4 % 53.6 % 55.3 % 64.7 % 60.5 % 62.8 % 62.5 % 62.7 % 61.9 % 66.4 %
Source: STR
FIGURE 4-6 MONTHLY AVERAGE RATE TRENDS
Month 2007 2008 2009 2010 2011 2012 2013 2014 2015 2016 2017
January $120.71 $134.90 $116.19 $92.76 $90.43 $91.78 $99.63 $98.13 $125.56 $113.07 $102.68February 125.52 148.64 124.89 102.51 97.80 102.87 113.75 114.09 133.91 136.76 136.40March 128.83 135.69 117.31 99.15 103.56 110.83 119.11 126.39 145.41 154.07 155.16Apri l 117.46 125.15 105.28 85.97 91.40 96.16 96.68 100.95 104.61 105.94 103.20May 106.23 109.40 85.38 79.25 81.38 87.97 84.31 84.78 89.63 88.94 84.54June 87.99 93.03 75.34 72.95 75.13 77.73 76.95 73.63 73.54 77.22 74.66July 85.94 86.50 72.08 69.87 71.52 77.07 73.71 71.72 70.38 72.85 69.30Augus t 85.33 84.80 70.71 70.92 72.75 74.77 71.75 69.99 67.71 72.59 68.99September 99.30 98.94 80.39 75.98 81.00 82.49 79.28 78.48 79.51 77.54 76.86October 107.89 103.31 86.85 80.70 89.91 89.97 87.90 84.24 86.08 86.31 86.18November 108.87 103.23 88.11 81.92 88.46 90.61 89.75 87.55 90.28 92.95 90.21December 104.43 99.68 84.84 79.13 81.62 86.12 85.21 86.30 84.95 86.32 —
Annual Average Rate $108.13 $112.83 $94.67 $84.30 $86.99 $91.13 $91.71 $93.26 $100.37 $99.15 —
Year-to-Date $108.42 $113.74 $95.46 $84.84 $87.41 $91.52 $92.27 $93.79 $101.64 $100.54 $99.10
Source: STR

February-2018 Supply and Demand Analysis Proposed Extended-Stay Hotel – Maricopa, Arizona 55
FIGURE 4-7 SEASONALITY
2007 2008 2009 2010 2011 2012 2013 2014 2015 2016 2017
High Season - February, March Occupancy 90.9 % 80.3 % 68.6 % 74.5 % 86.2 % 86.4 % 80.1 % 88.4 % 86.7 % 84.1 % 84.3 %Average Rate $127.31 $141.99 $121.00 $100.68 $100.95 $107.26 $116.70 $120.66 $140.14 $146.18 $146.60RevPAR 115.74 113.95 82.95 75.02 87.00 92.69 93.42 106.67 121.44 122.92 123.57
Shoulder Season - January, April, November Occupancy 79.7 % 72.0 % 57.8 % 61.4 % 68.4 % 63.3 % 65.6 % 67.0 % 66.6 % 68.8 % 71.5 %Average Rate $115.89 $121.77 $102.86 $86.61 $90.12 $92.88 $95.00 $95.81 $106.50 $102.73 $98.51RevPAR 92.41 87.65 59.46 53.20 61.67 58.78 62.30 64.17 70.98 70.64 70.41
Low Season - May, June, July, August, September, October, December Occupancy 67.5 % 57.9 % 46.7 % 48.3 % 55.8 % 50.7 % 56.3 % 51.9 % 53.4 % 54.3 % 58.1 %Average Rate $97.16 $97.03 $79.78 $76.13 $79.45 $82.67 $80.33 $79.06 $79.42 $81.23 $77.35RevPAR 65.55 56.15 37.29 36.78 44.31 41.91 45.23 41.04 42.41 44.12 44.94
Source: Smith Travel Res earch

February-2018 Supply and Demand Analysis Proposed Extended-Stay Hotel – Maricopa, Arizona 56
The illustrated monthly occupancy and average rates patterns reflect important seasonal characteristics. We have reviewed these trends in developing our forthcoming forecast of market-wide demand and average rate. Leisure demand in the market area is highly seasonal, regularly pushing occupancy levels into the high 80s to low 90s in February and March. The region's warm weather is popular among travelers from the northern United States; furthermore, 15 Major League Baseball (MLB) teams host Spring Training at facilities across the region, attracting hundreds of thousands of fans to the area. Leisure demand is significantly lower throughout the hot summer months. ADR levels follow similar trends to those of occupancy, allowing for average rates to reach the low $160s. A review of the trends in occupancy and average rate by day of the week provides some insight into the impact that the current economic conditions have had on the competitive lodging market. The data, as provided by STR, are illustrated in the following table(s).
Patterns of Demand

February-2018 Supply and Demand Analysis Proposed Extended-Stay Hotel – Maricopa, Arizona 57
FIGURE 4-8 OCCUPANCY BY DAY OF WEEK (TRAILING 12 MONTHS)
Month Sunday Monday Tuesday Wednesday Thursday Friday Saturday Total Month
Dec - 16 51.2 % 62.1 % 65.7 % 65.6 % 60.8 % 59.7 % 65.4 % 61.5 %Jan - 17 54.4 66.3 77.6 76.8 69.9 63.6 66.0 67.6Feb - 17 66.7 76.5 89.1 90.0 84.0 82.0 78.8 81.0Mar - 17 65.1 85.0 94.7 94.2 90.3 88.1 90.5 87.2Apr - 17 55.7 69.1 77.5 79.5 71.8 72.5 76.9 71.5May - 17 44.5 50.3 60.7 64.7 60.1 57.5 63.8 57.5Jun - 17 42.0 52.8 60.8 58.9 53.9 50.7 52.8 53.1Jul - 17 42.6 50.1 53.1 55.1 51.3 53.6 58.4 51.9Aug - 17 44.3 56.8 60.1 58.2 54.6 56.9 57.5 55.7Sep - 17 47.7 54.6 64.5 63.2 58.1 57.0 62.7 58.4Oct - 17 55.2 68.2 73.1 77.9 75.2 77.4 81.1 71.9Nov - 17 64.3 67.0 72.6 75.7 81.4 83.1 82.4 75.4
Average 52.8 % 62.9 % 70.6 % 71.8 % 67.7 % 66.6 % 69.4 % 66.0 %
Source: STR
FIGURE 4-9 AVERAGE RATE BY DAY OF WEEK (TRAILING 12 MONTHS)
Month Sunday Monday Tuesday Wednesday Thursday Friday Saturday Total Month
Dec - 16 $82.83 $85.74 $89.41 $87.29 $83.73 $86.90 $87.56 $86.32Jan - 17 94.93 103.27 110.30 109.23 101.83 96.15 98.32 102.68Feb - 17 129.22 133.65 144.01 142.76 138.44 132.70 130.97 136.40Mar - 17 141.79 150.84 156.18 160.42 160.14 154.06 156.07 155.16Apr - 17 98.85 110.26 105.16 105.63 97.78 98.02 105.64 103.20May - 17 79.73 87.04 88.39 88.42 87.06 78.08 79.39 84.54Jun - 17 71.60 78.05 78.09 78.90 75.68 69.32 70.11 74.66Jul - 17 67.24 71.35 72.27 72.84 70.40 65.68 66.10 69.30Aug - 17 66.21 71.71 72.11 72.17 69.42 64.28 64.46 68.99Sep - 17 72.07 81.16 83.40 82.30 78.25 71.42 70.96 76.86Oct - 17 81.88 85.53 87.75 89.69 86.10 84.35 87.20 86.18Nov - 17 85.23 89.37 91.46 91.95 91.02 90.25 90.65 90.21
Average $91.97 $98.34 $101.48 $103.10 $99.45 $95.54 $94.94 $98.08
Source: STR
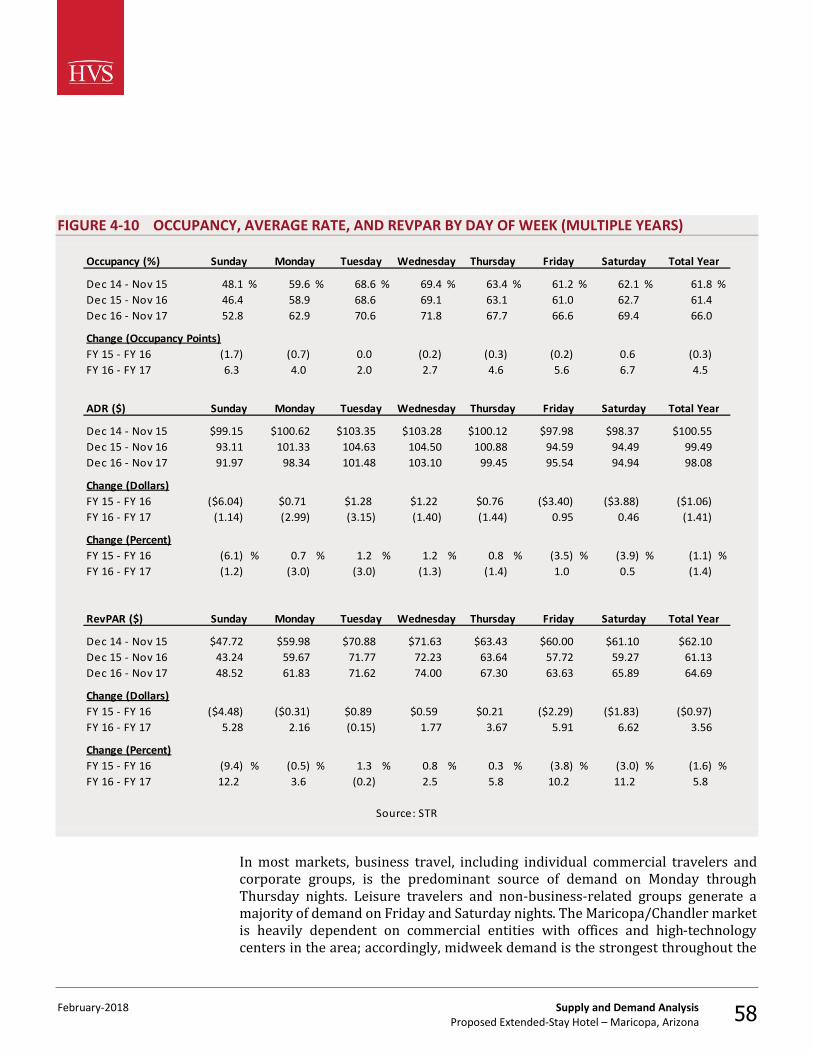
February-2018 Supply and Demand Analysis Proposed Extended-Stay Hotel – Maricopa, Arizona 58
FIGURE 4-10 OCCUPANCY, AVERAGE RATE, AND REVPAR BY DAY OF WEEK (MULTIPLE YEARS)
Occupancy (%)
Dec 14 - Nov 15 48.1 % 59.6 % 68.6 % 69.4 % 63.4 % 61.2 % 62.1 % 61.8 %Dec 15 - Nov 16 46.4 58.9 68.6 69.1 63.1 61.0 62.7 61.4Dec 16 - Nov 17 52.8 62.9 70.6 71.8 67.7 66.6 69.4 66.0
Change (Occupancy Points)FY 15 - FY 16 (1.7) (0.7) 0.0 (0.2) (0.3) (0.2) 0.6 (0.3)FY 16 - FY 17 6.3 4.0 2.0 2.7 4.6 5.6 6.7 4.5
ADR ($)
Dec 14 - Nov 15 $99.15 $100.62 $103.35 $103.28 $100.12 $97.98 $98.37 $100.55Dec 15 - Nov 16 93.11 101.33 104.63 104.50 100.88 94.59 94.49 99.49Dec 16 - Nov 17 91.97 98.34 101.48 103.10 99.45 95.54 94.94 98.08
Change (Dollars)FY 15 - FY 16 ($6.04) $0.71 $1.28 $1.22 $0.76 ($3.40) ($3.88) ($1.06)FY 16 - FY 17 (1.14) (2.99) (3.15) (1.40) (1.44) 0.95 0.46 (1.41)
Change (Percent)FY 15 - FY 16 (6.1) % 0.7 % 1.2 % 1.2 % 0.8 % (3.5) % (3.9) % (1.1) %FY 16 - FY 17 (1.2) (3.0) (3.0) (1.3) (1.4) 1.0 0.5 (1.4)
RevPAR ($)
Dec 14 - Nov 15 $47.72 $59.98 $70.88 $71.63 $63.43 $60.00 $61.10 $62.10Dec 15 - Nov 16 43.24 59.67 71.77 72.23 63.64 57.72 59.27 61.13Dec 16 - Nov 17 48.52 61.83 71.62 74.00 67.30 63.63 65.89 64.69
Change (Dollars)FY 15 - FY 16 ($4.48) ($0.31) $0.89 $0.59 $0.21 ($2.29) ($1.83) ($0.97)FY 16 - FY 17 5.28 2.16 (0.15) 1.77 3.67 5.91 6.62 3.56
Change (Percent)FY 15 - FY 16 (9.4) % (0.5) % 1.3 % 0.8 % 0.3 % (3.8) % (3.0) % (1.6) %FY 16 - FY 17 12.2 3.6 (0.2) 2.5 5.8 10.2 11.2 5.8
Source: STR
Total Year
Sunday Monday Tuesday Total Year
Wednesday Saturday
Wednesday Thursday Friday Saturday
Total YearSaturday
Friday
Thursday FridayWednesday
Sunday Monday Tuesday Thursday
Sunday Monday Tuesday
In most markets, business travel, including individual commercial travelers and corporate groups, is the predominant source of demand on Monday through Thursday nights. Leisure travelers and non-business-related groups generate a majority of demand on Friday and Saturday nights. The Maricopa/Chandler market is heavily dependent on commercial entities with offices and high-technology centers in the area; accordingly, midweek demand is the strongest throughout the

February-2018 Supply and Demand Analysis Proposed Extended-Stay Hotel – Maricopa, Arizona 59
year. Demand spikes from Monday through Saturday nights during the market's peak season, primarily due to the popularity of MLB's Spring Training and other events held in the area during that time. Based on an evaluation of the occupancy, rate structure, market orientation, chain affiliation, location, facilities, amenities, reputation, and quality of each area hotel, as well as the comments of management representatives, we have identified several properties that are expected to be primarily competitive with the proposed subject hotel. If applicable, additional lodging facilities may be judged only secondarily competitive; although the facilities, rate structures, or market orientations of these hotels prevent their inclusion among the primary competitive supply, they are expected to compete with the proposed subject hotel to some extent. The following table summarizes the important operating characteristics of the future primary competitors and the aggregate secondary competitors (if applicable). This information was compiled from personal interviews, inspections, online resources, and our in-house database of operating and hotel facility data.
SUPPLY
Primary Competition

February-2018 Supply and Demand Analysis Proposed Extended-Stay Hotel – Maricopa, Arizona 60
FIGURE 4-11 PRIMARY COMPETITORS – OPERATING PERFORMANCE
Est. Segmentation Estimated 2015 Estimated 2016
Property Occ. RevPAR RevPAROccupancy Penetration
Yield Penetration
Homewood Sui tes by Hi l ton Phoenix Chandler 83 35 % 40 % 20 % 5 % 83 65 - 70 % $115 - $120 $75 - $80 83 70 - 75 % $115 - $120 $80 - $85 110 - 120 % 110 - 120 %
Home2 Sui tes by Hi l ton Phoenix Chandler 126 50 30 15 5 0 — — — 73 40 - 45 95 - 100 40 - 45 70 - 75 55 - 60
Hampton Inn Phoenix Chandler 101 15 50 25 10 101 65 - 70 105 - 110 65 - 70 101 65 - 70 105 - 110 70 - 75 100 - 110 100 - 110
Fairfield Inn by Marriott Phoenix Chandler 64 15 50 25 10 64 60 - 65 90 - 95 55 - 60 64 60 - 65 90 - 95 55 - 60 100 - 110 80 - 85
Hol iday Inn Express Hotel & Sui tes Phoenix Chandler 125 15 50 25 10 125 60 - 65 90 - 95 60 - 65 125 60 - 65 90 - 95 55 - 60 100 - 110 80 - 85
Sub-Totals/Averages 499 28 % 43 % 21 % 8 % 373 65.6 % $101.97 $66.89 446 62.9 % $101.24 $63.73 101.1 % 90.8 %
Seconda ry Competi tors 810 7 % 26 % 36 % 30 % 428 60.0 % $129.57 $77.78 475 61.6 % $123.80 $76.30 99.0 % 108.7 %
Totals/Averages 1,309 18 % 35 % 28 % 19 % 801 62.6 % $116.12 $72.71 921 62.3 % $112.75 $70.21 100.0 % 100.0 %
* Specific occupancy and average rate data were utilized in our analysis, but are presented in ranges in the above table for the purposes of confidentiality.
Weighted Annual Room Count
Weighted Annual Room Count Average RateEx
tend
ed-S
tay
Com
mer
cial
Leisu
re
Grou
pNumber of Rooms Average Rate Occ.

February-2018 Supply and Demand Analysis Proposed Extended-Stay Hotel – Maricopa, Arizona 61
FIGURE 4-12 PRIMARY COMPETITORS – FACILITY PROFILES
PropertyNumber of
RoomsYear
OpenedLast Major
Renovation(s) Food and Beverage Outlets
Indoor Meeting
Space (SF) Facilities & Amenities
Homewood Sui tes by Hi l ton Phoenix Chandler 83 1998 240 7373 Wes t Detroit Street
Home2 Sui tes by Hi l ton Phoenix Chandl er 126 2016 — — 2490 Wes t Queen Creek Road
Hampton Inn Phoenix Chandler 101 1997 2007 450 7333 Wes t Detroit Street
Fa irfield Inn by Marriott Phoenix Chandler 64 1995 2013 — 7425 Wes t Chandl er Boulevard
Hol iday Inn Expres s Hotel & Sui tes Phoenix Chandl er 125 1998 2008 840 15221 South 50th Street
Breakfast Dining Area
Breakfast Dining Area Ai rport/Loca l Shuttle; Gues t Laundry Area; Outdoor Swimmi ng Pool ; Outdoor Whirl pool
Breakfast Dining Area Bus iness Center; Guest Laundry Area; Outdoor Swimming Pool ; Fi tnes s Center; Indoor Whirlpool
Bus iness Center; Guest Laundry Area; Concierge; Market Pantry; Outdoor Swimming Pool ; Fi tness Center; Indoor Whirlpool
Breakfast Dining Area Gues t Laundry Area; Outdoor Swimming Pool ; Fi tness Room; Lobby Workstation; Vending Area(s ); Outdoor Pati o & Barbecue Area; Outdoor Pati o & Fire Pi t; Outdoor Whirlpool
Breakfast Dining Area Lobby Workstation; Outdoor Swimmi ng Pool ; Fi tnes s Center; Indoor Whi rlpool

February-2018 Supply and Demand Analysis Proposed Extended-Stay Hotel – Maricopa, Arizona 62
The following map illustrates the locations of the subject property and its future competitors.
MAP OF COMPETITION
Our survey of the primarily competitive hotels in the local market shows a range of lodging types and facilities. Each primary competitor was inspected and evaluated. Descriptions of our findings are presented below.

February-2018 Supply and Demand Analysis Proposed Extended-Stay Hotel – Maricopa, Arizona 63
PRIMARY COMPETITOR #1 - HOMEWOOD SUITES BY HILTON PHOENIX CHANDLER
FIGURE 4-13 ESTIMATED HISTORICAL OPERATING STATISTICS
YearWtd. Annual Room Count Occupancy RevPAR
Occupancy Penetration
Yield Penetration
Est. 2015 83 65 - 70 115 - 120 75 - 80 100 - 110 100 - 110Est. 2016 83 70 - 75 115 - 120 80 - 85 110 - 120 110 - 120
Average Rate
This hotel benefits from its strong Hilton brand affiliation and location along Interstate 10, but is somewhat disadvantaged by its lack of recent property-wide renovations. Overall, the property appeared to be in good condition. Its accessibility is similar to that of the assumed subject site, and its visibility is similar to the expected visibility of the Proposed Extended-Stay Hotel.
Homewood Suites by Hilton Phoenix Chandler 7373 West Detroit Street Chandler, AZ
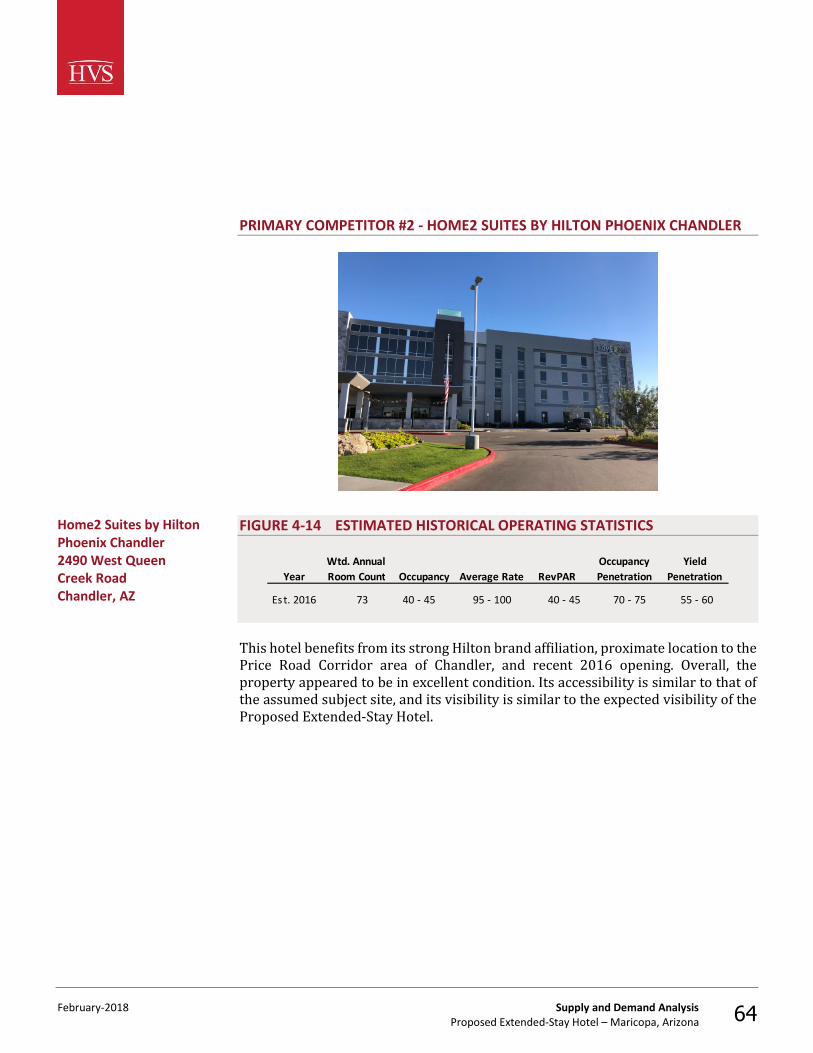
February-2018 Supply and Demand Analysis Proposed Extended-Stay Hotel – Maricopa, Arizona 64
PRIMARY COMPETITOR #2 - HOME2 SUITES BY HILTON PHOENIX CHANDLER
FIGURE 4-14 ESTIMATED HISTORICAL OPERATING STATISTICS
YearWtd. Annual Room Count Occupancy RevPAR
Occupancy Penetration
Yield Penetration
Est. 2016 73 40 - 45 95 - 100 40 - 45 70 - 75 55 - 60
Average Rate
This hotel benefits from its strong Hilton brand affiliation, proximate location to the Price Road Corridor area of Chandler, and recent 2016 opening. Overall, the property appeared to be in excellent condition. Its accessibility is similar to that of the assumed subject site, and its visibility is similar to the expected visibility of the Proposed Extended-Stay Hotel.
Home2 Suites by Hilton Phoenix Chandler 2490 West Queen Creek Road Chandler, AZ

February-2018 Supply and Demand Analysis Proposed Extended-Stay Hotel – Maricopa, Arizona 65
PRIMARY COMPETITOR #3 - HAMPTON INN PHOENIX CHANDLER
FIGURE 4-15 ESTIMATED HISTORICAL OPERATING STATISTICS
YearWtd. Annual Room Count Occupancy RevPAR
Occupancy Penetration
Yield Penetration
Est. 2015 101 65 - 70 105 - 110 65 - 70 100 - 110 90 - 95Est. 2016 101 65 - 70 105 - 110 70 - 75 100 - 110 100 - 110
Average Rate
This hotel benefits from its strong Hilton brand affiliation and location along Interstate 10, but is somewhat disadvantaged by its lack of recent property-wide renovations. Overall, the property appeared to be in good condition. Its accessibility is similar to that of the assumed subject site, and its visibility is similar to the expected visibility of the Proposed Extended-Stay Hotel.
Hampton Inn Phoenix Chandler 7333 West Detroit Street Chandler, AZ

February-2018 Supply and Demand Analysis Proposed Extended-Stay Hotel – Maricopa, Arizona 66
PRIMARY COMPETITOR #4 - FAIRFIELD INN BY MARRIOTT PHOENIX CHANDLER
FIGURE 4-16 ESTIMATED HISTORICAL OPERATING STATISTICS
YearWtd. Annual Room Count Occupancy RevPAR
Occupancy Penetration
Yield Penetration
Est. 2015 64 60 - 65 90 - 95 55 - 60 100 - 110 75 - 80Est. 2016 64 60 - 65 90 - 95 55 - 60 100 - 110 80 - 85
Average Rate
This hotel benefits from its strong Marriott brand affiliation and location along Interstate 10, but is somewhat disadvantaged by its lack of recent property-wide renovations. Overall, the property appeared to be in good condition. Its accessibility is similar to that of the assumed subject site, and its visibility is similar to the expected visibility of the Proposed Extended-Stay Hotel.
Fairfield Inn by Marriott Phoenix Chandler 7425 West Chandler Boulevard Chandler, AZ

February-2018 Supply and Demand Analysis Proposed Extended-Stay Hotel – Maricopa, Arizona 67
PRIMARY COMPETITOR #5 - HOLIDAY INN EXPRESS HOTEL & SUITES PHOENIX CHANDLER
FIGURE 4-17 ESTIMATED HISTORICAL OPERATING STATISTICS
YearWtd. Annual Room Count Occupancy RevPAR
Occupancy Penetration
Yield Penetration
Est. 2015 125 60 - 65 90 - 95 60 - 65 100 - 110 80 - 85Est. 2016 125 60 - 65 90 - 95 55 - 60 100 - 110 80 - 85
Average Rate
This hotel benefits from its strong IHG brand affiliation and location along Interstate 10, but is somewhat disadvantaged by its lack of recent property-wide renovations. Overall, the property appeared to be in good condition. Its accessibility is similar to the accessibility attributes of the assumed subject site, while its visibility is similar to the expected visibility of the Proposed Extended-Stay Hotel.
Holiday Inn Express Hotel & Suites Phoenix Chandler 15221 South 50th Street Phoenix, AZ

February-2018 Supply and Demand Analysis Proposed Extended-Stay Hotel – Maricopa, Arizona 68
We have also reviewed other area lodging facilities to determine whether any may compete with the proposed subject hotel on a secondary basis. The room count of each secondary competitor has been weighted based on its assumed degree of competitiveness in the future with the proposed subject hotel. By assigning degrees of competitiveness, we can assess how the proposed subject hotel and its future competitors may react to various changes in the market, including new supply, changes to demand generators, and renovations or franchise changes of existing supply. The following table sets forth the pertinent operating characteristics of the secondary competitors.
Secondary Competitors

February-2018 Supply and Demand Analysis Proposed Extended-Stay Hotel – Maricopa, Arizona 69
FIGURE 4-18 SECONDARY COMPETITOR(S) – OPERATING PERFORMANCE
Est. Segmentation Estimated 2015 Estimated 2016
PropertyNumber of
Rooms Occ. Average Rate RevPAR Occ. Average Rate RevPAR
Best Western Plus Chandler Hotel & Sui tes 87 10 % 45 % 35 % 10 % 80 % 0 — % — — 46 60 - 65 % $85 - $90 $50 - $55
La Quinta Inn & Sui tes Phoenix Chandler 117 10 40 40 10 80 94 60 - 65 80 - 85 50 - 55 94 60 - 65 80 - 85 50 - 55
Hol iday Inn & Suites Phoenix Chandler 106 10 30 55 5 80 85 45 - 50 115 - 120 55 - 60 85 55 - 60 115 - 120 65 - 70
Sheraton Wild Horse Pass Resort & Spa 500 5 15 30 50 50 250 60 - 65 150 - 160 90 - 95 250 60 - 65 140 - 150 90 - 95
Totals/Averages 810 7 % 26 % 36 % 30 % 61 % 428 60.0 % $129.57 $77.78 475 61.6 % $123.80 $76.30
* Specific occupancy and average rate data was utilized in our analysis, but is presented in ranges in the above table for the purposes of confidentiality.
Grou
p
Total Competitive
Level
Weighted Annual Room Count
Weighted Annual Room CountLe
isure
Exte
nded
-Sta
y
Com
mer
cial

February-2018 Supply and Demand Analysis Proposed Extended-Stay Hotel – Maricopa, Arizona 70
We have identified four hotels that are expected to compete with the proposed subject hotel on a secondary level. The Best Western Plus and La Quinta Inn & Suites are anticipated to be competitive based on their proximate location to Maricopa along Interstate 10 in southern Chandler; however, these hotels offer midscale product types at lower price points. The Holiday Inn & Suites is located in southern Chandler, near numerous demand sources near Maricopa, but has been weighted secondary given its full-service product type. Lastly, the Sheraton is expected to compete for similar automotive and group demand sources, but is not anticipated to compete directly given its full-service product type, higher price point, and association with the Wild Horse Pass casino. It is important to consider any new hotels that may have an impact on the proposed subject hotel’s operating performance. The following chart sets forth the hotels that have recently opened, are under construction, or are in the stages of early development in the Maricopa area. The list is categorized by the principal submarkets within the city.
FIGURE 4-19 AREA DEVELOPMENT ACTIVITY
Proposed Hotel Name Hotel Product Tier Development Stage AddressPropos ed Hotel 0
Southern Chandler/MaricopaHarrah's Ak-Chin Cas ino Res ort Expansion 230 Upsca le Under Cons truction Q2 '18 15406 N Maricopa Rd, Maricopa, AZResidence Inn by Marriott 142 Upsca le Under Cons truction Q2 '18 West of Dobson Road & Edgewater Way, Chandler, AZHol iday Inn & Sui tes Phoenix Chandler converting to DoubleTree by Hi l ton
159 Upsca le Under Cons truction Q2 '18 1200 W Ocoti l lo Rd, Cha ndler, AZ
Estimated Number of
Rooms
Expected Qtr. & Year of Opening
Of the hotels listed in the preceding chart, we have identified the following new supply that is expected to have some degree of competitive interaction with the proposed subject hotel, based on location, anticipated market orientation and price point, and/or operating profile.
FIGURE 4-20 NEW SUPPLY
Total
Proposed PropertyNumber
of Rooms Competitive
LevelEstimated Opening
Date Development Stage
Proposed Subject Property 100 100 % 100 July 1, 2020 Early DevelopmentRes idence Inn by Ma rriott 142 80 114 June 1, 2018 Under Construction
Totals/Averages 242 214
Weighted Room Count
The proposed Residence Inn by Marriott will be similar to the proposed subject hotel in terms of product offering and service level; however, this property has been weighted secondarily competitive in our analysis given its anticipated higher price point. Furthermore, we note that the Harrah’s Ak-Chin Casino Resort has not been included in our analysis given its positioning as a casino-hotel. These types of
Supply Changes

February-2018 Supply and Demand Analysis Proposed Extended-Stay Hotel – Maricopa, Arizona 71
properties typically offer guestrooms at a discounted rate to attract patrons to the casino component of the property. Since these hotels operate in an atypical fashion and generate their own demand, we believe it is appropriate to omit the Harrah’s Ak-Chin Casino Resort from the analysis. We note several other hotels are proposed for locations in the Chandler market, but are in the preliminary stages of development; therefore, we have only considered them qualitatively in our analysis. While we have taken reasonable steps to investigate proposed hotel projects and their status, due to the nature of real estate development, it is impossible to determine with certainty every hotel that will be opened in the future, or what their marketing strategies and effect in the market will be. Depending on the outcome of current and future projects, the future operating potential of the proposed subject hotel may be affected. Future improvement in market conditions will raise the risk of increased competition. Our forthcoming forecast of stabilized occupancy and average rate is intended to reflect such risk. We have identified various properties that are expected to be competitive to some degree with the proposed subject hotel. We have also investigated potential increases in competitive supply in this Maricopa submarket. The Proposed Extended-Stay Hotel should enter a dynamic market of varying product types and price points. Next, we will present our forecast for demand change, using the historical supply data presented as a starting point. The following table presents the most recent trends for the subject hotel market as tracked by HVS. These data pertain to the competitors discussed previously in this section; performance results are estimated, rounded for the competition, and in some cases weighted if there are secondary competitors present. In this respect, the information in the table differs from the previously presented STR data and is consistent with the supply and demand analysis developed for this report.
FIGURE 4-21 HISTORICAL MARKET TRENDS
Year
Es t. 2015 209,313 14.3 % 336,136 14.9 % 62.3 112.75 (2.9) % 70.21 (3.4) %Es t. 2016 243,540 16.4 363,905 8.3 66.9 110.84 (1.7) 74.18 5.6
Avg. Annua l Compounded Chg., Es t. 2014-Est. 2016: 15.3 % 11.5 % (2.3) % 1.0 %
% ChangeMarket
Occupancy Market ADR% ChangeRoom Nights
Available % Change % ChangeMarket RevPAR
Accommodated Room Nights
For the purpose of demand analysis, the overall market is divided into individual segments based on the nature of travel. Based on our fieldwork, area analysis, and knowledge of the local lodging market, we estimate the 2017 distribution of accommodated-room-night demand as follows.
Supply Conclusion
DEMAND
Demand Analysis Using Market Segmentation

February-2018 Supply and Demand Analysis Proposed Extended-Stay Hotel – Maricopa, Arizona 72
FIGURE 4-22 ACCOMMODATED ROOM-NIGHT DEMAND
Marketwide
Market Segment
Extended-Stay 43,821 18 %Commercia l 85,211 35Leisure 69,257 28Group 45,251 19
Total 243,540 100 %
Accommodated Demand
Percentage of Total
The market’s demand mix comprises extended-stay demand, with this segment representing roughly 18% of the accommodated room nights in this Maricopa submarket. The commercial segment comprises 35% of the total, with the final portions leisure in nature, reflecting 28%. Using the distribution of accommodated hotel demand as a starting point, we will analyze the characteristics of each market segment in an effort to determine future trends in room-night demand. Extended-stay demand consists of individuals who require accommodations for more than five nights; typically, the length of stay ranges from ten to fourteen nights, but can stretch to a month or more. The three principal categories of extended-stay demand are business-related (typically associated with long-term projects), family-oriented, and relocation demand. Extended-stay patrons usually prefer hotels located near shopping centers, restaurants, entertainment venues, and service-retail uses such as grocery stores, dry cleaners, and fueling stations. Extended-stay demand tends to trend in line with an area’s corporate expansion and/or population growth; commercial growth has a direct correlation with longer-term training activities that may be occurring in the area, while changes in population typically support related relocation demand. Large-scale construction projects, prevalent in growing metropolitan areas, also generate significant levels of extended-stay demand. Extended-stay demand in the Chandler area is generated primarily by corporate operations related to the expansive facilities of Intel, Bank of America, and Wells Fargo. In Maricopa, hot-weather test teams from across the world provide the majority of extended-stay demand in the market. In addition, the soon-to-be-open Apex Motor Club is expected to align itself with a manufacturing school partner in the near future, which will bring demand to the market for extended trips. Easy access to restaurants and shopping is sought after by travelers in the area on longer-term stays, and these establishments are prevalent throughout the market. These factors should allow for strong growth within this demand segment through the projection period.
Extended-Stay Segment

February-2018 Supply and Demand Analysis Proposed Extended-Stay Hotel – Maricopa, Arizona 73
Commercial demand consists mainly of individual businesspeople passing through the subject market or visiting area businesses, in addition to high-volume corporate accounts generated by local firms. Brand loyalty (particularly frequent-traveler programs), as well as location and convenience with respect to businesses and amenities, influence lodging choices in this segment. Companies typically designate hotels as “preferred” accommodations in return for more favorable rates, which are discounted in proportion to the number of room nights produced by a commercial client. Commercial demand is strongest Monday through Thursday nights, declines significantly on Friday and Saturday, and increases somewhat on Sunday night. It is relatively constant throughout the year, with marginal declines in late December and during other holiday periods. An important factor considered in the development of our growth rates is the presence of major corporate and institutional demand generators in nearby Chandler, such as Intel Corporation, Orbital ATK, Wells Fargo, PayPal, and General Motors. Furthermore, our growth rates recognize the presence of commercial demand generators in/around Maricopa, such as the Nissan and VW proving grounds. These entities all have a strong presence in the area, which bodes well for future commercial-related room-night production. As such, we expect strong growth in the commercial segment going forward. Leisure demand consists of individuals and families spending time in an area or passing through en route to other destinations. Travel purposes include sightseeing, recreation, or visiting friends and relatives. Leisure demand also includes room nights booked through Internet sites such as Expedia, Hotels.com, and Priceline; however, leisure may not be the purpose of the stay. This demand may also include business travelers and group and convention attendees who use these channels to take advantage of any discounts that may be available on these sites. Leisure demand is strongest Friday and Saturday nights, and all week during holiday periods and the summer months. These peak periods represent the inverse of commercial visitation trends, underscoring the stabilizing effect of capturing weekend and summer tourist travel. Future leisure demand is related to the overall economic health of the region and the nation. Trends showing changes in state and regional unemployment and disposable personal income correlate strongly with leisure travel levels. Leisure demand in Maricopa/Chandler is largely driven by the Phoenix area's reputation as a vacation spot, with numerous shopping outlets, art galleries, spas, and a high concentration of golf courses prevalent in the area. Leisure demand peaks from January through April given the warmer temperatures in Phoenix during the winter months, compared with the colder climate of the northern states and Canada. Specific leisure demand generators in Maricopa include Duke Golf Club, Ak-Chin Southern Dunes Golf Club, Copper Sky Recreational Complex, and Harrah’s Ak-Chin Casino Resort. Demand related to the leisure segment should continue to expand in the future. The purpose of segmenting the lodging market is to define each major type of demand, identify customer characteristics, and estimate future growth trends. Starting with an analysis of the local area, four segments were defined as
Commercial Segment
Leisure Segment
Base Demand Growth Rates
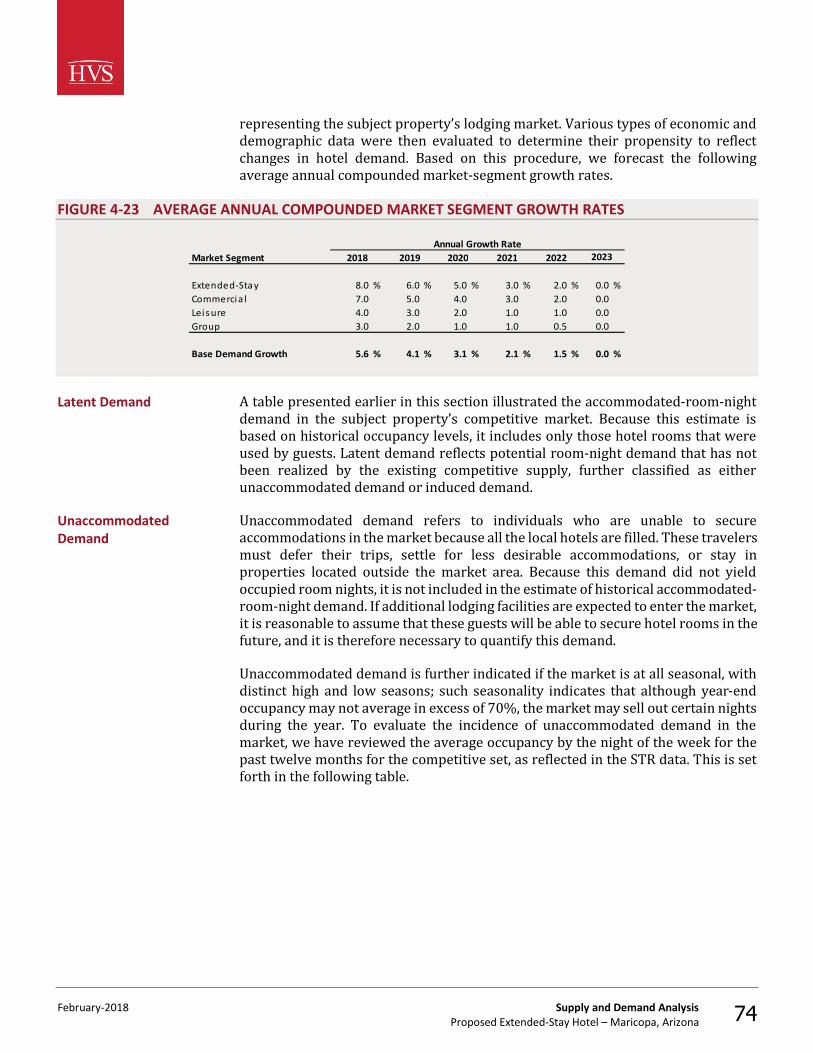
February-2018 Supply and Demand Analysis Proposed Extended-Stay Hotel – Maricopa, Arizona 74
representing the subject property’s lodging market. Various types of economic and demographic data were then evaluated to determine their propensity to reflect changes in hotel demand. Based on this procedure, we forecast the following average annual compounded market-segment growth rates.
FIGURE 4-23 AVERAGE ANNUAL COMPOUNDED MARKET SEGMENT GROWTH RATES
Annual Growth RateMarket Segment
Extended-Stay 8.0 % 6.0 % 5.0 % 3.0 % 2.0 % 0.0 %Commercia l 7.0 5.0 4.0 3.0 2.0 0.0Leisure 4.0 3.0 2.0 1.0 1.0 0.0Group 3.0 2.0 1.0 1.0 0.5 0.0
Base Demand Growth 5.6 % 4.1 % 3.1 % 2.1 % 1.5 % 0.0 %
2018 2019 2020 2021 2022 2023
A table presented earlier in this section illustrated the accommodated-room-night demand in the subject property’s competitive market. Because this estimate is based on historical occupancy levels, it includes only those hotel rooms that were used by guests. Latent demand reflects potential room-night demand that has not been realized by the existing competitive supply, further classified as either unaccommodated demand or induced demand. Unaccommodated demand refers to individuals who are unable to secure accommodations in the market because all the local hotels are filled. These travelers must defer their trips, settle for less desirable accommodations, or stay in properties located outside the market area. Because this demand did not yield occupied room nights, it is not included in the estimate of historical accommodated-room-night demand. If additional lodging facilities are expected to enter the market, it is reasonable to assume that these guests will be able to secure hotel rooms in the future, and it is therefore necessary to quantify this demand. Unaccommodated demand is further indicated if the market is at all seasonal, with distinct high and low seasons; such seasonality indicates that although year-end occupancy may not average in excess of 70%, the market may sell out certain nights during the year. To evaluate the incidence of unaccommodated demand in the market, we have reviewed the average occupancy by the night of the week for the past twelve months for the competitive set, as reflected in the STR data. This is set forth in the following table.
Latent Demand
Unaccommodated Demand

February-2018 Supply and Demand Analysis Proposed Extended-Stay Hotel – Maricopa, Arizona 75
FIGURE 4-24 OCCUPANCY BY NIGHT OF THE WEEK
Month Sunday Monday Tuesday Wednesday Thursday Friday Saturday Total Month
Dec - 16 51.2 % 62.1 % 65.7 % 65.6 % 60.8 % 59.7 % 65.4 % 61.5 %Jan - 17 54.4 66.3 77.6 76.8 69.9 63.6 66.0 67.6Feb - 17 66.7 76.5 89.1 90.0 84.0 82.0 78.8 81.0Mar - 17 65.1 85.0 94.7 94.2 90.3 88.1 90.5 87.2Apr - 17 55.7 69.1 77.5 79.5 71.8 72.5 76.9 71.5May - 17 44.5 50.3 60.7 64.7 60.1 57.5 63.8 57.5Jun - 17 42.0 52.8 60.8 58.9 53.9 50.7 52.8 53.1Jul - 17 42.6 50.1 53.1 55.1 51.3 53.6 58.4 51.9Aug - 17 44.3 56.8 60.1 58.2 54.6 56.9 57.5 55.7Sep - 17 47.7 54.6 64.5 63.2 58.1 57.0 62.7 58.4Oct - 17 55.2 68.2 73.1 77.9 75.2 77.4 81.1 71.9Nov - 17 64.3 67.0 72.6 75.7 81.4 83.1 82.4 75.4
Average 52.8 % 62.9 % 70.6 % 71.8 % 67.7 % 66.6 % 69.4 % 66.0 %
Source: STR
Our interviews with market participants found that the market generally sells out on Monday through Saturday nights during the peak travel season in February and March, as well as sporadically within other periods throughout the year. A portion of this demand, which is currently turned away, should return to the market concurrent with the supply increase. The following table presents our estimate of unaccommodated demand in the subject market. FIGURE 4-25 UNACCOMMODATED DEMAND ESTIMATE
Market Segment
Extended-Stay 43,821 1.6 % 705Commercia l 85,211 1.1 940Leisure 69,257 0.7 470Group 45,251 0.5 235
Total 243,540 1.0 % 2,350
Unaccommodated Demand Percentage
Unaccommodated Room Night Demand
Accommodated Room Night Demand
Accordingly, we have forecast unaccommodated demand equivalent to 1.0% of the base-year demand, resulting from our analysis of monthly and weekly peak demand and sell-out trends. Induced demand represents the additional room nights that are expected to be attracted to the market following the introduction of a new demand generator. Situations that can result in induced demand include the opening of a new manufacturing plant, the expansion of a convention center, or the addition of a new hotel with a distinct chain affiliation or unique facilities. Although increases in
Induced Demand

February-2018 Supply and Demand Analysis Proposed Extended-Stay Hotel – Maricopa, Arizona 76
demand are expected in the local market, we have accounted for this growth in the determination of market-segment growth rates rather than induced demand. Based upon a review of the market dynamics in the subject property’s competitive environment, we have forecast growth rates for each market segment. Using the calculated potential demand for the market, we have determined market-wide accommodated demand based on the inherent limitations of demand fluctuations and other factors in the market area. The following table details our projection of lodging demand growth for the subject market, including the total number of occupied room nights and any residual unaccommodated demand in the market.
Accommodated Demand and Market-wide Occupancy

February-2018 Supply and Demand Analysis Proposed Extended-Stay Hotel – Maricopa, Arizona 77
FIGURE 4-26 FORECAST OF MARKET OCCUPANCY
52,675 54,255 55,341 55,341Unaccommoda ted Demand 847 873 890 890
53,522 55,128 56,231 56,231Growth Rate 5.0 % 3.0 % 2.0 % 0.0 %
99,564 102,551 104,602 104,6021,098 1,131 1,154 1,154
100,662 103,682 105,755 105,7554.0 % 3.0 % 2.0 % 0.0 %
75,672 76,429 77,193 77,193513 519 524 524
76,186 76,947 77,717 77,7172.0 % 1.0 % 1.0 % 0.0 %
48,016 48,496 48,739 48,739Unaccommoda ted Demand 249 252 253 253Tota l Demand 48,265 48,748 48,992 48,992Growth Rate 1.0 % 1.0 % 0.5 % 0.0 %
Base Demand 275,927 281,731 285,874 285,874Unaccommoda ted Demand 2,708 2,774 2,821 2,821Tota l Demand 278,635 284,505 288,695 288,695less : Res idua l Demand 571 0 0 0Tota l Accommodated Demand 278,064 284,505 288,695 288,695Overall Demand Growth 3.3 % 2.3 % 1.5 % 0.0 %Market Mix
19.2 % 19.4 % 19.5 % 19.5 %36.1 36.4 36.6 36.627.3 27.0 26.9 26.9
Group 17.3 17.1 17.0 17.0997 997 997 997
Proposed Subject Property ¹ 50 100 100 100Res idence Inn by Marriott ² 114 114 114 114
Ava i lable Room Nights per Year 423,769 441,869 441,869 441,869Nights per Year 365 365 365 365Total Supply 1,161 1,211 1,211 1,211Rooms Supply Growth 4.5 % 4.3 % 0.0 % 0.0 %
Marketwide Occupancy 65.6 % 64.4 % 65.3 % 65.3 %
¹ Opening in July 2020 of the 100% competi tive, 100-room Proposed Subject Property² Opening in June 2018 of the 80% competi tive, 142-room Res idence Inn by Marriott
Lei sure
Existing Hotel SupplyProposed Hotels
Totals
Extended-StayCommercia l
Tota l DemandGrowth Rate
LeisureBase DemandUnaccommoda ted DemandTota l DemandGrowth Rate
GroupBase Demand
Unaccommoda ted Demand
2023
Base Demand
Tota l Demand
CommercialBase Demand
Extended-Stay
2020 2021 2022
The defined competitive market of hotels should experience consistent demand growth over the next few years, though the entry of new supply will cause occupancy levels to slightly fluctuate as these hotels are absorbed. Based on historical occupancy levels in this market, and taking into consideration typical supply and demand cyclicality, market occupancy is forecast to stabilize in the mid-60s.

February-2018 Description of the Proposed Improvements Proposed Extended-Stay Hotel – Maricopa, Arizona 78
5. Description of the Proposed Improvements
The quality of a lodging facility's physical improvements has a direct influence on marketability, attainable occupancy, and average room rate. The design and functionality of the structure can also affect operating efficiency and overall profitability. This section investigates the subject property's proposed physical improvements and personal property in an effort to determine how they are expected to contribute to attainable cash flows. The Proposed Extended-Stay Hotel is recommended to be an extended-stay lodging facility containing 100 rentable units and is expected to open on July 1, 2020. The Maricopa market area does not contain any non-casino, overnight lodging accommodations. Although primarily a residential community, greater Maricopa is home to automotive proving grounds, a USDA research facility, a first-class event center, top recreational facilities, and a growing retail/restaurant sector, including the soon-to-be-completed Edison Pointe shopping complex. While a particular brand has yet to be determined for the proposed subject property, our study assumes that the proposed subject hotel will operate as a nationally branded, upper-midscale to upscale, extended-stay hotel. This hotel is expected to enjoy a location along State Route 347, a major thoroughfare connecting Maricopa to the greater Phoenix region and Pinal County.
Project Overview

February-2018 Description of the Proposed Improvements Proposed Extended-Stay Hotel – Maricopa, Arizona
79
FIGURE 5-1 COMPARISON OF HISTORICAL AND PROJECTED OCCUPANCY, AVERAGE RATE, AND REVPAR – PROPOSED SUBJECT PROPERTY AND MARKET
2015 2016 2017 2018 2019 2020 2021 2022 2023
Proposed Extended-Stay Hotel
Occupancy — — 59.5 % 64.2 % 70.2 % 70.2 %Change in Points — — — 4.7 6.0 0.0Occupancy Penetration — — 90.7 % 99.7 % 107.5 % 107.5 %
Average Rate $103.00 $104.03 $106.11 $109.29 $112.57 $115.95 $119.43Change — 2.0 % 3.0 % 3.0 % 3.0 % 3.0 %Average Rate Penetra tion 92.9 % 92.9 % 92.9 % 92.9 % 92.9 % 92.9 %
RevPAR — — $65.01 $72.28 $81.43 $83.88Change — — — 11.2 % 12.7 % 3.0 %RevPAR Penetration — — 84.2 % 92.7 % 99.9 % 99.9 %
2015 2016 2017 2018 2019 2020 2021 2022 2023
Maricopa SubmarketOccupancy 62.6 % 62.3 % 66.9 % 66.4 % 66.4 % 65.6 % 64.4 % 65.3 % 65.3 %Change in Points — (0.4) 4.7 (0.5) (0.0) (0.8) (1.2) 0.9 0.0
Average Rate $116.12 $112.75 $110.84 $111.94 $114.18 $117.61 $121.14 $124.77 $128.51Change — (2.9) % (1.7) % 1.0 % 2.0 % 3.0 % 3.0 % 3.0 % 3.0 %
RevPAR $72.71 $70.21 $74.18 $74.34 $75.81 $77.17 $78.00 $81.52 $83.96Change — (3.4) % 5.6 % 0.2 % 2.0 % 1.8 % 1.1 % 4.5 % 3.0 %
* The forecast for the proposed subject property does not include rate discounts that are expected to occur during the initial year(s) of operation.
Projected
Historical (Estimated) Projected

February-2018 Description of the Proposed Improvements Proposed Extended-Stay Hotel – Maricopa, Arizona 80
Branded hotels offer many benefits to a prospective developer, especially in emerging lodging markets such as Maricopa. National hotel brands have established quality standards, which create consistency across their respective platforms. More importantly, these standards have allowed branded hotels to drive occupancy and average rate using reservation systems, loyalty and marketing programs, and mobile applications. Based on our research, we have determined that an upper-midscale to upscale, extended-stay hotel would best fit the Maricopa community. Below is an outlined list of available brands within the upper-midscale to upscale, extended-stay, limited-service hotel segment. We recommend that the proposed subject property operate as an upper-midscale to upscale, extended-stay hotel. While we have placed heavy consideration on the Home2 Suites by Hilton, Staybridge Suites, and TownePlace Suites by Marriott brands, a specific franchise affiliation and/or brand has yet to be finalized. Our projections reflect a nationally branded, upper-midscale to upscale, extended-stay hotel. • Home2 Suites by Hilton is a mid-tier, limited-service, extended-stay hotel by Hilton Inc. that offers contemporary accommodations and a customizable guestroom design; furthermore, the Home2 Suites by Hilton commitment to sustainability is reinforced throughout every aspect of the brand. The hotel’s all-suite configuration provides suites with flexible separate living and bedroom areas (divisible by a drape in the studio suite or partial wall in the one-bedroom suite). The guestroom suites feature an industry-unique “working wall” that incorporates the kitchen and a flexible working/media space; the kitchens include a refrigerator, a microwave, a dishwasher, and other typical kitchen amenities. The media/working zone includes a queen-size sofa sleeper, a 42-inch flat-screen television, a roll-around ottoman, ambient task lighting, an alarm clock with iPod port and MP3 jack, and various pieces of furniture that can be moved around to create customized living spaces and adjustable storage options. As of year-end 2016, there were 136 hotels (15,275 rooms) operating under the Home2 Suites by Hilton brand in the U.S. In 2016, the brand operated at an average occupancy level of 79.1%, with an average daily rate of $116.61 and an average RevPAR of $92.20 (worldwide). • The Staybridge Suites brand is an all-suite, upscale, extended-stay hotel brand owned by InterContinental Hotels Group (IHG). The first Staybridge Suites opened in Atlanta-Alpharetta in 1998. Three suite layouts are usually featured at each property, and each includes a fully equipped kitchen, a functional workstation, and a living area. Rooms also offer two-line speakerphones, voicemail, and complimentary high-speed Internet access. A business center, a 24-hour convenience store, a fitness room, a complimentary breakfast buffet and evening reception, and a guest laundry facility are also typically available on site. As of year-end 2016, there were 226 Staybridge Suites properties (24,185 rooms) in the

February-2018 Description of the Proposed Improvements Proposed Extended-Stay Hotel – Maricopa, Arizona 81
Americas. In 2016, the brand's hotels in the Americas operated at an average occupancy level of 76.8%, with an average daily rate of $116.46 and an average RevPAR of $89.49. • TownePlace Suites by Marriott is Marriott’s mid-priced, upper-midscale, extended-stay brand; the concept, created in 1997, was based on the success of Residence Inn by Marriott. The brand targets business travelers staying for multiple nights or weeks. Each TownePlace Suites by Marriott hotel provides a complimentary breakfast, free Internet, a swimming pool, a fitness room, a market pantry, and a guest laundry room. Guestroom suites offer separate living and working areas, as well as fully equipped kitchens. As of year-end 2016, there were 301 TownePlace Suites by Marriott properties (30,252 rooms) in the U.S. and Canada. The brand achieved an overall occupancy of 74.9% and an average daily rate of $105.54, resulting in an average RevPAR level of $79.02, for its North American properties in 2016. Based on information collected from the competitive market, the following table summarizes the facilities that are recommended to be available at the proposed subject hotel.
FIGURE 5-1 ROOM MIX COMPARISON CHART
Room Count 107Studio Units 91Studio % 85%One-Bedroom Units 16One-Bedroom % 15%Two-Bedroom Units 0Two-Bedroom % 0%6% 0%
Staybridge Suites Phoenix Chandler
Homewood Suites by Hilton Phoenix Chandler
Fashion Center
104 13345 59
94% 90%0 12
0% 10%4
25% 3%
43% 44%33 70
32% 53%5 0
Homewood Suites by Hilton Phoenix/Chandler
Home2 Suites by Hilton Phoenix Chandler
83 12678 114
Residence Inn by Marriott Phoenix
Chandler Fashion Center
TownePlace Suites by Marriott Phoenix
Chandler/Fashion CenterSample Comparables
Ratios/AveragesPositioned Subject
Property*
102 10030 80
29% 64% 80%51 15
21% 9% 5%
50% 26% 15%26 21 5
Summary of the Facilities

February-2018 Description of the Proposed Improvements Proposed Extended-Stay Hotel – Maricopa, Arizona 82
FIGURE 5-1 PROPOSED FACILITIES SUMMARY
Guestroom Configuration
Studio Sui te 80 One-Bedroom Suite 15 Two-Bedroom Suite 5
Tota l 100
Food & Beverage Facilities
Breakfast Dining Area
Indoor Meeting & Banquet Facilities
Meeting Space 450
Amenities & Services
Outdoor Swimming Pool Market PantryOutdoor Whirlpool Guest Laundry AreaFi tness Room Outdoor Patio & Barbecue AreaLobby Workstation
Square Footage
Number of Units
Once guests enter the site, ample parking is expected to be available on the surface lot around the perimeter of the hotel. Site improvements should include freestanding signage, which will likely be located on the northern and southern sides of the site (additional signage should be placed on the exterior of the building). We assume that all signage will adequately identify the property and meet brand standards. Planned landscaping should allow for a positive guest impression and competitive exterior appearance. Sidewalks are anticipated to be present along the front entrance and around the perimeter of the hotel. Other site improvements are expected to include an outdoor pool with sundeck, a barbecue and picnic area, and a trash area toward the rear of the property. Overall, the anticipated site improvements for the property should be adequate for an upper-midscale to upscale, extended-stay hotel. Construction details were not available for our review. It is expected that the hotel structure will be constructed as a wood-frame building with EIFS or stucco finishes and stone accents on the ground level and near the main entrance. Elevators and stairways should provide internal vertical transportation within the main structure as needed. We assume that the building components will be normal for a hotel of its type and will meet the standards for this market. Furthermore, we assume that all structural components will meet local building codes and that no significant defaults
Site Improvements and Hotel Structure
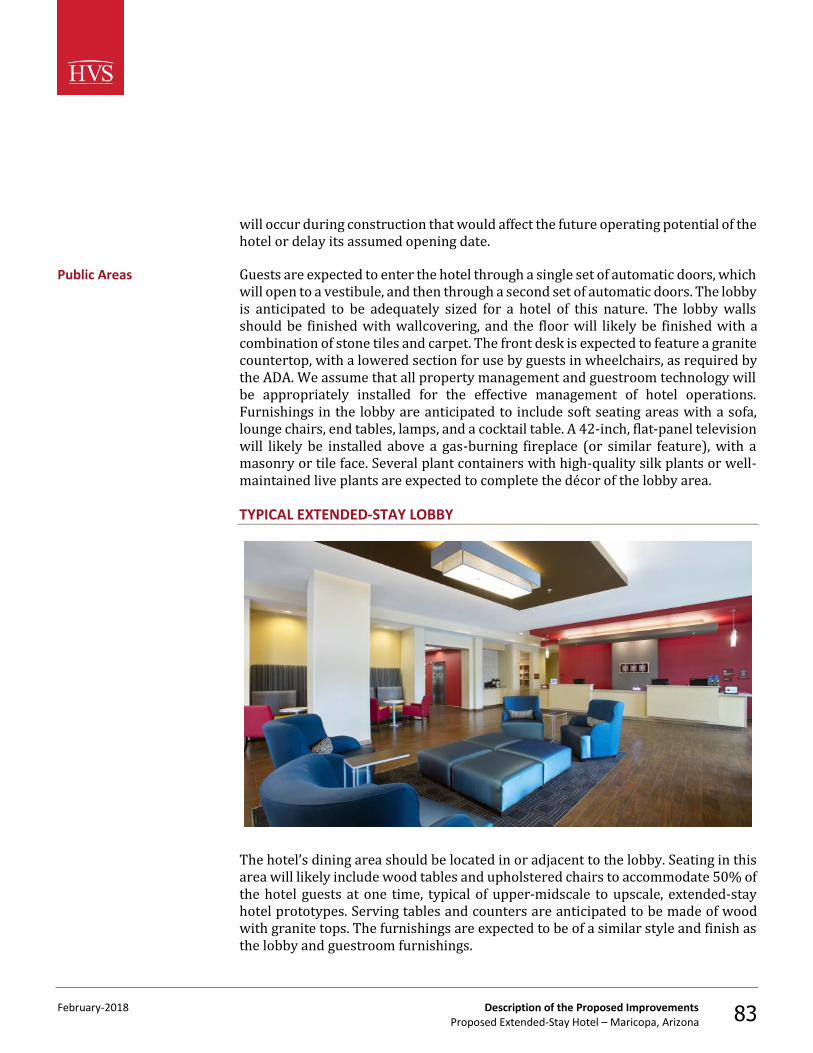
February-2018 Description of the Proposed Improvements Proposed Extended-Stay Hotel – Maricopa, Arizona 83
will occur during construction that would affect the future operating potential of the hotel or delay its assumed opening date. Guests are expected to enter the hotel through a single set of automatic doors, which will open to a vestibule, and then through a second set of automatic doors. The lobby is anticipated to be adequately sized for a hotel of this nature. The lobby walls should be finished with wallcovering, and the floor will likely be finished with a combination of stone tiles and carpet. The front desk is expected to feature a granite countertop, with a lowered section for use by guests in wheelchairs, as required by the ADA. We assume that all property management and guestroom technology will be appropriately installed for the effective management of hotel operations. Furnishings in the lobby are anticipated to include soft seating areas with a sofa, lounge chairs, end tables, lamps, and a cocktail table. A 42-inch, flat-panel television will likely be installed above a gas-burning fireplace (or similar feature), with a masonry or tile face. Several plant containers with high-quality silk plants or well-maintained live plants are expected to complete the décor of the lobby area. TYPICAL EXTENDED-STAY LOBBY
The hotel’s dining area should be located in or adjacent to the lobby. Seating in this area will likely include wood tables and upholstered chairs to accommodate 50% of the hotel guests at one time, typical of upper-midscale to upscale, extended-stay hotel prototypes. Serving tables and counters are anticipated to be made of wood with granite tops. The furnishings are expected to be of a similar style and finish as the lobby and guestroom furnishings.
Public Areas

February-2018 Description of the Proposed Improvements Proposed Extended-Stay Hotel – Maricopa, Arizona 84
TYPICAL EXTENDED-STAY DINING AREA
Additionally, we recommend that the proposed subject hotel feature a small meeting room near the lobby. While extended-stay hotels are not known for accommodating meeting and group demand, the meeting room would serve as a crucial amenity for the proposed subject property. As mentioned previously, competitor hotels offer an evening reception in a standalone meeting room for travelers from VW. Furthermore, the meeting room can be an important component when booking youth sports business, as these group blocks typically desire a room in which they can meet and prepare before leaving for their game. The hotel is expected to offer an outdoor pool and whirlpool and a fitness room. Restrooms should be present off the pool area. In addition, the hotel should feature an outdoor barbecue grill with an adjacent seating area. It was mentioned by market participants that extended-stay travelers enjoy cooking dinners outside (e.g., on outdoor patios that include barbecue areas) at competitive hotels. To remain competitive in the market, we recommend that the proposed subject property feature a similar outdoor patio and grilling area. Other amenities are anticipated include a lobby workstation and a market pantry (adjacent to the front desk), as well as a guest laundry room; these will likely all be conveniently located in the lobby. Ice machines will likely be located near elevator bays on all levels of the property. Overall, the supporting facilities should be
February-2018 Description of the Proposed Improvements Proposed Extended-Stay Hotel – Maricopa, Arizona 85
appropriate for a hotel of this type, and we assume that they will meet brand standards. The hotel is expected to feature suite-style guestroom configurations, with guestroom suites present all levels of the property's proposed single building. The guestroom suites should consist of studio suites, as well as one- and two-bedroom suites consisting of a parlor area (with living, dining, and kitchen) and a separate bedroom/bath area. All units should feature a fully equipped kitchen and a dining area, open to the adjacent living room. Furnishings will likely include beds, a nightstand, a sofa sleeper with coffee table, end tables, a lounge chair with ottoman, a desk with chair, a chest of drawers, and a dining table and chairs. In addition to the standard furnishings, the guestroom suites should feature an iron and ironing board, a coffeemaker, and wireless, high-speed Internet access. Overall, the guestroom suites should offer a competitive product for this Maricopa neighborhood. We recommend a guestroom mix that emphasizes studio suites, compared to larger one- and two-bedroom suites. This setup is considered more conducive for Maricopa’s mix of overnight lodging demand. While the larger one- and two-bedroom suites would be popular with longer-term stays from Nissan and VW, the smaller studio suites would be more appropriate for most of the overnight demand in the community, with guests typically staying less than five days. The guestroom bathrooms are anticipated to be of a standard size, with a shower-in-tub or stand-alone shower, commode, and single sink with vanity area, featuring a granite countertop. Most brands require that floors be finished with ceramic or porcelain tile and that the walls be finished with wallcovering. Bathroom amenities should include a hairdryer and complimentary toiletries. Overall, the bathroom design should be appropriate for a product of this type.
Guestrooms

February-2018 Description of the Proposed Improvements Proposed Extended-Stay Hotel – Maricopa, Arizona 86
TYPICAL EXTENDED-STAY GUESTROOM
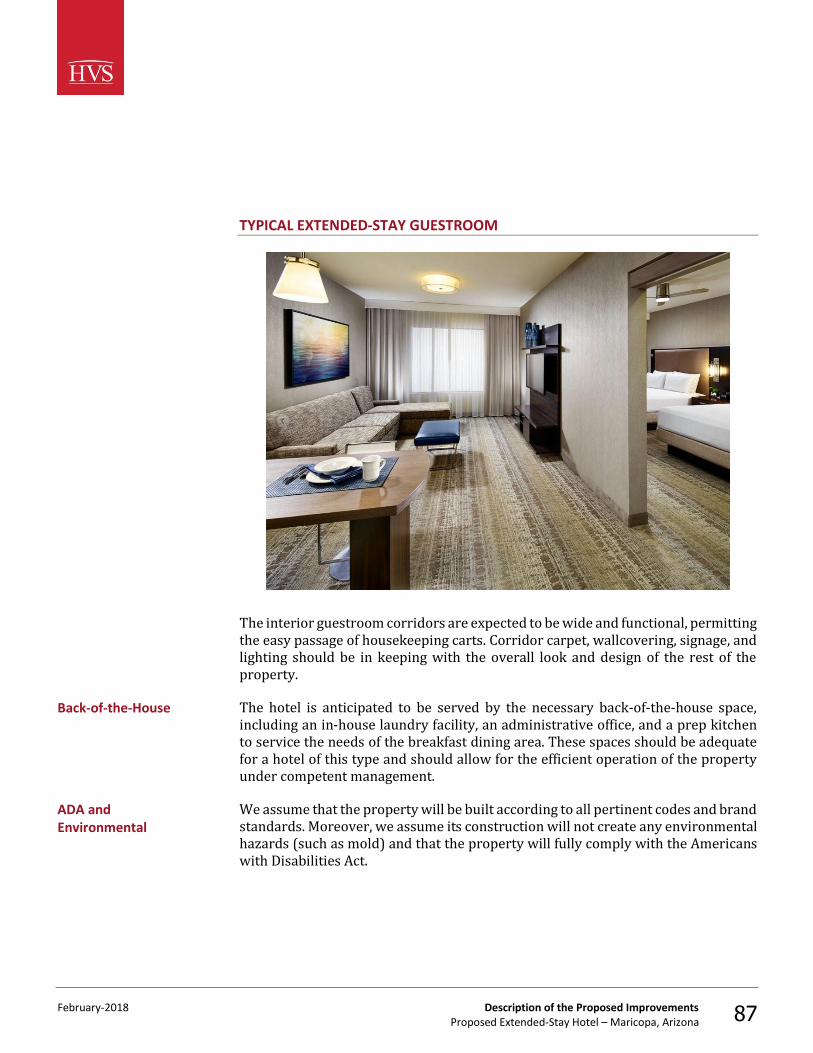
February-2018 Description of the Proposed Improvements Proposed Extended-Stay Hotel – Maricopa, Arizona 87
TYPICAL EXTENDED-STAY GUESTROOM
The interior guestroom corridors are expected to be wide and functional, permitting the easy passage of housekeeping carts. Corridor carpet, wallcovering, signage, and lighting should be in keeping with the overall look and design of the rest of the property. The hotel is anticipated to be served by the necessary back-of-the-house space, including an in-house laundry facility, an administrative office, and a prep kitchen to service the needs of the breakfast dining area. These spaces should be adequate for a hotel of this type and should allow for the efficient operation of the property under competent management. We assume that the property will be built according to all pertinent codes and brand standards. Moreover, we assume its construction will not create any environmental hazards (such as mold) and that the property will fully comply with the Americans with Disabilities Act.
Back-of-the-House
ADA and Environmental

February-2018 Description of the Proposed Improvements Proposed Extended-Stay Hotel – Maricopa, Arizona 88
Our analysis assumes that, after its opening, the hotel will require ongoing upgrades and periodic renovations in order to maintain its competitive level in this market and to remain compliant with brand standards. These costs should be adequately funded by the forecasted reserve for replacement, as long as a successful, ongoing preventive-maintenance program is employed by hotel staff. The construction budget for the 100-room subject hotel, as estimated by HVS, is illustrated in the following table.
FIGURE 5-2 SUBJECT PROPERTY CONSTRUCTION BUDGET – HVS ESTIMATE
Item Cost
Bui ldi ng, Pre-Openi ng & Worki ng Capi ta l , Soft Costs $8,300,000Furniture, Fi xtures , & Equi pment 1,500,000Land 1,200,000Entrepreneuria l Incentive 550,000
Total Cost New Estimate $11,550,000
Overall, the proposed subject hotel should offer a well-designed, functional layout of support areas and guestrooms. All typical and market-appropriate features and amenities are expected to be included in the hotel's design. We assume that the building will be fully open and operational on the stipulated opening date and will meet all local building codes and brand standards. Furthermore, we assume that the hotel staff will be adequately trained to allow for a successful opening and that pre-marketing efforts will have introduced the product to major local accounts at least six months in advance of the opening date.
Capital Expenditures
Construction Budget
Conclusion

February-2018 Projection of Occupancy and Average Rate Proposed Extended-Stay Hotel – Maricopa, Arizona 89
6. Projection of Occupancy and Average Rate
Along with average rate results, the occupancy levels achieved by a hotel are the foundation of the property's financial performance and market value. Most of a lodging facility's other revenue sources (such as food, beverages, other operated departments, and rentals and other income) are driven by the number of guests, and many expense levels vary with occupancy. To a certain degree, occupancy attainment can be manipulated by management. For example, hotel operators may choose to lower rates in an effort to maximize occupancy. Our forecasts reflect an operating strategy that we believe would be implemented by a typical, professional hotel management team to achieve an optimal mix of occupancy and average rate. The subject property's forecasted market share and occupancy levels are based upon its anticipated competitive position within the market, as quantified by its penetration rate. The penetration rate is the ratio of a property's market share to its fair share. In the following table, the penetration rates attained by the primary competitors and the aggregate secondary competitors are set forth for each segment for the base year.
FIGURE 6-2 HISTORICAL PENETRATION RATES
Over
all
Exte
nded
-St
ay
Com
mer
cial
Leisu
re
Grou
p
Property
Homewood Suites by Hi l ton Phoeni x Chandl er 212 % 125 % 77 % 29 % 109 %Home2 Suites by Hi l ton Phoenix Chandler 303 94 58 29 109Hampton Inn Phoenix Chandler 81 139 85 52 97Fa irfie ld Inn by Marriott Phoeni x Chandl er 85 145 89 55 102Hol iday Inn Expres s Hotel & Sui tes Phoenix Chandler 86 147 91 55 103Secondary Competi tion 39 72 121 156 96
Over
all
Exte
nded
-St
ay
Com
mer
cial
Leisu
re
Grou
p
The Home2 Suites by Hilton Phoenix Chandler achieved the highest penetration rate within the extended-stay segment. The highest penetration rate in the commercial segment was achieved by the Holiday Inn Express Hotel & Suites Phoenix Chandler, while the secondary competition led the market with the highest leisure penetration
Penetration Rate Analysis
Historical Penetration Rates by Market Segment

February-2018 Projection of Occupancy and Average Rate Proposed Extended-Stay Hotel – Maricopa, Arizona 90
rate. The Sheraton Wild Horse Pass Resort & Spa achieved the highest penetration rate within the group segment. Because the supply and demand balance for the competitive market is dynamic, there is a circular relationship between the penetration factors of each hotel in the market. The performance of individual new hotels has a direct effect upon the aggregate performance of the market, and consequently upon the calculated penetration factor for each hotel in each market segment. The same is true when the performance of existing hotels changes, either positively (following a refurbishment, for example) or negatively (when a poorly maintained or marketed hotel loses market share). A hotel’s penetration factor is calculated as its achieved market share of demand divided by its fair share of demand. Thus, if one hotel’s penetration performance increases, thereby increasing its achieved market share, this leaves less demand available in the market for the other hotels to capture and the penetration performance of one or more of those other hotels consequently declines (other things remaining equal). This type of market share adjustment takes place every time there is a change in supply, or a change in the relative penetration performance of one or more hotels in the competitive market. Our projections of penetration, demand capture, and occupancy performance for the subject property account for these types of adjustments to market share within the defined competitive market. The proposed subject hotel's occupancy forecast is set forth as follows, with the adjusted projected penetration rates used as a basis for calculating the amount of captured market demand.
Forecast of Subject Property’s Occupancy

February-2018 Projection of Occupancy and Average Rate Proposed Extended-Stay Hotel – Maricopa, Arizona 91
FIGURE 6-3 FORECAST OF SUBJECT PROPERTY'S OCCUPANCY
Market Segment
Extended-StayDema nd 53,344 55,128 56,231 56,231Ma rket Share 7.2 % 13.7 % 13.9 % 13.9 %Capture 3,856 7,535 7,843 7,843Penetrati on 166 % 165 % 169 % 169 %
CommercialDema nd 100,430 103,682 105,755 105,755Ma rket Share 4.3 % 8.6 % 9.0 % 9.0 %Capture 4,339 8,914 9,486 9,486Penetrati on 100 % 104 % 109 % 109 %
LeisureDema nd 76,077 76,947 77,717 77,717Ma rket Share 2.7 % 6.5 % 7.3 % 7.3 %Capture 2,060 4,968 5,639 5,639Penetrati on 62 % 78 % 88 % 88 %
GroupDema nd 48,213 48,748 48,992 48,992Ma rket Share 1.4 % 4.1 % 5.4 % 5.4 %Capture 689 2,017 2,666 2,666Penetrati on 33 % 50 % 66 % 66 %
Total Room Nights Captured 10,945 23,435 25,635 25,635Avai lable Room Ni ghts 18,400 36,500 36,500 36,500
Subject Occupancy 59 % 64 % 70 % 70 %Ma rket-wide Avai lable Room Ni ghts 423,769 441,869 441,869 441,869
Fair Share 4 % 8 % 8 % 8 %Ma rket-wide Occupied Room Nights 278,064 284,505 288,695 288,695
Market Share 4 % 8 % 9 % 9 %Market-wide Occupancy 66 % 64 % 65 % 65 %Total Penetration 91 % 100 % 107 % 107 %
2020 2021 2022 2023
We assume that the proposed hotel will be located on a favorable site with relation to demand generators, allowing the proposed hotel to maximize its operational potential in the Maricopa market. The proposed subject hotel is expected to stabilize with a strong occupancy penetration rate due to its new facility, its ability to accommodate longer-term stays, its presumed national brand, and its favorable

February-2018 Projection of Occupancy and Average Rate Proposed Extended-Stay Hotel – Maricopa, Arizona 92
location within an emerging community. As such, the proposed extended-stay hotel's overall occupancy penetration level is forecast to stabilize at 107%. Additional insights by segment are presented as follows:
• The proposed subject hotel is expected to become the foremost choice for extended-stay demand in the local Maricopa market, including from companies such as Volkswagen and Nissan, with its all-suite product and in-room kitchens being designed for this type of traveler. The proposed subject hotel will be the only upper-midscale to upscale, extended-stay product offering in its neighborhood; accordingly, travelers seeking a first-class hotel with extended-stay amenities, as well as convenient access to shopping and dining outlets, will be drawn to the proposed hotel. The proposed subject hotel is anticipated to perform appropriately within the competitive set given its modern design, new construction, and anticipated national brand recognition.
• Within the commercial segment, the proposed subject hotel’s occupancy penetration is positioned at a below-market-average level by the stabilized period due to its overall marketing focus on long-term stays. Nonetheless, travelers seeking an upper-midscale to upscale, extended-stay hotel, as well as convenient access to several commercial entities in/around Maricopa, will be drawn to the proposed hotel. The proposed subject hotel will be favorably suited for commercial demand given the presumed strength of the selected national brand in capturing commercial demand associated with travelers loyal to the respective brand's frequent guest program.
• The proposed subject hotel should benefit from leisure demand during weekends, with its outdoor pool and barbecue areas being notable highlights. The hotel's suite product and inclusive food and beverage services will also be popular with families, as these factors are key decision factors when choosing hotels for weekend stays. The secondary competitors are expected to be the primary leaders in this segment given their respective product types and/or amenity sets.
• Extended-stay hotels are not known for group accommodations and do not generally offer a significant amount of meeting space. However, the proposed subject hotel's location near the Elements Event Center at Harrah’s Ak-Chin Casino Resort, as well as its presumed national brand affiliation and upper-midscale to upscale product offering, should allow it to attract small commercial groups and SMERFE-related groups. These factors should lead to a modest group penetration rate for a property of this type, with the hotel realizing a level at fair share by the stabilized year.

February-2018 Projection of Occupancy and Average Rate Proposed Extended-Stay Hotel – Maricopa, Arizona 93
These positioned segment penetration rates result in the following market segmentation forecast. FIGURE 6-4 MARKET SEGMENTATION FORECAST – SUBJECT PROPERTY
Extended-Sta y 35 % 32 % 31 % 31 %Commercia l 40 38 37 37Lei sure 19 21 22 22Group 6 9 10 10
Total 100 % 100 % 100 % 100 %
2020 2021 2022 2023
Based on our analysis of the proposed subject hotel and market area, we have selected a stabilized occupancy level of 70%. The stabilized occupancy is intended to reflect the anticipated results of the property over its remaining economic life, given all changes in the life cycle of the hotel. Thus, the stabilized occupancy excludes from consideration any abnormal relationship between supply and demand, as well as any nonrecurring conditions that may result in unusually high or low occupancies. Although the subject property may operate at occupancies above this stabilized level, we believe it equally possible for new competition and temporary economic downturns to force the occupancy below this selected point of stability. One of the most important considerations in estimating the value of a lodging facility is a supportable forecast of its attainable average rate, which is more formally defined as the average rate per occupied room. Average rate can be calculated by dividing the total rooms revenue achieved during a specified period by the number of rooms sold during the same period. The projected average rate and the anticipated occupancy percentage are used to forecast rooms revenue, which in turn provides the basis for estimating most other income and expense categories. Although the average rate analysis presented here follows the occupancy projection, these two statistics are highly correlated; in reality, one cannot project occupancy without making specific assumptions regarding average rate. This relationship is best illustrated by revenue per available room (RevPAR), which reflects a property's ability to maximize rooms revenue. The following table summarizes the historical average rate and the RevPAR of the subject property’s future primary competitors.
Average Rate Analysis
Competitive Position

February-2018 Projection of Occupancy and Average Rate Proposed Extended-Stay Hotel – Maricopa, Arizona 94
FIGURE 6-5 BASE-YEAR AVERAGE RATE AND REVPAR OF THE COMPETITORS
Property
Homewood Suites by Hi l ton Phoeni x Cha ndl er $115 - $120 100 - 110 % $80 - $85 110 - 120 %
Home2 Suites by Hi l ton Phoenix Cha ndl er 95 - 100 80 - 85 40 - 45 55 - 60
Hampton Inn Phoenix Chandler 105 - 110 90 - 95 70 - 75 100 - 110
Fai rfi eld Inn by Marriott Phoenix Cha ndl er
90 - 95 80 - 85 55 - 60 80 - 85
Hol i day Inn Express Hotel & Suites Phoeni x Cha ndl er 90 - 95 80 - 85 55 - 60 80 - 85
Average - Prima ry Competi tors $101.24 89.8 % $63.73 90.8 %
Average - Seconda ry Competi tors 123.80 109.8 76.30 108.7
Overall Average $112.75 $70.21
Estimated 2016 Average Room
RateAverage Room
Rate Penetration
Rooms Revenue Per Available
Room (RevPAR)RevPAR
Penetration
The defined primarily competitive market realized an overall average rate of $100.25 in the 2017 base year, declining from the 2016 level of $101.24. The Sheraton Wild Horse Pass Resort & Spa (a secondary competitor) achieved the highest estimated average rate in the local competitive market, by a significant margin, because of its upscale, full-service product type and expanded amenity set. Of the primary competitive set, the Homewood Suites by Hilton achieved the highest estimated average rate because of its strong Hilton brand affiliation and location along Interstate 10. An important rate aspect of this market is its seasonality, which allows hotel operators to command rate premiums during the spring months, compared to the slower summer period. The selected rate position for the proposed subject hotel, in base-year dollars, takes into consideration factors such as its product type and Maricopa location. We have selected the rate position of $103.00, in base-year dollars, for the proposed subject. Market-wide average rates trended upward from 2011 through 2015; however, rates dropped by year-end 2016 because of the post-Super Bowl ADR correction and the openings of the Home2 Suites by Hilton and Best Western Plus in 2016. ADR is expected to increase at a level slightly below the inflationary rate in the first two

February-2018 Projection of Occupancy and Average Rate Proposed Extended-Stay Hotel – Maricopa, Arizona 95
projection years due to the continued absorption of new supply. However, as these supply additions are absorbed, rate growth is anticipated to improve to inflationary levels by the stabilized year given the strengthening economic conditions in Maricopa/Chandler. Based on these considerations, the following table illustrates the projected average rate and the growth rates assumed. As a context for the average rate growth factors, note that we have applied underlying inflation rates of 2.5%, 2.5%, and 3.0% thereafter for each respective year following the base year of 2017.

February-2018 Projection of Occupancy and Average Rate Proposed Extended-Stay Hotel – Maricopa, Arizona 96
FIGURE 6-6 COMPARISON OF HISTORICAL AND PROJECTED OCCUPANCY, AVERAGE RATE, AND REVPAR – PROPOSED SUBJECT PROPERTY AND MARKET
2015 2016 2017 2018 2019 2020 2021 2022 2023
Proposed Extended-Stay Hotel
Occupancy — — 59.5 % 64.2 % 70.2 % 70.2 %Change in Points — — — 4.7 6.0 0.0Occupancy Penetration — — 90.7 % 99.7 % 107.5 % 107.5 %
Average Rate $103.00 $104.03 $106.11 $109.29 $112.57 $115.95 $119.43Change — 2.0 % 3.0 % 3.0 % 3.0 % 3.0 %Average Rate Penetra tion 92.9 % 92.9 % 92.9 % 92.9 % 92.9 % 92.9 %
RevPAR — — $65.01 $72.28 $81.43 $83.88Change — — — 11.2 % 12.7 % 3.0 %RevPAR Penetration — — 84.2 % 92.7 % 99.9 % 99.9 %
2015 2016 2017 2018 2019 2020 2021 2022 2023
Maricopa SubmarketOccupancy 62.6 % 62.3 % 66.9 % 66.4 % 66.4 % 65.6 % 64.4 % 65.3 % 65.3 %Change in Points — (0.4) 4.7 (0.5) (0.0) (0.8) (1.2) 0.9 0.0
Average Rate $116.12 $112.75 $110.84 $111.94 $114.18 $117.61 $121.14 $124.77 $128.51Change — (2.9) % (1.7) % 1.0 % 2.0 % 3.0 % 3.0 % 3.0 % 3.0 %
RevPAR $72.71 $70.21 $74.18 $74.34 $75.81 $77.17 $78.00 $81.52 $83.96Change — (3.4) % 5.6 % 0.2 % 2.0 % 1.8 % 1.1 % 4.5 % 3.0 %
* The forecast for the proposed subject property does not include rate discounts that are expected to occur during the initial year(s) of operation.
Projected
Historical (Estimated) Projected

February-2018 Projection of Occupancy and Average Rate Proposed Extended-Stay Hotel – Maricopa, Arizona 97
The final forecast reflects years beginning on July 1, 2020 and corresponds with our financial projections, as shown below.
FIGURE 6-7 MARKET AND SUBJECT PROPERTY AVERAGE RATE FORECAST
Calendar Year 2017 2018 2019 2020 2021 2022 2023 2024 2025
Market ADR $110.84 $111.94 $114.18 $117.61 $121.14 $124.77 $128.51 $132.37 $136.34Projected Ma rket ADR Growth Ra te — 1.0% 2.0% 3.0% 3.0% 3.0% 3.0% 3.0% 3.0%
Proposed Subject Property ADR (As-If Stabi l ized) $103.00 $104.03 $106.11 $109.29 $112.57 $115.95 $119.43 $123.01 $126.70ADR Growth Rate — 1.0% 2.0% 3.0% 3.0% 3.0% 3.0% 3.0% 3.0%
Proposed Subject Stabi l ized ADR Penetra tion 93% 93% 93% 93% 93% 93% 93% 93% 92.9%
Fiscal Year 2020/21 2021/22 2022/23 2023/24 2024/25 2025/26
Proposed Subject Property Average Ra te $110.92 $114.25 $117.67 $121.21 $124.84 $128.59Opening Discount 2.0% 1.0% 0.0% 0.0% 0.0% 0.0%
Average Rate After Discount $108.70 $114.25 $117.67 $121.21 $124.84 $128.59
Real Avera ge Ra te Growth — 5.1% 3.0% 3.0% 3.0% 3.0%
Market ADR $119.36 $122.94 $126.63 $130.43 $134.34 $138.37Proposed Subject ADR Penetra tion (After Discount) 91% 93% 93% 93% 93% 93%
ADR Expressed in Ba se-Year Dol lars Deflated @ Inflation Rate $100.45 $102.50 $102.50 $102.50 $102.50 $102.50
As illustrated above, a 1.0%% rate of change is expected for the proposed subject hotel's positioned 2017 room rate in 2018. This is followed by growth rates of 2.0%% and 3.0%% in 2019 and 2020, respectively. The Maricopa/Chandler market should experience rate growth through the near term. The proposed subject hotel's rate position should reflect growth similar to market trends because of the proposed hotel's new facility, expected national brand affiliation, extended-stay amenity set, and location within the growing Maricopa community. The proposed subject hotel’s penetration rate is forecast to reach 92.9% by the stabilized period. A new property must establish its reputation and a client base in the market during its ramp-up period; as such, the proposed subject hotel’s average rates in the initial operating period have been discounted to reflect this likelihood. We forecast 2.0% and 1.0% discounts to the proposed subject hotel’s forecast room rates in the first two operating years, which would be typical for a new operation of this type. The following occupancies and average rates will be used to project the subject property's rooms revenue; this forecast reflects years beginning on July 1, 2020, which correspond with our financial projections.

February-2018 Projection of Occupancy and Average Rate Proposed Extended-Stay Hotel – Maricopa, Arizona 98
FIGURE 6-8 FORECASTS OF OCCUPANCY, AVERAGE RATE, AND REVPAR
Year
2020/21 62 % $110.922021/22 67 114.252022/23 70 117.67
OccupancyAverage Rate
Before Discount

February-2018 Projection of Income and Expense Proposed Extended-Stay Hotel – Maricopa, Arizona 99
7. Projection of Income and Expense
In this chapter of our report, we have compiled a forecast of income and expense for the proposed subject hotel. This forecast is based on the facilities program set forth previously, as well as the occupancy and average rate forecast discussed previously. The forecast of income and expense is expressed in current dollars for each year. The stabilized year is intended to reflect the anticipated operating results of the property over its remaining economic life, given any or all applicable stages of build-up, plateau, and decline in the life cycle of the hotel. Thus, income and expense estimates from the stabilized year forward exclude from consideration any abnormal relationship between supply and demand, as well as any nonrecurring conditions that may result in unusual revenues or expenses. The ten-year period reflects the typical holding period of large real estate assets such as hotels. In addition, the ten-year period provides for the stabilization of income streams and comparison of yields with alternate types of real estate. The forecasted income streams reflect the future benefits of owning specific rights in income-producing real estate. In order to project future income and expense for the proposed subject hotel, we have included a sample of individual comparable operating statements from our database of hotel statistics. All financial data are presented according to the three most common measures of industry performance: ratio to sales (RTS), amounts per available room (PAR), and amounts per occupied room night (POR). These historical income and expense statements will be used as benchmarks in our forthcoming forecast of income and expense.
Comparable Operating Statements

February-2018 Projection of Income and Expense Proposed Extended-Stay Hotel – Maricopa, Arizona 100
FIGURE 7-1 COMPARABLE OPERATING STATEMENTS: RATIO TO SALES
Comp 1 Comp 2 Comp 3 Comp 4 Comp 5 Subject
Year: 2016/17 2016 2015/16 2015 2015 2017Edition: 11 11 10 10 10 11
Number of Rooms: 110 to 140 80 to 110 80 to 110 70 to 100 90 to 120 100Days Open: 365 365 365 365 365 365Occupancy: 76% 63% 70% 78% 73% 70%
Average Rate: $102 $99 $91 $83 $98 $101RevPAR: $77 $62 $64 $65 $72 $71
REVENUE Rooms 98.8 % 98.2 % 98.6 % 97.1 % 97.2 % 97.8 % Other Operated Departments 1.2 1.8 1.4 0.9 1.4 1.2
Miscel laneous Income 0.0 0.0 0.0 2.0 1.4 1.0 Tota l 100.0 100.0 100.0 100.0 100.0 100.0 DEPARTMENTAL EXPENSES* Rooms 24.3 21.0 21.6 25.4 22.5 21.0 Other Operated Departments 47.2 20.9 74.0 110.9 45.3 85.0 Tota l 24.6 21.0 22.3 25.7 22.5 21.6DEPARTMENTAL INCOME 75.4 79.0 77.7 74.3 77.5 78.4OPERATING EXPENSES Adminis trative & Genera l 8.8 9.9 9.2 6.2 8.6 8.0 Info. and Telecom. Systems 1.8 0.0 0.0 0.0 0.0 0.9 Ma rketing 6.2 2.1 2.8 2.6 4.0 4.5 Fra nchise Fee 6.2 11.2 3.5 6.3 6.9 7.8 Property Operations & Ma intenance 4.1 5.4 3.1 3.0 3.7 3.8 Uti l i ties 3.3 3.9 3.7 5.3 4.5 3.4 Tota l 30.4 32.5 22.4 23.3 27.7 28.5HOUSE PROFIT 45.0 46.5 55.3 51.0 49.8 49.9Management Fee 4.0 3.5 3.9 3.0 3.0 3.0INCOME BEFORE FIXED CHARGES 40.9 43.0 51.4 48.0 46.8 46.9
* Departmenta l expense ra tios are expressed as a percentage of departmenta l revenues
Stabilized $

February-2018 Projection of Income and Expense Proposed Extended-Stay Hotel – Maricopa, Arizona 101
FIGURE 7-2 COMPARABLE OPERATING STATEMENTS: AMOUNTS PER AVAILABLE ROOM
Comp 1 Comp 2 Comp 3 Comp 4 Comp 5 Subject
Year: 2016/17 2016 2015/16 2015 2015 2017Edition: 11 11 10 10 10 11
Number of Rooms: 110 to 140 80 to 110 80 to 110 70 to 100 90 to 120 100Days Open: 365 365 365 365 365 365Occupancy: 76% 63% 70% 78% 73% 70%
Average Rate: $102 $99 $91 $83 $98 $101RevPAR: $77 $62 $64 $65 $72 $71
REVENUE Rooms $28,284 $22,612 $23,372 $23,833 $26,284 $25,805 Other Operated Departments 343 405 327 227 384 319
Miscel laneous Income 0 0 0 481 379 256 Tota l 28,626 23,017 23,699 24,541 27,047 26,379 DEPARTMENTAL EXPENSES Rooms 6,886 4,758 5,038 6,044 5,905 5,419 Other Operated Departments 162 84 242 252 174 271 Tota l 7,048 4,842 5,280 6,296 6,079 5,690DEPARTMENTAL INCOME 21,579 18,175 18,419 18,245 20,968 20,689OPERATING EXPENSES Adminis trative & Genera l 2,518 2,275 2,177 1,510 2,324 2,100 Info. and Telecom. Systems 523 0 0 0 0 250 Marketing 1,782 472 671 630 1,094 1,200 Franchise Fee 1,787 2,575 839 1,552 1,863 2,065 Property Operations & Maintenance 1,173 1,253 739 727 1,001 1,000 Uti l i ties 930 900 884 1,311 1,224 900 Tota l 8,713 7,474 5,309 5,729 7,505 7,515HOUSE PROFIT 12,866 10,701 13,110 12,516 13,463 13,174Management Fee 1,145 810 935 729 811 791INCOME BEFORE FIXED CHARGES 11,720 9,890 12,174 11,787 12,652 12,383
Stabilized $

February-2018 Projection of Income and Expense Proposed Extended-Stay Hotel – Maricopa, Arizona 102
FIGURE 7-3 COMPARABLE OPERATING STATEMENTS: AMOUNTS PER OCCUPIED ROOM
Comp 1 Comp 2 Comp 3 Comp 4 Comp 5 Subject
Year: 2016/17 2016 2015/16 2015 2015 2017Edition: 11 11 10 10 10 11
Number of Rooms: 110 to 140 80 to 110 80 to 110 70 to 100 90 to 120 100Days Open: 365 365 365 365 365 365Occupancy: 76% 63% 70% 78% 73% 70%
Average Rate: $102 $99 $91 $83 $98 $101RevPAR: $77 $62 $64 $65 $72 $71
REVENUE Rooms $102.41 $98.72 $90.89 $83.29 $98.24 $101.00 Other Operated Departments 1.24 1.77 1.27 0.79 1.44 1.25
Miscel la neous Income 0.00 0.00 0.00 1.68 1.42 1.00 Tota l 103.65 100.49 92.16 85.77 101.09 103.25 DEPARTMENTAL EXPENSES Rooms 24.93 20.77 19.59 21.12 22.07 21.21 Other Operated Departments 0.59 0.37 0.94 0.88 0.65 1.06 Tota l 25.52 21.14 20.53 22.00 22.72 22.27DEPARTMENTAL INCOME 78.13 79.35 71.63 63.76 78.37 80.97OPERATING EXPENSES Adminis trative & Genera l 9.12 9.93 8.47 5.28 8.69 8.22 Info. a nd Telecom. Systems 1.89 0.00 0.00 0.00 0.00 0.98 Marketing 6.45 2.06 2.61 2.20 4.09 4.70 Franchise Fee 6.47 11.24 3.26 5.42 6.96 8.08 Property Operations & Maintenance 4.25 5.47 2.87 2.54 3.74 3.91 Uti l i ties 3.37 3.93 3.44 4.58 4.57 3.52 Tota l 31.55 32.63 20.65 20.02 28.05 29.41HOUSE PROFIT 46.58 46.72 50.98 43.74 50.32 51.56Mana gement Fee 4.15 3.54 3.64 2.55 3.03 3.10INCOME BEFORE FIXED CHARGES 42.44 43.18 47.35 41.19 47.29 48.46
Stabilized $
The departmental income of the comparable properties ranged from 74.3% to 79.0% of total revenue. The comparable properties achieved a house profit ranging from 45.0% to 55.3% of total revenue. We will refer to the comparable operating data in our discussion of each line item, which follows later in this section of the report. HVS uses a fixed and variable component model to project a lodging facility's revenue and expense levels. This model is based on the premise that hotel revenues and expenses have one component that is fixed and another that varies directly with
Fixed and Variable Component Analysis

February-2018 Projection of Income and Expense Proposed Extended-Stay Hotel – Maricopa, Arizona 103
occupancy and facility usage. A projection can be made by taking a known level of revenue or expense and calculating its fixed and variable components. The fixed component is then increased in tandem with the underlying rate of inflation, while the variable component is adjusted for a specific measure of volume such as total revenue. The actual forecast is derived by adjusting each year’s revenue and expense by the amount fixed (the fixed expense multiplied by the inflated base-year amount) plus the variable amount (the variable expense multiplied by the inflated base-year amount) multiplied by the ratio of the projection year’s occupancy to the base-year occupancy (in the case of departmental revenue and expense) or the ratio of the projection year’s revenue to the base year’s revenue (in the case of undistributed operating expenses). Fixed expenses remain fixed, increasing only with inflation. Our discussion of the revenue and expense forecast in this report is based upon the output derived from the fixed and variable model. This forecast of revenue and expense is accomplished through a systematic approach, following the format of the Uniform System of Accounts for the Lodging Industry. Each category of revenue and expense is estimated separately and combined at the end in the final statement of income and expense. In consideration of the most recent trends, the projections set forth previously, and our assessment of probable property appreciation levels, we have applied underlying inflation rates of 2.5%, 2.5%, and 3.0% thereafter for each respective year following the base year of 2017. This stabilized inflation rate takes into account normal, recurring inflation cycles. Inflation is likely to fluctuate above and below this level during the projection period. Any exceptions to the application of the assumed underlying inflation rate are discussed in our write-up of individual income and expense items. Based on an analysis that will be detailed throughout this section, we have formulated a forecast of income and expense. The following table presents a detailed forecast through the fifth projection year, including amounts per available room and per occupied room. The second table illustrates our ten-year forecast of income and expense, presented with a lesser degree of detail. The forecasts pertain to years that begin on July 1, 2020, expressed in inflated dollars for each year.
Inflation Assumption
Forecast of Revenue and Expense

February-2018 Projection of Income and Expense Proposed Extended-Stay Hotel – Maricopa, Arizona 104
FIGURE 7-4 DETAILED FORECAST OF INCOME AND EXPENSE
2020/21 Begins July 2021/22 Stabilized 2023/24 2024/25
Number of Rooms: 100 100 100 100 100Occupancy: 62% 67% 70% 70% 70%Average Rate: $108.70 $114.25 $117.67 $121.21 $124.84RevPAR: $67.39 $76.55 $82.37 $84.84 $87.39Days Open: 365 365 365 365 365Occupied Rooms: 22,630 %Gross PAR POR 24,455 %Gross PAR POR 25,550 %Gross PAR POR 25,550 %Gross PAR POR 25,550 %Gross PAR POR OPERATING REVENUERooms $2,460 97.6 % $24,600 $108.71 $2,794 97.8 % $27,940 $114.25 $3,007 97.8 % $30,070 $117.69 $3,097 97.8 % $30,970 $121.21 $3,190 97.8 % $31,900 $124.85Other Operated Departments 34 1.3 339 1.50 36 1.2 357 1.46 37 1.2 372 1.46 38 1.2 383 1.50 39 1.2 395 1.55Miscellaneous Income 27 1.1 271 1.20 29 1.0 285 1.17 30 1.0 298 1.17 31 1.0 307 1.20 32 1.0 316 1.24 Total Operating Revenues 2,521 100.0 25,210 111.40 2,858 100.0 28,582 116.88 3,074 100.0 30,740 120.31 3,166 100.0 31,660 123.91 3,261 100.0 32,611 127.63DEPARTMENTAL EXPENSES *Rooms 568 23.1 5,679 25.10 602 21.6 6,025 24.64 631 21.0 6,314 24.71 650 21.0 6,503 25.45 670 21.0 6,698 26.22Other Operated Departments 30 87.1 295 1.30 31 85.8 306 1.25 32 85.0 316 1.24 33 85.0 326 1.28 34 85.0 336 1.31 Total Expenses 597 23.7 5,974 26.40 633 22.1 6,331 25.89 663 21.6 6,630 25.95 683 21.6 6,829 26.73 703 21.6 7,034 27.53DEPARTMENTAL INCOME 1,924 76.3 19,235 85.00 2,225 77.9 22,251 90.99 2,411 78.4 24,110 94.36 2,483 78.4 24,831 97.19 2,558 78.4 25,577 100.10UNDISTRIBUTED OPERATING EXPENSESAdministrative & General 223 8.9 2,231 9.86 235 8.2 2,350 9.61 245 8.0 2,447 9.58 252 8.0 2,520 9.86 260 8.0 2,596 10.16Info & Telecom Systems 27 1.1 266 1.17 28 1.0 280 1.14 29 0.9 291 1.14 30 0.9 300 1.17 31 0.9 309 1.21Marketing 153 6.1 1,530 6.76 148 5.2 1,477 6.04 140 4.5 1,398 5.47 144 4.5 1,440 5.64 148 4.5 1,483 5.81Franchise Fee 197 7.8 1,968 8.70 224 7.8 2,235 9.14 241 7.8 2,406 9.42 248 7.8 2,478 9.70 255 7.8 2,552 9.99Prop. Operations & Maint. 85 3.4 850 3.76 101 3.5 1,007 4.12 117 3.8 1,165 4.56 120 3.8 1,200 4.70 124 3.8 1,236 4.84Utilities 96 3.8 956 4.23 101 3.5 1,007 4.12 105 3.4 1,049 4.10 108 3.4 1,080 4.23 111 3.4 1,113 4.35 Total Expenses 780 31.1 7,802 34.48 836 29.2 8,358 34.18 876 28.4 8,756 34.27 902 28.4 9,018 35.30 929 28.4 9,289 36.36GROSS HOUSE PROFIT 1,143 45.2 11,434 50.52 1,389 48.7 13,894 56.81 1,535 50.0 15,354 60.09 1,581 50.0 15,813 61.89 1,629 50.0 16,288 63.75Management Fee 76 3.0 756 3.34 86 3.0 857 3.51 92 3.0 922 3.61 95 3.0 950 3.72 98 3.0 978 3.83INCOME BEFORE NON-OPR. INC. & EXP. 1,068 42.2 10,677 47.18 1,304 45.7 13,036 53.31 1,443 47.0 14,432 56.48 1,486 47.0 14,863 58.17 1,531 47.0 15,309 59.92NON-OPERATING INCOME & EXPENSEProperty Taxes 126 5.0 1,262 5.58 159 5.6 1,590 6.50 171 5.6 1,711 6.69 184 5.8 1,840 7.20 190 5.8 1,895 7.42Insurance 27 1.1 275 1.21 28 1.0 283 1.16 29 0.9 291 1.14 30 0.9 300 1.17 31 0.9 309 1.21Reserve for Replacement 50 2.0 504 2.23 86 3.0 857 3.51 123 4.0 1,230 4.81 127 4.0 1,266 4.96 130 4.0 1,304 5.11 Total Expenses 204 8.1 2,041 9.02 273 9.6 2,730 11.17 323 10.5 3,231 12.65 341 10.7 3,407 13.33 351 10.7 3,509 13.73EBITDA LESS RESERVE $864 34.1 % $8,637 $38.16 $1,031 36.1 % $10,306 $42.14 $1,120 36.5 % $11,200 $43.84 $1,146 36.3 % $11,456 $44.84 $1,180 36.3 % $11,801 $46.19
*Departmental expenses are expressed as a percentage of departmental revenues.

February-2018 Projection of Income and Expense Proposed Extended-Stay Hotel – Maricopa, Arizona 105
FIGURE 7-5 TEN-YEAR FORECAST OF INCOME AND EXPENSE
2020/21 2021/22 2022/23 2023/24 2024/25 2025/26 2026/27 2027/28 2028/29 2029/30
Number of Rooms: 100 100 100 100 100 100 100 100 100 100Occupied Rooms: 22,630 24,455 25,550 25,550 25,550 25,550 25,550 25,550 25,550 25,550Occupancy: 62% 67% 70% 70% 70% 70% 70% 70% 70% 70%Average Rate: $108.70 % of $114.25 % of $117.67 % of $121.21 % of $124.84 % of $128.59 % of $132.44 % of $136.42 % of $140.51 % of $144.73RevPAR: $67.39 Gross $76.55 Gross $82.37 Gross $84.84 Gross $87.39 Gross $90.01 Gross $92.71 Gross $95.49 Gross $98.36 Gross $101.31OPERATING REVENUERooms $2,460 97.6 % $2,794 97.8 % $3,007 97.8 % $3,097 97.8 % $3,190 97.8 % $3,285 97.8 % $3,384 97.8 % $3,485 97.8 % $3,590 97.8 % $3,698 97.8 %Other Operated Departments 34 1.3 36 1.2 37 1.2 38 1.2 39 1.2 41 1.2 42 1.2 43 1.2 44 1.2 46 1.2Miscellaneous Income 27 1.1 29 1.0 30 1.0 31 1.0 32 1.0 33 1.0 34 1.0 35 1.0 36 1.0 37 1.0 Total Operating Revenues 2,521 100.0 2,858 100.0 3,074 100.0 3,166 100.0 3,261 100.0 3,358 100.0 3,459 100.0 3,563 100.0 3,670 100.0 3,780 100.0DEPARTMENTAL EXPENSES *Rooms 568 23.1 602 21.6 631 21.0 650 21.0 670 21.0 690 21.0 711 21.0 732 21.0 754 21.0 777 21.0Other Operated Departments 30 87.1 31 85.8 32 85.0 33 85.0 34 85.0 35 85.0 36 85.0 37 85.0 38 85.0 39 85.0 Total Expenses 597 23.7 633 22.1 663 21.6 683 21.6 703 21.6 724 21.6 746 21.6 769 21.6 792 21.6 815 21.6DEPARTMENTAL INCOME 1,924 76.3 2,225 77.9 2,411 78.4 2,483 78.4 2,558 78.4 2,634 78.4 2,713 78.4 2,794 78.4 2,878 78.4 2,965 78.4UNDISTRIBUTED OPERATING EXPENSESAdministrative & General 223 8.9 235 8.2 245 8.0 252 8.0 260 8.0 267 8.0 275 8.0 284 8.0 292 8.0 301 8.0Info & Telecom Systems 27 1.1 28 1.0 29 0.9 30 0.9 31 0.9 32 0.9 33 0.9 34 0.9 35 0.9 36 0.9Marketing 153 6.1 148 5.2 140 4.5 144 4.5 148 4.5 153 4.5 157 4.5 162 4.5 167 4.5 172 4.5Franchise Fee 197 7.8 224 7.8 241 7.8 248 7.8 255 7.8 263 7.8 271 7.8 279 7.8 287 7.8 296 7.8Prop. Operations & Maint. 85 3.4 101 3.5 117 3.8 120 3.8 124 3.8 127 3.8 131 3.8 135 3.8 139 3.8 143 3.8Utilities 96 3.8 101 3.5 105 3.4 108 3.4 111 3.4 115 3.4 118 3.4 122 3.4 125 3.4 129 3.4 Total Expenses 780 31.1 836 29.2 876 28.4 902 28.4 929 28.4 957 28.4 985 28.4 1,015 28.4 1,045 28.4 1,077 28.4GROSS HOUSE PROFIT 1,143 45.2 1,389 48.7 1,535 50.0 1,581 50.0 1,629 50.0 1,677 50.0 1,728 50.0 1,779 50.0 1,833 50.0 1,888 50.0Management Fee 76 3.0 86 3.0 92 3.0 95 3.0 98 3.0 101 3.0 104 3.0 107 3.0 110 3.0 113 3.0INCOME BEFORE NON-OPR. INC. & EXP. 1,068 42.2 1,304 45.7 1,443 47.0 1,486 47.0 1,531 47.0 1,576 47.0 1,624 47.0 1,672 47.0 1,723 47.0 1,775 47.0NON-OPERATING INCOME & EXPENSEProperty Taxes 126 5.0 159 5.6 171 5.6 184 5.8 190 5.8 195 5.8 201 5.8 207 5.8 213 5.8 220 5.8Insurance 27 1.1 28 1.0 29 0.9 30 0.9 31 0.9 32 0.9 33 0.9 34 0.9 35 0.9 36 0.9Reserve for Replacement 50 2.0 86 3.0 123 4.0 127 4.0 130 4.0 134 4.0 138 4.0 143 4.0 147 4.0 151 4.0 Total Expenses 204 8.1 273 9.6 323 10.5 341 10.7 351 10.7 361 10.7 372 10.7 383 10.7 395 10.7 407 10.7EBITDA LESS RESERVE $864 34.1 % $1,031 36.1 % $1,120 36.5 % $1,146 36.3 % $1,180 36.3 % $1,215 36.3 % $1,252 36.3 % $1,289 36.3 % $1,328 36.3 % $1,368 36.3 %
1 1 1 1 1 1 1 1 1 1*Departmental expenses are expressed as a percentage of departmental revenues.
% ofGross

February-2018 Projection of Income and Expense Proposed Extended-Stay Hotel – Maricopa, Arizona 106
The following description sets forth the basis for the forecast of income and expense. We anticipate that it will take three years for the subject property to reach a stabilized level of operation. Each revenue and expense item has been forecast based upon our review of the proposed subject hotel's operating budget and comparable income and expense statements. The forecast is based upon fiscal years beginning July 1, 2020, expressed in inflated dollars for each year. Rooms revenue is determined by two variables: occupancy and average rate. We projected occupancy and average rate in a previous section of this report. The proposed subject hotel is expected to stabilize at an occupancy level of 70% with an average rate of $117.67 in 2022/23. Following the stabilized year, the subject property’s average rate is projected to increase along with the underlying rate of inflation. According to the Uniform System of Accounts, other operated departments include any major or minor operated department other than rooms and food and beverage. The proposed subject hotel's other operated departments revenue sources are expected to include the hotel's telephone charges, market pantry sales, guest laundry fees, and in-room movie and game charges. Based on our review of operations with a similar extent of offerings, we have positioned an appropriate revenue level for the proposed subject hotel.
FIGURE 7-6 OTHER OPERATED DEPARTMENTS REVENUE
#1 #2 #3 #4 #5 2020/21
Percentage of Revenue 1.2 % 1.8 % 1.4 % 0.9 % 1.4 % 1.3 % 1.2 %Per Ava i lable Room $343 $405 $327 $227 $384 $339 $319Per Occupied Room $1.24 $1.77 $1.27 $0.79 $1.44 $1.50 $1.25
Comparable Operating Statements Proposed Subject Property ForecastDeflated Stabilized
The miscellaneous income sources comprise those other than guestrooms, food and beverage, and the other operated departments. The proposed subject hotel's miscellaneous income revenues are expected to be generated primarily by the commissions earned on the vending sales and other minor collections, such as cancelation fees. Based on our review of operations with a similar extent of offerings, we have positioned an appropriate revenue level for the proposed subject hotel. Changes in this revenue item through the projection period result from the application of the underlying inflation rate and projected changes in occupancy.
Rooms Revenue
Other Operated Departments Revenue
Miscellaneous Income

February-2018 Projection of Income and Expense Proposed Extended-Stay Hotel – Maricopa, Arizona 107
FIGURE 7-7 MISCELLANEOUS INCOME
#1 #2 #3 #4 #5 2020/21
Percentage of Revenue 0.0 % 0.0 % 0.0 % 2.0 % 1.4 % 1.1 % 1.0 %Per Ava i lable Room $0 $0 $0 $481 $379 $271 $256Per Occupied Room $0.00 $0.00 $0.00 $1.68 $1.42 $1.20 $1.00
Comparable Operating Statements Proposed Subject Property ForecastDeflated Stabilized
Rooms expense consists of items related to the sale and upkeep of guestrooms and public space. Salaries, wages, and employee benefits account for a substantial portion of this category. Although payroll varies somewhat with occupancy and managers can generally scale the level of service staff on hand to meet an expected occupancy level, much of a hotel's payroll is fixed. A base level of front desk personnel, housekeepers, and supervisors must be maintained at all times. As a result, salaries, wages, and employee benefits are only moderately sensitive to changes in occupancy. Commissions and reservations are usually based on room sales, and thus are highly sensitive to changes in occupancy and average rate. While guest supplies vary 100% with occupancy, linens and other operating expenses are only slightly affected by volume. The proposed subject hotel's rooms department expense has been positioned based upon our review of the comparable operating data and our understanding of the hotel's future service level and price point.
FIGURE 7-8 ROOMS EXPENSE
#1 #2 #3 #4 #5 2020/21
Percentage of Revenue 24.3 % 21.0 % 21.6 % 25.4 % 22.5 % 23.1 % 21.0 %Per Ava i lable Room $6,886 $4,758 $5,038 $6,044 $5,905 $5,679 $5,419Per Occupied Room $24.93 $20.77 $19.59 $21.12 $22.07 $25.10 $21.21
Deflated StabilizedComparable Operating Statements Proposed Subject Property Forecast
Other operated departments expense includes all expenses reflected in the summary statements for the divisions associated in these categories. This was previously discussed in this chapter. The proposed subject hotel's other operated departments revenue sources are expected to include the hotel's telephone charges, market pantry sales, guest laundry fees, and in-room movie and game charges. Based on our review of operations with a similar extent of offerings, we have positioned an appropriate revenue level for the proposed subject hotel.
Rooms Expense
Other Operated Departments Expense

February-2018 Projection of Income and Expense Proposed Extended-Stay Hotel – Maricopa, Arizona 108
FIGURE 7-9 OTHER OPERATED DEPARTMENTS EXPENSE
#1 #2 #3 #4 #5 2020/21
Percentage of Revenue 47.2 % 20.9 % 74.0 % 110.9 % 45.3 % 87.1 % 85.0 %Per Ava i lable Room $162 $84 $242 $252 $174 $295 $271Per Occupied Room $0.59 $0.37 $0.94 $0.88 $0.65 $1.30 $1.06
Comparable Operating Statements Proposed Subject Property ForecastDeflated Stabilized
Administrative and general expense includes the salaries and wages of all administrative personnel who are not directly associated with a particular department. Expense items related to the management and operation of the property are also allocated to this category. Most administrative and general expenses are relatively fixed. The exceptions are cash overages and shortages; commissions on credit card charges; provision for doubtful accounts, which are moderately affected by the number of transactions or total revenue; and salaries, wages, and benefits, which are very slightly influenced by volume. Based upon our review of the comparable operating data and the expected scope of facility for the proposed subject hotel, we have positioned the administrative and general expense level at a market- and property-supported level.
FIGURE 7-10 ADMINISTRATIVE AND GENERAL EXPENSE
#1 #2 #3 #4 #5 2020/21
Percentage of Revenue 8.8 % 9.9 % 9.2 % 6.2 % 8.6 % 8.9 % 8.0 %Per Ava i lable Room $2,518 $2,275 $2,177 $1,510 $2,324 $2,231 $2,100Per Occupied Room $9.12 $9.93 $8.47 $5.28 $8.69 $9.86 $8.22
Comparable Operating Statements Proposed Subject Property ForecastDeflated Stabilized
Information and telecommunications systems expense consists of all costs associated with a hotel’s technology infrastructure. This includes the costs of cell phones, administrative call and Internet services, and complimentary call and Internet services. Expenses in this category are typically organized by type of technology, or the area benefitting from the technology solution. We expect the proposed subject hotel's information and telecommunications systems to be well managed. Expense levels should stabilize at a typical level for a property of this type. Marketing expense consists of all costs associated with advertising, sales, and promotion; these activities are intended to attract and retain customers. Marketing
Administrative and General Expense
Information and Telecommunications Systems Expense
Marketing Expense

February-2018 Projection of Income and Expense Proposed Extended-Stay Hotel – Maricopa, Arizona 109
can be used to create an image, develop customer awareness, and stimulate patronage of a property's various facilities. The marketing category is unique in that all expense items, with the exception of fees and commissions, are totally controlled by management. Most hotel operators establish an annual marketing budget that sets forth all planned expenditures. If the budget is followed, total marketing expenses can be projected accurately. Marketing expenditures are unusual because although there is a lag period before results are realized, the benefits are often extended over a long period. Depending on the type and scope of the advertising and promotion program implemented, the lag time can be as short as a few weeks or as long as several years. However, the favorable results of an effective marketing campaign tend to linger, and a property often enjoys the benefits of concentrated sales efforts for many months. Based upon our review of the comparable operating data and the expected scope of facility for the proposed subject hotel, we have positioned the marketing expense level at a market- and property-supported level.
FIGURE 7-11 MARKETING EXPENSE
#1 #2 #3 #4 #5 2020/21
Percentage of Revenue 6.2 % 2.1 % 2.8 % 2.6 % 4.0 % 6.1 % 4.5 %Per Ava i lable Room $1,782 $472 $671 $630 $1,094 $1,530 $1,200Per Occupied Room $6.45 $2.06 $2.61 $2.20 $4.09 $6.76 $4.70
Comparable Operating Statements Proposed Subject Property ForecastDeflated Stabilized
As previously discussed, the proposed subject property is expected to be operated independent of a franchise affiliation upon its opening; therefore, we have not included franchise fees in our forecast. Property operations and maintenance expense is another expense category that is largely controlled by management. Except for repairs that are necessary to keep the facility open and prevent damage (e.g., plumbing, heating, and electrical items), most maintenance can be deferred for varying lengths of time. Maintenance is an accumulating expense. If management elects to postpone performing a required repair, they have not eliminated or saved the expenditure; they have only deferred payment until a later date. A lodging facility that operates with a lower-than-normal maintenance budget is likely to accumulate a considerable amount of deferred maintenance.
Franchise Fee
Property Operations and Maintenance

February-2018 Projection of Income and Expense Proposed Extended-Stay Hotel – Maricopa, Arizona 110
The age of a lodging facility has a strong influence on the required level of maintenance. A new or thoroughly renovated property is protected for several years by modern equipment and manufacturers' warranties. However, as a hostelry grows older, maintenance expenses escalate. A well-organized preventive maintenance system often helps delay deterioration, but most facilities face higher property operations and maintenance costs each year, regardless of the occupancy trend. The quality of initial construction can also have a direct impact on future maintenance requirements. The use of high-quality building materials and construction methods generally reduces the need for maintenance expenditures over the long term. We expect the proposed subject hotel's maintenance operation to be well managed. Expense levels should stabilize at a typical level for a property of this type. Changes in this expense item through the projection period result from the application of the underlying inflation rate and projected changes in occupancy.
FIGURE 7-12 PROPERTY OPERATIONS AND MAINTENANCE EXPENSE
#1 #2 #3 #4 #5 2020/21
Percentage of Revenue 4.1 % 5.4 % 3.1 % 3.0 % 3.7 % 3.4 % 3.8 %Per Ava i lable Room $1,173 $1,253 $739 $727 $1,001 $850 $1,000Per Occupied Room $4.25 $5.47 $2.87 $2.54 $3.74 $3.76 $3.91
Comparable Operating Statements Proposed Subject Property ForecastDeflated Stabilized
The utilities consumption of a lodging facility takes several forms, including water and space heating, air conditioning, lighting, cooking fuel, and other miscellaneous power requirements. The most common sources of hotel utilities are electricity, natural gas, fuel oil, and steam. This category also includes the cost of water service. Total energy cost depends on the source and quantity of fuel used. Electricity tends to be the most expensive source, followed by oil and gas. Although all hotels consume a sizable amount of electricity, many properties supplement their utility requirements with less expensive sources, such as gas and oil, for heating and cooking. The changes in this utilities line item through the projection period are a result of the application of the underlying inflation rate and projected changes in occupancy.
Utilities Expense

February-2018 Projection of Income and Expense Proposed Extended-Stay Hotel – Maricopa, Arizona 111
FIGURE 7-13 UTILITIES EXPENSE
#1 #2 #3 #4 #5 2020/21
Percentage of Revenue 3.3 % 3.9 % 3.7 % 5.3 % 4.5 % 3.8 % 3.4 %Per Ava i lable Room $930 $900 $884 $1,311 $1,224 $956 $900Per Occupied Room $3.37 $3.93 $3.44 $4.58 $4.57 $4.23 $3.52
Comparable Operating Statements Proposed Subject Property ForecastDeflated Stabilized
Management expense consists of the fees paid to the managing agent contracted to operate the property. Some companies provide management services and a brand-name affiliation (first-tier management company), while others provide management services alone (second-tier management company). Some management contracts specify only a base fee (usually a percentage of total revenue), while others call for both a base fee and an incentive fee (usually a percentage of defined profit). Basic hotel management fees are often based on a percentage of total revenue, which means they have no fixed component. While base fees typically range from 2% to 4% of total revenue, incentive fees are deal specific and often are calculated as a percentage of income available after debt service and, in some cases, after a preferred return on equity. Total management fees for the proposed subject hotel have been forecast at 3.0% of total revenue. Property (or ad valorem) tax is one of the primary revenue sources of municipalities. Based on the concept that the tax burden should be distributed in proportion to the value of all properties within a taxing jurisdiction, a system of assessments is established. Theoretically, the assessed value placed on each parcel bears a definite relationship to market value, so properties with equal market values will have similar assessments and properties with higher and lower values will have proportionately larger and smaller assessments. Property assessments in this county are reviewed and adjusted annually at market value, referred to as “full cash value.” In addition, each property also has a second “limited value” that cannot exceed the full cash value. The limited value is essentially used to buffer the impact of changes in assessment so that any change is absorbed over a multiple-year period. Properties are generally inspected every three years, with annual adjustments based upon market factors and information compiled by the Arizona Department of Revenue. The County assesses improvements for hotels with over 200 rooms using the income approach to value, while hotels under 200 rooms are assessed using the cost approach via the Marshall & Swift cost estimator. Depreciation is generally based upon age, with commercial properties having an average 50-year life span and a 60% maximum depreciation. Personal property is taxed at a similar rate as real property (less the applicable flood assessment), but
Management Fee
Property Taxes

February-2018 Projection of Income and Expense Proposed Extended-Stay Hotel – Maricopa, Arizona 112
full cash and limited values are calculated based on inventories submitted by the property owner; personal property is depreciated annually. In 2012, Arizona voters approved Proposition 117, an amendment to the state constitution that provides property tax relief starting in 2015. Going forward, property taxes will be calculated only on the limited property value, and year-over-year value increases will be capped at no more than 5% per year. Annual tax burdens will be calculated by applying both the primary and secondary tax rates to the limited property value. The full cash value (i.e., market value) will continue to appear on the property tax record; however, it will no longer be used to calculate the amount of property tax owed. Depending on the taxing policy of the municipality, property taxes can be based on the value of the real property or the value of the personal property and the real property. We have based our estimate of the proposed subject property's market value (for tax purposes) on an analysis of assessments of comparable hotel properties in the local municipality.
FIGURE 7-14 COUNTY-ASSESSED VALUE OF COMPARABLE HOTELS
YearHotel Built Total
Hol iday Inn Express & Suites Casa Grande 2011 $3,525,507 — $3,525,507MainStay Suites Casa Grande 2006 2,289,054 — 2,289,054Hol iday Inn Casa Grande 1987 4,750,000 — 4,750,000Homewood Suites by Hi l ton Phoenix/Chandler 1998 — $206,100 206,100Homewood Suites by Hi l ton Phoenix Chandler Fashion Center 2009 — 689,800 689,800Res idence Inn by Marriott Phoenix Chandler/Fashion Center 2000 — 175,000 175,000
Assessments per RoomHol iday Inn Express & Suites Casa Grande 77 $45,786 — $45,786MainStay Suites Casa Grande 70 32,701 — 32,701Hol iday Inn Casa Grande 176 26,989 — 26,989Homewood Suites by Hi l ton Phoenix/Chandler 83 — $2,483 2,483Homewood Suites by Hi l ton Phoenix Chandler Fashion Center 133 — 5,186 5,186Res idence Inn by Marriott Phoenix Chandler/Fashion Center 102 — 1,716 1,716
Positioned Subject - Per Room 100 $35,000 $3,000 $38,000
Positioned Subject - Total $3,500,000 $300,000 $3,800,000
# of Rms
Pinal County Assessors Office
FCV Personal

February-2018 Projection of Income and Expense Proposed Extended-Stay Hotel – Maricopa, Arizona 113
We have positioned the future assessment levels of the subject site and proposed improvements, as well as the planned personal property, based upon the illustrated comparable data. We have positioned the real and personal property within a reasonable range of the comparable data. We note that the Pinal County Assessors Office declined to share business personal-property data for this report; therefore, indications for similar extended-stay hotels in Maricopa County were utilized. Tax rates are based on the city and county budgets, which change annually. The most recent combined tax rate in this jurisdiction was reported at 24.49150%. The following table shows changes in the tax rate during the last several years. FIGURE 7-15 COUNTY TAX RATES
Real Property PersonalYear Tax Rate
2015 24.56530 24.565302016 23.52690 23.526902017 24.49150 24.49150
Pi nal County Assessors Office
Tax Rate
Combined Combined
Arizona law requires the assessor's office to identify if a change in use, addition, or deletion of an improvement to a property has occurred. When there are additional improvements due to new construction, the Rule B process is utilized to calculate the limited property value. Rule B-5 applies to structures that are more than 50% (but less than 100%) completed prior to the deadline for the current valuation year (January 31). For structures that are less than 100% completed, the full cash value (market value) is set at a percentage complete of the market value as if 100% completed. The average ratio between the limited property value and full cash value is 95% of the positioned full cash value. Rule B-6 pertains to property that had a partially completed structure for the previous valuation year but is now complete. In this case, the full cash value represents 100% of market value as completed, while the limited property value is set at a 90% ratio of the full cash value.

February-2018 Projection of Income and Expense Proposed Extended-Stay Hotel – Maricopa, Arizona 114
FIGURE 7-16 RULE B ANALYSIS – RULE B5
2020/21 Tax Year(75% Complete)
Pos itioned Ful l Cash Va lue $3,500,000
Ful l Cash Va lue @ 75% of Pos itioned Ful l Cash Va lue
2,625,000
Limited Property Value @ 95% ratio of Ful l Cash Va lue
2,493,750
EstimatedAmount
Source: Pinal County Assessor
FIGURE 7-17 RULE B ANALYSIS – RULE B6
2017/18 Tax Year(100% Complete)
Pos itioned Ful l Cash Va lue $3,500,000
Ful l Cash Va lue @ 100% of Pos itioned Ful l Cash Va lue 3,500,000
Limited Property Value @ 90% ratio of Ful l Cash Va lue 3,150,000
Source: Pinal County Assessor
EstimatedAmount
Based on comparable assessments and the tax rate information, the proposed subject property's projected property tax expense levels are calculated as follows. FIGURE 7-18 PROJECTED PROPERTY TAX EXPENSE - REAL PROPERTY
Year
Pos i tioned $3,150,000 18.0 % $567,000 — — 24.49 $138,867
2016/17 $2,493,750 18.0 % $448,875 -20.8 % 2.0 % — $112,7142017/18 3,150,000 18.0 567,000 26.3 2.5 — 145,1932018/19 3,307,500 18.0 595,350 5.0 3.0 — 156,8082019/20 3,472,875 18.0 625,118 5.0 3.0 — 169,353
Assessment Ratio
Limited Property Value
(LPV) LPV Assessed
Forecast Rate of Value Change
Base Rate of Tax Burden
Increase
Combined Real Property Tax
RateTax Forecast - Real Property

February-2018 Projection of Income and Expense Proposed Extended-Stay Hotel – Maricopa, Arizona 115
FIGURE 7-19 PROJECTED PROPERTY TAX EXPENSE – PERSONAL PROPERTY
Year
Pos itioned $300,000 18.0 % $54,000 — — 24.49 $13,225
2020/21 $300,000 18.0 % $54,000 0.0 % 2.0 % — $13,4902021/22 300,000 18.0 54,000 0.0 2.5 — 13,8272022/23 300,000 18.0 54,000 0.0 3.0 — 14,2422023/24 300,000 18.0 54,000 0.0 3.0 — 14,669
Full Cash Value (FCV) Assessment Ratio LPV Assessed
Forecast Rate of Value Change
Base Rate of Tax Burden
Increase
Combined Personal
Property Tax Rate
Tax Forecast - Personal Property
The insurance expense category consists of the cost of insuring the hotel and its contents against damage or destruction by fire, weather, sprinkler leakage, boiler explosion, plate glass breakage, and so forth. General insurance costs also include premiums relating to liability, fidelity, and theft coverage. Insurance rates are based on many factors, including building design and construction, fire detection and extinguishing equipment, fire district, distance from the firehouse, and the area's fire experience. Insurance expenses do not vary with occupancy.
FIGURE 7-20 INSURANCE EXPENSE
#1 #2 #3 #4 #5 2020/21
Percentage of Revenue 0.9 % 1.0 % 0.6 % 0.7 % 1.4 % 1.1 % 0.9 %Per Ava i lable Room $253 $230 $141 $166 $377 $275 $250Per Occupied Room $0.92 $1.00 $0.55 $0.58 $1.41 $1.21 $0.98
Deflated StabilizedComparable Operating Statements Proposed Subject Property Forecast
Furniture, fixtures, and equipment are essential to the operation of a lodging facility, and their quality often influences a property's class. This category includes all non-real estate items that are capitalized, rather than expensed. The furniture, fixtures, and equipment of a hotel are exposed to heavy use and must be replaced at regular intervals. The useful life of these items is determined by their quality, durability, and the amount of guest traffic and use. Periodic replacement of furniture, fixtures, and equipment is essential to maintain the quality, image, and income-producing potential of a lodging facility. Because capitalized expenditures are not included in the operating statement but affect an owner's cash flow, a forecast of income and expense should reflect these expenses in the form of an appropriate reserve for replacement.
Insurance Expense
Reserve for Replacement

February-2018 Projection of Income and Expense Proposed Extended-Stay Hotel – Maricopa, Arizona 116
The International Society of Hospitality Consultants (ISHC) oversees a major industry-sponsored study of the capital expenditure requirements for full-service/luxury, select-service, and extended-stay hotels. The most recent study was published in 2014.7 Historical capital expenditures of well-maintained hotels were investigated through the compilation of data provided by most of the major hotel companies in the United States. A prospective analysis of future capital expenditure requirements was also performed based upon the cost to replace short- and long-lived building components over a hotel's economic life. The study showed that the capital expenditure requirements for hotels vary significantly from year to year and depend upon both the actual and effective ages of a property. The results of this study showed that hotel lenders and investors are requiring reserves for replacement ranging from 4% to 5% of total revenue. Based on the results of our analysis and on our review of the proposed subject asset and comparable lodging facilities, as well as on our industry expertise, we estimate that a reserve for replacement of 4% of total revenues is sufficient to provide for the timely and periodic replacement of the subject property's furniture, fixtures, and equipment. This amount has been ramped up during the initial projection period. Projected total revenue. House profit, and EBITDA less replacement reserves are set forth in the following table.
FIGURE 7-21 FORECAST OF REVENUE AND EXPENSE CONCLUSION
Year Total%
Change Total % Change Total % Change
Projected 2020/21 $2,521,000 — $1,143,000 — 45.2 % $864,000 — 34.1 %2021/22 2,858,000 13.4 % 1,389,000 21.5 % 48.7 1,031,000 19.3 % 36.12022/23 3,074,000 7.6 1,535,000 10.5 50.0 1,120,000 8.6 36.52023/24 3,166,000 3.0 1,581,000 3.0 50.0 1,146,000 2.3 36.32024/25 3,261,000 3.0 1,629,000 3.0 50.0 1,180,000 3.0 36.3
Total Revenue House Profit House Profit Ratio
EBITDA Less Replacement ReserveAs a % of
Ttl Rev
7 The International Society of Hotel Consultants, CapEx 2014, A Study of Capital Expenditure in the U.S. Hotel Industry.
Forecast of Revenue and Expense Conclusion

February-2018 Feasibility Analysis Proposed Extended-Stay Hotel – Maricopa, Arizona 117
8. Feasibility Analysis
Return on investment can be defined as the future benefits of an income-producing property relative to its acquisition or construction cost. The first step in performing a return on investment analysis is to determine the amount to be initially invested. For a proposed property, this amount is most likely to be the development cost of the hotel. Based on the total development cost, the individual investor will utilize a return on investment analysis to determine if the future cash flow from a current cash outlay meets his or her own investment criteria and at what level above or below this amount such an outlay exceeds or fails to meet these criteria. As an individual or company considering investment in hotel real estate, the decision to use one’s own cash, an equity partner's capital, or lender financing will be an internal one. Because hotels typically require a substantial investment, only the largest investors and hotel companies generally have the means to purchase properties with all cash. We would anticipate the involvement of some financing by a third party for the typical investor or for those who may be entering the market for hotel acquisitions at this time. In leveraged acquisitions and developments where investors typically purchase or build upon real estate with a small amount of equity cash (20% to 50%) and a large amount of mortgage financing (50% to 80%), it is important for the equity investor to acknowledge the return requirements of the debt participant (mortgagee), as well as his or her own return requirements. Therefore, we will begin our rate of return analysis by reviewing the debt requirements of typical hotel mortgagees. The construction budget for the 100-room subject hotel, as estimated by HVS, is illustrated in the following table.
FIGURE 8-1 SUBJECT PROPERTY CONSTRUCTION BUDGET
Item Cost
Bui ldi ng, Pre-Openi ng & Worki ng Capi ta l , Soft Costs $8,300,000Furniture, Fi xtures , & Equi pment 1,500,000Land 1,200,000Entrepreneuria l Incentive 550,000
Total Cost New Estimate $11,550,000
Construction Cost Estimate

February-2018 Feasibility Analysis Proposed Extended-Stay Hotel – Maricopa, Arizona 118
Hotel financing is available for most tiers of the lodging industry from a variety of lender types. The CMBS market is in a phase of strong activity, including lending in the hospitality sector. While many lenders remain active, underwriting standards are more stringent than ten years ago, and loan-to-value ratios remain in the 60% to 70% range. Lenders continue to be attracted to the lodging industry because of the higher yields generated by hotel financing relative to other commercial real estate, and the industry continues to perform strongly in most markets. Commercial banks, mortgage REITs, insurance companies, and CMBS and mezzanine lenders continue to pursue deals. Data for the mortgage component may be developed from statistics of actual hotel mortgages made by long-term lenders. The American Council of Life Insurance, which represents 20 large life insurance companies, publishes quarterly information pertaining to the hotel mortgages issued by its member companies. Because of the six- to nine-month lag time in reporting and publishing hotel mortgage statistics, it was necessary to update this information to reflect current lending practices. Our research indicates that the greatest degree of correlation exists between the average interest rate of a hotel mortgage and the concurrent yield on an average-A corporate bond. The following chart summarizes the average mortgage interest rates of the hotel loans made by these lenders. For the purpose of comparison, the average-A corporate bond yield (as reported by Moody's Bond Record) is also shown.
Mortgage Component

February-2018 Feasibility Analysis Proposed Extended-Stay Hotel – Maricopa, Arizona 119
FIGURE 8-2 AVERAGE MORTGAGE INTEREST RATES AND AVERAGE-A CORPORATE BOND YIELDS
3.0
4.0
5.0
6.0
7.0
8.0
9.0
2008
- 3r
d
2009
- 1s
t
2009
- 3r
d
2010
- 1s
t
2010
- 3r
d
2011
- 1s
t
2011
- 3r
d
2012
- 1s
t
2012
- 3r
d
2013
- 1s
t
2013
- 3r
d
2014
- 1s
t
2014
- 3r
d
2015
- 1s
t
2015
- 3r
d
2016
- 1s
t
2016
- 3r
d
2017
- 1s
t
2017
- 3r
d
Rate
(%)
Sources: American Council of Life Insurance, Moody's Bond Record, HVS
Avg. Interest Rate (%) Avg. A Corp. Bond Yield (%)
The relationship between hotel interest rates and the yields from the average-A corporate bond can be detailed through a regression analysis, which is expressed as follows.
Y = 0.95702153 X + 0.76102760 Where: Y = Estimated Hotel Mortgage Interest Rate
X = Current Average-A Corporate Bond Yield (Coefficient of correlation is 95%) The January 10, 2018, average yield on average-A corporate bonds, as reported by Moody’s Investors Service, was 3.88%. When used in the previously presented equation, a factor of 3.88 produces an estimated hotel/motel interest rate of 4.47% (rounded). Despite the recent interest-rate increases, hotel debt remains available at favorable interest rates from a variety of lender types as of early 2018 (e.g., CMBS, balance-sheet lenders, insurance companies, SBA lenders, and other sources). The most prevalent interest rates for single hotel assets are currently ranging from 5.0% to 7.0%, depending on the type of debt, loan-to-value ratio, and the quality of the asset and its market.

February-2018 Feasibility Analysis Proposed Extended-Stay Hotel – Maricopa, Arizona 120
In addition to the mortgage interest rate estimate derived from this regression analysis, HVS constantly monitors the terms of hotel mortgage loans made by our institutional lending clients. Fixed-rate debt is being priced at roughly 250 to 500 basis points over the corresponding yield on treasury notes. As of January 10, 2018, the yield on the ten-year T-bill was 2.55%, indicating an interest rate range from 5.1% to 7.6%. The hotel investment market has been very active given the strong performance of this sector and low interest rates in recent years. The Federal Reserve, which raised the federal funds rate by 25 basis points in December 2016, March 2017, and June 2017, is anticipated to raise interest rates again in 2018. Hotel mortgage interest rates have only been slightly influenced by the recent rate increases by the Fed given the contraction in interest-rate spreads; however, future increases by the Fed raises the prospect of a higher cost of debt capital for hotel investors in 2018. Hotel values have not yet been affected by the rise in the Fed rate; furthermore, debt capital is expected to remain available at favorable interest rates in the near term. At present, we find that lenders that are active in the market are using loan-to-value ratios of 60% to 70%, and amortization periods of 20 to 30 years. Loan-to-value ratios in 2018 are not as robust as those from a couple of years ago, when ratios as high as 75% were available. Based on our analysis of the current lodging industry mortgage market and adjustments for specific factors, such as the proposed property’s location and conditions in the Maricopa hotel market, it is our opinion that a 5.25% interest, 20-year amortization mortgage with a 0.080861 constant is appropriate for the proposed subject hotel. In the mortgage-equity analysis, we have applied a loan-to-cost ratio of 70%, which is reasonable to expect based on this interest rate and current parameters. The remaining capital required for a hotel investment generally comes from the equity investor. The rate of return that an equity investor expects over a ten-year holding period is known as the equity yield. Unlike the equity dividend, which is a short-term rate of return, the equity yield specifically considers a long-term holding period (generally ten years), annual inflation- adjusted cash flows, property appreciation, mortgage amortization, and proceeds from a sale at the end of the holding period. To establish an appropriate equity yield rate, we have used two sources of data: past appraisals and investor interviews. Hotel Sales – Each appraisal performed by HVS uses a mortgage-equity approach in which income is projected and then discounted to a current value at rates reflecting the cost of debt and equity capital. In the case of hotels that were sold near the date of our valuation, we were able to derive the equity yield rate and unlevered discount rate by inserting the ten-year projection, total investment (purchase price and estimated capital expenditure and/or PIP) and debt assumptions into a valuation model and solving for the equity yield. The overall capitalization rates for
Equity Component

February-2018 Feasibility Analysis Proposed Extended-Stay Hotel – Maricopa, Arizona 121
the historical income and projected first-year income are based on the sales price “as is.” The following table shows a representative sample of hotels that were sold on or about the time that we appraised them, along with the derived equity return and discount rates based on the purchase price and our forecast.

February-2018 Feasibility Analysis Proposed Extended-Stay Hotel – Maricopa, Arizona 122
FIGURE 8-3 SAMPLE OF HOTELS SOLD - SELECT-SERVICE/EXTENDED-STAY
Hotel Location
Hi l ton Garden Inn Al lentown Wes t Breinigsvi le, PA 111 Nov-17 10.8 % 18.9 % 8.1 % 8.6 %Courtyard by Marriott Tucson Airport Tucson, AZ 149 Nov-17 9.7 16.1 8.9 8.3Hampton Inn Sai nt Augustine I-95 Sa int Augustine, FL 67 Sep-17 11.9 21.0 11.3 10.8Hampton Inn & Sui tes Palm Coast Pa lm Coast, FL 94 Sep-17 12.5 21.2 10.2 10.6Element Denver Park Meadows Lone Tree, CO 123 Aug-17 10.3 18.7 5.9 8.1SpringHi l l Sui tes by Marriott Savannah, GA 79 Aug-17 12.1 20.8 4.0 9.3TownePlace Sui tes by Marriott Waco, TX 93 Aug-17 11.2 20.7 8.5 7.8Courtyard SeaWorld Lackland San Antonio, TX 96 Aug-17 11.0 18.9 7.9 7.8Courtyard Kaua'i at Coconut Beach Kapa 'a , HI 311 Aug-17 11.5 19.4 6.4 4.1Hampton Inn by Hi l ton Norfolk Virginia Beach, VA 120 Jul -17 11.4 21.2 12.4 12.6TownePlace Sui tes by Marriott Ta l lahassee, FL 94 Jul -17 10.5 16.1 14.5 7.9Hyatt Place US Capitol Washington, D.C. 200 Jun-17 10.3 20.0 6.1 7.2Hyatt Place San Jose Downtown San Jos e, CA 234 Jun-17 12.2 21.4 8.1 8.5Courtyard by Marriott Boston Cambri dge, MA 207 Jun-17 9.0 14.9 5.5 6.0Hi l ton Garden Inn Phi l adelphia Fort Washington, PA 146 May-17 10.9 19.7 7.6 8.3Hampton Inn Northlake Atlanta , GA 121 May-17 11.5 20.0 9.4 9.6Hyatt House Denver Airport Denver, CO 123 May-17 11.5 21.9 7.0 8.7Courtyard by Marriott Maui Kahului , HI 138 May-17 8.1 12.7 6.0 6.0Courtyard by Marriott Rock Hi l l , SC 90 Apr-17 12.5 23.6 15.2 11.1Hampton Inn DeKalb, IL 80 Mar-17 10.7 19.1 6.9 8.1Hampton Inn Ridgefield Park, NJ 83 Mar-17 9.8 17.1 6.4 6.6Courtyard by Marriott Tulsa, OK 122 Mar-17 12.3 21.4 12.3 10.3Hi l ton Garden Inn Overland Park, KS 125 Feb-17 10.6 19.4 8.1 8.5TownePlace Sui tes by Marriott Mount Laurel , NJ 94 Feb-17 8.7 16.1 5.8 8.3Hyatt Place Charl otte Downtown Charlotte, NC 172 Jan-17 10.5 19.4 6.7 8.1Hotel 43 Boise, ID 112 Jan-17 11.0 20.2 8.8 8.9Hyatt Place Airport Va l ley View Mal l Roanoke, VA 126 Jan-17 11.7 21.7 7.8 9.2Hyatt Place Greenvi l le Haywood Greenvi l le, SC 126 Jan-17 11.5 21.5 8.7 10.2Hyatt Place Da l las Park Centra l Da l las , TX 126 Jan-17 10.2 18.3 7.9 8.9Hyatt Place North Point Mal l Alpharetta , GA 124 Jan-17 12.4 23.8 10.8 11.0Hyatt Place Charl otte Arrowood Charlotte, NC 126 Jan-17 11.1 20.6 8.7 9.6Hyatt Place Topeka Topeka , KS 126 Jan-17 9.9 17.7 8.3 9.6Courtyard by Marriott Midtown Sacramento, CA 139 Dec-16 10.5 18.4 8.6 8.7Hyatt House Colorado Springs Colorado Springs , CO 125 Dec-16 13.1 23.3 9.9 11.3Courtyard by Marriott Boise Boise, ID 162 Dec-16 11.2 21.2 8.4 9.5Hampton Inn Freeport Freeport, IL 72 Nov-16 10.7 19.3 8.7 10.6Res idence Inn by Marriott Bozeman Bozeman, MT 115 Nov-16 11.2 19.1 7.2 8.8Hi l ton Garden Inn Downtown Detroi t, MI 198 Oct-16 12.0 22.3 8.7 10.0
Numberof Rooms of Sale
HistoricalTotal
Property Equity ProjectedYear Year One
DateYield Yield
Overall RateBased on Sales Price
Source: HVS
Investor Interviews - During the course of our work, we continuously monitor investor equity-yield requirements through discussions with hotel investors and
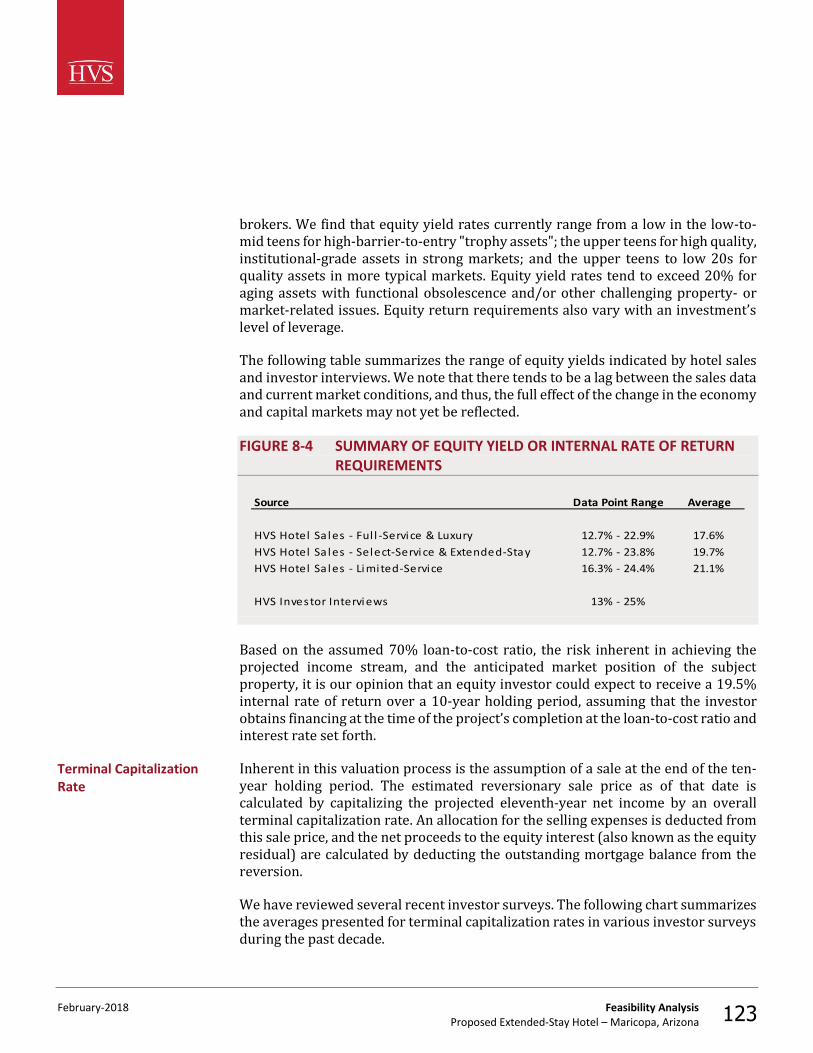
February-2018 Feasibility Analysis Proposed Extended-Stay Hotel – Maricopa, Arizona 123
brokers. We find that equity yield rates currently range from a low in the low-to-mid teens for high-barrier-to-entry "trophy assets"; the upper teens for high quality, institutional-grade assets in strong markets; and the upper teens to low 20s for quality assets in more typical markets. Equity yield rates tend to exceed 20% for aging assets with functional obsolescence and/or other challenging property- or market-related issues. Equity return requirements also vary with an investment’s level of leverage. The following table summarizes the range of equity yields indicated by hotel sales and investor interviews. We note that there tends to be a lag between the sales data and current market conditions, and thus, the full effect of the change in the economy and capital markets may not yet be reflected. FIGURE 8-4 SUMMARY OF EQUITY YIELD OR INTERNAL RATE OF RETURN
REQUIREMENTS
Source Data Point Range Average
HVS Hotel Sa les - Ful l -Service & Luxury 12.7% - 22.9% 17.6%HVS Hotel Sa les - Select-Service & Extended-Stay 12.7% - 23.8% 19.7%HVS Hotel Sa les - Limited-Service 16.3% - 24.4% 21.1%
HVS Investor Interviews 13% - 25%
Based on the assumed 70% loan-to-cost ratio, the risk inherent in achieving the projected income stream, and the anticipated market position of the subject property, it is our opinion that an equity investor could expect to receive a 19.5% internal rate of return over a 10-year holding period, assuming that the investor obtains financing at the time of the project’s completion at the loan-to-cost ratio and interest rate set forth. Inherent in this valuation process is the assumption of a sale at the end of the ten-year holding period. The estimated reversionary sale price as of that date is calculated by capitalizing the projected eleventh-year net income by an overall terminal capitalization rate. An allocation for the selling expenses is deducted from this sale price, and the net proceeds to the equity interest (also known as the equity residual) are calculated by deducting the outstanding mortgage balance from the reversion. We have reviewed several recent investor surveys. The following chart summarizes the averages presented for terminal capitalization rates in various investor surveys during the past decade.
Terminal Capitalization Rate

February-2018 Feasibility Analysis Proposed Extended-Stay Hotel – Maricopa, Arizona 124
FIGURE 8-5 HISTORICAL TRENDS OF TERMINAL CAPITALIZATION RATES
7.0
8.0
9.0
10.0
11.0
12.0
13.0
2007
2008
2009
2010
2011
2012
2013
2014
2015
2016
2017
Term
inal
Cap
Rat
e (%
)
PWC - Limited-Service Situs RERC - Second Tier
PWC - Select-Service Situs RERC - Third Tier
FIGURE 8-6 TERMINAL CAPITALIZATION RATES DERIVED FROM INVESTOR SURVEYS
Source Data Point Range Average
PWC Rea l Es tate Investor Survey - 3rd Quarter 2017 Select-Service Hotels 7.0% - 10.75% 9.1% Ful l -Service Hotels 7.0% - 10.0% 8.4% Luxury Hotels 5.5% - 9.5% 7.2%
USRC Hotel Investment Survey - Mid-Year 2017 Ful l -Service Hotels 7.0% - 9.25% 8.3%
Si tus RERC Real Estate Report - 2nd Quarter 2017 Fi rs t Tier Hotels 6.5% - 10.0% 8.3%
For purposes of this analysis, we have applied a terminal capitalization rate of 9.0%. Our final position for the terminal capitalization rate reflects the current market for hotel investments and also considers the subject property's attributes. Terminal capitalization rates, in general, have remained stable over the past few years. Terminal cap rates are at the low end of the range for quality hotel assets in markets

February-2018 Feasibility Analysis Proposed Extended-Stay Hotel – Maricopa, Arizona 125
with high barriers to entry and at the high end of the range for older assets or for those suffering from functional obsolescence and/or weak market conditions, reflecting the market's recognition that certain assets have less opportunity for significant appreciation. As the two participants in a real estate investment, investors and lenders must evaluate their equity and debt contributions based on their particular return requirements. After carefully weighing the risk associated with the projected economic benefits of a lodging investment, the participants will typically make their decision whether or not to invest in a hotel or resort by determining if their investment will provide an adequate yield over an established period. For the lender, this yield will typically reflect the interest rate required for a hotel mortgage over a period of what can range from seven to ten years. The yield to the equity participant may consider not only the requirements of a particular investor, but also the potential payments to cooperative or ancillary entities such as limited partner payouts, stockholder dividends, and management company incentive fees. The return on investment analysis in a hotel acquisition would not be complete without recognizing and reflecting the yield requirements of both the equity and debt participants. The analysis will now calculate the yields to the mortgage and equity participants during a ten-year projection period. The annual debt service is calculated by multiplying the mortgage component by the mortgage constant.
Mortgage Component $8,094,000 The yield to the lender based on a 70% debt contribution equates to an interest rate of 5.25%%, which is calculated as follows.
Mortgage-Equity Method

February-2018 Feasibility Analysis Proposed Extended-Stay Hotel – Maricopa, Arizona 126
FIGURE 8-7 RETURN TO THE LENDER
Total Annual Present Worth of $1 DiscountedYear Debt Service Factor at 5.1% Cash Flow
2020/21 $654,000 x 0.951084 = $622,0002021/22 654,000 x 0.904561 = 592,0002022/23 654,000 x 0.860313 = 563,0002023/24 654,000 x 0.818230 = 535,0002024/25 654,000 x 0.778205 = 509,0002025/26 654,000 x 0.740138 = 484,0002026/27 654,000 x 0.703934 = 460,0002027/28 654,000 x 0.669500 = 438,0002028/29 654,000 x 0.636751 = 416,0002029/30 5,738,000 * x 0.605603 = 3,475,000
Value of Mortgage Component $8,094,000
*10th year debt service of $654,000 plus outstanding mortgage balance of $5,083,000
The following table illustrates the cash flow available to the equity position, after deducting the debt service from the projected net income. FIGURE 8-8 NET INCOME TO EQUITY
Net IncomeAvailable for Total Annual Net Income
Year Debt Service Debt Service to Equity
2020/21 $864,000 - $654,000 = $210,0002021/22 $1,031,000 - 654,000 = $377,0002022/23 $1,120,000 - 654,000 = $466,0002023/24 $1,146,000 - 654,000 = $492,0002024/25 $1,180,000 - 654,000 = $526,0002025/26 $1,215,000 - 654,000 = $561,0002026/27 $1,252,000 - 654,000 = $598,0002027/28 $1,289,000 - 654,000 = $635,0002028/29 $1,328,000 - 654,000 = $674,0002029/30 $1,368,000 - 654,000 = $714,000
In order for the present value of the equity investment to equate to the $3,471,000 capital outlay, the investor must accept a 20.3% return, as shown in the following table.

February-2018 Feasibility Analysis Proposed Extended-Stay Hotel – Maricopa, Arizona 127
FIGURE 8-9 EQUITY COMPONENT YIELD
Net Income Present Worth of $1 DiscountedYear to Equity Factor at 20.3% Cash Flow
2020/21 $210,000 x 0.831191 = $175,0002021/22 $377,000 x 0.690879 = 260,0002022/23 $466,000 x 0.574252 = 268,0002023/24 $492,000 x 0.477313 = 235,0002024/25 $526,000 x 0.396738 = 209,0002025/26 $561,000 x 0.329765 = 185,0002026/27 $598,000 x 0.274098 = 164,0002027/28 $635,000 x 0.227828 = 145,0002028/29 $674,000 x 0.189369 = 128,0002029/30 $10,816,000 * x 0.157401 = 1,702,000
Value of Equi ty Component $3,471,000
*10th year net income to equity of $713,946 plus sales proceeds of $10,102,000
In determining the potential feasibility of the Proposed Extended-Stay Hotel, we analyzed the lodging market, researched the area’s economics, reviewed the estimated development cost, and prepared a ten-year forecast of income and expense, which was based on our review of the current and historical market conditions, as well as comparable income and expense statements. The conclusion of this analysis indicates that an equity investor contributing $3,471,000 (roughly 30% of the $11,600,000 development cost) could expect to receive a 20.3% internal rate of return over a ten-year holding period, assuming that the investor obtains financing at the time of the project’s completion at the loan-to-value ratio and interest rate set forth. The proposed subject hotel has an opportunity to serve an unrepresented niche in the market because the Maricopa area remains underserved by non-casino lodging facilities. Based on our market analysis, there is sufficient market support for the proposed upper-midscale to upscale, extended-stay hotel. Our conclusions are based primarily on the long-term strength of this hotel market. The greater market continues to absorb new supply, and the forecasts related to strong demand and ADR growth indicate that the market should successfully absorb the new supply, including the proposed subject hotel. Our review of investor surveys indicates equity returns ranging from 14.2% to 23.8%, with an average of 19.7%. Based on these parameters, the calculated return to the equity investor, 20.3%, is above the average yet within the range of market-level returns given the anticipated cost of $11,600,000. Based on these parameters, the feasibility of the subject project is confirmed.
Conclusion

February-2018 Feasibility Analysis Proposed Extended-Stay Hotel – Maricopa, Arizona 128
The analysis is based on the extraordinary assumption that the described improvements have been completed as of the stated date of opening. The reader should understand that the completed subject property does not yet exist as of the date of this report. Our feasibility study does not address unforeseeable events that could alter the proposed project and/or the market conditions reflected in the analyses; we assume that no significant changes, other than those anticipated and explained in this report, shall take place between the date of inspection and stated date of opening. The use of this extraordinary assumption may have affected the assignment results. We have made no other extraordinary assumptions specific to this feasibility study. However, several important general assumptions have been made that apply to this feasibility study and our studies of proposed hotels in general. These aspects are set forth in the Assumptions and Limiting Conditions chapter of this report. We have assumed the hypothetical condition that the subject site, which has yet to be selected, would be located favorably along the State Route 347 corridor, offering easy access to transportation linkages, ancillary commercial uses (retail, restaurant, and entertainment), and demand generators in/around the City of Maricopa. The reader should understand that the specific subject site has not been chosen, and that any deviation from these site assumptions could potentially alter the feasibility of this project; however, additional analysis would be required to confirm. We have assumed no other significant hypothetical conditions. Furthermore, we have not made any jurisdictional exceptions to the Uniform Standards of Professional Appraisal Practice in our analysis or report.

February-2018 Statement of Assumptions and Limiting Conditions Proposed Extended-Stay Hotel – Maricopa, Arizona 129
9. Statement of Assumptions and Limiting Conditions
1. This report is set forth as a feasibility study of the proposed subject hotel; this is not an appraisal report.
2. This report is to be used in whole and not in part. 3. No responsibility is assumed for matters of a legal nature, nor do we render
any opinion as to title, which is assumed marketable and free of any deed restrictions and easements. The property is evaluated as though free and clear unless otherwise stated.
4. We assume that there are no hidden or unapparent conditions of the sub-soil or structures, such as underground storage tanks, that would affect the property’s development potential. No responsibility is assumed for these conditions or for any engineering that may be required to discover them.
5. We have not considered the presence of potentially hazardous materials or any form of toxic waste on the project site. We are not qualified to detect hazardous substances and urge the client to retain an expert in this field if desired.
6. The Americans with Disabilities Act (ADA) became effective on January 26, 1992. We have assumed the proposed hotel would be designed and constructed to be in full compliance with the ADA.
7. We have made no survey of the site, and we assume no responsibility in connection with such matters. Sketches, photographs, maps, and other exhibits are included to assist the reader in visualizing the property. It is assumed that the use of the described real estate will be within the boundaries of the property described, and that no encroachment will exist.
8. All information, financial operating statements, estimates, and opinions obtained from parties not employed by TS Worldwide, LLC are assumed true and correct. We can assume no liability resulting from misinformation.
9. Unless noted, we assume that there are no encroachments, zoning violations, or building violations encumbering the subject property.
10. The property is assumed to be in full compliance with all applicable federal, state, local, and private codes, laws, consents, licenses, and regulations (including the appropriate liquor license if applicable), and that all licenses, permits, certificates, franchises, and so forth can be freely renewed or transferred to a purchaser.

February-2018 Statement of Assumptions and Limiting Conditions Proposed Extended-Stay Hotel – Maricopa, Arizona 130
11. All mortgages, liens, encumbrances, leases, and servitudes have been disregarded unless specified otherwise.
12. None of this material may be reproduced in any form without our written permission, and the report cannot be disseminated to the public through advertising, public relations, news, sales, or other media.
13. We are not required to give testimony or attendance in court because of this analysis without previous arrangements, and shall do so only when our standard per-diem fees and travel costs have been paid prior to the appearance.
14. If the reader is making a fiduciary or individual investment decision and has any questions concerning the material presented in this report, it is recommended that the reader contact us.
15. We take no responsibility for any events or circumstances that take place subsequent to the date of our field inspection.
16. The quality of a lodging facility's onsite management has a direct effect on a property's economic viability. The financial forecasts presented in this analysis assume responsible ownership and competent management. Any departure from this assumption may have a significant impact on the projected operating results.
17. The financial analysis presented in this report is based upon assumptions, estimates, and evaluations of the market conditions in the local and national economy, which may be subject to sharp rises and declines. Over the projection period considered in our analysis, wages and other operating expenses may increase or decrease because of market volatility and economic forces outside the control of the hotel’s management. We assume that the price of hotel rooms, food, beverages, and other sources of revenue to the hotel will be adjusted to offset any increases or decreases in related costs. We do not warrant that our estimates will be attained, but they have been developed based upon information obtained during the course of our market research and are intended to reflect the expectations of a typical hotel investor as of the stated date of the report.
18. This analysis assumes continuation of all Internal Revenue Service tax code provisions as stated or interpreted on either the date of value or the date of our field inspection, whichever occurs first.
19. Many of the figures presented in this report were generated using sophisticated computer models that make calculations based on numbers carried out to three or more decimal places. In the interest of simplicity, most numbers have been rounded to the nearest tenth of a percent. Thus, these figures may be subject to small rounding errors.

February-2018 Statement of Assumptions and Limiting Conditions Proposed Extended-Stay Hotel – Maricopa, Arizona 131
20. It is agreed that our liability to the client is limited to the amount of the fee paid as liquidated damages. Our responsibility is limited to the client, and use of this report by third parties shall be solely at the risk of the client and/or third parties. The use of this report is also subject to the terms and conditions set forth in our engagement letter with the client.
21. Evaluating and comprising financial forecasts for hotels is both a science and an art. Although this analysis employs various mathematical calculations to provide value indications, the final forecasts are subjective and may be influenced by our experience and other factors not specifically set forth in this report.
22. This study was prepared by HVS, a division of TS Worldwide, LLC. All opinions, recommendations, and conclusions expressed during the course of this assignment are rendered by the staff of TS Worldwide, LLC as employees, rather than as individuals.

February-2018 Certification Proposed Extended-Stay Hotel – Maricopa, Arizona 132
10. Certification
The undersigned hereby certify that, to the best of our knowledge and belief: 1. the statements of fact presented in this report are true and correct; 2. the reported analyses, opinions, and conclusions are limited only by the
reported assumptions and limiting conditions, and are our personal, impartial, and unbiased professional analyses, opinions, and conclusions;
3. we have no present or prospective interest in the property that is the subject of this report and no personal interest with respect to the parties involved;
4. we have no bias with respect to the property that is the subject of this report or to the parties involved with this assignment;
5. our engagement in this assignment was not contingent upon developing or reporting predetermined results;
6. our compensation for completing this assignment is not contingent upon the development or reporting of a predetermined result or direction in performance that favors the cause of the client, the attainment of a stipulated result, or the occurrence of a subsequent event directly related to the intended use of this study;
7. our analyses, opinions, and conclusions were developed, and this report has been prepared, in conformity with the Uniform Standards of Professional Appraisal Practice;
8. Ryan Wall personally inspected the property described in this report; Ryan Wall participated in the analysis and reviewed the findings;
9. no one other than those listed above and the undersigned prepared the analyses, conclusions, and opinions concerning the real estate that are set forth in this report; Ryan M. Wall has not performed services, as an appraiser or in any other capacity, on the property that is the subject of this report within the three-year period immediately preceding acceptance of this assignment;
10. the reported analyses, opinions, and conclusions were developed, and this report has been prepared, in conformity with the requirements of the Code of Professional Ethics and the Standards of Professional Appraisal Practice of the Appraisal Institute;
11. the use of this report is subject to the requirements of the Appraisal Institute relating to review by its duly authorized representatives; and

February-2018 Certification Proposed Extended-Stay Hotel – Maricopa, Arizona 133
Ryan Wall Director TS Worldwide, LLC State Appraiser License (AZ) 32100

HVS, Phoenix, Arizona Qualifications of Ryan Wall 1
Ryan Wall
HVS CONSULTING AND VALUATION SERVICES Phoenix, Arizona SHERATON CLAYTON PLAZA HOTEL St. Louis, Missouri HILTON MADISON MONONA TERRACE Madison, Wisconsin MARCUS HOTELS AND RESORTS Milwaukee, Wisconsin SHERATON LANSING HOTEL Lansing, Michigan PFISTER HOTEL Milwaukee, Wisconsin GREAT WOLF LODGE RESORT Wisconsin Dells, Wisconsin MICHIGAN STATE UNIVERSITY HOUSING AND FOOD SERVICES East Lansing, Michigan Arizona Commercial Mortgage Lenders Association (ACMLA) Urban Land Institute Arizona NAIOP Arizona
EMPLOYMENT
2012 to present
2011 – 2012
2010 – 2011
2009 – 2010
2009
2008
2006 – 2007
2006 – 2009
PROFESSIONAL AFFILIATIONS

HVS, Phoenix, Arizona Qualifications of Ryan Wall 2
BS – School of Hospitality Business, Michigan State University Other Specialized Training Classes Completed: Uniform Standards of Professional Appraisal Practice – 15 hours Basic Appraisal Procedures – 30 hours Basic Appraisal Principles – 30 hours General Appraiser Income Approach (Parts I and II) – 60 hours General Appraiser Market Analysis and HBU – 30 hours General Appraiser Site Valuation and Cost Approach – 30 hours General Appraiser Sales Comparison Approach – 30 hours General Appraiser Report Writing and Case Studies – 30 hours Business Practices and Ethics – 5 hours Statistics, Modeling and Finance – 15 hours Advanced Income – 30 hours Comprehensive Review of Appraisal Concepts Advanced Hotel Appraisals Appraisal of Land Subject to Ground Lease – 7 hours Exploring Appraiser Liability – 7 hours Appraisal of Green Buildings – 7 hours Annual USPAP Updates – 4 hours Arizona, Nevada, New Mexico, Utah “Key Drivers for Hotel and Resort Spa Profitability,” July 2017 “Market Pulse: Tucson, AZ,” co-authored with Michael Smithson, March 2017 “In Focus: Phoenix, AZ,” co-authored with Bethany Cronk, July 2016 “Five Key Takeaways: The Lodging Conference 2015,” co-authored by Brett Russell and
Adam Lair, October 2015 “Market Intelligence Report 2013: Nashville,” October 2013 “HVS Hotel Market Intelligence Report: Lansing, Michigan,” January 2013
EDUCATION AND OTHER TRAINING
STATE CERTIFICATION
PUBLISHED ARTICLES
HVS Journal
HVS Journal
HVS Journal
HVS Journal
HVS Journal
HVS Journal

HVS, Phoenix, Arizona Qualifications of Ryan Wall 3
EXAMPLES OF PROPERTIES APPRAISED OR EVALUATED ARIZONA Proposed Hilton Brand Hotel, Buckeye Proposed Marriott Hotel at Park Place,
Chandler Proposed Home2 Suites, Chandler Proposed Marriott Hotel at Park Place,
Chandler Motel 6 Casa Grande Eloy, Eloy Courtyard by Marriott, Flagstaff Embassy Suites, Flagstaff SpringHill Suites by Marriott, Flagstaff CopperWynd Resort and Club,
Fountain Hills DoubleTree by Hilton, Gilbert InTown Suites, Gilbert Proposed Holiday Inn
Express/Staybridge Suites, Gilbert Proposed Holiday Inn Express, Globe Proposed Home2 Suites, Glendale Proposed Hotel Gilbert, Gilbert Proposed Holiday Inn
Express/Staybridge Suites, Goodyear
Best Western Legacy Inn & Suites, Mesa
Courtyard by Marriott Phoenix Mesa, Mesa
Marriott Mesa, Mesa Motel 6 Mesa North, Mesa Motel 6 Mesa South, Mesa Residence Inn by Marriott, Mesa Sleep Inn, Mesa Fairfield Inn & Suites by Marriott
Tucson North Oro Valley, Oro Valley Proposed Hotel and Conference
Center, Payson Residence Inn by Marriott Phoenix
Glendale Peoria, Peoria Comfort Inn, Phoenix GreenTree Inn & Suites, Phoenix Hampton Inn Phoenix Airport North,
Phoenix
Holiday Inn & Suites Airport North, Phoenix
Holiday Inn Express & Suites, Phoenix North Scottsdale, Phoenix
Homewood Suites by Hilton Biltmore, Phoenix
Hotel San Carlos, Phoenix Marriott Phoenix Airport, Phoenix Motel 6 Phoenix East, Phoenix Motel 6 Phoenix North, Phoenix Motel 6 Phoenix Northern Avenue,
Phoenix Motel 6 Phoenix West, Phoenix Motel 6 Phoenix, Phoenix Pointe Hilton at Squaw Peak, Phoenix Proposed AC Hotel by Marriott
Downtown Phoenix, Phoenix Proposed Hampton Inn & Suites
Downtown Phoenix, Phoenix Proposed Holiday Inn Express
Downtown Phoenix, Phoenix Renaissance Phoenix Downtown,
Phoenix Residence Inn by Marriott Phoenix
Airport, Phoenix Sheraton, Phoenix Studio 6 Phoenix Deer Valley, Phoenix Aloft, Scottsdale Courtyard by Marriott Scottsdale Old
Town, Scottsdale Courtyard by Marriott Scottsdale Salt
River, Scottsdale DoubleTree by Hilton Paradise Valley
Resort, Scottsdale DoubleTree Resort, Scottsdale Fairmont Scottsdale Princess,
Scottsdale Four Seasons Scottsdale at Troon
North, Scottsdale Holiday Inn Express North Scottsdale,
Scottsdale Hotel Indigo Scottsdale Old Town,
Scottsdale Motel 6 Scottsdale, Scottsdale Proposed Fairfield Inn & Suites DC
Ranch, Scottsdale
Proposed Home2 Suites/Tru by Hilton Scottsdale Salt River, Scottsdale
Proposed Hyatt House, Scottsdale Proposed Limited-Service Hotel
Scottsdale, Scottsdale Proposed Staybridge Suites, Scottsdale Residence Inn by Marriott, Scottsdale Saguaro Scottsdale, Scottsdale Scottsdale Plaza Resort, Scottsdale Hampton Inn & Suites, Surprise Aloft, Tempe Graduate, Tempe Hampton Inn & Suites
Phoenix/Tempe-ASU Area, Tempe Motel 6 Phoenix Tempe Broadway
ASU, Tempe Motel 6 Phoenix Tempe Priest Drive
ASU, Tempe Motel 6 Tempe/Scottsdale, Tempe Proposed AC Hotel, Tempe Proposed Hilton Garden Inn/Home2
Suites by Hilton, Tempe Proposed Hotel Tempe, Tempe Proposed Kimpton, Tempe Studio 6, Tempe Aloft, Tucson Courtyard by Marriott Tucson Airport,
Tucson DoubleTree by Hilton Tucson Reid
Park, Tucson Hampton Inn Tucson North, Tucson Holiday Inn Express Tucson Mall,
Tucson JW Marriott Starr Pass Resort, Tucson Miraval Resort & Spa Arizona, Tucson Proposed Hotel Rita Tech Park Tucson,
Tucson Westward Look Wyndham Grand
Resort & Spa, Tucson Grand Canyon Railway Hotel, Williams Motel 6 Phoenix Sun City, Youngtown CALIFORNIA Hilton Garden Inn, Folsom Proposed Hotel, Lodi

HVS, Phoenix, Arizona Qualifications of Ryan Wall 4
SpringHill Suites by Marriott The Dunes On Monterey Bay, Marina
Hilton Garden Inn, Milpitas Ritz-Carlton, Rancho Mirage Hilton Garden Inn, Roseville Citizens Hotel, Sacramento COLORADO Ritz-Carlton Bachelor Gulch, Avon Hyatt House, Colorado Springs Courtyard by Marriott SW Lakewood,
Lakewood Residence Inn by Marriott SW
Lakewood, Lakewood FLORIDA Proposed Ascend Hotel, Dania Beach La Quinta Inn & Suites, Jupiter Hard Rock Hotel at Universal Studios,
Orlando Loews Portofino Bay Hotel, Orlando Loews Royal Pacific Resort at
Universal Orlando, Orlando GEORGIA Georgia Tech Hotel & Conference
Center, Atlanta Hampton Inn & Suites, Atlanta Holiday Inn Express Hotel & Suites,
Sandy Springs KANSAS Comfort Inn & Suites, Overland Park ILLINOIS Days Inn, Alsip Proposed SpringHill Suites and
Conference Center, Alton Wingate by Wyndham, Arlington
Heights Super 8, Beardstown Baymont Inn & Suites, Beardstown
Super 8, Bloomington Ramada Inn, Bolingbrook Plaza Inn, Calumet Park Microtel, Champaign Economy Inn, Chillicothe Proposed Holiday Inn Express,
Edwardsville Proposed Hotel and Conference
Center, Edwardsville Clarion Inn, Elmhurst Courtyard by Marriott, Evansville Best Western Plus, Hillside Star Inn, Joliet Super 8, Joliet Quality Inn, Kewanee Howard Johnson, Lansing Proposed Hyatt Place, Lansing Hyatt, Lisle Holiday Inn, Matteson Proposed Extended-Stay Hotel
Minooka, Minooka Best Western Plus, Oak Forest Carleton Hotel, Oak Park Super 8, Paris Four Points, Peoria Econo Lodge, Princeton Hyatt, Rosemont Quality Inn, Schiller Park Proposed Boutique Hotel, Springfield Holiday Inn Express, Vandalia Holiday Inn, Willowbrook INDIANA Super 8, Auburn Holiday Inn Express, Frankfort Big Splash Adventure Water Park &
Resort, French Lick Courtyard by Marriott, Goshen Candlewood Suites, Greenwood Best Western, Hammond Super 8, Huntington Comfort Inn, Indianapolis Super 8, Logansport Economy Inn of America, Merrillville Quality Inn, Merrillville
Cambria Suites Indianapolis Airport, Plainfield
Super 8, Plainfield Wingate by Wyndham, Plainfield IOWA Proposed Candlewood Suites,
Davenport Clarion, Iowa City Baymont Inn & Suites, Keokuk Country Hearth Inn & Suites,
Muscatine KENTUCKY La Quinta Inn, Bowling Green Knights Inn, Cadiz Sleep Inn, Henderson MINNESOTA Windom Family Inn, Windom MICHIGAN Proposed Hyatt Place, Lansing Best Western Hospitality Inn, Port
Huron Super 8, Stevensville Best Western, Woodhaven Holiday Inn Express, Woodhaven MISSOURI Travelodge, Berkeley Mountain Music Inn, Branson Proposed Hyatt Place, Chesterfield Residence Inn by Marriott, Earth City La Quinta Inn, Hazelwood Hilton Kansas City Airport, Kansas City Proposed Marriott Marquis KC, Kansas
City Quality Inn Lake Ozark, Lake Ozark Holiday Inn Express, O’Fallon Staybridge Suites, O’Fallon
HVS, Phoenix, Arizona Qualifications of Ryan Wall 5
Hampton Inn St. Louis/St. Charles, St. Charles
Crowne Plaza St. Louis Downtown, St. Louis
La Quinta Inn, St. Louis Marriott at the Airport, St. Louis MONTANA Holiday Inn, Billings NEW MEXICO Proposed Home2 Suites by Hilton, Rio
Rancho Hyatt Regency Tamaya Resort & Spa,
Santa Ana Pueblo Inn & Spa At Loretto, Santa Fe NEW YORK Econo Lodge, Williamsville Proposed Hilton Garden Inn,
Williamsville NORTH DAKOTA Proposed Dakota Suites, Dickinson Grand Inn, Fargo Proposed Baymont Inn & Suites, South
Heart OHIO Steve’s Motel, Akron Economy Inn & Suites, North Olmsted PENNSYLVANIA Econo Lodge, Denver Red Roof Inn, Denver Carnegie Inn & Spa, State College SOUTH CAROLINA Hampton Inn, Gaffney
TENNESSEE Comfort Inn & Suites, Memphis Hampton Inn, Memphis Homewood Suites, Memphis Hyatt Place, Memphis Best Western Near Opryland, Nashville Hampton Inn Rudy Circle, Nashville Holiday Inn Express McGavock Pike,
Nashville TEXAS Candlewood Suites, Texarkana UTAH Proposed La Quinta Inn, La Verkin Holiday Inn Express & Suites, Moab VIRGINIA InTown Suites
Chesapeake/Greenbrier, Chesapeake WEST VIRGINIA Hotel Morgantown, Morgantown WISCONSIN Ramada Plaza Hotel, Fond du Lac Residence Inn by Marriott, Madison Quality Inn, Minocqua Quality Inn, Rhinelander Rodeway Inn, Wisconsin Rapids

Signed in the Superintendent’s office at 2910 North 44th
Street, Suite 310,in the City of Phoenix, State of Arizona, this
Robert D. Charlton
Superintendent
This document is evidence that: has complied with the provisions of
Arizona Revised Statutes, relating to the establishment and operation of a:
and that the Superintendent of Financial Institutions of the State of Arizona has granted this license to transact the business of a
This license is subject to the laws of Arizona and will remain in full force and effect until surrendered, revoked or suspended as
provided by law.
32100
RYAN M. WALL
CGA -
Certified General Real Estate Appraiser
Certified General Real Estate Appraiser
RYAN M. WALL
August 31, 2019
8th day of August, 2017.
Expiration Date :

E
E
E
E
E
E
ZONEA
,E
ZONE AE
ZONE AE
ZONEAE
ZONE X
ZONE X
ZONE X
ZONE AE
VekolChannel
City ofMaricopa
040052
ZONE D
FLOOD HAZARD INFORMATIONIS NOT SHOWN ON THIS MAPIN AREAS INSIDE AK-CHIN INDIANCOMMUNITY
NOTE: MAP AREA SHOWN ON THIS PANEL ISLOCATED WITHIN TOWNSHIP 4 SOUTH,RANGE 3 EAST.
NOTE: THIS AREA IS SHOWN AS BEINGPROTECTED FROM THE 1-PERCENT-ANNUALCHANCE OR GREATER FLOODHAZARD BY A LEVEE SYSTEM.OVERTOPPING OR FAILURE OF ANYLEVEE SYSTEM IS POSSIBLE. FORADDITIONAL INFORMATION SEE THE"ACCREDITED LEVEE NOTE" IN NOTESTO USERS.
Vekol WashTributary Split Flow
1176
.7
1176
.7
ZONE X
ZONE X
ZONE X
1% ANNUAL CHANCEFLOOD DISCHARGE
CONTAINED IN STRUCTURE
ZONE X
ZONE X
NOTE: THIS AREA IS SHOWN AS BEINGPROTECTED FROM THE 1-PERCENT-ANNUALCHANCE OR GREATER FLOODHAZARD BY A LEVEE SYSTEM.OVERTOPPING OR FAILURE OF ANYLEVEE SYSTEM IS POSSIBLE. FORADDITIONAL INFORMATION SEE THE"ACCREDITED LEVEE NOTE" IN NOTESTO USERS.
M.L.K. JR.BOULEVARD
1175.5
1175.5
1175
.5
1176
.7
1181.3
1181.7
REVISEDAREA
1176.7
1177.0
1177.7
1178.0
1178.0
1181.0
1179.0
1177.0
1182.0
1177.0
1177.7
1176.7
1178
1176
.8
1176
.7
1178.0
1176.0
1176.8
1177.8
1178.0
1182.1
1175.0
1175.2
1180.0
1172
1170
1174
1172
1182.1
1177.91177.9
,J, I
,K ,H
,G
,F
,J
,I
,L
1178.5
1176.7
1174.9
1182.1
1180.9
1179.3
1176.2
1177.41% ANNUAL CHANCEFLOOD DISCHARGE
CONTAINED IN CHANNEL
Vekol Channel
Vekol Wash Tributary
Vekol Wash Tributary
33
34
27
28
ZONE AE
ZONE A
ZONE D
ZONE AEZONE AE
ZONE X
ZONE AO(DEPTH 1)
ZONE AO(DEPTH 2)
Ak-Chin IndianCommunity
Pinal CountyUnincorporated
Areas040077
City ofMaricopa
040052
COWPATH DR
ELIZABETH AVE
AUST
IN CT
HORSEMESA RD
W ROSS ST
RICC
ARDO
WAY
MESCALST
ANCO
N AVE
WOODYRD
GATU
NAV
E
ROOS
EVEL
T AVE
DUNC
ANDR
LARKSPUR DR
MARI
NAAV
E
W YUCCA LN
COZU
MEL
PRIMROSEDR
WOODYRD
CHER
RYLN
LARK
SPUR
DR
SANDHILLRD
LAUR
ELAV
EMESCAL ST
YUCCA LNDU
NCAN
DR
MEGHAN
DR
W BUCKHORNTRL
APPLEGATERD
DESERTCEDARS LN
HORSEMESA RD
ZION RD
JOHNWAYNEPKWY
APPLEGATE RD
SANDHILL RD
DESERTGARDEN RD
WOODY RD
COSTA
BRAVA AVE
SAGE BRUSH DR
VERA
CRU
Z AVE
ANCO
N AVE
W WINDROSE DR
W ED GREEN LN
BURKETTAVE
VERA
CRU
Z AVE
W TAPPS RD
DESERT GARDEN RD
CHER
RY LN
DESERTCEDARS LN
RHEA RD
NORRIS RD
WOODY RD
JUNIPER AVE
COSTA BRAVA AVE
ARIZONAAVE
WINDROSE DR
HORSE MESA RD
SANDHILL RD
W EDWARDS CIR
WYU
CCA
LN
GATU
N AVE
SOFTWIND
DR
4TH
STPL
AINV
IEW ST
W WINDROSEDR
NORRIS RD
RHEA RD
MARICOPA AVE
MAGNOLIA RD
WBUCKHORNTRL
W JUNIPERAVE
W JACK RABBIT TRL
MESCAL ST
SAGE BRUSH DR
W EDWARDS AVE
ZION RD
JUNIPER AVE
YUCCA LN
W HONEYCUTT AVE
CYPRESSLN
WBOWLIN RD
W BOWLIN RD
W PALO NUEZ ST
W BOWLIN RD
JOHN WAYNE PKWY
STAT
E RTE
347
(347
ALTE
RRA P
KWYSPECIAL FLOOD
HAZARD AREAS
OTHER AREAS OFFLOOD HAZARD
Without Base Flood Elevation (BFE)With BFE or DepthRegulatory Floodway
Zone A,V, A99Zone AE, AO, AH, VE, AR
0.2% Annual Chance Flood Hazard, Areas of 1% annual chance flood with average depth less than one foot or with drainage areas of less than one square mileFuture Conditions 1% Annual Chance Flood HazardArea with Reduced Flood Risk due to LeveeSee Notes.
Zone X
Zone X
Zone X
SCALE
0 500 1,000250Feet
1 inch = 500 feet 1:6,000
Map Projection:NAD 1983 UTM Zone 12N;Western Hemisphere; Vertical Datum: NAVD 88
0 150 30075Meters
NATIONAL FLOOD INSURANCE PROGRAMFLOOD INSURANCE RATE MAPPINAL COUNTY, ARIZONAand Incorporated Areas
PANEL 741 OF 2575Panel Contains:
MAP NUMBER
EFFECTIVE DATEJUNE 16, 2014
04021C0741F
VERSION NUMBER1.1.1.0
MARICOPA, CITY OF 040052 0741 FPINAL COUNTY 040077 0741 F
COMMUNITY NUMBER PANEL SUFFIX
DABD6542
LOMR Effective
DABD6542
Text Box
July 7, 2017
Related Documents