Feasibility Report of Proposed Amtrak Service Kansas City, Missouri – Oklahoma City, Oklahoma to Fort Worth, Texas Prepared By: M.W. Franke Assistant Vice President - State and Commuter Partnership (Central) B.E. Hillblom Senior Director – State Partnerships R.P. Hoffman Principal Officer – Corridor Planning Amtrak Chicago, Illinois March 9, 2010

Welcome message from author
This document is posted to help you gain knowledge. Please leave a comment to let me know what you think about it! Share it to your friends and learn new things together.
Transcript
Feasibility Report of Proposed Amtrak Service
Kansas City, Missouri – Oklahoma City, Oklahoma to Fort Worth, Texas
Prepared By: M.W. Franke
Assistant Vice President - State and Commuter Partnership (Central)
B.E. Hillblom Senior Director – State Partnerships
R.P. Hoffman Principal Officer – Corridor Planning
Amtrak Chicago, Illinois March 9, 2010
Feasibility Report of Proposed Amtrak Service
Kansas City, Missouri – Oklahoma City, Oklahoma – Fort Worth, Texas
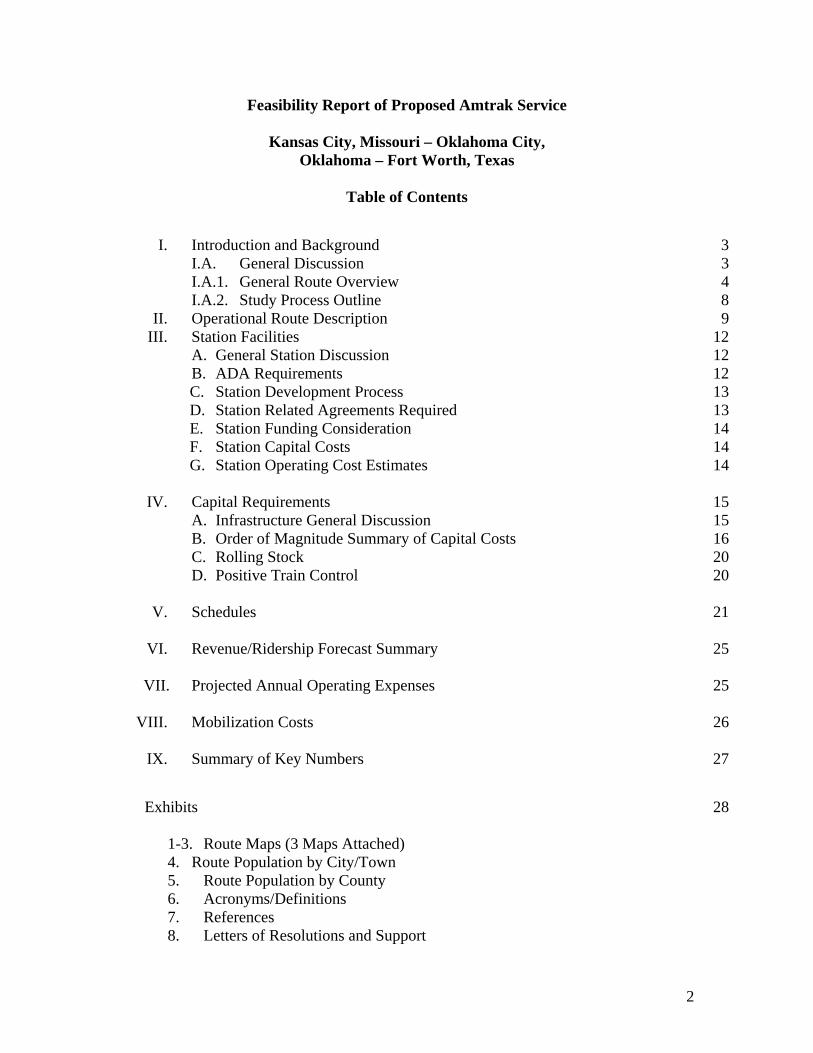
Table of Contents
I. Introduction and Background 3 I.A. General Discussion 3 I.A.1. General Route Overview 4 I.A.2. Study Process Outline 8 II. Operational Route Description 9 III. Station Facilities 12 A. General Station Discussion 12 B. ADA Requirements 12
C. Station Development Process 13 D. Station Related Agreements Required 13 E. Station Funding Consideration 14 F. Station Capital Costs 14 G. Station Operating Cost Estimates 14
IV. Capital Requirements 15 A. Infrastructure General Discussion 15 B. Order of Magnitude Summary of Capital Costs 16 C. Rolling Stock 20 D. Positive Train Control 20
V. Schedules 21
VI. Revenue/Ridership Forecast Summary 25
VII. Projected Annual Operating Expenses 25
VIII. Mobilization Costs 26
IX. Summary of Key Numbers 27
Exhibits 28 1-3. Route Maps (3 Maps Attached)
4. Route Population by City/Town 5. Route Population by County 6. Acronyms/Definitions 7. References 8. Letters of Resolutions and Support
2
Feasibility Report of Proposed Amtrak Service
Kansas City, MO – Oklahoma City, OK – Fort Worth, TX
I. Introduction and Background I.A. General Discussion
The Kansas Department of Transportation (KDOT) formally requested Amtrak to conduct a feasibility study to “establish what would be needed to provide state-sponsored intercity rail passenger service between Kansas City, MO, Oklahoma City, OK and Fort Worth, TX”. KDOT stated that “the primary purpose of expanded rail passenger service would be to carry travelers along a potentially 606 mile rail corridor in Kansas, Oklahoma and Texas that connects to the National Passenger Rail System”. At the direction of KDOT, Amtrak examined four route and schedule alternatives as follows:
1. Newton, Kansas – Ft. Worth, Texas
This alternative extends the existing Heartland Flyer service daily from Oklahoma City to Newton where it would terminate and connect with the eastbound and westbound Southwest Chief. The Southwest Chief is a daily Amtrak long-distance train operating between Chicago and Los Angeles. The existing Heartland Flyer schedule would be unchanged at stations currently served.
2. Kansas City, Missouri – Ft. Worth, Texas
This alternative extends the existing Heartland Flyer from Oklahoma City to Kansas City, thereby providing a new daily overnight service between Ft. Worth and Kansas City in both directions via Newton. The existing Heartland Flyer schedule would be unchanged at stations currently served.
3. Kansas City, Missouri – Ft. Worth, Texas This alternative would be a new daily daytime service in both directions between Kansas City and Ft. Worth. It would be a stand-alone service not connecting with either the Southwest Chief or the Heartland Flyer. In this alternative, the existing Heartland Flyer continues to operate on its current schedule and the new train would provide a second daily frequency between Oklahoma City and Ft. Worth daily.
4. Kansas City, Missouri – Oklahoma City, Oklahoma
This alternative would be a new daily daytime service in both directions between Kansas City and Oklahoma City. It would be a stand-alone service that does not connect with either the Southwest Chief or the Heartland Flyer. In this alternative, the existing Heartland Flyer continues to operate on its current schedule at stations now served.
3
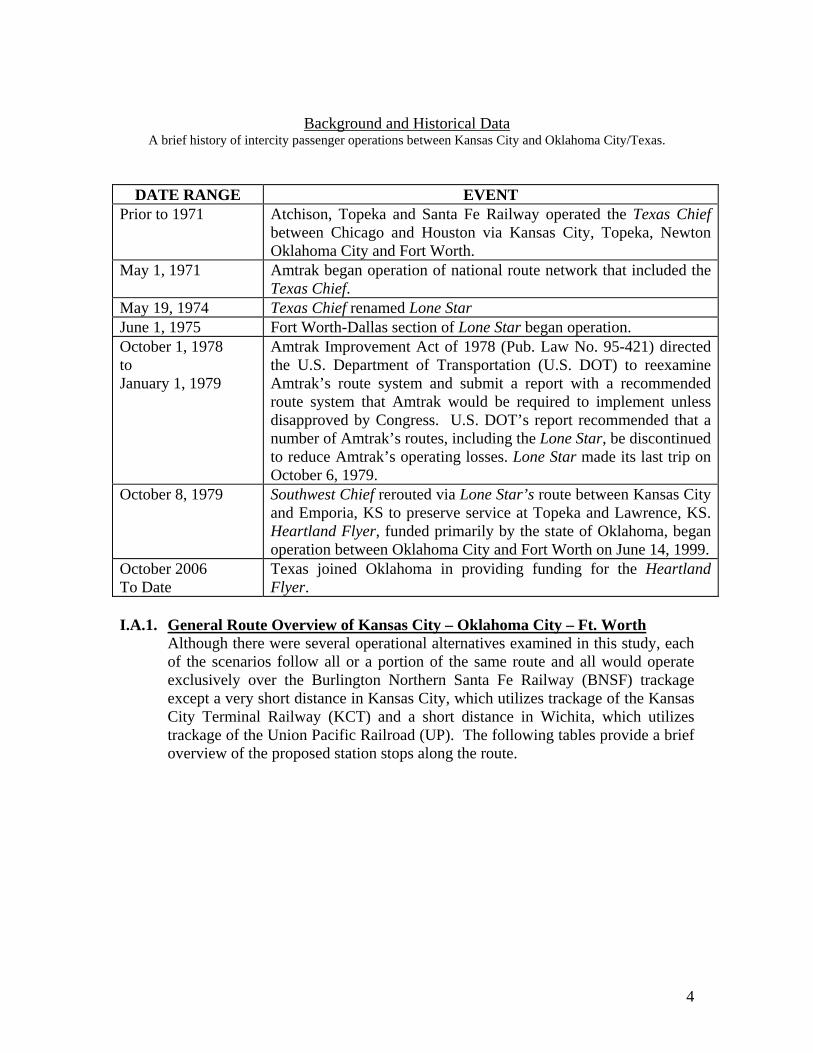
Background and Historical Data
A brief history of intercity passenger operations between Kansas City and Oklahoma City/Texas.
DATE RANGE EVENT Prior to 1971 Atchison, Topeka and Santa Fe Railway operated the Texas Chief
between Chicago and Houston via Kansas City, Topeka, Newton Oklahoma City and Fort Worth.
May 1, 1971 Amtrak began operation of national route network that included the Texas Chief.
May 19, 1974 Texas Chief renamed Lone Star June 1, 1975 Fort Worth-Dallas section of Lone Star began operation. October 1, 1978 to January 1, 1979
Amtrak Improvement Act of 1978 (Pub. Law No. 95-421) directed the U.S. Department of Transportation (U.S. DOT) to reexamine Amtrak’s route system and submit a report with a recommended route system that Amtrak would be required to implement unless disapproved by Congress. U.S. DOT’s report recommended that a number of Amtrak’s routes, including the Lone Star, be discontinued to reduce Amtrak’s operating losses. Lone Star made its last trip on October 6, 1979.
October 8, 1979 Southwest Chief rerouted via Lone Star’s route between Kansas City and Emporia, KS to preserve service at Topeka and Lawrence, KS. Heartland Flyer, funded primarily by the state of Oklahoma, began operation between Oklahoma City and Fort Worth on June 14, 1999.
October 2006 To Date
Texas joined Oklahoma in providing funding for the Heartland Flyer.
I.A.1. General Route Overview of Kansas City – Oklahoma City – Ft. Worth
Although there were several operational alternatives examined in this study, each of the scenarios follow all or a portion of the same route and all would operate exclusively over the Burlington Northern Santa Fe Railway (BNSF) trackage except a very short distance in Kansas City, which utilizes trackage of the Kansas City Terminal Railway (KCT) and a short distance in Wichita, which utilizes trackage of the Union Pacific Railroad (UP). The following tables provide a brief overview of the proposed station stops along the route.
4
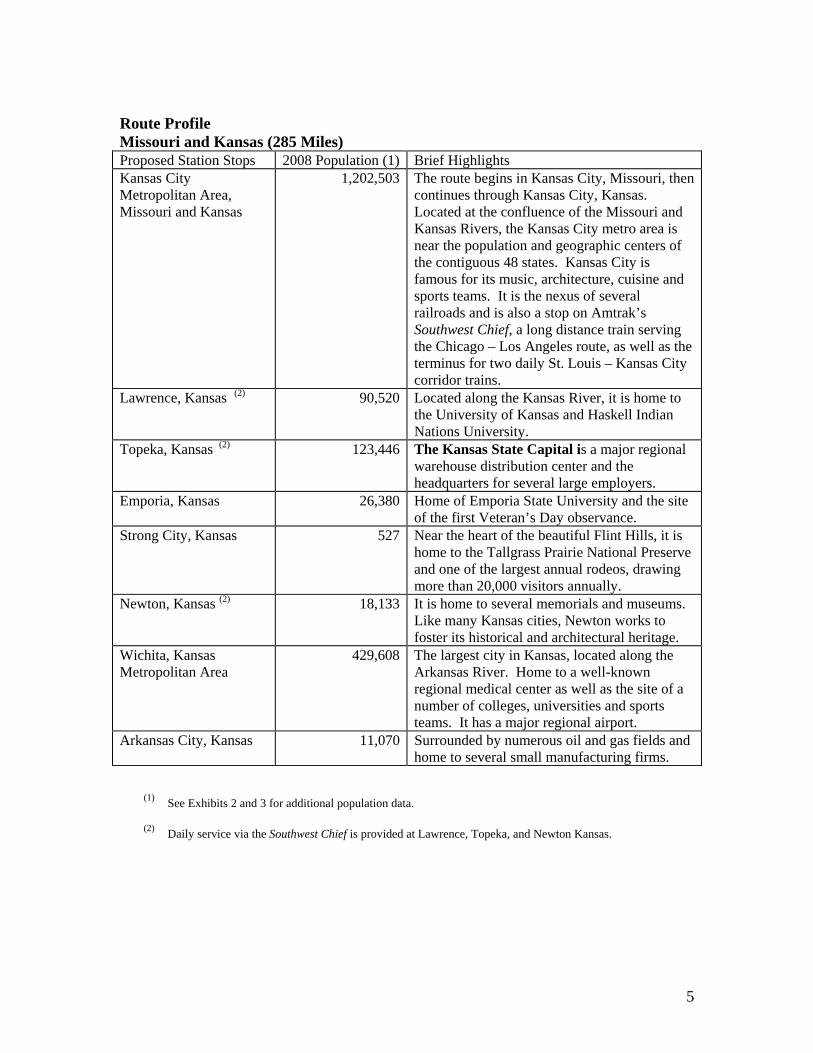
Route Profile Missouri and Kansas (285 Miles) Proposed Station Stops 2008 Population (1) Brief Highlights Kansas City Metropolitan Area, Missouri and Kansas
1,202,503 The route begins in Kansas City, Missouri, then continues through Kansas City, Kansas. Located at the confluence of the Missouri and Kansas Rivers, the Kansas City metro area is near the population and geographic centers of the contiguous 48 states. Kansas City is famous for its music, architecture, cuisine and sports teams. It is the nexus of several railroads and is also a stop on Amtrak’s Southwest Chief, a long distance train serving the Chicago – Los Angeles route, as well as the terminus for two daily St. Louis – Kansas City corridor trains.
Lawrence, Kansas (2) 90,520 Located along the Kansas River, it is home to the University of Kansas and Haskell Indian Nations University.
Topeka, Kansas (2) 123,446 The Kansas State Capital is a major regional warehouse distribution center and the headquarters for several large employers.
Emporia, Kansas 26,380 Home of Emporia State University and the site of the first Veteran’s Day observance.
Strong City, Kansas 527 Near the heart of the beautiful Flint Hills, it is home to the Tallgrass Prairie National Preserve and one of the largest annual rodeos, drawing more than 20,000 visitors annually.
Newton, Kansas (2) 18,133 It is home to several memorials and museums. Like many Kansas cities, Newton works to foster its historical and architectural heritage.
Wichita, Kansas Metropolitan Area
429,608 The largest city in Kansas, located along the Arkansas River. Home to a well-known regional medical center as well as the site of a number of colleges, universities and sports teams. It has a major regional airport.
Arkansas City, Kansas 11,070 Surrounded by numerous oil and gas fields and home to several small manufacturing firms.
(1) See Exhibits 2 and 3 for additional population data.
(2) Daily service via the Southwest Chief is provided at Lawrence, Topeka, and Newton Kansas.
5
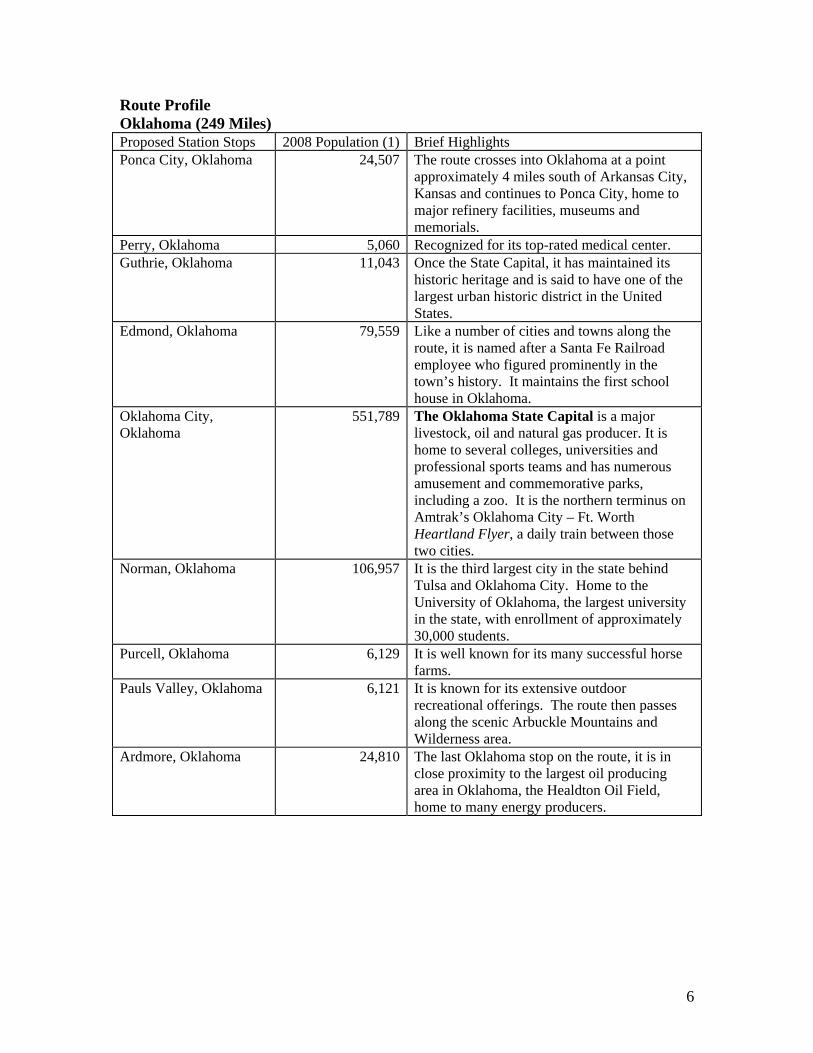
Route Profile Oklahoma (249 Miles) Proposed Station Stops 2008 Population (1) Brief Highlights Ponca City, Oklahoma 24,507 The route crosses into Oklahoma at a point
approximately 4 miles south of Arkansas City, Kansas and continues to Ponca City, home to major refinery facilities, museums and memorials.
Perry, Oklahoma 5,060 Recognized for its top-rated medical center. Guthrie, Oklahoma 11,043 Once the State Capital, it has maintained its
historic heritage and is said to have one of the largest urban historic district in the United States.
Edmond, Oklahoma 79,559 Like a number of cities and towns along the route, it is named after a Santa Fe Railroad employee who figured prominently in the town’s history. It maintains the first school house in Oklahoma.
Oklahoma City, Oklahoma
551,789 The Oklahoma State Capital is a major livestock, oil and natural gas producer. It is home to several colleges, universities and professional sports teams and has numerous amusement and commemorative parks, including a zoo. It is the northern terminus on Amtrak’s Oklahoma City – Ft. Worth Heartland Flyer, a daily train between those two cities.
Norman, Oklahoma 106,957 It is the third largest city in the state behind Tulsa and Oklahoma City. Home to the University of Oklahoma, the largest university in the state, with enrollment of approximately 30,000 students.
Purcell, Oklahoma 6,129 It is well known for its many successful horse farms.
Pauls Valley, Oklahoma 6,121 It is known for its extensive outdoor recreational offerings. The route then passes along the scenic Arbuckle Mountains and Wilderness area.
Ardmore, Oklahoma 24,810 The last Oklahoma stop on the route, it is in close proximity to the largest oil producing area in Oklahoma, the Healdton Oil Field, home to many energy producers.
6
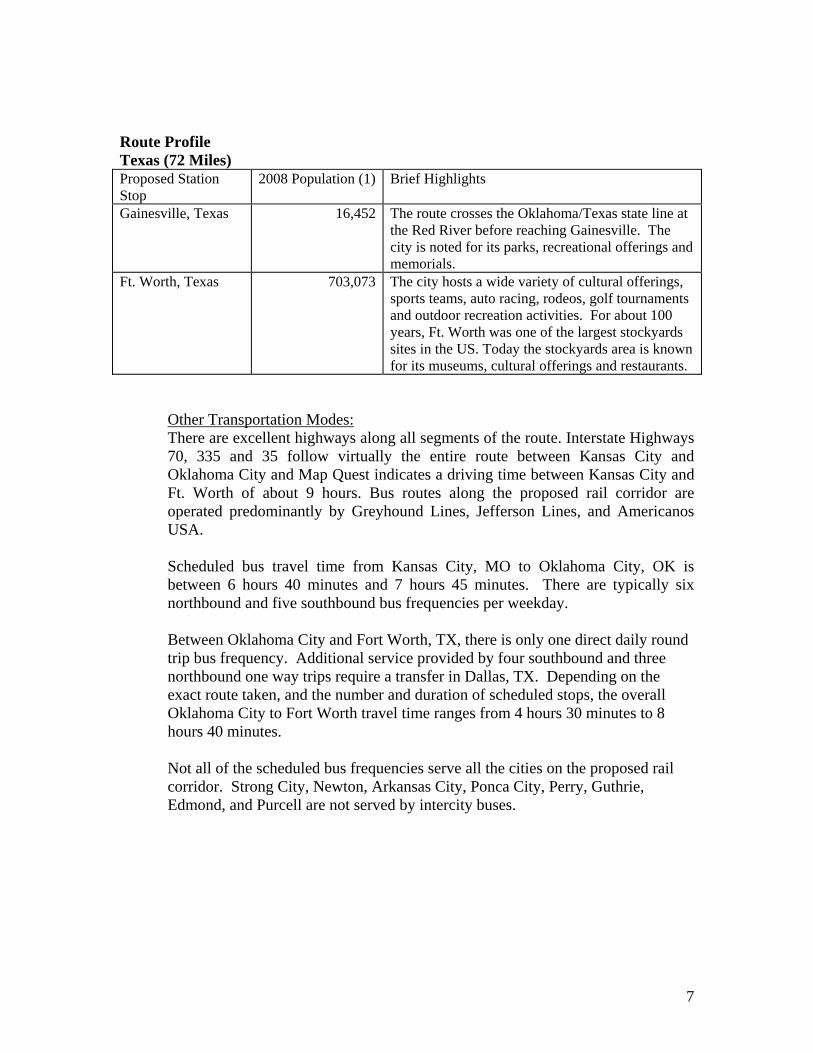
Route Profile Texas (72 Miles) Proposed Station Stop
2008 Population (1) Brief Highlights
Gainesville, Texas 16,452 The route crosses the Oklahoma/Texas state line at the Red River before reaching Gainesville. The city is noted for its parks, recreational offerings and memorials.
Ft. Worth, Texas 703,073 The city hosts a wide variety of cultural offerings, sports teams, auto racing, rodeos, golf tournaments and outdoor recreation activities. For about 100 years, Ft. Worth was one of the largest stockyards sites in the US. Today the stockyards area is known for its museums, cultural offerings and restaurants.
Other Transportation Modes: There are excellent highways along all segments of the route. Interstate Highways 70, 335 and 35 follow virtually the entire route between Kansas City and Oklahoma City and Map Quest indicates a driving time between Kansas City and Ft. Worth of about 9 hours. Bus routes along the proposed rail corridor are operated predominantly by Greyhound Lines, Jefferson Lines, and Americanos USA. Scheduled bus travel time from Kansas City, MO to Oklahoma City, OK is between 6 hours 40 minutes and 7 hours 45 minutes. There are typically six northbound and five southbound bus frequencies per weekday.
Between Oklahoma City and Fort Worth, TX, there is only one direct daily round trip bus frequency. Additional service provided by four southbound and three northbound one way trips require a transfer in Dallas, TX. Depending on the exact route taken, and the number and duration of scheduled stops, the overall Oklahoma City to Fort Worth travel time ranges from 4 hours 30 minutes to 8 hours 40 minutes.
Not all of the scheduled bus frequencies serve all the cities on the proposed rail corridor. Strong City, Newton, Arkansas City, Ponca City, Perry, Guthrie, Edmond, and Purcell are not served by intercity buses.
7
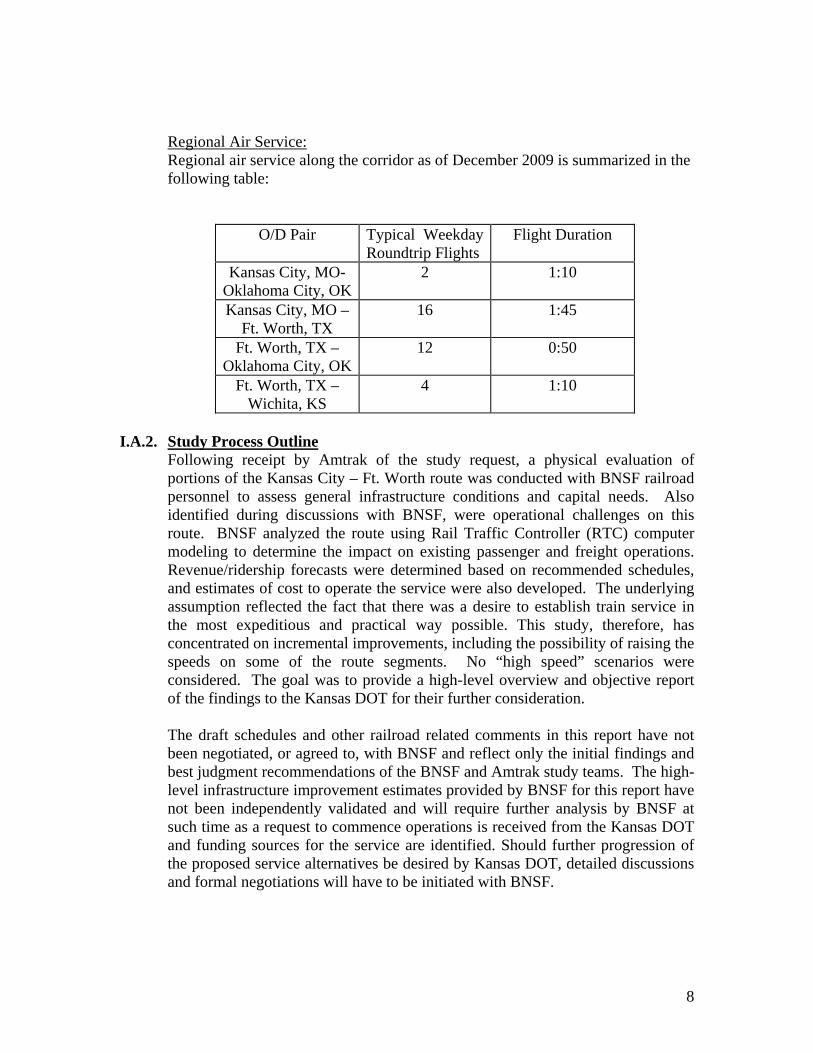
Regional Air Service: Regional air service along the corridor as of December 2009 is summarized in the following table:
O/D Pair Typical Weekday Roundtrip Flights
Flight Duration
Kansas City, MO- Oklahoma City, OK
2 1:10
Kansas City, MO – Ft. Worth, TX
16 1:45
Ft. Worth, TX – Oklahoma City, OK
12 0:50
Ft. Worth, TX –Wichita, KS
4 1:10
I.A.2. Study Process Outline
Following receipt by Amtrak of the study request, a physical evaluation of portions of the Kansas City – Ft. Worth route was conducted with BNSF railroad personnel to assess general infrastructure conditions and capital needs. Also identified during discussions with BNSF, were operational challenges on this route. BNSF analyzed the route using Rail Traffic Controller (RTC) computer modeling to determine the impact on existing passenger and freight operations. Revenue/ridership forecasts were determined based on recommended schedules, and estimates of cost to operate the service were also developed. The underlying assumption reflected the fact that there was a desire to establish train service in the most expeditious and practical way possible. This study, therefore, has concentrated on incremental improvements, including the possibility of raising the speeds on some of the route segments. No “high speed” scenarios were considered. The goal was to provide a high-level overview and objective report of the findings to the Kansas DOT for their further consideration.
The draft schedules and other railroad related comments in this report have not been negotiated, or agreed to, with BNSF and reflect only the initial findings and best judgment recommendations of the BNSF and Amtrak study teams. The high- level infrastructure improvement estimates provided by BNSF for this report have not been independently validated and will require further analysis by BNSF at such time as a request to commence operations is received from the Kansas DOT and funding sources for the service are identified. Should further progression of the proposed service alternatives be desired by Kansas DOT, detailed discussions and formal negotiations will have to be initiated with BNSF.
8
It is recommended that another inspection of the route be conducted to update the capital needs at the time this passenger train proposal is funded by the Kansas DOT. Such an update would help ascertain whether any operational or freight traffic volume changes would warrant a revision of the foregoing scope of infrastructure work, or in the event ongoing maintenance work or track degradation has changed the capital requirements.
II. Operational Route Description Kansas City – Oklahoma City – Ft. Worth:
After a 2 mile segment on the KCT at Kansas City, the balance of the route (604 miles) from Kansas City to Ft. Worth operates over 6 subdivisions of the BNSF, including a 1.5 mile segment in Wichita over the Union Pacific Railroad. A route map is included in this report (see Exhibit 1). Emporia Sub-Division, Kansas City to Holliday (13.5 miles) The segment from Kansas City to Holliday is double, triple and quadruple main track controlled by Centralized Traffic Control (CTC). The largest yard on the segment is at Argentine, 4.6 miles south of Kansas City. An average of 2200 cars per day are handled through this 24/7 facility, which also has complete car and locomotive servicing facilities. An average of 67 trains per day operate between Kansas City and Holliday, over half being intermodal, some of which are high priority, and the balance manifest, local and unit trains. Maximum authorized passenger train speed on the segment is 79 mph and the top freight speed is 55 mph. The major challenge on this segment is traversing the Argentine freight yard area, one of the highest volume switching yards on the BNSF System. Also, several freight trains receive fueling, inspection services, as well as change crews at Argentine.
Topeka Sub-Division, Holliday to Emporia (113 miles) The segment from Holliday to Emporia is single track, controlled by Track Warrant Control (TWC) with Automatic Block Signals (ABS) and Automatic Train Stop (ATS) between De Soto through Lawrence, Topeka, and Pauline to Emporia, where CTC again begins. Topeka and Emporia are the largest yards on the segment. Between Holliday and Emporia, 6-7 trains operate daily. Maximum authorized passenger train speed on the route is 79 mph and the top freight train speed is 55 mph. The major challenges on this segment are the short siding lengths and the long distances between sidings.
9
Emporia Sub-Division, Emporia to Ellinor (13.4 miles) The Emporia to Ellinor segment reconnects with the Emporia Sub-Division at Emporia “N.R. Jct”. Eight of the thirteen miles of the segment are triple track CTC. This segment picks up the BNSF main route carrying an average of 60 trains per day, including several priority intermodal trains. Top speed continues to be 79 mph for passenger trains and 55 mph for freight trains. The challenge on this subdivision is the merging of train flows from the Newton route and the Augusta route at Ellinor. La Junta Sub-Division, Ellinor to Newton (60.4 miles) This segment is single track except through Newton, where it is double and triple track and it is entirely controlled by CTC. There are 5 sidings on the segment. Newton has a rail yard which handles nearly 250 cars per day. The segment averages 21 trains per day, mostly intermodal and manifest trains. Train operations on this segment are primarily in the direction toward Kansas City. Trains heading in the opposite direction operate primarily on the Emporia subdivision. Top speed on the segment is 79 mph passenger and 55 mph for freight trains. The major challenge on the La Junta subdivision is dispatching those trains (such as the westbound Southwest Chief) that operate against the current of traffic moving toward Kansas City. Arkansas City Sub-Division, Newton to Arkansas City (78.1 miles) Over half of this Sub-Division is single track and the majority of the total segment is controlled by CTC. An average of 20 trains, including a mix of intermodal unit trains, manifest and locals operate between Newton and Mulvane. Amtrak’s Southwest Chief and west Kansas trains move off the route at Newton. A mix of 10 trains per day operate between the area of Mulvane, and nearly double this number of trains operate between Winfield and Arkansas City, consisting of a mix of intermodal, unit, manifest and local trains. This segment is primarily eastbound from a freight standpoint (with most westbound freight trains staying on the Emporia Sub). There are 11 sidings of varying lengths on the segment. Maximum authorized speed on the line is 55 mph for both passenger and freight trains. The major challenges on the segment include dispatching those trains (such as the westbound Southwest Chief) that go against the current of traffic on this segment. Another challenge is integrating Union Pacific trains on the route through the Wichita area. This challenge arises on the 1.5 mile segment of track owned by Union Pacific over which the BNSF operates through Wichita. Union Pacific train movements operating to/from Wellington, Kansas, are integrated by cooperative dispatching control.
10
Red Rock Sub-Division, Arkansas City, Kansas to Gainesville, TX (260.2 miles) The entire Sub-Division is single track CTC, except for a 7 mile double track segment through and just beyond Oklahoma City. The major rail yard on the sub-division is at Ponca City serving a large refinery. There are 31 sidings (not counting sidings and station tracks at Oklahoma City) of various lengths between Arkansas City and Gainesville. Oklahoma City is the north terminus of Amtrak’s Ft. Worth – Oklahoma City Heartland Flyer. The Heartland Flyer follows this route from Oklahoma City to Ft. Worth. This segment handles a mix of high speed intermodal, medium speed manifest, and slower speed unit train traffic. Top speed on the sub-division is 79 mph passenger and 55 mph freight. The major challenge on this segment is dispatching trains that have a wide range of service priorities and speeds. Ft. Worth Sub-Division, Gainesville to Ft. Worth (65 miles) The final segment of the route is single track from Gainesville to Lambert, then double track to South Haslet, then single track the balance of the route to Ft. Worth. The entire Gainesville – Ft. Worth segment is controlled by CTC. There are 9 sidings of various lengths on the segment. Major yards are in the Ft. Worth/Saginaw area and at Alliance just north of Ft. Worth. From Gainesville to Ft. Worth, the freight train density is between 23-38 trains per day. The greatest number of trains operate between Alliance and Saginaw/Ft. Worth. In addition to the Heartland Flyer, there is a mix of intermodal, unit, and manifest trains on the subdivision. Maximum speed is 55 mph for both passenger and freight trains. This is a medium density single track CTC segment with several sidings between Gainesville and Alliance. The segment becomes a high density route from Alliance through Saginaw to Ft. Worth. There are 7 miles of double track through the Alliance area, and 3 more miles of double track in the north Ft. Worth area. At Saginaw, large numbers of trains enter / exit the route operating to / from Amarillo. The Union Pacific (UP), Fort Worth and Western (FWWR), and Trinity Railway Express (TRE) railroads all come together with BNSF in the Ft. Worth area. Each of these railroads have there own unique operating rights to access one another. There is a significant amount of freight interchange traffic with BNSF/UP in the Ft. Worth terminal area. The major challenge is managing all of the train flows converging in the Ft. Worth area from different routes, and having to meter trains through the Tower 55 interlocking, which is controlled by UP. This is a major railroad junction.
11
III. Station Facilities A. General Discussion
For purposes of this feasibility study, it is assumed that all new station facilities will be provided by parties other than Amtrak, including platforms, parking lots, and waiting areas. The assumption is that local communities desiring a station stop will provide such facilities, as well as ongoing maintenance, snow and ice removal, utilities, and janitorial services. This study assumes no addition of station personnel, nor does it include the capital cost of so-called “Quik-Trak” self-service ticketing machines at the stations, as no decisions have been made by Kansas DOT regarding station staffing. Suggested station stops shown in the sample schedules can be modified depending upon the willingness and abilities of the communities to provide facilities and as directed by the State. Whether Amtrak uses the existing station structures or new ones, it must be ensured that they are in a state of good repair and are compliant with the Americans with Disabilities Act of 1990 (ADA) before service commences. Amtrak has developed an extensive process for assessing and providing guidelines for completing work necessary to develop or restore stations. This process allows Amtrak to ensure that the stations it serves are equipped to meet ADA accessibility requirements and provide the level of service appropriate for their size and locations.
B. ADA Requirements – Overview of the ADA Law and Standards
a. Americans with Disabilities Act of 1990 (ADA)
Amtrak strives to ensure that the rail stations it serves are in a state of good repair and are readily accessible to, and usable by, passengers with disabilities as required by Section 242(e)(2) of the Americans with Disabilities Act of 1990 (42 U.S.C. 12162(e)(2)) (the “ADA”). In February of 2009, Amtrak submitted to Congress “A Report on Accessibility and Compliance with the Americans with Disabilities Act of 1990,” (the “Stations ADA Report”) that details Amtrak’s plan for making the 481 stations Amtrak currently serves compliant. However, the Stations ADA Report does not include restoration assessments and development plans for any of the potentially reinstated stations or any alternative stations that might be added in their place.
b. Construction and Alteration of Rail Stations
The ADA precludes Amtrak from “[building] a station for use in intercity rail transportation that is not readily accessible to and usable by persons
12
with disabilities, including individuals who use wheelchairs.” (42 U.S.C. 12162(e)(1)). Whether Amtrak uses the existing station structures or new stations built by others, stations not currently served by Amtrak will likely be deemed “new stations” for purposes of the ADA. As such, Amtrak cannot serve them unless and until they are made fully ADA compliant. Accessibility can be achieved through the use of wheelchair lifts where applicable. Nevertheless, some city and county governments may have a strong interest in funding the establishment of Amtrak service in their communities. However, to the best of the study team’s knowledge, no local government along the route has, as of the date of this report, committed to financing such an endeavor.
C. Station Development Process
Amtrak’s Stations Development Plan is founded on a set of station surveys completed for each of the 481 stations currently served by Amtrak that are required to be made ADA compliant and are contained in the Stations ADA Report.
Station designs are initiated through the development of a conceptual design process. The conceptual design describes the scope of the project, time frames for implementation, responsibilities for improvements and management process steps for completing the detailed design and construction process.
The scope, schedule, and budget, along with funding assumptions and management responsibilities and actions, would be developed as part of this stage, along with covering agreements among and between the parties associated with implementation.
This conceptual design phase is followed by the final design and construction phase of the project. The nature and duration of this phase depends upon the size of the station involved and the extent of the work necessary to refurbish it. These projects typically follow a design-build approach, in which a single contractor would handle both the detailed design and the construction. Based on Amtrak’s experience, the duration for station projects from start to finish can be significant and often exceeds 12-24 months.
D. Station Related Agreements Required
As part of the conceptual design process associated with potential station restoration, various agreements would need to be forged between Amtrak and the owners of the station sites. As the station sites not currently served by Amtrak on this route are now used for a variety of private purposes and for freight railroad operations, these negotiations will require time and resources to forge necessary agreements.
13
Responsibility for adding and maintaining electronic ticketing and passenger information displays systems (where appropriate), and other elements of the delivery system for service require detailed inventory and responsibility assignment. Amtrak would expect to enter into agreements with the station owner, which would specify that parties other than Amtrak would provide for all ongoing maintenance associated with the station facility. This agreement would also delineate the responsibility for the day-to-day station operating expenses.
E. Station Funding Consideration
An important consideration in establishing the proposed station stops is the source of funding for these efforts. Given the significant amount of ADA-related work associated with these projects, it is impractical to distinguish ADA-related costs from general refurbishment and state of good repair expenditures. For example, missing platforms must be replaced, both to comply with ADA and for customer service considerations.
F. Station Capital Costs
It may be that some of the stations along the route are not suitable for use in any future passenger train service. Even if some of the current sites can be used, stations would require the construction of a new platform in order to meet current requirements. The parking lots at the potential station locations must be re-striped, or replaced altogether. Although Amtrak’s Station guidelines do not designate parking as a mandatory feature for small stations (the category in which some of the stations may fall), parking facilities should be added. As public transportation options in these communities are limited, passengers using these facilities will most likely use personal automobiles as their primary mode of transportation to and from these stations.
Based upon the recent surveys, establishment of service at some of the stations, where feasible, could be costly. Determination of capital investments for station restoration and for achieving ADA compliance will depend upon final station design as agreed upon by Kansas DOT and current station owner/operators as well as with input from local government and Amtrak. No estimates of total station capital investments have been developed at this time.
G. Station Operating Cost Estimates
Once the necessary capital improvements to the potential station stops have been made, an annual operating expenditure will need to be determined for maintaining them in a state of good repair and to ensure that they remain ADA compliant. As mentioned earlier, it has not been established whether any of the stations will be
14
staffed. Station operating costs will derive from utilities, snow removal, facility upkeep, communications and ticket machine servicing.
IV. Capital Requirements IV.A. Infrastructure – General Discussion Each of the route and schedule alternatives studied for this report were modeled
by BNSF using Rail Traffic Controller (RTC), a computer tool designed to give the user the ability to simulate and analyze rail traffic flows. Using the RTC model, BNSF loaded their existing train operations data as well as their track, signaling and other infrastructure data into the program database, then iteratively added each of the four study alternative train schedules to determine the impact on BNSF operations. With the resultant program output, BNSF then modeled infrastructure improvements geared to achieve an RTC program result of 100% on time performance (OTP) for each Amtrak alternative train schedule, while at the same time holding to the guideline of no significant adverse impact on BNSF operations. Based on the BNSF RTC modeling analysis, the following “Order of Magnitude” track and signaling infrastructure improvements were determined by BNSF to be necessary in order to meet the 100% Amtrak OTP of each of the four alternatives and to minimize negative impacts on BNSF’s current operation. This analysis and the conclusions reached have not been independently validated. Highway Grade Crossings An estimate of $8 million to upgrade grade crossing warning device approach circuits to permit higher speeds between Newton and Oklahoma City has been included in the “Order of Magnitude” capital cost tables. It is recommended that discussions with the State of Kansas be initiated about any additional grade crossing warning device (gates and/or flashing lights) or closures that may be deemed appropriate for the route, based on a diagnostic analysis recommended to be conducted by the Kansas DOT in cooperation with BNSF.
15
IV.B. “Order of Magnitude” Infrastructure Improvements
Alternative 1
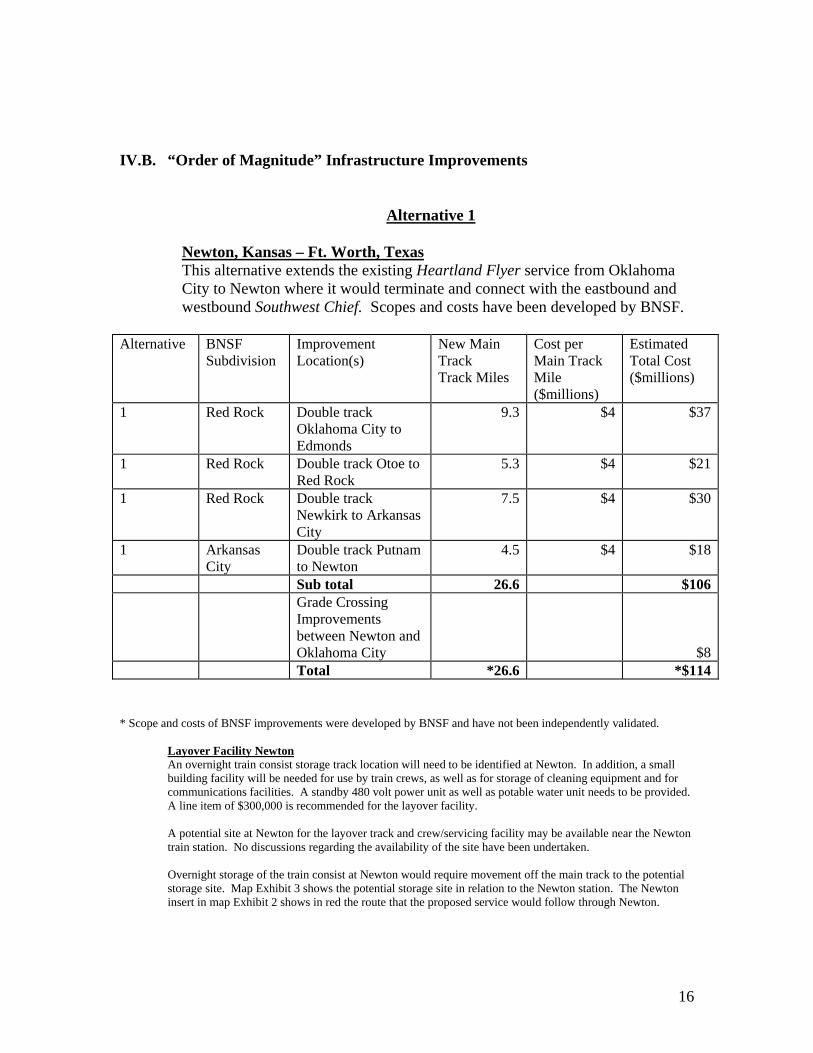
Newton, Kansas – Ft. Worth, Texas This alternative extends the existing Heartland Flyer service from Oklahoma City to Newton where it would terminate and connect with the eastbound and westbound Southwest Chief. Scopes and costs have been developed by BNSF.
Alternative BNSF Subdivision
Improvement Location(s)
New Main Track Track Miles
Cost per Main Track Mile ($millions)
Estimated Total Cost ($millions)
1 Red Rock Double track Oklahoma City to Edmonds
9.3 $4 $37
1 Red Rock Double track Otoe to Red Rock
5.3 $4 $21
1 Red Rock Double track Newkirk to Arkansas City
7.5 $4 $30
1 Arkansas City
Double track Putnam to Newton
4.5 $4 $18
Sub total 26.6 $106
Grade Crossing Improvements between Newton and Oklahoma City
$8 Total *26.6 *$114 * Scope and costs of BNSF improvements were developed by BNSF and have not been independently validated. Layover Facility Newton An overnight train consist storage track location will need to be identified at Newton. In addition, a small
building facility will be needed for use by train crews, as well as for storage of cleaning equipment and for communications facilities. A standby 480 volt power unit as well as potable water unit needs to be provided. A line item of $300,000 is recommended for the layover facility. A potential site at Newton for the layover track and crew/servicing facility may be available near the Newton train station. No discussions regarding the availability of the site have been undertaken. Overnight storage of the train consist at Newton would require movement off the main track to the potential storage site. Map Exhibit 3 shows the potential storage site in relation to the Newton station. The Newton insert in map Exhibit 2 shows in red the route that the proposed service would follow through Newton.
16
Alternative 2
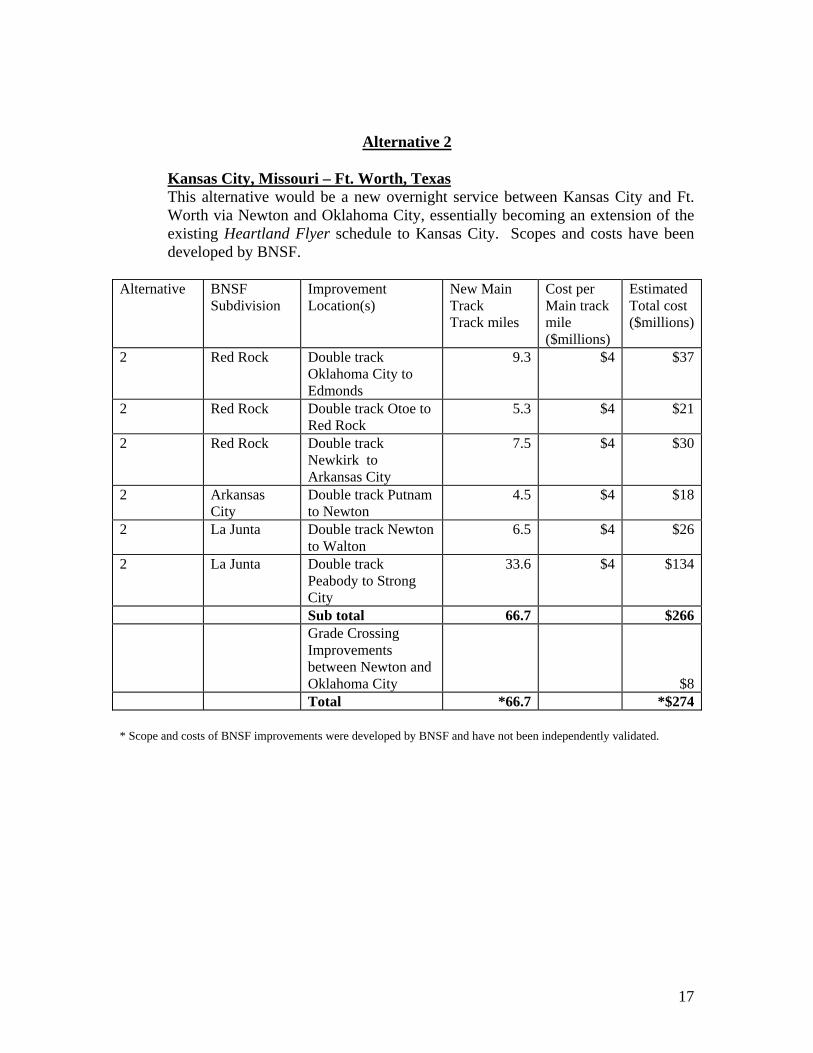
Kansas City, Missouri – Ft. Worth, Texas This alternative would be a new overnight service between Kansas City and Ft. Worth via Newton and Oklahoma City, essentially becoming an extension of the existing Heartland Flyer schedule to Kansas City. Scopes and costs have been developed by BNSF.
Alternative BNSF
Subdivision Improvement Location(s)
New Main Track Track miles
Cost per Main track mile ($millions)
Estimated Total cost ($millions)
2 Red Rock Double track Oklahoma City to Edmonds
9.3 $4 $37
2 Red Rock Double track Otoe to Red Rock
5.3 $4 $21
2 Red Rock Double track Newkirk to Arkansas City
7.5 $4 $30
2 Arkansas City
Double track Putnam to Newton
4.5 $4 $18
2 La Junta Double track Newton to Walton
6.5 $4 $26
2 La Junta Double track Peabody to Strong City
33.6 $4 $134
Sub total 66.7 $266 Grade Crossing
Improvements between Newton and Oklahoma City
$8 Total *66.7 *$274 * Scope and costs of BNSF improvements were developed by BNSF and have not been independently validated.
17
Alternative 3
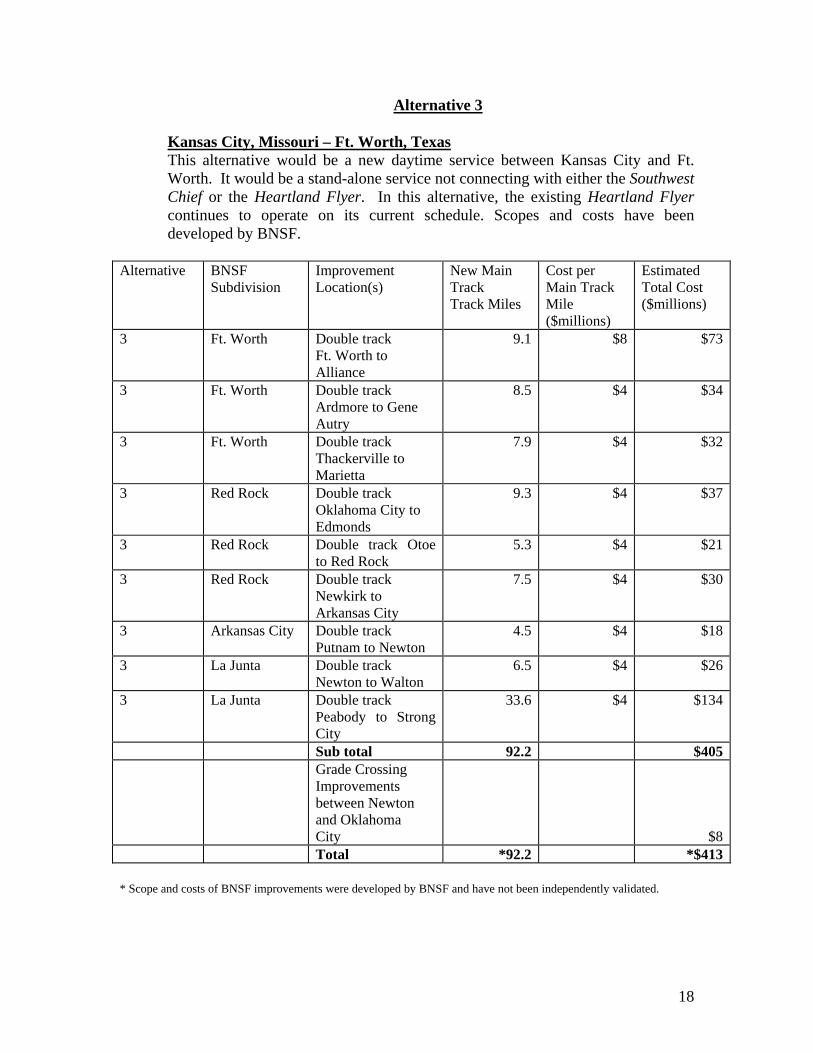
Kansas City, Missouri – Ft. Worth, Texas This alternative would be a new daytime service between Kansas City and Ft. Worth. It would be a stand-alone service not connecting with either the Southwest Chief or the Heartland Flyer. In this alternative, the existing Heartland Flyer continues to operate on its current schedule. Scopes and costs have been developed by BNSF.
Alternative BNSF Subdivision
Improvement Location(s)
New Main Track Track Miles
Cost per Main Track Mile ($millions)
Estimated Total Cost ($millions)
3 Ft. Worth Double track Ft. Worth to Alliance
9.1 $8 $73
3 Ft. Worth Double track Ardmore to Gene Autry
8.5 $4 $34
3 Ft. Worth Double track Thackerville to Marietta
7.9 $4 $32
3 Red Rock Double track Oklahoma City to Edmonds
9.3 $4 $37
3 Red Rock Double track Otoe to Red Rock
5.3 $4 $21
3 Red Rock Double track Newkirk to Arkansas City
7.5 $4 $30
3 Arkansas City Double track Putnam to Newton
4.5 $4 $18
3 La Junta Double track Newton to Walton
6.5 $4 $26
3 La Junta Double track Peabody to Strong City
33.6 $4 $134
Sub total 92.2 $405 Grade Crossing
Improvements between Newton and Oklahoma City
$8 Total *92.2 *$413
* Scope and costs of BNSF improvements were developed by BNSF and have not been independently validated.
18
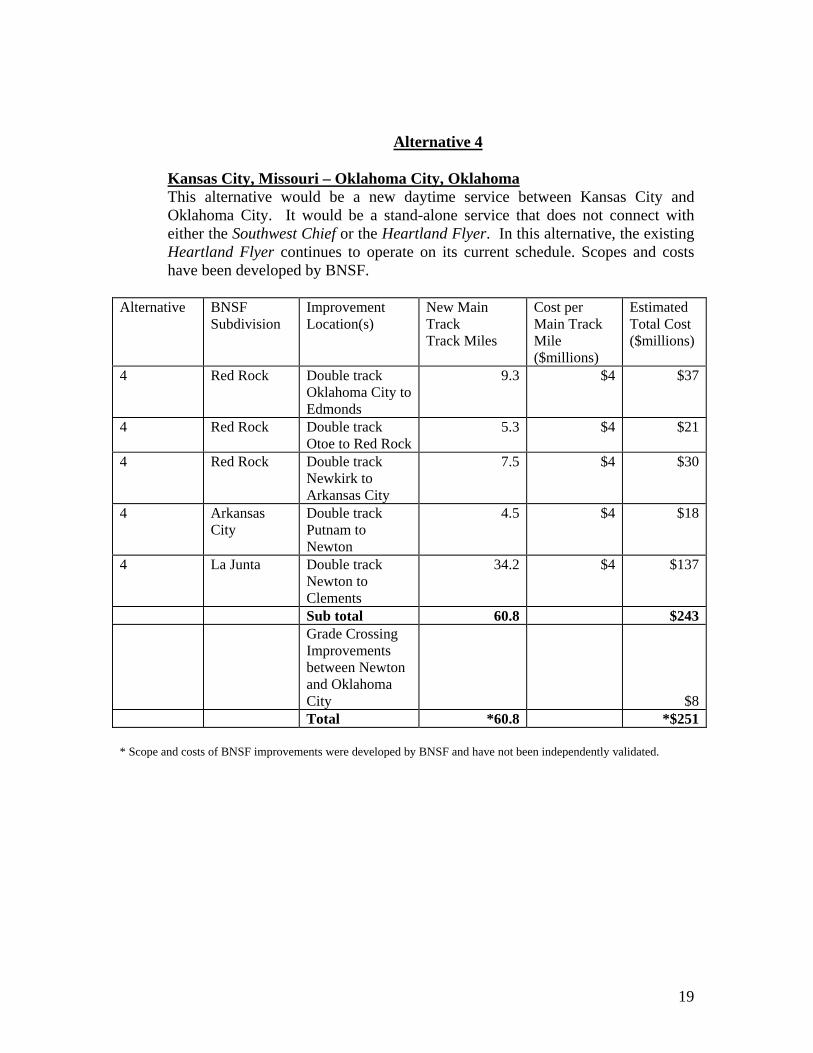
Alternative 4
Kansas City, Missouri – Oklahoma City, Oklahoma This alternative would be a new daytime service between Kansas City and Oklahoma City. It would be a stand-alone service that does not connect with either the Southwest Chief or the Heartland Flyer. In this alternative, the existing Heartland Flyer continues to operate on its current schedule. Scopes and costs have been developed by BNSF.
Alternative BNSF Subdivision
Improvement Location(s)
New Main Track Track Miles
Cost per Main Track Mile ($millions)
Estimated Total Cost ($millions)
4 Red Rock Double track Oklahoma City to Edmonds
9.3 $4 $37
4 Red Rock Double track Otoe to Red Rock
5.3 $4 $21
4 Red Rock Double track Newkirk to Arkansas City
7.5 $4 $30
4 Arkansas City
Double track Putnam to Newton
4.5 $4 $18
4 La Junta Double track Newton to Clements
34.2 $4 $137
Sub total 60.8 $243 Grade Crossing
Improvements between Newton and Oklahoma City
$8 Total *60.8 *$251 * Scope and costs of BNSF improvements were developed by BNSF and have not been independently validated.
19
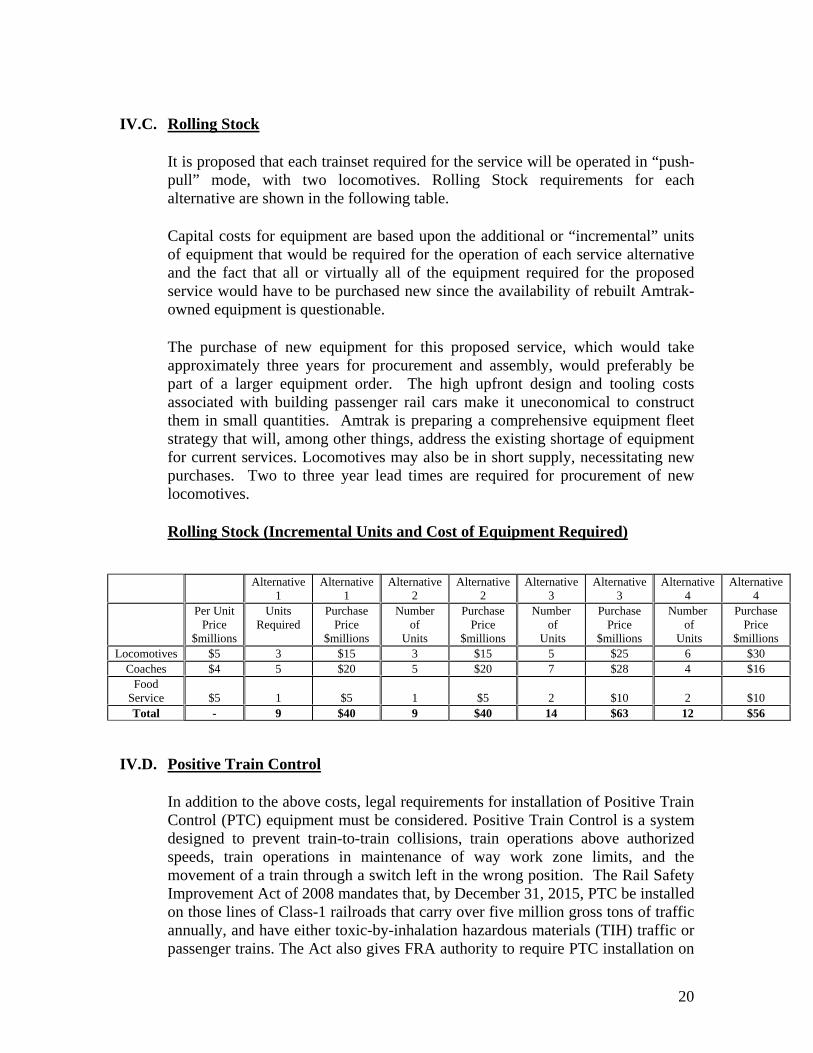
IV.C. Rolling Stock
It is proposed that each trainset required for the service will be operated in “push-pull” mode, with two locomotives. Rolling Stock requirements for each alternative are shown in the following table. Capital costs for equipment are based upon the additional or “incremental” units of equipment that would be required for the operation of each service alternative and the fact that all or virtually all of the equipment required for the proposed service would have to be purchased new since the availability of rebuilt Amtrak-owned equipment is questionable.
The purchase of new equipment for this proposed service, which would take approximately three years for procurement and assembly, would preferably be part of a larger equipment order. The high upfront design and tooling costs associated with building passenger rail cars make it uneconomical to construct them in small quantities. Amtrak is preparing a comprehensive equipment fleet strategy that will, among other things, address the existing shortage of equipment for current services. Locomotives may also be in short supply, necessitating new purchases. Two to three year lead times are required for procurement of new locomotives.
Rolling Stock (Incremental Units and Cost of Equipment Required)
Alternative 1
Alternative 1
Alternative 2
Alternative 2
Alternative 3
Alternative 3
Alternative 4
Alternative 4
Per Unit Price
$millions
Units Required
Purchase Price
$millions
Number of
Units
Purchase Price
$millions
Number of
Units
Purchase Price
$millions
Number of
Units
Purchase Price
$millions Locomotives $5 3 $15 3 $15 5 $25 6 $30
Coaches $4 5 $20 5 $20 7 $28 4 $16 Food
Service
$5 1
$5
1
$5
2
$10
2
$10
Total - 9 $40 9 $40 14 $63 12 $56
IV.D. Positive Train Control
In addition to the above costs, legal requirements for installation of Positive Train Control (PTC) equipment must be considered. Positive Train Control is a system designed to prevent train-to-train collisions, train operations above authorized speeds, train operations in maintenance of way work zone limits, and the movement of a train through a switch left in the wrong position. The Rail Safety Improvement Act of 2008 mandates that, by December 31, 2015, PTC be installed on those lines of Class-1 railroads that carry over five million gross tons of traffic annually, and have either toxic-by-inhalation hazardous materials (TIH) traffic or passenger trains. The Act also gives FRA authority to require PTC installation on
20
other rail lines. FRA has recently issued proposed regulations that would require PTC on virtually all rail lines over which scheduled passenger trains operate. At this time, the scope, costs and funding requirements for Positive Train Control are still to be determined.
V. Schedules Using Amtrak’s standard methodology and reflecting the maximum authorized operating speeds, station dwell times and 8% recovery time, proposed schedules were developed as follows:
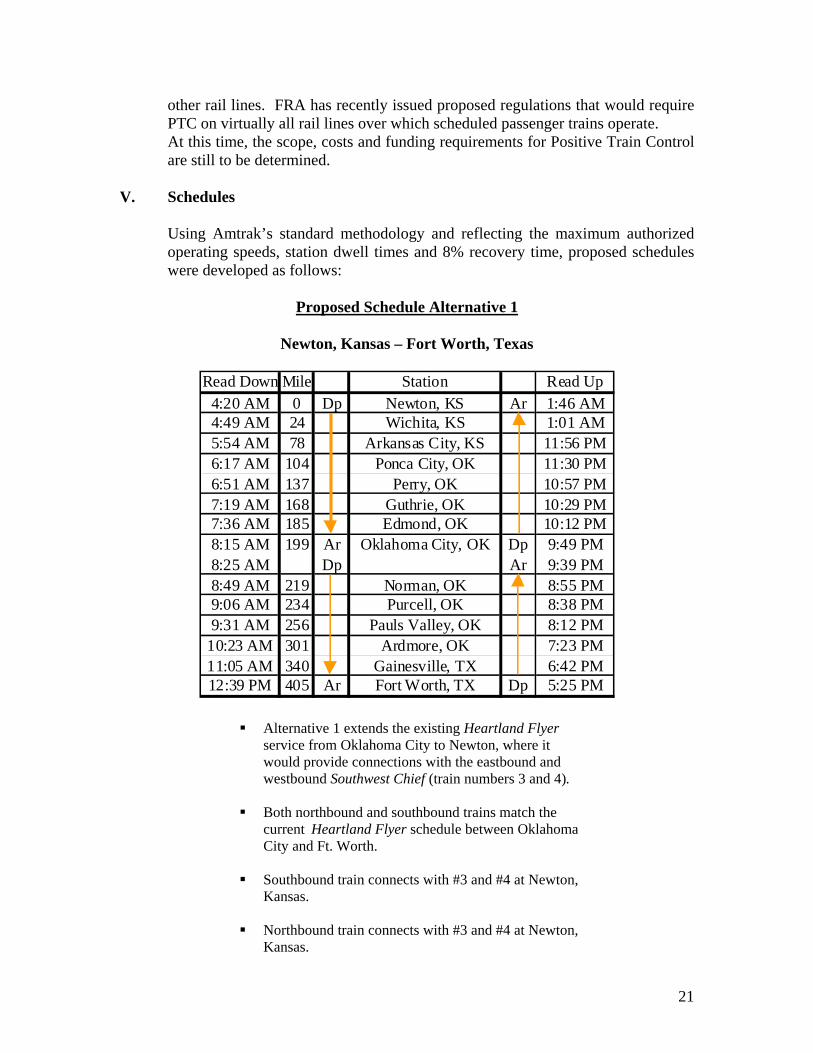
Proposed Schedule Alternative 1
Newton, Kansas – Fort Worth, Texas Read Down Mile Station Read Up
4:20 AM 0 Dp Newton, KS Ar 1:46 AM4:49 AM 24 Wichita, KS 1:01 AM5:54 AM 78 Arkansas City, KS 11:56 PM6:17 AM 104 Ponca City, OK 11:30 PM6:51 AM 137 Perry, OK 10:57 PM7:19 AM 168 Guthrie, OK 10:29 PM7:36 AM 185 Edmond, OK 10:12 PM8:15 AM 199 Ar Oklahoma City, OK Dp 9:49 PM8:25 AM Dp Ar 9:39 PM8:49 AM 219 Norman, OK 8:55 PM9:06 AM 234 Purcell, OK 8:38 PM9:31 AM 256 Pauls Valley, OK 8:12 PM
10:23 AM 301 Ardmore, OK 7:23 PM11:05 AM 340 Gainesville, TX 6:42 PM12:39 PM 405 Ar Fort Worth, TX Dp 5:25 PM
Alternative 1 extends the existing Heartland Flyer service from Oklahoma City to Newton, where it
would provide connections with the eastbound and westbound Southwest Chief (train numbers 3 and 4).
Both northbound and southbound trains match the
current Heartland Flyer schedule between Oklahoma City and Ft. Worth.
Southbound train connects with #3 and #4 at Newton,
Kansas.
Northbound train connects with #3 and #4 at Newton, Kansas.
21
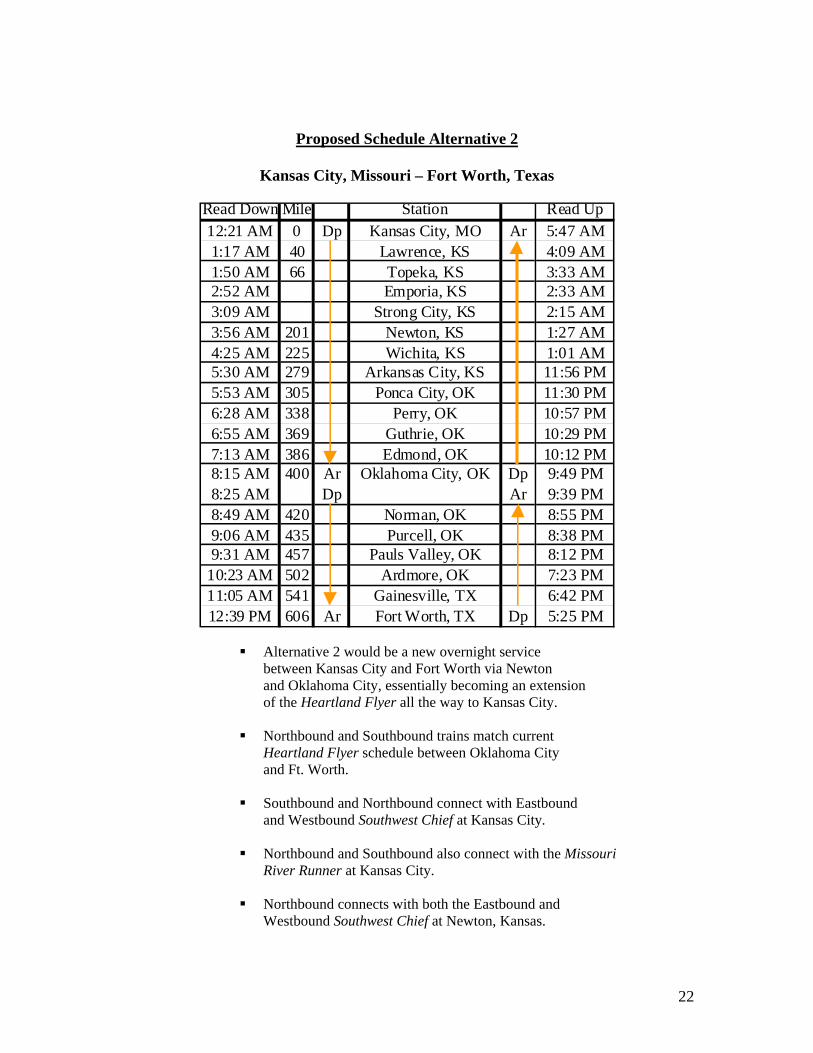
Proposed Schedule Alternative 2
Kansas City, Missouri – Fort Worth, Texas
Read Down Mile Station Read Up12:21 AM 0 Dp Kansas City, MO Ar 5:47 AM1:17 AM 40 Lawrence, KS 4:09 AM1:50 AM 66 Topeka, KS 3:33 AM2:52 AM Emporia, KS 2:33 AM3:09 AM Strong City, KS 2:15 AM3:56 AM 201 Newton, KS 1:27 AM4:25 AM 225 Wichita, KS 1:01 AM5:30 AM 279 Arkansas City, KS 11:56 PM5:53 AM 305 Ponca City, OK 11:30 PM6:28 AM 338 Perry, OK 10:57 PM6:55 AM 369 Guthrie, OK 10:29 PM7:13 AM 386 Edmond, OK 10:12 PM8:15 AM 400 Ar Oklahoma City, OK Dp 9:49 PM8:25 AM Dp Ar 9:39 PM8:49 AM 420 Norman, OK 8:55 PM9:06 AM 435 Purcell, OK 8:38 PM9:31 AM 457 Pauls Valley, OK 8:12 PM
10:23 AM 502 Ardmore, OK 7:23 PM11:05 AM 541 Gainesville, TX 6:42 PM12:39 PM 606 Ar Fort Worth, TX Dp 5:25 PM
Alternative 2 would be a new overnight service between Kansas City and Fort Worth via Newton and Oklahoma City, essentially becoming an extension of the Heartland Flyer all the way to Kansas City.
Northbound and Southbound trains match current
Heartland Flyer schedule between Oklahoma City and Ft. Worth.
Southbound and Northbound connect with Eastbound
and Westbound Southwest Chief at Kansas City.
Northbound and Southbound also connect with the Missouri River Runner at Kansas City.
Northbound connects with both the Eastbound and
Westbound Southwest Chief at Newton, Kansas.
22
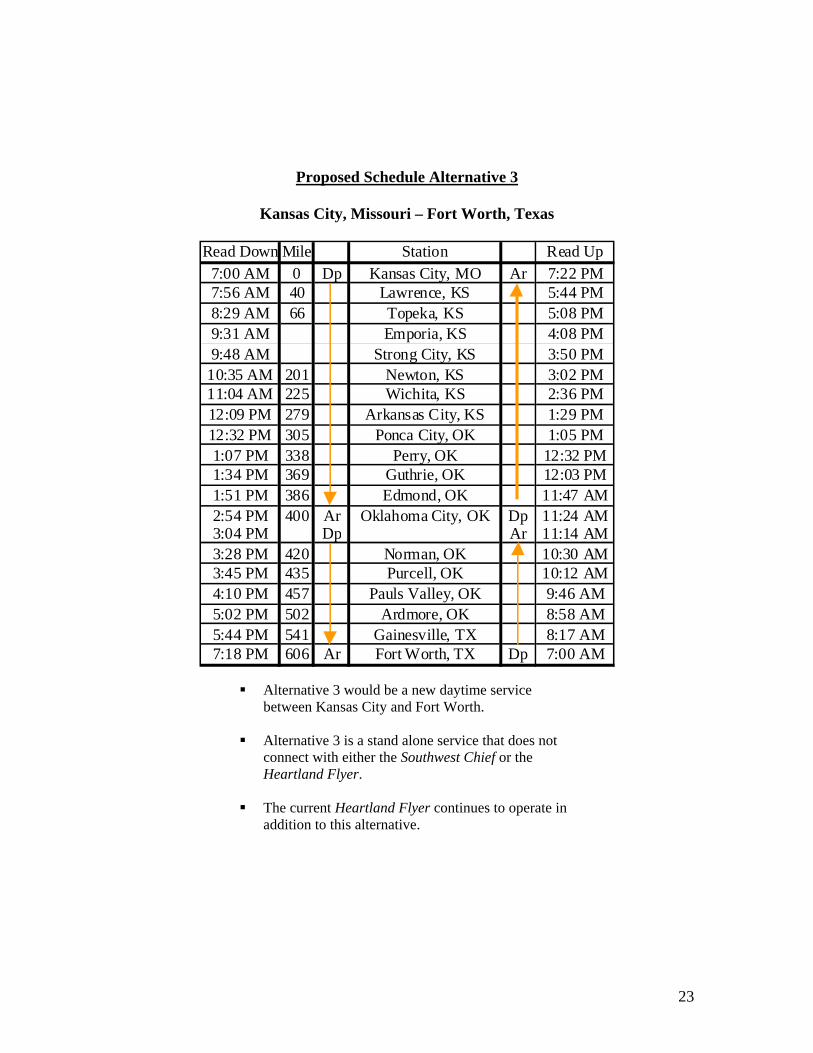
Proposed Schedule Alternative 3
Kansas City, Missouri – Fort Worth, Texas Read Down Mile Station Read Up
7:00 AM 0 Dp Kansas City, MO Ar 7:22 PM7:56 AM 40 Lawrence, KS 5:44 PM8:29 AM 66 Topeka, KS 5:08 PM9:31 AM Emporia, KS 4:08 PM9:48 AM Strong City, KS 3:50 PM
10:35 AM 201 Newton, KS 3:02 PM11:04 AM 225 Wichita, KS 2:36 PM12:09 PM 279 Arkansas City, KS 1:29 PM12:32 PM 305 Ponca City, OK 1:05 PM1:07 PM 338 Perry, OK 12:32 PM1:34 PM 369 Guthrie, OK 12:03 PM1:51 PM 386 Edmond, OK 11:47 AM2:54 PM 400 Ar Oklahoma City, OK Dp 11:24 AM3:04 PM Dp Ar 11:14 AM3:28 PM 420 Norman, OK 10:30 AM3:45 PM 435 Purcell, OK 10:12 AM4:10 PM 457 Pauls Valley, OK 9:46 AM5:02 PM 502 Ardmore, OK 8:58 AM5:44 PM 541 Gainesville, TX 8:17 AM7:18 PM 606 Ar Fort Worth, TX Dp 7:00 AM
Alternative 3 would be a new daytime service between Kansas City and Fort Worth.
Alternative 3 is a stand alone service that does not
connect with either the Southwest Chief or the Heartland Flyer.
The current Heartland Flyer continues to operate in
addition to this alternative.
23
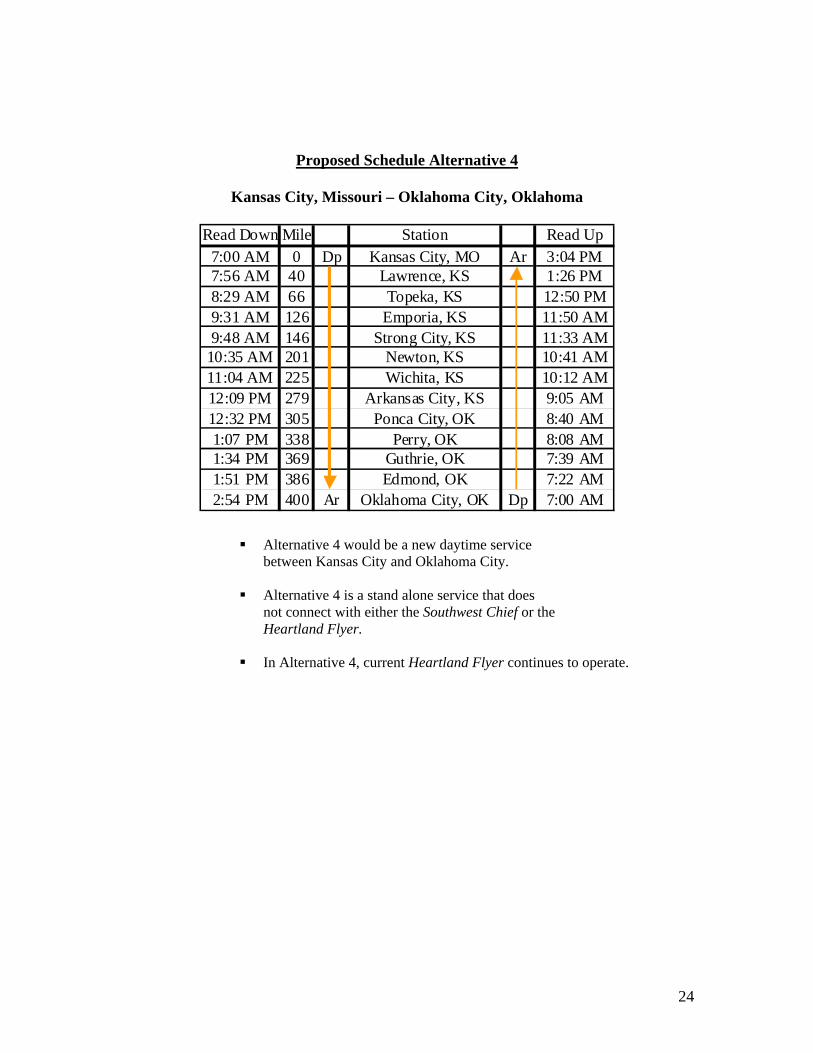
Proposed Schedule Alternative 4
Kansas City, Missouri – Oklahoma City, Oklahoma
Read Down Mile Station Read Up7:00 AM 0 Dp Kansas City, MO Ar 3:04 PM7:56 AM 40 Lawrence, KS 1:26 PM8:29 AM 66 Topeka, KS 12:50 PM9:31 AM 126 Emporia, KS 11:50 AM9:48 AM 146 Strong City, KS 11:33 AM
10:35 AM 201 Newton, KS 10:41 AM11:04 AM 225 Wichita, KS 10:12 AM12:09 PM 279 Arkansas City, KS 9:05 AM12:32 PM 305 Ponca City, OK 8:40 AM1:07 PM 338 Perry, OK 8:08 AM1:34 PM 369 Guthrie, OK 7:39 AM1:51 PM 386 Edmond, OK 7:22 AM2:54 PM 400 Ar Oklahoma City, OK Dp 7:00 AM
Alternative 4 would be a new daytime service between Kansas City and Oklahoma City.
Alternative 4 is a stand alone service that does
not connect with either the Southwest Chief or the Heartland Flyer.
In Alternative 4, current Heartland Flyer continues to operate.
24
VI. Revenue/Ridership Forecast Summary
Annual ridership and ticket revenue projections for fiscal year 2009 were developed for each of the four service alternatives described on page 3 of this report by the firm AECOM. These projections were based upon the hypothetical 12-month operation of the schedule developed for each alternative service option and presented on pages 21 thru 24. Based upon these schedules and the assumed operation of each service for the full 12-month 2009 period, incremental ridership and ticket revenue estimates for each alternative are as follows: Incremental Ridership and Ticket Revenue Service Alternative 1 2 3 4 Ridership (Annual Trips) 92,500 118,200 174,000 65,900 Ticket Revenue ($millions) $2.7 $5.2 $6.1 $2.1
The ridership and ticket revenue estimates presented above reflect the additional or “incremental” annual 2009 ridership and ticket revenue that would have been expected to result on a stand alone basis from the implementation of each of the four different service alternatives described on page 3. Accordingly with respect to service alternatives 1 and 2, which provide for extension of the current Heartland Flyer route, the projected results reflect only the projected additional ridership and ticket revenue that would have been realized by the Heartland Flyer from the proposed extension of the route. As such, the above projected results do not include any ancillary traffic projected to be realized by Amtrak’s long distance service due to enhanced levels of connectivity associated with the proposed extension of the route. In addition to the proposed schedules developed for each service alternative, the projected ridership and ticket revenue results presented above are also based upon an assessment of several other key service parameters including (1) population size and demographics of the geographic area to be served; (2) the proposed level of daily service, i.e., the number of daily train frequencies; (3) the length of scheduled trip duration; and (4) competing modes of alternative transportation.
VII. Projected Annual Operating Expenses
Projected annual direct operating costs for the 2009 fiscal year were developed by Amtrak and are presented below on a stand-alone basis for each of the 4 service alternatives described on page 3. Consistent with the methodology used for ridership and ticket revenue, these cost projections exclude any projected operating expenses applicable to Amtrak long distance services. Consequently, the results projected below reflect the projected “incremental” operating expenses that would have been realized by the Heartland Flyer, under service alternatives 1
25
and 2 or new operating expenses associated with the proposed operation of new day time services under service alternatives 3 and 4. Among the key determinants of projected annual operating costs are: (1) the number of daily frequencies proposed for operation; (2) the projected types and quantities of equipment required to support operations; (3) equipment rotation; (4) crew base requirements and scheduling synergies; and (5) the desired level of service amenities, such as food and beverage services.
Estimated Annual Incremental Operating Expenses
Service Alternative 1 2 3 4 Projected Total Direct Costs ($millions) $5.9 $10.4 $14.1 $8.5
VIII. Mobilization Costs
Before establishing any of the four potential service alternatives, Amtrak would need to hire, train and qualify necessary employees to perform a number of functions including train operations and on-board services. The number of additional staff required by position is projected as follows.
Required Additional Personnel Alternatives 1 2 3 4 Train and Locomotive Staffing 15 25 25 15 On-Board-Service Staffing 5 5 5 4 Mechanical Staffing 2 2 4 4 Station Staffing TBD TBD TBD TBDTotal Additional Personnel Required 22 32 34 23
Mobilization Costs Alternatives 1 2 3 4 Training, Qualification, and Other ($millions) $1.5 $3.0 $3.1 $2.1 Total Estimated Mobilization Costs ($millions) $1.5 $3.0 $3.1 $2.1
The majority of this cost is driven by the lengthy classroom and on-the-job training required of new locomotive engineers and conductors, and federal regulations that require they be qualified on the operating rules and physical characteristics of the routes over which they will be operating trains. In addition to classroom training, engineer-trainees are required to complete a minimum of 240 hours of locomotive engine operation and 480 hours of on-the-job training to obtain certification; the qualification process requires engineers to make as many as 36 round trips, accompanied by a qualified engineer, on each line staffed by the crew base where they are employed.
26
IX. Summary of Key Numbers
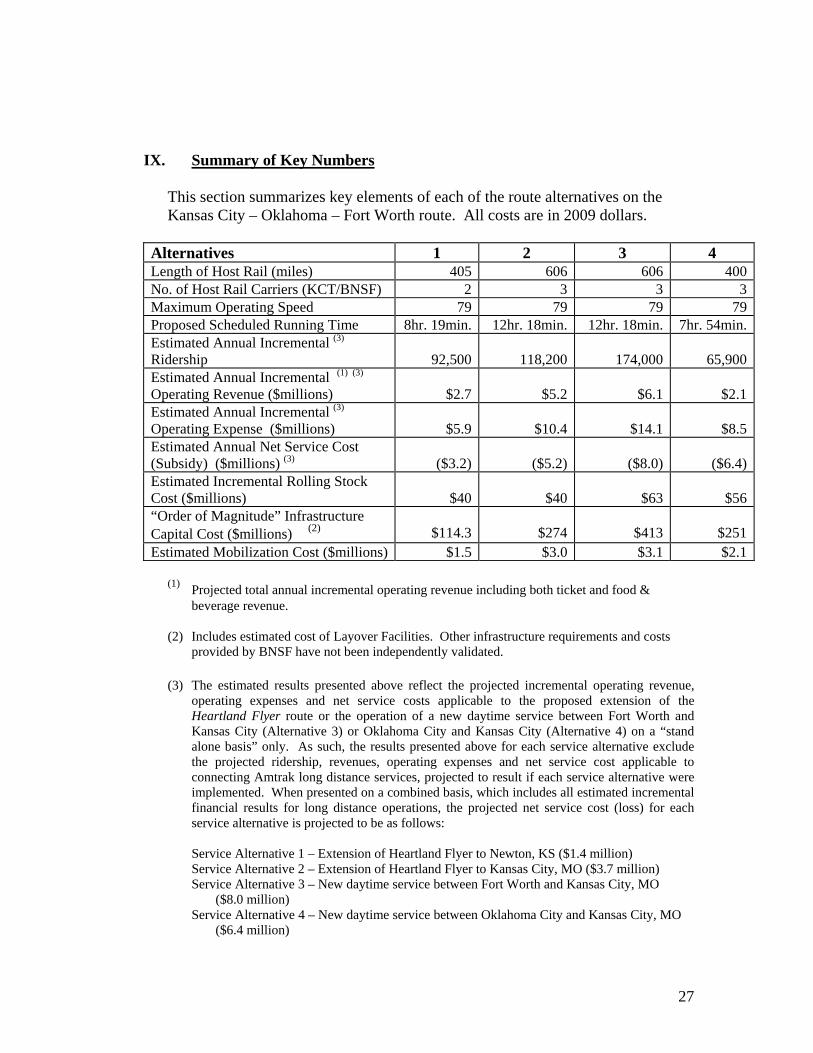
This section summarizes key elements of each of the route alternatives on the Kansas City – Oklahoma – Fort Worth route. All costs are in 2009 dollars.
Alternatives 1 2 3 4 Length of Host Rail (miles) 405 606 606 400No. of Host Rail Carriers (KCT/BNSF) 2 3 3 3Maximum Operating Speed 79 79 79 79Proposed Scheduled Running Time 8hr. 19min. 12hr. 18min. 12hr. 18min. 7hr. 54min.Estimated Annual Incremental (3)
Ridership
92,500
118,200
174,000
65,900Estimated Annual Incremental (1) (3)
Operating Revenue ($millions)
$2.7
$5.2
$6.1
$2.1Estimated Annual Incremental (3)
Operating Expense ($millions)
$5.9
$10.4
$14.1
$8.5Estimated Annual Net Service Cost (Subsidy) ($millions) (3)
($3.2)
($5.2)
($8.0)
($6.4)
Estimated Incremental Rolling Stock Cost ($millions)
$40
$40
$63
$56
“Order of Magnitude” Infrastructure Capital Cost ($millions) (2)
$114.3
$274
$413
$251
Estimated Mobilization Cost ($millions) $1.5 $3.0 $3.1 $2.1 (1) Projected total annual incremental operating revenue including both ticket and food &
beverage revenue. (2) Includes estimated cost of Layover Facilities. Other infrastructure requirements and costs
provided by BNSF have not been independently validated. (3) The estimated results presented above reflect the projected incremental operating revenue,
operating expenses and net service costs applicable to the proposed extension of the Heartland Flyer route or the operation of a new daytime service between Fort Worth and Kansas City (Alternative 3) or Oklahoma City and Kansas City (Alternative 4) on a “stand alone basis” only. As such, the results presented above for each service alternative exclude the projected ridership, revenues, operating expenses and net service cost applicable to connecting Amtrak long distance services, projected to result if each service alternative were implemented. When presented on a combined basis, which includes all estimated incremental financial results for long distance operations, the projected net service cost (loss) for each service alternative is projected to be as follows:
Service Alternative 1 – Extension of Heartland Flyer to Newton, KS ($1.4 million) Service Alternative 2 – Extension of Heartland Flyer to Kansas City, MO ($3.7 million) Service Alternative 3 – New daytime service between Fort Worth and Kansas City, MO ($8.0 million) Service Alternative 4 – New daytime service between Oklahoma City and Kansas City, MO ($6.4 million)
27
Exhibits
1-3. Route Maps (3 Maps Attached) 4. Route Population by City/Town 6. Route Population by County 6. Acronyms/Definitions 7. References 8. Letters of Resolutions and Support
28
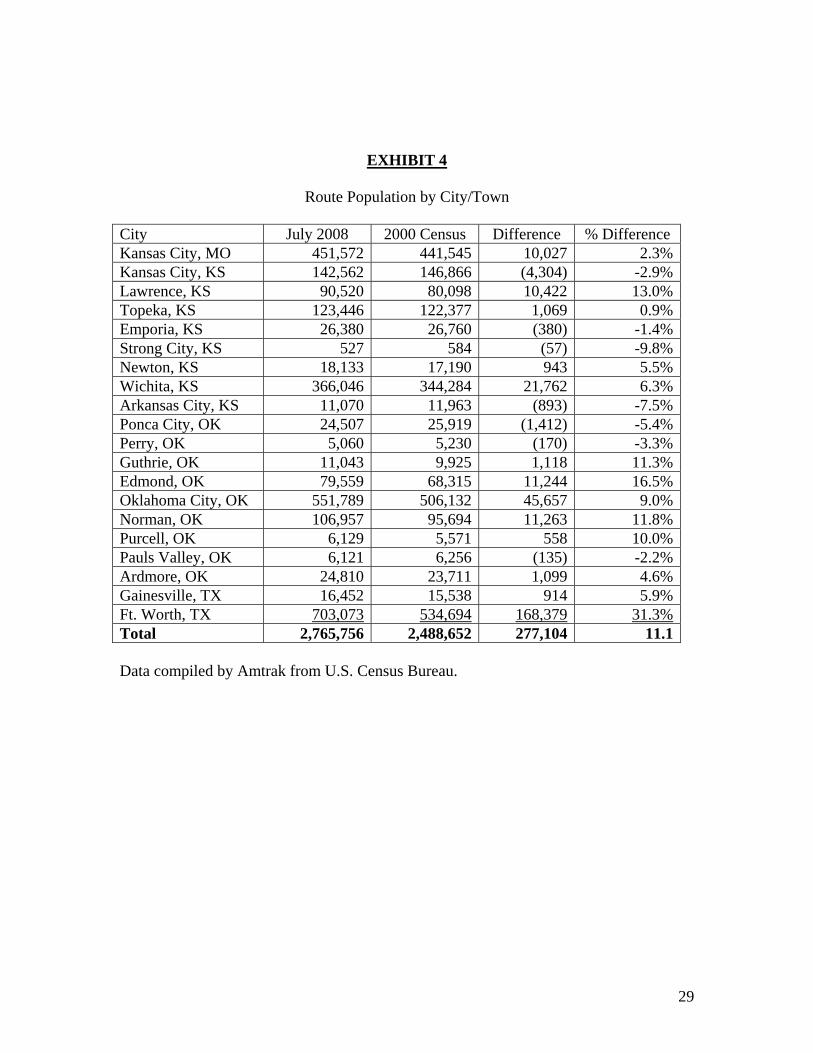
EXHIBIT 4
Route Population by City/Town City July 2008 2000 Census Difference % Difference Kansas City, MO 451,572 441,545 10,027 2.3%Kansas City, KS 142,562 146,866 (4,304) -2.9%Lawrence, KS 90,520 80,098 10,422 13.0%Topeka, KS 123,446 122,377 1,069 0.9%Emporia, KS 26,380 26,760 (380) -1.4%Strong City, KS 527 584 (57) -9.8%Newton, KS 18,133 17,190 943 5.5%Wichita, KS 366,046 344,284 21,762 6.3%Arkansas City, KS 11,070 11,963 (893) -7.5%Ponca City, OK 24,507 25,919 (1,412) -5.4%Perry, OK 5,060 5,230 (170) -3.3%Guthrie, OK 11,043 9,925 1,118 11.3%Edmond, OK 79,559 68,315 11,244 16.5%Oklahoma City, OK 551,789 506,132 45,657 9.0%Norman, OK 106,957 95,694 11,263 11.8%Purcell, OK 6,129 5,571 558 10.0%Pauls Valley, OK 6,121 6,256 (135) -2.2%Ardmore, OK 24,810 23,711 1,099 4.6%Gainesville, TX 16,452 15,538 914 5.9%Ft. Worth, TX 703,073 534,694 168,379 31.3%Total 2,765,756 2,488,652 277,104 11.1 Data compiled by Amtrak from U.S. Census Bureau.
29
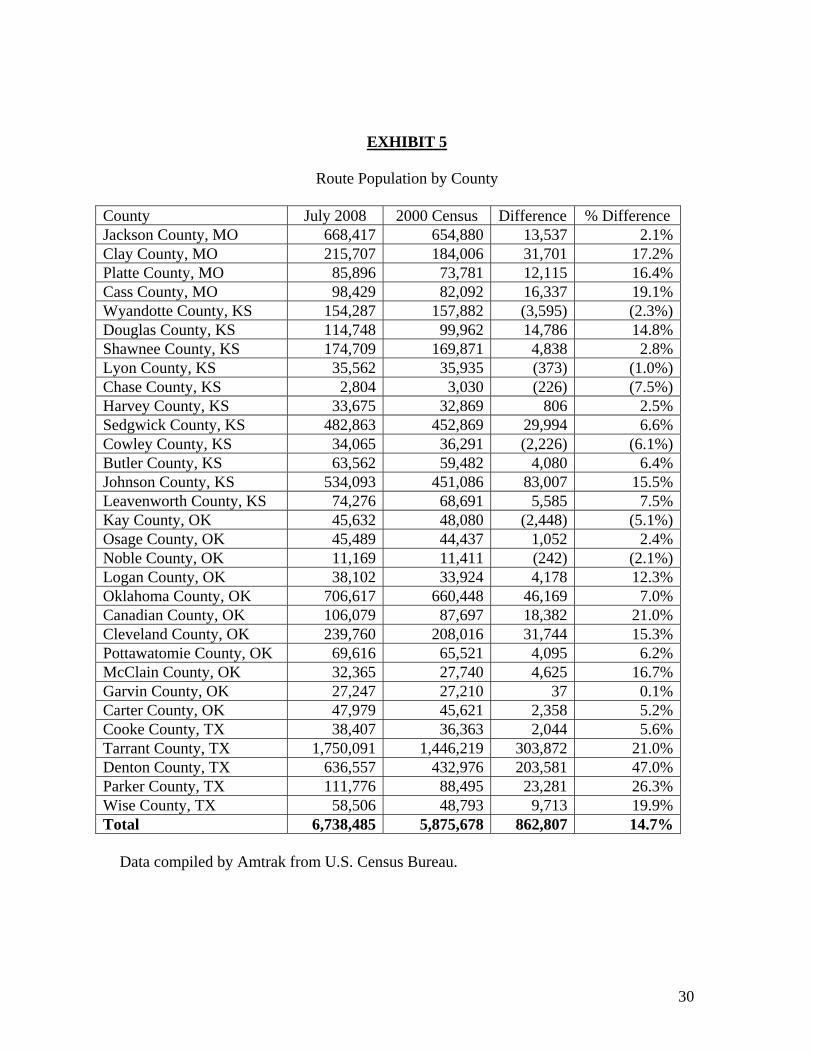
EXHIBIT 5
Route Population by County
County July 2008 2000 Census Difference % Difference Jackson County, MO 668,417 654,880 13,537 2.1%Clay County, MO 215,707 184,006 31,701 17.2%Platte County, MO 85,896 73,781 12,115 16.4%Cass County, MO 98,429 82,092 16,337 19.1%Wyandotte County, KS 154,287 157,882 (3,595) (2.3%)Douglas County, KS 114,748 99,962 14,786 14.8%Shawnee County, KS 174,709 169,871 4,838 2.8%Lyon County, KS 35,562 35,935 (373) (1.0%)Chase County, KS 2,804 3,030 (226) (7.5%)Harvey County, KS 33,675 32,869 806 2.5%Sedgwick County, KS 482,863 452,869 29,994 6.6%Cowley County, KS 34,065 36,291 (2,226) (6.1%)Butler County, KS 63,562 59,482 4,080 6.4%Johnson County, KS 534,093 451,086 83,007 15.5%Leavenworth County, KS 74,276 68,691 5,585 7.5%Kay County, OK 45,632 48,080 (2,448) (5.1%)Osage County, OK 45,489 44,437 1,052 2.4%Noble County, OK 11,169 11,411 (242) (2.1%)Logan County, OK 38,102 33,924 4,178 12.3%Oklahoma County, OK 706,617 660,448 46,169 7.0%Canadian County, OK 106,079 87,697 18,382 21.0%Cleveland County, OK 239,760 208,016 31,744 15.3%Pottawatomie County, OK 69,616 65,521 4,095 6.2%McClain County, OK 32,365 27,740 4,625 16.7%Garvin County, OK 27,247 27,210 37 0.1%Carter County, OK 47,979 45,621 2,358 5.2%Cooke County, TX 38,407 36,363 2,044 5.6%Tarrant County, TX 1,750,091 1,446,219 303,872 21.0%Denton County, TX 636,557 432,976 203,581 47.0%Parker County, TX 111,776 88,495 23,281 26.3%Wise County, TX 58,506 48,793 9,713 19.9%Total 6,738,485 5,875,678 862,807 14.7%
Data compiled by Amtrak from U.S. Census Bureau.
30
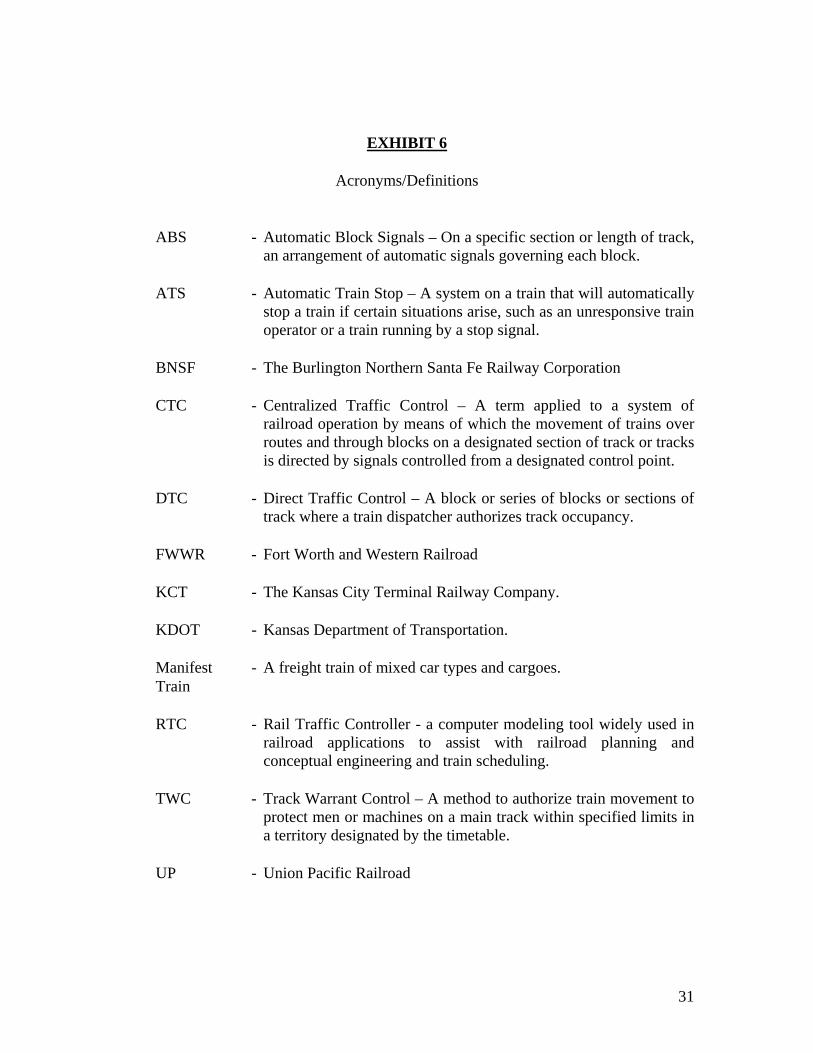
EXHIBIT 6
Acronyms/Definitions
ABS - Automatic Block Signals – On a specific section or length of track, an arrangement of automatic signals governing each block.
ATS - Automatic Train Stop – A system on a train that will automatically
stop a train if certain situations arise, such as an unresponsive train operator or a train running by a stop signal.
BNSF - The Burlington Northern Santa Fe Railway Corporation
CTC - Centralized Traffic Control – A term applied to a system of railroad operation by means of which the movement of trains over routes and through blocks on a designated section of track or tracks is directed by signals controlled from a designated control point.
DTC - Direct Traffic Control – A block or series of blocks or sections of
track where a train dispatcher authorizes track occupancy. FWWR - Fort Worth and Western Railroad KCT - The Kansas City Terminal Railway Company. KDOT - Kansas Department of Transportation. Manifest - A freight train of mixed car types and cargoes. Train RTC - Rail Traffic Controller - a computer modeling tool widely used in
railroad applications to assist with railroad planning and conceptual engineering and train scheduling.
TWC - Track Warrant Control – A method to authorize train movement to
protect men or machines on a main track within specified limits in a territory designated by the timetable.
UP - Union Pacific Railroad
31
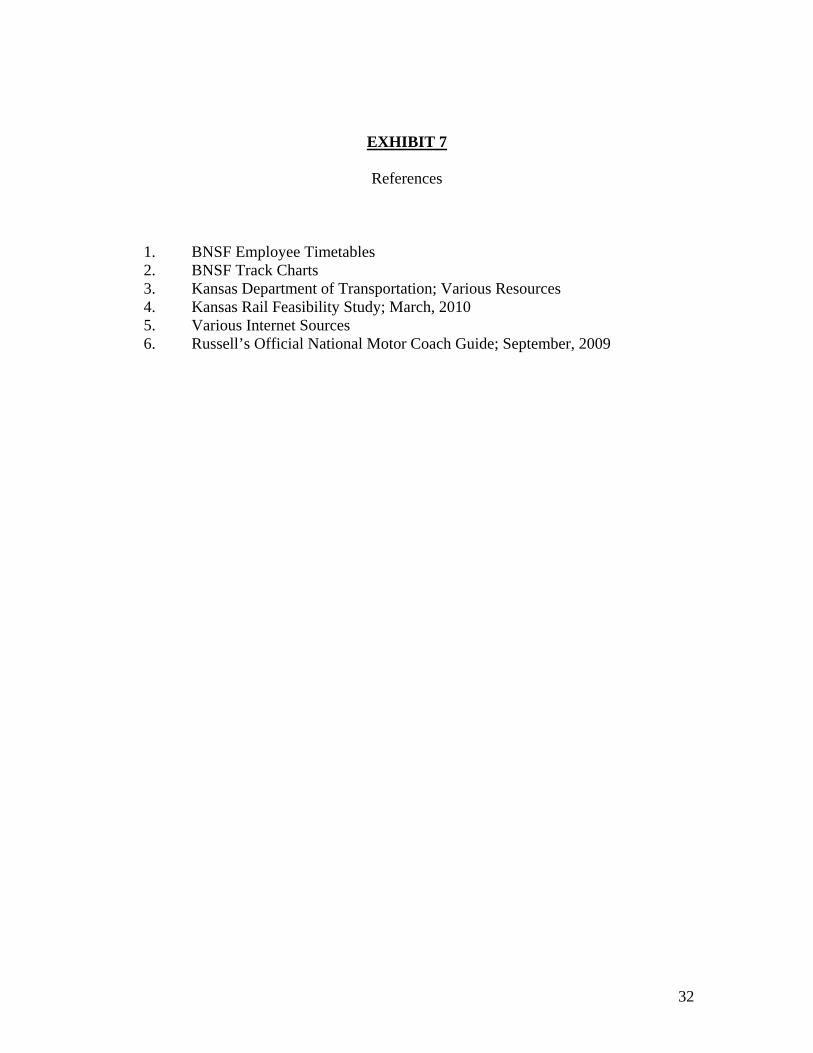
EXHIBIT 7
References
1. BNSF Employee Timetables 2. BNSF Track Charts 3. Kansas Department of Transportation; Various Resources 4. Kansas Rail Feasibility Study; March, 2010 5. Various Internet Sources 6. Russell’s Official National Motor Coach Guide; September, 2009
32
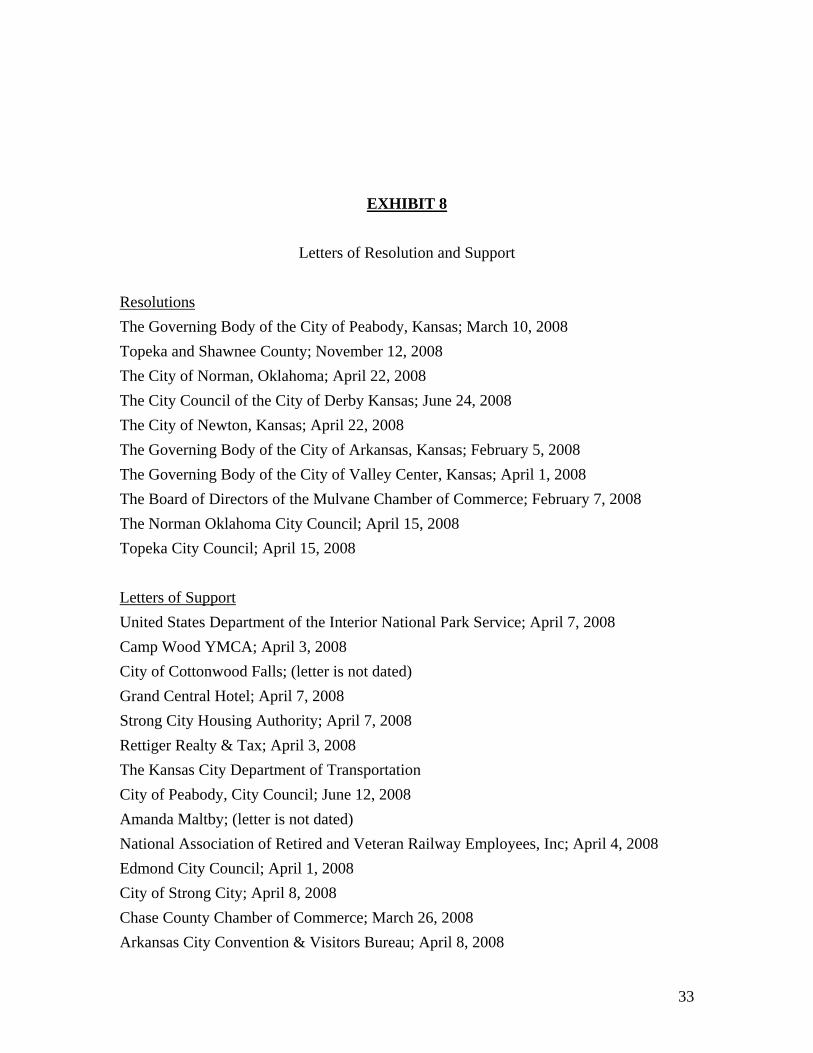
EXHIBIT 8
Letters of Resolution and Support
Resolutions
The Governing Body of the City of Peabody, Kansas; March 10, 2008
Topeka and Shawnee County; November 12, 2008
The City of Norman, Oklahoma; April 22, 2008
The City Council of the City of Derby Kansas; June 24, 2008
The City of Newton, Kansas; April 22, 2008
The Governing Body of the City of Arkansas, Kansas; February 5, 2008
The Governing Body of the City of Valley Center, Kansas; April 1, 2008
The Board of Directors of the Mulvane Chamber of Commerce; February 7, 2008
The Norman Oklahoma City Council; April 15, 2008
Topeka City Council; April 15, 2008
Letters of Support
United States Department of the Interior National Park Service; April 7, 2008
Camp Wood YMCA; April 3, 2008
City of Cottonwood Falls; (letter is not dated)
Grand Central Hotel; April 7, 2008
Strong City Housing Authority; April 7, 2008
Rettiger Realty & Tax; April 3, 2008
The Kansas City Department of Transportation
City of Peabody, City Council; June 12, 2008
Amanda Maltby; (letter is not dated)
National Association of Retired and Veteran Railway Employees, Inc; April 4, 2008
Edmond City Council; April 1, 2008
City of Strong City; April 8, 2008
Chase County Chamber of Commerce; March 26, 2008
Arkansas City Convention & Visitors Bureau; April 8, 2008
33

34
Related Documents