Citation: Zaborskis, A.; Kavaliauskien ˙ e, A.; Eriksson, C.; Dimitrova, E.; Makari, J. Family Structure through the Adolescent Eyes: A Comparative Study of Current Status and Time Trends over Three Decades of HBSC Study. Societies 2022, 12, 88. https:// doi.org/10.3390/soc12030088 Academic Editor: Gregor Wolbring Received: 23 April 2022 Accepted: 28 May 2022 Published: 31 May 2022 Publisher’s Note: MDPI stays neutral with regard to jurisdictional claims in published maps and institutional affil- iations. Copyright: © 2022 by the authors. Licensee MDPI, Basel, Switzerland. This article is an open access article distributed under the terms and conditions of the Creative Commons Attribution (CC BY) license (https:// creativecommons.org/licenses/by/ 4.0/). societies Article Family Structure through the Adolescent Eyes: A Comparative Study of Current Status and Time Trends over Three Decades of HBSC Study Apolinaras Zaborskis 1, * , Aist ˙ e Kavaliauskien ˙ e 2 , Charli Eriksson 3 , Elitsa Dimitrova 4 and Joana Makari 5 1 Faculty of Public Health, Medical Academy, Lithuanian University of Health Sciences, LT-44307 Kaunas, Lithuania 2 Department of Orthodontics, Faculty of Odontology, Medical Academy, Lithuanian University of Health Sciences, LT-44307 Kaunas, Lithuania; [email protected] 3 Department of Public Health, Stockholm University, SE-10691 Stockholm, Sweden; [email protected] 4 Institute for Population and Human Studies, Bulgarian Academy of Sciences & Plovdiv University Paisii Hilendarski, 1000 Sofia, Bulgaria; [email protected] 5 Department of Pediatrics, Skåne University Hospital, Lund University, SE-22185 Lund, Sweden; [email protected] * Correspondence: [email protected] Abstract: This study aimed to investigate how family structure varies and identify its time trends in European and North American countries using data from seven surveys conducted between 1994 and 2018 according to the Health Behaviour in School-aged Children (HBSC) study. The current family structure in 44 countries was described and time trend analysis of 28 countries was performed. Adolescents were asked whom they lived with in their home to describe family structures. Family structures showed distinct patterns and dynamics between countries. In 2018, in all countries, 73% of adolescents lived with both their mother and father; 14% and 5% of adolescents lived in a single- parent family and stepfamily, respectively; and around 9% of adolescents lived in another family type. In the period 1994–2018, the proportion of young people living in intact families decreased from 79.6% to 70.0%, on average about 10 percentage points. There were no significant changes in the prevalence of single-parent families and stepfamilies, but a significant increase in the number of adolescents living without either parent was revealed. The findings have implications for cross- national adjustment of adolescent health, well-being, and behaviours, and for critical analysis of socioeconomic family resources. Keywords: adolescents; family structure; intact family; time trends; HBSC 1. Introduction The family is the primary place for the development and socialization of adolescents. In the family, they learn the norms of behaviour and the values of life. Many factors determine the functioning of the family and its significance for young people’s development, but the structure of the family is undoubtedly of great importance [1]. Different family structures include nuclear families, single-parent families, stepfam- ilies, families headed by two unmarried partners (either of the opposite sex or the same sex), adoptive families, extended families, and grandparent families [2]. Nuclear families are usually married couples who have any number of children. Although there are differ- ences in the definitions among observers, in this study, we use the intact family structure equivalent to the nuclear family structure as a concept to refer to those children who are living in families in which both biological parents are present in the household [3]. This type of family structure contrasts with the non-intact family. This term is also known as the reconstructed, reconstituted, or blended family in which one of the partners is not a biological parent [2]. From the child’s perspective, the non-intact family type includes Societies 2022, 12, 88. https://doi.org/10.3390/soc12030088 https://www.mdpi.com/journal/societies

Welcome message from author
This document is posted to help you gain knowledge. Please leave a comment to let me know what you think about it! Share it to your friends and learn new things together.
Transcript
Citation: Zaborskis, A.;
Kavaliauskiene, A.; Eriksson, C.;
Dimitrova, E.; Makari, J. Family
Structure through the Adolescent
Eyes: A Comparative Study of
Current Status and Time Trends over
Three Decades of HBSC Study.
Societies 2022, 12, 88. https://
doi.org/10.3390/soc12030088
Academic Editor: Gregor Wolbring
Received: 23 April 2022
Accepted: 28 May 2022
Published: 31 May 2022
Publisher’s Note: MDPI stays neutral
with regard to jurisdictional claims in
published maps and institutional affil-
iations.
Copyright: © 2022 by the authors.
Licensee MDPI, Basel, Switzerland.
This article is an open access article
distributed under the terms and
conditions of the Creative Commons
Attribution (CC BY) license (https://
creativecommons.org/licenses/by/
4.0/).
societies
Article
Family Structure through the Adolescent Eyes: A ComparativeStudy of Current Status and Time Trends over Three Decades ofHBSC StudyApolinaras Zaborskis 1,* , Aiste Kavaliauskiene 2, Charli Eriksson 3, Elitsa Dimitrova 4 and Joana Makari 5
1 Faculty of Public Health, Medical Academy, Lithuanian University of Health Sciences,LT-44307 Kaunas, Lithuania
2 Department of Orthodontics, Faculty of Odontology, Medical Academy, Lithuanian University of HealthSciences, LT-44307 Kaunas, Lithuania; [email protected]
3 Department of Public Health, Stockholm University, SE-10691 Stockholm, Sweden; [email protected] Institute for Population and Human Studies, Bulgarian Academy of Sciences & Plovdiv University Paisii
Hilendarski, 1000 Sofia, Bulgaria; [email protected] Department of Pediatrics, Skåne University Hospital, Lund University, SE-22185 Lund, Sweden;
[email protected]* Correspondence: [email protected]
Abstract: This study aimed to investigate how family structure varies and identify its time trends inEuropean and North American countries using data from seven surveys conducted between 1994and 2018 according to the Health Behaviour in School-aged Children (HBSC) study. The currentfamily structure in 44 countries was described and time trend analysis of 28 countries was performed.Adolescents were asked whom they lived with in their home to describe family structures. Familystructures showed distinct patterns and dynamics between countries. In 2018, in all countries, 73%of adolescents lived with both their mother and father; 14% and 5% of adolescents lived in a single-parent family and stepfamily, respectively; and around 9% of adolescents lived in another familytype. In the period 1994–2018, the proportion of young people living in intact families decreasedfrom 79.6% to 70.0%, on average about 10 percentage points. There were no significant changes inthe prevalence of single-parent families and stepfamilies, but a significant increase in the numberof adolescents living without either parent was revealed. The findings have implications for cross-national adjustment of adolescent health, well-being, and behaviours, and for critical analysis ofsocioeconomic family resources.
Keywords: adolescents; family structure; intact family; time trends; HBSC
1. Introduction
The family is the primary place for the development and socialization of adolescents.In the family, they learn the norms of behaviour and the values of life. Many factorsdetermine the functioning of the family and its significance for young people’s development,but the structure of the family is undoubtedly of great importance [1].
Different family structures include nuclear families, single-parent families, stepfam-ilies, families headed by two unmarried partners (either of the opposite sex or the samesex), adoptive families, extended families, and grandparent families [2]. Nuclear familiesare usually married couples who have any number of children. Although there are differ-ences in the definitions among observers, in this study, we use the intact family structureequivalent to the nuclear family structure as a concept to refer to those children who areliving in families in which both biological parents are present in the household [3]. Thistype of family structure contrasts with the non-intact family. This term is also known asthe reconstructed, reconstituted, or blended family in which one of the partners is not abiological parent [2]. From the child’s perspective, the non-intact family type includes
Societies 2022, 12, 88. https://doi.org/10.3390/soc12030088 https://www.mdpi.com/journal/societies

Societies 2022, 12, 88 2 of 16
children living in a single-parent family, stepfamily, or living with someone or somewhereelse. Parental separation or divorce is the most common cause of family compositiondisintegration [1,4–6].
The literature on the impact of family structure on child development and well-beingis huge. It covers several disciplines, including economics, demography, sociology, andpsychology. A recent scoping review evaluated 283 studies focused on the associationsbetween family structure and well-being [7]. Nearly three decades of research on theimpact of changing family structures shows that the highest levels of physical, emotional,and academic well-being are achieved among children living in nuclear or intact families,controlling for other family circumstances [4,8–13].
Research shows that living with both parents constitutes a protective factor for nor-mative development while living with a single parent or in stepfamilies has previouslybeen associated with a higher risk of poor psychological adjustment (depression, anxiety,poor perception of well-being, and social isolation) [14–17]. Young people who are livingin non-intact families are also more likely to engage in risky behaviour, such as sexualinitiation [18]. The most disturbing finding that researchers have found is the relationshipbetween impaired family structure and suicide [19,20]. Changes in family structure canalso predict poorer behavioural outcomes such as cigarette smoking and/or use of alco-hol in adolescence [21–23]. Living in a single-parent family or in a reconstituted familywas unfavourably associated with physical activity, sport participation, and screen-basedbehaviours among youth [24]. Adolescents from non-intact families had a less healthydiet [25,26] and higher risk of being overweight [27,28].
Research on the impact of changing family structures on general life satisfaction foundthat children living with both biological parents reported higher life satisfaction thanchildren living with a single parent or in stepfamilies [29,30]. However, the effect size ofsuch a parenthood/family structure on child well-being varied between countries, with nosystematic link to differences in policies [10,31,32]. Evidence has shown that in adolescence,the quality of family relationships might be more important for health outcomes thanfamily structure per se [33–35]. Shared physical custody after divorce is an increasingpattern in some countries such as Sweden [36]. In a study of 37 countries [37], it was foundthat adolescents’ life satisfaction in such an arrangement is higher than in asymmetricarrangements, although this is related to the children and family characteristics. Moreover,a large body of research has shown that families can function well and children can thrivein a variety of family structures if families are stable, have good parent–child relationships,and are financially secure [38,39].
Despite the examples of the strong implications of family structure on child devel-opment, data on the prevalence of different types of families can only be found mostly inofficial statistics. For many countries, official statistics contain only data on the frequencyof parental divorces, families by number of children, births to unmarried women, and otherdata that are successfully recorded during the census [40–43].
It should be noted that family structure can be measured in two different ways:from a family-centred perspective and from a child-centred perspective [32]. From thefirst perspective, generally for national databases, information is gathered in populationsurveys assessing the proportion of some types of family structure in all families withchildren. The sampling frame for the surveys is most typically a household address-basedone. The person responding to questions regarding the family situation is an adult, ratherthan a dependent child. From the second child-centred perspective, the proportion of allchildren who are living in some type of family structure is estimated. Researchers recordthe child’s response and use the school rather the household address as a sampling frame.In this way, the questions on family structure are measured by the responses of the children,not the adults. Adult and child perceptions of family structure, of course, may differ. Theperceptions of the children are certainly more important when examining the effects offamily structure on children’s health. However, very few cross-national studies collectinformation on family structure from the child’s perspective [44].
Societies 2022, 12, 88 3 of 16
The Health Behaviour in School-aged Children (HBSC) study is a World HealthOrganization (EURO) collaborative cross-national project that aims to investigate thehealth and well-being of adolescents in Europe and North America (see: www.hbsc.org(accessed on 22 April 2022)). Cross-sectional surveys with school-aged children of 11, 13,and 15 years of age have been conducted regularly since 1983/84 across an increasingnumber of countries [45,46]. As HBSC focuses on the social context of young people’shealth, health behaviour, well-being, and education, family measures are undoubtedly ofgreat importance. The determination of family structure is one of the key measurementsused since the first HBSC survey. The family structure is assessed based on the child’sown responses, and the methodology for collecting this information has not changedsince 1994. The impact of family structure on adolescent health, well-being, and healthbehaviour has already been highlighted in a number of papers from the HBSC surveydata. The concept of family has been used in more than 100 HBSC scientific papers (see:www.hbsc.org/publications/ (accessed on 1 April 2022)). Comparative studies of familystructure have been conducted by Chapple in 2009 [32] and Låftman in 2010 [10], but thesestudies, despite their age, were limited to single-mother families. Tables and/or graphsshowing family structure by HBSC countries have been presented in the internationalreports for each HBSC survey [47–53]; however, no detailed analysis of family structuretime trends using data of the HBSC study has been performed to date.
Consequently, using the large datasets from HBSC surveys, the present study aimed toanswer the following two questions: (1) how does family structure vary between countriesparticipating in the HBSC, and (2) what time trends in family structure are shown over thethree decades of HBSC study?
2. Materials and Methods2.1. Study Population
In this study, we used data from the HBSC surveys that were conducted in the periodof 1993/1994 (coded as 1994) to 2017/2018 (coded as 2018), which spanned almost threedecades. During this period, seven surveys were conducted every four years. The numberof countries or regions participating in the study increased from 24 (in 1994 [47]) to 45(in 2018 [53]) (hereinafter, the Flemish- and French-speaking regions of Belgium, and theEngland, Scotland, and Wales regions of the United Kingdom were considered individuallyas countries). In all surveys, data collection followed the standard methodology outlined inthe HBSC protocols and included country-representative samples of 11-, 13-, and 15-year-old students. The data were gathered through a self-filled questionnaire administered inschools. A detailed description of the aims, theoretical framework, and survey methodologyof the HBSC study can be found in the study website (www.hbsc.org) (accessed on 22 April2022), international protocols [54], and international reports, which summarized the resultsof each of the seven surveys [47–53]. The data were obtained from the International HBSCData Bank (Bergen University, Bergen, Norway).
The status of the family structure was described, using data from the 45 countries thatparticipated in the HBSC survey in 2018. Since no data on family structure was receivedfrom Azerbaijan, the final list of countries in the present analysis included 44 countries,with a total of 215,875 surveyed students with non-missing responses on family structure.
Time trend analysis was performed using the data of 28 countries in which the surveywas conducted in 1994 (or at least in 1998) and in 2018 (or at least in 2014). Overall,906,235 students of both sexes aged 11, 13, and 15 years were included in this analysis:94,618 students in 1994; 116,173 students in 1998; 128,756 students in 2002; 141,630 studentsin 2006; 136,573 students in 2010; 148,466 students in 2014; and 140,019 students in the 2018study waves.
2.2. Ethics
This study conformed with the principles outlined in the World Medical Associa-tion Declaration of Helsinki. National teams obtained ethical consent from the institu-
Societies 2022, 12, 88 4 of 16
tional ethics committee(s), when required. Parental consent was passive in most coun-tries. Students were informed orally and in writing that participation in HBSC was vol-untary. Students did not provide any personal information (such as name, classroom,teacher) to guarantee the students’ anonymity and to ensure the confidentiality of thepersonal responses.
2.3. Measurements
Family structure. The measure of family structure aimed to gain a full picture of the(sometimes complex) type of families in which children lived [54]. It remained unchangedand mandatory over the study period (1994 to 2018), except for editing the preamble ofthe question. The measure examined the family composition in the main home where thechild lived all the time or most of the time. Following the suggestion of some countries, inthe 2002, 2006, and 2010 surveys, the measurement of family structure was supplementedby an analogous examination of the family composition in the second home, if any (forinstance, among children whose parents were divorced), but such data were not includedin the analysis of the present study. The validity of the question was confirmed in allHBSC surveys, with a strong influence of family structure on adolescent lifestyle andhealth [47–53].
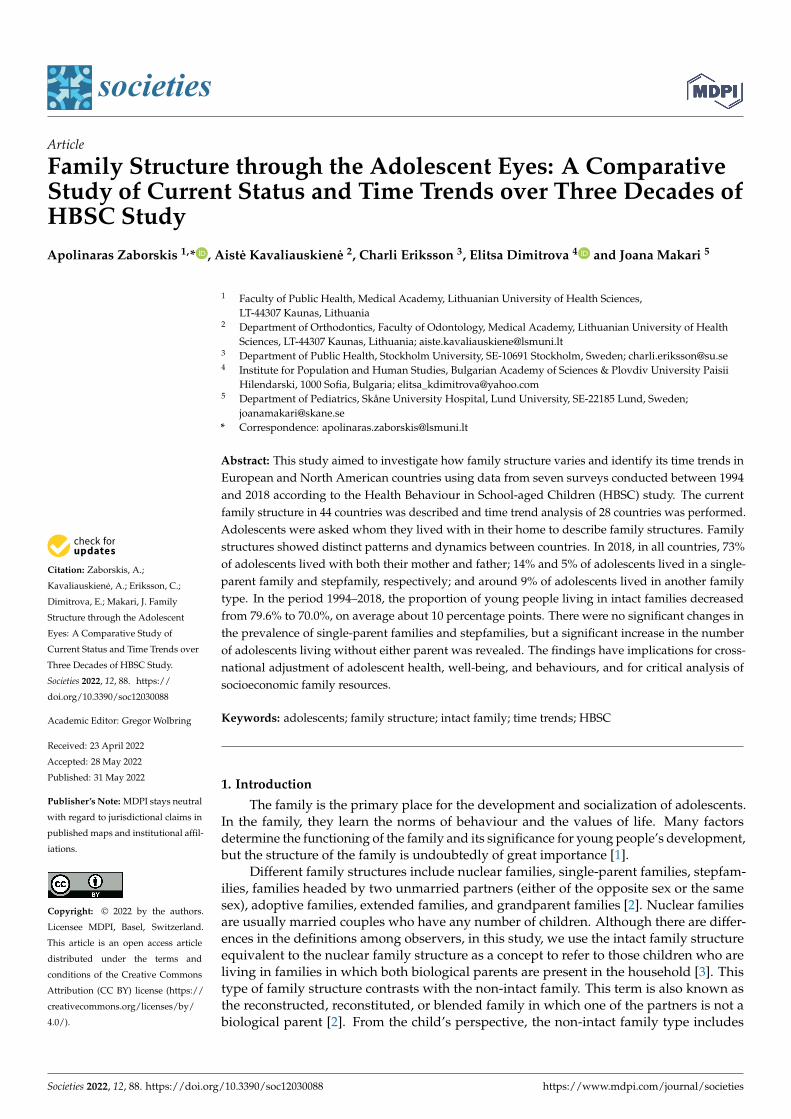
To define the type of family structure, the students were asked to answer a questionof whom they lived with. When choosing the answer “yes” or “no”, they had to indicatewhether they lived with their “mother”, “father”, “stepmother (or father’s girlfriend)”,“stepfather (or mother’s boyfriend)”, “grandmother”, “grandfather”, “I live in a fosterhome or children’s home”, or “I live with someone or somewhere else: please write itdown”. The students who responded that they lived with their “mother” and “father”were defined as living with two biological parents or living in an intact family. Those whoresponded that they lived with their “mother” but not their “father” or “stepfather” weredefined as living with their mother only (single-mother family). In addition to these typesof family structure, four more types were formed, as shown in Figure 1, with a total ofsix types. The group of adolescents living in an “other type” of family structure includedthose who reported living in a foster home or children’s home, living with someone orsomewhere else, living with grandparents, or living in a homosexual family.
Reasons for not living with both parents. This measure was developed with the aim ofidentifying why the teen did not live with both parents. This optional measure has beentested by several countries participating in HBSC. At first, students were asked if theylived with both parents. If the answer was no, then they were asked why. The answeroptions were: 1—parents are divorced; 2—mother/father is dead; 3—mother/father isliving/working far away; 4—never seen father/mother/parents; 5—other reasons.
2.4. Statistical Analysis
The proportions of family structure types were estimated from the HBSC data of eachcountry by the wave of the survey. The aggregated data of all countries was estimated byweighting data by the country’s sample size to ensure that the sample was representative ofthe general population. In the time trend analysis, a z-test with Bonferroni correction wasconducted to estimate the significance of the proportion changes. Associations betweenvariables were assessed using the non-parametric Spearman correlation. A significancelevel was set at p < 0.05. Descriptive analyses were performed with SPSS (version 21.0;SPSS Inc., Chicago, IL, USA, 2012).
Societies 2022, 12, 88 5 of 16Societies 2022, 12, x FOR PEER REVIEW 5 of 18
Figure 1. Flow diagram of the classification of families by the type of structure. Sample size of the
HBSC survey in 2018 is presented. Codes of items: 1 = yes; 2 = no; 9 = missing; Foster—living in
foster home or children’s home; Else—living with someone or somewhere else.
3. Results
3.1. Family Structure in HBSC Countries in 2018
Based on data that was aggregated and weighted by country sample, the percentages
of adolescents who reported living in a certain type of family were estimated (Figure 2).
In contrast to crude data (69.7%, see Figure 1), the weighted data showed that 72.7% of
young people reported living in an intact family, i.e., in a family with both parents. Four-
teen percent of respondents reported that they lived with only one parent, but most of
them lived with their mother. About five percent of the respondents indicated living in
Figure 1. Flow diagram of the classification of families by the type of structure. Sample size of theHBSC survey in 2018 is presented. Codes of items: 1 = yes; 2 = no; 9 = missing; Foster—living infoster home or children’s home; Else—living with someone or somewhere else.
3. Results3.1. Family Structure in HBSC Countries in 2018
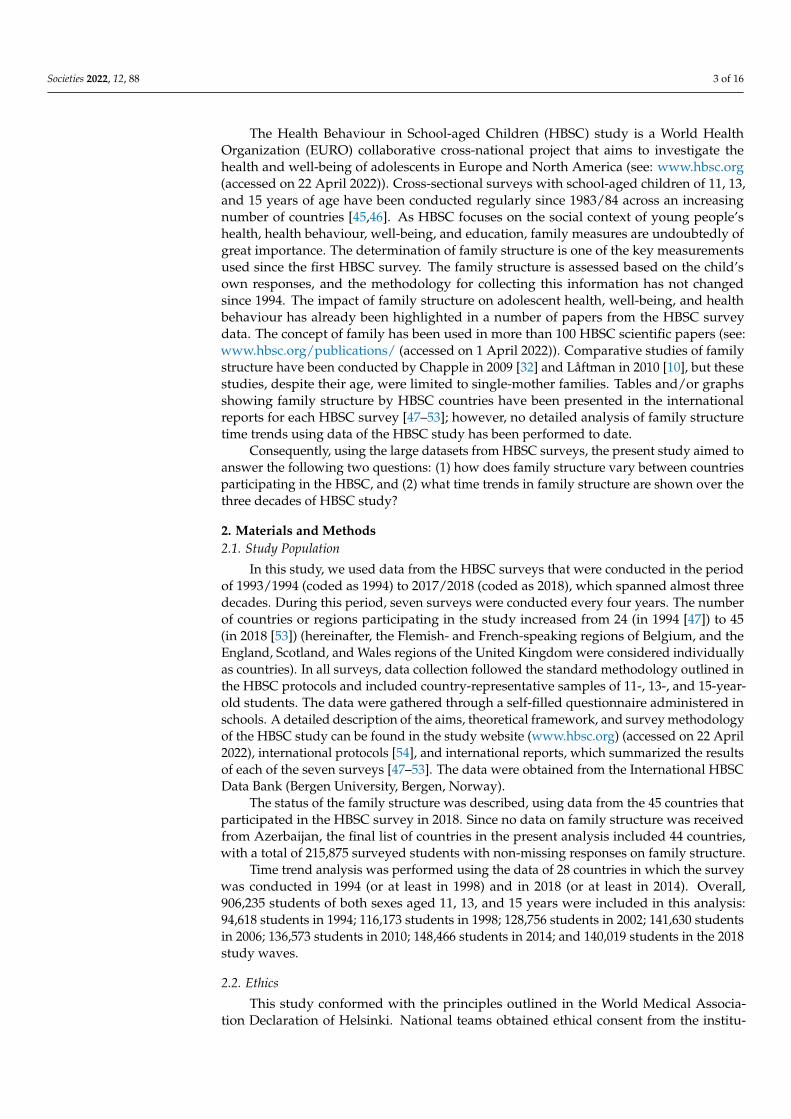
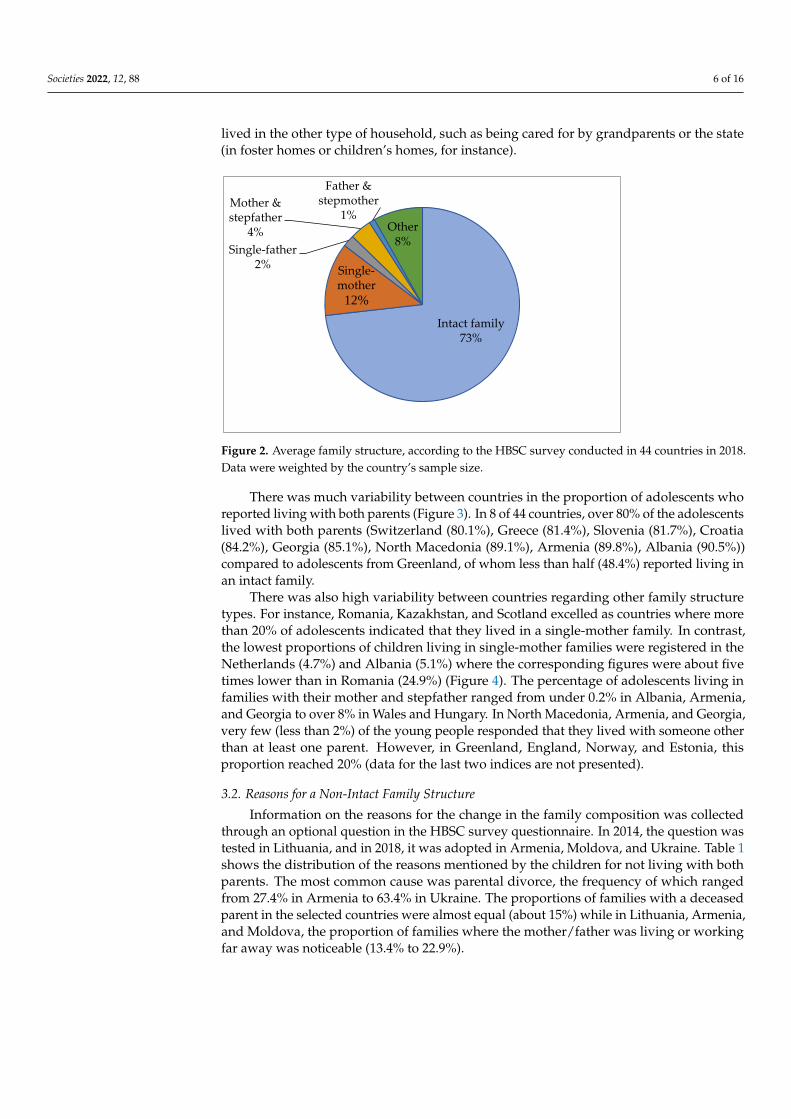
Based on data that was aggregated and weighted by country sample, the percentagesof adolescents who reported living in a certain type of family were estimated (Figure 2). Incontrast to crude data (69.7%, see Figure 1), the weighted data showed that 72.7% of youngpeople reported living in an intact family, i.e., in a family with both parents. Fourteenpercent of respondents reported that they lived with only one parent, but most of them livedwith their mother. About five percent of the respondents indicated living in stepfamilies,mostly in families with the biological mother and stepfather. Eight percent of adolescents
Societies 2022, 12, 88 6 of 16
lived in the other type of household, such as being cared for by grandparents or the state(in foster homes or children’s homes, for instance).
Societies 2022, 12, x FOR PEER REVIEW 6 of 18
stepfamilies, mostly in families with the biological mother and stepfather. Eight percent
of adolescents lived in the other type of household, such as being cared for by grandpar-
ents or the state (in foster homes or children’s homes, for instance).
Figure 2. Average family structure, according to the HBSC survey conducted in 44 countries in 2018.
Data were weighted by the country’s sample size.
There was much variability between countries in the proportion of adolescents who
reported living with both parents (Figure 3). In 8 of 44 countries, over 80% of the adoles-
cents lived with both parents (Switzerland (80.1%), Greece (81.4%), Slovenia (81.7%), Cro-
atia (84.2%), Georgia (85.1%), North Macedonia (89.1%), Armenia (89.8%), Albania
(90.5%)) compared to adolescents from Greenland, of whom less than half (48.4%) re-
ported living in an intact family.
There was also high variability between countries regarding other family structure
types. For instance, Romania, Kazakhstan, and Scotland excelled as countries where more
than 20% of adolescents indicated that they lived in a single-mother family. In contrast,
the lowest proportions of children living in single-mother families were registered in the
Netherlands (4.7%) and Albania (5.1%) where the corresponding figures were about five
times lower than in Romania (24.9%) (Figure 4). The percentage of adolescents living in
families with their mother and stepfather ranged from under 0.2% in Albania, Armenia,
and Georgia to over 8% in Wales and Hungary. In North Macedonia, Armenia, and Geor-
gia, very few (less than 2%) of the young people responded that they lived with someone
other than at least one parent. However, in Greenland, England, Norway, and Estonia,
this proportion reached 20% (data for the last two indices are not presented).
3.2. Reasons for a Non-Intact Family Structure
Information on the reasons for the change in the family composition was collected
through an optional question in the HBSC survey questionnaire. In 2014, the question was
tested in Lithuania, and in 2018, it was adopted in Armenia, Moldova, and Ukraine. Table
1 shows the distribution of the reasons mentioned by the children for not living with both
parents. The most common cause was parental divorce, the frequency of which ranged
from 27.4% in Armenia to 63.4% in Ukraine. The proportions of families with a deceased
parent in the selected countries were almost equal (about 15%) while in Lithuania, Arme-
nia, and Moldova, the proportion of families where the mother/father was living or work-
ing far away was noticeable (13.4% to 22.9%).
Intact family73%
Single-mother
12%
Single-father2%
Mother & stepfather
4%
Father & stepmother
1%Other
8%
Figure 2. Average family structure, according to the HBSC survey conducted in 44 countries in 2018.Data were weighted by the country’s sample size.
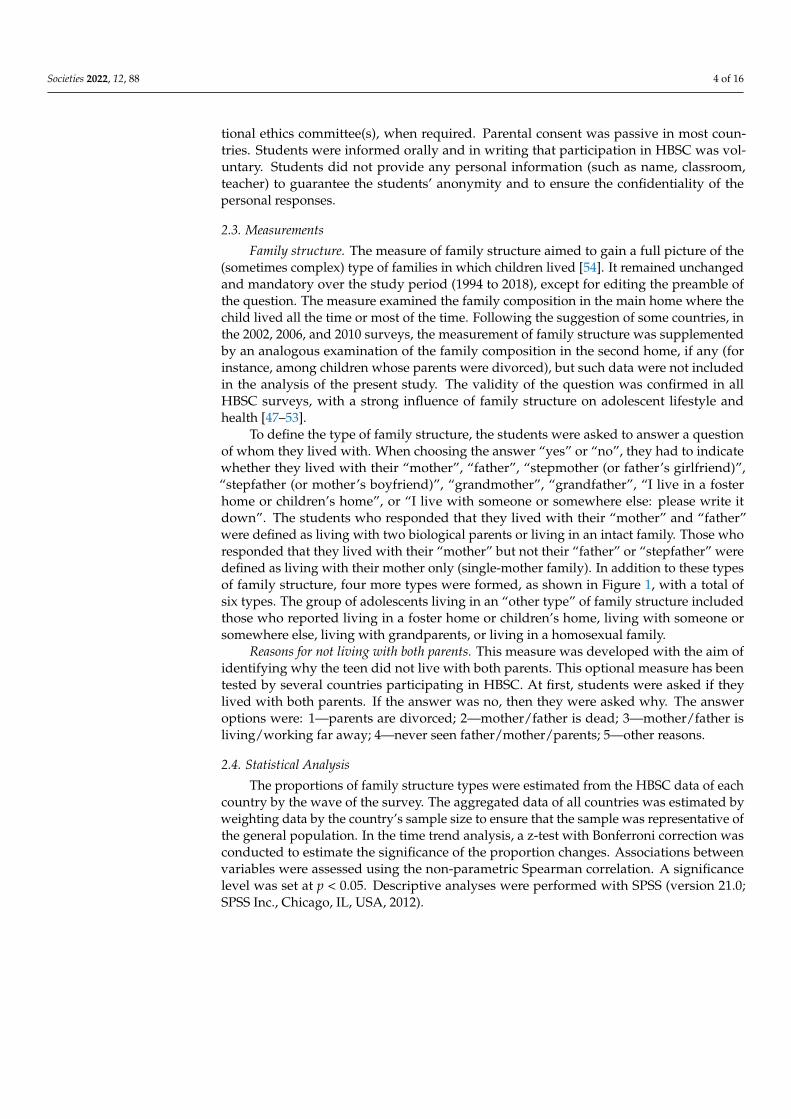
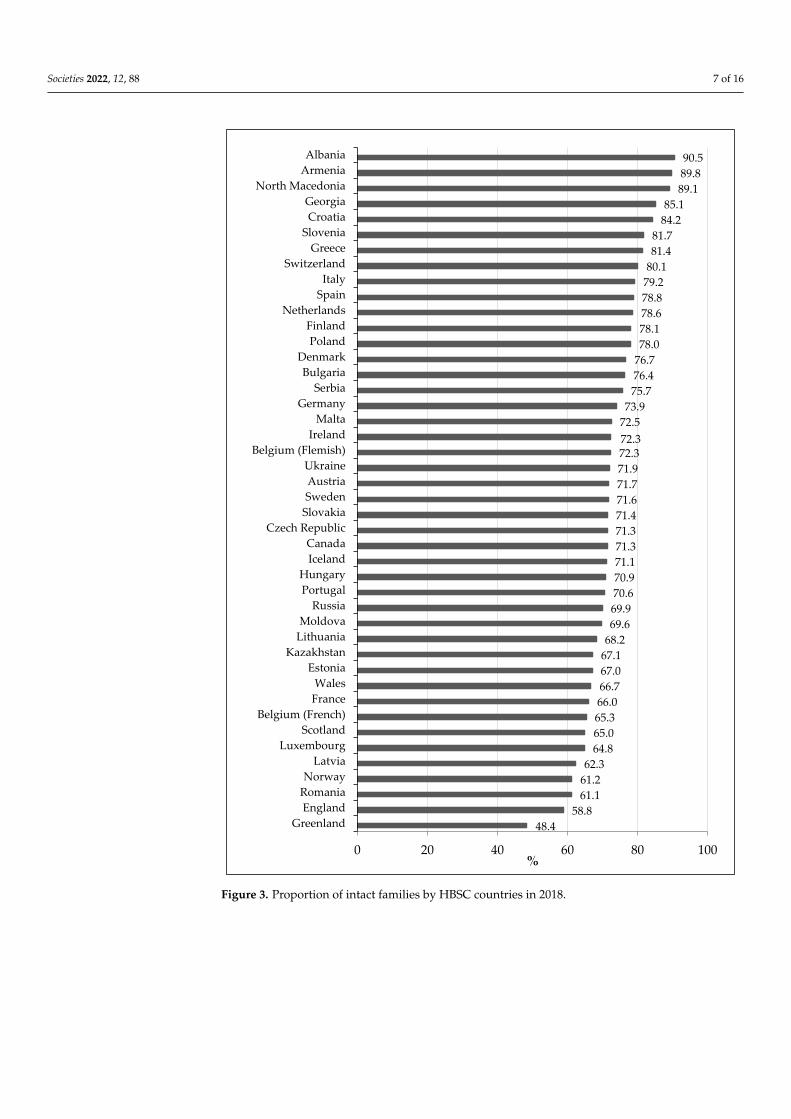
There was much variability between countries in the proportion of adolescents whoreported living with both parents (Figure 3). In 8 of 44 countries, over 80% of the adolescentslived with both parents (Switzerland (80.1%), Greece (81.4%), Slovenia (81.7%), Croatia(84.2%), Georgia (85.1%), North Macedonia (89.1%), Armenia (89.8%), Albania (90.5%))compared to adolescents from Greenland, of whom less than half (48.4%) reported living inan intact family.
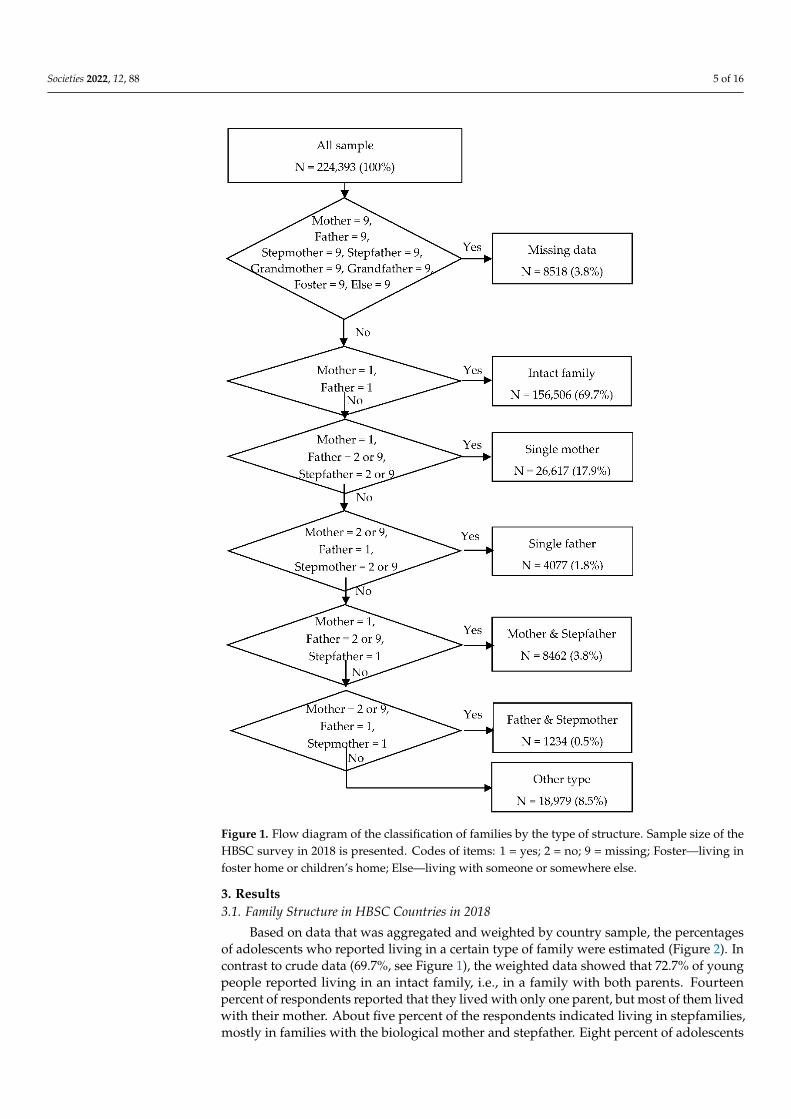
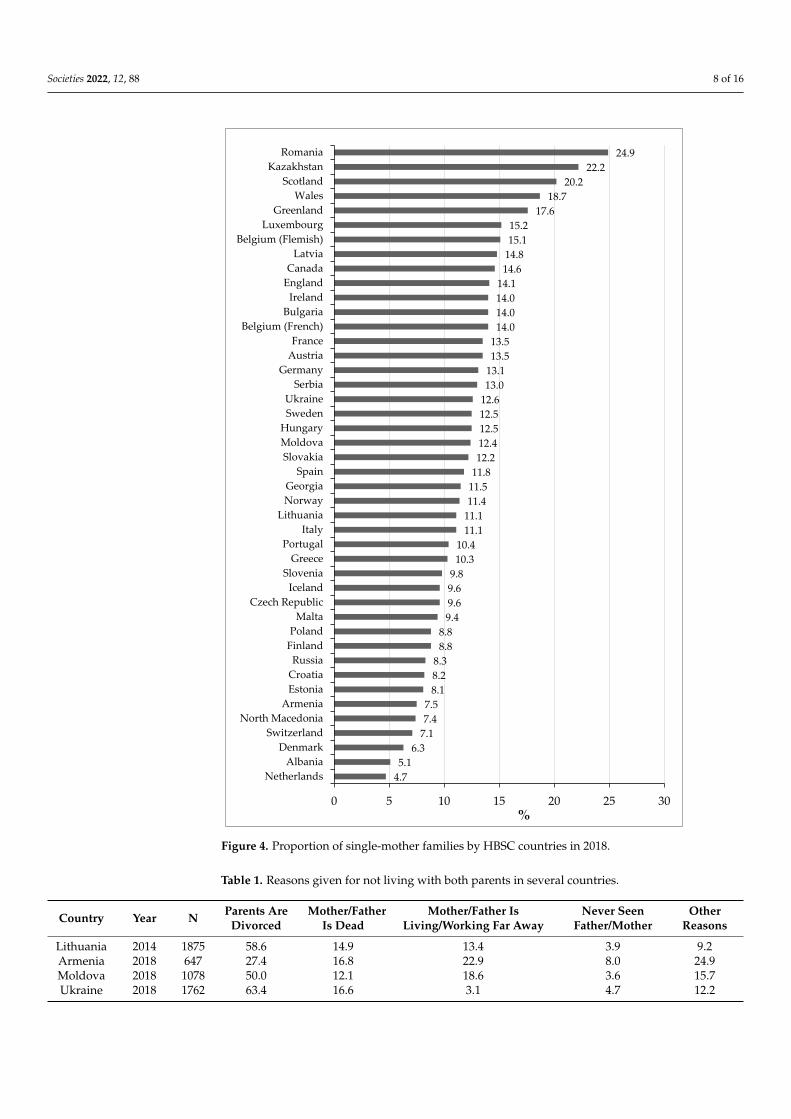
There was also high variability between countries regarding other family structuretypes. For instance, Romania, Kazakhstan, and Scotland excelled as countries where morethan 20% of adolescents indicated that they lived in a single-mother family. In contrast,the lowest proportions of children living in single-mother families were registered in theNetherlands (4.7%) and Albania (5.1%) where the corresponding figures were about fivetimes lower than in Romania (24.9%) (Figure 4). The percentage of adolescents living infamilies with their mother and stepfather ranged from under 0.2% in Albania, Armenia,and Georgia to over 8% in Wales and Hungary. In North Macedonia, Armenia, and Georgia,very few (less than 2%) of the young people responded that they lived with someone otherthan at least one parent. However, in Greenland, England, Norway, and Estonia, thisproportion reached 20% (data for the last two indices are not presented).
3.2. Reasons for a Non-Intact Family Structure
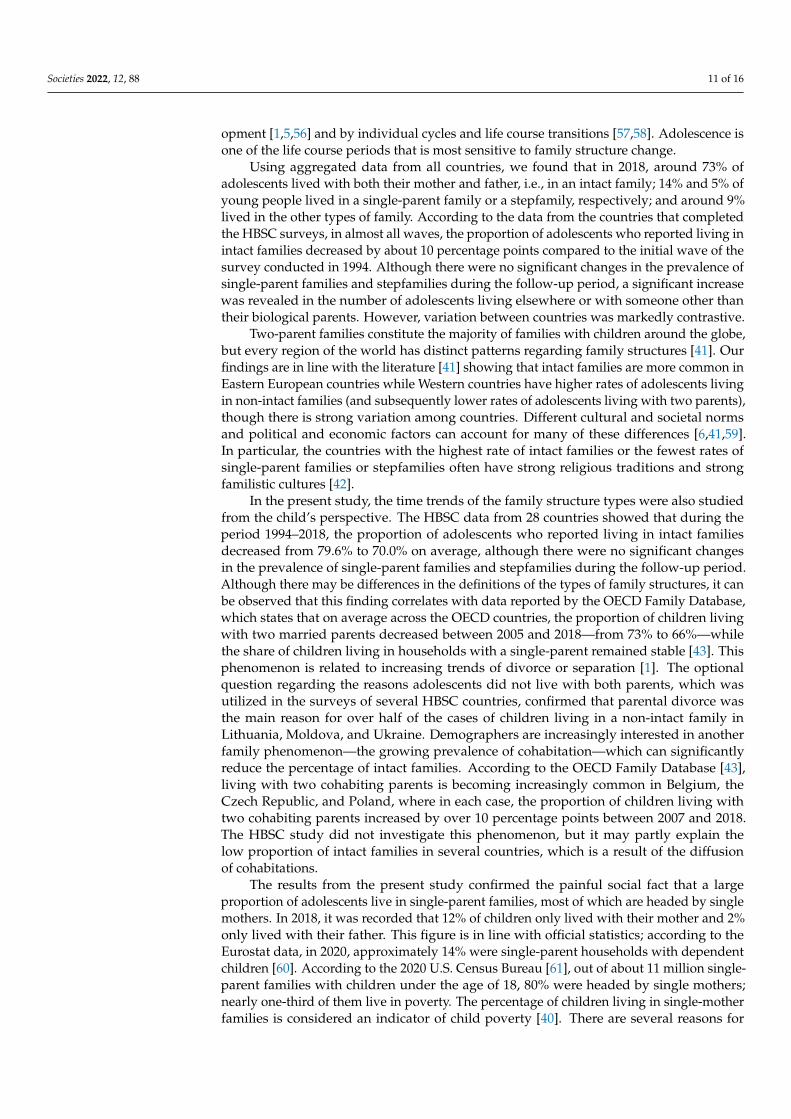
Information on the reasons for the change in the family composition was collectedthrough an optional question in the HBSC survey questionnaire. In 2014, the question wastested in Lithuania, and in 2018, it was adopted in Armenia, Moldova, and Ukraine. Table 1shows the distribution of the reasons mentioned by the children for not living with bothparents. The most common cause was parental divorce, the frequency of which rangedfrom 27.4% in Armenia to 63.4% in Ukraine. The proportions of families with a deceasedparent in the selected countries were almost equal (about 15%) while in Lithuania, Armenia,and Moldova, the proportion of families where the mother/father was living or workingfar away was noticeable (13.4% to 22.9%).
Societies 2022, 12, 88 7 of 16Societies 2022, 12, x FOR PEER REVIEW 7 of 18
Figure 3. Proportion of intact families by HBSC countries in 2018.
48.4
58.8
61.1
61.2
62.3
64.8
65.0
65.3
66.0
66.7
67.0
67.1
68.2
69.6
69.9
70.6
70.9
71.1
71.3
71.3
71.4
71.6
71.7
71.9
72.372.3
72.5
73.9
75.7
76.4
76.7
78.0
78.1
78.6
78.8
79.2
80.1
81.4
81.7
84.2
85.1
89.1
89.8
90.5
0 20 40 60 80 100
Greenland
England
Romania
Norway
Latvia
Luxembourg
Scotland
Belgium (French)
France
Wales
Estonia
Kazakhstan
Lithuania
Moldova
Russia
Portugal
Hungary
Iceland
Canada
Czech Republic
Slovakia
Sweden
Austria
Ukraine
Belgium (Flemish)
Ireland
Malta
Germany
Serbia
Bulgaria
Denmark
Poland
Finland
Netherlands
Spain
Italy
Switzerland
Greece
Slovenia
Croatia
Georgia
North Macedonia
Armenia
Albania
%
Figure 3. Proportion of intact families by HBSC countries in 2018.
Societies 2022, 12, 88 8 of 16Societies 2022, 12, x FOR PEER REVIEW 8 of 18
Figure 4. Proportion of single-mother families by HBSC countries in 2018.
Table 1. Reasons given for not living with both parents in several countries.
Country Year N Parents Are
Divorced
Mother/Father Is
Dead
Mother/Father Is Liv-
ing/Working Far Away
Never Seen Fa-
ther/Mother
Other Rea-
sons
Lithuania 2014 1875 58.6 14.9 13.4 3.9 9.2
Armenia 2018 647 27.4 16.8 22.9 8.0 24.9
Moldova 2018 1078 50.0 12.1 18.6 3.6 15.7
Ukraine 2018 1762 63.4 16.6 3.1 4.7 12.2
4.7
5.1
6.3
7.1
7.4
7.5
8.1
8.2
8.3
8.8
8.8
9.4
9.6
9.6
9.8
10.3
10.4
11.1
11.1
11.4
11.5
11.8
12.2
12.4
12.5
12.5
12.6
13.0
13.1
13.5
13.5
14.0
14.0
14.0
14.1
14.6
14.8
15.1
15.2
17.6
18.7
20.2
22.2
24.9
0 5 10 15 20 25 30
Netherlands
Albania
Denmark
Switzerland
North Macedonia
Armenia
Estonia
Croatia
Russia
Finland
Poland
Malta
Czech Republic
Iceland
Slovenia
Greece
Portugal
Italy
Lithuania
Norway
Georgia
Spain
Slovakia
Moldova
Hungary
Sweden
Ukraine
Serbia
Germany
Austria
France
Belgium (French)
Bulgaria
Ireland
England
Canada
Latvia
Belgium (Flemish)
Luxembourg
Greenland
Wales
Scotland
Kazakhstan
Romania
%
Figure 4. Proportion of single-mother families by HBSC countries in 2018.
Table 1. Reasons given for not living with both parents in several countries.
Country Year N Parents AreDivorced
Mother/FatherIs Dead
Mother/Father IsLiving/Working Far Away
Never SeenFather/Mother
OtherReasons
Lithuania 2014 1875 58.6 14.9 13.4 3.9 9.2Armenia 2018 647 27.4 16.8 22.9 8.0 24.9Moldova 2018 1078 50.0 12.1 18.6 3.6 15.7Ukraine 2018 1762 63.4 16.6 3.1 4.7 12.2

Societies 2022, 12, 88 9 of 16
3.3. Time Trend of Family Structures over 1994–2018
Time trend analysis of family structures was performed using data from 28 countriesin which the HBSC surveys were conducted in 1994 (or 1998) and 2018 (or 2014). The datapresented in Table 2 allow a comparison of the proportions of all types of family structuresbetween the selected survey waves by countries. In all countries, except Denmark andFinland, the proportion of intact families significantly decreased. There was a smallchange in the rank of countries that were sorted by the proportion of intact families, asthe proportions of intact families that were estimated in 1994 (or 1998) and 2018 (or 2014)within selected countries were highly correlated (r = 0.79). In 17 of 28 countries, theproportion of adolescents living in a single-mother significantly increased (the highestincrease was in Belgium (Flemish) and more than doubled to 15.1%) while in the rest of thecountries, the percentage of children living in single-mother families decreased or did notchange significantly.
Table 2. Comparison of the family structure between surveys in 1994 (or 1998) and 2018 (or 2014)across 28 HBSC countries.
Country orRegion
Survey in 1994 (or 1998) Survey in 2018 (or 2014)
Year N BothParents
SingleMother
Mother andStepfather Other Year N Both
ParentsSingleMother
Mother andStepfather Other
Austria 1994 5349 85.2 8.0 3.0 1.8 2018 4032 71.7 * 13.5 * 2.7 10.2 *Belgium(Flemish) 1994 4476 86.0 6.8 4.0 0.6 2018 4034 72.3 * 15.1 * 4.0 4.8 *
Belgium(French) 1994 5196 75.5 10.3 6.3 4.8 2018 4020 65.3 * 14.0 * 5.3 11.9 *
Canada 1994 6699 77.1 11.8 6.3 0.8 2018 12707 71.3 * 14.6 * 5.0 * 5.2 *CzechRepublic 1994 3584 83.8 8.1 5.7 0.7 2018 11070 71.3 * 9.6 * 4.7 * 12.7 *
Denmark 1994 3867 74.8 12.6 8.2 1.1 2018 3073 76.7 6.3 * 1.2 * 14.0 *England 1998 6373 68.2 14.4 11.0 2.9 2018 3397 58.8 * 14.1 3.8 * 21.2 *Estonia 1994 3516 76.2 15.1 6.1 1.1 2018 4725 67.0 * 8.1 * 3.9 * 19.4 *Finland 1994 4181 76.6 12.4 5.8 1.9 2018 3100 78.1 8.8 * 5.8 4.5 *France 1994 3971 81.6 10.0 4.9 1.0 2018 9170 66.0 * 13.5 * 5.8 * 11.4 *Germany 1998 4770 81.1 9.7 5.3 1.4 2018 4061 73.9 * 13.1 * 5.1 5.8 *Greece 1998 4285 91.1 5.6 1.0 1.4 2018 3863 81.4 * 10.3 * 1.4 4.9 *Greenland 1994 1238 57.7 17.9 7.3 11.6 2018 1168 48.4 * 17.6 6.2 21.6 *Hungary 1994 5775 78.5 10.8 5.7 2.9 2018 3748 70.9 * 12.5 * 8.2 * 5.5 *Ireland 1998 4352 86.1 8.1 0.9 3.2 2018 3833 72.3 * 14.0 * 4.1 * 7.9 *Israel 1994 4103 91.5 5.5 1.4 1.0 2014 6104 86.1 * 9.8 * 1.8 0.9Latvia 1994 3774 74.1 15.6 6.7 2.1 2018 4412 62.3 * 14.8 4.3 * 15.7 *Lithuania 1994 5425 82.7 10.9 4.4 1.0 2018 3797 68.2 * 11.1 5.6 * 13.6 *Norway 1994 4920 78.3 10.8 6.6 0.9 2018 3127 61.2 * 11.4 4.5 * 19.3 *Poland 1994 4519 88.4 7.1 2.2 1.1 2018 5164 78.0 * 8.8 * 1.7 10.2 *Portugal 1998 3720 85.4 7.9 2.6 2.5 2018 5655 70.6 * 10.4 * 3.3 13.8 *RussianFederation 1994 4001 75.7 16.6 5.2 1.6 2018 4260 69.9 * 8.3 * 5.0 15.9 *
Scotland 1994 4770 75.8 14.6 4.9 1.7 2018 4773 65.0 * 20.2 * 5.2 7.3 *Slovakia 1994 3402 88.5 7.6 1.9 0.6 2018 3911 71.4 * 12.2 * 4.3 * 9.9 *Spain 1994 4431 90.8 6.2 1.3 0.7 2018 4320 78.8 * 11.8 * 2.2 * 5.6 *Sweden 1994 3570 76.0 11.3 6.5 2.4 2018 4185 71.6 * 12.5 5.1 * 6.5 *Switzerland 1998 3997 83.3 10.4 3.6 1.1 2018 7375 80.1 * 7.1 * 3.6 7.9 *Wales 1994 3851 77.2 12.3 6.3 1.3 2018 13039 66.7 * 18.7 * 8.2 * 3.3 *
Notes: Proportions of adolescents who were living with a single father and living with a father and stepmotherare not presented because they have only a small proportion in the family structure; * p < 0.05 compared with thedata of the survey conducted in 1994 (or 1998).
In all countries, the proportion of the other type of family structure (adolescents livingwith someone other than at least one parent) significantly increased. On average, the shareof such families reached 9.3% while in several countries, such as Greenland and England,that figure was over 20%. Compared with the data of the 1994 HBSC survey, the highestincreases were observed in Norway (18.4%), Estonia (18.3%), Russia (14.3%), Latvia (13.6%),and Lithuania (12.6%).

Societies 2022, 12, 88 10 of 16
Figure 5A shows the time trend of the proportion of intact families over 1994–2018in the 28 countries. In this period, the proportion of families where the adolescent livedwith both parents decreased from 79.6% to 70.0%; thus, the overall decrease was almost10 percentage points. Similarly, Figure 5B shows the time trend of the proportion of familieswhere the adolescent lived with a single mother. Here, it is difficult to notice any regularchange trend. The mean percentage of this type of family structure during the observationperiod was about 12%.
Societies 2022, 12, x FOR PEER REVIEW 9 of 18
3.3. Time Trend of Family Structures over 1994–2018 Time trend analysis of family structures was performed using data from 28 countries
in which the HBSC surveys were conducted in 1994 (or 1998) and 2018 (or 2014). The data presented in Table 2 allow a comparison of the proportions of all types of family structures between the selected survey waves by countries. In all countries, except Denmark and Finland, the proportion of intact families significantly decreased. There was a small change in the rank of countries that were sorted by the proportion of intact families, as the proportions of intact families that were estimated in 1994 (or 1998) and 2018 (or 2014) within selected countries were highly correlated (r = 0.79). In 17 of 28 countries, the pro-portion of adolescents living in a single-mother significantly increased (the highest in-crease was in Belgium (Flemish) and more than doubled to 15.1%) while in the rest of the countries, the percentage of children living in single-mother families decreased or did not change significantly.
In all countries, the proportion of the other type of family structure (adolescents liv-ing with someone other than at least one parent) significantly increased. On average, the share of such families reached 9.3% while in several countries, such as Greenland and England, that figure was over 20%. Compared with the data of the 1994 HBSC survey, the highest increases were observed in Norway (18.4%), Estonia (18.3%), Russia (14.3%), Lat-via (13.6%), and Lithuania (12.6%).
Figure 5A shows the time trend of the proportion of intact families over 1994–2018 in the 28 countries. In this period, the proportion of families where the adolescent lived with both parents decreased from 79.6% to 70.0%; thus, the overall decrease was almost 10 per-centage points. Similarly, Figure 5B shows the time trend of the proportion of families where the adolescent lived with a single mother. Here, it is difficult to notice any regular change trend. The mean percentage of this type of family structure during the observation period was about 12%.
Figure 5. Time trend of the proportion of families where the adolescent lived with both parents (A) and with a single mother (B) over 1994–2018 in 28 HBSC countries (see Table 2), except England, Germany, Greece, Ireland, Portugal, and Wales in 1994; Belgium (French) and Spain in 1998; Slo-vakia in 2002; Israel and Russia in 2010; and Israel in 2018. Vertical bars indicate a standard error.
Figure 5. Time trend of the proportion of families where the adolescent lived with both parents (A)and with a single mother (B) over 1994–2018 in 28 HBSC countries (see Table 2), except England,Germany, Greece, Ireland, Portugal, and Wales in 1994; Belgium (French) and Spain in 1998; Slovakiain 2002; Israel and Russia in 2010; and Israel in 2018. Vertical bars indicate a standard error.
4. Discussion
The present study aimed to answer to the following two questions: (1) how do familystructures vary between countries, and (2) what are the time trends shown in familystructures over the three decades of the HBSC study? Extensive data from the HBSC studyconducted between 1994 and 2018 was used to answer these questions. Over this period,in seven waves of the HBSC survey, adolescents from many countries reported on thecomposition of their family by responding to a question regarding whom they lived with.In contrast with the data from the official statistics, the results of this study are visible“through the eyes of adolescents”, so they reflect the child’s perspective in regard to familystructure. Thus, the present study was conducted in accordance with the UN Conventionon the Rights of the Child, which states that “Children have the right to give their opinionsfreely on issues that affect them. Adults should listen and take children seriously” [55].
Overall, the results of the present study revealed a wide variety of family structures inthe European region and North American countries. The results from the analysis outlinedsignificant shifts in the composition of families over the last three decades. These resultsconfirmed the basic idea that the family is not a closed and static unit but a complex anddynamic system, both affecting and being affected by social, cultural, and historical devel-
Societies 2022, 12, 88 11 of 16
opment [1,5,56] and by individual cycles and life course transitions [57,58]. Adolescence isone of the life course periods that is most sensitive to family structure change.
Using aggregated data from all countries, we found that in 2018, around 73% ofadolescents lived with both their mother and father, i.e., in an intact family; 14% and 5% ofyoung people lived in a single-parent family or a stepfamily, respectively; and around 9%lived in the other types of family. According to the data from the countries that completedthe HBSC surveys, in almost all waves, the proportion of adolescents who reported living inintact families decreased by about 10 percentage points compared to the initial wave of thesurvey conducted in 1994. Although there were no significant changes in the prevalence ofsingle-parent families and stepfamilies during the follow-up period, a significant increasewas revealed in the number of adolescents living elsewhere or with someone other thantheir biological parents. However, variation between countries was markedly contrastive.
Two-parent families constitute the majority of families with children around the globe,but every region of the world has distinct patterns regarding family structures [41]. Ourfindings are in line with the literature [41] showing that intact families are more common inEastern European countries while Western countries have higher rates of adolescents livingin non-intact families (and subsequently lower rates of adolescents living with two parents),though there is strong variation among countries. Different cultural and societal normsand political and economic factors can account for many of these differences [6,41,59].In particular, the countries with the highest rate of intact families or the fewest rates ofsingle-parent families or stepfamilies often have strong religious traditions and strongfamilistic cultures [42].
In the present study, the time trends of the family structure types were also studiedfrom the child’s perspective. The HBSC data from 28 countries showed that during theperiod 1994–2018, the proportion of adolescents who reported living in intact familiesdecreased from 79.6% to 70.0% on average, although there were no significant changesin the prevalence of single-parent families and stepfamilies during the follow-up period.Although there may be differences in the definitions of the types of family structures, it canbe observed that this finding correlates with data reported by the OECD Family Database,which states that on average across the OECD countries, the proportion of children livingwith two married parents decreased between 2005 and 2018—from 73% to 66%—whilethe share of children living in households with a single-parent remained stable [43]. Thisphenomenon is related to increasing trends of divorce or separation [1]. The optionalquestion regarding the reasons adolescents did not live with both parents, which wasutilized in the surveys of several HBSC countries, confirmed that parental divorce wasthe main reason for over half of the cases of children living in a non-intact family inLithuania, Moldova, and Ukraine. Demographers are increasingly interested in anotherfamily phenomenon—the growing prevalence of cohabitation—which can significantlyreduce the percentage of intact families. According to the OECD Family Database [43],living with two cohabiting parents is becoming increasingly common in Belgium, theCzech Republic, and Poland, where in each case, the proportion of children living withtwo cohabiting parents increased by over 10 percentage points between 2007 and 2018.The HBSC study did not investigate this phenomenon, but it may partly explain thelow proportion of intact families in several countries, which is a result of the diffusionof cohabitations.
The results from the present study confirmed the painful social fact that a largeproportion of adolescents live in single-parent families, most of which are headed by singlemothers. In 2018, it was recorded that 12% of children only lived with their mother and 2%only lived with their father. This figure is in line with official statistics; according to theEurostat data, in 2020, approximately 14% were single-parent households with dependentchildren [60]. According to the 2020 U.S. Census Bureau [61], out of about 11 million single-parent families with children under the age of 18, 80% were headed by single mothers;nearly one-third of them live in poverty. The percentage of children living in single-motherfamilies is considered an indicator of child poverty [40]. There are several reasons for
Societies 2022, 12, 88 12 of 16
this. Recent demographic data show that, for example, in the USA, around half (49.5%) ofsingle mothers have never married, almost one-third (29.9%) are divorced, and 20.5% areeither separated or widowed [61]. The share of single-mother families varied considerablyfrom one country to another. To compare the observed variation with data from othersources, we sorted the countries by the values of the proportion of single-mother familiesand compared their rank with analogous ranks found in official statistics. There was asignificant correlation ($ = 0.449, p = 0.010) with the ranking of a subset of 32 countriesfrom the Luxembourg Income Study (LIS) [40], but there was no significant correlation($ = 0.114, p = 0.571) with the ranking of a subset of 27 countries from the European Unionregarding single-parent families but not single-mother families [60].
Studies have focused on the rise of single motherhood in the EU [62] and the USA [61].Over the study period, we observed an increase in single-mother families in 17 of 28 HBSCcountries. However, regarding the data from all countries, the change between the surveyswaves in 1994 and 2018 was not significant. Instead of this change, across all countrieswe observed a significant rise in the proportion of adolescents living in a family of theother structure type. In several countries, such as Greenland and England, this figure wasover 20%. Although the World Family Map (2017) shows that the share of children livingwithout parents is more common in African countries, there is also data on countries in theEuropean region in previous years: for example, 5% in Italy (2014), 5% in Hungary (2001),and 4% in Romania (2004) [41]. So, it is clear that recently, the situation may have changeda lot. This phenomenon is related to the growing incidence of parental divorce and thesubsequent establishment of new family types and living arrangements for young people.For instance, a child may be part of two families, when both biological parents establishnew households after separation. A child may live part of the time with one biologicalparent and the remaining time with the other biological parent [1,49]. It is also the casethat children are often raised by other relatives, either for their own good (e.g., fostered toan aunt who lives near a good school) or for the benefit of their host family (e.g., fosteredin need of domestic labour) [42]. The increasing frequency of births outside of marriage,especially among young women, may also be one of the reasons why there has been anincrease in the share of children who do not live with both biological parents. This mayalso be the case when the child is cared for by grandparents in order to help the parents tocontinue their studies and careers [41].
A specific reason for adolescents living without any of their parents could be that theirparents go to work abroad due to difficult living conditions in their country. At the time ofthe survey (in 2014 and 2018), this phenomenon was more common in countries in EasternEurope [63]. It corresponds to our findings, which showed that the number of adolescentsliving in families without parents has recently increased in Estonia, Latvia, Lithuania, andRussia. An optional question regarding the reasons why adolescents did not live with bothparents also confirmed that a high proportion of adolescents declared that their parentswork far away (it is unfortunate that this question was included in the HBSC survey inonly four countries from Eastern Europe—Lithuania, Armenia, Moldova, and Ukraine).
Communication is a key modality by which the family functions as a protective healthasset for adolescent development [64]. Difficult communication or a complete lack ofcommunication due to the absence of the mother and father increases the probability ofemotional and behavioural problems [65]. For many children whose parents work abroad,“home” means the absence of parents, emotional and psychological distress, and oftenphysical and mental health problems [63,66]. Therefore, it deserves further and moredetailed study.
Strengths and Limitations
One the strengths of the present analysis is that this study provided detailed analysis ofthe HBSC data on the composition of families in the year 2018 in 44 European countries andCanada and a trends analysis of the changes in family structures in 28 countries over thepast three decades. Another strength is that the data was collected from the adolescent’s life
Societies 2022, 12, 88 13 of 16
perspective, making it more suitable for an assessment of adolescent health, well-being, andbehaviour compared to official statistics. This study presents the adolescents’ perspectivesand views on the types of families in which they live, and this has a strong added value toofficial statistics on family compositions and dynamics.
We also hereby acknowledge several limitations of the present study. First, the presentstudy relied only on the adolescents’ self-reported data and these reports may have beensubject to a potential response bias. The question on the composition of the family may havebeen sensitive for children who lived with one parent or with other relatives. For example,using sensitive questions, such as the question regarding with whom the adolescent livedwith, can be affected by the possibility of a social fear bias in young people’s responses.The sensitivity was minimized by an effort to ensure the strict anonymity of respondents.Second, the classification of family structure types may have been a limitation, whichwas based on the adolescents’ responses. For example, some respondents indicated thatthey lived with their mother, father, and stepfather. According to our methodology, theseresponses were classified as an intact family, but it is also likely that the family couple wasalready in the process of separation. Third, the question regarding the reasons why theadolescent did not live with both parents was only asked in four countries participating inthe HBSC study. After all, there was no clarification of the “other family structure”.
5. Conclusions
Over the last three decades, family structures in the European and North Americanregions have shown distinct patterns and changed considerably. The model of the intactfamily has been challenged by the recent trends of increasing family union instability andphysical separation of families due to the emigration of parents or living apart.
The present study demonstrates how the adolescent’s perspective can contributeto better understanding the demographic trends and provide deeper knowledge on thechanging sphere of family and parenthood. Its findings may have implications for cross-national adjustment of adolescent health, well-being, and behaviour by family structure,and for a critical analysis of socioeconomic family resources.
Author Contributions: Conceptualization, A.Z.; methodology, A.Z., C.E. and E.D.; software, A.Z.;validation, A.Z. and C.E.; formal analysis, A.K.; investigation, A.Z., C.E., E.D. and J.M.; writing—original draft prep-aration, A.K.; writing—review and editing, C.E. and E.D.; visualization, A.Z.and J.M.; supervi-sion, A.Z.; project administration, A.Z. All authors have read and agreed to thepublished version of the manuscript.
Funding: This research received no external funding. The data collection for the HBSC data wasfunded at the national level in each country.
Institutional Review Board Statement: The study was conducted in accordance with the Declarationof Helsinki. Each country obtained approval to conduct the survey from the ethics review board orequivalent regulatory body asso-ciated with their institution. Surveys at school were authorized bynational, regional, and school authorities.
Informed Consent Statement: Informed consent was obtained from all participants, their parents,and the school administrators included in the study. Participation was voluntary and confidential.The article does not present neither individual- nor school-level data.
Data Availability Statement: The data presented in this study are available on reasonable requestfrom the HBSC Data Man-agement Centre, University of Bergen, Norway ([email protected]).
Acknowledgments: This study used survey data collected in the Health Behaviour in School-agedChildren (HBSC) study during period of 1994–2018. The HBSC study is an internationally com-parative study carried out in collaboration with WHO/EURO. The international coordinator of the2017/18 study was A complete list of participating countries and researchers is available on the HBSCwebsite (http://www.hbsc.org accessed on 22 April 2022).
Conflicts of Interest: The authors declare no conflict of interest.
Societies 2022, 12, 88 14 of 16
References1. Gerhardt, C.E. Chapter 1. Family Dynamics: Setting Families in Motion. In Families in Motion: Dynamics in Diverse Contexts,
1st ed.; SAGE Publications, Inc.: New York, NY, USA, 2020; pp. 3–23. Available online: https://us.sagepub.com/sites/default/files/upm-assets/109149_book_item_109149.pdf (accessed on 1 April 2022).
2. Benokraitis, N.; Buehler, C. Marriages and Families: Changes, Choices, and Constraints, 9th ed.; Pearson Education, Inc.: Boston, MA,USA, 2019.
3. Blackwell, D.L. Family structure and children’s health in the United States: Findings from the National Health Interview Survey,2001–2007. In Vital and Health Statistics; Series 10; National Health Survey: Singapore, 2010; Volume 246, pp. 1–166.
4. Anderson, J. The impact of family structure on the health of children: Effects of divorce. Linacre Q. 2014, 81, 378–387. [CrossRef][PubMed]
5. Oláh, L.S. Changing families in the European Union: Trends and Policy implications. Families and Societies. Working Paper Series.2015. Available online: http://www.familiesandsocieties.eu/wp-content/uploads/2015/09/WP44Olah2015.pdf (accessed on 1April 2022).
6. Farris, D.N.; Bourque, A.J.J. (Eds.) International Handbook on the Demography of Marriage and the Family; Springer Nature SwitzerlandAG: Cham, Switzerland, 2020.
7. Jensen, T.; Sanner, C. A scoping review of research on well-being across diverse family structures: Rethinking approaches forunderstanding contemporary families. J. Fam. Theory Rev. 2021, 13, 463–495. [CrossRef]
8. Carlson, M.J.; Corcoran, M.E. Family structure and children’s behavioral and cognitive outcomes. J. Marriage Fam. 2001, 63,779–792. [CrossRef]
9. Jeynes, W. Divorce, Family Structure, and the Academic Success of Children; Routledge, Taylor & Francis Group: London, UK;New York, NY, USA, 2002.
10. Låftman, S.B. Family Structure and Children’s Living Conditions. A Comparative Study of 24 Countries. Child Indic. Res. 2010, 3,127–147. [CrossRef]
11. Sun, Y.; Li, Y. Effects of Family Structure Type and Stability on Children’s Academic Performance Trajectories. J. Marriage Fam.2011, 73, 541–556. [CrossRef]
12. Langton, C.E.; Berger, L.M. Family Structure and Adolescent Physical Health, Behavior, and Emotional Well-Being. Soc. Serv. Rev.2011, 85, 323–357. [CrossRef]
13. Hadfield, K.; Amos, M.; Gosselin, J.; Unger, M.; Gosselin, J.; Ganong, L.H. Do Changes to Family Structure Affect Child andFamily Outcomes? A Systematic Review of the Instability Hypothesis. J. Fam. Theory Rev. 2018, 10, 87–110. [CrossRef]
14. Granado Alcón, M.C.; Pedersen, J.M. Family as a child development context and smoking behaviour among schoolchildren inGreenland. Int. J. Circumpolar Health 2001, 60, 52–63. [CrossRef]
15. del Carmen, M.; Alcón, G.; Pedersen, J.M.; María, A.; González, C. Greenlandic family structure and communications withparents: Influences on schoolchildren’s drinking behaviour. Int. J. Circumpolar Health 2002, 61, 319–331. [CrossRef]
16. Hetherington, E.M. Social Support and the Adjustment of Children in Divorced and Remarried Families. Childhood 2003, 10,217–236. [CrossRef]
17. Amato, P.R. The impact of family formation changes the cognitive, social, and emotional well-being of the next generation. FutureChild Fall 2005, 15, 75–96. [CrossRef] [PubMed]
18. Lenciauskiene, I.; Zaborskis, A. The effects of family structure, parent–child relationship and parental monitoring on early sexualbehaviour among adolescents in nine European countries. Scand. J. Public Health 2008, 36, 607–618. [CrossRef] [PubMed]
19. Zaborskis, A.; Sirvyte, D.; Zemaitiene, N. Prevalence and familial predictors of suicidal behaviour among adolescents in Lithuania:A cross-sectional survey 2014. BMC Public Health 2016, 16, 554. [CrossRef] [PubMed]
20. Susukida, R.; Wilcox, H.C.; Mendelson, T. The association of lifetime suicidal ideation with perceived parental love and familystructure in childhood in a nationally representative adult sample. Psychiatry Res. 2016, 237, 246–251. [CrossRef] [PubMed]
21. Zaborskis, A.; Sirvyte, D. Familial determinants of current smoking among adolescents of Lithuania: A cross-sectional survey2014. BMC Public Health 2015, 15, 889. [CrossRef]
22. Šumskas, L.; Zaborskis, A. Family Social Environment and Parenting Predictors of Alcohol Use among Adolescents in Lithuania.Int. J. Environ. Res. Public Health 2017, 14, 1037. [CrossRef]
23. Park, H.; Lee, K.S. The association of family structure with health behavior, mental health, and perceived academic achievementamong adolescents: A 2018 Korean nationally representative survey. BMC Public Health 2020, 20, 510. [CrossRef]
24. Langøy, A.; Smith, O.R.F.; Wold, B.; Samdal, O.; Haug, E.M. Associations between family structure and young people’s physicalactivity and screen time behaviors. BMC Public Health 2019, 19, 433. [CrossRef]
25. Zaborskis, A.; Grincaite, M.; Kavaliauskiene, A.; Tesler, R. Family structure and affluence in adolescent eating behaviour: Across-national study in forty-one countries. Public Health Nutr. 2021, 24, 2521–2532. [CrossRef]
26. Fismen, A.S.; Smith, O.R.F.; Samdal, O.; Helleve, A.; Haug, E. Associations between family structure and adolescents’ food habits.Public Health Nutr. 2022, 25, 702–709. [CrossRef]
27. Chen, A.Y.; Escarce, J.J. Family structure and childhood obesity: An analysis through 8th grade. Matern Child Health J. 2014, 18,1772–1777. [CrossRef] [PubMed]
28. Duriancik, D.M.; Goff, C.R. Children of single-parent households are at a higher risk of obesity: A systematic review. J. ChildHealth Care 2019, 23, 358–369. [CrossRef] [PubMed]
Societies 2022, 12, 88 15 of 16
29. Levin, K.A.; Currie, C. Family structure, mother–child communication, father–child communication, and adolescent life satisfac-tion: A cross-sectional multilevel analysis. Health Educ. 2010, 110, 152–168. [CrossRef]
30. Levin, K.A.; Dallago, L.; Currie, C. The association between adolescent life satisfaction, family structure, family affluence andgender differences in parent–child communication. Soc. Indic. Res. 2012, 106, 287–305. [CrossRef]
31. Bjarnason, T.; Arnarsson, A.M. Joint physical custody and communication with parents: A cross-national study of children in 36Western countries. J. Comp. Fam. Stud. 2011, 42, 871–890. [CrossRef]
32. Chapple, S. Child Well-Being and Sole-Parent Family Structure in the OECD: An Analysis, OECD Social, Employment and MigrationWorking Papers; No. 82; OECD Publishing: Paris, France, 2009; Available online: https://library.bsl.org.au/jspui/bitstream/1/1061/1/Child%20well-being%20and%20sole%20parent%20family%20structure.pdf (accessed on 1 April 2022).
33. Paclikova, K.; Dankulincova Veselska, Z.; Filakovska Bobakova, D.; Palfiova, M.; Madarasova Geckova, A. What role do familycomposition and functioning play in emotional and behavioral problems among adolescent boys and girls? Int. J. Public Health2019, 64, 209–221. [CrossRef] [PubMed]
34. Rattay, P.; von der Lippe, E.; Mauz, E.; Richter, F.; Hölling, H.; Lange, C.; Lampert, T. Health and health risk behaviour ofadolescents-Differences according to family structure. Results of the German KiGGS cohort study. PLoS ONE 2018, 13, e0192968.[CrossRef]
35. Hagquist, C. Family residency and psychosomatic problems among adolescents in Sweden: The impact of child-parent relations.Scand. J. Public Health 2016, 44, 36–46. [CrossRef]
36. Carlsund, Å.; Eriksson, U.; Sellström, E. Shared physical custody after family split-up: Implications for health and well-being inSwedish schoolchildren. Acta Paediatr. 2013, 102, 318–323. [CrossRef]
37. Steinbach, A. Children’s and Parents’ Well-Being in Joint Physical Custody: A Literature Review. Fam. Process 2019, 58, 353–369.[CrossRef]
38. Yang, F.; Tan, K.-A.; Cheng, W.J.Y. The effects of connectedness on health-promoting and health-compromising behaviors inadolescents: Evidence from a statewide survey. J. Prim. Prev. 2013, 35, 33–46. [CrossRef] [PubMed]
39. Barnett, M.A. Economic disadvantage in complex family systems: Expansion of family stress models. Clin. Child Fam. Psychol.Rev. 2008, 11, 145–161. [CrossRef] [PubMed]
40. LIS. Luxembourg Income Study. Key Figures. 2022. Available online: https://www.lisdatacenter.org/lis-ikf-webapp/app/search-ikf-figures (accessed on 1 April 2022).
41. World Family Map 2017. Mapping Family Changes and Child Well-Being Outcomes. Essay: The Cohabitation-Go-Round: Cohab-itation and Family Instability Across the Globe. An International Report from Institute for Family Studies and Weatley Institution.New York, Barcelona. 2017. Available online: https://worldfamilymap.ifstudies.org/2017/files/WFM-2017-FullReport.pdf(accessed on 1 April 2022).
42. World Family Map 2019. Mapping Family Changes and Child Well-Being Outcomes. Essay: The Ties That Bind: Is Faith a GlobalForce for Good or Ill in the Family? An International Report from Institute for Family Studies and Weatley Institution. New York,Barcelona. 2019. Available online: https://ifstudies.org/ifs-admin/resources/reports/worldfamilymap-2019-051819final.pdf(accessed on 1 April 2022).
43. OECD Family Database. SF1.2: Children in Families. OECD-Social Policy Division-Directorate of Employment, Labour and SocialAffairs. Website, Updated on February 2020. Available online: https://www.oecd.org/els/soc/SF_1_2_Children_in_families.pdf(accessed on 1 April 2022).
44. Andersson, G. Children’s experience of family disruption and family formation: Evidence from 16 FFS countries. Demogr. Res.2002, 7, 343–363. [CrossRef]
45. Roberts, C.; Currie, C.; Samdal, O.; Currie, D.; Smith, R.; Maes, L. Measuring the health and health behaviours of adolescentsthrough cross-national survey research: Recent developments in the Health Behaviour in School-aged Children (HBSC) Study. J.Public Health 2007, 15, 179–186. [CrossRef]
46. Moor, I.; Winter, K.; Bilz, L.; Bucksch, J.; Finne, E.; John, N.; Kolip, P.; Paulsen, L.; Ravens-Sieberer, U.; Schlattmann, M.; et al. The2017/18 Health Behaviour in School-aged Children (HBSC) study–Methodology of the World Health Organization’s child andadolescent health study. J. Health Monit. 2020, 5, 88–102. [CrossRef]
47. King, A.; Wold, B.; Tudor-Smith, C.; Harel, Y. (Eds.) The Health of Youth: A Cross-National Survey; European Series No. 69; WHORegional Publications: Copenhagen, Denmark, 1996; Available online: http://www.hbsc.org/documents/The%20Health%20of%20Youth%20A%20cross-national%20survey.pdf (accessed on 1 April 2022).
48. Currie, C.; Hurrelmann, K.; Settertobulte, W.; Smith, R.; Todd, J. (Eds.) Health and Health Behaviour among Young People (HealthPolicy for Children and Adolescents, Issue 1, International Report); WHO Regional Office for Europe: Copenhagen, Denmark, 2000;Available online: https://www.euro.who.int/__data/assets/pdf_file/0006/119571/E67880.pdf (accessed on 1 April 2022).
49. Currie, C.; Roberts, C.; Morgan, A.; Smith, R.; Settertobulte, W.; Samdal, O.; Barnekow Rasmussen, V. (Eds.) Young People’s Healthin Context; International Report from the HBSC 2001/02 Survey, (Health Policy for Children and Adolescents, No. 4); WHORegional Office for Europe: Copenhagen, Denmark, 2004; Available online: https://www.euro.who.int/__data/assets/pdf_file/0008/110231/e82923.pdf (accessed on 1 April 2022).
Societies 2022, 12, 88 16 of 16
50. Currie, C.; Nic Gabhainn, S.; Godeau, E.; Roberts, C.; Smith, R.; Currie, D.; Pickett, W.; Richter, M.; Morgan, A.; Barnekow, V.(Eds.) Inequalities in Young People’s Health; HBSC International Report from the 2005/06 Survey; Health Policy for Children andAdolescents, No. 5; WHO Regional Office for Europe: Copenhagen, Denmark, 2008; Available online: https://www.euro.who.int/__data/assets/pdf_file/0005/53852/E91416.pdf (accessed on 1 April 2022).
51. Currie, C.; Zanotti, C.; Morgan, A.; Currie, D.; de Looze, M.; Roberts, C.; Samdal, O.; Smith, O.R.F.; Barnekow, V. (Eds.)Social Determinants of Health and Well-Being among Young People; Health Behaviour in School-Aged Children (HBSC) Study:International Report from the 2009/2010 Survey, (Health Policy for Children and Adolescents, No. 6); WHO Regional Officefor Europe: Copenhagen, Denmark, 2012; Available online: https://www.euro.who.int/__data/assets/pdf_file/0003/163857/Social-determinants-of-health-and-well-being-among-young-people.pdf (accessed on 1 April 2022).
52. Inchley, J.; Currie, D.; Young, T.; Samdal, O.; Torsheim, T.; Augustson, L.; Mathison, F.; Aleman-Diaz, A.; Molcho, M.; Weber, M.;et al. (Eds.) Growing Up Unequal: Gender and Socioeconomic Differences in Young People’s Health and Well-Being; Health Behaviourin School-Aged Children (HBSC) Study: International Report from the 2013/2014 Survey, (Health Policy for Children andAdolescents, No. 7); WHO Regional Office for Europe: Copenhagen, Denmark, 2016; Available online: https://www.euro.who.int/__data/assets/pdf_file/0003/303438/HSBC-No.7-Growing-up-unequal-Full-Report.pdf (accessed on 1 April 2022).
53. Inchley, J.; Currie, D.; Budisavljevic, S.; Torsheim, T.; Jåstad, A.; Cosma, A.; Kelly, C.; Arnarsson, A.M. (Eds.) Spotlight on AdolescentHealth and Well-Being; Findings from the 2017/2018 Health Behaviour in School-Aged Children (HBSC) Survey in Europe andCanada. International Report. Volume 1. Key Findings, Licence: CC BY-NC-SA 3.0 IGO; WHO Regional Office for Europe:Copenhagen, Denmark, 2020; Available online: https://apps.who.int/iris/bitstream/handle/10665/332091/9789289055000-eng.pdf (accessed on 1 April 2022).
54. Currie, C.; Inchley, J.; Molcho, M.; Lenzi, M.; Veselska, Z.; Wild, F. Health Behaviour in School-Aged Children (HBSC) StudyProtocol: Background, Methodology, and Mandatory Items for the 2013/14 Survey. St Andrews: CAHRU. 2014. Available online:https://drive.google.com/file/d/1FZ8c2Xa_FcZ5Yx5gPXkPtlbV545NKhnx/view (accessed on 1 April 2022).
55. United Nation. Convention of the Rights of the Child. 1989. Available online: https://www.ohchr.org/en/instruments-mechanisms/instruments/convention-rights-child (accessed on 1 April 2022).
56. OECD. Doing Better for Families; OECD Publishing: Paris, France, 2011; Available online: https://www.oecd.org/social/soc/doingbetterforfamilies.htm (accessed on 1 April 2022).
57. Cowan, P.A.; Hetherington, M. (Eds.) Family Transitions; Laurence Erlbaum Associates: Hillsdale, NJ, USA, 1991.58. Steinberg, L. The family at adolescence: Transition and transformation. J. Adolesc. Health 2000, 27, 170–178. [CrossRef]59. Lamanna, M.A.; Riedmann, A.; Stewwart, S. Marriages, Families, and Relationships: Making Choices in a Diverse Society, 13th ed.;
Cengage Learning: Boston, MA, USA, 2018.60. Eurostat. People in the EU: Who Are We and How Do We live? 2015th ed.; Eurostat Statistical Books: Luxembourg, 2015; Available
online: https://doi.org/10.2785/406462 (accessed on 1 April 2022).61. U.S. Census Bureau. Single Mother Statistics. 2021. Available online: https://singlemotherguide.com/single-mother-statistics/
(accessed on 1 April 2022).62. Heine, S. The Rise of Single Motherhood in the EU: Analysis and Propositions. European Policy Brief. EGMONT Royal Institute
for International Relations, No. 42. 2016. Available online: https://aei.pitt.edu/74547/1/42.pdf (accessed on 1 April 2022).63. Yanovich, L. Children Left Behind: The Impact of Labor Migration in Moldova and Ukraine. Migration Information Source. 2015.
Available online: https://www.migrationpolicy.org/article/children-left-behind-impact-labor-migration-moldova-and-ukraine(accessed on 1 April 2022).
64. Brooks, F.; Zaborskis, A.; Tabak, I.; Alcón, M.D.; Zemaitiene, N.; de Roos, S.; Klemera, E. Trends in adolescents’ perceived parentalcommunication across 32 countries in Europe and North America from 2002 to 2010. Eur. J. Public Health 2015, 25 (Suppl. 2),46–50. [CrossRef]
65. Rebicova, M.L.; Veselska, Z.D.; Husarova, D.; Klein, D.; Geckova, A.M.; van Dijk, J.P.; Reijneveld, S.A. Does family communicationmoderate the association between adverse childhood experiences and emotional and behavioural problems? BMC Public Health2020, 20, 1–7. [CrossRef]
66. Botezat, A. Parental Migration and the Children Left Behind; Bold: Jacobs Fundation: Zürich, Switzerland, 2018; Available online:https://bold.expert/parental-migration-and-the-children-left-behind/ (accessed on 1 April 2022).
Related Documents


