Familiarity Breeds Investment Gur Huberman Columbia University Shareholders of a Regional Bell Operating Company (RBOC) tend to live in the area which it serves, and an RBOC’s customers tend to hold its shares rather than other RBOCs’ equity. The geographic bias of the RBOC investors is closely related to the general tendency of households’ portfolios to be concentrated, of employees’ tendency to own their employers’ stocks in their retirement accounts, and to the home country bias in the international arena. Together, these phenomena provide compeling evidence that people invest in the familiar while often ignoring the principles of portfolio theory. Traditional economic models posit investors who have beliefs about future payoffs of assets. Each investor selects his portfolio so as to maximize the expected utility of the portfolio’s payoff. Investors’ aversion to risk implies that their portfolios should be diversified. In particular, they will greatly ben- efit from international diversification. Nonetheless, people tend to ignore this advice: by and large, investors’ money stays in their home countries. Kang and Stulz (1997) observe: “Many Financial Economists have noticed that even though the barriers to international investment have fallen dramatically, foreign ownership of shares is still extremely limited and much smaller than one would expect in the absence of barriers to international investment.” An article in the Economist (1996), “Stay-at-Home Shareholders,” concludes: “It appears, therefore, that foreign investment has been hampered, at least until recently, by many of the factors that common sense would suggest: capital controls, opaque markets, and the high cost for fund managers of setting up overseas. In the past few years, these barriers have been falling—especially in emerging markets, where the gains from diversifying are biggest. So investors should soon start gobbling up foreign shares in record numbers. If they do not, economists may have to diversify into other theories.” This article offers a novel explanation of the home country bias: people simply prefer to invest in the familiar. People root for the home team, and feel comfortable investing their money in a business that is visible to them. Paucity of international diversification is only one of the implications of this tendency to invest in the familiar. I am grateful to the referees, Ravi Jagannathan (the editor), Yakov Amihud, Maya Bar-Hillel, Joshua Coval, Frank Edwards, Joseph Even, Paul Granatstein, William Gentry, Larry Glosten, Sean Hanna, Laurie Hodrick, Josef Lakonishok, Ariel Rubinstein, Richard Thaler, William Schwert, Eldar Shafir, and Jason Zweig for useful conversations and to Lipper Analytical Services for data on Texas municipal bond funds. Address correspondence to Gur Huberman, 807 Uris Hall, Columbia University, 3022 Broadway, New York, NY 10027, or e-mail: [email protected]. The Review of Financial Studies Fall 2001 Vol. 14, No. 3, pp. 659–680 © 2001 The Society for Financial Studies

Welcome message from author
This document is posted to help you gain knowledge. Please leave a comment to let me know what you think about it! Share it to your friends and learn new things together.
Transcript
Familiarity Breeds Investment
Gur HubermanColumbia University
Shareholders of a Regional Bell Operating Company (RBOC) tend to live in the areawhich it serves, and an RBOC’s customers tend to hold its shares rather than otherRBOCs’ equity. The geographic bias of the RBOC investors is closely related to thegeneral tendency of households’ portfolios to be concentrated, of employees’ tendency toown their employers’ stocks in their retirement accounts, and to the home country biasin the international arena. Together, these phenomena provide compeling evidence thatpeople invest in the familiar while often ignoring the principles of portfolio theory.
Traditional economic models posit investors who have beliefs about futurepayoffs of assets. Each investor selects his portfolio so as to maximize theexpected utility of the portfolio’s payoff. Investors’ aversion to risk impliesthat their portfolios should be diversified. In particular, they will greatly ben-efit from international diversification. Nonetheless, people tend to ignore thisadvice: by and large, investors’ money stays in their home countries. Kangand Stulz (1997) observe: “Many Financial Economists have noticed thateven though the barriers to international investment have fallen dramatically,foreign ownership of shares is still extremely limited and much smaller thanone would expect in the absence of barriers to international investment.” Anarticle in the Economist (1996), “Stay-at-Home Shareholders,” concludes: “Itappears, therefore, that foreign investment has been hampered, at least untilrecently, by many of the factors that common sense would suggest: capitalcontrols, opaque markets, and the high cost for fund managers of setting upoverseas. In the past few years, these barriers have been falling—especially inemerging markets, where the gains from diversifying are biggest. So investorsshould soon start gobbling up foreign shares in record numbers. If they donot, economists may have to diversify into other theories.”
This article offers a novel explanation of the home country bias: peoplesimply prefer to invest in the familiar. People root for the home team, andfeel comfortable investing their money in a business that is visible to them.Paucity of international diversification is only one of the implications of thistendency to invest in the familiar.
I am grateful to the referees, Ravi Jagannathan (the editor), Yakov Amihud, Maya Bar-Hillel, Joshua Coval,Frank Edwards, Joseph Even, Paul Granatstein, William Gentry, Larry Glosten, Sean Hanna, Laurie Hodrick,Josef Lakonishok, Ariel Rubinstein, Richard Thaler, William Schwert, Eldar Shafir, and Jason Zweig foruseful conversations and to Lipper Analytical Services for data on Texas municipal bond funds. Addresscorrespondence to Gur Huberman, 807 Uris Hall, Columbia University, 3022 Broadway, New York, NY10027, or e-mail: [email protected].
The Review of Financial Studies Fall 2001 Vol. 14, No. 3, pp. 659–680© 2001 The Society for Financial Studies
The Review of Financial Studies / v 14 n 3 2001
Investment in the familiar manifests itself in more than just the home coun-try bias. Coval and Moskowitz (1999) find that U.S. investment managersexhibit a strong preference for locally headquartered firms in their domesticportfolios. Feldstein and Horioka (1980) document high positive correlationbetween a country’s savings and its investment rate, arguing that capital flowsto familiar (domestic) investment opportunities, not necessarily to the mostprofitable. Kilka and Weber (1997) show that German business students aremore optimistic about German stocks than American stocks, and vice versafor American business students. More than 30% of defined contribution pen-sion money is invested in the employer’s stock. And respondents to a Gallupsurvey [Driscoll et al. (1995)] view their own employer’s stock as safer thana diversified stock fund, domestic or international.
Heath and Tversky (1991) lay out behavioral foundations for betting on thefamiliar, but do not explain why the nature of the bet is frequently “buy andhold.” They conduct a series of experiments showing that “holding judgedprobability constant—people prefer to bet in a context where they considerthemselves knowledgeable or competent than in a context where they feelignorant or uninformed.” Heath and Tversky conclude “[the competencehypothesis] might also help explain why investors are sometimes willingto forego the advantage of diversification and concentrate on a small numberof companies with which they are presumably familiar.”
Merton (1987) offers an asset pricing theory that deviates from the capitalasset pricing model (CAPM) because investors focus on the familiar. Inthat work, every stock is familiar to a subset of investors in the sense thatthey—and only they—know the parameters of the stock return’s distribution.Investors trade only in securities with which they are familiar; otherwise theyare rational mean-variance maximizers. In equilibrium, stocks with a smallerinvestor base will have lower prices (and higher expected returns).
To test the familiarity hypothesis, consider the geographic distributionof the shareholders of the seven U.S. Regional Bell Operating Companies(RBOCs) at the end of 1996. Each RBOC has been the major provider oflocal telephone service in its region since the 1984 divestiture of AT&T. Thebehavioral hypothesis implies that a disproportionate number of an RBOC’scustomers tend to hold a disproportionate number of shares of that RBOCand invest a disproportionate amount of money in their local RBOC. Theusual explanations for the small scale of international stock diversificationare irrelevant here, as each of the seven RBOCs is equally accessible to theU.S. investing public, their shares trade on the New York Stock Exchange(NYSE), and their market capitalizations are large.
The evidence that people do invest in the familiar is clear. In every statebut Montana, more people hold shares of the local RBOC than of any othersingle RBOC. In most states, more money is invested, per investor, in thelocal RBOC than in any other RBOC. A typical investor in an RBOC tendsto invest more money if he invests in the local RBOC than if he invests
660
Familiarity Breeds Investment
in an out-of-state RBOC. Typical account sizes range between $10,000 and$20,000, a considerable amount to be invested in a single stock in comparisonwith the typical U.S. household’s net worth and direct and indirect stockholdings.
Section 1 assembles seemingly disparate evidence on how familiarityaffects investment choices. Section 2 documents the geographic distributionof the RBOC shareholders and relates the amount of money that individualsinvest in the RBOCs to the typical U.S. household’s net worth and stockholdings. Section 3 discusses possible explanations and Section 4 concludes.
1. Instances of Investment in the Familiar
This section surveys numerous examples of the tendency to invest in thefamiliar and thereby demonstrates the strong and pervasive influence famil-iarity exerts on investment decisions. It recalls the relevant literature on inter-national investments, mentions the geographic bias of U.S. domestic fundmanagers, discusses employees’ inclination to hold their employers’ equityin defined contribution pension plans, and relates a few additional anecdotes.Together the evidence suggests that in addition to perceived risk and return,other variables—familiarity, for instance—affect investment choices, or thatthese other variables affect the perception of risk and return.
1.1 International finance and investing in the familiarGrubel (1968), Levy and Sarnat (1970), and Solnik (1974) are among the firstto recommend international diversification. French and Poterba (1991) is prob-ably the most prominent among the numerous studies which document thehome country bias—evidence that investors do not diversify internationally.
French and Poterba (1991) estimate that U.S., Japan, and U.K. investorshold 93%, 98%, and 82% of their equity investments, respectively, in theirhome countries, and argue that these numbers are inconsistent with stan-dard models of asset allocation. Observing that they can reliably estimatea variance-covariance matrix of returns but not the vector of their expectedreturns, they consider hypothetical mean-variance optimizing investors andaddress the following question: Given the variance-covariance matrix and aninternational asset allocation equal to the aggregate allocation of investorsin the particular country, what is the implied vector of expected returns?They compute the expected returns vectors from the perspective of U.S.,Japanese, and U.K. investors and compare the imputed expected returnsacross investors, and for each investor, across countries. Each investor is mostoptimistic about his own country’s equity returns. The expected return onU.S. equities is 5.5% in the eyes of U.S. investors, compared with 3.1% and4.4% in the eyes of Japanese and U.K. investors, respectively. The expectedreturn on Japanese equities is 6.6% in the eyes of Japanese investors, com-pared with 3.2% and 3.8% in the eyes of U.S. and U.K. investors, respec-tively. Of interest, the most egregious numbers come from the investors who
661
The Review of Financial Studies / v 14 n 3 2001
display the weakest home bias, the U.K. investors. In their eyes the expectedreturns on their equities is 9.6%, compared with 4.5% and 3.8% in the eyesof U.S. and Japanese investors, respectively.
This gap between investors’ actual and presumably optimal behaviormotivated numerous studies in the search for an explanation. A partial listof articles looking at the home country bias includes Cooper and Kaplanis(1986, 1994), Gehrig (1993), Tesar and Werner (1995), Pesenti and Win-coop (1996), and Kang and Stulz (1997). Lewis (1995, 1999) surveys thisliterature. More recent contributions include Grossman and Zhou (1997).
Attempts to explain the home country bias usually consider eithertransaction costs or hedging needs. The former include outright capitalcontrols, taxes, and higher transaction costs associated with internationalinvestments. But these seem to pose no material challenge to cross-borderinvestments among the developed countries. Indeed, Tesar and Werner (1995)write: “the high transactions rate on foreign investments suggests thatinvestors frequently adjust the composition and size of their internationalportfolios, even though much of this activity has little impact on net invest-ment positions. . . [This observation] suggests that high transaction costsassociated with trading foreign securities cannot be the reason for theobserved reluctance of investors to diversify their positions internationally.”
Of interest, Tesar and Werner (1995) anticipate this article’s results, notingthat “Observations on the portfolio choices of Canadian and U.S. investorssuggest that to the extent investors do invest in foreign securities, their invest-ment decisions do not reflect pure diversification motives. Instead, geographicproximity seems to be an important ingredient in the international portfolioallocation decision.”
Different hedging needs may arise because residents of different countriesconsume bundles that are subject to different stochastic inflation rates, orbecause they produce and consume different nontraded goods, or becausethey own assets that do not trade. Baxter and Jermann (1997) argue per-suasively that the single most important nontraded asset is human capital,and that returns to human capital are highly correlated with the returns to thedomestic stock market. Indeed, Baxter and Jermann consider typical investorsfrom four countries—Japan, Germany, the United Kingdom, and the UnitedStates—who wish to allocate their portfolios among equity indices of thesemarkets. Optimally, each investor should short a substantial fraction of hisnational market portfolio.
The home country bias also applies to real, not just financial investments.Indeed, a closely related puzzle is the high correlation between a country’slong-term saving rate and its investment rate, which suggests that moneysaved in a country is invested in that country rather than in the (possiblyforeign) country that offers the best return. Obstfeld (1995) offers a criti-cal review of the literature, which was pioneered by Feldstein and Horioka(1980).
662
Familiarity Breeds Investment
1.2 Domestic equity managersCoval and Moskowitz (1999) report that the typical equity portfolio of aU.S. money manager consists of stocks of firms that are located 100 milescloser to the manager’s office than the average U.S. firm. The bias towardinvesting locally increases with firm leverage and decreases with firm sizeand output tradeability, but seems unrelated to the money manager’s type.Coval and Moskowitz (1997) find abnormal performance in locally held firmsand interpret their results as evidence that information advantages motivateinvestors to favor nearby investments.
1.3 Investment in the most familiar: the employer’s stockInvestment in the familiar extends to workers who choose to invest some,or perhaps all of their retirement money in their employer’s stock. In somecases, workers prefer to buy the company stock instead of investing in theother options available in their pension plans. In other cases the preference forthe company stock is induced by a matching contribution from the employer.And in still other cases, it is the company that contributes its own stockto the plan, without offering the workers any choice in the matter. Benartzi(2000) reports that “[r]oughly a third of assets in large retirement savingsplans are in company stock . . . [E]mployees invest 20–30 percent of theirdiscretionary funds in company stock (as opposed to being required to owncompany stock).”
Employers may, and some do, offer incentives to workers to include thecompany stock in their retirement accounts. In these cases, stockholdersessentially sell the firm’s shares to workers at a discount. A standard appli-cation of the principal-agent theory cannot account for this behavior, sincein a large firm, most individuals’ job performance hardly affects the bottomline. It seems that employers have two mutually enhancing reasons for seeingrank-and-file workers as fellow shareholders: (1) this makes employees iden-tify more strongly with the company and thereby motivates them to becomebetter workers; and (2) workers actually like to hold the company stock—itis familiar.
Even in the absence of an explicit financial inducement, many employeeschoose to hold their firm’s stock in their 401(k) accounts. For instance, thepresumably financially sophisticated employees of J. P. Morgan invest 19%of their 401(k) plan money in Morgan’s stock, although the firm offers noincentive to make this particular choice. (J. P. Morgan, 1997). Business Week(1997) reports, “in some companies, even when employees have the choiceof other investment options, they tend to go for what they know. Look atAbbott Labs. Until January 1996, employees had no choice: All of the 401(k)money went into company stock. Then the company added four investmentchoices and the chance to reallocate. Today, 68% of the employees’ regularinvestment still goes toward stock and the total plan remains 90% investedin Abbott shares.”
663
The Review of Financial Studies / v 14 n 3 2001
Krane (1996) provides an example of how badly workers of one companywere hurt, having invested their retirement money with the company’s stock:“Employees of Color Tile still don’t know how much money they lost. Mostof their 401(k) is invested in company stock and real estate, but the com-pany, a retailer of home-decorating materials based in Fort Worth, declaredbankruptcy in January. That froze the estimated $20 million in the plan and itsexact value is unknown.” According to Schultz (1996a), Color Tile’s 401(k)plan had 1,362 participants.
Kahn (1997) reports on the 401(k) plan of Mercury Finance, a firm whosestock price dropped from $12.25 on December 31, 1996, to $2.25 on April4, 1997. According to Kahn, “Of a total of about 1,900 workers, nearly 900are enrolled in the company’s 401(k) plan. And according to the plan datafor 1994, nearly two-thirds of the plan’s assets were invested in MercuryFinance’s own plummeting stock . . . Besides Mercury stock, workers wereoffered just one other equity option, a diversified growth fund. The onlyother active options were a money market fund and a guaranteed invest-ment contract . . . At the end of 1994, besides the 65.5 percent in Mercurystock, the plan assets were divided as follows: 18 percent in the guaranteedinvestment contract, 8.5 percent in the equity fund and 5.5 percent in themoney market fund . . . [P]lan participants themselves chose how to dividetheir contributions to the plan.”
The John Hancock–Gallup survey sheds further and consistent light on theissues discussed here [Driscoll et al. (1995)]. It compiles the responses of803 randomly selected individuals whose employers were offering a 401(k),savings, thrift, or profit-sharing plan with a choice of funds in which to invest.To qualify for the survey these workers had to be currently contributing to theconsidered retirement plan. The survey’s most relevant finding for this workis that participants consider the employer’s stock safer than a domestic stockfund, which they consider safer than an international stock fund. In addition,they say that they are more likely to contribute to a familiar investmentoption, and that their own company stock is the most familiar investmentoption to them.
In summary, both the data on 401(k) asset allocation and the John Hancocksurvey suggest that workers’ financial well-being is often closely tied to theiremployer’s stock. Workers actually like this situation because the employer’sstock is a very familiar investment.
1.4 Additional instances of investment in the familiarCasual empiricism suggests that residents of company towns tend to holdshares in these companies (e.g., Rochester, N.Y., for Bausch and Lomb,Kodak, and Xerox). A piece of anecdotal evidence: following the 1994takeover of Gerber Products by Sandoz, the New York Times reported fromFremont, Michigan, that “hundreds of local residents—including descendantsof those farmers who first invested in the cooperative that became Gerber
664
Familiarity Breeds Investment
Products—are figuring out how to reinvest anywhere from the hundredsto tens of millions of dollars they will receive from the Gerber stock.”Fremont had 3,900 residents. Gerber directly accounted for 40% of localtaxes and employed about 1,300 people according to the New York Times[Feder (1994)]. Fremont’s shareholders of Gerber were very lucky, but theirportfolio selection was far from wise.
The Wall Street Journal [Deogun (1997)] provides another example,reporting that at least $23 billion of Coca Cola stock, or 16%, is held inGeorgia, most of it in metropolitan Atlanta, and to many shareholders, sellingis anathema. (Coke’s headquarters is in Atlanta.)
Lipper Analytical Services (1997, personal communication) reports theexistence of 21 mutual funds of Texas municipal bonds. Among them, theymanage around $500 million. Residents of a state buy shares in a fund whoseassets are municipal bonds from their home state if they wish to avoid payingboth federal and state taxes on the interest income. Texas, however, imposesno state income tax. It seems, then, that buying a Texas municipal bond fundis yet another manifestation of investment in the familiar and an act of Texanpatriotism.
A detailed look at the geographic distribution of the shareholders of theRBOCs augments the review of the evidence that shows that people favorfamiliar investments, and are reluctant to invest in the unfamiliar.
2. Evidence on the Regional Bell Operating Companies
Traditional hedging arguments suggest both over- and underinvestment inlocal RBOCs, but the argument favoring underinvestment is stronger than theone favoring overinvestment. A customer of an RBOC may overinvest in itsstock as a hedge against unexpected increase in the price of its services. Butthe magnitude of a typical household’s expenditure on local telephone servicesuggests that only a small portion of the household’s investment portfolioshould be dedicated to such a hedge. Nonetheless, the evidence indicatesthat on average a household that chooses to own shares of an RBOC isheavily invested in these shares in comparison with the typical household’sequity portfolio.
Theory would suggest that a person should diversify and invest less inthe RBOC serving him than in those operating in other parts of the countrybecause the fortunes of the RBOCs vary with the economic tides in theirhome areas. To the extent that a household’s financial well-being is tied toits region’s well-being, share returns of the local RBOC are more positivelycorrelated with the household’s well-being than the returns of any of theother six RBOCs. Therefore a rational household’s portfolio should have asmaller weight in its local RBOC than in each of the other RBOCs.
The data are considered from various perspectives. The implicit nullhypothesis that shareholders’ location has no effect on their choice of RBOC
665
The Review of Financial Studies / v 14 n 3 2001
stocks is usually rejected in favor of the alternative that people tend to investin the RBOC that serves them.
2.1 The dataThe seven RBOCs provided the number of account holders and the number ofshares being held in each state in late 1996. There are 48 states in the samplebecause Connecticut, Alaska, and Hawaii were not served by an RBOC,while Washington, D.C., is listed as a separate state. BellSouth provided theinformation only for individual accounts registered directly with it, that is,it omitted both institutional accounts and individual accounts held throughbrokerage firms. Ameritech requested that explicit data on the distributionof its shareholders not be published, but allowed the incorporation of itsinformation into aggregate statistics. Share prices are February 10, 1997,closing prices.
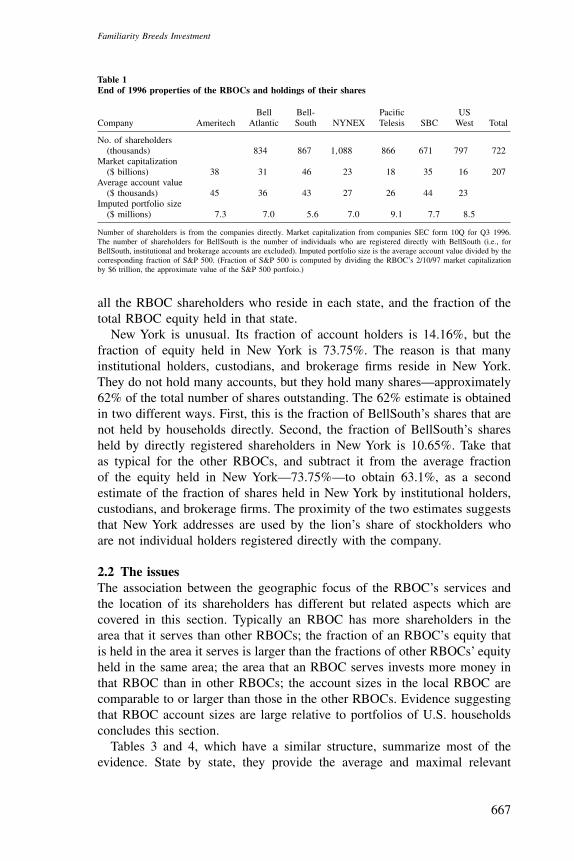
Table 1 reports the number of shareholders and market capitalization ofeach RBOC. It also provides the average dollar value of an account, and theimputed value of an S&P 500 portfolio with the holding of the particularRBOC equal to the average account size.
The number of shareholders provided by the RBOCs and reported inTable 1 is the sum of the number of individual shareholders registered directlywith the RBOC, the number of institutions holding the RBOC’s shares, thenumber of various brokerage accounts that pool individual holdings, andthe number of trustee accounts. BellSouth is exceptional, having providedonly the number of individual accounts registered directly with the com-pany. Therefore the number of accounts of BellSouth reported in the table,1.088 million, is not comparable to the total number of accounts providedfor the other RBOCs. Nonetheless, the table shows that BellSouth has moreshareholders than the other RBOCs. Among them, these 1.088 million share-holders hold 373 million shares out of the total 993 million outstanding. Thusabout 62% of the equity of BellSouth is held by institutions and by peoplewho hold the shares through brokerage accounts.
The RBOCs tend to subsidize their employees’ stockholdings, but thistendency does not drive the results below. They subsidize their employees’stock purchases only within a 401(k) pension plan, and shares of the 401(k)plan are held by a trustee on behalf of the pension plan and therefore appearas owned by a single owner—the trustee. Thus this article’s results are notcontaminated by employees’ holdings of subsidized employer stocks.
The average account value reported in Table 1 reflects all accounts—individuals directly holding shares with the companies as well as institu-tions, brokerage, and trust accounts. For BellSouth, the average account sizeof individuals who are registered directly with the company is $16,024.
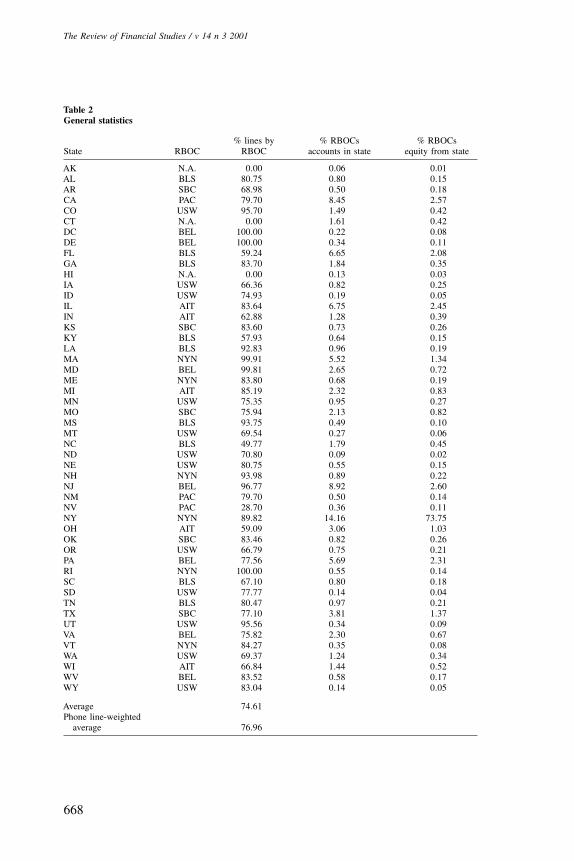
Table 2 shows the states covered by the different RBOCs and the fractionof the telephone lines provided by the RBOC. (The rest of the lines areprovided by non-Bell companies.) In addition, Table 2 reports the fraction of
666
Familiarity Breeds Investment
Table 1End of 1996 properties of the RBOCs and holdings of their shares
Bell Bell- Pacific USCompany Ameritech Atlantic South NYNEX Telesis SBC West Total
No. of shareholders(thousands) 834 867 1,088 866 671 797 722
Market capitalization($ billions) 38 31 46 23 18 35 16 207
Average account value($ thousands) 45 36 43 27 26 44 23
Imputed portfolio size($ millions) 7.3 7.0 5.6 7.0 9.1 7.7 8.5
Number of shareholders is from the companies directly. Market capitalization from companies SEC form 10Q for Q3 1996.The number of shareholders for BellSouth is the number of individuals who are registered directly with BellSouth (i.e., forBellSouth, institutional and brokerage accounts are excluded). Imputed portfolio size is the average account value divided by thecorresponding fraction of S&P 500. (Fraction of S&P 500 is computed by dividing the RBOC’s 2/10/97 market capitalizationby $6 trillion, the approximate value of the S&P 500 portfoio.)
all the RBOC shareholders who reside in each state, and the fraction of thetotal RBOC equity held in that state.
New York is unusual. Its fraction of account holders is 14.16%, but thefraction of equity held in New York is 73.75%. The reason is that manyinstitutional holders, custodians, and brokerage firms reside in New York.They do not hold many accounts, but they hold many shares—approximately62% of the total number of shares outstanding. The 62% estimate is obtainedin two different ways. First, this is the fraction of BellSouth’s shares that arenot held by households directly. Second, the fraction of BellSouth’s sharesheld by directly registered shareholders in New York is 10.65%. Take thatas typical for the other RBOCs, and subtract it from the average fractionof the equity held in New York—73.75%—to obtain 63.1%, as a secondestimate of the fraction of shares held in New York by institutional holders,custodians, and brokerage firms. The proximity of the two estimates suggeststhat New York addresses are used by the lion’s share of stockholders whoare not individual holders registered directly with the company.
2.2 The issuesThe association between the geographic focus of the RBOC’s services andthe location of its shareholders has different but related aspects which arecovered in this section. Typically an RBOC has more shareholders in thearea that it serves than other RBOCs; the fraction of an RBOC’s equity thatis held in the area it serves is larger than the fractions of other RBOCs’ equityheld in the same area; the area that an RBOC serves invests more money inthat RBOC than in other RBOCs; the account sizes in the local RBOC arecomparable to or larger than those in the other RBOCs. Evidence suggestingthat RBOC account sizes are large relative to portfolios of U.S. householdsconcludes this section.
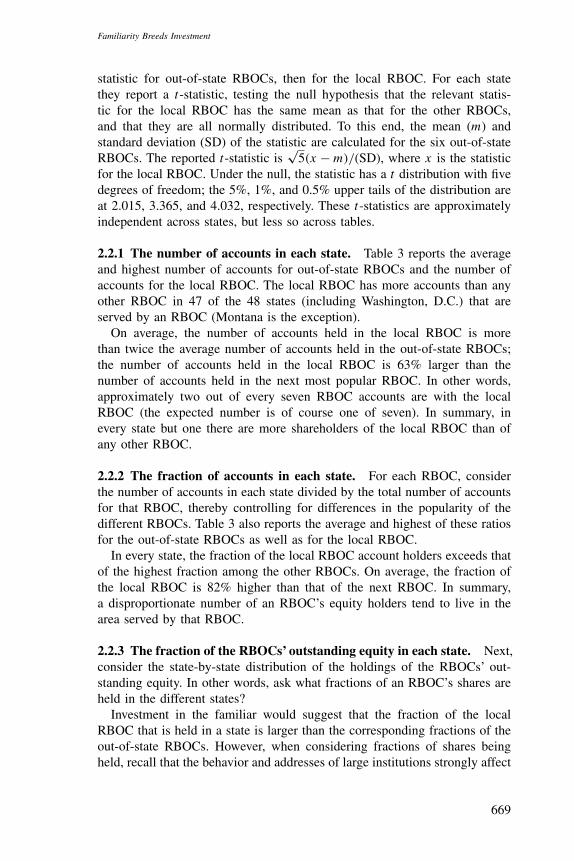
Tables 3 and 4, which have a similar structure, summarize most of theevidence. State by state, they provide the average and maximal relevant
667
The Review of Financial Studies / v 14 n 3 2001
Table 2General statistics
% lines by % RBOCs % RBOCsState RBOC RBOC accounts in state equity from state
AK N.A. 0.00 0.06 0.01AL BLS 80.75 0.80 0.15AR SBC 68.98 0.50 0.18CA PAC 79.70 8.45 2.57CO USW 95.70 1.49 0.42CT N.A. 0.00 1.61 0.42DC BEL 100.00 0.22 0.08DE BEL 100.00 0.34 0.11FL BLS 59.24 6.65 2.08GA BLS 83.70 1.84 0.35HI N.A. 0.00 0.13 0.03IA USW 66.36 0.82 0.25ID USW 74.93 0.19 0.05IL AIT 83.64 6.75 2.45IN AIT 62.88 1.28 0.39KS SBC 83.60 0.73 0.26KY BLS 57.93 0.64 0.15LA BLS 92.83 0.96 0.19MA NYN 99.91 5.52 1.34MD BEL 99.81 2.65 0.72ME NYN 83.80 0.68 0.19MI AIT 85.19 2.32 0.83MN USW 75.35 0.95 0.27MO SBC 75.94 2.13 0.82MS BLS 93.75 0.49 0.10MT USW 69.54 0.27 0.06NC BLS 49.77 1.79 0.45ND USW 70.80 0.09 0.02NE USW 80.75 0.55 0.15NH NYN 93.98 0.89 0.22NJ BEL 96.77 8.92 2.60NM PAC 79.70 0.50 0.14NV PAC 28.70 0.36 0.11NY NYN 89.82 14.16 73.75OH AIT 59.09 3.06 1.03OK SBC 83.46 0.82 0.26OR USW 66.79 0.75 0.21PA BEL 77.56 5.69 2.31RI NYN 100.00 0.55 0.14SC BLS 67.10 0.80 0.18SD USW 77.77 0.14 0.04TN BLS 80.47 0.97 0.21TX SBC 77.10 3.81 1.37UT USW 95.56 0.34 0.09VA BEL 75.82 2.30 0.67VT NYN 84.27 0.35 0.08WA USW 69.37 1.24 0.34WI AIT 66.84 1.44 0.52WV BEL 83.52 0.58 0.17WY USW 83.04 0.14 0.05
Average 74.61Phone line-weighted
average 76.96
668
Familiarity Breeds Investment
statistic for out-of-state RBOCs, then for the local RBOC. For each statethey report a t-statistic, testing the null hypothesis that the relevant statis-tic for the local RBOC has the same mean as that for the other RBOCs,and that they are all normally distributed. To this end, the mean (m) andstandard deviation (SD) of the statistic are calculated for the six out-of-stateRBOCs. The reported t-statistic is
√5(x − m)/(SD), where x is the statistic
for the local RBOC. Under the null, the statistic has a t distribution with fivedegrees of freedom; the 5%, 1%, and 0.5% upper tails of the distribution areat 2.015, 3.365, and 4.032, respectively. These t-statistics are approximatelyindependent across states, but less so across tables.
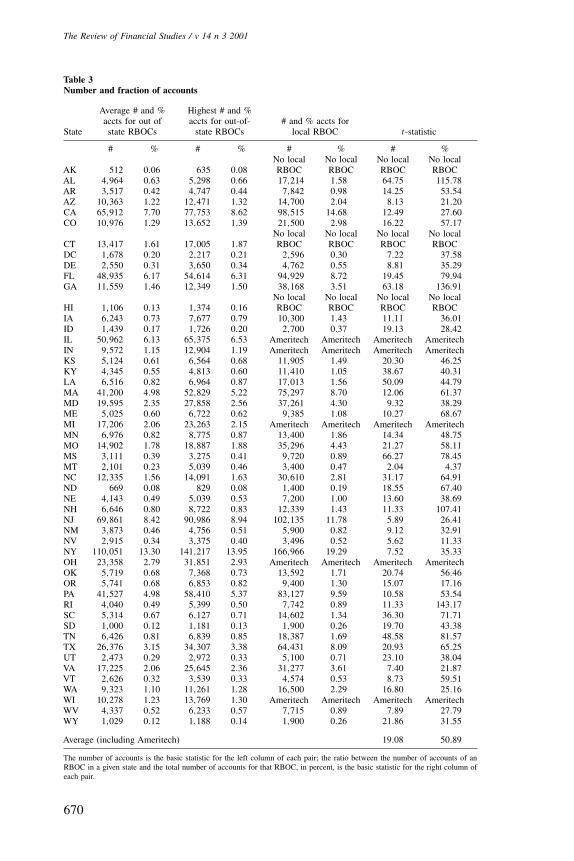
2.2.1 The number of accounts in each state. Table 3 reports the averageand highest number of accounts for out-of-state RBOCs and the number ofaccounts for the local RBOC. The local RBOC has more accounts than anyother RBOC in 47 of the 48 states (including Washington, D.C.) that areserved by an RBOC (Montana is the exception).
On average, the number of accounts held in the local RBOC is morethan twice the average number of accounts held in the out-of-state RBOCs;the number of accounts held in the local RBOC is 63% larger than thenumber of accounts held in the next most popular RBOC. In other words,approximately two out of every seven RBOC accounts are with the localRBOC (the expected number is of course one of seven). In summary, inevery state but one there are more shareholders of the local RBOC than ofany other RBOC.
2.2.2 The fraction of accounts in each state. For each RBOC, considerthe number of accounts in each state divided by the total number of accountsfor that RBOC, thereby controlling for differences in the popularity of thedifferent RBOCs. Table 3 also reports the average and highest of these ratiosfor the out-of-state RBOCs as well as for the local RBOC.
In every state, the fraction of the local RBOC account holders exceeds thatof the highest fraction among the other RBOCs. On average, the fraction ofthe local RBOC is 82% higher than that of the next RBOC. In summary,a disproportionate number of an RBOC’s equity holders tend to live in thearea served by that RBOC.
2.2.3 The fraction of the RBOCs’ outstanding equity in each state. Next,consider the state-by-state distribution of the holdings of the RBOCs’ out-standing equity. In other words, ask what fractions of an RBOC’s shares areheld in the different states?
Investment in the familiar would suggest that the fraction of the localRBOC that is held in a state is larger than the corresponding fractions of theout-of-state RBOCs. However, when considering fractions of shares beingheld, recall that the behavior and addresses of large institutions strongly affect
669
The Review of Financial Studies / v 14 n 3 2001
Table 3Number and fraction of accounts
Average # and % Highest # and %accts for out of accts for out-of- # and % accts for
State state RBOCs state RBOCs local RBOC t-statistic
# % # % # % # %No local No local No local No local
AK 512 0.06 635 0.08 RBOC RBOC RBOC RBOCAL 4,964 0.63 5,298 0.66 17,214 1.58 64.75 115.78AR 3,517 0.42 4,747 0.44 7,842 0.98 14.25 53.54AZ 10,363 1.22 12,471 1.32 14,700 2.04 8.13 21.20CA 65,912 7.70 77,753 8.62 98,515 14.68 12.49 27.60CO 10,976 1.29 13,652 1.39 21,500 2.98 16.22 57.17
No local No local No local No localCT 13,417 1.61 17,005 1.87 RBOC RBOC RBOC RBOCDC 1,678 0.20 2,217 0.21 2,596 0.30 7.22 37.58DE 2,550 0.31 3,650 0.34 4,762 0.55 8.81 35.29FL 48,935 6.17 54,614 6.31 94,929 8.72 19.45 79.94GA 11,559 1.46 12,349 1.50 38,168 3.51 63.18 136.91
No local No local No local No localHI 1,106 0.13 1,374 0.16 RBOC RBOC RBOC RBOCIA 6,243 0.73 7,677 0.79 10,300 1.43 11.11 36.01ID 1,439 0.17 1,726 0.20 2,700 0.37 19.13 28.42IL 50,962 6.13 65,375 6.53 Ameritech Ameritech Ameritech AmeritechIN 9,572 1.15 12,904 1.19 Ameritech Ameritech Ameritech AmeritechKS 5,124 0.61 6,564 0.68 11,905 1.49 20.30 46.25KY 4,345 0.55 4,813 0.60 11,410 1.05 38.67 40.31LA 6,516 0.82 6,964 0.87 17,013 1.56 50.09 44.79MA 41,200 4.98 52,829 5.22 75,297 8.70 12.06 61.37MD 19,595 2.35 27,858 2.56 37,261 4.30 9.32 38.29ME 5,025 0.60 6,722 0.62 9,385 1.08 10.27 68.67MI 17,206 2.06 23,263 2.15 Ameritech Ameritech Ameritech AmeritechMN 6,976 0.82 8,775 0.87 13,400 1.86 14.34 48.75MO 14,902 1.78 18,887 1.88 35,296 4.43 21.27 58.11MS 3,111 0.39 3,275 0.41 9,720 0.89 66.27 78.45MT 2,101 0.23 5,039 0.46 3,400 0.47 2.04 4.37NC 12,335 1.56 14,091 1.63 30,610 2.81 31.17 64.91ND 669 0.08 829 0.08 1,400 0.19 18.55 67.40NE 4,143 0.49 5,039 0.53 7,200 1.00 13.60 38.69NH 6,646 0.80 8,722 0.83 12,339 1.43 11.33 107.41NJ 69,861 8.42 90,986 8.94 102,135 11.78 5.89 26.41NM 3,873 0.46 4,756 0.51 5,900 0.82 9.12 32.91NV 2,915 0.34 3,375 0.40 3,496 0.52 5.62 11.33NY 110,051 13.30 141,217 13.95 166,966 19.29 7.52 35.33OH 23,358 2.79 31,851 2.93 Ameritech Ameritech Ameritech AmeritechOK 5,719 0.68 7,368 0.73 13,592 1.71 20.74 56.46OR 5,741 0.68 6,853 0.82 9,400 1.30 15.07 17.16PA 41,527 4.98 58,410 5.37 83,127 9.59 10.58 53.54RI 4,040 0.49 5,399 0.50 7,742 0.89 11.33 143.17SC 5,314 0.67 6,127 0.71 14,602 1.34 36.30 71.71SD 1,000 0.12 1,181 0.13 1,900 0.26 19.70 43.38TN 6,426 0.81 6,839 0.85 18,387 1.69 48.58 81.57TX 26,376 3.15 34,307 3.38 64,431 8.09 20.93 65.25UT 2,473 0.29 2,972 0.33 5,100 0.71 23.10 38.04VA 17,225 2.06 25,645 2.36 31,277 3.61 7.40 21.87VT 2,626 0.32 3,539 0.33 4,574 0.53 8.73 59.51WA 9,323 1.10 11,261 1.28 16,500 2.29 16.80 25.16WI 10,278 1.23 13,769 1.30 Ameritech Ameritech Ameritech AmeritechWV 4,337 0.52 6,233 0.57 7,715 0.89 7.89 27.79WY 1,029 0.12 1,188 0.14 1,900 0.26 21.86 31.55
Average (including Ameritech) 19.08 50.89
The number of accounts is the basic statistic for the left column of each pair; the ratio between the number of accounts of anRBOC in a given state and the total number of accounts for that RBOC, in percent, is the basic statistic for the right column ofeach pair.
670
Familiarity Breeds Investment
these numbers. Table 2 shows the strong tendency of companies’ equity tobe held by New Yorkers—but not necessarily individuals. These can be insti-tutional holders (e.g., pension funds with New York addresses) trustees (e.g.,money center banks that act as trustees for big RBOC employee retirementaccounts), or large brokerage firms that hold shares belonging to individualsbut held under the brokerage firms’ names. Moreover, the number of sharesheld in each state is affected by portfolio choices of money managers. Theseare at most a few hundred large institutions that control hundreds of billionsof dollars invested in U.S. stocks.
When interpreting the distribution of the numbers of shares held in eachstate, one should keep in mind the possibility that a few large institutionalinvestors located in a particular state will deem it wise to invest in a particularRBOC, thereby leaving the number of accounts holding that RBOC in thatstate almost intact, but increasing considerably the number of shares held inthat state.
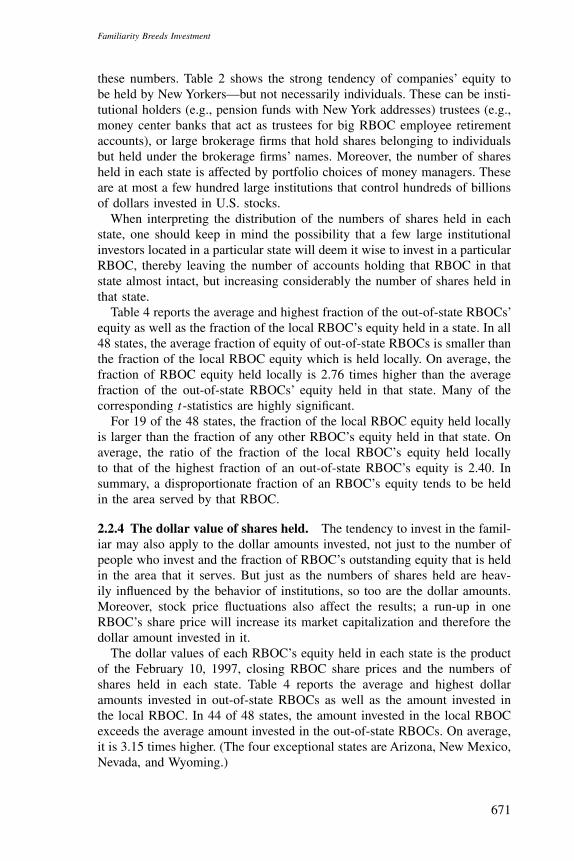
Table 4 reports the average and highest fraction of the out-of-state RBOCs’equity as well as the fraction of the local RBOC’s equity held in a state. In all48 states, the average fraction of equity of out-of-state RBOCs is smaller thanthe fraction of the local RBOC equity which is held locally. On average, thefraction of RBOC equity held locally is 2.76 times higher than the averagefraction of the out-of-state RBOCs’ equity held in that state. Many of thecorresponding t-statistics are highly significant.
For 19 of the 48 states, the fraction of the local RBOC equity held locallyis larger than the fraction of any other RBOC’s equity held in that state. Onaverage, the ratio of the fraction of the local RBOC’s equity held locallyto that of the highest fraction of an out-of-state RBOC’s equity is 2.40. Insummary, a disproportionate fraction of an RBOC’s equity tends to be heldin the area served by that RBOC.
2.2.4 The dollar value of shares held. The tendency to invest in the famil-iar may also apply to the dollar amounts invested, not just to the number ofpeople who invest and the fraction of RBOC’s outstanding equity that is heldin the area that it serves. But just as the numbers of shares held are heav-ily influenced by the behavior of institutions, so too are the dollar amounts.Moreover, stock price fluctuations also affect the results; a run-up in oneRBOC’s share price will increase its market capitalization and therefore thedollar amount invested in it.
The dollar values of each RBOC’s equity held in each state is the productof the February 10, 1997, closing RBOC share prices and the numbers ofshares held in each state. Table 4 reports the average and highest dollaramounts invested in out-of-state RBOCs as well as the amount invested inthe local RBOC. In 44 of 48 states, the amount invested in the local RBOCexceeds the average amount invested in the out-of-state RBOCs. On average,it is 3.15 times higher. (The four exceptional states are Arizona, New Mexico,Nevada, and Wyoming.)
671
The Review of Financial Studies / v 14 n 3 2001
Table 4Fraction of an RBOC equity and dollar amount held in a state
Highest fraction FractionAverage fraction and dollar amount and amount held
State and dollar amount for out-of-state for local RBOC t-statistic
AL 0.14% 40 0.17% 60 1.78% 311 150.70 33.82AZ 0.49% 121 1.08% 188 0.58% 95 0.63 (1.08)
CA 2.76% 673 6.21% 1,082 6.29% 1,109 4.72 3.61CO 0.45% 112 1.04% 181 1.03% 170 4.12 2.49
No local No local No local No localCT 0.55% 129 1.38% 240 RBOC RBOC RBOC RBOCDC 0.09% 20 0.22% 38 0.15% 46 2.01 5.66DE 0.12% 27 0.32% 56 0.22% 67 2.22 5.42FL 2.01% 547 2.39% 841 10.42% 1,817 63.80 12.56GA 0.34% 92 0.39% 138 4.66% 812 197.76 40.60
No local No local No local No localHI 0.05% 11 0.11% 19 RBOC RBOC RBOC RBOCIA 0.29% 71 0.65% 114 0.48% 80 2.22 0.57ID 0.06% 14 0.12% 22 0.11% 19 3.43 1.73IL 2.32% 512 5.77% 1,007 Ameritech Ameritech Ameritech AmeritechIN 0.38% 84 1.01% 176 Ameritech Ameritech Ameritech AmeritechKS 0.24% 53 0.55% 97 0.57% 196 4.83 12.02KY 0.15% 41 0.19% 66 1.19% 208 74.16 18.46LA 0.18% 51 0.29% 97 1.65% 288 61.65 18.85MA 1.51% 356 3.72% 649 2.66% 635 2.38 3.39MD 0.79% 174 2.07% 361 1.48% 459 2.50 6.22ME 0.22% 52 0.53% 93 0.34% 81 1.73 2.30MI 0.81% 183 1.97% 344 Ameritech Ameritech Ameritech AmeritechMN 0.29% 73 0.63% 109 0.57% 93 3.34 1.37MO 0.65% 146 1.57% 274 2.02% 690 6.80 15.12MS 0.10% 26 0.13% 39 1.07% 187 109.92 29.39MT 0.07% 16 0.15% 27 0.16% 27 4.53 3.04NC 0.43% 118 0.50% 172 3.36% 586 96.09 20.64ND 0.03% 6 0.06% 11 0.07% 11 4.68 3.34NE 0.17% 41 0.37% 64 0.32% 53 3.20 1.40NH 0.25% 60 0.63% 110 0.44% 106 2.28 3.29NJ 3.06% 692 7.51% 1,310 4.12% 1,1277 1.10 3.52NM 0.17% 42 0.39% 68 0.24% 39 1.29 (0.30)
NV 0.13% 32 0.28% 48 0.18% 31 1.35 (0.30)
NY 63.46% 16,658 79.19% 24,768 77.91% 18,625 1.26 0.50OH 1.35% 289 4.45% 776 Ameritech Ameritech Ameritech AmeritechOK 0.22% 49 0.55% 96 0.64% 217 5.77 13.60OR 0.24% 59 0.53% 93 0.40% 65 2.23 0.59PA 2.20% 502 4.99% 869 4.90% 1,516 4.45 9.36RI 0.16% 37 0.40% 69 0.28% 67 2.32 3.39SC 0.18% 48 0.22% 70 1.49% 260 92.38 22.25SD 0.06% 13 0.19% 33 0.08% 14 0.88 0.21TN 0.21% 57 0.25% 86 5.83% 1,017 344.05 82.08TX 1.15% 252 2.76% 481 3.32% 1,136 6.23 15.35UT 0.09% 24 0.19% 44 0.19% 32 3.85 1.29VA 0.76% 168 2.18% 380 1.42% 440 2.14 5.27VT 0.10% 23 0.25% 43 0.15% 36 1.65 2.38WA 0.39% 96 0.87% 152 0.74% 122 3.07 1.51WI 0.44% 96 1.11% 194 Ameritech Ameritech Ameritech AmeritechWV 0.20% 44 0.55% 96 0.33% 104 1.78 4.60WY 0.06% 15 0.16% 28 0.08% 14 0.82 (0.20)
Average (including Ameritech) 27.24 9.68
The basic statistics are the ratio between the number of shares of an RBOC in a given state and the total number of shares forthat RBOC, in percent (for the left column), and the number of shares of an RBOC in a given state and the 2/10/97 share price.
672
Familiarity Breeds Investment
For 26 of the 48 states, more money is invested in the local RBOC thanin any other RBOC. On average, the amount invested in the local RBOC is1.84 times higher than the amount invested in the next most heavily investedRBOC. In summary, a disproportionate dollar amount is invested in the localRBOC compared to the amount invested in out-of-state RBOCs.
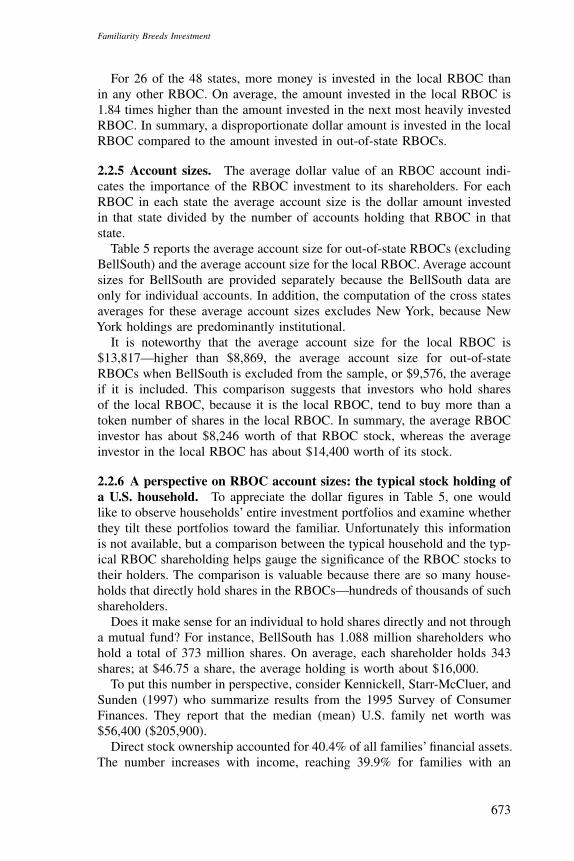
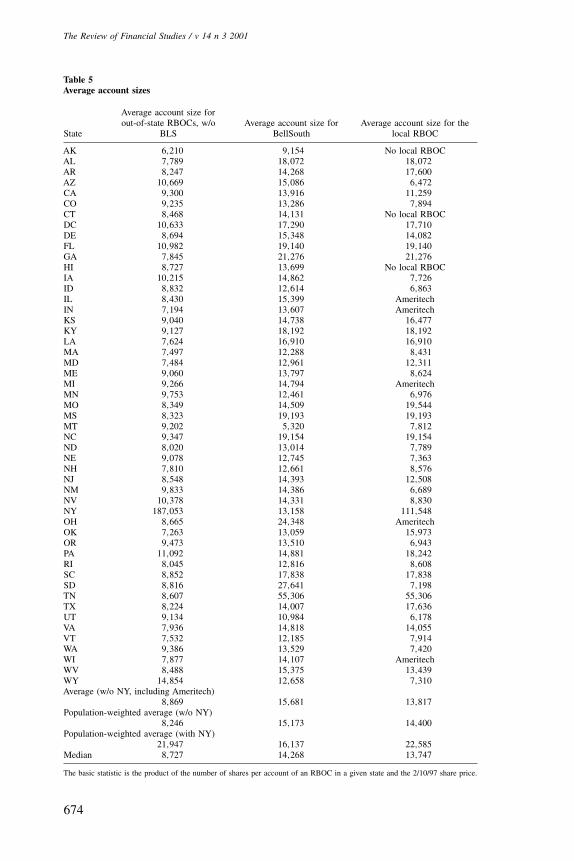
2.2.5 Account sizes. The average dollar value of an RBOC account indi-cates the importance of the RBOC investment to its shareholders. For eachRBOC in each state the average account size is the dollar amount investedin that state divided by the number of accounts holding that RBOC in thatstate.
Table 5 reports the average account size for out-of-state RBOCs (excludingBellSouth) and the average account size for the local RBOC. Average accountsizes for BellSouth are provided separately because the BellSouth data areonly for individual accounts. In addition, the computation of the cross statesaverages for these average account sizes excludes New York, because NewYork holdings are predominantly institutional.
It is noteworthy that the average account size for the local RBOC is$13,817—higher than $8,869, the average account size for out-of-stateRBOCs when BellSouth is excluded from the sample, or $9,576, the averageif it is included. This comparison suggests that investors who hold sharesof the local RBOC, because it is the local RBOC, tend to buy more than atoken number of shares in the local RBOC. In summary, the average RBOCinvestor has about $8,246 worth of that RBOC stock, whereas the averageinvestor in the local RBOC has about $14,400 worth of its stock.
2.2.6 A perspective on RBOC account sizes: the typical stock holding ofa U.S. household. To appreciate the dollar figures in Table 5, one wouldlike to observe households’ entire investment portfolios and examine whetherthey tilt these portfolios toward the familiar. Unfortunately this informationis not available, but a comparison between the typical household and the typ-ical RBOC shareholding helps gauge the significance of the RBOC stocks totheir holders. The comparison is valuable because there are so many house-holds that directly hold shares in the RBOCs—hundreds of thousands of suchshareholders.
Does it make sense for an individual to hold shares directly and not througha mutual fund? For instance, BellSouth has 1.088 million shareholders whohold a total of 373 million shares. On average, each shareholder holds 343shares; at $46.75 a share, the average holding is worth about $16,000.
To put this number in perspective, consider Kennickell, Starr-McCluer, andSunden (1997) who summarize results from the 1995 Survey of ConsumerFinances. They report that the median (mean) U.S. family net worth was$56,400 ($205,900).
Direct stock ownership accounted for 40.4% of all families’ financial assets.The number increases with income, reaching 39.9% for families with an
673
The Review of Financial Studies / v 14 n 3 2001
Table 5Average account sizes
Average account size forout-of-state RBOCs, w/o Average account size for Average account size for the
State BLS BellSouth local RBOC
AK 6,210 9,154 No local RBOCAL 7,789 18,072 18,072AR 8,247 14,268 17,600AZ 10,669 15,086 6,472CA 9,300 13,916 11,259CO 9,235 13,286 7,894CT 8,468 14,131 No local RBOCDC 10,633 17,290 17,710DE 8,694 15,348 14,082FL 10,982 19,140 19,140GA 7,845 21,276 21,276HI 8,727 13,699 No local RBOCIA 10,215 14,862 7,726ID 8,832 12,614 6,863IL 8,430 15,399 AmeritechIN 7,194 13,607 AmeritechKS 9,040 14,738 16,477KY 9,127 18,192 18,192LA 7,624 16,910 16,910MA 7,497 12,288 8,431MD 7,484 12,961 12,311ME 9,060 13,797 8,624MI 9,266 14,794 AmeritechMN 9,753 12,461 6,976MO 8,349 14,509 19,544MS 8,323 19,193 19,193MT 9,202 5,320 7,812NC 9,347 19,154 19,154ND 8,020 13,014 7,789NE 9,078 12,745 7,363NH 7,810 12,661 8,576NJ 8,548 14,393 12,508NM 9,833 14,386 6,689NV 10,378 14,331 8,830NY 187,053 13,158 111,548OH 8,665 24,348 AmeritechOK 7,263 13,059 15,973OR 9,473 13,510 6,943PA 11,092 14,881 18,242RI 8,045 12,816 8,608SC 8,852 17,838 17,838SD 8,816 27,641 7,198TN 8,607 55,306 55,306TX 8,224 14,007 17,636UT 9,134 10,984 6,178VA 7,936 14,818 14,055VT 7,532 12,185 7,914WA 9,386 13,529 7,420WI 7,877 14,107 AmeritechWV 8,488 15,375 13,439WY 14,854 12,658 7,310Average (w/o NY, including Ameritech)
8,869 15,681 13,817Population-weighted average (w/o NY)
8,246 15,173 14,400Population-weighted average (with NY)
21,947 16,137 22,585Median 8,727 14,268 13,747
The basic statistic is the product of the number of shares per account of an RBOC in a given state and the 2/10/97 share price.
674
Familiarity Breeds Investment
annual income between $50,000 and 100,000, and 47.6% for families withan annual income of more than $100,000. For the 20.2% of families withannual incomes between $50,000 and $100,000, the median value of directand indirect stock ownership (for the 66.7% of families in this income rangethat held stocks) was $21,300. Only 6.1% of the families had an annualincome higher than $100,000, and their median direct and indirect stockownership was $90,800.
Compare these numbers with the numbers in Table 5. In particular, look atthe numbers for BellSouth, which do not reflect institutional ownership. Theestimates in Table 5 are substantial in comparison with the typical familystock holdings; they suggest that to many, their equity investments in theRBOCs represent substantial fractions of their savings.
3. Decision Theory and Investment in the Familiar
Expected utility-based portfolio theory focuses only on financial attributesof assets. The preceding sections document that familiarity, apparently anonfinancial attribute, affects investors’ choices.
Familiarity may represent information available to the investor, but not yetto the market. It may represent the investor’s illusion that he has superiorinformation. It may represent an investor’s belief that he will have supe-rior information—perhaps he will be among the first to hear of bad news,and therefore will be able to get out in time. Thus familiarity as informa-tion ranges from the investor actually possessing superior information, to theinvestor thinking that he currently has superior information, to the investorthinking that he will have superior information at some important point inthe future.
People are better informed about the familiar than the unfamiliar—thisis almost the defining property of the familiar. But being better informedmeans spotting as many “sell” opportunities as “buy.” In fact, even havingthe illusion of superior information—now or in the future—should not, byitself, bias one’s position to buy a security, if one follows a standard port-folio selection procedure. However, there is not a single state in which thelocal RBOC is less popular than the average out-of-state RBOC in termsof the number of accounts or fraction of the equity held. And it seems thatpeople tend to buy (and hold) the familiar stocks, not sell them. Moreover,price changes and new insights induce trading by people with informationaladvantage, or with the illusion of possessing it. Therefore investors whobelieve that they have superior information are likely to trade frequently. Butabysmally underdiversified 401(k) investors who buy their employers’ stocksseem in the main to be holding these investments rather than trading themaggressively in response to new information.
Investors in the familiar seem to have static, “buy-and-hold” portfolios.If their positions exploited informational advantage, who are the people on
675
The Review of Financial Studies / v 14 n 3 2001
the other side of these positions? Recall that people who acknowledge theirinformational inferiority can compensate for it by acquiring an index of thestocks about which they feel they know less than others. The equilibriumimplications of this observation are yet to be explored. But before turning tocomplex equilibrium considerations, it is worthwhile to look at the behavioralevidence pertaining to investments in the familiar.
It seems that the bias favoring the familiar does not reflect the exploitationof informational advantage—real or imagined. Rather, it reflects people’stendency to be optimistic about and charitable toward what they feel affinitywith—the comfortable and the familiar. The experimental evidence reviewedbelow supports this view.
Confidence in the familiar is documented by Heath and Tversky (1991),who summarize their results: “a series of experiments provides support forthe hypothesis that people prefer betting on their own judgment over anequiprobable chance event when they consider themselves knowledgeable,but not otherwise. They even pay a significant premium to bet on their judg-ments.” French and Poterba (1991) suggest that Heath and Tversky’s compe-tence hypothesis may explain the home country bias. But they do not explainhow the competence hypothesis implies buying (and probably holding) thehome country equity, as opposed to selling it.
Kilka and Weber (1997) examine the relation between the home countrybias and the competence hypothesis by directly eliciting expectations aboutreturns of American and German stocks from American and German businessstudents. The elicited returns expectations were both about individual stocksand about two leading stock indices—the Dow Jones and the DAX. Subjectswere asked to assess their competence to form beliefs about the equities inquestion, and then to provide a rough probability distribution of the returnsof these equities.
U.S. subjects felt that they were more competent to construct returndistributions of U.S. stocks and the Dow than of German stocks and theDAX, and vice versa for the German subjects. For individual stocks, theelicited returns distributions were more dispersed the less competent a sub-ject felt about his ability to form such a distribution. In particular, German(U.S.) subjects had higher dispersions for the returns of U.S. (German) thanfor German (U.S.) equities, and within each country, higher dispersions forthe returns of equities about which they felt less competent to judge. Thisobservation seems consistent with the Heath and Tversky (1991) competencehypothesis.
A more interesting result, which directly explains the home country biasbut does not follow from the competence hypothesis, is the expected returnsassociated with familiar stocks. For individual stocks, imputed expectedreturns were higher the more competent the subject felt about his abilityto form the return probability distribution. In particular, German (U.S.) sub-jects had higher expected returns for German (U.S.) than for U.S. (German)
676
Familiarity Breeds Investment
equities. Strong and Xu (1999) offer a similar finding. They “use survey dataof fund managers’ views on prospects for international equity markets” and“find that fund managers from the U.S., the U.K., Continental Europe, andJapan show a significant comparative optimism towards their home equitymarket.”
The reports of Kilka and Weber (1997) and Strong and Xu (1999) suggestthat familiarity, or perceived competence, tends to increase the returns distri-butions’ expected values and lower their variances. The variances of individ-ual assets’ returns hardly affect the portfolio weights of optimizingindividuals, because they should care about the overall variances of their port-folio returns, not about the return variances of components of the portfolios.However, individuals who do not attempt to choose mean-variance efficientportfolios may assign undue importance to stock-specific risks. Moreover,investors should and do shift portfolio weights toward assets with higherexpected returns.
It seems, then, that people look favorably upon stocks with which theyare familiar and think of them as more likely to deliver higher returns,at lower stock-specific risks. And this view tilts portfolio weights towardfamiliar stocks.
A favorable view of stocks with which a person has an affinity, whetherhe has a stake in them or not, recalls wishful thinking. Indeed, it has beendocumented that people who vote for a party assign that party a higherprobability of winning the election than those who do not vote for it. And fansof a sports team who bet on the outcomes of ballgames are more likely thanthose who do not support that team to bet that their favorite team will win[see Babad and Yosi (1991), Babad (1995), Bar-Hillel and Budescu (1995)].
Preference for the familiar, and distaste for and fear of the unfamiliar, arefamiliar phenomena with wide-ranging manifestations. One example is peo-ple’s support for local causes such as sports teams and charities. Race- andgender-based discrimination reflect less innocuous aspects of such a pref-erence. And many wars and interethnic violent conflicts may be the mostpernicious outbreaks of the distaste for the alien.
Levi (1993) recognizes the universality of these phenomena, albeit in avery different context, prefacing his work, “[this book] should be able ( . . . )to furnish documentation for a quiet study of certain aspects of the humanmind. Many people—many nations—can find themselves holding, more orless wittingly, that “every stranger is an enemy.” For the most part this con-viction lies deep down like some latent infection; it betrays itself only in ran-dom, disconnected acts, and does not lie at the base of a system of reason.”
4. Concluding Remarks
The geographic distribution of shareholders of the Regional Bell OperatingCompanies demonstrates the propensity to invest in the familiar. Investment
677
The Review of Financial Studies / v 14 n 3 2001
in the familiar conflicts with portfolio theory’s advice to diversify. Indeed,it may be hazardous to its practitioners’ wealth, especially if they concen-trate large amounts of their retirement money in their employers’ stock. Thisbehavior is consistent with the home country bias and workers’ propensityto invest in their company’s stock. Familiarity is associated with a generalsense of comfort with the known and discomfort with—even distaste for andfear of—the alien and distant. This adds a nonpecuniary dimension to thetraditional risk-return trade-off, which is the focus of earlier studies of theportfolio selection problem.
This study suggests that investors do not optimize along objectiverisk-return trade-offs. Indeed, investors’ heterogeneous experiences will leadthem to invest with different companies. A person is more likely to investwith a company he knows (or thinks he knows). At the extreme, this willlead most people to shy away from foreign stocks and to concentrate theirportfolios on stocks they know—for instance, their own company’s stock,stocks of firms that are visible in the investors’ lives, and stocks that arediscussed favorably in the media.
According to Miller (1986), “for [individual] investors stocks are usuallymore than just the abstract “bundles of returns” of our economic models.Behind each holding may be a story of family business, family quarrels,legacies received, divorce settlements, and a host of other considerationsalmost totally irrelevant to our theories of portfolio selection. That we abstractfrom all these stories in building our models is not because the stories areuninteresting but because they may be too interesting and thereby distract usfrom the pervasive market forces that should be our principal concern.”
When individuals’ stories about portfolio selection are systematicallysimilar, they are pervasive market forces. This article’s assertion that famil-iarity breeds investment is a contribution to portfolio theory. Since portfoliotheory is the foundation of asset pricing theory, implications of this workmay affect our understanding of the way security prices are set.
ReferencesBabad, E., and K. Yosi, 1991, “Wishful Thinking—Against All Odds,” Journal of Applied Social Psychology,21, 1921–1938.
Babad, E., 1995, “Can Accurate Knowledge Reduce Wishful Thinking in Voters’ Predictions of ElectionsOutcomes?” Journal of Psychology, 129, 285–300.
Bar-Hillel, M., and D. Budescu, 1995, “The Elusive Wishful Thinking,” Thinking and Reasoning, 1, 71–103.
Baxter, M., and U. J. Jermann, 1997, “The International Diversification Puzzle Is Worse Than You Think,”American Economic Review, 87, 170–180.
Benartzi, S., 2000, “Excessive Extrapolation and the Allocation of 401(k) Accounts to Company Stock,”working paper, UCLA.
Bernstein Research, 1996, “The Future of Money Management in America, 1997 Edition.”
Brown, P., G. Foster, and E. Noreen, 1985, “Security Analysts Multi-year Earnings Forecasts and the CapitalMarket,” Studies in Accounting Research, vol. 21.
678
Familiarity Breeds Investment
Business Week, 1997, “The Cream of the Crop in Pensions, Too,” May 19.
Cooper, I., and E. Kaplanis, 1986, “Costs of Crossborder Investment and International Equity MarketEquilibrium,” in Jeremy Edwards (ed.), Recent Advances in Corporate Finance, Cambridge University Press,Cambridge.
Cooper, I., and E. Kaplanis, 1994, “Home Bias in Equity Portfolios, Inflation Hedging, and InternationalCapital Market Equilibrium,” Review of Financial Studies, 7, 45–60.
Coval, J. D., and T. J. Moskowitz, 1997, “The Geography of Investment: Are There Gains to InvestingLocally?” working paper, UCLA.
Coval, J. D., and T. J. Moskowitz, 1999, “Home Bias at Home: Local Equity Preference in DomesticPortfolios,” Journal of Finance, 54, 1–39.
Deogun, N., 1997, “The Legacy: Roberto Goizueta Led Coca-Cola Stock Surge, and Its Home Prospers,” WallStreet Journal, October 20.
Driscoll, K., J. Malcolm, M. Sirull, and P. Slotter, 1995, “1995 Gallup Survey of Defined Contribution PlanParticipants,” John Hancock Financial Services, November.
The Economist, 1996, “Stay-at-Home Shareholders,” February 17, p. 75.
Feder, B. J., 1994, “Gerber’s Hometown Ready to Welcome Sandoz,” New York Times, August 2, p. D1.
Feldstein, M., and C. Horioka, 1980, “Domestic Saving and International Capital Flows,” Economic Journal,90, 314–329.
French, K. R., and J. M. Poterba, 1991, “Investor Diversification and International Equity Markets,” AmericanEconomic Review, 81, 222–226.
Gehrig, T., 1993, “An Information Based Explanation of the Domestic Bias in International EquityInvestment,” Scandinavian Journal of Economics, 95, 97–109.
Grossman, S. J., and Z. Zhou, 1997, “Incomplete Equitization and the Foreign Exchange Risk Premium,”working paper, University of Pennsylvania.
Grubel, H. G., 1968, “Internationally Diversified Portfolios,” American Economic Review, 58, 1299–1314.
Heath, C., and A. Tversky, 1991, “Preferences and Beliefs: Ambiguity and Competence in Choice UnderUncertainty,” Journal of Risk and Uncertainty, 4, 5–28.
Kang, J., and R. Stulz, 1997, “Why Is There a Home Bias? An Analysis of Foreign Portfolio Equity Ownershipin Japan,” Journal of Financial Economics, 46, 3–28.
Kahn, V. M., 1997, “A 401(k) with One Big Gun Is One Big Risk,” New York Times, April 6.
Kennickell, A. B., M. Starr-McCluer, and A. E. Sunden, 1997, “Family Finances in the U.S.: Recent Evidencefrom the Survey of Consumer Finances,” Federal Reserve Bulletin, January, 1–24.
Kilka, M., and M. Weber, 1997 “Home Bias in International Stock Return Expectations,” working paper,Universitat Manheim.
Krane, M., 1996, “Earning It: Redress For Broken Nest Eggs,” New York Times, November 3.
Levy, H., and M. Sarnat, 1970, “International Diversification of Investment Portfolios,” American EconomicReview, 60, 668–675.
Levi, P., 1993, Survival in Auschwitz, translated by Stuart Wolf, Macmillan, New York.
Lewis, K. K., 1995, “Puzzles in International Financial Markets,” in G. Grossman, and K. Rogoff (eds.),Handbook of International Economics, vol. III, Amsterdam: North Holland, 1913–1971.
Lewis, K. K., 1999, “Trying to Explain Home Bias in Equities and Consumption,” Journal of EconomicLiterature, 37, 571–608.
679
The Review of Financial Studies / v 14 n 3 2001
Merton, R. C., 1987 “A Simple Model of Capital Market Equilibrium with Incomplete Information,” Journalof Finance, 42, 483–510.
Miller, M. H., 1986, “Behavioral Rationality in Finance,” Journal of Business, 59, S451–S468.
J. P. Morgan, 1997, “Profit Sharing/401(k) Plan, 1997–98 Report to Participants,” J. P. Morgan, New York.
Obstfeld, M., 1995, “International Capital Mobility in the 1990s,” in Peter Kened (ed.), UnderstandingInterdependence,
Pesenti, P., and E. Wincoop, 1996, “Do Nontraded Goods Explain the Home Bias Puzzle?” Working Paperno. 5784, NBER, October.
Schultz, E. E., 1996, “Color Tile Offers Sad Lessons For Investors in 401(k) Plans,” Wall Street Journal,June 5.
Siegel, J. J., and R. H. Thaler, 1997, “The Equity Premium Puzzle,” Journal of Economic Perspectives, 11,191–200.
Solnik, B. H., 1974, “Why Not Diversify Internationally Rather than Domestically?” Financial Analyst Jour-nal, 30, 91–135.
Strong, N., and X. Xu, 1999, “Understanding the Home Equity Bias: Evidence from Survey Data,” workingpaper, University of Manchester.
Tesar, L. L., and I. M. Werner, 1995, “Home Bias and High Turnover,” Journal of International Money andFinance, 14, 467–492.
680
Related Documents