Gardner-Webb University

Welcome message from author
This document is posted to help you gain knowledge. Please leave a comment to let me know what you think about it! Share it to your friends and learn new things together.
Transcript
Gardner-Webb University

Fall 2005 Spring 2006 Fall 2006 Spring 2007
Lawrence, Donald L. SSCI 1 Smith, Craig W. PSYC 1 Gambill, Steve SSCI 2 Boner, John W. SSCI 1Lineberger, Jason A. ENGL 1 Blanton, Thomas E. RELI 1 Patrick, Timothy A. SSCI 1 Craig, Homer W. SSCI 4Dell'Aquila, Sherry T. BUSN 1 Boling, Nancy L. PSYC 1 Craig, Homer W. SSCI 3 Greenwood, William I. RELI 3Greenwood, William I. RELI 1 Whitehead, Geoffrey I. ARTS 1 Boling, Nancy L. PSYC 2 Barkley, Wesley W. SSCI 1Craig, Homer W. SSCI 1 Coffey, Sandra J. PSYC 1 Brown, Gregory J. PSYC 1 Bridgeman, William M. BUSN 1Edwards, Lewis W. SSCI 1 Netterville, Anna SSCI 1 Pons, Frank H. NSCI 1 Haynes, Emma BUSN 1Stafford, Nathan A. BUSN 1 Ricks, Shawn PSYC 1 Dell'Aquila, Sherry T. BUSN 2 Russell, Gay R. ENGL 1Sizemore, Frances B. BUSN 1 Boone, Roy E. BUSN 1 Ellis, Richard D. BUSN 1 Coulter, Cynthia L. MATH 1Morgan, Virginia D. MATH 1 Padgett, Diane W. EDUC 1 Hayes, Clarence R. BUSN 1 Brooks, Mark L. SSCI 1Penley, Jeffrey D. BUSN 1 Bishop, Randy A. RELI 1 Meade, Russell A. BUSN 1 Queen, Lisa R. PEWS 1Mason, Robert S. MATH 1 Martin, Cindy H. NSCI 1 Smith, Craig W. PSYC 2 Childers, Janet S. RELI 1Hall, Amos M. PSYC 1 Greenwood, William I. RELI 2 Ricks, Shawn PSYC 2 Dell'Aquila, Sherry T. BUSN 3Ledford, Katherine E. ENGL 1 Craig, Homer W. SSCI 2 Lineberger, Jason A. ENGL 2 Patterson, Jeffrey S. RELI 1Cliver, Don RELI 1 Gambill, Steve SSCI 1 Willis, Jason A. MATH 1 Marshall, David A. NSCI 1Carmichael, Richard E. BUSN 1 Wilson, Darrell G. BUSN 1 Schenck, Elizabeth H. PSYC 1 Morgan, Virginia D. NSCI 2
Student Choice Awards (GOAL Adjuncts)
Beginning with the 2005‐06 academic year, the GOAL program began formally recognizing adjunct faculty members whoreceived the highest scores each semester on the Student Opinion of Instruction survey. A minimum of seven submittedevaluations is required in order to be eligible for consideration.
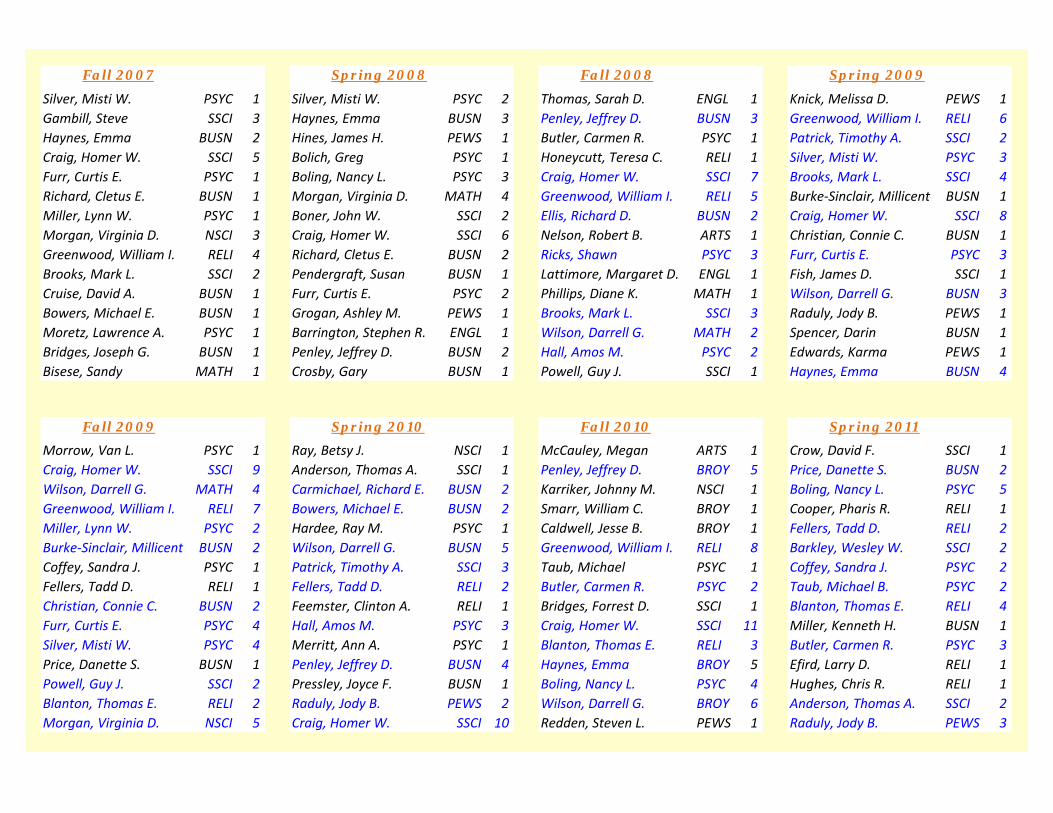
Fall 2007 Spring 2008 Fall 2008 Spring 2009
Silver, Misti W. PSYC 1 Silver, Misti W. PSYC 2 Thomas, Sarah D. ENGL 1 Knick, Melissa D. PEWS 1Gambill, Steve SSCI 3 Haynes, Emma BUSN 3 Penley, Jeffrey D. BUSN 3 Greenwood, William I. RELI 6Haynes, Emma BUSN 2 Hines, James H. PEWS 1 Butler, Carmen R. PSYC 1 Patrick, Timothy A. SSCI 2Craig, Homer W. SSCI 5 Bolich, Greg PSYC 1 Honeycutt, Teresa C. RELI 1 Silver, Misti W. PSYC 3Furr, Curtis E. PSYC 1 Boling, Nancy L. PSYC 3 Craig, Homer W. SSCI 7 Brooks, Mark L. SSCI 4Richard, Cletus E. BUSN 1 Morgan, Virginia D. MATH 4 Greenwood, William I. RELI 5 Burke‐Sinclair, Millicent BUSN 1Miller, Lynn W. PSYC 1 Boner, John W. SSCI 2 Ellis, Richard D. BUSN 2 Craig, Homer W. SSCI 8Morgan, Virginia D. NSCI 3 Craig, Homer W. SSCI 6 Nelson, Robert B. ARTS 1 Christian, Connie C. BUSN 1Greenwood, William I. RELI 4 Richard, Cletus E. BUSN 2 Ricks, Shawn PSYC 3 Furr, Curtis E. PSYC 3Brooks, Mark L. SSCI 2 Pendergraft, Susan BUSN 1 Lattimore, Margaret D. ENGL 1 Fish, James D. SSCI 1Cruise, David A. BUSN 1 Furr, Curtis E. PSYC 2 Phillips, Diane K. MATH 1 Wilson, Darrell G. BUSN 3Bowers, Michael E. BUSN 1 Grogan, Ashley M. PEWS 1 Brooks, Mark L. SSCI 3 Raduly, Jody B. PEWS 1Moretz, Lawrence A. PSYC 1 Barrington, Stephen R. ENGL 1 Wilson, Darrell G. MATH 2 Spencer, Darin BUSN 1Bridges, Joseph G. BUSN 1 Penley, Jeffrey D. BUSN 2 Hall, Amos M. PSYC 2 Edwards, Karma PEWS 1Bisese, Sandy MATH 1 Crosby, Gary BUSN 1 Powell, Guy J. SSCI 1 Haynes, Emma BUSN 4
Fall 2009 Spring 2010 Fall 2010 Spring 2011
Morrow, Van L. PSYC 1 Ray, Betsy J. NSCI 1 McCauley, Megan ARTS 1 Crow, David F. SSCI 1Craig, Homer W. SSCI 9 Anderson, Thomas A. SSCI 1 Penley, Jeffrey D. BROY 5 Price, Danette S. BUSN 2Wilson, Darrell G. MATH 4 Carmichael, Richard E. BUSN 2 Karriker, Johnny M. NSCI 1 Boling, Nancy L. PSYC 5Greenwood, William I. RELI 7 Bowers, Michael E. BUSN 2 Smarr, William C. BROY 1 Cooper, Pharis R. RELI 1Miller, Lynn W. PSYC 2 Hardee, Ray M. PSYC 1 Caldwell, Jesse B. BROY 1 Fellers, Tadd D. RELI 2Burke‐Sinclair, Millicent BUSN 2 Wilson, Darrell G. BUSN 5 Greenwood, William I. RELI 8 Barkley, Wesley W. SSCI 2Coffey, Sandra J. PSYC 1 Patrick, Timothy A. SSCI 3 Taub, Michael PSYC 1 Coffey, Sandra J. PSYC 2Fellers, Tadd D. RELI 1 Fellers, Tadd D. RELI 2 Butler, Carmen R. PSYC 2 Taub, Michael B. PSYC 2Christian, Connie C. BUSN 2 Feemster, Clinton A. RELI 1 Bridges, Forrest D. SSCI 1 Blanton, Thomas E. RELI 4Furr, Curtis E. PSYC 4 Hall, Amos M. PSYC 3 Craig, Homer W. SSCI 11 Miller, Kenneth H. BUSN 1Silver, Misti W. PSYC 4 Merritt, Ann A. PSYC 1 Blanton, Thomas E. RELI 3 Butler, Carmen R. PSYC 3Price, Danette S. BUSN 1 Penley, Jeffrey D. BUSN 4 Haynes, Emma BROY 5 Efird, Larry D. RELI 1Powell, Guy J. SSCI 2 Pressley, Joyce F. BUSN 1 Boling, Nancy L. PSYC 4 Hughes, Chris R. RELI 1Blanton, Thomas E. RELI 2 Raduly, Jody B. PEWS 2 Wilson, Darrell G. BROY 6 Anderson, Thomas A. SSCI 2Morgan, Virginia D. NSCI 5 Craig, Homer W. SSCI 10 Redden, Steven L. PEWS 1 Raduly, Jody B. PEWS 3

Fall 2011 Spring 2012
Miller, Kimberly D. PSYC 1 Barkley, Wesley W. SSCI 4Barkley, Wesley W. SSCI 3 Craig, Homer W. SSCI 13Craig, Homer W. SSCI 12 Efird, Larry D. RELI 2Fish, James D. SSCI 2 Butler, Carmen R. PSYC 4Pallick, Ronald PSYC 1 Greenwood, William I. RELI 9Patrick, Timothy A. SSCI 4 Patrick, Timothy A. SSCI 5Watford, Courtney E. PSYC 1 Fellers, Tadd D. RELI 4Carmichael, Richard E. BROY 3 Karriker, Johnny M. NSCI 2Furr, Curtis E. PSYC 5 Fish, James D. SSCI 3Sparti, Frances NURS 1 Hall, Amos M. PSYC 5Bridges, Forrest D. BROY 2 Taylor, Mischia A. BROY 1Brown, Bobby G. SSCI 1 Bridges, Forrest D. BROY 3Burke‐Sinclair, Millicent G BROY 3 Regan, Brian K. SSCI 1Chester, Terri D. PSYC 1 Brown, Bobby G. SSCI 2Hall, Amos M. PSYC 4 Queen, Lisa R. PEWS 2

Fall 2008 Spring 2009
Morgan, James P. PSYC 1 Sykes, Dianne L. SSCI 2Sykes, Dianne L. SSCI 1 Berry, Donald L. RELI 1Munoz, Robert D. SSCI 1 Camp, Sue C. BROY 2Willis, Jason A. MATH 1 Morgan, James P. PSYC 2Carpenter, Thomas E. PSYC 1 Willis, Jason A. MATH 2Smith, Elveta D. BROY 1 Carpenter, Thomas E. PSYC 2Sparti, Frances NURS 1 Blevins, Kent B. RELI 1Hodge, Mary Alice M. NURS 1 Munoz, Robert D. SSCI 2Camp, Sue C. BROY 1 Davis, Christopher V. ENGL 2Gaddis, Roger G. PSYC 1 Hoyle, Tammy C. MATH 1Davis, Christopher V. ENGL 1 Hodge, Mary Alice M. NURS 2Cox, Barbara G. SSCI 1 Totten, Venita L. NSCI 1
Fall 2009 Spring 2010
Johnson, James C. MATH 1 Phillips, Teresa R. FLAN 1Sykes, Dianne L. SSCI 3 Davis, Christopher V. ENGL 4Davis, Christopher V. ENGL 3 Sparti, Frances NURS 3Willis, Jason A. MATH 3 Zehnder, Timothy J. NSCI 1Zamora, Oscar BUSN 1 Sykes, Dianne L. SSCI 4Carpenter, Thomas E. PSYC 3 Graham, R V. BUSN 1Hodge, Mary Alice M. NURS 3 Walker, Vickie R. NURS 2Sparti, Frances NURS 2 Morgan, James P. PSYC 3Camp, Sue C. BUSN 3 Bottoms, Ira G. BUSN 1Walker, Vickie R. NURS 1 Camp, Sue C. BUSN 4Hoyle, Tammy C. MATH 2 Baker, Russel K. PEWS 1Vanderburg, Timothy W. SSCI 1 Carpenter, Thomas E. PSYC 4
Fall 2010 Spring 2011
Sykes, Dianne L. SSCI 5 Willis, Jason A. MATH 5Graham, R V. BROY 2 Davis, Christopher V. ENGL 6Walker, Vickie R. NURS 3 Munoz, Robert D. PSYC 4Little, Rebecca B. NURS 1 Sykes, Dianne L. SSCI 6McNeely, Sara N. PEWS 1 Camp, Sue C. BROY 6Davis, Christopher V. ENGL 5 Rome, Candice J. NURS 1Camp, Sue C. BROY 5 Collins, Joseph W. RELI 1Willis, Jason A. MATH 4 Mankins, Sandra H. BUSN 1Munoz, Robert D. PSYC 3 Walker, Vickie R. NURS 4Hodge, Mary Alice M. NURS 4 Carpenter, Thomas E. PSYC 6Totten, Venita L. NSCI 2 Arnold, Tracy D. NURS 1Carpenter, Thomas E. PSYC 5 Graham, R V. BROY 3
Student Choice Awards (GOAL FTTF)
Beginning with the 2008-09 academic year, the GOAL program began formally recognizing members ofthe full-time teaching faculty who received the highest scores each semester on the Student Opinion ofInstruction survey. A minimum of seven submitted evaluations is required in order to be eligible forconsideration.

Fall 2011 Spring 2012
Warden, Shannon PSYC 1 Davis, Christopher V. ENGL 8Schoenfeldt, Robin NURS 1 Mankins, Sandra H. BROY 2Hodge, Mary Alice M. NURS 5 Arnold, Tracy D. NURS 3Carpenter, Thomas E. PSYC 7 Eddins, Stefka G. NSCI 1Berry, Donald L. RELI 2 Walker, Vickie R. NURS 5Davis, Christopher V. ENGL 7 Rome, Candice J. NURS 3Arnold, Tracy D. NURS 2 Sykes, Dianne L. SSCI 7Serafica, Reimund C. NURS 1 Hoyle, Tammy C. MATH 3Rome, Candice J. NURS 2 Godfrey, Earl H. BROY 1Camp, Sue C. BROY 7 Graham, R V. BROY 4Mankins, Sandra H. BROY 1 Baker, Russel K. PEWS 2Lane, Susan H. NURS 1 Lane, Susan H. NURS 2
Dr. Don Caudill Dr. Perry Hildreth Dr. Susan Ali Ms. Jennifer BucknerDr. Cathleen Ciesielski Dr. Carroll Smith Dr. Nancy Bottoms
Dr. Jeff Hartman Dr. Tim Vanderburg Dr. Cathleen Ciesielski
Dr. Vickie Walker Dr. Danny West Dr. Joe Collins
Dr. Mary Alice Hodge
Dr. Shonna Snyder
Dr. Jeff Hartman
Dr. Perry Hildreth Ms. Susan Bell Dr. Sheila Ingle Mr. Jason WillisDr. Sheila Ingle Dr. Thomas Meaders Dr. Michael KuchinskyDr. Michael Kuchinsky Dr. Olga Poliakova Dr. Faye RuckerDr. Lane Wesson Dr. Tim ZehnderDr. Dianne Sykes
Dr. Sydney Brown Mr. Doug Knotts Dr. Sydney BrownDr. Robert Carey Mr. Mickey MetcalfDr. Willie FlemingDr. Linda GreeneDr. Don OliveDr. Eddie Stepp
Dr. Earl Godfrey Dr. Earl Godfrey Dr. Robert CareyDr. John Kaufhold Dr. David Parker Dr. Eileen ColonMr. Christopher Keene Dr. Patricia Sparti Mr. R. Van GrahamDr. Miroslaw Mystkowski Mr. Christopher KeeneDr. Felice Policastro Dr. Miroslaw MystkowskiDr. Faye Rucker Dr. Felice PolicastroDr. Patricia Sparti Dr. Lane WessonDr. Deborah Ware
Dr. Ben Brooks Dr. Ken Baker Dr. Ben Brooks Ms. Mary Alice HodgeDr. Chris Davis Dr. Franki Burch Dr. Chris Davis Ms. Linda WinesDr. Stefka Eddins Dr. Doug Eury Dr. Stefka EddinsDr. Paul Etter Dr. Dan Goodman Dr. Paul EtterDr. Doug Eury Dr. Ute Lahaie Dr. Linda GreeneDr. David Judge Dr. Paula Qualls Dr. David JudgeDr. David Shellman Dr. Laura Smith Dr. Vicky RatchfordDr. Venita Totten Dr. Matt Theado Dr. David Shellman
Dr. Eddie SteppDr. Venita Totten
Dr. Gail Stowe Dr. Don Berry Dr. Earl Godfrey Ms. Tammy HoyleDr. Tim Vanderburg Dr. Robert Canoy Dr. Gail Stowe Ms. Darlene StreetDr. Danny West Dr. Tamara Cox Dr. Tim Vanderburg
Dr. Faith Weathington
Dr. Franki Burch Dr. Charles Moore Dr. Debra Miles Ms. Susan ManahanDr. Daniel Goodman Dr. Sophia Steibel Dr. Carroll SmithDr. Ute Lahaie Dr. Ron WilliamsDr. Thomas Meaders Dr. Deborah WittigDr. James NogalskiDr. Carroll SmithDr. Laura SmithDr. Faith Weathington
Dr. Rebecca Beck‐Little Dr. Rebecca Beck‐Little Dr. Larisa Bulysheva Ms. Teri HassellDr. Donald Berry Dr. Lucenda McKinney Dr. Doug EuryDr. Doug Bryan Dr. Ron Nanney Dr. Mary HighDr. Mary High Dr. Olga PoliakovaDr. Jim Lawrence Dr. Phillip SwicegoodDr. Olga PoliakovaDr. Paula QuallsDr. Phillip SwicegoodDr. Deborah Wittig
Dr. Robert Canoy Dr. Kent Blevins Ms. Susan Bell Mr. Bob CareyDr. Doug Dickens Dr. David Carscaddon Mr. Doug Knotts Ms. Trisa Hines
Dr. Johnnie Hamrick Dr. Patricia Sparti Ms. Sharon Starr Dr. June Hobbs Ms. Lane WessonDr. Janet LandDr. Wanda Stutts
Dr. Ken Baker Dr. Carol Blassingame Dr. David ParkerDr. David Carscaddon Dr. Matt Whitfield Dr. Paula QuallsDr. Ron NanneyDr. David ParkerDr. Tim Zehnder
2003
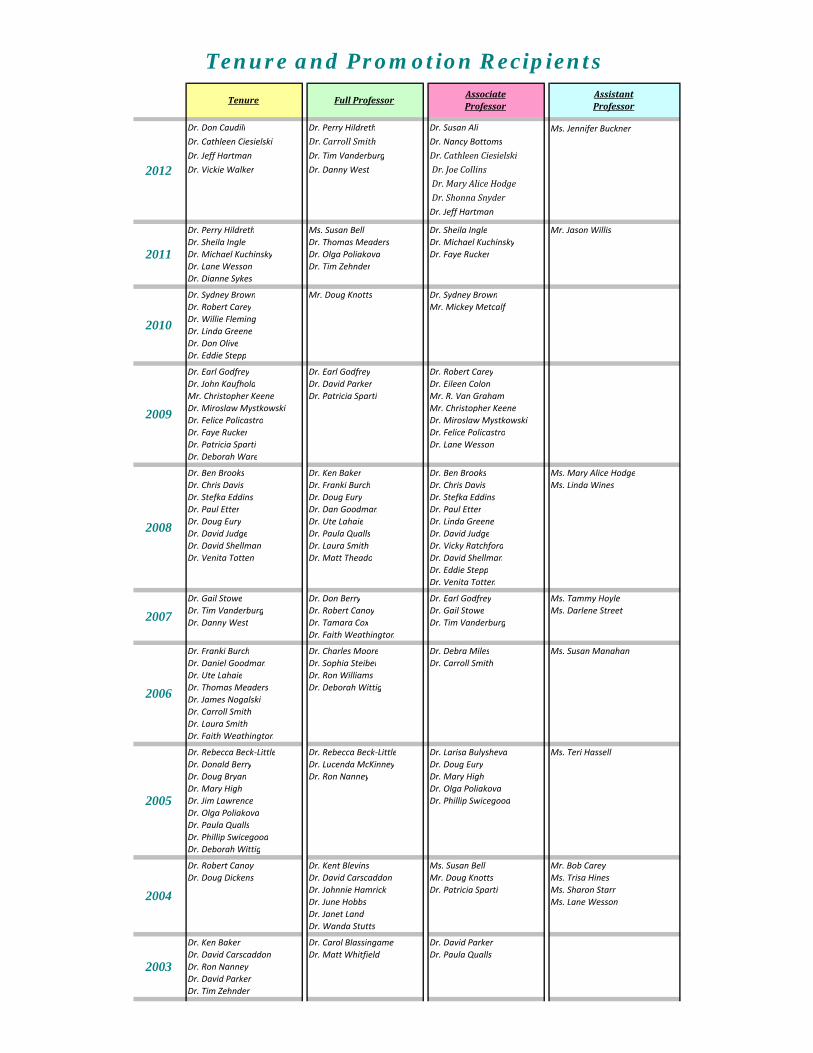
Full Professor
2008
2010
2006
2011
Tenure and Promotion Recipients
2007
AssistantProfessor
2004
Tenure
2009
2005
AssociateProfessor
2012

Dr. Kent Blevins Dr. David Yelton Dr. Ken Baker Mr. Chris ParsonsDr. Tamara Cox Dr. Rebecca Beck‐LittleDr. Lorin Cranford Dr. Tamara CoxDr. Charles Moore Dr. Matt TheadoDr. Donna SimmonsDr. Matt TheadoDr. Ron Williams
Dr. Carol Blassingame Dr. Sheri Adams Mr. Keith CagleDr. Anne Henderson Dr. Arlen HontsDr. Lucenda McKinney Dr. Ron WilliamsDr. Wanda Stutts Dr. Charles Moore
Ms. Nell Griggs
Dr. Johnnie Hamrick Dr. Robert Bass Dr. Lucenda McKinneyDr. Arlen Honts Dr. Donna Ellington Dr. Timothy ZehnderDr. Gerald KeownDr. Mary Alice Seals
Dr. Sheri Adams Dr. Marcia Miller Dr. David CarscaddonDr. Robert Bass Dr. Robert Munoz Dr. June HobbsDr. June Hobbs Dr. Anthony Negbenebor Dr. Janet LandDr. Janet Land Dr. Wanda StuttsDr. Marcia MillerDr. Wayne Stacy
1998 Dr. Sophia Steibel Dr. Johnnie Hamrick Ms. Susie Little
Dr. Donna Ellington Dr. Bonnie Wright Dr. David Yelton Ms. Raquel BarretoDr. Bob Shackleford Mr. Earl GodfreyDr. Marvin Taylor Dr. Sophia SteibelDr. David Yelton
Dr. Ruth Pace Dr. Gayle Price Dr. Russell Hardin Ms. Lynn KeeterDr. Matt Whitfield Dr. Robert Shackleford Ms. Lucenda McKinney
Dr. Matt Whitfield Ms. Barbara Selph
Dr. Ben Carson Dr. Stephen Plate Dr. Donna Ellington Mr. David CarscaddonDr. Gayle Price Dr. Dan ProctorDr. Ted Vaughan
Dr. Doris Banner Dr. Anthony Negbenebor Mr. Tom EnglishDr. Anthony Negbenebor Dr. Larry GreggDr. Stephen Plate
Dr. Darlene Gravett Dr. Sue CampDr. Robert Munoz Dr. Keith Griggs
Dr. Ted Vaughan
Dr. Pat Partin Dr. Stan Smedley Dr. Bonnie Wright Ms. Donna EllingtonDr. Oland Summers
Dr. Bonnie Wright Dr. Glenn Bottoms Dr. Gary Chandler Ms. Susan BellDr. Tom JonesDr. Jeff Tubbs
Dr. Frieda Brown Dr. Carolyn Billings Dr. Frieda Brown Ms. Margaret PlowdenDr. Shirley Toney Dr. Shirley Toney
1989
Dr. Glenn Bottoms Dr. Dee Hunt Dr. Sue CampDr. Sue Camp Dr. Keith Griggs
Dr. Dennis Quinn
Dr. Andrew Ash Dr. Terry Fern Dr. Andrew AshDr. Jack Partain Dr. Jeff TubbsDr. Dennis QuinnDr. Jeff Tubbs
Dr. Terry Fern Dr. Logan Carson Dr. Tom JonesDr. Jeffrey Chang Dr. Stanley SmedleyDr. Alice Cullinan
Dr. Tim Cherry Ms. Johnnie HamrickMr. James Hartman
Dr. Janie Carlton Dr. Ernice Bookout Ms. Kennedy CabellDr. John Drayer Mr. Robert Decker Dr. Dennis QuinnDr. Roger Gaddis Dr. David DeGraff Mr. Ted Stanley
Dr. Barbara Burkett Dr. Carolyn Billings Dr. Tom JonesDr. Joseph Hughey Ms. Patsy QueenDr. Dee Hunt Dr. Rick Wilson
Dr. Gil Blackburn Dr. Barry HambrightDr. Joyce Brown Dr. Joseph HugheyDr. Les BrownDr. Launita Proctor
1982
1983
1988
1987
1986
1994
1984
1985
1990
1997
2002
1995
1999
1992
1996
1991
1993
2001
2000

RECIPIENT DEPARTMENT
Dr. Anthony Eastman Social Sciences
Dr. Lonnie Proctor Physical Education
Dr. Charles Andrews Foreign Languages
Dr. Michael Harrelson Natural Sciences
Dr. Jim Taylor English
Dr. Gil Blackburn Social Sciences
Dr. Dee Hunt Physical Education
Dr. Rick Wilson Religious Studies
Dr. Charles Andrews Foreign Languages
Dr. Robert Morgan Foreign Languages
Dr. Ted Monroe Mathematics
Dr. Freida Brown Psychology
Dr. Alice Cullinan Religious Studies
Dr. Anthony Eastman Social Sciences
Dr. Dee Hunt Physical Education
Dr. Barry Hambright Social Sciences
Dr. Tom Jones Natural Sciences
Dr. Jack Partain Religious Studies
Ms. Barbara Stansbury Foreign Languages
Dr. Anthony Negbenebor Broyhill
Dr. Carolyn Billings Fine Arts
Dr. David Carscaddon Psychology
Dr. Stephen Plate Fine Arts
Dr. Gayle Price English
Dr. David Yelton Social Sciences
Dr. Lucenda McKinney Education
Dr. Tim Zehnder Natural Sciences
Dr. Sophia Steibel School of Divinity
Dr. Tamara Cox World Languages
Dr. Paula Qualls Religious Studies
Dr. Matt Theado English
Dr. June Hobbs English
Dr. Janet Land English
Dr. Jim Morgan Psychology
1983
1980
2008
2004
Outstanding Professor Award
1998199719961995
1977
19811982
2005
2003
1976
2011
19931992
2000
1994
2002
1984
19871988
1986
2001
1989
1991
2012
2007
1985
19781979
20102009
1999
2006
1990
In 1977, Gardner-Webb's Alpha Chi Honor Society initiated the annual process of recognizing the University's most outstanding member of the full-time teaching faculty. The chapter's nominations were presented to the faculty and the final vote was taken at the March general faculty meeting.
Beginning in 1987, a select committee consisting of administrators, alumni, faculty and students was established to receive nominations from various quarters and identify that year's winner.
Known as the Fleming-White Award from 1987-2002, the recognition is now known as Gardner-Webb University's Outstanding Professor Award.

NAME DEPT YRS BEGAN
1 Harrelson, Pat ARTS 40 1974
2 Camp, Sue BROY 37 1976
3 Billings, Carolyn ARTS 34 1979
4 Jones, Tom NSCI 33 1980
5 Carlton, Janie NURb 31 1982
6 Brown, Frieda PSYC 30.5 1983
6 Bottoms, Glenn BUSN 30 1983
8 Miller, Marcia* NURS 36 1977
9 Bell, Susan ARTS 27 1986
10 Godfrey, Earl BUSN 25 1988
10 Ellington, Donna SOSC 25 1988
12 Munoz, Rob SOSC 24 1989
12 Negbenebor, Anthony BUSN 24 1989
13 Johnson, James MATH 23 1990
13 Carscaddon, David PSYC 23 1990
13 Hoyle, Tammy MATH 23 1990
13 Yelton, David SOSC 23 1990
17 Little, Rebecca-Beck NURS 22 1991
18 GODFREY, EARL H. BUSN 20 1992
18 MCKINNEY, LUCENDA EDUC 20 1992
18 WHITFIELD, JAMES M. ARTS 20 1992
(as of the end of the Spring 2012 semester)
Longest ServiceFull-Time Teaching Faculty
* non-continuous service

Susie Beck‐Little, ADNursing 1 Dee Hunt, PEWSS 1 Dee Hunt, PEWSS 1Alice Cullinan, Religious Studies 1 Alice Cullinan, Religious Studies 2 Carolyn Billings, Fine Arts 2Ron Williams, Religious Studies 1 Paula Qualls, Religious Studies 1 Ron Williams, Religious Studies 3Carolyn Billings, Fine Arts 1 Ron Williams, Religious Studies 2 Stephen Plate, Fine Arts 1Darlene Gravett, English 1 Cindy McKinney, Education 1 Larry Brey, PEWSS 1Carol Blassingame, PEWSS 1 Jackson Rainer, Psychology 2 Trisa Hines, ADNursing 1June Hobbs, English 1 Susan Bell, Fine Arts 1 David Carscaddon, Psychology 2Jackson Rainer, Psychology 1 Tim Zehnder, Natural Sciences 1 Mary Lou Hodge, ADNursing 1David Carscaddon, Psychology 1 Susie Beck‐Little, ADNursing 2 Tony Eastman, Social Sciences 1
Keith Cagle, Foreign Languages 1 Alice Cullinan, Religious Studies 3Tamara Cox, Foreign Languages 1 David Parker, English 1Matt Theado, English 1 Sandra King, BSNursing 1
Alice Cullinan, Religious Studies 4 Ron Williams, Religious Studies 5 Carolyn Billings, Fine Arts 3Ron Williams, Religious Studies 4 Teresa Phillips, Foreign Languages 2 Venita Totten, Natural Sciences 2Paula Qualls, Religious Studies 2 David Carscaddon, Psychology 4 Teresa Phillips, Foreign Languages 3Franki Burch, PEWSS 1 Franki Burch, PEWSS 2 Gail Stowe, Education 1David Carscaddon, Psychology 3 Carol Blassingame, PEWSS 2 David Carscaddon, Psychology 5Debbie Cody, BSNursing 1 Janet Painter, Education 2 Janet Land, English 2Cindy McKinney, Education 2 Paula Qualls, Religious Studies 3 Phillip Swicegood, Broyhill 1Mary Lou Hodge, ADNursing 2 Venita Totten, Natural Sciences 1 Carol Blassingame, PEWSS 3Teresa Phillips, Foreign Languages 1 Kirk Peterson, PEWSS 1 Paul Etter, Fine Arts 1Janet Painter, Education 1 Janet Land, English 1 Lane Wesson, Education 1Charles Moore, Foreign Languages 1 Susan Bell, Fine Arts 2 Ashley White, PEWSS 1Tamara Cox, Foreign Languages 2 David Parker, English 2 Paula Qualls, Religious Studies 4
Franki Burch, PEWSS 3 Franki Burch, PEWSS 4 Dee Hunt, PEWSS 3Venita Totten, Natural Sciences 3 Scot Lahaie, Comm Studies 1 Linda Wines, AANursing 1Lane Wesson, Education 2 Venita Totten, Natural Sciences 4 Lane Wesson, Education 3Paula Qualls, Religious Studies 5 Wanda Stutts, BSNursing 1 Ben Brooks, Natural Sciences 3Ron Williams, Religious Studies 6 Eddie Stepp, Religious Studies 2 Sydney Brown, Education 2Ben Brooks, Natural Sciences 1 Ben Brooks, Natural Sciences 2 Paula Qualls, Religious Studies 6David Parker, English 3 Janet Land, English 3 Venita Totten, Natural Sciences 5Cindy McKinney, Education 3 David Parker, English 4 Scot Lahaie, Comm Studies 2Eddie Stepp, Religious Studies 1 Doug Bryan, Religious Studies 2 Franki Burch, PEWSS 5Doug Bryan, Religious Studies 1 Ron Williams, Religious Studies 7 Doug Bryan, Religious Studies 3Sydney Brown, Education 1 Van Graham, Broyhill 1 Teresa Phillips, World Languages 5David Carscaddon, Psychology 6 Teresa Phillips, World Languages 4 David Carscaddon, Psychology 7
2006 - 2007
Students' Choice Award Winners
2001 - 2002 2002 - 2003 Fall 2003 Only
1998 - 1999 1999 - 2000 2000 - 2001
2004 - 2005 2005 - 2006
Members of the full‐time teaching faculty who receive the highest scores on the Student Opinion of Instruction survey are recognized as Students' Choice Award winners. In addition to high total scores, faculty considered for this honor must have taught in both the fall and spring semesters of the academic year, and must have received at least 10
evaluations each semester and at least 30 evaluations for the entire year.

Lane Wesson, Education 4 Ben Brooks, Natural Sciences 4 Ben Brooks, Natural Sciences 5Scot Lahaie, Comm Studies 3 Janet Land, English 4 Teralea Moore, Mathematics 1Dee Hunt, PEWSS 4 Lane Wesson, Education 5 Janet Land, English 5Paula Qualls, Religious Studies 7 Linda Wines, Nursing 3 Paula Qualls, Religious Studies 9Jennifer Buckner, English 1 James Morgan, Psychology 1 June Hobbs, English 3Sydney Brown, Education 3 Sydney Brown, Education 4 Cathleen Ciesielski, Natural Sciences 2Ron Williams, Religious Studies 8 Paula Qualls, Religious Studies 8 Paul Etter, Fine Arts 3Venita Totten, Natural Sciences 6 Cathleen Ciesielski, Natural Sciences 1 Thomas Carpenter, Psychology 1Anthony Negbenebor, Broyhill 1 June Hobbs, English 2 Charles Tichenor, Business 1Linda Wines, AANursing 2 James English, Natural Sciences 1 Jennifer Buckner, English 2David Parker, English 5 Tim Zehnder, Natural Sciences 2 Cindy McKinney, Education 4Van Graham, Broyhill 2 Paul Etter, Fine Arts 2 Sydney Brown, Education 5
Paula Qualls, Religious Studies 10 Nicole Waters, Nursing 1Sandra Mankins, Business 1 Ben Brooks, Natural Sciences 6Carolyn Billings, Fine Arts 4 Tracy Arnold, Nusring 2Steven Johnson, Business 1 John Coates, World Languages 2John Coates, World Languages 1 Janet Land, English 7Candice Rome, Nursing 1 Carolyn Billings, Fine Arts 5Janet Land, English 6 James Morgan, Psychology 3James Morgan, Psychology 2 Jennifer Buckner, English 3Tracy Arnold, Nusring 1 Sandra Mankins, Business 2Robin Schoenfeldt, Nursing 1 Candice Rome, Nursing 2Dianne Sykes, Social Sciences 1 Christopher Davis, English 1Vickie Walker, Nursing 1 Paula Qualls, Religious Studies 11
2011 - 20122010 - 2011
2008 - 20092007 - 2008 2009 - 2010
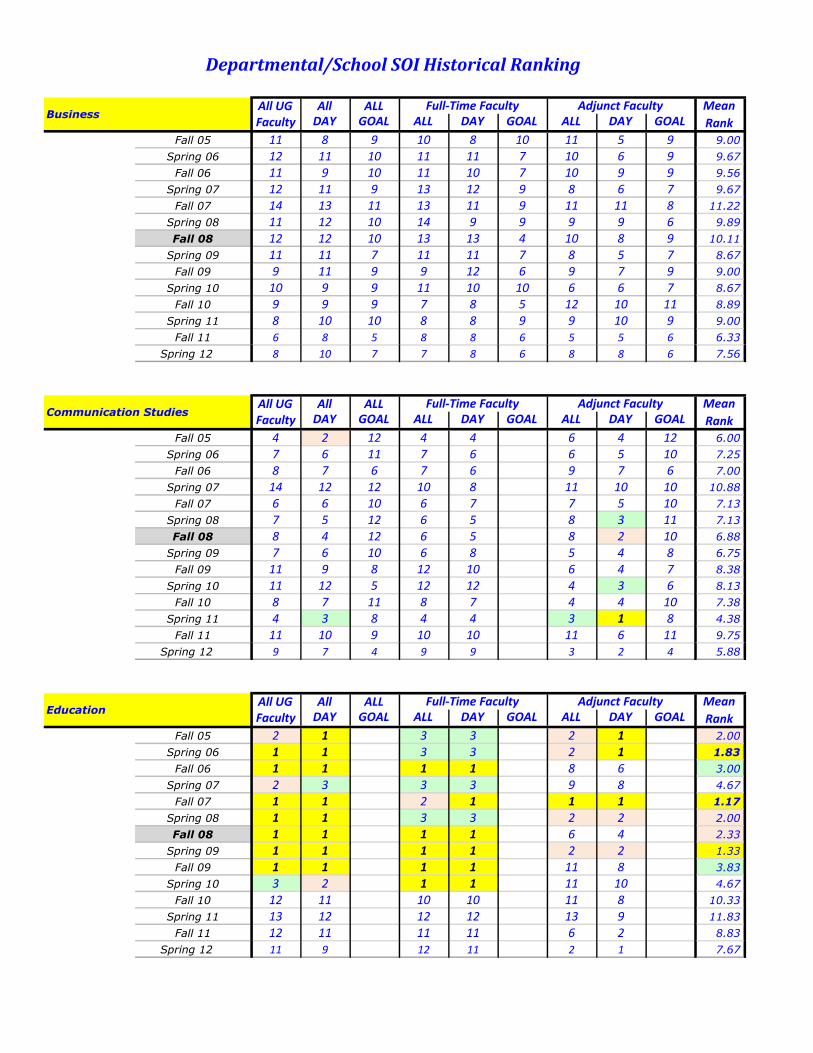
All UG All ALLFaculty DAY GOAL ALL DAY GOAL ALL DAY GOAL
11 8 9 10 8 10 11 5 9 9.00
12 11 10 11 11 7 10 6 9 9.67
11 9 10 11 10 7 10 9 9 9.56
12 11 9 13 12 9 8 6 7 9.67
14 13 11 13 11 9 11 11 8 11.22
11 12 10 14 9 9 9 9 6 9.89
12 12 10 13 13 4 10 8 9 10.11
11 11 7 11 11 7 8 5 7 8.67
9 11 9 9 12 6 9 7 9 9.00
10 9 9 11 10 10 6 6 7 8.67
9 9 9 7 8 5 12 10 11 8.89
8 10 10 8 8 9 9 10 9 9.00
6 8 5 8 8 6 5 5 6 6.33
Spring 12 8 10 7 7 8 6 8 8 6 7.56
All UG All ALLFaculty DAY GOAL ALL DAY GOAL ALL DAY GOAL
4 2 12 4 4 6 4 12 6.00
7 6 11 7 6 6 5 10 7.25
8 7 6 7 6 9 7 6 7.00
14 12 12 10 8 11 10 10 10.88
6 6 10 6 7 7 5 10 7.13
7 5 12 6 5 8 3 11 7.13
8 4 12 6 5 8 2 10 6.88
7 6 10 6 8 5 4 8 6.75
11 9 8 12 10 6 4 7 8.38
11 12 5 12 12 4 3 6 8.13
8 7 11 8 7 4 4 10 7.38
4 3 8 4 4 3 1 8 4.38
11 10 9 10 10 11 6 11 9.75
Spring 12 9 7 4 9 9 3 2 4 5.88
All UG All ALLFaculty DAY GOAL ALL DAY GOAL ALL DAY GOAL
2 1 3 3 2 1 2.00
1 1 3 3 2 1 1.83
1 1 1 1 8 6 3.00
2 3 3 3 9 8 4.67
1 1 2 1 1 1 1.17
1 1 3 3 2 2 2.00
1 1 1 1 6 4 2.33
1 1 1 1 2 2 1.33
1 1 1 1 11 8 3.83
3 2 1 1 11 10 4.67
12 11 10 10 11 8 10.33
13 12 12 12 13 9 11.83
12 11 11 11 6 2 8.83
Spring 12 11 9 12 11 2 1 7.67
Spring 07
Fall 07
Spring 08
Fall 08
Spring 09
Fall 09
Spring 10
Fall 10
Spring 11
Fall 10
Spring 11
Education
Fall 05
Spring 06
Fall 06
Spring 10
Fall 10
Spring 11
Fall 05
Spring 06
Fall 06
Fall 11
Spring 08
Adjunct FacultyFull-Time Faculty
Full-Time Faculty Adjunct Faculty
Fall 08
Spring 09
Fall 09
Business
Fall 05
Spring 06
Fall 06
Spring 07
Fall 07
Communication Studies
Spring 07
Fall 07
Spring 08
Fall 08
Spring 09
Fall 09
Spring 10
Mean
Rank
Full-Time Faculty Adjunct Faculty
Departmental/School SOI Historical Ranking
Mean
Rank
Mean
Rank
Fall 11
Fall 11

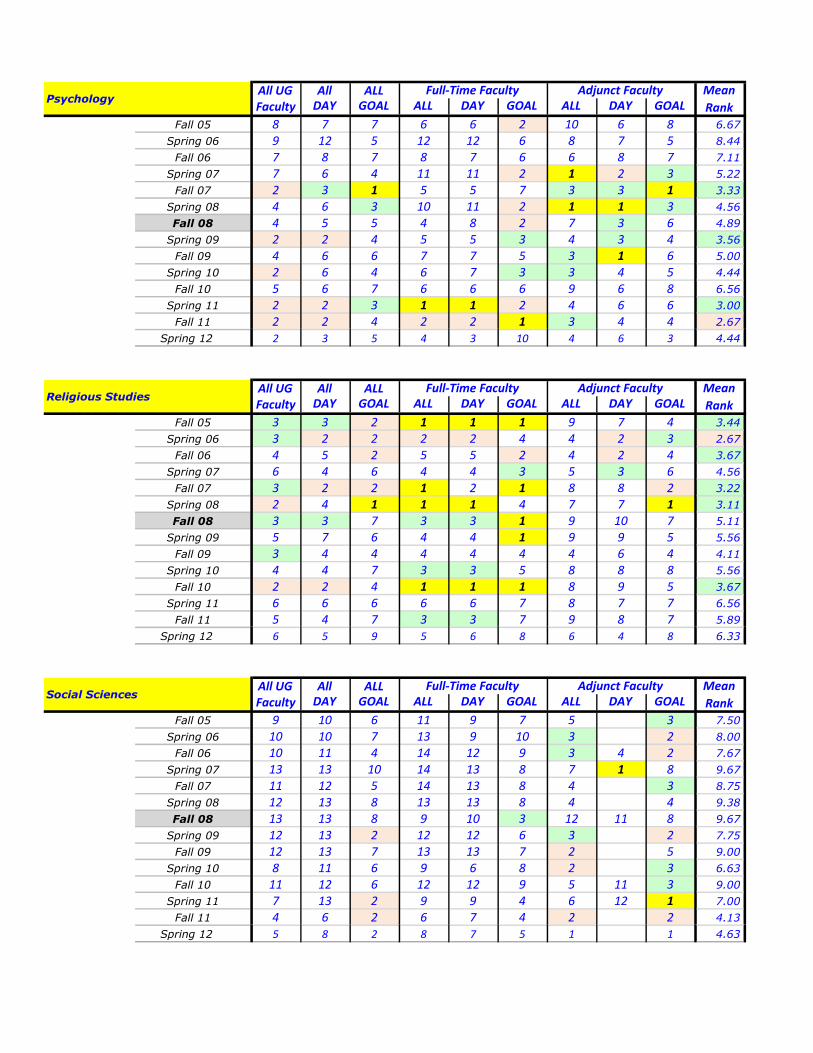
All UG All ALLFaculty DAY GOAL ALL DAY GOAL ALL DAY GOAL
5 4 8 5 2 8 12 8 7 6.56
4 3 4 1 1 1 11 8 6 4.33
3 3 5 2 2 3 5 5 5 3.67
3 2 1 1 2 1 6 9 4 3.22
7 7 4 3 3 2 10 7 5 5.33
3 2 2 2 2 3 12 6 2 3.78
2 2 3 2 2 5 5 6 3 3.33
3 4 5 3 3 4 11 8 6 5.22
6 7 1 2 2 1 10 9 3 4.56
1 1 1 2 2 1 9 9 1 3.00
3 3 1 3 3 2 6 7 2 3.33
5 5 1 2 3 1 12 11 3 4.78
3 3 3 4 4 2 4 3 5 3.44
Spring 12 3 6 1 2 2 1 10 7 5 4.11
All UG All ALLFaculty DAY GOAL ALL DAY GOAL ALL DAY GOAL
13 12 11 9 10 13 9 11 11.00
8 8 8 8 7 12 10 8 8.63
13 13 8 9 9 13 11 8 10.50
10 9 8 12 10 4 4 5 7.75
13 11 9 11 10 13 9 9 10.63
10 11 5 9 10 13 8 8 9.25
11 10 6 10 9 11 9 5 8.88
13 12 11 13 13 10 7 9 11.00
13 12 11 10 9 12 10 11 11.00
12 13 10 13 13 10 7 11 11.13
13 13 12 13 13 13 12 12 12.63
12 8 12 10 10 10 8 11 10.13
13 13 12 13 12 13 9 12 12.13
Spring 12 13 13 10 10 10 12 9 10 10.88
All UG All ALLFaculty DAY GOAL ALL DAY GOAL ALL DAY GOAL
12 11 3 12 11 6 1 1 7.13
13 7 12 9 8 9 13 12 10.38
12 10 12 12 11 4 12 11 10.50
9 10 7 8 9 4 10 9 8.25
12 10 12 12 12 5 12 10 11 10.67
6 9 4 5 8 1 10 9 6.50
7 9 2 8 7 7 2 7 1 5.56
9 10 1 8 10 2 6 3 6.13
10 10 3 8 11 2 7 3 10 7.11
13 10 12 7 8 4 12 2 12 8.89
10 10 8 9 9 7 7 3 9 8.00
3 4 4 5 5 6 2 4 5 4.22
8 7 10 7 6 9 12 10 10 8.78
Spring 12 4 4 8 3 8 3 9 9 6.00
Fall 10
Spring 11
Fall 07
Spring 08
Fall 08
Spring 09
Fall 09
Spring 10
Full-Time Faculty Adjunct Faculty
Fall 05
Spring 06
Fall 06
Spring 07
Spring 09
Fall 09
Spring 10
Fall 10
Spring 11
Mathematics
Spring 06
Fall 06
Spring 07
Fall 07
Spring 08
Fall 08
Fall 10
Spring 11
Fine ArtsFull-Time Faculty Adjunct Faculty
Fall 05
Fall 07
Spring 08
Fall 08
Spring 09
Fall 09
Spring 10
EnglishFull-Time Faculty Adjunct Faculty
Fall 05
Fall 06
Spring 07
Spring 06
Fall 11
Fall 11
Mean
Rank
Mean
Rank
Mean
Rank
Fall 11

All UG All ALLFaculty DAY GOAL ALL DAY GOAL ALL DAY GOAL
6 5 5 7 5 9 7 10 6 6.67
6 4 6 6 4 8 7 9 7 6.33
2 2 1 3 3 2 1 3 2.13
1 1 2 2 1 2 7 2 2.25
5 5 7 4 4 3 9 7 5.50
8 8 7 8 7 7 6 7 7.25
6 6 4 5 4 6 4 4 4.88
6 3 12 2 2 5 12 11 10 7.00
5 2 10 5 3 8 8 8 6.13
6 5 8 4 4 7 7 9 6.25
4 4 5 4 4 4 10 13 6 6.00
10 9 9 11 11 3 7 2 10 8.00
7 5 8 5 5 5 10 11 9 7.22
Spring 12 7 2 12 6 4 9 11 11 7.75
All UG All ALLFaculty DAY GOAL ALL DAY GOAL ALL DAY GOAL
14 13 14 13 13.50
1 1 2 3 3 2 2.00
14 13 14 13 13.50
2 1 4 5 1 1 2.33
14 12 13 13 13.00
5 3 6 5 1 1 3.50
8 7 9 7 7.75
5 3 6 5 4.75
9 8 8 8 2 2 6.17
8 8 9 6 7.75
13 10 11 12 5 5 9.33
14 11 12 6 10.75
10 11 9 12 12 8 1 1 8.00
8 5 9 9 9 9 1 1 6.38
2 3 2 3 6 3 1 2 1 2.56
9 3 11 10 9 9 1 1 4 6.33
1 1 3 2 2 3 3 2 7 2.67
1 1 7 3 2 8 1 3 2 3.11
1 1 1 1 1 3 1 1 3 1.44
Spring 12 1 1 3 1 1 2 5 3 2 2.11
All UG All ALLFaculty DAY GOAL ALL DAY GOAL ALL DAY GOAL
7 6 10 8 7 5 8 3 10 7.11
5 5 3 5 5 2 5 4 4 4.22
6 4 9 4 4 1 7 3 10 5.33
4 5 5 5 5 6 3 5 1 4.33
4 4 3 7 6 4 5 4 4 4.56
5 3 6 4 4 5 3 4 5 4.33
5 7 1 11 11 9 3 5 2 6.00
4 9 3 10 6 10 7 6 1 6.22
8 8 5 11 8 9 5 5 2 6.78
5 7 2 8 9 6 5 5 2 5.44
7 8 2 11 11 8 1 5 1 6.00
11 11 5 13 13 10 5 5 4 8.56
9 12 6 12 13 8 7 7 1 8.33
Spring 12 10 11 6 13 13 4 7 5 7 8.44
Spring 11
Spring 08
Fall 08
Spring 09
Fall 09
Spring 10
Fall 10
Full-Time Faculty Adjunct Faculty
Fall 05
Spring 06
Fall 06
Spring 07
Full-Time Faculty Adjunct Faculty
Fall 05 (AA)
Spring 06 (AA)
Fall 05 (BS)
Spring 06 (BS)
Fall 11
Fall 11
Fall 11
Fall 06 (AA)
Spring 07 (AA)
Fall 07 (AA)
Spring 08 (AA)
Fall 08
Spring 07 (BS)
Fall 07 (BS)
Spring 08 (BS)
Spring 09
Fall 09
Spring 10
Fall 10
Spring 11
Spring 09
Fall 09
Spring 10
Fall 10
Spring 11
Nursing
Fall 06 (BS)
PEWSS
Fall 07
Spring 06
Fall 06
Spring 07
Fall 07
Spring 08
Fall 08
Natural SciencesFull-Time Faculty Adjunct Faculty
Fall 05
Mean
Rank
Mean
Rank
Mean
Rank
All UG All ALLFaculty DAY GOAL ALL DAY GOAL ALL DAY GOAL
8 7 7 6 6 2 10 6 8 6.67
9 12 5 12 12 6 8 7 5 8.44
7 8 7 8 7 6 6 8 7 7.11
7 6 4 11 11 2 1 2 3 5.22
2 3 1 5 5 7 3 3 1 3.33
4 6 3 10 11 2 1 1 3 4.56
4 5 5 4 8 2 7 3 6 4.89
2 2 4 5 5 3 4 3 4 3.56
4 6 6 7 7 5 3 1 6 5.00
2 6 4 6 7 3 3 4 5 4.44
5 6 7 6 6 6 9 6 8 6.56
2 2 3 1 1 2 4 6 6 3.00
2 2 4 2 2 1 3 4 4 2.67
Spring 12 2 3 5 4 3 10 4 6 3 4.44
All UG All ALLFaculty DAY GOAL ALL DAY GOAL ALL DAY GOAL
3 3 2 1 1 1 9 7 4 3.44
3 2 2 2 2 4 4 2 3 2.67
4 5 2 5 5 2 4 2 4 3.67
6 4 6 4 4 3 5 3 6 4.56
3 2 2 1 2 1 8 8 2 3.22
2 4 1 1 1 4 7 7 1 3.11
3 3 7 3 3 1 9 10 7 5.11
5 7 6 4 4 1 9 9 5 5.56
3 4 4 4 4 4 4 6 4 4.11
4 4 7 3 3 5 8 8 8 5.56
2 2 4 1 1 1 8 9 5 3.67
6 6 6 6 6 7 8 7 7 6.56
5 4 7 3 3 7 9 8 7 5.89
Spring 12 6 5 9 5 6 8 6 4 8 6.33
All UG All ALLFaculty DAY GOAL ALL DAY GOAL ALL DAY GOAL
9 10 6 11 9 7 5 3 7.50
10 10 7 13 9 10 3 2 8.00
10 11 4 14 12 9 3 4 2 7.67
13 13 10 14 13 8 7 1 8 9.67
11 12 5 14 13 8 4 3 8.75
12 13 8 13 13 8 4 4 9.38
13 13 8 9 10 3 12 11 8 9.67
12 13 2 12 12 6 3 2 7.75
12 13 7 13 13 7 2 5 9.00
8 11 6 9 6 8 2 3 6.63
11 12 6 12 12 9 5 11 3 9.00
7 13 2 9 9 4 6 12 1 7.00
4 6 2 6 7 4 2 2 4.13
Spring 12 5 8 2 8 7 5 1 1 4.63
Fall 09
Spring 10
Fall 10
Spring 11
Fall 09
Fall 06
Spring 07
Fall 07
Spring 08
Fall 08
Spring 09
Fall 11
Fall 06
Spring 07
Fall 07
Spring 08
Fall 08
Spring 09
Spring 10
Fall 10
Adjunct Faculty
Social SciencesFull-Time Faculty Adjunct Faculty
Full-Time Faculty
Spring 11
Fall 05
Spring 06
Spring 09
Fall 05
Spring 06
Fall 09
Spring 10
Fall 10
Spring 11
Religious Studies
Fall 11
Fall 11
Fall 06
Spring 07
Fall 07
Spring 08
Fall 08
Fall 05
Spring 06
Full-Time Faculty Adjunct FacultyPsychology
Mean
Rank
Mean
Rank
Mean
Rank

All UG All ALLFaculty DAY GOAL ALL DAY GOAL ALL DAY GOAL
10 9 4 13 12 4 4 2 5 7.00
11 9 9 10 10 3 9 3 11 8.33
9 10 11 6 8 8 11 10 9.13
11 8 11 7 6 7 12 11 9.13
10 9 6 10 9 6 6 6 7.75
9 7 9 7 6 11 10 8.43
9 8 11 7 6 10 8.50
10 8 8 7 7 8 13 10 8.88
7 5 12 6 5 10 13 11 8.63
7 8 3 5 5 2 5.00
6 5 10 5 5 10 2 1 4 5.33
9 7 11 7 7 5 11 12 8.63
10 9 11 9 9 10 8 8 9.25
Spring 12 12 12 11 11 12 7 10.83
Adjunct Faculty
Fall 05
Spring 11
Spring 08
Fall 08
Spring 09
Fall 09
Spring 10
Fall 10
Spring 06
Fall 06
Spring 07
Fall 07
World LanguagesFull-Time Faculty
Fall 11
Mean
Rank

All Surveys
All Undergraduate All DAY All GOAL
1 Nursing 1 Nursing 1 English
2 Psychology 2 Natural Sciences 2 Social Sciences
3 English 3 Psychology 3 Nursing
4 Mathematics 4 Mathematics 4 Communication Studies
5 Social Sciences 5 Religious Studies 5 Psychology
All FTTF DAY FTTF GOAL FTTF
1 Nursing 1 Nursing 1 English
2 English 2 English 2 Nursing
3 Mathematics 3 Psychology 3 Mathematics
4 Psychology 4 Natural Sciences 4 PEWSS
5 Religious Studies 5 Mathematics 5 Social Sciences
Adjunct Faculty
All Adjuncts DAY Adjuncts GOAL Adjuncts
1 Social Sciences 1 Education 1 Social Sciences
2 Education 2 Communication Studies 2 Nursing
3 Communication Studies 3 Nursing 3 Psychology
4 Psychology 4 Religious Studies 4 Communication Studies
5 Nursing 5 PEWSS 5 English
Student Opinion of Instruction
Undergraduate Survey Spring 2012
Highest Rated Departments / Schools by Category
Full-Time Teaching Faculty

Academic Performance of Athletes by Sport Fall 2011
N
Ath
TEAM
AVG
GPA
IND
HIGH
GPA
IND
LOW
GPA
Und
1.00
1.00
to
1.49
1.50
to
1.99
2.00
to
2.49
2.50
to
2.99
3.00
to
3.49
3.50
to
4.00
4.00%
over3
.0
TEAM
AVG
GPA
IND
HIGH
GPA
IND
LOW
GPA
Und
1.00
1.00
to
1.49
1.50
to
1.99
2.00
to
2.49
2.50
to
2.99
3.00
to
3.49
3.50
to
4.00
4.00%
over3
.0Basketball 17 2.944 3.83 1.43 0 1 0 3 4 5 4 0 53% 2.924 3.94 1.43 0 1 0 3 6 5 2 0 41%
Cross Country 9 3.238 3.92 1.86 0 0 1 0 1 3 4 0 78% 3.174 3.84 2.35 0 0 0 1 3 1 4 0 56%
Golf 8 3.373 4.00 2.75 0 0 0 0 3 2 3 2 63% 3.428 4.00 2.86 0 0 0 0 2 2 4 1 75%
Soccer 29 3.255 4.00 1.00 0 2 1 2 4 3 17 4 69% 3.281 4.00 1.45 0 1 0 4 4 3 17 1 69%
Softball 22 3.136 4.00 1.84 0 0 2 2 4 9 5 2 64% 3.222 4.00 2.42 0 0 0 2 6 8 6 1 64%
Swimming 27 3.405 4.00 2.43 0 0 0 2 2 10 13 4 85% 3.468 4.00 2.68 0 0 0 0 2 13 12 2 93%
Tennis 5 3.600 4.00 3.40 0 0 0 0 0 2 3 1 100% 3.534 3.84 3.13 0 0 0 0 0 2 3 0 100%
Track 30 3.271 4.00 1.86 0 0 2 2 6 5 15 2 67% 3.240 3.97 2.10 0 0 0 5 7 3 15 0 60%
Volleyball 13 3.215 4.00 1.73 0 0 2 0 3 1 7 2 62% 3.214 4.00 2.34 0 0 0 1 3 6 3 1 69%
Totals 160 3.246 0 3 8 11 27 40 71 17 69% 3.262 0 2 0 16 33 43 66 6 68%
Unduplicated 151 3.250 0 3 7 11 26 37 67 17 69% 3.270 2 0 15 30 42 62 6 69%
Categorical % 0% 2% 5% 7% 17% 25% 44% 11% 0% 1% 0% 10% 20% 28% 41% 4%
N
Ath
TEAM
AVG
GPA
IND
HIGH
GPA
IND
LOW
GPA
Und
1.00
1.00
to
1.49
1.50
to
1.99
2.00
to
2.49
2.50
to
2.99
3.00
to
3.49
3.50
to
4.00
4.00%
over3
.0
TEAM
AVG
GPA
IND
HIGH
GPA
IND
LOW
GPA
Und
1.00
1.00
to
1.49
1.50
to
1.99
2.00
to
2.49
2.50
to
2.99
3.00
to
3.49
3.50
to
4.00
4.00%
over3
.0Baseball 33 3.279 4.00 1.58 0 0 3 2 4 7 17 4 73% 3.278 4.00 2.03 0 0 0 2 6 12 13 1 76%
Basketball 16 2.839 3.60 1.86 0 0 1 4 4 5 2 0 44% 2.889 3.71 2.14 0 0 0 4 5 5 2 0 44%
Cross Country 11 2.760 3.66 1.84 0 0 2 3 1 2 3 0 45% 3.046 3.66 2.24 0 0 0 1 3 4 3 0 64%
Football 79 2.364 3.80 0.00 6 6 14 14 14 19 6 0 32% 2.482 3.69 0.00 3 1 10 27 17 17 4 0 27%
Golf 11 3.212 4.00 1.85 0 0 1 1 0 5 4 1 82% 3.209 4.00 2.19 0 0 0 2 2 2 5 1 64%
Soccer 35 2.877 3.83 1.16 0 2 3 3 8 11 8 0 54% 2.946 3.83 1.80 0 0 1 5 12 12 5 0 49%
Swimming 25 3.316 4.00 2.66 0 0 0 0 2 17 6 2 92% 3.348 4.00 2.60 0 0 0 0 5 10 10 2 80%
Tennis 8 3.536 4.00 2.84 0 0 0 0 1 3 4 1 88% 3.581 4.00 3.13 0 0 0 0 0 3 5 1 100%
Track 29 2.766 4.00 1.00 0 1 4 7 6 3 8 2 38% 2.951 4.00 1.96 0 0 1 6 8 5 9 2 48%
Wrestling 26 2.732 3.73 0.93 1 0 1 7 6 7 4 0 42% 2.767 3.83 0.93 1 0 0 8 7 6 4 0 38%
Totals 273 2.818 7 9 29 41 46 79 62 10 52% 2.902 4 1 12 55 65 76 60 7 50%
Unduplicated 260 2.820 7 9 27 37 45 77 58 10 52% 2.890 4 1 12 53 62 72 56 7 49%
Categorical % 3% 3% 10% 14% 17% 30% 22% 4% 2% 0% 5% 20% 24% 28% 22% 3%
All Athletes 433 2.968 7 12 37 52 73 119 133 27 58% 3.035 4 3 12 71 98 119 126 13 57%
Unduplicated 411 2.976 7 12 34 48 71 114 125 27 58% 3.030 4 3 12 68 92 114 118 13 56%
Categorical % 2% 3% 8% 12% 17% 28% 30% 7% 1% 1% 3% 17% 22% 28% 29% 3%
SEMESTER CUMULATIVEWOMEN'S
TEAMS
GPA Distribution GPA Distribution
SEMESTER CUMULATIVE
MEN'S
TEAMS
GPA Distribution GPA Distribution

Academic Performance of Athletes by Sport Fall 2011
Semester Cumulative
Women4.03.53.02.52.01.51.0Un1
IND
LOW
GPA
IND
HIGH
GPA
TEAM
AVG
GPA 4.03.53.02.52.01.51.0Un1
IND
HIGH
GPA
TEAM
AVG
GPA# A
th
IND
LOW
GPA
17 2.917 3.830 1.430 0 1 0 3 4 5 4 0 2.902 3.940 1.430 0 1 0 4 5 5 2 0Basketball
9 3.238 3.920 1.860 0 0 1 0 1 3 4 0 3.174 3.840 2.350 0 0 0 1 3 1 4 0Cross Country
8 3.373 4.000 2.750 0 0 0 0 3 2 3 2 3.428 4.000 2.860 0 0 0 0 2 2 4 1Golf
29 3.194 4.000 0.330 1 1 2 2 3 3 17 4 3.254 4.000 1.450 0 1 1 3 4 3 17 1Soccer
22 3.128 4.000 1.840 0 0 2 2 4 9 5 2 3.218 4.000 2.420 0 0 0 2 6 8 6 1Softball
27 3.405 4.000 2.430 0 0 0 2 2 10 13 4 3.468 4.000 2.680 0 0 0 0 2 13 12 2Swimming
5 3.600 4.000 3.400 0 0 0 0 0 2 3 1 3.534 3.840 3.130 0 0 0 0 0 2 3 0Tennis
30 3.271 4.000 1.860 0 0 2 2 6 5 15 2 3.240 3.970 2.100 0 0 0 5 7 3 15 0Track
13 3.215 4.000 1.730 0 0 2 0 3 1 7 2 3.208 4.000 2.340 0 0 0 1 3 6 3 1Volleyball
17 71 40 26 11 9 2 1 3.231 160Totals 6 66 43 32 16 1 2 0 3.254
151 1 17Unduplicated 2 67 37 25 11 8 3.230 0 2 1 15 29 42 62 6 3.260
Men4.03.53.02.52.01.51.0Un1
IND
LOW
GPA
IND
HIGH
GPA
TEAM
AVG
GPA 4.03.53.02.52.01.51.0Un1
IND
HIGH
GPA
TEAM
AVG
GPA# A
th
IND
LOW
GPA
33 3.279 4.000 1.580 0 0 3 2 4 7 17 4 3.272 4.000 2.030 0 0 0 2 6 13 12 1Baseball
16 2.839 3.600 1.860 0 0 1 4 4 5 2 0 2.869 3.710 2.140 0 0 0 6 3 5 2 0Basketball
11 2.760 3.660 1.840 0 0 2 3 1 2 3 0 3.046 3.660 2.240 0 0 0 1 3 4 3 0Cross Country
79 2.297 3.800 0.000 6 10 13 13 13 18 6 0 2.424 3.690 0.000 4 2 11 26 16 17 3 0Football
11 3.212 4.000 1.850 0 0 1 1 0 5 4 1 3.209 4.000 2.190 0 0 0 2 2 2 5 1Golf
35 2.851 3.830 1.160 0 2 3 4 7 13 6 0 2.907 3.830 1.800 0 0 1 7 11 13 3 0Soccer
25 3.281 4.000 2.530 0 0 0 0 3 16 6 2 3.335 4.000 2.500 0 0 0 0 5 10 10 2Swimming
8 3.536 4.000 2.840 0 0 0 0 1 3 4 1 3.581 4.000 3.130 0 0 0 0 0 3 5 1Tennis
29 2.752 4.000 1.160 0 1 5 6 6 3 8 2 2.944 4.000 1.860 0 0 2 5 8 5 9 2Track
26 2.707 3.730 0.930 1 0 1 8 5 8 3 0 2.755 3.830 0.930 1 0 0 8 8 5 4 0Wrestling
10 59 80 44 41 29 13 7 2.788 273Totals 7 56 77 62 57 14 2 5 2.875
260 7 10Unduplicated 13 55 78 43 37 27 2.790 5 2 14 55 59 73 52 7 2.870
3.015 2.952 8 15 38 52 70 120 130 27 433 5 4 15 73 94 120 122 13All Athletes
411Unduplicated 2.950 8 15 35 48 68 115 122 27 5 4 15 70 88 115 114 13 3.010

Academic Performance of Athletes by Sport Spring 2012
Semester Cumulative
Women4.03.53.02.52.01.51.0Un1
IND
LOW
GPA
IND
HIGH
GPA
TEAM
AVG
GPA 4.03.53.02.52.01.51.0Un1
IND
HIGH
GPA
TEAM
AVG
GPA# A
th
IND
LOW
GPA
14 2.729 4.000 0.860 1 2 2 0 1 4 4 1 2.872 3.950 1.920 0 0 1 4 2 5 2 0Basketball
8 3.220 4.000 2.350 0 0 0 1 1 3 3 1 3.188 3.790 2.350 0 0 0 1 2 2 3 0Cross Country
7 3.407 4.000 2.840 0 0 0 0 1 3 3 1 3.359 3.990 2.850 0 0 0 0 2 3 2 0Golf
28 3.112 4.000 1.430 0 1 1 5 2 8 11 2 3.167 3.920 1.910 0 0 1 4 4 8 11 0Soccer
22 3.060 4.000 1.000 0 1 0 1 7 7 6 1 3.182 4.000 2.080 0 0 0 2 5 11 4 1Softball
24 3.419 4.000 2.500 0 0 0 0 5 7 12 2 3.421 4.000 2.740 0 0 0 0 4 9 11 1Swimming
7 3.621 4.000 3.000 0 0 0 0 0 1 6 1 3.574 3.860 3.210 0 0 0 0 0 3 4 0Tennis
29 3.133 4.000 0.000 1 2 0 1 4 7 14 2 3.210 3.940 2.140 0 0 0 4 8 3 14 0Track
14 3.402 4.000 2.450 0 0 0 1 1 6 6 1 3.268 4.000 2.560 0 0 0 0 4 6 4 1Volleyball
12 65 46 22 9 3 6 2 3.191 153Totals 3 55 50 31 15 2 0 0 3.228
144 2 11Unduplicated 6 61 43 21 8 3 3.180 0 0 2 14 29 48 51 3 3.230
Men4.03.53.02.52.01.51.0Un1
IND
LOW
GPA
IND
HIGH
GPA
TEAM
AVG
GPA 4.03.53.02.52.01.51.0Un1
IND
HIGH
GPA
TEAM
AVG
GPA# A
th
IND
LOW
GPA
29 3.121 4.000 1.770 0 0 2 5 3 7 12 4 3.260 4.000 2.000 0 0 0 2 6 11 10 1Baseball
12 2.789 4.000 1.660 0 0 1 3 4 1 3 1 2.873 3.760 2.210 0 0 0 3 5 2 2 0Basketball
10 2.404 3.550 0.000 1 0 2 2 1 3 1 0 2.972 3.610 2.190 0 0 0 1 3 3 3 0Cross Country
68 2.601 4.000 0.930 1 3 10 19 10 14 11 1 2.583 3.870 1.530 0 0 10 20 22 12 4 0Football
10 3.219 4.000 0.000 1 0 0 0 1 3 5 3 3.342 4.000 2.260 0 0 0 1 1 3 5 1Golf
29 2.917 3.850 1.160 0 2 2 2 7 10 6 0 2.914 3.640 1.510 0 0 1 6 5 15 2 0Soccer
24 3.053 4.000 0.000 2 1 0 0 4 6 11 2 3.318 4.000 2.310 0 0 0 1 4 9 10 2Swimming
9 3.559 3.930 2.830 0 0 0 0 1 2 6 0 3.589 3.830 3.260 0 0 0 0 0 4 5 0Tennis
28 2.553 4.000 0.000 1 0 7 8 2 5 5 3 2.858 4.000 1.690 0 0 2 6 7 5 8 1Track
22 2.655 3.970 0.920 1 0 3 3 8 5 2 0 2.770 3.840 1.350 0 1 0 6 9 4 2 0Wrestling
14 62 56 41 42 27 6 7 2.809 241Totals 5 51 68 62 46 13 1 0 2.926
230 6 14Unduplicated 6 61 53 39 40 25 2.830 0 1 13 45 59 64 48 5 2.920
3.043 2.957 9 12 30 51 63 102 127 26 394 0 1 15 61 93 118 106 8All Athletes
374Unduplicated 2.964 8 12 28 48 60 96 122 25 0 1 15 59 88 112 99 8 3.040

Academic Performance of Athletes by Sport Spring 2012
N
Ath
TEAM
AVG
GPA
IND
HIGH
GPA
IND
LOW
GPA
Und
1.00
1.00
to
1.49
1.50
to
1.99
2.00
to
2.49
2.50
to
2.99
3.00
to
3.49
3.50
to
4.00
4.00%
over3
.0
TEAM
AVG
GPA
IND
HIGH
GPA
IND
LOW
GPA
Und
1.00
1.00
to
1.49
1.50
to
1.99
2.00
to
2.49
2.50
to
2.99
3.00
to
3.49
3.50
to
4.00
4.00%
over3
.0Basketball 14 2.729 4.00 0.86 1 2 2 0 1 4 4 1 57% 2.884 3.95 2.04 0 0 0 5 2 5 2 0 50%
Cross Country 8 3.220 4.00 2.35 0 0 0 1 1 3 3 1 75% 3.188 3.79 2.35 0 0 0 1 2 2 3 0 63%
Golf 7 3.407 4.00 2.84 0 0 0 0 1 3 3 1 86% 3.359 3.99 2.85 0 0 0 0 2 3 2 0 71%
Soccer 28 3.112 4.00 1.43 0 1 1 5 2 8 11 2 68% 3.167 3.92 1.91 0 0 1 4 4 8 11 0 68%
Softball 22 3.060 4.00 1.00 0 1 0 1 7 7 6 1 59% 3.182 4.00 2.08 0 0 0 2 5 11 4 1 68%
Swimming 24 3.419 4.00 2.50 0 0 0 0 5 7 12 2 79% 3.421 4.00 2.74 0 0 0 0 4 9 11 1 83%
Tennis 7 3.621 4.00 3.00 0 0 0 0 0 1 6 1 100% 3.574 3.86 3.21 0 0 0 0 0 3 4 0 100%
Track 29 3.133 4.00 0.00 1 2 0 1 4 7 14 2 72% 3.210 3.94 2.14 0 0 0 4 8 3 14 0 59%
Volleyball 14 3.402 4.00 2.45 0 0 0 1 1 6 6 1 86% 3.268 4.00 2.56 0 0 0 0 4 6 4 1 71%
Totals 153 3.191 2 6 3 9 22 46 65 12 73% 3.229 0 0 1 16 31 50 55 3 69%
Unduplicated 144 3.180 2 6 3 8 21 43 61 11 72% 3.230 0 0 1 15 29 48 51 3 69%
Categorical % 1% 4% 2% 6% 15% 30% 42% 8% 0% 0% 1% 10% 20% 33% 35% 2%
N
Ath
TEAM
AVG
GPA
IND
HIGH
GPA
IND
LOW
GPA
Und
1.00
1.00
to
1.49
1.50
to
1.99
2.00
to
2.49
2.50
to
2.99
3.00
to
3.49
3.50
to
4.00
4.00%
over3
.0
TEAM
AVG
GPA
IND
HIGH
GPA
IND
LOW
GPA
Und
1.00
1.00
to
1.49
1.50
to
1.99
2.00
to
2.49
2.50
to
2.99
3.00
to
3.49
3.50
to
4.00
4.00%
over3
.0Baseball 29 3.121 4.00 1.77 0 0 2 5 3 7 12 4 66% 3.260 4.00 2.00 0 0 0 2 6 11 10 1 72%
Basketball 12 2.789 4.00 1.66 0 0 1 3 4 1 3 1 33% 2.873 3.76 2.21 0 0 0 3 5 2 2 0 33%
Cross Country 10 2.404 3.55 0.00 1 0 2 2 1 3 1 0 40% 2.972 3.61 2.19 0 0 0 1 3 3 3 0 60%
Football 68 2.601 4.00 0.93 1 3 10 19 10 14 11 1 37% 2.583 3.87 1.53 0 0 10 20 22 12 4 0 24%
Golf 10 3.219 4.00 0.00 1 0 0 0 1 3 5 3 80% 3.342 4.00 2.26 0 0 0 1 1 3 5 1 80%
Soccer 29 2.905 3.85 1.16 0 2 2 3 6 10 6 0 55% 2.912 3.64 1.51 0 0 1 7 4 15 2 0 59%
Swimming 24 3.046 4.00 0.00 2 1 0 0 4 6 11 2 71% 3.315 4.00 2.31 0 0 0 1 4 9 10 2 79%
Tennis 9 3.559 3.93 2.83 0 0 0 0 1 2 6 0 89% 3.589 3.83 3.26 0 0 0 0 0 4 5 0 100%
Track 28 2.553 4.00 0.00 1 0 7 8 2 5 5 3 36% 2.858 4.00 1.69 0 0 2 6 7 5 8 1 46%
Wrestling 22 2.655 3.97 0.92 1 0 3 3 8 5 2 0 32% 2.770 3.84 1.35 0 1 0 6 9 4 2 0 27%
Totals 241 2.807 7 6 27 43 40 56 62 14 49% 2.926 0 1 13 47 61 68 51 5 49%
Unduplicated 230 2.820 6 6 25 41 38 53 61 14 50% 2.920 0 1 13 46 58 64 48 5 49%
Categorical % 3% 3% 11% 18% 17% 23% 27% 6% 0% 0% 6% 20% 25% 28% 21% 2%
All Athletes 394 2.956 9 12 30 52 62 102 127 26 58% 3.043 0 1 14 63 92 118 106 8 57%
Unduplicated 374 2.963 8 12 28 49 59 96 122 25 58% 3.040 0 1 14 61 87 112 99 8 56%
Categorical % 2% 3% 7% 13% 16% 26% 33% 7% 0% 0% 4% 16% 23% 30% 26% 2%
SEMESTER CUMULATIVEWOMEN'S
TEAMS
GPA Distribution GPA Distribution
SEMESTER CUMULATIVE
MEN'S
TEAMS
GPA Distribution GPA Distribution
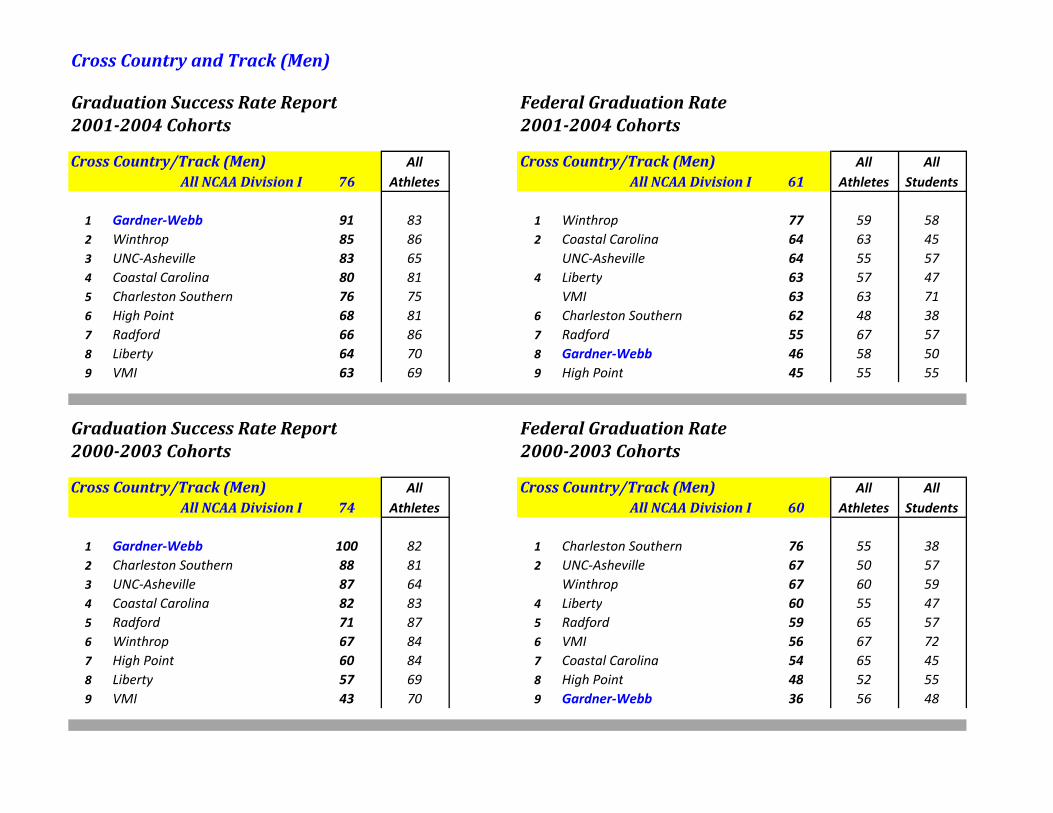
Cross Country and Track (Men)
Graduation Success Rate Report Federal Graduation Rate20012004 Cohorts 20012004 Cohorts
Cross Country/Track (Men) All Cross Country/Track (Men) All AllAll NCAA Division I 76 Athletes All NCAA Division I 61 Athletes Students
1 Gardner‐Webb 91 83 1 Winthrop 77 59 582 Winthrop 85 86 2 Coastal Carolina 64 63 453 UNC‐Asheville 83 65 UNC‐Asheville 64 55 574 Coastal Carolina 80 81 4 Liberty 63 57 475 Charleston Southern 76 75 VMI 63 63 716 High Point 68 81 6 Charleston Southern 62 48 387 Radford 66 86 7 Radford 55 67 578 Liberty 64 70 8 Gardner‐Webb 46 58 509 VMI 63 69 9 High Point 45 55 55
Graduation Success Rate Report Federal Graduation Rate20002003 Cohorts 20002003 Cohorts
Cross Country/Track (Men) All Cross Country/Track (Men) All AllAll NCAA Division I 74 Athletes All NCAA Division I 60 Athletes Students
1 Gardner‐Webb 100 82 1 Charleston Southern 76 55 382 Charleston Southern 88 81 2 UNC‐Asheville 67 50 573 UNC‐Asheville 87 64 Winthrop 67 60 594 Coastal Carolina 82 83 4 Liberty 60 55 475 Radford 71 87 5 Radford 59 65 576 Winthrop 67 84 6 VMI 56 67 727 High Point 60 84 7 Coastal Carolina 54 65 458 Liberty 57 69 8 High Point 48 52 559 VMI 43 70 9 Gardner‐Webb 36 56 48

Cross Country and Track (Women)
Graduation Success Rate Report Federal Graduation Rate20012004 Cohorts 20012004 Cohorts
Cross Country/Track (Women) All Cross Country/Track (Women) All AllAll NCAA Division I 85 Athletes All NCAA Division I 71 Athletes Students
1 Coastal Carolina 96 81 1 VMI 78 63 712 Radford 93 86 2 Radford 73 67 573 Gardner‐Webb 90 83 3 Coastal Carolina 72 63 454 Liberty 88 70 4 Liberty 68 57 475 Winthrop 85 86 5 UNC‐Asheville 65 55 576 High Point 83 81 Winthrop 65 59 587 UNC‐Asheville 76 65 7 Gardner‐Webb 64 58 508 Charleston Southern 70 75 8 High Point 52 55 559 VMI 64 69 9 Charleston Southern 48 48 38
Graduation Success Rate Report Federal Graduation Rate20002003 Cohorts 20002003 Cohorts
Cross Country/Track (Women) All Cross Country/Track (Women) All AllAll NCAA Division I 85 Athletes All NCAA Division I 70 Athletes Students
1 Coastal Carolina 94 83 1 Winthrop 79 60 592 Gardner‐Webb 93 82 2 Radford 72 65 573 Radford 88 87 3 Coastal Carolina 67 65 45
Winthrop 88 84 4 Liberty 66 55 475 Liberty 87 69 5 UNC‐Asheville 64 50 576 High Point 86 84 6 Gardner‐Webb 60 56 487 UNC‐Asheville 78 64 7 High Point 52 52 558 Charleston Southern 63 81 8 Charleston Southern 43 55 38
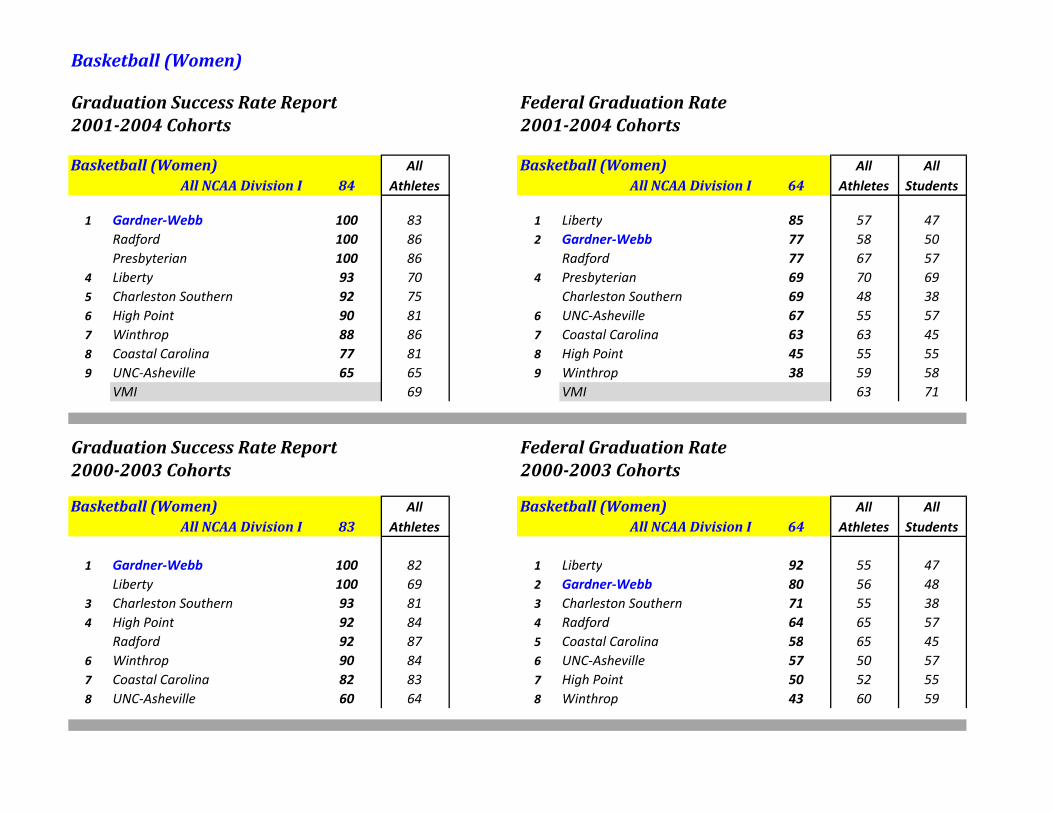
Basketball (Women)
Graduation Success Rate Report Federal Graduation Rate20012004 Cohorts 20012004 Cohorts
Basketball (Women) All Basketball (Women) All AllAll NCAA Division I 84 Athletes All NCAA Division I 64 Athletes Students
1 Gardner‐Webb 100 83 1 Liberty 85 57 47Radford 100 86 2 Gardner‐Webb 77 58 50Presbyterian 100 86 Radford 77 67 57
4 Liberty 93 70 4 Presbyterian 69 70 695 Charleston Southern 92 75 Charleston Southern 69 48 386 High Point 90 81 6 UNC‐Asheville 67 55 577 Winthrop 88 86 7 Coastal Carolina 63 63 458 Coastal Carolina 77 81 8 High Point 45 55 559 UNC‐Asheville 65 65 9 Winthrop 38 59 58
VMI 69 VMI 63 71
Graduation Success Rate Report Federal Graduation Rate20002003 Cohorts 20002003 Cohorts
Basketball (Women) All Basketball (Women) All AllAll NCAA Division I 83 Athletes All NCAA Division I 64 Athletes Students
1 Gardner‐Webb 100 82 1 Liberty 92 55 47Liberty 100 69 2 Gardner‐Webb 80 56 48
3 Charleston Southern 93 81 3 Charleston Southern 71 55 384 High Point 92 84 4 Radford 64 65 57
Radford 92 87 5 Coastal Carolina 58 65 456 Winthrop 90 84 6 UNC‐Asheville 57 50 577 Coastal Carolina 82 83 7 High Point 50 52 558 UNC‐Asheville 60 64 8 Winthrop 43 60 59

Basketball (Men)
Graduation Success Rate Report Federal Graduation Rate20012004 Cohorts 20012004 Cohorts
Basketball (Men) All Basketball (Men) All AllAll NCAA Division I 66 Athletes All NCAA Division I 48 Athletes Students
1 Winthrop 92 86 1 Coastal Carolina 75 63 45Presbyterian 92 86 2 Winthrop 73 59 58
3 Gardner‐Webb 90 83 3 Presbyterian 71 70 694 Charleston Southern 89 75 4 Charleston Southern 64 48 38
Coastal Carolina 89 81 Gardner‐Webb 64 58 506 VMI 71 69 6 VMI 63 63 717 UNC‐Asheville 57 65 7 Liberty 57 57 478 High Point 56 81 8 UNC‐Asheville 47 55 579 Radford 55 86 9 Radford 40 67 5710 Liberty 50 70 10 High Point 20 55 55
Graduation Success Rate Report Federal Graduation Rate20002003 Cohorts 20002003 Cohorts
Basketball (Men) All Basketball (Men) All AllAll NCAA Division I 65 Athletes All NCAA Division I 48 Athletes Students
1 Charleston Southern 100 81 1 Coastal Carolina 100 65 45Coastal Carolina 100 83 2 Gardner‐Webb 75 56 48
3 Gardner‐Webb 90 82 3 VMI 69 67 724 VMI 85 70 4 Charleston Southern 64 55 385 Winthrop 82 84 5 Winthrop 50 60 596 High Point 63 84 6 Radford 43 65 577 Radford 50 87 7 Liberty 38 55 47
UNC‐Asheville 50 64 8 UNC‐Asheville 35 50 579 Liberty 44 69 9 High Point 22 52 55

Baseball
Graduation Success Rate Report Federal Graduation Rate20012004 Cohorts 20012004 Cohorts
Baseball All Baseball All AllAll NCAA Division I 72 Athletes All NCAA Division I 48 Athletes Students
1 Radford 95 86 1 Radford 68 67 572 Gardner‐Webb 94 83 2 Presbyterian 63 70 693 Presbyterian 89 86 3 VMI 59 63 714 Winthrop 87 86 4 Liberty 50 57 475 Charleston Southern 77 75 5 Gardner‐Webb 47 58 506 VMI 67 69 6 High Point 46 55 557 Liberty 65 70 7 Charleston Southern 44 48 388 Coastal Carolina 63 81 8 Coastal Carolina 37 63 45
High Point 63 81 9 Winthrop 32 59 5810 UNC‐Asheville 50 65 10 UNC‐Asheville 26 55 57
Graduation Success Rate Report Federal Graduation Rate20002003 Cohorts 20002003 Cohorts
Baseball All Baseball All AllAll NCAA Division I 70 Athletes All NCAA Division I 47 Athletes Students
1 Radford 95 87 1 VMI 70 67 722 Winthrop 88 84 2 High Point 62 52 553 Gardner‐Webb 85 82 3 Charleston Southern 58 55 384 Charleston Southern 83 81 4 Radford 55 65 57
High Point 83 84 5 Gardner‐Webb 48 56 486 VMI 79 70 Liberty 48 55 477 Liberty 63 69 Winthrop 48 60 598 Coastal Carolina 62 83 8 Coastal Carolina 39 65 459 UNC‐Asheville 45 64 9 UNC‐Asheville 24 50 57

Golf (Men)
Graduation Success Rate Report Federal Graduation Rate20012004 Cohorts 20012004 Cohorts
Golf (Men) All Golf (Men) All AllAll NCAA Division I 81 Athletes All NCAA Division I 65 Athletes Students
1 Charleston Southern 100 75 1 High Point 88 55 55Coastal Carolina 100 81 2 Charleston Southern 86 48 38High Point 100 81 3 Coastal Carolina 82 63 45Liberty 100 70 4 Winthrop 80 59 58Radford 100 86 5 Presbyterian 67 70 69Winthrop 100 86 6 Gardner‐Webb 36 58 50
7 Presbyterian 88 86 7 Liberty 33 57 478 Gardner‐Webb 86 83 Radford 33 67 57
UNC‐Asheville 65 UNC‐Asheville 55 57VMI 69 VMI 63 71
Graduation Success Rate Report Federal Graduation Rate20002003 Cohorts 20002003 Cohorts
Golf (Men) All Golf (Men) All AllAll NCAA Division I 81 Athletes All NCAA Division I 63 Athletes Students
1 Charleston Southern 100 81 1 Coastal Carolina 88 65 45Coastal Carolina 100 83 2 Charleston Southern 86 55 38High Point 100 84 3 High Point 75 52 55Radford 100 87 4 Winthrop 67 60 59
5 Gardner‐Webb 90 82 5 Gardner‐Webb 64 56 486 Winthrop 86 84 6 Radford 43 65 577 Liberty 67 69 7 Liberty 22 55 47

Golf (Women)
Graduation Success Rate Report Federal Graduation Rate20012004 Cohorts 20012004 Cohorts
Golf (Women) All Golf (Women) All AllAll NCAA Division I 88 Athletes All NCAA Division I 72 Athletes Students
1 Coastal Carolina 100 81 1 Charleston Southern 100 48 38Gardner‐Webb 100 83 Gardner‐Webb 100 58 50High Point 100 81 3 Coastal Carolina 83 63 45Presbyterian 100 4 High Point 71 55 55
5 Charleston Southern 75 75 5 Radford 57 67 576 Radford 71 86 6 Winthrop 50 59 587 Winthrop 63 86 Presbyterian No Report 70 69
Liberty 70 Liberty 57 47UNC‐Asheville 65 UNC‐Asheville 55 57VMI 69 VMI 63 71
Graduation Success Rate Report Federal Graduation Rate20002003 Cohorts 20002003 Cohorts
Golf (Women) All Golf (Women) All AllAll NCAA Division I 88 Athletes All NCAA Division I 72 Athletes Students
1 Charleston Southern 100 81 1 Charleston Southern 100 55 38Coastal Carolina 100 83 Coastal Carolina 100 65 45Gardner‐Webb 100 82 3 Radford 86 65 57High Point 100 84 4 Gardner‐Webb 83 56 48Radford 100 87 5 Winthrop 63 60 59
6 Winthrop 67 84 6 High Point 60 52 55
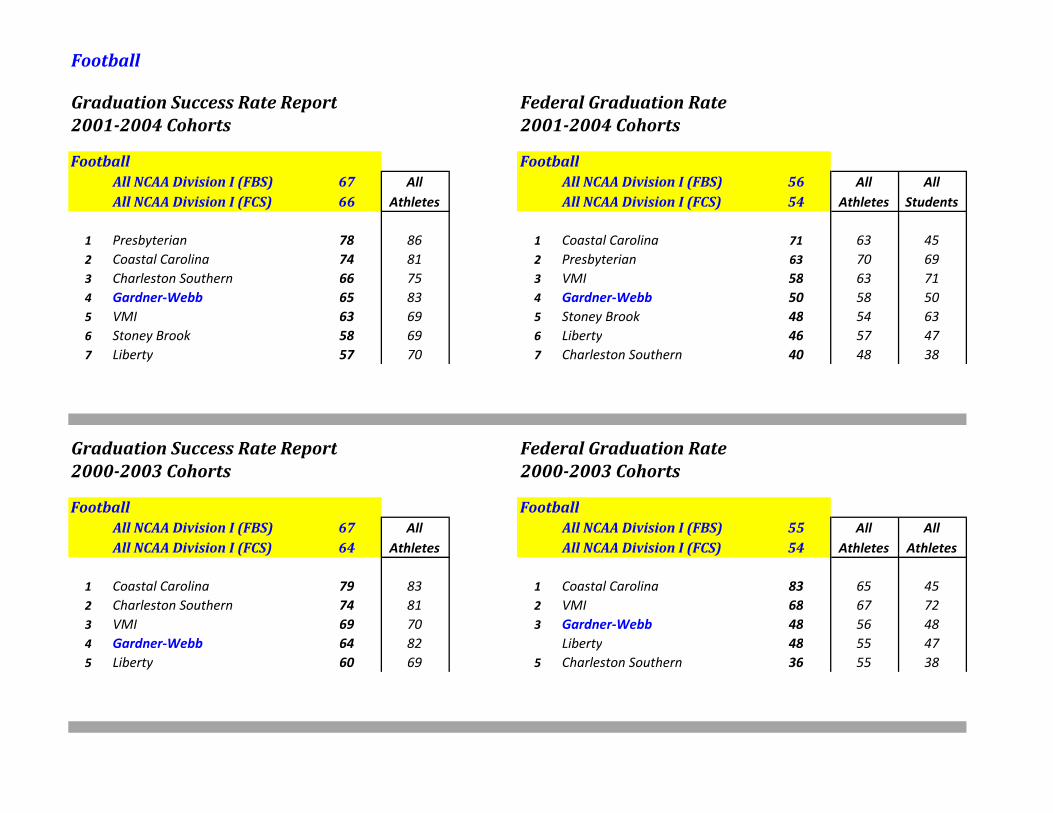
Football
Graduation Success Rate Report Federal Graduation Rate20012004 Cohorts 20012004 Cohorts
Football FootballAll NCAA Division I (FBS) 67 All All NCAA Division I (FBS) 56 All AllAll NCAA Division I (FCS) 66 Athletes All NCAA Division I (FCS) 54 Athletes Students
1 Presbyterian 78 86 1 Coastal Carolina 71 63 452 Coastal Carolina 74 81 2 Presbyterian 63 70 693 Charleston Southern 66 75 3 VMI 58 63 714 Gardner‐Webb 65 83 4 Gardner‐Webb 50 58 505 VMI 63 69 5 Stoney Brook 48 54 636 Stoney Brook 58 69 6 Liberty 46 57 477 Liberty 57 70 7 Charleston Southern 40 48 38
Graduation Success Rate Report Federal Graduation Rate20002003 Cohorts 20002003 Cohorts
Football FootballAll NCAA Division I (FBS) 67 All All NCAA Division I (FBS) 55 All AllAll NCAA Division I (FCS) 64 Athletes All NCAA Division I (FCS) 54 Athletes Athletes
1 Coastal Carolina 79 83 1 Coastal Carolina 83 65 452 Charleston Southern 74 81 2 VMI 68 67 723 VMI 69 70 3 Gardner‐Webb 48 56 484 Gardner‐Webb 64 82 Liberty 48 55 475 Liberty 60 69 5 Charleston Southern 36 55 38

Tennis (Men)
Graduation Success Rate Report Federal Graduation Rate20012004 Cohorts 20012004 Cohorts
Tennis (Men) All Tennis (Men) All AllAll NCAA Division I 86 Athletes All NCAA Division I 65 Athletes Students
1 Gardner‐Webb 100 83 1 Winthrop 100 59 58Liberty 100 70 2 Presbyterian 80 70 69Winthrop 100 86 Radford 80 67 57
4 Radford 88 86 4 Coastal Carolina 67 63 455 Coastal Carolina 83 81 Gardner‐Webb 67 58 506 Presbyterian 57 86 Liberty 67 57 477 UNC‐Asheville 33 65 7 UNC‐Asheville 33 55 57
Charleston Southern 75 Charleston Southern 48 38High Point 81 High Point 55 55VMI 69 VMI 63 71
Graduation Success Rate Report Federal Graduation Rate20002003 Cohorts 20002003 Cohorts
Tennis (Men) All Tennis (Men) All AllAll NCAA Division I 84 Athletes All NCAA Division I 65 Athletes Students
1 Charleston Southern 100 81 1 Liberty 100 55 47Gardner‐Webb 100 82 Winthrop 100 60 59High Point 100 84 3 Gardner‐Webb 80 56 48Liberty 100 69 4 High Point 67 52 55Winthrop 100 84 UNC‐Asheville 67 50 57
6 Radford 83 87 6 Radford 60 65 57UNC‐Asheville 83 64 7 Coastal Carolina 50 65 45
8 Coastal Carolina 80 83 8 Charleston Southern 0 55 38

Swimming (Women)
Graduation Success Rate Report Federal Graduation Rate20012004 Cohorts 20012004 Cohorts
Swimming (Women) All Swimming (Women) All AllAll NCAA Division I 91 Athletes All NCAA Division I 76 Athletes Students
1 College of Charleston 100 81 1 Campbell 100 48 52Campbell 100 84 Davidson 100 91 92Davidson 100 97 Howard 100 63 65Gardner‐Webb 100 83 3 Radford 80 67 57Howard 100 68 4 College of Charleston 76 66 63Radford 100 86 5 Gardner‐Webb 74 58 50VMI 100 69 6 North Carolina A&T 64 51 39
7 North Florida 81 79 7 Georgia Southern 62 52 468 Georgia Southern 78 66 8 North Florida 60 67 479 North Carolina A&T 69 55 9 Florida A&M 24 43 3510 Florida A&M 36 50 10 VMI 0 71 63
Graduation Success Rate Report Federal Graduation Rate20002003 Cohorts 20002003 Cohorts
Swimming (Women) All Swimming (Women) All AllAll NCAA Division I 91 Athletes All NCAA Division I 77 Athletes Students
1 Gardner‐Webb 100 82 1 Davidson 100 96 92Radford 100 87 Howard 100 63 64Davidson 100 96 3 Radford 83 65 57Howard 100 68 4 College of Charleston 71 63 62College of Charleston 100 83 5 North Carolina A&T 67 52 38
6 Georgia Southern 80 68 6 Georgia Southern 62 52 457 North Carolina A&T 67 50 7 Gardner‐Webb 60 56 488 Florida A&M 47 42 8 Florida A&M 25 40 41

Swimming (Men)
Graduation Success Rate Report Federal Graduation Rate20012004 Cohorts 20012004 Cohorts
Swimming (Men) All Swimming (Men) All AllAll NCAA Division I 85 Athletes All NCAA Division I 72 Athletes Students
1 VMI 85 69 1 VMI 0 63 71
Graduation Success Rate Report Federal Graduation Rate20002003 Cohorts 20002003 Cohorts
Swimming (Men) All Swimming (Men) All AllAll NCAA Division I 85 Athletes All NCAA Division I 72 Athletes Students
1 VMI 100 70 1 VMI

Softball
Graduation Success Rate Report Federal Graduation Rate20012004 Cohorts 20012004 Cohorts
Softball All Softball All AllAll NCAA Division I 86 Athletes All NCAA Division I 70 Athletes Students
1 Radford 100 86 1 Coastal Carolina 93 63 45Winthrop 100 86 2 Winthrop 77 59 58
3 Gardner‐Webb 94 83 3 Presbyterian 72 70 69Presbyterian 94 86 4 Radford 63 67 57
5 Coastal Carolina 88 81 5 Gardner‐Webb 59 58 506 Liberty 71 70 6 Charleston Southern 58 48 387 Charleston Southern 67 75 7 Liberty 42 57 47
High Point 81 High Point 55 55UNC‐Asheville 65 UNC‐Asheville 55 57VMI 69 VMI 63 71
Graduation Success Rate Report Federal Graduation Rate20002003 Cohorts 20002003 Cohorts
Softball All Softball All AllAll NCAA Division I 86 Athletes All NCAA Division I 70 Athletes Students
1 Radford 100 87 1 Winthrop 82 60 59Winthrop 100 84 2 Coastal Carolina 79 65 45
3 Gardner‐Webb 94 82 3 Gardner‐Webb 71 56 484 Coastal Carolina 87 83 4 Charleston Southern 56 55 385 Charleston Southern 73 81 5 Radford 47 65 576 Liberty 70 69 6 Liberty 40 55 47

Soccer (Women)
Graduation Success Rate Report Federal Graduation Rate20012004 Cohorts 20012004 Cohorts
Soccer (Women) All Soccer (Women) All AllAll NCAA Division I 89 Athletes All NCAA Division I 71 Athletes Students
1 Gardner‐Webb 100 83 1 High Point 89 55 55High Point 100 81 2 UNC‐Asheville 88 55 57UNC‐Asheville 100 65 3 Liberty 86 57 47
4 Coastal Carolina 95 81 4 Presbyterian 85 70 69Liberty 95 70 5 VMI 80 63 71Presbyterian 95 86 6 Gardner‐Webb 78 58 50
7 Radford 89 86 7 Coastal Carolina 76 63 458 Charleston Southern 85 75 8 Radford 68 67 579 VMI 80 69 9 Winthrop 65 59 5810 Winthrop 76 86 10 Charleston Southern 58 48 38
Graduation Success Rate Report Federal Graduation Rate20002003 Cohorts 20002003 Cohorts
Soccer (Women) All Soccer (Women) All AllAll NCAA Division I 89 Athletes All NCAA Division I 71 Athletes Students
1 Coastal Carolina 100 83 1 Gardner‐Webb 94 56 48Gardner‐Webb 100 82 2 Coastal Carolina 91 65 45High Point 100 84 3 Liberty 83 55 47UNC‐Asheville 100 64 4 High Point 82 52 55
5 Liberty 94 69 5 Radford 72 65 576 Radford 90 87 6 UNC‐Asheville 70 50 577 Charleston Southern 85 81 7 Charleston Southern 62 55 388 Winthrop 67 84 8 Winthrop 53 60 59

Soccer (Men)
Graduation Success Rate Report Federal Graduation Rate20012004 Cohorts 20012004 Cohorts
Soccer (Men) All Soccer (Men) All AllAll NCAA Division I 79 Athletes All NCAA Division I 58 Athletes Students
1 Presbyterian 100 86 1 Presbyterian 88 70 692 VMI 89 69 2 VMI 84 63 713 Radford 86 86 3 Radford 81 67 574 High Point 79 81 4 Liberty 56 57 47
Winthrop 79 86 5 High Point 53 55 556 Gardner‐Webb 72 83 6 UNC‐Asheville 47 55 577 Liberty 69 70 7 Gardner‐Webb 38 58 508 Coastal Carolina 63 81 Winthrop 38 59 589 UNC‐Asheville 57 65 9 Coastal Carolina 18 63 45
Charleston Southern 75 Charleston Southern 48 38
Graduation Success Rate Report Federal Graduation Rate20002003 Cohorts 20002003 Cohorts
Soccer (Men) All Soccer (Men) All AllAll NCAA Division I 77 Athletes All NCAA Division I 58 Athletes Students
1 Radford 95 87 1 Radford 85 65 572 VMI 82 70 2 VMI 78 67 723 High Point 79 84 3 Liberty 67 55 474 Gardner‐Webb 77 82 4 High Point 53 52 555 Liberty 75 69 5 Gardner‐Webb 43 56 486 Winthrop 71 84 6 Winthrop 41 60 597 Coastal Carolina 60 83 7 UNC‐Asheville 33 50 578 UNC‐Asheville 44 64 8 Coastal Carolina 14 65 45

Wrestling
Graduation Success Rate Report Federal Graduation Rate20012004 Cohorts 20012004 Cohorts
Wrestling All Wrestling All AllAll NCAA Division I 73 Athletes All NCAA Division I 56 Athletes Students
1 Davidson 89 97 1 Davidson 87 91 922 Appalachian State 83 86 2 Citadel 65 65 70
Citadel 83 80 3 Appalachian State 61 61 644 Liberty 75 70 4 VMI 56 63 715 Gardner‐Webb 69 83 5 Gardner‐Webb 52 58 506 Campbell 67 84 6 UNC Greensboro 46 52 527 UNC Greensboro 65 72 7 Chattanooga 32 48 408 VMI 56 69 8 Campbell 31 48 529 Chattanooga 37 49 9 Liberty 0 57 47
Graduation Success Rate Report Federal Graduation Rate20002003 Cohorts 20002003 Cohorts
Wrestling All Wrestling All AllAll NCAA Division I 72 Athletes All NCAA Division I 56 Athletes Students
1 Campbell 89 92 1 Citadel 65 67 702 Citadel 81 79 2 VMI 62 67 723 Appalachian State 75 88 3 Appalachian State 54 62 634 VMI 67 70 4 Campbell 50 51 535 UNC Greensboro 65 74 5 UNC Greensboro 43 52 526 Gardner‐Webb 58 82 6 Gardner‐Webb 39 56 487 Chattanooga 35 47 7 Chattanooga 30 49 428 Liberty 0 69 8 Liberty 55 38

Graduation Rates by Athletic Team
Enter Grad % Enter Grad % Enter Grad % Enter Grad % Enter Grad %
1990 0 1 1 100.0 2 0 0.0 2 1 50.0 1990
1991 2 1 50.0 0 6 3 50.0 1 1 100.0 1991
1992 3 2 66.7 4 2 50.0 7 4 57.1 2 2 100.0 1992
1993 5 3 60.0 2 0 0.0 5 4 80.0 3 2 66.7 1993
1994 2 1 50.0 2 1 4 4 100.0 7 5 71.4 1994
1995 4 2 50.0 8 3 37.5 6 4 66.7 4 3 75.0 1995
1996 4 3 75.0 5 4 80.0 6 4 66.7 2 1 50.0 1996
1997 7 4 57.1 1 0 0.0 0 8 5 62.5 8 6 75.0 1997
1998 3 2 66.7 1 1 100.0 4 3 75.0 1 1 100.0 11 6 54.5 1998
1999 3 2 66.7 2 2 100.0 1 1 100.0 13 9 69.2 8 5 62.5 1999
2000 3 2 66.7 5 3 60.0 2 1 50.0 6 6 100.0 10 8 80.0 2000
2001 5 3 60.0 0 2 2 100.0 6 4 66.7 4 3 75.0 2001
2002 3 3 100.0 2 1 50.0 0 7 4 57.1 5 3 60.0 2002
2003 7 4 57.1 0 2 2 100.0 5 4 80.0 4 1 25.0 2003
2004 3 1 33.3 1 0 0.0 0 10 6 60.0 9 6 66.7 2004
2005 6 1 16.7 0 4 3 75.0 6 5 83.3 3 2 66.7 2005
2006 3 2 66.7 0 0 9 5 55.6 7 5 71.4 2006
2007 7 4 57.1 0 3 1 33.3 3 1 33.3 2 2 100.0 2007
2008* 3 1 33.3 0 1 1 100.0 11 7 63.6 7 6 85.7 2008*
73 41 56.2 34 18 52.9 19 14 73.7 121 80 66.1 99 68 68.7
29 13 44.8 3 1 33.3 14 10 71.4 76 51 67.1 51 36 70.6
Enter Grad % Enter Grad % Enter Grad % Enter Grad % Enter Grad %
1990 2 2 100.0 0 7 4 57.1 1990
1991 1 0 0.0 2 0 0.0 12 5 41.7 1991
1992 0 3 2 66.7 19 12 63.2 1992
1993 2 1 50.0 4 3 75.0 21 13 61.9 1993
1994 3 2 66.7 5 3 60.0 23 16 69.6 1994
1995 3 3 100.0 3 2 66.7 28 17 60.7 1995
1996 1 1 100.0 2 1 50.0 20 14 70.0 1996
1997 6 6 100.0 5 3 60.0 35 24 68.6 1997
1998 0 4 4 100.0 24 17 70.8 1998
1999 5 3 60.0 3 2 66.7 5 4 80.0 2 2 100.0 42 30 71.4 1999
2000 9 7 77.8 2 1 50.0 4 2 50.0 3 2 66.7 44 32 72.7 2000
2001 9 6 66.7 3 3 100.0 6 2 33.3 3 3 100.0 38 26 68.4 2001
2002 7 4 57.1 0 3 1 33.3 6 4 66.7 33 20 60.6 2002
2003 5 4 80.0 2 2 100.0 5 4 80.0 6 3 50.0 36 24 66.7 2003
2004 12 8 66.7 1 1 100.0 2 1 50.0 4 4 100.0 42 27 64.3 2004
2005 7 6 85.7 2 2 100.0 7 5 71.4 2 2 100.0 37 26 70.3 2005
2006 9 5 55.6 3 3 100.0 5 4 80.0 5 3 60.0 41 27 65.9 2006
2007 12 11 91.7 1 0.0 7 5 71.4 1 1 100.0 36 25 69.4 2007
2008* 11 4 36.4 1 1 100.0 10 6 60.0 5 4 80.0 49 30 61.2 2008*2001 2001
86 58 67.4 36 30 83.3 54 34 63.0 65 46 70.8 587 389 66.3
86 58 67.4 10 9 90.0 36 25 69.4 305 203 66.6
Women's Sports
Sport Total
Current
Coach
Sport Total
Current
Coach
* reflects only a four-year graduation rate for designated year
Golf Soccer Softball
Sport Total
Current
Coach
Volleyball
Basketball Cross Country
Sport Total
Current
Coach
Yearly TotalsSwimming Tennis Track / Field

Graduation Rates by Athletic Team
Enter Grad % Enter Grad % Enter Grad % Enter Grad % Enter Grad % Enter Grad %
1990 4 1 25.0 1 1 100.0 24 9 37.5 2 1 50.0 3 0 0.0 1990
1991 3 2 66.7 4 2 50.0 24 14 58.3 1 1 100.0 11 2 18.2 1991
1992 8 3 37.5 2 1 50.0 0 33 15 45.5 1 1 100.0 8 2 25.0 1992
1993 12 4 33.3 7 3 42.9 0 29 8 27.6 1 1 100.0 17 6 35.3 1993
1994 4 2 50.0 0 1 1 100.0 19 4 21.1 2 1 50.0 8 2 25.0 1994
1995 6 2 33.3 1 0 0.0 4 2 50.0 31 12 38.7 2 0 0.0 6 2 33.3 1995
1996 16 8 50.0 2 1 50.0 0 16 6 37.5 3 1 33.3 12 1 8.3 1996
1997 7 4 57.1 3 0 0.0 2 2 100.0 40 11 27.5 4 2 50.0 11 5 45.5 1997
1998 23 8 34.8 5 4 80.0 2 2 100.0 34 9 26.5 1 0 0.0 13 4 30.8 1998
1999 15 4 26.7 4 1 25.0 1 1 100.0 27 8 29.6 6 4 66.7 20 3 15.0 1999
2000 15 7 46.7 3 3 100.0 7 4 57.1 31 12 38.7 4 4 100.0 19 8 42.1 2000
2001 10 3 30.0 2 1 50.0 0 27 14 51.9 4 2 50.0 5 3 60.0 2001
2002 12 2 16.7 5 4 80.0 0 30 9 30.0 3 1 33.3 10 3 30.0 2002
2003 12 4 33.3 2 1 50.0 0 27 11 40.7 5 3 60.0 8 5 62.5 2003
2004 11 3 27.3 2 1 50.0 4 2 50.0 21 10 47.6 3 0 0.0 9 4 44.4 2004
2005 13 10 76.9 1 1 100.0 1 1 100.0 29 16 55.2 4 3 75.0 15 6 40.0 2005
2006 6 5 83.3 8 4 50.0 29 14 48.3 6 2 33.3 15 2 13.3 2006
2007 9 7 77.8 2 0.0 24 16 66.7 3 2 66.7 9 6 66.7 2007
2008* 7 2 28.6 3 0.0 29 11 37.9 3 1 33.3 15 3 20.0 2008*
193 81 42.0 57 28 49.1 22 15 68.2 524 209 39.9 58 30 51.7 214 67 31.3
70 33 47.1 5 3 60.0 35 18 51.4 214 67 31.3
Enter Grad % Enter Grad % Enter Grad % Enter Grad % Enter Grad %
1990 4 0 0.0 7 2 28.6 45 14 31.1 1990
1991 7 4 57.1 6 1 16.7 56 26 46.4 1991
1992 4 2 50.0 9 3 33.3 65 27 41.5 1992
1993 4 1 25.0 18 9 50.0 88 32 36.4 1993
1994 1 1 100.0 9 3 33.3 44 14 31.8 1994
1995 3 2 66.7 7 1 14.3 60 21 35.0 1995
1996 2 1 50.0 10 2 20.0 61 20 32.8 1996
1997 1 0 0.0 16 7 43.8 84 31 36.9 1997
1998 3 3 100.0 8 3 37.5 89 33 37.1 1998
1999 1 1 100.0 3 0 0.0 19 5 26.3 96 27 28.1 1999
2000 3 3 100.0 4 1 25.0 10 1 10.0 96 43 44.8 2000
2001 1 0 0.0 6 2 33.3 11 5 45.5 66 30 45.5 2001
2002 0 8 2 25.0 10 4 40.0 78 25 32.1 2002
2003 2 1 50.0 3 0 0.0 11 6 54.5 70 31 44.3 2003
2004 2 1 50.0 4 4 100.0 8 4 50.0 64 29 45.3 2004
2005 2 1 50.0 7 4 57.1 11 3 27.3 83 45 54.2 2005
2006 1 1 100.0 1 1 100.0 3 1 33.3 10 3 30.0 79 33 41.8 2006
2007 16 10 62.5 3 1 33.3 4 2 50.0 10 1 10.0 80 45 56.3 2007
2008* 7 6 85.7 1 1 100.0 8 1 12.5 10 0.0 83 25 30.1 2008*2001 2001
24 17 70.8 45 24 53.3 50 17 34.0 200 63 31.5 1387 551 39.7
24 17 70.8 11 6 54.5 29 12 41.4 200 63 31.5 588 219 37.2
Men's Sports
Sport Total
Current
Coach
Sport Total
Current
Coach
Baseball Cross Country GolfBasketball
Sport Total
Current
Coach
Sport Total
Current
Coach
Yearly Totals
Football
* reflects only a four-year graduation rate for designated year
Swimming Track / Field Wrestling
Soccer
Tennis

GardnerWebb UniversitySAT Comparison by Athletic Team
Men 2011 2010 2009 2008 2007 2006 2005 2004 2003 2002 2001 2000
Baseball 1,126.0 1,131.7 1,044.2 1,005.7 1,046.7 1,083.3 1,060.9 951.1 1,080.0 973.3 1,029.0 1,026.0Basketball 1,036.7 1,025.0 850.0 975.0 1,000.0 915.0 830.0 1,000.0 1,068.0 840.0 1,016.7Cross Country 1,260.0 1,270.0 965.0 1,060.0Football 954.0 928.6 926.1 944.8 920.5 892.2 933.3 934.8 965.6 946.1 980.0 927.2Golf 1,170.0 1,170.0 1,120.0 1,120.0 1,003.3 1,132.5 996.7 1,190.0 1,002.0 843.3 926.7 935.0Soccer 1,033.6 926.7 996.9 939.1 994.3 923.6 1,102.7 955.0 963.8 1,019.0 1,022.0 1,045.3Swimming 1,113.3 1,090.0 1,040.0 1,090.0 1,105.0 1,310.0Tennis 987.5 1,000.0 1,000.0 1,090.0 980.0 1,340.0 1,160.0 1,170.0 860.0 1,100.0 1,056.7Track 990.0 1,096.4 950.0 965.7 972.5 1,043.3 1,068.3 1,155.0 800.0 1,104.3 973.3 1,045.0Wrestling 1,052.5 1,040.0 980.0 1,023.3 1,047.1 951.3 956.0 1,107.1 932.2 928.8 1,071.3 948.6All Men's Teams 1,047.6 1,028.3 986.8 981.9 1,004.9 961.4 1,011.8 985.5 977.6 980.3 1,000.2 994.6
Women 2011 2010 2009 2008 2007 2006 2005 2004 2003 2002 2001 2000
Basketball 880.0 960.0 943.3 780.0 973.3 886.7 925.0 1,040.0 935.7 1,040.0 876.7 1,106.7Cross Country 920.0 826.7 990.0 1,000.0 962.5Golf 1,020.0 1,310.0 963.3 1,013.3 970.0 800.0 960.0Soccer 1,210.0 978.6 1,028.6 1,031.1 970.0 1,038.3 1,090.0 1,013.3 1,096.0 1,016.0 928.3 1,068.0Softball 1,013.3 976.7 976.7 1,046.7 995.0 937.5 1,030.0 1,036.7 956.7 1,010.0 1,040.0 1,051.1Swimming 1,126.0 1,115.0 1,133.0 1,091.3 1,073.3 1,027.1 1,097.0 1,101.1 1,122.0 1,058.6 1,112.5 978.3Tennis 950.0 1,250.0 950.0 975.0 960.0 1,130.0 1,033.3 1,130.0Track 1,000.0 1,036.3 990.0 966.3 992.9 955.0 1,000.0 970.0 1,142.5 880.0 1,010.0 1,037.5Volleyball 1,320.0 940.0 950.0 1,123.3 1,330.0 942.5 950.0 1,046.7 880.0 1,040.0 950.0 953.3All Women's Teams 1,064.4 1,006.7 1,017.7 1,046.8 1,021.5 990.7 1,026.8 1,041.2 1,031.7 1,027.7 991.6 1,018.7
All Teams 1,052.9 1,021.7 996.7 1,005.4 1,010.6 970.1 1,016.3 1,008.3 995.1 993.4 997.1 1,002.0
Red type indicates that the SAT average is based on only one athlete

Enrollment Comparisons Summer Semesters (2005 - 2012)
End End End End End End End End
2005 2006 2007 2008 2009 2010 2011 2012 N % N %
Full-Time Students, Reg Prog 51 35 43 41 29 32 33 35 2 6.06 3 9.38
Part-Time Students, Reg Prog 265 254 306 312 294 329 352 334 -18 -5.11 5 1.52
Special/2nd Deg Headcount, Reg Prog 22 27 13 11 10 17 9 16 7 77.78 -1 -5.88
Total Headcount, Reg Prog 338 316 362 364 333 378 394 385 -9 -2.28 7 1.85
First Time Freshmen, Reg Prog 7 10 22 16 18 24 27 27 0 3 12.50
Transfer Students, Reg Prog 2 3 13 11 6 8 10 10 0 2 25.00
FT Transfer Students, Reg Prog 2 1 2 0 2 0 0 2 2 2
FT Readmitted Students, Reg Prog 2 1 3 2 0 1 1 1 0 0
Continuing Students, Reg Prog (10+hrs) 54 42 48 41 40 45 51 47 -4 -7.84 2 4.44
Resident Students, Reg Prog 91 83 114 124 123 144 160 166 6 3.75 22 15.28
Resident Students, All Programs 93 84 114 126 126 149 165 170 5 3.03 21 14.09
FT Students, Reg Prog (for Billing) 58 46 54 46 47 47 53 51 -2 -3.77 4 8.51
Deaf Headcount 1 0 2 0 0 0 0 0 0 0
GOAL Headcount 805 852 872 806 705 719 784 637 -147 -18.75 -82 -11.40
RN to BSN Headcount 25 19 21 12 80 109 125 130 5 4.00 21 19.27
Total Headcount, GOAL/RN to BSN 830 871 893 818 785 828 909 767 -142 -15.62 -61 -7.37
EUEP Headcount 14 12 15 13 17 11 11 13 2 18.18 2 18.18
Doctor of Education Headcount 32 34 49 55 63 111 153 169 16 10.46 58 52.25
New Students , Doctor of Education 0 0 0 0 0 0 0 0 0 0
Graduate School Headcount 439 421 463 431 354 314 542 935 393 72.51 621 197.77
New Students , Graduate School 77 76 127 92 32 33 14 10 -4 -28.57 -23 -69.70
Masters of Nursing Headcount 69 68 48 94 95 111 116 119 3 2.59 8 7.21
New Students , Masters of Nursing 10 5 13 27 16 17 14 6 -8 -57.14 -11 -64.71
Doctor of Nursing 24 28 4 16.67 28
New Students , Doctor of Nursing 12 11 -1 -8.33 11
School of Divinity Headcount 73 60 77 76 87 80 71 60 -11 -15.49 -20 -25.00
New Students , School of Divinity 5 9 11 15 11 4 2 2 0 -2 -50.00
Doctor of Ministry Headcount 6 0 7 3 8 6 0 13 13 7 116.67
New Students , Doctor of Ministry 0 0 0 0 1 1 0 7 7 6 600.00
Graduate School of Business Headcount 330 340 343 339 360 360 356 352 -4 -1.12 -8 -2.22
New Students , Graduate School of Business 84 83 147 126 75 73 66 81 15 22.73 8 10.96
Total Headcount, All Programs 2,132 2,122 2,259 2,195 2,102 2,212 2,576 2,841 265 10.29 629 28.44
Total FT Students, All Programs 889 827 852 781 766 750 1,062 1,316 254 23.92 566 75.47
Student Hours, Reg Prog (Full-Time) 679.5 444.5 578.5 535.0 384.0 399.0 421.0 471.0 50 11.88 72 18.05
Student Hours, Reg Prog (Part-Time) 1,328.0 1,297.5 1,551.5 1,546.0 1,441.5 1,737.0 1,849.0 1,785.5 -64 -3.43 49 2.79
Student Hours, Reg Prog (Spec/2nd Deg) 85.0 101.0 59.0 59.0 47.0 75.0 37.0 64.0 27 72.97 -11 -14.67
Student Hours, Reg Prog (Overload) 5.5 0.0 2.5 1.5 0.5 0.0 0.0 0.0 0 0
Student Hours, DEAF 3.0 0.0 6.0 0.0 0.0 0.0 0.0 0.0 0 0
Student Hours, GOAL 6,142 6,371 6,505 5,964 5,454 5,558 6,374 4,653 -1,721 -27.00 -905 -16.28
Student Hours, RN to BSN 195 102 114 62 543 708 758 807 49 6.46 99 13.98
Student Hours, GOAL/RN to BSN 6,337 6,473 6,619 6,026 5,997 6,266 7,132 5,460 -1,672 -23.44 -806 -12.86
Student Hours, EUEP 99 87 108 93 120 57 84 84 0 27 47.37
Student Hours, Doctorate of Education 425 362 467 550 555 1,172 1,658 1,588 -70 -4.22 416 35.49
New Hours , Doctorate of Education 0 0 0 0 0 0 0 0 0 0
Student Hours, Graduate School 2,671 2,578 2,824 2,773 2,026 1,715 3,388 6,012 2,624 77.45 4,297 250.55
New Hours , Graduate School 399 381 744 495 147 171 67 38 -29 -43.28 -133 -77.78
Student Hours, Masters of Nursing 369 326 242 360 457 508 552 573 21 3.80 65 12.80
New Hours , Master of Nursing 37 36 69 95 60 63 57 24 -33 -57.89 -39 -61.90
Student Hours, Doctors of Nursing 132 162 30 22.73 162
New Hours , Doctor of Nursing 66 63 -3 -4.55 63
Student Hours, School of Divinity 375 276 342 333 375 375 342 261 -81 -23.68 -114 -30.40
New Hours , School of Divinity 18 45 45 54 42 18 6 6 0 -12 -66.67
Student Hours, Doctor of Ministry 24 0 28 12 20 24 0 52 52 28 116.67
New Hours , Doctor of Ministry 0 0 0 0 4 4 0 28 28 24 600.00
Student Hours, Graduate School of Business 1,812 1,957 1,851 1,713 1,779 1,728 1,754 1,683 -71 -4.05 -45 -2.60
New Hours , Graduate School of Business 426 435 795 582 333 309 303 393 90 29.70 84 27.18
Student Hours, All Programs 14,207.5 13,902.0 14,676.0 14,006.0 13,201.5 14,128.0 17,349.0 18,195.5 847 4.88 4,068 28.79
One-Year Chg Two-Year Chg
Summer Semesters

Enrollment Comparisons Spring Semesters (2004 - 2012)
End End End End End End End End End
2004 2005 2006 2007 2008 2009 2010 2011 2012 N % N %
Full-Time Students, Reg Prog 1,213 1,268 1,302 1,265 1,324 1,340 1,378 1,427 1,379 -48 -3.36 1 0.07
Part-Time Students, Reg Prog 119 119 76 108 93 93 63 57 64 7 12.28 1 1.59
Special/2nd Deg Headcount, Reg Prog 52 84 68 76 74 79 79 66 53 -13 -19.70 -26 -32.91
Total Headcount, Reg Prog 1,384 1,471 1,446 1,449 1,491 1,512 1,520 1,550 1,496 -54 -3.48 -24 -1.58
First Time Freshmen, Reg Prog 5 3 14 12 10 7 19 8 9 1 12.50 -10 -52.63
Transfer Students, Reg Prog 20 7 39 33 29 39 29 27 28 1 3.70 -1 -3.45
FT Transfer Students, Reg Prog 15 6 38 31 23 33 25 23 23 0 -2 -8.00
FT Readmitted Students, Reg Prog 14 10 10 16 14 10 7 6 10 4 66.67 3 42.86
Continuing Students, Reg Prog (10+hrs) 1,184 1,256 1,241 1,206 1,277 1,294 1,330 1,397 1,340 -57 -4.08 10 0.75
Resident Students, Reg Prog 948 985 989 954 1,009 1,046 1,088 1,145 1,132 -13 -1.14 44 4.04
Resident Students, All Programs 960 994 995 963 1,018 1,059 1,097 1,158 1,141 -17 -1.47 44 4.01
FT Students, Reg Prog (for Billing) 1,215 1,276 1,304 1,267 1,331 1,343 1,383 1,435 1,383 -52 -3.62 0
Deaf Headcount 13 17 9 22 20 19 23 22 13 -9 -40.91 -10 -43.48
GOAL Headcount 1,071 1,035 1,078 1,090 1,032 961 871 905 855 -50 -5.52 -16 -1.84
RN to BSN Headcount 38 34 35 37 22 28 144 190 191 1 0.53 47 32.64
Total Headcount, GOAL/RN to BSN 1,109 1,069 1,113 1,127 1,054 989 1,015 1,095 1,046 -49 -4.47 31 3.05
EUEP Headcount 39 27 22 28 33 36 24 17 28 11 64.71 4 16.67
Doctor of Education Headcount 15 32 40 53 60 71 120 164 188 24 14.63 68 56.67
New Students , Doctor of Education 0 0 0 0 0 1 0 0 2 2 #DIV/0! 2 #DIV/0!
Graduate School Headcount 461 471 464 506 504 448 367 641 1,197 556 86.74 830 226.16
New Students , Graduate School 72 26 66 73 61 49 58 177 311 134 75.71 253 436.21
Masters of Nursing Headcount 81 84 93 65 93 96 126 132 144 12 9.09 18 14.29
New Students , Masters of Nursing 15 5 14 14 23 12 35 12 18 6 50.00 -17 -48.57
Doctor of Nursing 12 24 12 100.00 24 #DIV/0!
New Students , Doctor of Nursing 0 0 0 0
School of Divinity Headcount 175 161 147 167 167 192 199 189 191 2 1.06 -8 -4.02
New Students , School of Divinity 20 5 16 21 21 42 33 28 27 -1 -3.57 -6 -18.18
Doctor of Ministry Headcount 22 23 17 21 19 21 24 19 19 0 -5 -20.83
New Students , Doctor of Ministry 2 0 1 0 1 2 4 3 5 2 66.67 1 25.00
Graduate School of Business Headcount 391 391 409 429 420 428 425 407 396 -11 -2.70 -29 -6.82
New Students , Graduate School of Business 60 43 81 126 100 120 105 109 95 -14 -12.84 -10 -9.52
Total Headcount, All Programs 3,689 3,746 3,760 3,867 3,861 3,812 3,843 4,248 4,742 494 11.63 899 23.39
Total FT Students, All Programs 2,941 3,008 3,034 3,111 3,124 2,977 3,014 3,400 3,784 384 11.29 770 25.55
Student Hours, Reg Prog (Full-Time) 18,924.0 19,636.5 20,212.5 19,975.5 20,758.5 20,998.0 21,616.0 22,414.0 21,675.5 -739 -3.29 60 0.28
Student Hours, Reg Prog (Part-Time) 605.0 656.0 377.0 651.5 586.5 619.5 420.0 365.0 430.0 65 17.81 10 2.38
Student Hours, Reg Prog (Spec/2nd Deg) 167.5 215.0 232.0 206.0 319.0 347.5 321.5 296.5 256.5 -40 -13.49 -65 -20.22
Student Hours, Reg Prog (Overload) 59.5 58.0 98.5 110.5 91.5 98.5 72.0 134.5 107.5 -27 -20.07 36 49.31
Student Hours, Regular Program 23,075.5 22,362.0
Student Hours, DEAF 39.0 60.0 27.0 66.0 60.0 57.0 68.0 66.0 39 -27 -40.91 -29 -42.65
Student Hours, GOAL 11,927 11,303 11,618 12,001 11,337 10,254 9,616 10,007 9,316 -691 -6.91 -300 -3.12
Student Hours, RN to BSN 304 327 306 317 222 239 1,219 1,785 1,859 74 4.15 640 52.50
Student Hours, GOAL/RN to BSN 12,231 11,630 11,924 12,318 11,559 10,493 10,838 11,792 11,175 -617 -5.23 337 3.11
Student Hours, EUEP 434 306 264 320 388 435 294 210 366 156 74.29 72 24.49
Student Hours, Doctor of Education 105 224 224 287 334 357 707 997 998 1 0.10 291 41.16
New Hours , Doctor of Education 0 0 0 0 0 7 0 0 14 14 #DIV/0! 14 #DIV/0!
Student Hours, Graduate School 1,934 1,912 2,086 2,320 2,238 2,015 1,632 3,888 7,809 3,921 100.85 6,177 378.49
New Hours , Graduate School 234 93 225 254 231 181 264 1,284 2,307 1,023 79.67 2,043 773.86
Student Hours, Master of Nursing 430 484 438 333 409 446 583 664 727 63 9.49 144 24.70
New Hours , Master of Nursing 81 28 73 55 103 47 135 63 81 18 28.57 -54 -40.00
Student Hours, Doctors of Nursing 66 144 78 118.18 144 #DIV/0!
New Hours , Doctor of Nursing 0 0 0 0
Student Hours, School of Divinity 1,659 1,592 1,398 1,707 1,734 1,872 1,951 1,815 1,620 -195 -10.74 -331 -16.97
New Hours , School of Divinity 147 30 123 198 162 312 282 246 198 -48 -19.51 -84 -29.79
Student Hours, Doctor of Ministry 106 74 57 67 61 54 67 66 38 -28 -42.42 -29 -43.28
New Hours , Doctor of Ministry 19 0 4 0 4 6 15 4 8 4 100.00 -7 -46.67
Student Hours, Graduate School of Business 2,043 2,130 2,282 2,346 2,210 2,172 2,094 2,024 1,937 -87 -4.30 -157 -7.50
New Hours , Graduate School of Business 282 222 453 717 492 576 528 552 471 -81 -14.67 -57 -10.80
Student Hours, All Programs 38,766.5 38,919.5 39,521.5 40,597.0 40,657.0 39,866.0 40,591.5 44,662.0 47,215.0 2,553 5.72 6,624 16.32
One-Year Chg Two-Year Chg
Spring Semesters

Enrollment Comparisons Fall Semesters (2003 - 2011)
End End End End End End End End End
2003 2004 2005 2006 2007 2008 2009 2010 2011 N % N %
Full-Time Students, Reg Prog 1,354 1,375 1,387 1,358 1,428 1,468 1,535 1,604 1,560 -44 -2.74 185 13.45
Part-Time Students, Reg Prog 157 104 97 119 113 100 57 58 52 -6 -10.34 -52 -50.00
Special/2nd Deg Headcount, Reg Prog 64 90 81 75 83 67 64 55 -9 -14.06 -9 -14.06
Total Headcount, Reg Prog 1,511 1,543 1,574 1,558 1,616 1,651 1,659 1,726 1,667 -59 -3.42 124 8.04
First Time Freshmen, Reg Prog 405 442 405 419 441 446 467 451 -16 -3.43 46 11.36
Transfer Students, Reg Prog 129 101 138 101 108 105 125 106 -19 -15.20 -23 -17.83
FT Transfer Students, Reg Prog 116 86 103 85 90 96 120 101 -19 -15.83 -15 -12.93
FT Readmitted Students, Reg Prog 22 19 20 17 12 20 22 16 -6 -27.27 -6 -27.27
Continuing Students, Reg Prog (10+hrs) 835 843 831 909 924 969 994 990 -4 -0.40 155 18.56
Resident Students, Reg Prog 1,032 1,084 1,076 1,033 1,103 1,163 1,191 1,278 1,262 -16 -1.25 178 16.42
Resident Students, All Programs 1,091 1,082 1,040 1,111 1,178 1,200 1,289 1,274 -15 -1.16 183 16.77
FT Students, Reg Prog (for Billing) 1,377 1,392 1,363 1,430 1,472 1,538 1,610 1,565 -45 -2.80 188 13.65
Deaf Headcount 13 15 15 9 14 19 7 5 -2 -28.57 -8 -61.54
GOAL Headcount 1,098 1,000 1,066 1,071 1,024 963 837 934 899 -35 -3.75 -101 -10.10
RN to BSN Headcount 39 35 39 36 32 34 134 168 189 21 12.50 154 440.00
Total Headcount, GOAL/RN to BSN 1,137 1,035 1,105 1,107 1,056 997 971 1,102 1,088 -14 -1.27 53 5.12
EUEP Headcount 44 39 34 31 38 41 35 30 38 8 26.67 -1 -2.56
Doctor of Education Headcount 16 33 42 54 62 74 125 168 193 25 14.88 160 484.85
New Students , Doctor of Education 18 11 23 15 20 66 59 48 -11 -18.64 30 166.67
Graduate School Headcount 459 495 480 481 501 471 358 541 947 406 75.05 452 91.31
New Students , Graduate School 225 156 197 160 136 114 281 413 132 46.98 188 83.56
Masters of Nursing Headcount 78 86 94 66 78 100 105 132 136 4 3.03 50 58.14
New Students , Masters of Nursing 31 41 18 40 30 32 52 46 -6 -11.54 15 48.39
Doctor of Nursing 13 24 11 84.62 24
New Students , Doctor of Nursing 13 12 -1 -7.69 12
School of Divinity Headcount 179 175 148 164 171 170 199 197 194 -3 -1.52 19 10.86
New Students , School of Divinity 47 39 54 49 46 50 51 51 0 0.00 4 8.51
Doctor of Ministry Headcount 23 23 17 19 21 24 21 21 24 3 14.29 1 4.35
New Students , Doctor of Ministry 8 2 7 6 6 8 4 9 5 125.00 1 12.50
Graduate School of Business Headcount 395 362 403 394 410 419 432 425 424 -1 -0.24 62 17.13
New Students , Graduate School of Business 152 181 160 159 170 168 151 147 -4 -2.65 -5 -3.29
Total Headcount, All Programs 3,877 3,804 3,912 3,889 3,962 3,962 3,924 4,362 4,740 378 8.67 936 24.61
Total FT Students, All Programs 2,342 3,113 3,157 3,180 3,218 3,129 3,187 3,550 3,872 322 9.07 759 24.38
Student Hours, Reg Prog (Full-Time) 20,570.0 21,408.5 21,604.5 21,447.5 22,615.0 22,849.5 24,073.0 25,285.0 24,468.5 -817 -3.23 3,060 14.29
Student Hours, Reg Prog (Part-Time) 659.0 640.0 575.5 738.0 707.5 723.5 362.5 377.5 339.0 -39 -10.20 -301 -47.03
Student Hours, Reg Prog (Spec/2nd Deg) 188.0 267.5 239.5 279.5 400.0 306.5 321.0 262.5 -59 -18.22 75 39.63
Student Hours, Reg Prog (Overload) 51.5 44.0 64.0 68.5 59.5 60.0 78.0 107.0 29 37.18 56 107.77
Student Hours, DEAF 48.0 48.0 45.0 27.0 42.0 57.0 17.0 15.0 -2 -11.76 -33 -68.75
Student Hours, GOAL 12,367 10,971 11,773 11,776 11,211 10,181 9,254 10,252 9,795 -457 -4.46 -1,176 -10.72
Student Hours, RN to BSN 283 267 309 303 262 279 1,099 1,543 1,756 213 13.80 1,489 557.68
Student Hours, GOAL/RN to BSN 12,650 11,238 12,082 12,079 11,473 10,460 10,353 11,794 11,551 -243 -2.06 313 2.79
Student Hours, EUEP 476 462 411 341 418 460 402 361 492 131 36.29 30 6.49
Student Hours, Doctorate of Education 112 231 280 342 364 422 769 1,048 1,171 123 11.74 940 406.93
New Hours , Doctorate of Education 126 77 161 105 143 462 413 344 -69 -16.71 218 173.02
Student Hours, Graduate School 1,865 2,047 1,980 2,109 2,232 2,122 1,611 2,947 6,399 3,452 117.14 4,352 212.60
New Hours , Graduate School 852 626 827 663 531 520 1,750 2,971 1,221 69.77 2,119 248.71
Student Hours, Masters of Nursing 391 431 456 293 298 387 472 631 651 20 3.17 220 51.04
New Hours , Master of Nursing 160 212 94 136 118 154 256 236 -20 -7.81 76 47.50
Student Hours, Doctors of Nursing 72 138 66 91.67 138
New Hours , Doctor of Nursing 72 69 -3 -4.17 69
Student Hours, School of Divinity 1,769 1,696 1,463 1,716 1,767 1,766 1,878 1,813 1,680 -133 -7.34 -16 -0.94
New Hours , School of Divinity 423 369 567 495 434 444 444 438 -6 -1.35 15 3.55
Student Hours, Doctor of Ministry 110 104 71 83 103 93 74 75 90 15 20.00 -14 -13.46
New Hours , Doctor of Ministry 46 12 42 33 35 41 18 37 19 105.56 -9 -19.57
Student Hours, Graduate School of Business 2,115 1,905 2,136 2,193 2,160 2,166 2,229 2,181 2,139 -42 -1.93 234 12.28
New Hours , Graduate School of Business 810 1,002 906 807 876 915 829 795 -34 -4.10 -15 -1.85
Student Hours, All Programs 40,717.0 40,398.5 41,374.5 41,626.0 42,444.0 41,893.5 42,587.0 46,921.5 49,396.0 2,475 5.27 8,998 22.27
One-Year Chg 7-Year Change
Fall Semesters
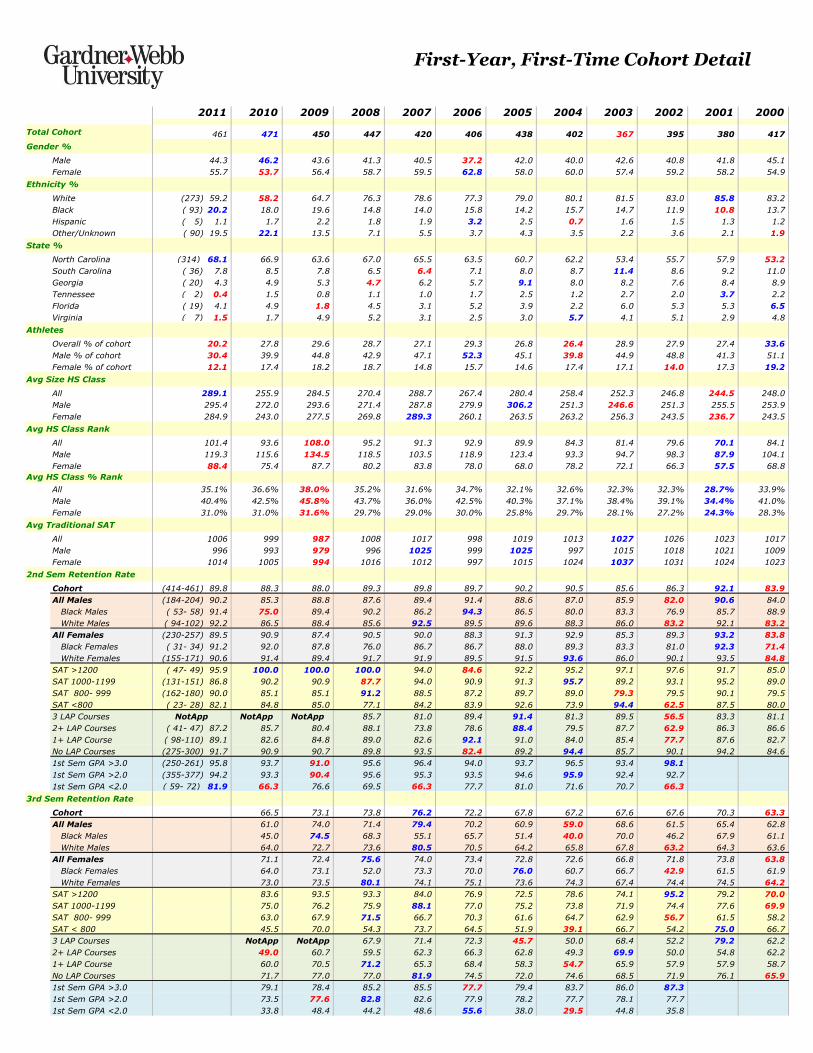
2011 2010 2009 2008 2007 2006 2005 2004 2003 2002 2001 2000450
Total Cohort 461 471 450 447 420 406 438 402 367 395 380 417
Gender %
Male 44.3 46.2 43.6 41.3 40.5 37.2 42.0 40.0 42.6 40.8 41.8 45.1
Female 55.7 53.7 56.4 58.7 59.5 62.8 58.0 60.0 57.4 59.2 58.2 54.9
Ethnicity %
White (273) 59.2 58.2 64.7 76.3 78.6 77.3 79.0 80.1 81.5 83.0 85.8 83.2
Black ( 93) 20.2 18.0 19.6 14.8 14.0 15.8 14.2 15.7 14.7 11.9 10.8 13.7
Hispanic ( 5) 1.1 1.7 2.2 1.8 1.9 3.2 2.5 0.7 1.6 1.5 1.3 1.2
Other/Unknown ( 90) 19.5 22.1 13.5 7.1 5.5 3.7 4.3 3.5 2.2 3.6 2.1 1.9
State %
North Carolina (314) 68.1 66.9 63.6 67.0 65.5 63.5 60.7 62.2 53.4 55.7 57.9 53.2
South Carolina ( 36) 7.8 8.5 7.8 6.5 6.4 7.1 8.0 8.7 11.4 8.6 9.2 11.0
Georgia ( 20) 4.3 4.9 5.3 4.7 6.2 5.7 9.1 8.0 8.2 7.6 8.4 8.9
Tennessee ( 2) 0.4 1.5 0.8 1.1 1.0 1.7 2.5 1.2 2.7 2.0 3.7 2.2
Florida ( 19) 4.1 4.9 1.8 4.5 3.1 5.2 3.9 2.2 6.0 5.3 5.3 6.5
Virginia ( 7) 1.5 1.7 4.9 5.2 3.1 2.5 3.0 5.7 4.1 5.1 2.9 4.8
Athletes
Overall % of cohort 20.2 27.8 29.6 28.7 27.1 29.3 26.8 26.4 28.9 27.9 27.4 33.6
Male % of cohort 30.4 39.9 44.8 42.9 47.1 52.3 45.1 39.8 44.9 48.8 41.3 51.1
Female % of cohort 12.1 17.4 18.2 18.7 14.8 15.7 14.6 17.4 17.1 14.0 17.3 19.2
Avg Size HS Class
All 289.1 255.9 284.5 270.4 288.7 267.4 280.4 258.4 252.3 246.8 244.5 248.0
Male 295.4 272.0 293.6 271.4 287.8 279.9 306.2 251.3 246.6 251.3 255.5 253.9
Female 284.9 243.0 277.5 269.8 289.3 260.1 263.5 263.2 256.3 243.5 236.7 243.5
Avg HS Class Rank
All 101.4 93.6 108.0 95.2 91.3 92.9 89.9 84.3 81.4 79.6 70.1 84.1
Male 119.3 115.6 134.5 118.5 103.5 118.9 123.4 93.3 94.7 98.3 87.9 104.1
Female 88.4 75.4 87.7 80.2 83.8 78.0 68.0 78.2 72.1 66.3 57.5 68.8
Avg HS Class % Rank
All 35.1% 36.6% 38.0% 35.2% 31.6% 34.7% 32.1% 32.6% 32.3% 32.3% 28.7% 33.9%
Male 40.4% 42.5% 45.8% 43.7% 36.0% 42.5% 40.3% 37.1% 38.4% 39.1% 34.4% 41.0%
Female 31.0% 31.0% 31.6% 29.7% 29.0% 30.0% 25.8% 29.7% 28.1% 27.2% 24.3% 28.3%
Avg Traditional SAT
All 1006 999 987 1008 1017 998 1019 1013 1027 1026 1023 1017
Male 996 993 979 996 1025 999 1025 997 1015 1018 1021 1009
Female 1014 1005 994 1016 1012 997 1015 1024 1037 1031 1024 1023
2nd Sem Retention Rate
Cohort (414-461) 89.8 88.3 88.0 89.3 89.8 89.7 90.2 90.5 85.6 86.3 92.1 83.9
All Males (184-204) 90.2 85.3 88.8 87.6 89.4 91.4 88.6 87.0 85.9 82.0 90.6 84.0
Black Males ( 53- 58) 91.4 75.0 89.4 90.2 86.2 94.3 86.5 80.0 83.3 76.9 85.7 88.9
White Males ( 94-102) 92.2 86.5 88.4 85.6 92.5 89.5 89.6 88.3 86.0 83.2 92.1 83.2
All Females (230-257) 89.5 90.9 87.4 90.5 90.0 88.3 91.3 92.9 85.3 89.3 93.2 83.8
Black Females ( 31- 34) 91.2 92.0 87.8 76.0 86.7 86.7 88.0 89.3 83.3 81.0 92.3 71.4
White Females (155-171) 90.6 91.4 89.4 91.7 91.9 89.5 91.5 93.6 86.0 90.1 93.5 84.8
SAT >1200 ( 47- 49) 95.9 100.0 100.0 100.0 94.0 84.6 92.2 95.2 97.1 97.6 91.7 85.0
SAT 1000-1199 (131-151) 86.8 90.2 90.9 87.7 94.0 90.9 91.3 95.7 89.2 93.1 95.2 89.0
SAT 800- 999 (162-180) 90.0 85.1 85.1 91.2 88.5 87.2 89.7 89.0 79.3 79.5 90.1 79.5
SAT <800 ( 23- 28) 82.1 84.8 85.0 77.1 84.2 83.9 92.6 73.9 94.4 62.5 87.5 80.0
3 LAP Courses NotApp NotApp NotApp 85.7 81.0 89.4 91.4 81.3 89.5 56.5 83.3 81.1
2+ LAP Courses ( 41- 47) 87.2 85.7 80.4 88.1 73.8 78.6 88.4 79.5 87.7 62.9 86.3 86.6
1+ LAP Course ( 98-110) 89.1 82.6 84.8 89.0 82.6 92.1 91.0 84.0 85.4 77.7 87.6 82.7
No LAP Courses (275-300) 91.7 90.9 90.7 89.8 93.5 82.4 89.2 94.4 85.7 90.1 94.2 84.6
1st Sem GPA >3.0 (250-261) 95.8 93.7 91.0 95.6 96.4 94.0 93.7 96.5 93.4 98.1
1st Sem GPA >2.0 (355-377) 94.2 93.3 90.4 95.6 95.3 93.5 94.6 95.9 92.4 92.7
1st Sem GPA <2.0 ( 59- 72) 81.9 66.3 76.6 69.5 66.3 77.7 81.0 71.6 70.7 66.3
3rd Sem Retention Rate
Cohort 66.5 73.1 73.8 76.2 72.2 67.8 67.2 67.6 67.6 70.3 63.3
All Males 61.0 74.0 71.4 79.4 70.2 60.9 59.0 68.6 61.5 65.4 62.8
Black Males 45.0 74.5 68.3 55.1 65.7 51.4 40.0 70.0 46.2 67.9 61.1
White Males 64.0 72.7 73.6 80.5 70.5 64.2 65.8 67.8 63.2 64.3 63.6
All Females 71.1 72.4 75.6 74.0 73.4 72.8 72.6 66.8 71.8 73.8 63.8
Black Females 64.0 73.1 52.0 73.3 70.0 76.0 60.7 66.7 42.9 61.5 61.9
White Females 73.0 73.5 80.1 74.1 75.1 73.6 74.3 67.4 74.4 74.5 64.2
SAT >1200 83.6 93.5 93.3 84.0 76.9 72.5 78.6 74.1 95.2 79.2 70.0
SAT 1000-1199 75.0 76.2 75.9 88.1 77.0 75.2 73.8 71.9 74.4 77.6 69.9
SAT 800- 999 63.0 67.9 71.5 66.7 70.3 61.6 64.7 62.9 56.7 61.5 58.2
SAT < 800 45.5 70.0 54.3 73.7 64.5 51.9 39.1 66.7 54.2 75.0 66.7
3 LAP Courses NotApp NotApp 67.9 71.4 72.3 45.7 50.0 68.4 52.2 79.2 62.2
2+ LAP Courses 49.0 60.7 59.5 62.3 66.3 62.8 49.3 69.9 50.0 54.8 62.2
1+ LAP Course 60.0 70.5 71.2 65.3 68.4 58.3 54.7 65.9 57.9 57.9 58.7
No LAP Courses 71.7 77.0 77.0 81.9 74.5 72.0 74.6 68.5 71.9 76.1 65.9
1st Sem GPA >3.0 79.1 78.4 85.2 85.5 77.7 79.4 83.7 86.0 87.3
1st Sem GPA >2.0 73.5 77.6 82.8 82.6 77.9 78.2 77.7 78.1 77.7
1st Sem GPA <2.0 33.8 48.4 44.2 48.6 55.6 38.0 29.5 44.8 35.8
First-Year, First-Time Cohort Detail

Ac
ad
em
ic
Year
TR
AD
ITIO
NA
L
GO
AL
GR
AD
TO
TA
L %
Annu
Chge
TR
AD
ITIO
NA
L
GO
AL
GR
AD
TO
TA
L %
Annu
Chge
TR
AD
ITIO
NA
L
GO
AL
GR
AD
TO
TA
L %
Annu
Chge
TR
AD
ITIO
NA
L
GO
AL
GR
AD
TO
TA
L %
Annu
Chge
99 - 00 42 17 59 113 7 120 56 79 135 0 211 103 314
00 - 01 99 59 158 168% 210 72 282 135% 241 109 350 159% 0 550 240 790 152%
01 - 02 248 199 447 183% 364 289 653 132% 444 235 679 94% 0 1056 723 1779 125%
02 - 03 438 276 714 60% 703 354 1057 62% 866 307 1173 73% 0 2007 937 2944 65%
03 - 04 1 841 389 1231 72% 22 1257 474 1753 66% 924 575 1499 28% 23 3022 1438 4483 52%
04 - 05 927 485 1412 15% 1095 584 1679 -4% 1 985 548 1534 2% 1 3007 1617 4625 3%
05 - 06 1093 596 1689 20% 1281 716 1997 19% 1076 653 1729 13% 0 3450 1965 5415 17%
06 - 07 1006 531 1537 -9% 1332 725 2057 3% 2 1197 701 1900 10% 2 3535 1957 5494 1%
07 - 08 139 1442 653 2234 45% 46 1687 672 2405 17% 62 1464 613 2139 13% 247 4593 1938 6778 23%
08 - 09 58 1842 646 2546 14% 56 1854 720 2630 9% 96 1202 770 2068 -3% 210 4898 2136 7244 7%
09- 10 97 1930 791 2818 11% 51 2120 814 2985 13% 100 1676 872 2648 28% 248 5726 2477 8451 17%
10- 11 81 2403 971 3455 23% 2576 910 3486 17% 10 1978 852 2840 7% 91 6957 2733 9781 16%
11-12 157 2590 975 3722 8% 17 2800 1097 3914 12% 50 1748 938 2736 -4% 224 7138 3010 10372 6%
Undergraduate
Business
Communication Studies
Education
English
Fine Arts
Mathematics
Natural Sciences
Nursing
PEWSS
Religious Studies
Social Sciences
World Languages
Other (YMCA)
Total
Graduate
Business
Education
English
Mathematics
Nursing
Total 975 1,097 938 3,010
237 213 211 661 22.0%
7 7 0.2%
25 26 51 1.7%
191 334 214 739 24.6%
540 525 487 1,552 51.6%
% Prog
Fall Spring Summer Total Total
0 0.0%
2,747 2,817 1,798 7,362
43 45 30 118 1.6%
167 229 179 575 7.8%
261 278 207 746 10.1%
209 256 165 630 8.6%
486 440 108 1,034 14.0%
162 105 69 336 4.6%
134 108 90 332 4.5%
59 64 64 187 2.5%
123 117 115 355 4.8%
0 0.0%
29 36 109 174 2.4%
1074 1,139 662 2,875 39.1%
Fall Spring Summer Total Total
2011-12 Online Enrollment by Academic Program
% Prog
Fall Spring Summer Overall Academic Year

Grade Distribution by Department / School
Fall 2011
Full-Time Faculty
Nstud QPts QPR NStud QPts QPR NStud QPts QPR NStud QPts QPR NStud QPts QPR NStud QPts QPR NStud QPts QPR NStud QPts QPR
1 Business 41 139.00 3.390 188 597.99 3.181 220 608.68 2.767 127 414.02 3.260 576 1,759.69 3.055 122 343.36 2.814 584 1,991.70 3.410 698 2,103.05 3.013
2 Communication St 163 493.37 3.027 121 436.04 3.604 53 179.39 3.385 337 1,108.80 3.290 337 1,108.80 3.290
3 Divinity, School of 28 95.35 3.405 23 70.00 3.043 23 87.00 3.783 74 252.35 3.410 427 1,403.00 3.286 74 252.35 3.410
4 Education 51 168.01 3.294 119 413.68 3.476 54 204.35 3.784 224 786.04 3.509 242 947.70 3.916 224 786.04 3.509
5 English 418 1,270.75 3.040 155 460.07 2.968 62 211.35 3.409 25 79.34 3.174 660 2,021.51 3.063 44 124.33 2.826 14 54.01 3.858 704 2,145.84 3.048
6 Fine Arts 289 1,047.35 3.624 248 753.42 3.038 81 282.01 3.482 67 218.35 3.259 685 2,301.13 3.359 685 2,301.13 3.359
7 Mathematics 447 1,020.43 2.283 50 131.67 2.633 18 53.99 2.999 28 72.00 2.571 543 1,278.09 2.354 83 187.67 2.261 13 51.67 3.975 626 1,465.76 2.341
8 Natural Sciences 375 990.03 2.640 177 463.41 2.618 31 100.67 3.247 67 235.00 3.507 650 1,789.11 2.752 28 89.02 3.179 678 1,878.13 2.770
9 Nursing 256 701.00 2.738 155 458.00 2.955 411 1,159.00 2.820 208 778.00 3.740 169 647.67 3.832 619 1,937.00 3.129
10 PhyEdWellSpStud 47 149.00 3.170 268 760.80 2.839 98 276.70 2.823 52 165.35 3.180 465 1,351.85 2.907 106 315.00 2.972 15 40.01 2.667 571 1,666.85 2.919
11 Psychology 16 51.00 3.188 124 330.00 2.661 142 395.00 2.782 114 327.00 2.868 396 1,103.00 2.785 70 262.68 3.753 120 448.00 3.733 466 1,365.68 2.931
12 Religious Studies 161 444.68 2.762 122 353.98 2.901 84 255.98 3.047 6 21.00 3.500 373 1,075.64 2.884 30 70.68 2.356 7 26.01 3.716 403 1,146.32 2.844
13 Social Sciences 258 557.46 2.161 234 615.68 2.631 86 248.70 2.892 84 280.68 3.341 662 1,702.52 2.572 46 157.00 3.413 708 1,859.52 2.626
14 World Languages 262 677.78 2.587 159 435.40 2.738 50 130.34 2.607 47 156.97 3.340 518 1,400.49 2.704 25 80.01 3.200 543 1,480.50 2.727
TOTALS 2,598 7,143.83 2.750 2,117 6,091.80 2.878 1,112 3,413.14 3.069 747 2,440.45 3.267 6,574 19,089.22 2.904 762 2,407.75 3.160 1,591 5,609.77 3.526 7,336 21,496.97 2.930
Part-Time / Adjunct Faculty
Nstud QPts QPR NStud QPts QPR NStud QPts QPR NStud QPts QPR NStud QPts QPR NStud QPts QPR NStud QPts QPR NStud QPts QPR
1 Business 31 104.00 3.355 61 183.02 3.000 92 287.02 3.120 1,005 3,132.34 3.117 47 162.63 3.460 1,097 3,419.36 3.117
2 Communication St 36 126.66 3.518 10 32.00 3.200 46 158.66 3.449 39 125.00 3.205 85 283.66 3.337
3 Divinity, School of 89 329.00 3.697
4 Education 25 97.00 3.880 1 4.00 4.000 26 101.00 3.885 806 3,076.85 3.817 26 101.00 3.885
5 English 181 580.05 3.205 40 120.00 3.000 221 700.05 3.168 82 235.36 2.870 303 935.41 3.087
6 Fine Arts 88 329.69 3.746 214 678.05 3.168 54 191.99 3.555 35 123.68 3.534 391 1,323.41 3.385 57 208.68 3.661 448 1,532.09 3.420
7 Mathematics 10 29.66 2.966 10 29.66 2.966 51 145.34 2.850 61 175.00 2.869
8 Natural Sciences 12 25.34 2.112 12 25.34 2.112 170 538.02 3.165 182 563.36 3.095
9 Nursing 18 65.00 3.611 18 65.00 3.611 143 535.00 3.741 67 267.00 3.985 161 600.00 3.727
10 PhyEdWellSpStud 169 628.68 3.720 43 134.33 3.124 1 3.00 3.000 3 10.00 3.333 216 776.01 3.593 127 431.01 3.394 343 1,207.02 3.519
11 Psychology 16 44.00 2.750 14 47.00 3.357 10 34.33 3.433 40 125.33 3.133 591 2,075.64 3.512 42 154.67 3.683 631 2,200.97 3.488
12 Religious Studies 273 830.11 3.041 25 96.68 3.867 298 926.79 3.110 257 780.40 3.037 22 50.00 2.273 555 1,707.19 3.076
13 ROTC 11 43.67 3.970 8 30.34 3.793 12 40.00 3.333 10 36.00 3.600 41 150.01 3.659 41 150.01 3.659
14 Social Sciences 31 94.70 3.055 31 94.70 3.055 353 1,122.70 3.180 384 1,217.40 3.170
15 STAFF 139 460.67 3.314 139 460.67 3.314 44 161.00 3.659 183 621.67 3.397
16 World Languages 15 42.00 2.800 15 42.00 2.800
TOTALS 920 3,046.21 3.311 414 1,325.74 3.202 188 646.02 3.436 59 205.68 3.486 1,581 5,223.65 3.304 2,934 9,532.49 3.249 1,073 4,040.15 3.765 4,515 14,756.14 3.268
100
Level
Courses
200
Level
Courses
300
Level
Courses
400
Level
Courses
Traditional
Undergraduate
Courses
GOAL/Non-Tradition
Undergraduate
Courses
Graduate
Courses
All
Undergraduate
Courses
100
Level
Courses
200
Level
Courses
300
Level
Courses
400
Level
Courses
Traditional
Undergraduate
Courses
GOAL
Courses
Graduate
Courses
All
Undergraduate
Courses

All Faculty
Nstud QPts QPR NStud QPts QPR NStud QPts QPR NStud QPts QPR NStud QPts QPR NStud QPts QPR NStud QPts QPR NStud QPts QPR
1 Business 72 243.00 3.375 188 597.99 3.181 281 791.70 2.817 127 414.02 3.260 668 2,046.71 3.064 1,127 3,475.70 3.084 631 2,154.33 3.414 1,795 5,522.41 3.077
2 Communication St 199 620.03 3.116 121 436.04 3.604 63 211.39 3.355 383 1,267.46 3.309 39 125.00 3.205 422 1,392.46 3.300
3 Divinity, School of 28 95 3.405 23 70 3.043 23 87 3.783 74 252.35 3.410 0 0.00 516 1,732.00 3.357 74 252.35 3.410
4 Education 51 168.01 3.294 144 510.68 3.546 55 208.35 3.788 250 887.04 3.548 0 0.00 1,048 4,024.55 3.840 250 887.04 3.548
5 English 599 1,850.80 3.090 195 580.07 2.975 62 211.35 3.409 25 79.34 3.174 881 2,721.56 3.089 126 359.69 2.855 14 54.01 3.858 1,007 3,081.25 3.060
6 Fine Arts 377 1,377.04 3.653 462 1,431.47 3.098 135 474.00 3.511 102 342.03 3.353 1,076 3,624.54 3.369 57 208.68 3.661 1,133 3,833.22 3.383
7 Mathematics 447 1,020.43 2.283 60 161.33 2.689 18 53.99 2.999 28 72.00 2.571 553 1,307.75 2.365 134 333.01 2.485 13 51.67 3.975 687 1,640.76 2.388
8 Natural Sciences 387 1,015.37 2.624 177 463.41 2.618 31 100.67 3.247 67 235.00 3.507 662 1,814.45 2.741 198 627.04 3.167 860 2,441.49 2.839
9 Nursing 256 701.00 2.738 173 523.00 3.023 429 1,224.00 2.853 351 1,313.00 3.741 236 914.67 3.876 780 2,537.00 3.253
10 PhyEdWellSpStud 216 777.68 3.600 311 895.13 2.878 99 279.70 2.825 55 175.35 3.188 681 2,127.86 3.125 233 746.01 3.202 15 40.01 2.667 914 2,873.87 3.144
11 Psychology 32 95.00 2.969 138 377.00 2.732 152 429.33 2.825 114 327.00 2.868 436 1,228.33 2.817 661 2,338.32 3.538 162 602.67 3.720 1,097 3,566.65 3.251
12 Religious Studies 434 1,274.79 2.937 122 353.98 2.901 109 352.66 3.235 6 21.00 3.500 671 2,002.43 2.984 287 851.08 2.965 29 76.01 2.621 958 2,853.51 2.979
13 ROTC 11 43.67 3.970 8 30.34 3.793 12 40.00 3.333 10 36.00 3.600 41 150.01 3.659 0 0.00 41 150.01 3.659
14 Social Sciences 258 557.46 2.161 265 710.38 2.681 86 248.70 2.892 84 280.68 3.341 693 1,797.22 2.593 399 1,279.70 3.207 1,092 3,076.92 2.818
15 STAFF 139 460.67 3.314 139 460.67 3.314 44 161.00 3.659 183 621.67 3.397
16 World Languages 262 677.78 2.587 159 435.40 2.738 50 130.34 2.607 47 156.97 3.340 518 1,400.49 2.704 40 122.01 3.050 558 1,522.50 2.728
TOTALS 3,518 10,190.04 2.897 2,531 7,417.54 2.931 1,300 4,059.16 3.122 806 2,646.13 3.283 8,155 24,312.87 2.981 3,696 11,940.24 3.231 2,664 9,649.92 3.622 11,851 36,253.11 3.059
100
Level
Courses
200
Level
Courses
300
Level
Courses
400
Level
Courses
Traditional
Undergraduate
Courses
GOAL
Courses
Graduate
Courses
All
Undergraduate
Courses
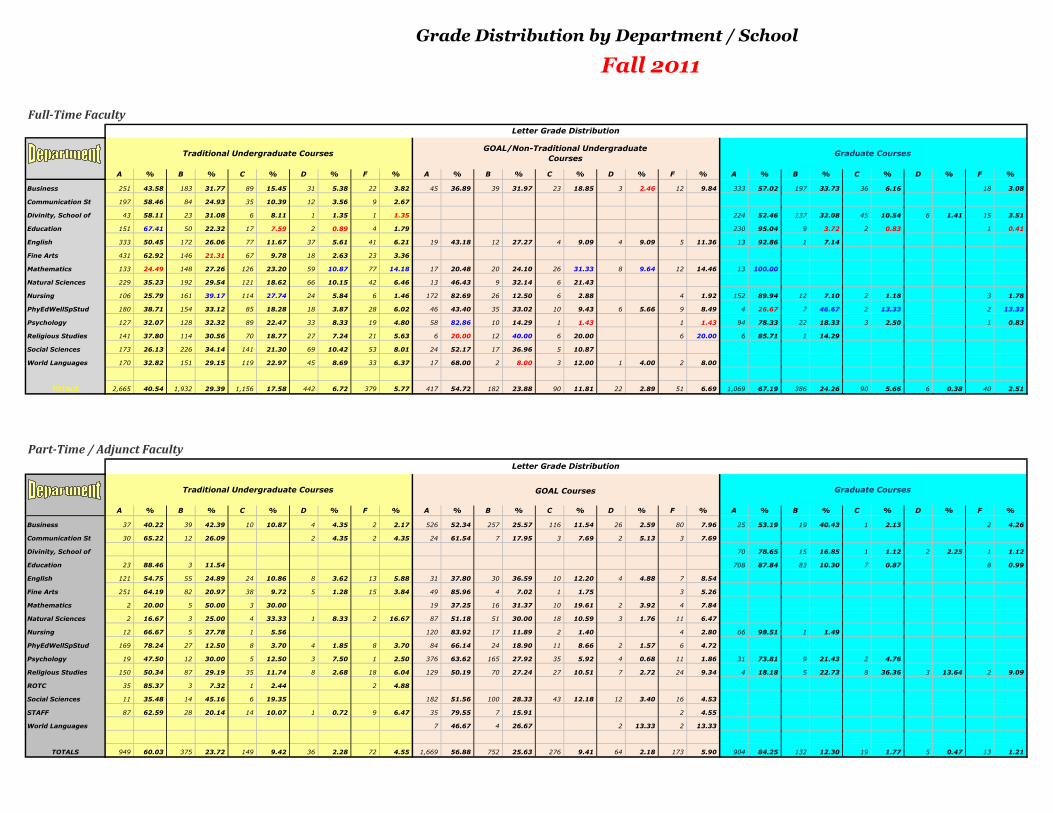
Grade Distribution by Department / School
Fall 2011
Full-Time Faculty
A % B % C % D % F % A % B % C % D % F % A % B % C % D % F %
Business 251 43.58 183 31.77 89 15.45 31 5.38 22 3.82 45 36.89 39 31.97 23 18.85 3 2.46 12 9.84 333 57.02 197 33.73 36 6.16 18 3.08
Communication St 197 58.46 84 24.93 35 10.39 12 3.56 9 2.67
Divinity, School of 43 58.11 23 31.08 6 8.11 1 1.35 1 1.35 224 52.46 137 32.08 45 10.54 6 1.41 15 3.51
Education 151 67.41 50 22.32 17 7.59 2 0.89 4 1.79 230 95.04 9 3.72 2 0.83 1 0.41
English 333 50.45 172 26.06 77 11.67 37 5.61 41 6.21 19 43.18 12 27.27 4 9.09 4 9.09 5 11.36 13 92.86 1 7.14
Fine Arts 431 62.92 146 21.31 67 9.78 18 2.63 23 3.36
Mathematics 133 24.49 148 27.26 126 23.20 59 10.87 77 14.18 17 20.48 20 24.10 26 31.33 8 9.64 12 14.46 13 100.00
Natural Sciences 229 35.23 192 29.54 121 18.62 66 10.15 42 6.46 13 46.43 9 32.14 6 21.43
Nursing 106 25.79 161 39.17 114 27.74 24 5.84 6 1.46 172 82.69 26 12.50 6 2.88 4 1.92 152 89.94 12 7.10 2 1.18 3 1.78
PhyEdWellSpStud 180 38.71 154 33.12 85 18.28 18 3.87 28 6.02 46 43.40 35 33.02 10 9.43 6 5.66 9 8.49 4 26.67 7 46.67 2 13.33 2 13.33
Psychology 127 32.07 128 32.32 89 22.47 33 8.33 19 4.80 58 82.86 10 14.29 1 1.43 1 1.43 94 78.33 22 18.33 3 2.50 1 0.83
Religious Studies 141 37.80 114 30.56 70 18.77 27 7.24 21 5.63 6 20.00 12 40.00 6 20.00 6 20.00 6 85.71 1 14.29
Social Sciences 173 26.13 226 34.14 141 21.30 69 10.42 53 8.01 24 52.17 17 36.96 5 10.87
World Languages 170 32.82 151 29.15 119 22.97 45 8.69 33 6.37 17 68.00 2 8.00 3 12.00 1 4.00 2 8.00
TOTALS 2,665 40.54 1,932 29.39 1,156 17.58 442 6.72 379 5.77 417 54.72 182 23.88 90 11.81 22 2.89 51 6.69 1,069 67.19 386 24.26 90 5.66 6 0.38 40 2.51
Part-Time / Adjunct Faculty
A % B % C % D % F % A % B % C % D % F % A % B % C % D % F %
Business 37 40.22 39 42.39 10 10.87 4 4.35 2 2.17 526 52.34 257 25.57 116 11.54 26 2.59 80 7.96 25 53.19 19 40.43 1 2.13 2 4.26
Communication St 30 65.22 12 26.09 2 4.35 2 4.35 24 61.54 7 17.95 3 7.69 2 5.13 3 7.69
Divinity, School of 70 78.65 15 16.85 1 1.12 2 2.25 1 1.12
Education 23 88.46 3 11.54 708 87.84 83 10.30 7 0.87 8 0.99
English 121 54.75 55 24.89 24 10.86 8 3.62 13 5.88 31 37.80 30 36.59 10 12.20 4 4.88 7 8.54
Fine Arts 251 64.19 82 20.97 38 9.72 5 1.28 15 3.84 49 85.96 4 7.02 1 1.75 3 5.26
Mathematics 2 20.00 5 50.00 3 30.00 19 37.25 16 31.37 10 19.61 2 3.92 4 7.84
Natural Sciences 2 16.67 3 25.00 4 33.33 1 8.33 2 16.67 87 51.18 51 30.00 18 10.59 3 1.76 11 6.47
Nursing 12 66.67 5 27.78 1 5.56 120 83.92 17 11.89 2 1.40 4 2.80 66 98.51 1 1.49
PhyEdWellSpStud 169 78.24 27 12.50 8 3.70 4 1.85 8 3.70 84 66.14 24 18.90 11 8.66 2 1.57 6 4.72
Psychology 19 47.50 12 30.00 5 12.50 3 7.50 1 2.50 376 63.62 165 27.92 35 5.92 4 0.68 11 1.86 31 73.81 9 21.43 2 4.76
Religious Studies 150 50.34 87 29.19 35 11.74 8 2.68 18 6.04 129 50.19 70 27.24 27 10.51 7 2.72 24 9.34 4 18.18 5 22.73 8 36.36 3 13.64 2 9.09
ROTC 35 85.37 3 7.32 1 2.44 2 4.88
Social Sciences 11 35.48 14 45.16 6 19.35 182 51.56 100 28.33 43 12.18 12 3.40 16 4.53
STAFF 87 62.59 28 20.14 14 10.07 1 0.72 9 6.47 35 79.55 7 15.91 2 4.55
World Languages 7 46.67 4 26.67 2 13.33 2 13.33
TOTALS 949 60.03 375 23.72 149 9.42 36 2.28 72 4.55 1,669 56.88 752 25.63 276 9.41 64 2.18 173 5.90 904 84.25 132 12.30 19 1.77 5 0.47 13 1.21
Letter Grade Distribution
Traditional Undergraduate CoursesGOAL/Non-Traditional Undergraduate
CoursesGraduate Courses
Letter Grade Distribution
Traditional Undergraduate Courses GOAL Courses Graduate Courses
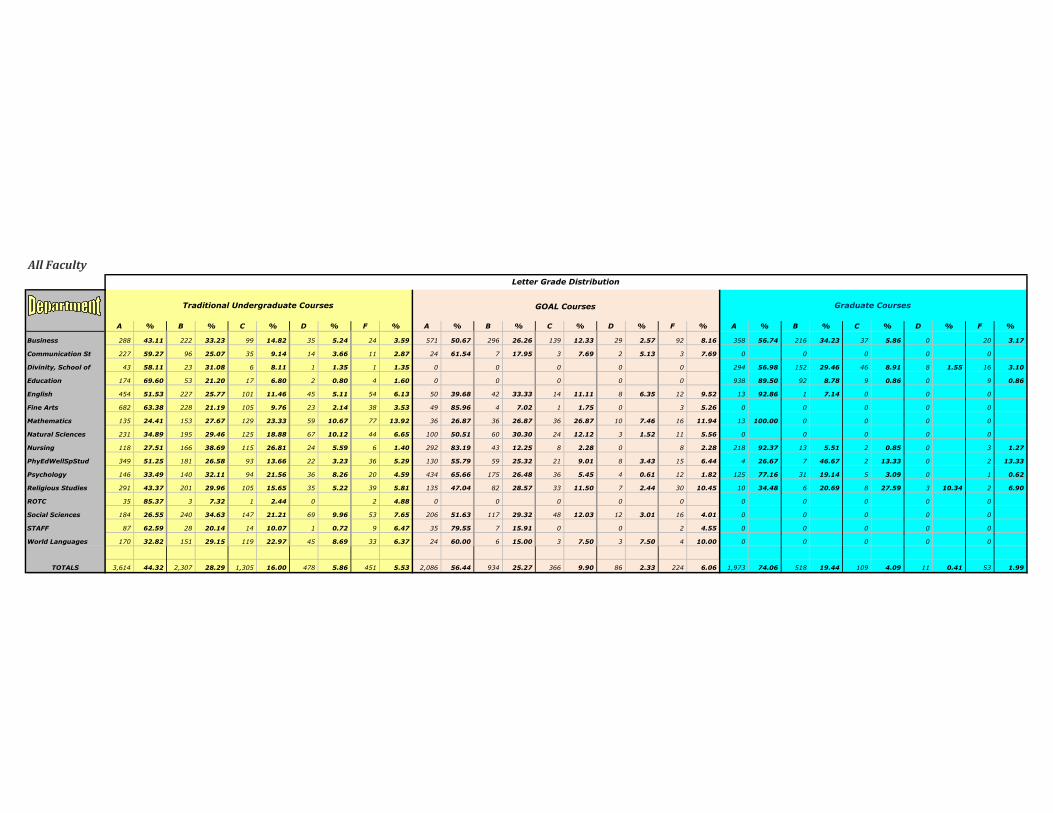
All Faculty
A % B % C % D % F % A % B % C % D % F % A % B % C % D % F %
Business 288 43.11 222 33.23 99 14.82 35 5.24 24 3.59 571 50.67 296 26.26 139 12.33 29 2.57 92 8.16 358 56.74 216 34.23 37 5.86 0 20 3.17
Communication St 227 59.27 96 25.07 35 9.14 14 3.66 11 2.87 24 61.54 7 17.95 3 7.69 2 5.13 3 7.69 0 0 0 0 0
Divinity, School of 43 58.11 23 31.08 6 8.11 1 1.35 1 1.35 0 0 0 0 0 294 56.98 152 29.46 46 8.91 8 1.55 16 3.10
Education 174 69.60 53 21.20 17 6.80 2 0.80 4 1.60 0 0 0 0 0 938 89.50 92 8.78 9 0.86 0 9 0.86
English 454 51.53 227 25.77 101 11.46 45 5.11 54 6.13 50 39.68 42 33.33 14 11.11 8 6.35 12 9.52 13 92.86 1 7.14 0 0 0
Fine Arts 682 63.38 228 21.19 105 9.76 23 2.14 38 3.53 49 85.96 4 7.02 1 1.75 0 3 5.26 0 0 0 0 0
Mathematics 135 24.41 153 27.67 129 23.33 59 10.67 77 13.92 36 26.87 36 26.87 36 26.87 10 7.46 16 11.94 13 100.00 0 0 0 0
Natural Sciences 231 34.89 195 29.46 125 18.88 67 10.12 44 6.65 100 50.51 60 30.30 24 12.12 3 1.52 11 5.56 0 0 0 0 0
Nursing 118 27.51 166 38.69 115 26.81 24 5.59 6 1.40 292 83.19 43 12.25 8 2.28 0 8 2.28 218 92.37 13 5.51 2 0.85 0 3 1.27
PhyEdWellSpStud 349 51.25 181 26.58 93 13.66 22 3.23 36 5.29 130 55.79 59 25.32 21 9.01 8 3.43 15 6.44 4 26.67 7 46.67 2 13.33 0 2 13.33
Psychology 146 33.49 140 32.11 94 21.56 36 8.26 20 4.59 434 65.66 175 26.48 36 5.45 4 0.61 12 1.82 125 77.16 31 19.14 5 3.09 0 1 0.62
Religious Studies 291 43.37 201 29.96 105 15.65 35 5.22 39 5.81 135 47.04 82 28.57 33 11.50 7 2.44 30 10.45 10 34.48 6 20.69 8 27.59 3 10.34 2 6.90
ROTC 35 85.37 3 7.32 1 2.44 0 2 4.88 0 0 0 0 0 0 0 0 0 0
Social Sciences 184 26.55 240 34.63 147 21.21 69 9.96 53 7.65 206 51.63 117 29.32 48 12.03 12 3.01 16 4.01 0 0 0 0 0
STAFF 87 62.59 28 20.14 14 10.07 1 0.72 9 6.47 35 79.55 7 15.91 0 0 2 4.55 0 0 0 0 0
World Languages 170 32.82 151 29.15 119 22.97 45 8.69 33 6.37 24 60.00 6 15.00 3 7.50 3 7.50 4 10.00 0 0 0 0 0
TOTALS 3,614 44.32 2,307 28.29 1,305 16.00 478 5.86 451 5.53 2,086 56.44 934 25.27 366 9.90 86 2.33 224 6.06 1,973 74.06 518 19.44 109 4.09 11 0.41 53 1.99
Graduate Courses
Letter Grade Distribution
Traditional Undergraduate Courses GOAL Courses

Grade Distribution by Department / School
Spring 2012
Full-Time Faculty
Nstud QPts QPR NStud QPts QPR NStud QPts QPR NStud QPts QPR NStud QPts QPR NStud QPts QPR NStud QPts QPR NStud QPts QPR
1 Business 47 149.00 3.170 168 510.33 3.038 220 652.05 2.964 78 272.36 3.492 513 1,583.74 3.087 256 784.36 3.064 508 1,717.43 3.381 769 2,368.10 3.079
2 Communication St 187 584.70 3.127 68 237.07 3.486 52 184.38 3.546 307 1,006.15 3.277 307 1,006.15 3.277
3 Divinity, School of 8 20.00 2.500 8 20.00 2.500 391 1,278.68 3.270 8 20.00 2.500
4 Education 31 75.66 2.441 109 330.33 3.031 33 126.00 3.818 173 531.99 3.075 288 1,109.75 3.853 173 531.99 3.075
5 English 373 1,105.08 2.963 141 401.72 2.849 31 94.33 3.043 38 133.66 3.517 583 1,734.79 2.976 45 144.68 3.215 15 58.35 3.890 628 1,879.47 2.993
6 Fine Arts 208 694.68 3.340 148 460.70 3.113 116 385.36 3.322 56 204.66 3.655 528 1,745.40 3.306 528 1,745.40 3.306
7 Mathematics 313 616.66 1.970 26 69.99 2.692 50 137.34 2.747 11 40.00 3.636 400 863.99 2.160 97 249.66 2.574 24 82.01 3.417 497 1,113.65 2.241
8 Natural Sciences 255 677.72 2.658 208 595.69 2.864 53 181.00 3.415 55 187.68 3.412 571 1,642.09 2.876 53 130.66 2.465 624 1,772.75 2.841
9 Nursing 92 246.00 2.674 225 669.00 2.973 317 915.00 2.886 293 1,031.00 3.519 126 496.00 3.937 610 1,946.00 3.190
10 PhyEdWellSpStud 1 2.33 2.330 324 951.39 2.936 131 406.03 3.099 76 237.69 3.128 532 1,597.44 3.003 98 280.37 2.861 25 88.34 3.534 630 1,877.81 2.981
11 Psychology 150 404.00 2.693 109 322.00 2.954 136 418.00 3.074 395 1,144.00 2.896 51 182.33 3.575 158 614.00 3.886 446 1,326.33 2.974
12 Religious Studies 172 400.30 2.327 109 301.67 2.768 134 389.34 2.906 8 22.33 2.791 423 1,113.64 2.633 22 61.00 2.773 3 12.00 4.000 445 1,174.64 2.640
13 Social Sciences 222 443.41 1.997 283 712.81 2.519 95 276.35 2.909 96 303.68 3.163 696 1,736.25 2.495 78 269.00 3.449 774 2,005.25 2.591
14 World Languages 259 713.46 2.755 128 340.68 2.662 50 155.97 3.119 42 136.02 3.239 479 1,346.13 2.810 41 127.34 3.106 520 1,473.47 2.834
TOTALS 1,950 5,068.64 2.599 2,128 6,078.34 2.856 1,166 3,567.17 3.059 681 2,266.46 3.328 5,925 16,980.61 2.866 1,034 3,260.40 3.153 1,538 5,456.56 3.548 6,959 20,241.01 2.909
Part-Time / Adjunct Faculty
Nstud QPts QPR NStud QPts QPR NStud QPts QPR NStud QPts QPR NStud QPts QPR NStud QPts QPR NStud QPts QPR NStud QPts QPR
1 Business 14 42.00 3.000 26 82.67 3.180 60 196.67 3.278 13 50.00 3.846 113 371.34 3.286 865 2,635.77 3.047 42 158.00 3.762 978 3,007.11 3.075
2 Communication St 42 148.67 3.540 16 60.35 3.772 58 209.02 3.604 52 184.00 3.538 110 393.02 3.573
3 Divinity, School of 113 427.00 3.779
4 Education 43 166.01 3.861 9 36.00 4.000 52 202.01 3.885 1,001 3,848.82 3.845 52 202.01 3.885
5 English 40 124.70 3.118 63 177.33 2.815 103 302.03 2.932 91 276.68 3.040 194 578.71 2.983
6 Fine Arts 86 316.38 3.679 116 354.04 3.052 35 122.66 3.505 36 118.35 3.288 273 911.43 3.339 59 174.36 2.955 332 1,085.79 3.270
7 Mathematics 81 249.69 3.083 9 34.00 3.778 81 249.69 3.083
8 Natural Sciences 68 246.37 3.623 68 246.37 3.623
9 Nursing 12 37.00 3.083 12 37.00 3.083 118 436.67 3.701 64 248.33 3.880 130 473.67 3.644
10 PhyEdWellSpStud 221 841.99 3.810 19 39.66 2.087 9 34.34 3.816 5 14.67 2.934 254 930.66 3.664 192 630.67 3.285 446 1,561.33 3.501
11 Psychology 23 77.00 3.348 22 77.00 3.500 45 154.00 3.422 451 1,606.34 3.562 15 48.00 3.200 496 1,760.34 3.549
12 Religious Studies 234 699.45 2.989 15 57.68 3.845 249 757.13 3.041 290 846.08 2.918 539 1,603.21 2.974
13 ROTC 12 45.00 3.750 2 8.00 4.000 8 32.00 4.000 8 28.00 3.500 30 113.00 3.767 30 113.00 3.767
14 Social Sciences 8 32.00 4.000 8 32.00 4.000 398 1,279.41 3.215 22 86.00 3.909 406 1,311.41 3.230
15 STAFF 15 16.00 1.067 1 4.00 4.000 16 20.00 1.250 11 35.67 3.243 27 55.67 2.062
16 World Languages
TOTALS 634 2,122.52 3.348 291 887.37 3.049 201 722.36 3.594 87 307.37 3.533 1,213 4,039.62 3.330 2,676 8,601.71 3.214 1,266 4,850.15 3.831 3,889 12,641.33 3.251
100
Level
Courses
200
Level
Courses
300
Level
Courses
400
Level
Courses
Traditional
Undergraduate
Courses
GOAL/Non-Tradition
Undergraduate
Courses
Graduate
Courses
All
Undergraduate
Courses
100
Level
Courses
200
Level
Courses
300
Level
Courses
400
Level
Courses
Traditional
Undergraduate
Courses
GOAL
Courses
Graduate
Courses
All
Undergraduate
Courses
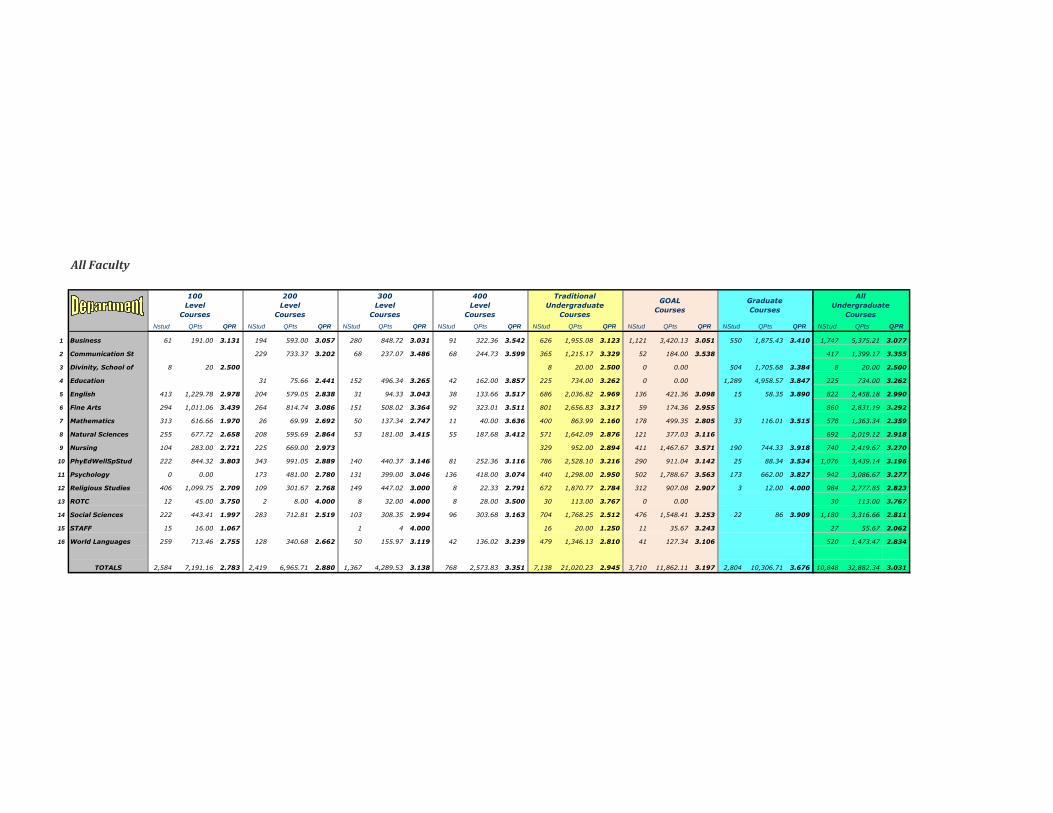
All Faculty
Nstud QPts QPR NStud QPts QPR NStud QPts QPR NStud QPts QPR NStud QPts QPR NStud QPts QPR NStud QPts QPR NStud QPts QPR
1 Business 61 191.00 3.131 194 593.00 3.057 280 848.72 3.031 91 322.36 3.542 626 1,955.08 3.123 1,121 3,420.13 3.051 550 1,875.43 3.410 1,747 5,375.21 3.077
2 Communication St 229 733.37 3.202 68 237.07 3.486 68 244.73 3.599 365 1,215.17 3.329 52 184.00 3.538 417 1,399.17 3.355
3 Divinity, School of 8 20 2.500 8 20.00 2.500 0 0.00 504 1,705.68 3.384 8 20.00 2.500
4 Education 31 75.66 2.441 152 496.34 3.265 42 162.00 3.857 225 734.00 3.262 0 0.00 1,289 4,958.57 3.847 225 734.00 3.262
5 English 413 1,229.78 2.978 204 579.05 2.838 31 94.33 3.043 38 133.66 3.517 686 2,036.82 2.969 136 421.36 3.098 15 58.35 3.890 822 2,458.18 2.990
6 Fine Arts 294 1,011.06 3.439 264 814.74 3.086 151 508.02 3.364 92 323.01 3.511 801 2,656.83 3.317 59 174.36 2.955 860 2,831.19 3.292
7 Mathematics 313 616.66 1.970 26 69.99 2.692 50 137.34 2.747 11 40.00 3.636 400 863.99 2.160 178 499.35 2.805 33 116.01 3.515 578 1,363.34 2.359
8 Natural Sciences 255 677.72 2.658 208 595.69 2.864 53 181.00 3.415 55 187.68 3.412 571 1,642.09 2.876 121 377.03 3.116 692 2,019.12 2.918
9 Nursing 104 283.00 2.721 225 669.00 2.973 329 952.00 2.894 411 1,467.67 3.571 190 744.33 3.918 740 2,419.67 3.270
10 PhyEdWellSpStud 222 844.32 3.803 343 991.05 2.889 140 440.37 3.146 81 252.36 3.116 786 2,528.10 3.216 290 911.04 3.142 25 88.34 3.534 1,076 3,439.14 3.196
11 Psychology 0 0.00 173 481.00 2.780 131 399.00 3.046 136 418.00 3.074 440 1,298.00 2.950 502 1,788.67 3.563 173 662.00 3.827 942 3,086.67 3.277
12 Religious Studies 406 1,099.75 2.709 109 301.67 2.768 149 447.02 3.000 8 22.33 2.791 672 1,870.77 2.784 312 907.08 2.907 3 12.00 4.000 984 2,777.85 2.823
13 ROTC 12 45.00 3.750 2 8.00 4.000 8 32.00 4.000 8 28.00 3.500 30 113.00 3.767 0 0.00 30 113.00 3.767
14 Social Sciences 222 443.41 1.997 283 712.81 2.519 103 308.35 2.994 96 303.68 3.163 704 1,768.25 2.512 476 1,548.41 3.253 22 86 3.909 1,180 3,316.66 2.811
15 STAFF 15 16.00 1.067 1 4 4.000 16 20.00 1.250 11 35.67 3.243 27 55.67 2.062
16 World Languages 259 713.46 2.755 128 340.68 2.662 50 155.97 3.119 42 136.02 3.239 479 1,346.13 2.810 41 127.34 3.106 520 1,473.47 2.834
TOTALS 2,584 7,191.16 2.783 2,419 6,965.71 2.880 1,367 4,289.53 3.138 768 2,573.83 3.351 7,138 21,020.23 2.945 3,710 11,862.11 3.197 2,804 10,306.71 3.676 10,848 32,882.34 3.031
100
Level
Courses
200
Level
Courses
300
Level
Courses
400
Level
Courses
Traditional
Undergraduate
Courses
GOAL
Courses
Graduate
Courses
All
Undergraduate
Courses

Grade Distribution by Department / School
Spring 2012
Full-Time Faculty
A % B % C % D % F % A % B % C % D % F % A % B % C % D % F %
Business 240 46.78 146 28.46 90 17.54 13 2.53 24 4.68 114 44.53 82 32.03 39 15.23 7 2.73 14 5.47 289 56.89 171 33.66 29 5.71 19 3.74
Communication St 181 58.96 80 26.06 23 7.49 11 3.58 12 3.91
Divinity, School of 5 62.50 2 25.00 1 12.50 192 49.10 131 33.50 57 14.58 5 1.28 6 1.53
Education 80 46.24 51 29.48 26 15.03 6 3.47 10 5.78 267 92.71 16 5.56 1 0.35 4 1.39
English 277 47.51 152 26.07 79 13.55 25 4.29 50 8.58 30 66.67 6 13.33 3 6.67 2 4.44 4 8.89 15 100.00
Fine Arts 320 60.61 116 21.97 57 10.80 10 1.89 25 4.73
Mathematics 78 19.50 97 24.25 102 25.50 56 14.00 67 16.75 29 29.90 26 26.80 21 21.65 13 13.40 8 8.25 12 50.00 11 45.83 1 4.17
Natural Sciences 221 38.70 173 30.30 104 18.21 40 7.01 33 5.78 12 22.64 17 32.08 14 26.42 3 5.66 7 13.21
Nursing 82 25.87 129 40.69 95 29.97 10 3.15 1 0.32 193 65.87 74 25.26 18 6.14 1 0.34 7 2.39 118 93.65 8 6.35
PhyEdWellSpStud 226 42.48 172 32.33 78 14.66 32 6.02 24 4.51 49 50.00 23 23.47 6 6.12 7 7.14 13 13.27 20 80.00 3 12.00 2 8.00
Psychology 136 34.43 134 33.92 89 22.53 20 5.06 16 4.05 35 68.63 14 27.45 2 3.92 143 90.51 14 8.86 1 0.63
Religious Studies 108 25.53 145 34.28 104 24.59 36 8.51 30 7.09 6 27.27 9 40.91 4 18.18 2 9.09 1 4.55 3 100.00
Social Sciences 188 27.01 217 31.18 137 19.68 84 12.07 70 10.06 42 53.85 32 41.03 2 2.56 1 1.28 1 1.28
World Languages 176 36.74 136 28.39 105 21.92 37 7.72 25 5.22 24 58.54 9 21.95 1 2.44 3 7.32 4 9.76
TOTALS 2,313 39.04 1,753 29.59 1,091 18.41 381 6.43 387 6.53 534 51.64 292 28.24 108 10.44 39 3.77 61 5.90 1,059 68.86 354 23.02 88 5.72 5 0.33 32 2.08
Part-Time / Adjunct Faculty
A % B % C % D % F % A % B % C % D % F % A % B % C % D % F %
Business 57 50.44 41 36.28 9 7.96 3 2.65 3 2.65 479 55.38 181 20.92 82 9.48 23 2.66 100 11.56 33 78.57 8 19.05 1 2.38
Communication St 42 72.41 13 22.41 2 3.45 1 1.72 39 75.00 7 13.46 3 5.77 1 1.92 2 3.85
Divinity, School of 100 88.50 6 5.31 4 3.54 1 0.88 2 1.77
Education 48 92.31 3 5.77 1 1.92 911 91.01 72 7.19 2 0.20 16 1.60
English 45 43.69 29 28.16 18 17.48 2 1.94 9 8.74 43 47.25 30 32.97 7 7.69 2 2.20 9 9.89
Fine Arts 178 65.20 59 21.61 14 5.13 4 1.47 18 6.59 32 54.24 10 16.95 7 11.86 5 8.47 5 8.47
Mathematics 43 53.09 16 19.75 15 18.52 2 2.47 5 6.17 8 88.89 1 11.11
Natural Sciences 49 72.06 16 23.53 3 4.41
Nursing 4 33.33 7 58.33 1 8.33 94 79.66 19 16.10 2 1.69 3 2.54 59 92.19 4 6.25 1 1.56
PhyEdWellSpStud 206 81.10 25 9.84 14 5.51 3 1.18 6 2.36 109 56.77 52 27.08 19 9.90 1 0.52 11 5.73
Psychology 27 60.00 12 26.67 4 8.89 2 4.44 307 68.07 110 24.39 23 5.10 3 0.67 8 1.77 7 46.67 6 40.00 1 6.67 1 6.67
Religious Studies 120 48.19 71 28.51 33 13.25 11 4.42 14 5.62 136 46.90 71 24.48 44 15.17 9 3.10 30 10.34
ROTC 25 83.33 3 10.00 2 6.67
Social Sciences 8 100.00 221 55.53 100 25.13 41 10.30 21 5.28 15 3.77 20 90.91 2 9.09
STAFF 3 18.75 2 12.50 1 6.25 10 62.50 6 54.55 4 36.36 1 9.09
World Languages
TOTALS 763 62.90 265 21.85 98 8.08 25 2.06 62 5.11 1,558 58.22 616 23.02 246 9.19 67 2.50 189 7.06 1,138 89.89 98 7.74 9 0.71 1 0.08 20 1.58
Letter Grade Distribution
Traditional Undergraduate CoursesGOAL/Non-Traditional Undergraduate
CoursesGraduate Courses
Letter Grade Distribution
Traditional Undergraduate Courses GOAL Courses Graduate Courses

All Faculty
A % B % C % D % F % A % B % C % D % F % A % B % C % D % F %
Business 297 47.44 187 29.87 99 15.81 16 2.56 27 4.31 593 52.90 263 23.46 121 10.79 30 2.68 114 10.17 322 58.55 179 32.55 30 5.45 0 19 3.45
Communication St 223 61.10 93 25.48 25 6.85 11 3.01 13 3.56 39 75.00 7 13.46 3 5.77 1 1.92 2 3.85 0 0 0 0 0
Divinity, School of 0 5 62.50 2 25.00 1 12.50 0 0 0 0 0 0 292 57.94 137 27.18 61 12.10 6 1.19 8 1.59
Education 128 56.89 54 24.00 27 12.00 6 2.67 10 4.44 0 0 0 0 0 1,178 91.39 88 6.83 3 0.23 0 20 1.55
English 322 46.94 181 26.38 97 14.14 27 3.94 59 8.60 73 53.68 36 26.47 10 7.35 4 2.94 13 9.56 15 100.00 0 0 0 0
Fine Arts 498 62.17 175 21.85 71 8.86 14 1.75 43 5.37 32 54.24 10 16.95 7 11.86 5 8.47 5 8.47 0 0 0 0 0
Mathematics 78 19.50 97 24.25 102 25.50 56 14.00 67 16.75 72 40.45 42 23.60 36 20.22 15 8.43 13 7.30 20 60.61 11 33.33 2 6.06 0 0
Natural Sciences 221 38.70 173 30.30 104 18.21 40 7.01 33 5.78 61 50.41 33 27.27 17 14.05 3 2.48 7 5.79 0 0 0 0 0
Nursing 86 26.14 136 41.34 95 28.88 10 3.04 2 0.61 287 69.83 93 22.63 20 4.87 1 0.24 10 2.43 177 93.16 12 6.32 0 0 1 0.53
PhyEdWellSpStud 432 54.96 197 25.06 92 11.70 35 4.45 30 3.82 158 54.48 75 25.86 25 8.62 8 2.76 24 8.28 20 80.00 3 12.00 0 0 2 8.00
Psychology 163 37.05 146 33.18 93 21.14 22 5.00 16 3.64 342 68.13 124 24.70 23 4.58 3 0.60 10 1.99 150 86.71 20 11.56 1 0.58 0 2 1.16
Religious Studies 228 33.93 216 32.14 137 20.39 47 6.99 44 6.55 142 45.51 80 25.64 48 15.38 11 3.53 31 9.94 3 100.00 0 0 0 0
ROTC 25 83.33 3 10.00 2 6.67 0 0 0 0 0 0 0 0 0 0 0 0
Social Sciences 196 27.84 217 30.82 137 19.46 84 11.93 70 9.94 263 55.25 132 27.73 43 9.03 22 4.62 16 3.36 20 90.91 2 9.09 0 0 0
STAFF 3 18.75 2 12.50 1 6.25 0 10 62.50 6 54.55 4 36.36 0 0 1 9.09 0 0 0 0 0
World Languages 176 36.74 136 28.39 105 21.92 37 7.72 25 5.22 24 58.54 9 21.95 1 2.44 3 7.32 4 9.76 0 0 0 0 0
TOTALS 3,076 43.09 2,018 28.27 1,189 16.66 406 5.69 449 6.29 2,092 56.39 908 24.47 354 9.54 106 2.86 250 6.74 2,197 78.35 452 16.12 97 3.46 6 0.21 52 1.85
Graduate Courses
Letter Grade Distribution
Traditional Undergraduate Courses GOAL Courses

Full-Time Faculty
NStud QuPts QPR % A % B % C % D % F NStud QuPts QPR % A % B % C % D % F NStud QuPts QPR % A % B % C % D % F
Fall 04 5,642 15,904 2.819 661 2,027 3.067 1,259 4,444 3.530 Fall 04
Spring 05 5,440 15,644 2.876 803 2,478 3.086 1,472 5,375 3.651 Spring 05
Fall 05 5,733 16,017 2.794 727 2,171 2.986 1,497 5,433 3.629 Fall 05
Spring 06 5,184 14,887 2.872 734 2,215 3.018 1,666 6,068 3.642 Spring 06
Fall 06 6,238 18,233 2.923 794 2,530 3.186 1,572 5,628 3.580 Fall 06
Spring 07 5,504 16,169 2.938 1,000 3,186 3.186 1,765 6,451 3.655 Spring 07
Fall 07 6,242 18,422 2.951 41.7 29.8 16.6 5.8 6.1 825 2,773 3.361 59.4 23.9 12.2 2.4 2.1 1,756 6,257 3.563 69.0 21.9 6.8 1.0 1.3 Fall 07
Spring 08 5,583 16,282 2.916 39.4 30.2 18.4 6.8 5.2 898 2,804 3.131 49.8 26.3 14.9 4.5 4.6 1,681 6,052 3.600 71.1 20.9 6.0 0.8 1.1 Spring 08
Fall 08 6,490 19,014 2.930 41.4 28.8 17.3 6.3 6.2 883 2,846 3.223 55.2 26.3 9.2 4.5 4.9 1,705 6,137 3.599 71.1 21.5 5.3 0.3 1.8 Fall 08
Spring 09 5,778 16,922 2.929 41.0 28.8 18.1 6.2 5.9 781 2,533 3.243 54.9 26.2 11.1 3.6 4.1 1,835 6,501 3.543 67.7 23.2 6.9 0.2 2.0 Spring 09
Fall 09 6,286 18,136 2.885 38.7 29.3 19.7 6.6 5.8 831 2,639 3.176 52.9 25.3 13.0 4.0 4.8 1,788 6,408 3.584 70.2 22.1 5.4 0.1 2.1 Fall 09
Spring 10 5,779 16,772 2.902 39.7 28.6 19.4 6.6 5.7 936 2,974 3.177 51.8 28.3 10.9 3.7 5.2 1,730 6,305 3.645 73.2 20.9 4.4 0.2 1.3 Spring 10
Fall 10 6,436 18,797 2.921 42.0 27.6 18.3 6.1 6.0 741 2,384 3.218 55.5 24.7 11.1 4.2 4.6 1,804 6,485 3.595 72.2 21.1 3.9 0.4 2.4 Fall 10
Spring 11 5,697 16,402 2.879 40.6 28.3 17.8 6.7 6.7 873 2,743 3.142 48.8 30.5 12.7 3.0 5.0 1,763 6,393 3.626 72.4 21.7 4.5 0.2 1.2 Spring 11
Fall 11 6,574 19,089 2.904 40.5 29.4 17.6 6.7 5.8 762 2,408 3.160 54.7 23.9 11.8 2.9 6.7 1,591 5,610 3.526 67.2 24.3 5.7 0.4 2.5 Fall 11
Spring 12 5,925 16,981 2.866 39.0 29.6 18.4 6.4 6.5 1034 3,260 3.153 51.6 28.2 10.4 3.8 5.9 1,538 5,457 3.548 68.9 23.0 5.7 0.3 2.1 Spring 12
Part-Time / Adjunct Faculty
NStud QuPts QPR % A % B % C % D % F NStud QuPts QPR % A % B % C % D % F NStud QuPts QPR % A % B % C % D % F
Fall 04 1,787 5,530 3.095 2,771 9,146 3.301 613 2,295 3.744 Fall 04
Spring 05 1,189 3,814 3.208 2,823 9,446 3.346 407 1,521 3.737 Spring 05
Fall 05 1,742 5,616 3.224 2,988 9,977 3.339 358 1,278 3.570 Fall 05
Spring 06 1,421 4,572 3.217 3,070 10,358 3.374 264 965 3.655 Spring 06
Fall 06 1,403 4,652 3.316 2,928 9,746 3.329 362 1,328 3.669 Fall 06
Spring 07 1,289 4,281 3.321 3,099 10,083 3.254 573 2,068 3.609 Spring 07
Fall 07 1,541 5,031 3.265 56.4 24.1 12.6 3.3 3.6 2,858 9,428 3.299 55.4 27.6 11.7 2.2 3.1 411 1,530 3.723 78.3 18.5 1.7 0 1.5 Fall 07
Spring 08 1,202 4,049 3.369 60.2 24.1 10.8 1.9 2.9 3,049 10,008 3.282 56.8 25.9 10.3 2.9 4.2 393 1,488 3.786 86.8 7.9 3.6 0.8 1.0 Spring 08
Fall 08 1,464 4,835 3.303 57.7 26.7 8.7 2.2 4.8 2,553 8,112 3.177 50.2 29.7 12.9 2.3 5.0 388 1,430 3.686 76.8 18.6 2.8 0 1.8 Fall 08
Spring 09 1,229 4,191 3.410 64.4 21.7 7.8 2.4 3.6 2,744 8,906 3.246 55.2 26.4 10.9 2.7 4.8 292 1,136 3.890 92.1 6.8 0 0 1.0 Spring 09
Fall 09 1,708 5,692 3.333 57.1 27.8 9.7 2.1 3.3 2,622 8,510 3.246 55.1 26.9 10.3 2.6 5.0 319 1,216 3.824 83.7 14.7 1.6 0 0 Fall 09
Spring 10 1,394 4,758 3.413 61.6 24.0 10.0 2.8 1.6 2,678 8,683 3.242 54.6 27.5 10.4 2.3 5.1 387 1,473 3.806 85.5 11.4 1.8 0.8 0.5 Spring 10
Fall 10 1,833 6,014 3.281 57.2 25.3 11.1 2.2 4.2 3,104 9,901 3.190 53.1 27.0 11.8 2.9 5.2 873 3,385 3.878 92.0 6.1 1.2 0 0.8 Fall 10
Spring 11 1,606 5,415 3.372 64.1 20.6 10.0 2.1 3.3 3,072 9,912 3.227 55.0 25.9 11.5 2.9 4.8 1,092 4,195 3.842 89.7 7.9 1.3 0.2 0.9 Spring 11
Fall 11 1,581 5,224 3.304 60.0 23.7 9.4 2.3 4.6 2,934 9,532 3.249 56.9 25.6 9.4 2.2 5.9 1,073 4,040 3.765 84.2 12.3 1.8 0.5 1.2 Fall 11
Spring 12 1,213 4,040 3.331 62.9 21.6 8.1 2.1 5.1 2,676 8,602 3.214 58.2 23.0 9.2 2.5 7.1 1,266 4,850 3.831 89.9 7.7 0.7 0.1 1.6 Spring 12
All Faculty
NStud QuPts QPR % A % B % C % D % F NStud QuPts QPR % A % B % C % D % F NStud QuPts QPR % A % B % C % D % F
Fall 04 7,429 21,434 2.885 3,432 11,173 3.256 1,872 6,739 3.600 Fall 04
Spring 05 6,629 19,458 2.935 3,626 11,924 3.288 1,879 6,896 3.670 Spring 05
Fall 05 7,475 21,633 2.894 3,715 12,148 3.270 1,855 6,711 3.618 Fall 05
Spring 06 6,605 19,459 2.946 3,804 12,573 3.305 1,930 7,033 3.644 Spring 06
Fall 06 7,641 22,885 2.995 3,722 12,276 3.298 1,934 6,956 3.597 Fall 06
Spring 07 6,793 20,450 3.010 4,099 13,269 3.237 2,338 8,519 3.644 Spring 07
Fall 07 7,783 23,453 3.013 44.6 28.6 15.8 5.3 5.6 3,683 12,201 3.313 56.3 26.7 11.8 2.2 2.9 2,167 7,787 3.593 70.8 21.2 5.9 0.8 1.3 Fall 07
Spring 08 6,785 20,331 2.996 43.1 29.1 17.1 5.9 4.8 3,947 12,812 3.246 55.2 26.0 11.3 3.2 4.3 2,074 7,540 3.635 74.1 18.5 5.5 0.8 1.1 Spring 08
Fall 08 7,954 23,849 2.998 44.4 28.4 15.7 5.6 5.9 3,436 10,958 3.189 51.5 28.8 11.9 2.9 4.9 2,093 7,567 3.615 72.2 20.9 4.9 0.2 1.8 Fall 08
Spring 09 7,007 21,113 3.013 45.1 27.6 16.3 5.6 5.5 3,525 11,439 3.245 55.1 26.4 10.9 2.9 4.6 2,127 7,637 3.591 71.0 20.9 6.0 0.2 1.9 Spring 09
Fall 09 7,994 23,828 2.981 42.6 28.9 17.6 5.6 5.3 3,453 11,149 3.229 54.6 26.5 10.9 2.9 5.0 2,107 7,624 3.618 72.3 21.0 4.8 0 1.8 Fall 09
Spring 10 7,173 21,530 3.002 44.0 27.7 17.6 5.9 4.9 3,614 11,657 3.226 53.9 27.7 10.5 2.7 5.1 2,117 7,778 3.674 75.4 19.2 3.9 0.3 1.2 Spring 10
Fall 10 8,269 24,811 3.000 45.4 27.1 16.7 5.2 5.6 3,845 12,285 3.195 53.6 26.6 11.7 3.1 5.1 2,677 9,871 3.687 78.8 16.0 3.0 0.3 1.9 Fall 10
Spring 11 7,303 21,817 2.987 45.7 26.6 16.1 5.7 5.9 3,945 12,655 3.208 53.6 26.9 11.7 2.9 4.8 2,855 10,588 3.708 79.0 16.4 3.3 0.2 1.1 Spring 11
Fall 11 8,155 24,313 2.981 44.3 28.3 16.0 5.9 5.5 3,696 11,940 3.231 56.4 25.3 9.9 2.3 6.1 2,664 9,650 3.622 74.1 19.4 4.1 0.4 2.0 Fall 11
Spring 12 7,138 21,021 2.945 43.1 28.3 16.7 5.7 6.3 3710 11862 3.197 56.4 24.5 9.5 2.9 6.7 2,804 10,307 3.676 78.4 16.1 3.5 0.2 1.9 Spring 12
GRADUATE
Grade Distribution Summary
TRADITIONAL UNDERGRADUATE GOAL/NON-TRAD UNDERGRADUATE
TRADITIONAL UNDERGRADUATE GOAL/NON-TRAD UNDERGRADUATE GRADUATE
TRADITIONAL UNDERGRADUATE GOAL/NON-TRAD UNDERGRADUATE GRADUATE

1 Hoover, W. MATH 1 Hoover, W. MATH 1 Hoover, W. MATH 1 Hoover, W. MATH 1
2 Brown, L. NSCI 2 Jones, T. NSCI 2 Yelton, D. SOSC 2 Steibel, S. RELI 2
3 Ellington, D. SOSC 3 Ellington, D. SOSC 3 Brown, L. NSCI 3 Brown, L. NSCI 3
4 Terrell, B. MATH 4 Burkett, B. NSCI 4 Binfield, K. ENGL 4 Burkett, B. NSCI 4
5 Yelton, D. SOSC 5 Brown, L. NSCI 5 Burkett, B. NSCI 5 Jones, T. NSCI 5
6 Burkett, B. NSCI 6 Yelton, D. SOSC 6 Bass, R. MATH 6 Prim, G. SOSC 6
7 Partain, J. RELI 7 Land, J. ENGL 7 Steibel, S. RELI 7 Bass, R. MATH 7
8 Blackburn, G. SOSC 8 Terrell, B. MATH 8 Terrell, B. MATH 8 Ellington, D. SOSC 8
9 Price, G. ENGL 9 Partain, J. RELI 9 Ellington, D. SOSC 9 Binfield, K. ENGL 9
10 Vaughan, T. COMM 10 Hart, L. MATH 10 Blackburn, G. SOSC 10 Partain, J. RELI 10
1 Hoover, W. MATH 1 Hoover, W. MATH 1 Canuup, P. MATH 1 Canuup, P. MATH 1
2 Burkett, B. NSCI 2 Partain, J. RELI 2 Yelton, D. SOSC 2 Ellington, D. SOSC 2
3 Brown, L. NSCI 3 Bass, R. MATH 3 Ellington, Donna S. SSCI 3 Jones, T. NSCI 3
4 Yelton, D. SOSC 4 Burkett, B. NSCI 4 Brown, L. NSCI 4 Brown, J. ENGL 4
5 Partain, J. RELI 5 Steibel, S. RELI 5 Bass, R. MATH 5 English, T. NSCI 5
6 Stathakis, P. SOSC 6 Brown, J. ENGL 6 Partain, J. RELI 6 Bunn, S. ENGL 6
7 Gregg, L. RELI 7 English, T. NSCI 7 Hart, L. MATH 7 Yelton, D. SOSC 7
8 Steibel, S. RELI 8 Ellington, Donna S. SSCI 8 Crawley, J. BROY 8 Partain, J. RELI 8
9 Barreto, R. FLAN 9 Yelton, D. SOSC 9 Burkett, B. NSCI 9 Brown, L. NSCI 9
10 Blackburn, G. SOSC 10 Stathakis, P. SOSC 10 Zehnder, T. NSCI 10 Zehnder, T. NSCI 10
1 Stathakis, P. SOSC 1 Brown, L. NSCI 1 Terrell, B. MATH 1 Terrell, B. MATH 1
2 Wright, M. NSCI 2 Steibel, S. RELI 2 Yelton, D. SOSC 2 Lopez. S. BROY 2
3 Brown, L. NSCI 3 Bass, R. MATH 3 Brown, L. NSCI 3 Johnson, J. MATH 3
4 Zehnder, T. NSCI 4 Ellington, Donna S. SSCI 4 Zehnder, T. NSCI 4 Burkett, B. NSCI 4
5 Ellington, D. SOSC 5 Honts, A. BROY 5 Burkett, B. NSCI 5 Steibel, S. RELI 5
6 Terrell, B. MATH 6 Zehnder, T. NSCI 6 Ellington, Donna S. SSCI 6 Zehnder, T. NSCI 6
7 Taylor, M. FLAN 7 Johnson, J. MATH 7 Johnson, J. MATH 7 Ellington, D. SOSC 7
8 Yelton, D. SOSC 8 Eastman, A. SOSC 8 Bass, R. MATH 8 Gravett, D. ENGL 8
9 Blevins, K. RELI 9 Stathakis, P. SOSC 9 Parrish, S. NSCI 9 Brown, L. NSCI 9
10 Canuup, P. MATH 10 Canuup, P. MATH 10 Stansbury, B. FLAN 10 Wright, M. NSCI 10
1 Terrell, B. MATH 1 Terrell, B. MATH 1 Terrell, B. MATH 1 Terrell, B. MATH 1
2 Burkett, B. NSCI 2 Johnson, James C. MATH 2 Brown, L. NSCI 2 Johnson, J. MATH 2
3 Ellington, D. SOSC 3 Hart, L. MATH 3 Yelton, David K. SSCI 3 Zehnder, T. NSCI 3
4 Brown, L. NSCI 4 Brown, L. NSCI 4 Eddins, S. NSCI 4 Plate, S. ARTS 4
5 Wright, M. NSCI 5 Ellington, Donna S. SSCI 5 Zehnder, T. NSCI 5 Yelton, D. SOSC 5
6 Johnson, J. MATH 6 Zehnder, T. NSCI 6 Johnson, James C. MATH 6 Vanderburg, T. SOSC 6
7 Zehnder, T. NSCI 7 Poliakova, O. MATH 7 Davaut, N. FLAN 7 Brown, L. NSCI 7
8 Blackburn, G. SOSC 8 Yelton, David K. SSCI 8 Richardson, W. MATH 8 Ellington, D. SOSC 8
9 Yelton, D. SOSC 9 English, T. NSCI 9 Hobbs, J. ENGL 9 Davaut, N. FLAN 9
10 Hoyle, T. MATH 10 Land, J. ENGL 10 Honts, A. BROY 10 Carscaddon, D. PSYC 10
1 Zehnder, T. NSCI 1 Johnson, James C. MATH 1 Terrell, B. MATH 1 Terrell, B. MATH 1
2 Brown, L. NSCI 2 Terrell, B. MATH 2 Yelton, David K. SSCI 2 Johnson, J. MATH 2
3 Johnson, J. MATH 3 Zehnder, T. NSCI 3 Johnson, James C. MATH 3 Brown, L. NSCI 3
4 Street, D. NURa 4 Brown, L. NSCI 4 Street, D. NURa 4 Ellington, D. SOSC 4
5 Yelton, D. SOSC 5 Poliakova, O. MATH 5 Gravett, D. ENGL 5 Yelton, D. SOSC 5
6 Raymond, C. SOSC 6 Bivens, M. NURa 6 Keeter, N. ENGL 6 Boyett, A. BROY 6
7 Terrell, B. MATH 7 Boyett, A. BROY 7 Zehnder, T. NSCI 7 Eastman, A. SOSC 7
8 Hobbs, J. ENGL 8 Ellington, Donna S. SSCI 8 Brown, L. NSCI 8 Bivens, M. NURa 8
9 Vanderburg, T. SOSC 9 Yelton, David K. SSCI 9 Ellington, Donna S. SSCI 9 Zehnder, T. NSCI 9
10 Ellington, D. SOSC 10 Morris, T. ENGL 10 Peterson, K. PEWS 10 Wittig, D. SOSC 10
1 Yelton, D. SSCI 1 Terrell, B. MATH 1 Brown, L. NSCI 1 Bass, R. MATH 1
2 Ellington, D. SSCI 2 Poliakova, O. MATH 2 Bass, R. MATH 2 Raymond, C. SSCI 2
3 Zehnder, T. NSCI 3 Johnson, James C. MATH 3 Zehnder, Timothy J. NSCI 3 Johnson, J. MATH 3
4 Terrell, B. MATH 4 Keeter, N. ENGL 4 Street, D. NURa 4 Brown, L. NSCI 4
5 Brown, L. NSCI 5 Zehnder, Timothy J. NSCI 5 Davaut, N. FLAN 5 Ellington, D. SSCI 5
6 Johnson, J. MATH 6 Ellington, Donna S. SSCI 6 Hines, T. NURa 6 Baity, E. NURa 6
7 VanderburgT SSCI 7 Colon, E. NURa 7 Yelton, David K. SSCI 7 Davaut, N. FLAN 7
Fall 96
Spring 03
Fall 00
10 Most Rigorous Graders By Semester, Full-Time Teaching Faculty
Fall 04 Spring 05
Spring 04Fall 03Fall 02
Fall 98 Spring 99
Fall 94 Spring 96Spring 95 Fall 95
Spring 01 Fall 01
Fall 97
Fall 99 Spring 00
Spring 98
Fall 05 Spring 06
Spring 97
Spring 02

8 Poliakova, O. MATH 8 Wittig, D. SSCI 8 Eastman, Anthony F. SSCI 8 Eastman, A. SSCI 8
9 Boyett, A. BROY 9 Bass, R. MATH 9 Ewald, Brian MATH 9 Keeter, N. ENGL 9
10 Davaut, N. FLAN 10 Eastman, Anthony F. SSCI 10 Ellington, D. SSCI 10 Walker, V. NURa 10
Yelton, D. SSCI
1 Ellington, D. SSCI 1 Johnson, James C. MATH 1 Ellington, D. SSCI 1 Johnson, J. MATH 1
2 Davaut, N. FLAN 2 Moore, T. MATH 2 Zehnder, Timothy J. NSCI 2 Willis, J. MATH 2
3 Zehnder, T. NSCI 3 Bass, R. MATH 3 Willis, Jason A. MATH 3 Tubbs, J. NSCI 3
4 Baity, E. NURa 4 Zehnder, Timothy J. NSCI 4 Walker, V. NURa 4 Moore, T. MATH 4
5 Yelton, D. SSCI 5 Baity, E. NURa 5 Yelton, David K. SSCI 5 Baity, E. NURa 5
6 Johnson, J. MATH 6 Davaut, N. FLAN 6 Buckner, J. ENGL 6 Walker, V. NURa 6
7 Moore, T. MATH 7 Ellington, Donna S. SSCI 7 Wines, L. NURa 7 Eastman, A. SSCI 7
8 Hines, T. NURa 8 Colon, E. NURa 8 Moore, T. MATH 8 Buckner, J. ENGL 8
9 Land, J. ENGL 9 Wittig-Wells, D. SSCI 9 Bass, R. MATH 9 High, M. FLAN 9
10 Hambright, B. SSCI 10 Carscaddon, D. PSYC 10 Hambright, B. SSCI 10 Street, D. NURa 10
1 Ciesielski, C. NSCI Johnson, James C. MATH Ellington, Donna S. SSCI Johnson, J. MATH 1
2 Mystkowski, M. MATH Willis, Jason A. MATH Willis, Jason A. MATH Willis, J. MATH 2
3 Ellington, D. SSCI Moore, T. MATH Yelton, David K. SSCI Wines, L. NURS 3
4 Bass, R. MATH Vanderburg, Timothy W. SSCI Mystkowski, M. MATH Jones, T. NSCI 4
5 Willis, J. MATH English, L. NSCI Eastman, Anthony F. SSCI Poliakova, O. MATH 5
6 Johnson, J. MATH Ellington, Donna S. SSCI Johnson, James C. MATH Eastman, A. SSCI 6
7 Zehnder, T. NSCI Ciesielski, C. NSCI Sparti, F. NURS Hambright, B. SSCI 7
8 Yelton, D. SSCI Yelton, David K. SSCI Kuchinsky, M. SSCI Yelton, D. SSCI 8
9 Eastman, A. SSCI Zehnder, Timothy J. NSCI Hambright, B. SSCI Moore, T. MATH 9
10 Buckner, J. ENGL Street, D. NURS Zehnder, Timothy J. NSCI Monroe, S. NURS 10
1 Yelton, D. SSCI Johnson, James C. MATH Zehnder, Timothy J. NSCI Blevins, Kent B. RELI 1
2 Zehnder, T. NSCI Yelton, David K. SSCI Yelton, David K. SSCI Johnson, James C. MATH 2
3 Eastman, A. SSCI Moore, Teralea L. MATH Moore, Teralea L. MATH Moore, Teralea L. MATH 3
4 Bass, R. MATH Baity, Elizabeth J. NURS Ellington, Donna S. SSCI Moore, Joseph S. SSCI 4
5 Mystkowski, M. MATH Zehnder, Timothy J. NSCI Willis, Jason A. MATH Vanderburg, Timothy W. SSCI 5
6 Vanderburg, T. SSCI Willis, Jason A. MATH Johnson, James C. MATH High, Mary J. FLAN 6
7 Johnson, J. MATH Vanderburg, Timothy W. SSCI Moore, Charles B. FLAN Ellington, Donna S. SSCI 7
8 Ellington, D. SSCI Eastman, Anthony F. SSCI Blevins, Kent B. RELI Yelton, David K. SSCI 8
9 Willis, J. MATH High, Mary J. FLAN Serafica, Reimund C. NURS Hildreth, Thomas P. RELI 9
10 Hoyle, T. MATH Hobbs, June M. ENGL Poliakova, Olga MATH Willis, Jason A. MATH 10
Spring 2012
Fall 08 Spring 09
Fall 2011Fall 10 Spring 2011
Fall 06 Spring 07
Spring 10Fall 09
Fall 07 Spring 08

Rnk Yrs
1 Pat Harrelson, Assistant Professor of Music (8:1972) 40 1
2 Sue Camp, Professor of Business Administration (7:1976) 36 2
2 Vicki Webb-Morrison, Administrative Ast, Student Development (7:1976) 36 1
4 Dee Hunt, Vice President and Dean of Student Development (8:1978) 34 2
5 Larry Thomas, Captain of Facility Services, University Police (11:1978) 34 3
6 Carolyn Billings, Professor of Music (8:1979) 33 3
7 Cheryl Potter, Director of the NOEL Program (7:1980) 32 4
8 Tom Jones, Professor of Biology (8:1980) 32 5
9 Pam Scruggs, Associate Director of Athletics (9:1980) 32 1
10 Glenda Crotts, Senior Assistant to the President (1:1981) 31.5 1
11 Jeff Tubbs, VP for Institutional Effectiveness and Distance Learning(1:1982) 30.5 1
12 Janie Carlton, Professor of Nursing (9:1982) 30 6
13 Frieda Brown, Professor of Psychology (2:1983) 29.5 7
14 Ira G. Bottoms, Professor of Economics and MIS (8:1983) 29 8
15 Z. David Jones, Physical Plant (4:1984) 29 1
16 Marcia Miller, Professor of Nursing (7:1977) 28 9
17 Kevin Jones, Director of Athletic Training (8:1984) 28 2
18 Lou Ann Scates, Registrar (7:1985) 27 10
19 Susan Bell, Associate Professor of Art (8:1986) 26 11
20 Sandra Earl, Secretary to the President's Senior Assistant (8:1984) 26 2
21 Frank Bonner, President (6:1987) 25 3
21 Stephen Sain, Technology Specialist and Degree Auditor (6:1987) 25 12
23 Jack Williams, Library Cataloging Assistant (8:1987) 25 13
24 Nancy Borders, Administrative Ast, Summer Camp Coordinator (1:1988) 24.5 2
25 Earl Godfrey, Associate Professor of Business Administration (4:1988) 24 14
26 Tony Setzer, Head Men's Soccer Coach (7:1988) 24 3
27 Donna Ellington, Professor of History (9:1988) 24 15
28 Rob Munoz, Professor of Sociology (8:1989) 23 16
28 Anthony Negbenebor, Dean of the Godbold School of Business (8:1989) 23 16
30 Ralph W. Dixon, Senior Vice Pres for Community Relations (1:1989) 22.5 1
31 Margaret Christopher, Library Media Assistant (4:1990) 22 17
31 James Johnson, Assistant Professor of Mathematics (4:1990) 22 17
31 Richard Wince, Director of Wrestling Operations (4:1990) 22 4
34 Audrey Sloan, Director of Admissions, GOAL (7:1990) 22 1
Stu
de
nt
De
ve
lop
me
nt
Ath
leti
cs
Ad
min
istr
ati
on
Ad
va
nce
me
nt
Longest Service(Current Employees as of the end of the Spring 2012 semester
with a minimum of 15 years of service)
Inst
Eff
ect
ive
ne
ss/D
ista
nce
Le
arn
ing
University Division Ranking
Pre
sid
en
t's
Off
ice
Pro
vo
st/A
cad
em
ics
En
roll
me
nt
Ma
na
ge
me
nt
Ch
rist
ian
Lif
e a
nd
Se
rvic
e
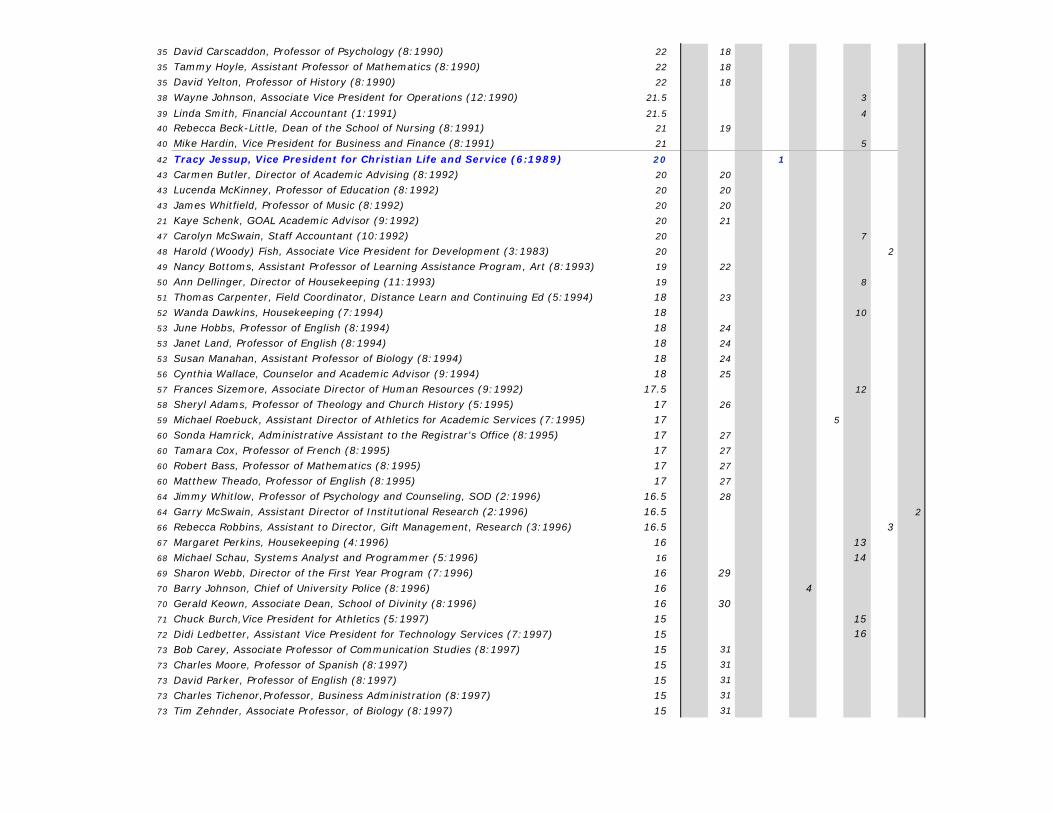
35 David Carscaddon, Professor of Psychology (8:1990) 22 18
35 Tammy Hoyle, Assistant Professor of Mathematics (8:1990) 22 18
35 David Yelton, Professor of History (8:1990) 22 18
38 Wayne Johnson, Associate Vice President for Operations (12:1990) 21.5 3
39 Linda Smith, Financial Accountant (1:1991) 21.5 4
40 Rebecca Beck-Little, Dean of the School of Nursing (8:1991) 21 19
40 Mike Hardin, Vice President for Business and Finance (8:1991) 21 5
42 Tracy Jessup, Vice President for Christian Life and Service (6:1989) 20 1
43 Carmen Butler, Director of Academic Advising (8:1992) 20 20
43 Lucenda McKinney, Professor of Education (8:1992) 20 20
43 James Whitfield, Professor of Music (8:1992) 20 20
21 Kaye Schenk, GOAL Academic Advisor (9:1992) 20 21
47 Carolyn McSwain, Staff Accountant (10:1992) 20 7
48 Harold (Woody) Fish, Associate Vice President for Development (3:1983) 20 2
49 Nancy Bottoms, Assistant Professor of Learning Assistance Program, Art (8:1993) 19 22
50 Ann Dellinger, Director of Housekeeping (11:1993) 19 8
51 Thomas Carpenter, Field Coordinator, Distance Learn and Continuing Ed (5:1994) 18 23
52 Wanda Dawkins, Housekeeping (7:1994) 18 10
53 June Hobbs, Professor of English (8:1994) 18 24
53 Janet Land, Professor of English (8:1994) 18 24
53 Susan Manahan, Assistant Professor of Biology (8:1994) 18 24
56 Cynthia Wallace, Counselor and Academic Advisor (9:1994) 18 25
57 Frances Sizemore, Associate Director of Human Resources (9:1992) 17.5 12
58 Sheryl Adams, Professor of Theology and Church History (5:1995) 17 26
59 Michael Roebuck, Assistant Director of Athletics for Academic Services (7:1995) 17 5
60 Sonda Hamrick, Administrative Assistant to the Registrar's Office (8:1995) 17 27
60 Tamara Cox, Professor of French (8:1995) 17 27
60 Robert Bass, Professor of Mathematics (8:1995) 17 27
60 Matthew Theado, Professor of English (8:1995) 17 27
64 Jimmy Whitlow, Professor of Psychology and Counseling, SOD (2:1996) 16.5 28
64 Garry McSwain, Assistant Director of Institutional Research (2:1996) 16.5 2
66 Rebecca Robbins, Assistant to Director, Gift Management, Research (3:1996) 16.5 367 Margaret Perkins, Housekeeping (4:1996) 16 1368 Michael Schau, Systems Analyst and Programmer (5:1996) 16 1469 Sharon Webb, Director of the First Year Program (7:1996) 16 2970 Barry Johnson, Chief of University Police (8:1996) 16 470 Gerald Keown, Associate Dean, School of Divinity (8:1996) 16 3071 Chuck Burch,Vice President for Athletics (5:1997) 15 1572 Didi Ledbetter, Assistant Vice President for Technology Services (7:1997) 15 16
73 Bob Carey, Associate Professor of Communication Studies (8:1997) 15 31
73 Charles Moore, Professor of Spanish (8:1997) 15 31
73 David Parker, Professor of English (8:1997) 15 31
73 Charles Tichenor,Professor, Business Administration (8:1997) 15 31
73 Tim Zehnder, Associate Professor, of Biology (8:1997) 15 31
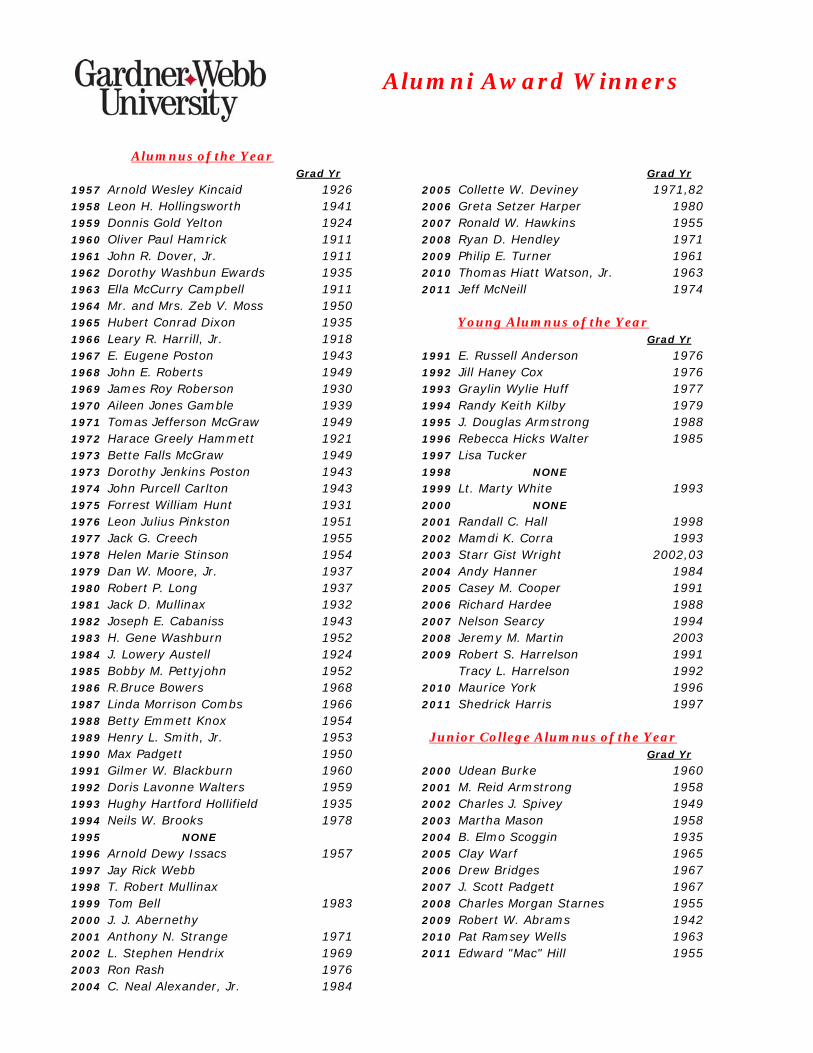
Grad Yr Grad Yr
1957 Arnold Wesley Kincaid 1926 2005 Collette W. Deviney 1971,821958 Leon H. Hollingsworth 1941 2006 Greta Setzer Harper 19801959 Donnis Gold Yelton 1924 2007 Ronald W. Hawkins 19551960 Oliver Paul Hamrick 1911 2008 Ryan D. Hendley 19711961 John R. Dover, Jr. 1911 2009 Philip E. Turner 19611962 Dorothy Washbun Ewards 1935 2010 Thomas Hiatt Watson, Jr. 19631963 Ella McCurry Campbell 1911 2011 Jeff McNeill 19741964 Mr. and Mrs. Zeb V. Moss 19501965 Hubert Conrad Dixon 19351966 Leary R. Harrill, Jr. 1918 Grad Yr
1967 E. Eugene Poston 1943 1991 E. Russell Anderson 19761968 John E. Roberts 1949 1992 Jill Haney Cox 19761969 James Roy Roberson 1930 1993 Graylin Wylie Huff 19771970 Aileen Jones Gamble 1939 1994 Randy Keith Kilby 19791971 Tomas Jefferson McGraw 1949 1995 J. Douglas Armstrong 19881972 Harace Greely Hammett 1921 1996 Rebecca Hicks Walter 19851973 Bette Falls McGraw 1949 1997 Lisa Tucker1973 Dorothy Jenkins Poston 1943 1998 NONE
1974 John Purcell Carlton 1943 1999 Lt. Marty White 19931975 Forrest William Hunt 1931 2000 NONE
1976 Leon Julius Pinkston 1951 2001 Randall C. Hall 19981977 Jack G. Creech 1955 2002 Mamdi K. Corra 19931978 Helen Marie Stinson 1954 2003 Starr Gist Wright 2002,031979 Dan W. Moore, Jr. 1937 2004 Andy Hanner 19841980 Robert P. Long 1937 2005 Casey M. Cooper 19911981 Jack D. Mullinax 1932 2006 Richard Hardee 19881982 Joseph E. Cabaniss 1943 2007 Nelson Searcy 19941983 H. Gene Washburn 1952 2008 Jeremy M. Martin 20031984 J. Lowery Austell 1924 2009 Robert S. Harrelson 19911985 Bobby M. Pettyjohn 1952 Tracy L. Harrelson 19921986 R.Bruce Bowers 1968 2010 Maurice York 19961987 Linda Morrison Combs 1966 2011 Shedrick Harris 19971988 Betty Emmett Knox 19541989 Henry L. Smith, Jr. 19531990 Max Padgett 1950 Grad Yr
1991 Gilmer W. Blackburn 1960 2000 Udean Burke 19601992 Doris Lavonne Walters 1959 2001 M. Reid Armstrong 19581993 Hughy Hartford Hollifield 1935 2002 Charles J. Spivey 19491994 Neils W. Brooks 1978 2003 Martha Mason 19581995 NONE 2004 B. Elmo Scoggin 19351996 Arnold Dewy Issacs 1957 2005 Clay Warf 19651997 Jay Rick Webb 2006 Drew Bridges 19671998 T. Robert Mullinax 2007 J. Scott Padgett 19671999 Tom Bell 1983 2008 Charles Morgan Starnes 19552000 J. J. Abernethy 2009 Robert W. Abrams 19422001 Anthony N. Strange 1971 2010 Pat Ramsey Wells 19632002 L. Stephen Hendrix 1969 2011 Edward "Mac" Hill 19552003 Ron Rash 19762004 C. Neal Alexander, Jr. 1984
Junior College Alumnus of the Year
Alumni Award Winners
Alumnus of the Year
Young Alumnus of the Year
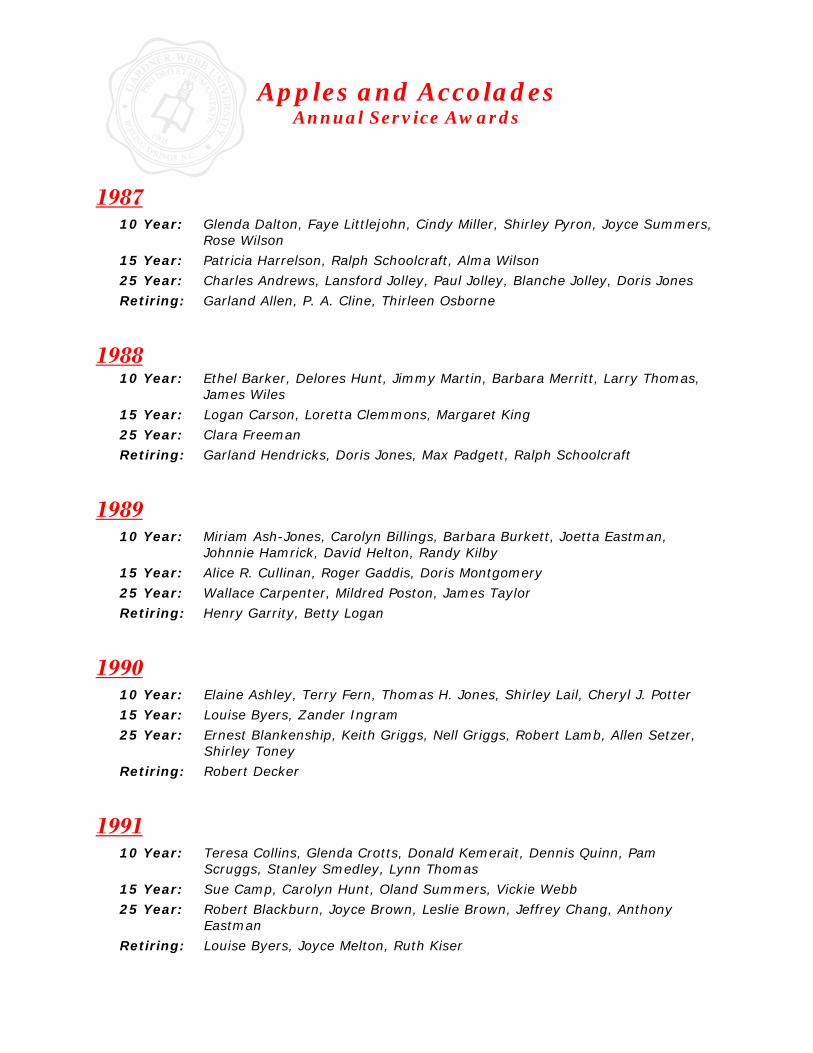
Apples and Accolades Annual Service Awards
1987 10 Year: Glenda Dalton, Faye Littlejohn, Cindy Miller, Shirley Pyron, Joyce Summers,
Rose Wilson
15 Year: Patricia Harrelson, Ralph Schoolcraft, Alma Wilson
25 Year: Charles Andrews, Lansford Jolley, Paul Jolley, Blanche Jolley, Doris Jones
Retiring: Garland Allen, P. A. Cline, Thirleen Osborne
1988
10 Year: Ethel Barker, Delores Hunt, Jimmy Martin, Barbara Merritt, Larry Thomas, James Wiles
15 Year: Logan Carson, Loretta Clemmons, Margaret King
25 Year: Clara Freeman
Retiring: Garland Hendricks, Doris Jones, Max Padgett, Ralph Schoolcraft
1989
10 Year: Miriam Ash-Jones, Carolyn Billings, Barbara Burkett, Joetta Eastman, Johnnie Hamrick, David Helton, Randy Kilby
15 Year: Alice R. Cullinan, Roger Gaddis, Doris Montgomery
25 Year: Wallace Carpenter, Mildred Poston, James Taylor
Retiring: Henry Garrity, Betty Logan
1990
10 Year: Elaine Ashley, Terry Fern, Thomas H. Jones, Shirley Lail, Cheryl J. Potter
15 Year: Louise Byers, Zander Ingram
25 Year: Ernest Blankenship, Keith Griggs, Nell Griggs, Robert Lamb, Allen Setzer, Shirley Toney
Retiring: Robert Decker
1991
10 Year: Teresa Collins, Glenda Crotts, Donald Kemerait, Dennis Quinn, Pam Scruggs, Stanley Smedley, Lynn Thomas
15 Year: Sue Camp, Carolyn Hunt, Oland Summers, Vickie Webb
25 Year: Robert Blackburn, Joyce Brown, Leslie Brown, Jeffrey Chang, Anthony Eastman
Retiring: Louise Byers, Joyce Melton, Ruth Kiser

1992 10 Year: Janie Carlton, Libby Carswell, Ozzie McFarland, Evan Thompson, Jeff Tubbs
15 Year:
25 Year: Robert Morgan, Vann Murrell
Retiring: Barbara Cribb, George Cribb, Lansford Jolley, Launita Proctor
1993
10 Year: Glenn Bottoms, Charles Bridges, Frieda Brown, Woody Fish, James Hartman, Carolyn McKinney, Jack Partain, Genevieve Street
15 Year: Ann Wesson
25 Year: Gil Blackburn
Retiring: Margaret King, Allen Setzer
1994
10 Year: Ben Davis, Sandra Earl, Kitty Eeds, Russell Hardin, David Jones, Kevin Jones, Valerie Parry
25 Year: Barry Hambright, Julius Hoyle, Melvin Lutz, Phil Perrin, Dan Proctor, William Stowe
Retiring: Paul Jolley
1995
10 Year: Thomas Rabon, Lou Ann Scates, Mary Ruth Dixon, Robert Parris, Saundra Rogers, Barbara Selph, Wanda Stutts
15 Year: Tom Jones
25 Year: Retiring: Paul Jolley, Vann Murrell, Dan Proctor, Marie Wellman
1996
10 Year: Susan Bell, John Brock, Donnie Clary, Ray Hardee, Steve Holland, Sharon Jennings, Chuck Ledford, Chris White
25 Year: Retiring: Robert Blackburn, Jean Cabaniss, Ben Davis, Roy Wyatt
1997
10 Year: Frank Bonner, Gary Chandler, Alma Cline, Allen Eaves, Stephen Sain, Harrison Williams
25 Year: Patricia Harrelson
Retiring: John Brock, James Taylor

1998 10 Year: Nancy Borders, Donna Ellington, Angela Farley, Earl Godfrey, Patricia Partin,
Tony Setzer, Horace Toney
25 Year: Loretta Clemmons
Retiring: Mildred Poston, Robert Morgan
1999
10 Year: Sherilyn Cannon, Catherine Chambers, Joyce Crumpton, Arvle Dunn, Tom English, Darlene Gravett, Clyde Miller, Robert Munoz, Anthony Negbenebor, Robert Parsons, Peggy Powell
25 Year: Alice Cullinan, Roger Gaddis, Doris Montgomery
Retiring: James Crawley, Robert Lamb, Melvin Lutz, Barbara Merritt, Jack Partain
2000
10 Year: David Carscadden, Margaret Christopher, Ralph Dixon, Tammy Hoyle, James Johnson, Wayne Johnson, Domencia Meilenger, Stephen Plate, Audrey Sloan, Brenda Terrell, Mae Walton, Richard Wince, David Yelton
25 Year: Zander Ingram
Retiring: Bobby Adams, Donald Cook, Doris Banner, Steve Dalton, Kitty Eeds, Carolyn Hunt
2001
10 Year: Rebecca Beck-Little, Ben Carson, Deborah Cody, Danny Davis, Mike Hardin, Linda Smith, Ted Vaughn
25 Year: Sue Camp, Oland Summers, Vickie Webb-Morrison
Retiring: Barbara Burkett, Ben Carson, Nell Griggs, Domencia Meilinger
2002
10 Year: Carmen Butler, Tracy Caldwell, Mary Hodge, Lucenda McKinney, Carolyn McSwain, Cindy Rochester, Kaye Schenk, Martha Tate, Matt Whitfield
25 Year: Shirley Pyron, Joyce Summers, Sarah Elam
Retiring: Sarah Elam, Joyce Summers, Marvin Taylor, Mae Walton
2003
10 Year: Ann Dellinger, Arlen Honts, Lowell Hamrick, Tracy Jessup, Cothenia Jolley, Bruce Rabon, Matt Webber
25 Year: Dee Hunt, Jimmy Martin, Larry Thomas, Ann Wesson
Retiring: Sherman Parrish, Phil Perrin
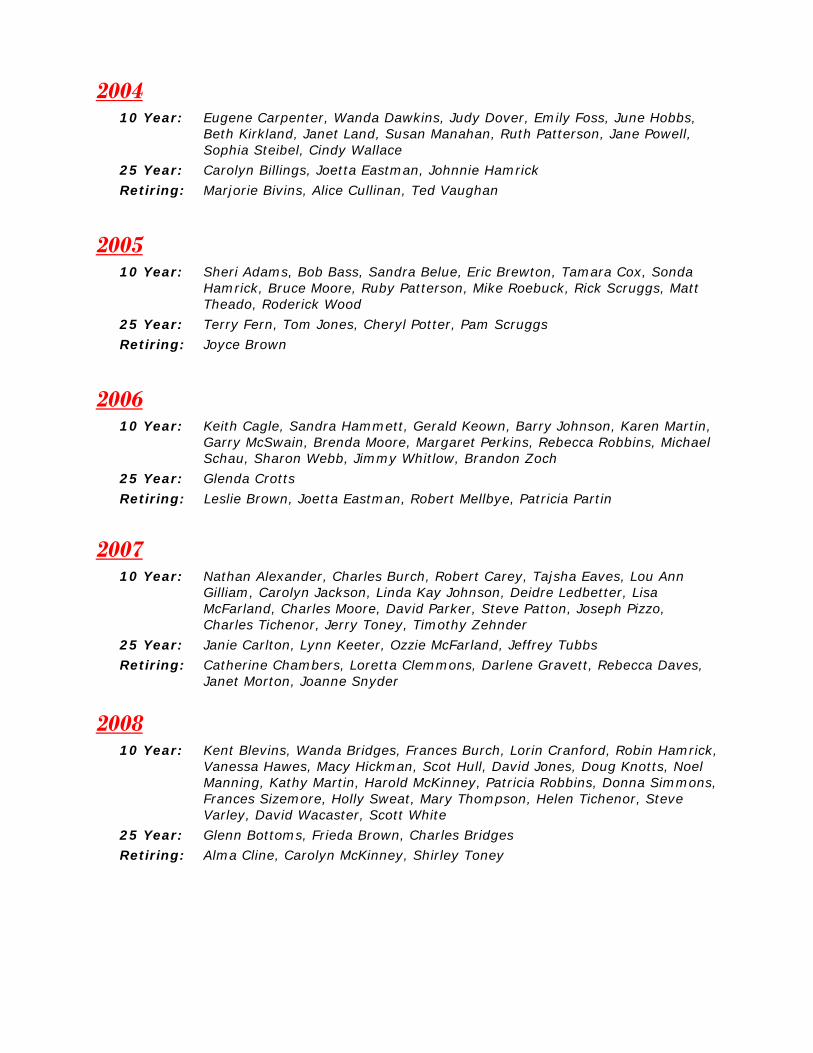
2004 10 Year: Eugene Carpenter, Wanda Dawkins, Judy Dover, Emily Foss, June Hobbs,
Beth Kirkland, Janet Land, Susan Manahan, Ruth Patterson, Jane Powell, Sophia Steibel, Cindy Wallace
25 Year: Carolyn Billings, Joetta Eastman, Johnnie Hamrick
Retiring: Marjorie Bivins, Alice Cullinan, Ted Vaughan
2005
10 Year: Sheri Adams, Bob Bass, Sandra Belue, Eric Brewton, Tamara Cox, Sonda Hamrick, Bruce Moore, Ruby Patterson, Mike Roebuck, Rick Scruggs, Matt Theado, Roderick Wood
25 Year: Terry Fern, Tom Jones, Cheryl Potter, Pam Scruggs
Retiring: Joyce Brown
2006
10 Year: Keith Cagle, Sandra Hammett, Gerald Keown, Barry Johnson, Karen Martin, Garry McSwain, Brenda Moore, Margaret Perkins, Rebecca Robbins, Michael Schau, Sharon Webb, Jimmy Whitlow, Brandon Zoch
25 Year: Glenda Crotts
Retiring: Leslie Brown, Joetta Eastman, Robert Mellbye, Patricia Partin
2007
10 Year: Nathan Alexander, Charles Burch, Robert Carey, Tajsha Eaves, Lou Ann Gilliam, Carolyn Jackson, Linda Kay Johnson, Deidre Ledbetter, Lisa McFarland, Charles Moore, David Parker, Steve Patton, Joseph Pizzo, Charles Tichenor, Jerry Toney, Timothy Zehnder
25 Year: Janie Carlton, Lynn Keeter, Ozzie McFarland, Jeffrey Tubbs
Retiring: Catherine Chambers, Loretta Clemmons, Darlene Gravett, Rebecca Daves, Janet Morton, Joanne Snyder
2008 10 Year: Kent Blevins, Wanda Bridges, Frances Burch, Lorin Cranford, Robin Hamrick,
Vanessa Hawes, Macy Hickman, Scot Hull, David Jones, Doug Knotts, Noel Manning, Kathy Martin, Harold McKinney, Patricia Robbins, Donna Simmons, Frances Sizemore, Holly Sweat, Mary Thompson, Helen Tichenor, Steve Varley, David Wacaster, Scott White
25 Year: Glenn Bottoms, Frieda Brown, Charles Bridges
Retiring: Alma Cline, Carolyn McKinney, Shirley Toney

2009 10 Year: Ken Baker, Don Berry, Kelly Brame, Randall Cooper, Sharon Edwards,
Denise McKee, Kevin Mounce, Paula Qualls, Laura Simmons, Mike Simpson, Ron Williams
25 Year: David Jones, Kevin Jones Retiring: Lorin Cranford, Valerie Parry, Donna Simmons
2010
10 Year: Thomas Burton, Robert Canoy, Thomas Cole, Rhonda Cromer, Douglas Dickens, Douglas Eury, Mary High, Daniel Jolley, Sylvia McCurry, Jon Mitchell, Ronald Nanney, Francis Newton, Marcus Rabb, Olga Poliakova, Stanley Powell, Kristen Setzer, Annette Simmons, Timothy Vanderburg, Karissa Weir, Lane Wesson, Jacqueline Williams, Rebekah Wright
25 Year: LouAnn Scates
30 Year: Terry Fern, Thomas Jones, Cheryl Potter, Pamela Scruggs
Retiring: Terry Fern, Carolyn Jackson, Ruby Patterson, Victoria Ratchford, Faith Weathington, Shirley Pyron
2011 10 Year: Brian D. Baker, W. James Corn, Christopher V. Davis, C. Elizabeth Davis,
Stefka G. Eddins, Paul J. Etter, Linda C. Greene, David N. Judge, H. James Lawrence, R. Wayne Merritt, Teresa R. Phillips, Mary D. Roby, Amanda K. Smith, J. Carroll Smith
25 Year: Susan Carlisle Bell, Marcia “Cindy” Miller, Stephen E. Sain
30 Year: Glenda S. Crotts
Retiring: Anthony F. Eastman, Roger G. Gaddis, Jimmy T. Martin, C. Oland Summers
2012
10 Year: Dawn M. Anthony, Sandra B. Bailes, Fannie E. Brooks, Selvia B. Brown, C. Douglas Bryan, Jeremy L. Fern, R. Van Graham, Michael G. Griffith, Christopher R. Keene, Alison A. Kernicky, Thomas J. Meaders, Corwin M. Metcalf, Miroslaw Mystkowski, G. Jeffrey Powell, Emily G. Robertson, Faye H. Rucker, David W. Shellman, James D. Smith, Patricia C. Sparti, Gail D. Stowe, Joshua N. Stroup, J. Russell Stroupe, Venita L. Totten, Danny M. West
25 Year: A. Frank Bonner, Sandra C. Earl, J. Harrison Williams
30 Year: Janie M. Carlton, Jeffrey L. Tubbs
Retiring: Patricia B. Harrelson, Sylvia A. McCurry, Jimmy D. Whitlow, Richard M. Wince, Roderick Wood, Patricia D. Brannon
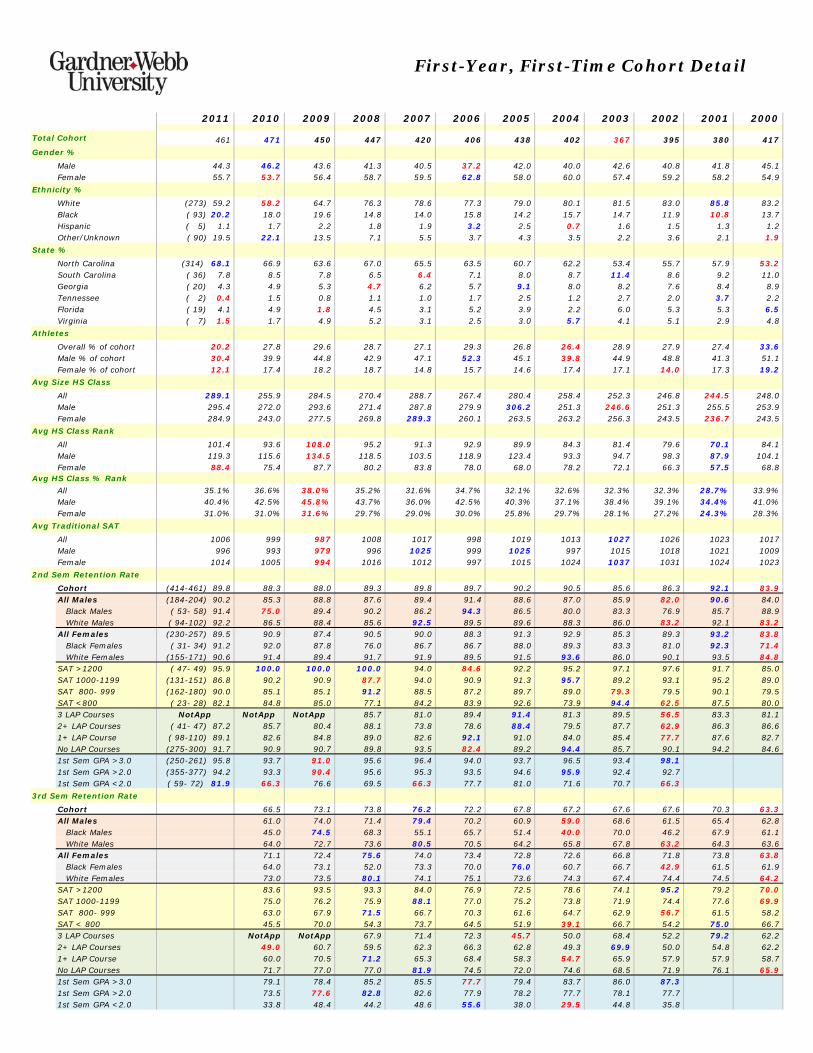
2011 2010 2009 2008 2007 2006 2005 2004 2003 2002 2001 2000
Total Cohort 461 471 450 447 420 406 438 402 367 395 380 417
First-Year, First-Time Cohort Detail
Gender %
Male 44.3 46.2 43.6 41.3 40.5 37.2 42.0 40.0 42.6 40.8 41.8 45.1Female 55.7 53.7 56.4 58.7 59.5 62.8 58.0 60.0 57.4 59.2 58.2 54.9
Ethnicity %
White (273) 59.2 58.2 64.7 76.3 78.6 77.3 79.0 80.1 81.5 83.0 85.8 83.2Black ( 93) 20.2 18.0 19.6 14.8 14.0 15.8 14.2 15.7 14.7 11.9 10.8 13.7Hispanic ( 5) 1.1 1.7 2.2 1.8 1.9 3.2 2.5 0.7 1.6 1.5 1.3 1.2Other/Unknown ( 90) 19.5 22.1 13.5 7.1 5.5 3.7 4.3 3.5 2.2 3.6 2.1 1.9
State %
North Carolina (314) 68.1 66.9 63.6 67.0 65.5 63.5 60.7 62.2 53.4 55.7 57.9 53.2South Carolina ( 36) 7.8 8.5 7.8 6.5 6.4 7.1 8.0 8.7 11.4 8.6 9.2 11.0Georgia ( 20) 4.3 4.9 5.3 4.7 6.2 5.7 9.1 8.0 8.2 7.6 8.4 8.9Tennessee ( 2) 0.4 1.5 0.8 1.1 1.0 1.7 2.5 1.2 2.7 2.0 3.7 2.2Florida ( 19) 4.1 4.9 1.8 4.5 3.1 5.2 3.9 2.2 6.0 5.3 5.3 6.5Virginia ( 7) 1.5 1.7 4.9 5.2 3.1 2.5 3.0 5.7 4.1 5.1 2.9 4.8
Athletes
Overall % of cohort 20.2 27.8 29.6 28.7 27.1 29.3 26.8 26.4 28.9 27.9 27.4 33.6Male % of cohort 30.4 39.9 44.8 42.9 47.1 52.3 45.1 39.8 44.9 48.8 41.3 51.1Female % of cohort 12.1 17.4 18.2 18.7 14.8 15.7 14.6 17.4 17.1 14.0 17.3 19.2
Avg Size HS Class
All 289 1 255 9 284 5 270 4 288 7 267 4 280 4 258 4 252 3 246 8 244 5 248 0All 289.1 255.9 284.5 270.4 288.7 267.4 280.4 258.4 252.3 246.8 244.5 248.0Male 295.4 272.0 293.6 271.4 287.8 279.9 306.2 251.3 246.6 251.3 255.5 253.9Female 284.9 243.0 277.5 269.8 289.3 260.1 263.5 263.2 256.3 243.5 236.7 243.5
Avg HS Class Rank
All 101.4 93.6 108.0 95.2 91.3 92.9 89.9 84.3 81.4 79.6 70.1 84.1Male 119.3 115.6 134.5 118.5 103.5 118.9 123.4 93.3 94.7 98.3 87.9 104.1Female 88.4 75.4 87.7 80.2 83.8 78.0 68.0 78.2 72.1 66.3 57.5 68.8
Avg HS Class % Rank
All 35.1% 36.6% 38.0% 35.2% 31.6% 34.7% 32.1% 32.6% 32.3% 32.3% 28.7% 33.9%Male 40.4% 42.5% 45.8% 43.7% 36.0% 42.5% 40.3% 37.1% 38.4% 39.1% 34.4% 41.0%Female 31.0% 31.0% 31.6% 29.7% 29.0% 30.0% 25.8% 29.7% 28.1% 27.2% 24.3% 28.3%Female 31.0% 31.0% 31.6% 29.7% 29.0% 30.0% 25.8% 29.7% 28.1% 27.2% 24.3% 28.3%
Avg Traditional SAT
All 1006 999 987 1008 1017 998 1019 1013 1027 1026 1023 1017Male 996 993 979 996 1025 999 1025 997 1015 1018 1021 1009Female 1014 1005 994 1016 1012 997 1015 1024 1037 1031 1024 1023
2nd Sem Retention Rate
Cohort (414-461) 89.8 88.3 88.0 89.3 89.8 89.7 90.2 90.5 85.6 86.3 92.1 83.9All Males (184-204) 90.2 85.3 88.8 87.6 89.4 91.4 88.6 87.0 85.9 82.0 90.6 84.0 Black Males ( 53- 58) 91.4 75.0 89.4 90.2 86.2 94.3 86.5 80.0 83.3 76.9 85.7 88.9 White Males ( 94-102) 92.2 86.5 88.4 85.6 92.5 89.5 89.6 88.3 86.0 83.2 92.1 83.2All Females (230-257) 89.5 90.9 87.4 90.5 90.0 88.3 91.3 92.9 85.3 89.3 93.2 83.8 Black Females ( 31- 34) 91.2 92.0 87.8 76.0 86.7 86.7 88.0 89.3 83.3 81.0 92.3 71.4 White Females (155-171) 90.6 91.4 89.4 91.7 91.9 89.5 91.5 93.6 86.0 90.1 93.5 84.8SAT >1200 ( 47- 49) 95.9 100.0 100.0 100.0 94.0 84.6 92.2 95.2 97.1 97.6 91.7 85.0SAT 1000-1199 (131-151) 86.8 90.2 90.9 87.7 94.0 90.9 91.3 95.7 89.2 93.1 95.2 89.0SAT 800- 999 (162-180) 90.0 85.1 85.1 91.2 88.5 87.2 89.7 89.0 79.3 79.5 90.1 79.5SAT <800 ( 23- 28) 82.1 84.8 85.0 77.1 84.2 83.9 92.6 73.9 94.4 62.5 87.5 80.03 LAP Courses NotApp NotApp NotApp 85.7 81.0 89.4 91.4 81.3 89.5 56.5 83.3 81.12+ LAP Courses ( 41- 47) 87.2 85.7 80.4 88.1 73.8 78.6 88.4 79.5 87.7 62.9 86.3 86.61+ LAP Course ( 98-110) 89.1 82.6 84.8 89.0 82.6 92.1 91.0 84.0 85.4 77.7 87.6 82.7No LAP Courses (275-300) 91.7 90.9 90.7 89.8 93.5 82.4 89.2 94.4 85.7 90.1 94.2 84.61st Sem GPA >3 0 (250-261) 95 8 93 7 91.0 95 6 96 4 94 0 93 7 96 5 93 4 98.11st Sem GPA >3.0 (250 261) 95.8 93.7 91.0 95.6 96.4 94.0 93.7 96.5 93.4 98.11st Sem GPA >2.0 (355-377) 94.2 93.3 90.4 95.6 95.3 93.5 94.6 95.9 92.4 92.71st Sem GPA <2.0 ( 59- 72) 81.9 66.3 76.6 69.5 66.3 77.7 81.0 71.6 70.7 66.3
3rd Sem Retention Rate
Cohort 66.5 73.1 73.8 76.2 72.2 67.8 67.2 67.6 67.6 70.3 63.3All Males 61.0 74.0 71.4 79.4 70.2 60.9 59.0 68.6 61.5 65.4 62.8 Black Males 45.0 74.5 68.3 55.1 65.7 51.4 40.0 70.0 46.2 67.9 61.1 White Males 64.0 72.7 73.6 80.5 70.5 64.2 65.8 67.8 63.2 64.3 63.6All Females 71.1 72.4 75.6 74.0 73.4 72.8 72.6 66.8 71.8 73.8 63.8 Black Females 64.0 73.1 52.0 73.3 70.0 76.0 60.7 66.7 42.9 61.5 61.9 White Females 73.0 73.5 80.1 74.1 75.1 73.6 74.3 67.4 74.4 74.5 64.2SAT >1200 83.6 93.5 93.3 84.0 76.9 72.5 78.6 74.1 95.2 79.2 70.0SAT 1000-1199 75.0 76.2 75.9 88.1 77.0 75.2 73.8 71.9 74.4 77.6 69.9SAT 800- 999 63.0 67.9 71.5 66.7 70.3 61.6 64.7 62.9 56.7 61.5 58.2SAT < 800 45.5 70.0 54.3 73.7 64.5 51.9 39.1 66.7 54.2 75.0 66.73 LAP Courses NotApp NotApp 67.9 71.4 72.3 45.7 50.0 68.4 52.2 79.2 62.22+ LAP Courses 49.0 60.7 59.5 62.3 66.3 62.8 49.3 69.9 50.0 54.8 62.21+ LAP Course 60.0 70.5 71.2 65.3 68.4 58.3 54.7 65.9 57.9 57.9 58.7No LAP Courses 71.7 77.0 77.0 81.9 74.5 72.0 74.6 68.5 71.9 76.1 65.91st Sem GPA >3.0 79.1 78.4 85.2 85.5 77.7 79.4 83.7 86.0 87.31st Sem GPA >2.0 73.5 77.6 82.8 82.6 77.9 78.2 77.7 78.1 77.71st Sem GPA <2.0 33.8 48.4 44.2 48.6 55.6 38.0 29.5 44.8 35.8

2011 2010 2009 2008 2007 2006 2005 2004 2003 2002 2001 2000 1999 1998 1997 1996 1995
Total Cohort 461 471 450 446 420 406 441 402 367 398 380 417 407 399 367 320 369
% Cohort Submitting SAT Scores 88.5% 85.1% 88.2% 85.0% 89.5% 83.3% 84.4% 85.1% 89.1% 88.7% 87.6% 87.3% 88.2% 87.5% 86.1% 85.3% 84.3%
SAT Verbal Mean 512 509 502 510 513 504 511 508 511 509 513 508 501 506 508 498 421
580 570 560 570 580 570 570 570 570 560 570 560 550 570 560 550 480
450 440 440 450 440 440 450 450 450 450 450 450 450 440 450 450 360
SAT Math Mean 495 490 485 498 504 493 508 505 516 517 510 509 497 502 497 488 460
540 550 550 550 560 550 570 560 570 580 570 570 550 550 560 530 520
430 430 420 440 450 430 440 450 450 460 460 450 440 440 440 430 390
SAT Overall Mean 1006 999 987 1008 1017 998 1019 1013 1027 1026 1023 1017 997 1008 1005 985 881
1123 1120 1100 1110 1110 1120 1140 1120 1140 1130 1120 1120 1090 1110 1100 1090 990
880 870 850 890 890 870 910 900 890 920 920 900 880 890 900 890 770
Percent of Cohort Scoring:
0.5% 0.7% 0.8% 1.3% 1.1% 1.5% 1.1% 0.3% 0.1% 0.8% 0.3% 0.3% 0.6% 0.6% 0.3% 0.4% 0.0%
3.4% 4.7% 2.8% 5.0% 6.4% 3.6% 4.3% 3.8% 4.9% 4.0% 3.0% 2.8% 2.8% 3.1% 3.2% 2.2% 0.8%
12.0% 13.7% 11.6% 11.9% 13.3% 10.7% 13.7% 12.3% 16.5% 11.9% 14.4% 11.0% 9.2% 11.9% 11.1% 8.8% 3.0%
28.9% 28.7% 25.7% 27.8% 45.2% 29.6% 33.1% 32.2% 32.7% 34.6% 30.6% 30.0% 24.5% 26.5% 26.9% 23.1% 8.7%
49.0% 46.6% 47.6% 54.8% 53.5% 46.7% 53.8% 53.5% 59.0% 57.2% 58.6% 55.8% 46.8% 52.4% 50.3% 44.0% 19.8%
51.0% 53.4% 52.4% 45.2% 46.5% 53.3% 46.2% 46.5% 41.0% 42.8% 41.4% 44.2% 53.2% 47.6% 49.7% 56.0% 80.2%
27.9% 30.4% 33.5% 25.4% 25.2% 33.4% 23.7% 24.3% 25.1% 17.8% 21.3% 22.8% 27.6% 25.5% 23.7% 26.7% 47.7%
6.8% 8.2% 10.1% 9.3% 5.0% 9.5% 7.3% 6.7% 5.5% 6.8% 4.8% 4.1% 4.2% 6.6% 4.4% 8.4% 27.6%
0.0% 0.7% 0.3% 0.8% 0.2% 0.9% 1.1% 0.6% 0.9% 0.6% 0.6% 1.1% 0.8% 1.2% 0.6% 1.8% 8.7%
Individual High Score 1450 1460 1430 1460 1440 1470 1480 1450 1440 1470 1410 1440 1430 1430 1400 1420 1310
Individual Low Score 710 560 640 660 590 680 630 690 580 670 650 660 670 640 680 500 520
SAT Overall Mean Scores
All Males 996 993 979 996 1025 999 1025 997 1015 1018 1021 1009 983 986 986 969 892
White Males 1051 1053 1015 1035 1053 1041 1053 1024 1047 1036 1047 1028 1014 1014 1006 973 907
Black Males 904 887 872 894 897 870 895 886 886 919 898 931 875 832 878 913 749
All Females 1014 1005 994 1017 1012 997 1015 1024 1037 1031 1024 1023 1010 1027 1021 996 873
White Females 1065 1040 1029 1036 1033 1016 1032 1044 1059 1042 1034 1036 1020 1045 1030 1002 881
Black Females 901 851 869 863 862 865 882 903 878 914 887 897 921 875 903 860 732
All Athletes 1053 1022 997 1005 1011 970 1016 1008 995 993 997 1002 965 966 978 959 855
All Male Athletes 1048 1028 987 982 1005 961 1012 986 978 980 1000 995 956 954 969 948 825
White Male Athletes 1086 1062 1007 995 1031 1005 1041 1000 998 992 1027 1016 983 991 1006 943 846
Black Male Athletes 978 929 883 943 884 856 897 917 911 912 928 932 847 839 860 1025 724
All Female Athletes 1064 1007 1017 1047 1022 991 1027 1041 1032 1028 992 1019 984 1019 997 1001 930
White Female Athletes 1117 1030 1018 1069 1038 1016 1051 1044 1075 1044 994 1026 983 1036 996 1018 957
Black Female Athletes 887 870 910 872 926 870 880 992 884 915 983 987 1000 930 935 840 793
All Non-Athletes 995 992 983 1009 1020 1008 1020 1015 1040 1038 1032 1024 1014 1024 1020 993 890
All Male Non-Athletes 974 970 973 1006 1044 1036 1035 1003 1045 1053 1035 1024 1011 1017 1006 988 934
White Male Non-Athletes 1025 1045 1018 1062 1075 1071 1062 1037 1084 1065 1058 1038 1037 1033 1006 1005 941
Black Male Non-Athletes 872 866 866 843 913 893 894 866 864 890 863 927 926 804 963 890 785
All Female Non-Athletes 1007 1004 990 1011 1009 998 1013 1021 1038 1032 1031 1024 1016 1028 1026 995 865
White Female Non-Athletes 1058 1043 1031 1030 1032 1019 1029 1044 1056 1044 1041 1038 1030 1046 1035 1000 873
Black Female Non-Athletes 903 847 858 859 843 865 882 871 875 914 839 834 910 871 896 863 711
All In-State Residents 1003 990 981 1007 1021 1010 1022 1005 1021 1030 1021 1005 994 1021 1004 992 872
All Male In-State Residents 992 981 976 1009 1037 1016 1030 998 1022 1022 1031 987 969 992 994 976 877
White Male In-State Residents 1047 1030 1015 1053 1075 1065 1069 1030 1049 1030 1046 1005 1009 1019 1003 982 893
Black Male In-State Residents 893 899 868 882 892 841 877 858 870 928 880 929 852 843 913 856 706
All Female In-State Residents 1009 996 985 1005 1012 1006 1017 1008 1020 1035 1015 1017 1013 1043 1011 1000 868
White Female In-State Residents 1063 1035 1023 1022 1037 1031 1038 1029 1035 1043 1021 1023 1024 1057 1023 1001 872
Black Female In-State Residents 906 859 864 862 834 865 889 862 871 933 845 951 909 865 866 965 693
All Out-of-State Residents 1016 1024 1001 1012 1008 970 1013 1030 1036 1020 1027 1032 1003 985 1007 973 894
All Male Out-of-State Residents 1006 1013 984 962 1003 970 1016 995 1008 1009 1009 1031 1000 977 975 958 916
White Male Out-of-State Residents 1051 1082 1015 974 1017 997 1025 1013 1044 1041 1049 1050 1020 1007 1010 959 929
Black Male Out-of-State Residents 918 869 878 911 910 911 924 915 897 899 907 932 917 817 851 953 797
All Female Out-of-State Residents 1032 1041 1020 1048 1012 971 1011 1057 1064 1028 1044 1034 1005 994 1031 986 878
White Female Out-of-State Residents 1073 1058 1048 1075 1024 981 1020 1077 1099 1044 1066 1058 1013 1018 1040 1004 894
Black Female Out-of-State Residents 890 775 861 865 940 864 840 966 886 886 908 836 942 883 933 720 744
SAT Breakdown by FirstTime Cohort
Above 1300
Below 900
Below 800
Below 700
Above 1200
Above 1100
Above 1000
Below 1000
25th %tile
75th %tile
25th %tile
Above 1400
75th %tile
25th %tile
75th %tile

Males Females Males Females1937 Dan Wesley Moore, Jr. 1979 David Warren Cribb Bettye Diggs1938 Franklin D. Smith 1980 Mark Masters Greta Setzer1939 Glenn Robert Bridges 1981 Bradley Scott Riddle Rachel (Elizabeth) Schlafer Parton1940 James S. Rotan 1982 William Wilson Rash Nola Renee Boughmann1941 Cecil Propst 1983 Franklin Craig Meadows Mary (Joan) Proctor Hendrix1942 R.W. Adams 1984 Jerome Frederick Creach Jami (Lynne) McNeely Crisman1943 E. Eugene Poston Eunice Hoyle Pratt 1985 Sidney Wilkey Carol Whitmire Harwell1944 Clyde E. McAlister 1986 Christopher Sherman Roberts Mary (Elizabeth) Willoughby Hartman1945 Sam M. Green, Jr. 1987 Michael Rousseaux Teresa (Lynn) Cannon Jessup1946 Carl Edgar Jolley 1988 James Douglas Armstrong Cara (Lynn) Barker Winslow1947 William Brian Beam Dorothy Spangler 1989 Tracy Craig Jessup Carol King Dawson1948 John Worth Long Margaret McKinney 1990 Philip David Archer Anna Christine Vaughn1949 John E. Roberts 1991 Robert Stephen Harrelson Michele (Sheree) Philemon Norman1950 James Edward Cooke 1992 Brian Patrick Miller Dawn Elaine Camp1951 Alred Smith Homesley 1993 Martin Lynn White Andrea Starr Sells1952 Joseph McWayne Cole 1994 Anthony Todd Estes Frances Elizabeth Mabry1953 Amos Glen Henson 1995 Clayton Ryan King Sabrina Michelle Barnes
Paul Henry Thomas 1996 Edwin E. Odugba Heather (Nicole) Robertson White1954 Frank Mason Hudspeth Virginia Huggins 1997 Michael James Mustian Susan Joy McKibben1955 Truman Garland Philips Cynthia Covington 1998 Robert Daniel Emily Harrelson1956 Harold Lloyd Long Mildred Peterson 1999 Joshua Kime Lawson Amanda Marie Keene1957 Douglas David Hamrick Faye Branch 2000 Wesley William Barkley Linda Jean Sain1958 Douglas Woodrow Wilson Grace Ollis 2001 Kenneth Martin Wince Hanh My Tran1959 Marvin Ray Walters, Jr. Sonja Hedrick 2002 Charles Andrew Polk Rebecca Kay Boring1960 W. Worth Bridges, Jr. Mary Josephine Roper 2003 Patrick O'Neil Woody Larissa Marie Bixler1961 Jerry Richard Walker Joyce (Carolyn) Gantt Beam Erin Leigh Boyd1962 James Edwin McSwain Judith (Amelia) Mintz Fernald 2004 Todd William Ulrich Laurie Ann Pinkert1963 Richard Verlon Ledford Sarah Amanda Warlick 2005 Timothy J. Gribble Nisreen Karim Abu Ata1964 David Bruce Washburn Peggy Janet Cooper 2006 Lance R. Lucas Summer N. Hess1965 Charles Ray Yarborough, Jr. Dianne Washburn 2007 Austin Lee Campbell Allison Louise Blackwell1966 Robert Stephen Poston Patricia Ann Jarman 2008 Matthew Brett Walters Natalie Ann Pippen1967 Philip B. Storm 2009 Jordan Thomas Tubbs Sarah Elizabeth Seagroves1968 Richard P. Smith, Jr. 2010 M Tyler McCall Randi Gill‐Sadler1969 David Vernon Webb Gloria (Jean) Poston Helton 2010 D Oluwadamilola Teniola Xan N. Moss1970 William Burdette Harrill, III Janet (Faye) Costner Elliott 2011 M Jesse Elijah Roberts Brittany Nichole Bounds1971 Jerry C. Ruppe Janet (Mae) Whisnant Harllee 2011 D Jack Zimmerman Haleigh Petersen1972 William Jefferson Cranford Sue Holder Rash 2012 M Matthew Lineberger Chelsea Usher1973 Steven Glenn Riddle Deborah Leigh Caskill1974 Jerry Calvin Burleson Donna Kay Abrams1975 William Shellem Barkley, Jr. Mary Jo Boyd1976 Stephen McFadden Lewis Sarah Louise Ormand1977 Robert Conrad Pettyjohn Sophia (Regina) Gomes Steibel1978 Kenneth Lamar Lewis Kimberly (Patrice) Sain Harris
Mildred Laney

Student Count by Academic Major
Spring 2012
Undergraduate 2,539Males FemalesTotal
Business 589 240 348
005 Accounting BS (GOAL) 37 101 139
005 Accounting BS (DAY) 16 12 28
015 Business Administration BS (GOAL) 78 145 223
015 Business Administration BS (DAY) 33 13 46
026 Economics/Finance BS 12 0 12
030 Health Management BS 3 30 33
031 Healthcare Management BS GL 5 19 24
031 Healthcare Management BS SB 2 4 6
046 Computer Information Systems BS (GOAL) 27 7 34
046 Computer Information Systems BS (DAY) 7 3 10
050 Marketing BS 11 7 18
070 International Business BS 9 7 16
Communication Studies 85 32 53
055 Communication Studies BA 24 42 66
057 Journalism BA 8 11 19
Education 101 4 97
165 Elementary Education BS 4 91 95
182 Middle Grades Education BS 0 6 6
English 37 12 25
205 English BA 12 25 37
Mathematics 37 30 7
405 Computer Science BS 18 1 19
415 Mathematics BS 12 6 18
Natural Sciences 105 35 70
452 Environmental Science BS 0 2 2
455 Biology BS 25 52 77
460 Chemistry BS 10 16 26
Nursing 402 29 372
504 Nursing BSN 3 52 55
505 Nursing AS 8 110 118
505 Nursing BSN 11 174 186
999 Nursing Intended AA 7 36 43
PEWSS 126 78 48
340 Health/Wellness BS 19 23 42

342 Exercise Science BS 5 4 9
350 Sport Management BS 45 8 53
361 Physical Education & Health Ed BS 6 6 12
365 Athletic Training BS 3 7 10
Psychology 394 68 325
560 Psychology BS 29 95 124
665 Human Services BS 39 229 269
675 Human Services BS 0 1 1
Religious Studies 80 56 24
607 Missiology BA 5 6 11
610 Biblical Studies BA 7 4 11
612 Discipleship Studies BA 10 4 14
614 Youth Discipleship Studies BA 4 2 6
625 Religious Studies BA 4 2 6
625 Religious Studies BS 20 5 25
627 Philosophy and Theology BA 6 1 7
Social Sciences 180 103 77
655 Criminal Justice BS 40 49 89
660 History BA 10 2 12
670 Political Science BA 11 9 20
675 Social Sciences BA 3 1 4
680 Global Studies BA 2 2 4
690 Sociology BA 37 14 51
Visual/Performing Arts 96 44 52
060 Theatre Arts BA 4 4 8
255 Art BA 0 9 9
255 Art BFA 2 1 3
256 Art Education BA 0 3 3
260 Music BA 3 0 3
265 Music Education BM 20 23 43
270 Sacred Music BM 1 0 1
275 Music Performance BM 4 6 10
280 Music Composition BM 3 1 4
290 Music with Elec Music Business BM 7 5 12
World Languages 43 8 35
065 American Sign Language BA 2 26 28
300 English as a Second Language BA 0 5 5
315 French BA 2 1 3
320 Spanish BA 4 3 7
x-To Be Determined 264 154 109
1 1 2
0000 Undeclared BS 4 0 5
001 Undecided BS 149 105 254
804 Multidisciplinary Studies BS 0 3 3

Graduate 1,880Males FemalesTotal
Business 367 155 212
005 Accounting CERT 2 5 7
005 Accounting MAC 38 70 108
015 Business Administration MBA 103 118 221
021 Finance CERT 0 1 1
030 Health Management CERT 0 3 3
044 Human Resource Management CERT 1 1 2
045 Management Information Systems CERT 2 2 4
050 Marketing CERT 0 2 2
070 International Business CERT 0 2 2
070 International Business IMB 9 8 17
Education 1,241 266 975
165 Elementary Education MA 10 314 324
182 Middle Grades Education MA 12 87 99
185 School Administration CERT 19 74 93
185 School Administration MA 15 33 48
186 Executive Leadership Studies MA 148 343 491
188 Educational Leadership EDD 46 49 95
189 Curriculum & Instruction EDD 16 75 91
English 7 1 6
200 English Education MA 1 3 4
205 English MA 0 3 3
Nursing 168 19 149
505 Nursing CERT 0 1 1
505 Nursing DNP 7 17 24
505 Nursing MSN 12 130 142
507 Post MSN-Nurs Admin Certificat CERT 0 1 1
PEWSS 13 8 5
375 Sport Science and Pedagogy MA 8 5 13
Psychology 84 12 72
550 Mental Health Counseling MA/EDS 9 48 57
565 School Counseling MA 3 24 27
Professional 207Males FemalesTotal
Divinity 206 112 94
570 Christian Education MDV 14 26 40
580 Pastoral Care and Counseling MDV 28 28 56
581 Past Care&Counslng/Member Care DMN 3 0 3

582 Missiology MDV 2 6 8
585 Pastoral Ministries DMN 15 1 16
585 Pastoral Ministries MDV 36 23 59
585 Pastoral Ministries MDV/MA 3 1 4
608 Intercultural Studies MDV 1 1 2
610 Biblical Studies MDV 10 8 18
Psychology 1 0 1
550 Mental Health Counseling MDV 0 1 1

Academic Awards Day 2012Recipient List
2012 Big South George A. Christenberry Joshua Padgett 2012 Big South George A. Christenberry Jane Elizabeth Savage 2012 Big South Volleyball Evan Moffitt
2012 Big South Women's Basketball Co-Scholar Brianna Dillard LEADERS Award of Professional Excellence Breanna Lynn Davenport LEADERS Award of Professional Excellence Ashley Hannah Davis
Global Studies Jimmy Johnson Healthcare Mgmt Dena B. Webb
Religious Studies Service Award Chelsea Elizabeth Hearne Technical Theatre Richard Leigh Horsley
Jennifer Law
Christopher Martin
Laura Wilcox
Les Brown Environmental Science None
Stefka Eddins Undergraduate Research Jeremy Dale Griffin
Kristin Allison
Daniel Kernicky and Joshua Padget
Mathematics Education Courtney Anne Kerly
Courtney Marie Finocchiaro
Philosophy Matthew Lineberger
Rebecca Setzer
Greek Cedric Starr
None
Chelsea Renee Usher
Jane Elizabeth Savage
Anna Marion Howell
Jane Elizabeth Savage
Amy Rebecca Snyder
None
Broad River Review Editors' Prize in Prose Chelsea Renee Usher
Courtney Marie Finocchiaro and AnnaLisa Musarra
Lindsey Rae Hamby, Jessica Marie Hibbard and Heather Yvonne Pendergraft
Rebekah Joy Rausch
Eleanor McKenzie Conner
Breanna Lynn Davenport
Ashley Hannah Davis
Tabitha Lynn Hamilton
Danielle Nicole Marshall
Anna Marie Howell, John Benton Johnson and Brandon James
Brianna Dillard, Kyle Bennett Wilkinson and Savanna Richelle Yount
Brianna Dillard and Joshua Floyd Dula
Brandon Max Smith
Kristin Nicole Allison and Carrie Arant
J.O. Terrell History Samuel Clayton Woods
Amanda Marie Finocchiaro
Kelly Montgomery
Chassidy Rowe
Courtney Meyer
Kasey Jo Eskridge
Matthew Lineberger
Bonnie Scruggs
Elizabeth Anne Kington
Sara Grace Baylor and Natasha Leann Puplichhuisen
Matthew Edward Cummings
Kara Lynn Buchanan and Miriam Elaina Downing
English as a Second Language Elizabeth Margaret Glunk and Olivia Leigh Teague
Mark Ethan Drum
Brittany Lauren Blackwelder and Kristopher Gray
Jennifer M. Hindman
Jennifer M. Hindman
Daniel KernickyMegan D. Tremblay
Finance Jackson F. Liner
Wallace Carpenter Management Info Sys Christopher T. Putnam
Bradly David Collins
None
Teresa Jamene Spears
None
Delta Mu Delta None
Kerr "Buddy" Watson Business Administration Corey John Devine
John and Linda Godbold Jessica Marie Greer
Alfred and Shirley Wampler Marketing None
John Godbold Student Service Learning None
Matthew Lineberger
Justin Lindley
Hannah Lee Blalock
Orchestra Kenneth Wayne Collins and Bonnie Scruggs
Roger Lowe
Davone Omar Wingo
Jack H. Zimmerman
Kathryn Grace Kibler
Elisa Beth Beekman
None
Grace C. Lee Ashley Dawn McCurry
NCLEX Scholarship Sarah Beth Anthony
M. Vann Murrell Bible
Paul J. Stacy Biology
Parrish First Year Chemistry
M.A. Moseley, Jr., Senior Chemistry
First Year Mathematics Achievement
Mathematics Major
Alpha Psi Theater
Religious Education
Hebrew
Senior English Major
Professional Writing
First Year English Composition
J. Calvin Koonts Poetry
Broad River Review Editors' Prize in Poetry
Broad River Review Editors' Prize in Fiction
Communication Studies
Communication Studies Photography
Journalism
Sport Management Major
Athletic Training Major
Physical Education Major
Health / Wellness Major
Justin Scot Alston Memorial
Psychology
French
Sociology
Political Science
First Year History
Teacher Education Scholarship
Elementary Education Student Teaching (Boiling Spgs)
Elementary Education Student Teaching (Statesville)
Middle Grades Student Teaching
Secondary Student Teaching
Speciality Area Student Teaching
Delta Kappa Gamma Society International
Broyhill Achievement
German
Spanish
American Sign Language
Accounting
Caudill Marketing Award
International Business
SIFE World Trade
Computer Science
Economics
F. Keith Griggs Student Leadership
Ray Webb Lutz Scholarship
Professor James Rash
Art History Research
Elizabeth Carlisle Jones Art
Academic Freedom
Wall Street Journal
David M. Schweppe Memorial Music
Music Achievement
First Year Music
Theodore Presser Music
Symphonic Band
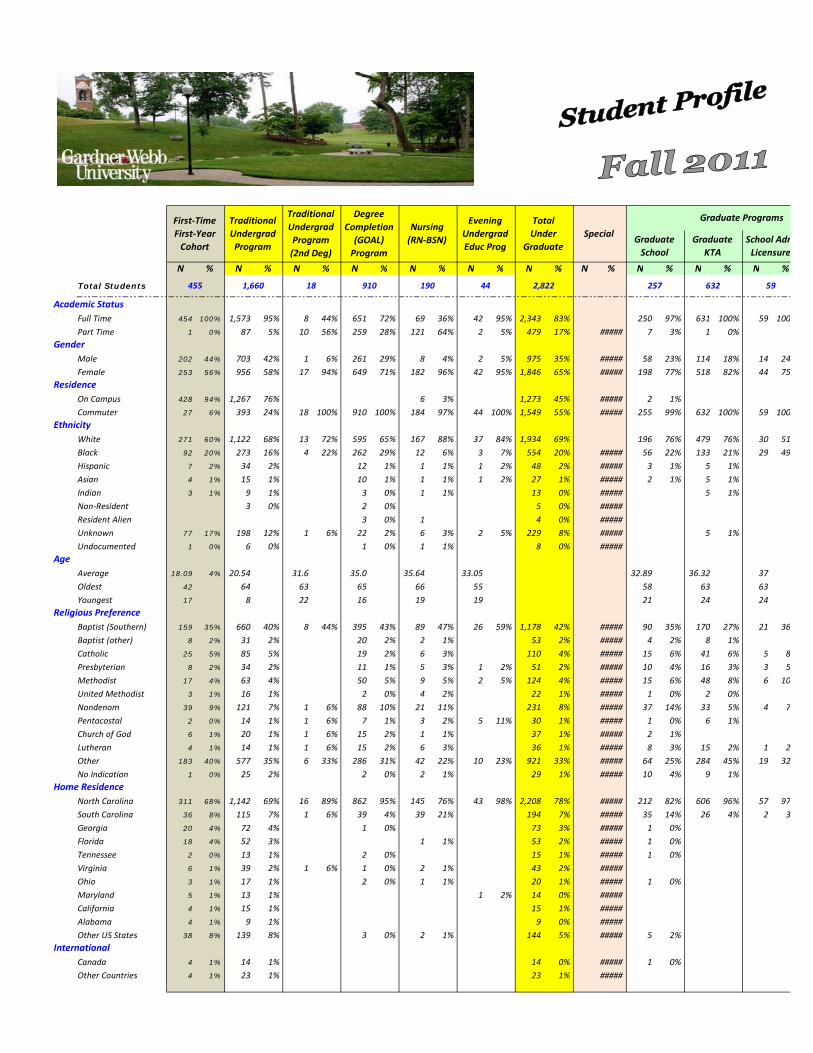
N % N % N % N % N % N % N % N % N % N % N %
Total Students
Academic StatusFull Time 454 100% 1,573 95% 8 44% 651 72% 69 36% 42 95% 2,343 83% 250 97% 631 100% 59 100
Part Time 1 0% 87 5% 10 56% 259 28% 121 64% 2 5% 479 17% ##### 7 3% 1 0%Gender
Male 202 44% 703 42% 1 6% 261 29% 8 4% 2 5% 975 35% ##### 58 23% 114 18% 14 24
Female 253 56% 956 58% 17 94% 649 71% 182 96% 42 95% 1,846 65% ##### 198 77% 518 82% 44 75Residence
On Campus 428 94% 1,267 76% 6 3% 1,273 45% ##### 2 1%
Commuter 27 6% 393 24% 18 100% 910 100% 184 97% 44 100% 1,549 55% ##### 255 99% 632 100% 59 100Ethnicity
White 271 60% 1,122 68% 13 72% 595 65% 167 88% 37 84% 1,934 69% 196 76% 479 76% 30 51
Black 92 20% 273 16% 4 22% 262 29% 12 6% 3 7% 554 20% ##### 56 22% 133 21% 29 49
Hispanic 7 2% 34 2% 12 1% 1 1% 1 2% 48 2% ##### 3 1% 5 1%
Asian 4 1% 15 1% 10 1% 1 1% 1 2% 27 1% ##### 2 1% 5 1%
Indian 3 1% 9 1% 3 0% 1 1% 13 0% ##### 5 1%
Non‐Resident 3 0% 2 0% 5 0% #####
Resident Alien 3 0% 1 4 0% #####
Unknown 77 17% 198 12% 1 6% 22 2% 6 3% 2 5% 229 8% ##### 5 1%
Undocumented 1 0% 6 0% 1 0% 1 1% 8 0% #####Age
Average 18.09 4% 20.54 31.6 35.0 35.64 33.05 32.89 36.32 37
Oldest 42 64 63 65 66 55 58 63 63
Youngest 17 8 22 16 19 19 21 24 24Religious Preference
Baptist (Southern) 159 35% 660 40% 8 44% 395 43% 89 47% 26 59% 1,178 42% ##### 90 35% 170 27% 21 36
Baptist (other) 8 2% 31 2% 20 2% 2 1% 53 2% ##### 4 2% 8 1%
Catholic 25 5% 85 5% 19 2% 6 3% 110 4% ##### 15 6% 41 6% 5 8
Presbyterian 8 2% 34 2% 11 1% 5 3% 1 2% 51 2% ##### 10 4% 16 3% 3 5
Methodist 17 4% 63 4% 50 5% 9 5% 2 5% 124 4% ##### 15 6% 48 8% 6 10
United Methodist 3 1% 16 1% 2 0% 4 2% 22 1% ##### 1 0% 2 0%
Nondenom 39 9% 121 7% 1 6% 88 10% 21 11% 231 8% ##### 37 14% 33 5% 4 7
Pentacostal 2 0% 14 1% 1 6% 7 1% 3 2% 5 11% 30 1% ##### 1 0% 6 1%
Church of God 6 1% 20 1% 1 6% 15 2% 1 1% 37 1% ##### 2 1%
Lutheran 4 1% 14 1% 1 6% 15 2% 6 3% 36 1% ##### 8 3% 15 2% 1 2
Other 183 40% 577 35% 6 33% 286 31% 42 22% 10 23% 921 33% ##### 64 25% 284 45% 19 32
No Indication 1 0% 25 2% 2 0% 2 1% 29 1% ##### 10 4% 9 1%Home Residence
North Carolina 311 68% 1,142 69% 16 89% 862 95% 145 76% 43 98% 2,208 78% ##### 212 82% 606 96% 57 97
South Carolina 36 8% 115 7% 1 6% 39 4% 39 21% 194 7% ##### 35 14% 26 4% 2 3
Georgia 20 4% 72 4% 1 0% 73 3% ##### 1 0%
Florida 18 4% 52 3% 1 1% 53 2% ##### 1 0%
Tennessee 2 0% 13 1% 2 0% 15 1% ##### 1 0%
Virginia 6 1% 39 2% 1 6% 1 0% 2 1% 43 2% #####
Ohio 3 1% 17 1% 2 0% 1 1% 20 1% ##### 1 0%
Maryland 5 1% 13 1% 1 2% 14 0% #####
California 4 1% 15 1% 15 1% #####
Alabama 4 1% 9 1% 9 0% #####
Other US States 38 8% 139 8% 3 0% 2 1% 144 5% ##### 5 2%International
Canada 4 1% 14 1% 14 0% ##### 1 0%
Other Countries 4 1% 23 1% 23 1% #####
First‐Time First‐Year Cohort
455 257 632 591,660 18 910 190 44 2,822
Graduate School
Graduate KTA
School AdmLicensure
TotalUnder
GraduateSpecial
Graduate ProgramsTraditionalUndergradProgram
TraditionalUndergradProgram(2nd Deg)
DegreeCompletion (GOAL)Program
Nursing(RN‐BSN)
Evening UndergradEduc Prog

N % N % N % N % N % N % N % N % N % N % N %
Total Students
Academic Status1 20% 79 57% 22 92% 195 100% 1237 94% 131 70% 18 82% 149 72% 262 61% 1,648 85% 3,991 84% Full Time
4 80% 59 43% 2 8% 73 6% 55 30% 4 18% 59 28% 166 39% 298 15% 777 16% Part TimeGender
2 40% 9 7% 7 29% 66 34% 270 21% 97 52% 19 86% 116 56% 182 43% 568 29% 1,543 32% Male
3 60% 129 93% 17 71% 129 66% 1038 79% 89 48% 3 14% 92 44% 246 57% 1,376 71% 3,222 68% FemaleResidence
5 1% 5 0% 1,278 27% On Campus
5 100% 138 100% 24 100% 195 100% 1308 100% 186 100% 22 100% 208 100% 423 99% 1,939 100% 3,488 73% CommuterEthnicity
4 80% 120 87% 21 88% 135 69% 985 75% 101 54% 18 82% 119 57% 298 70% 1,402 72% 3,336 70% White
1 20% 12 9% 1 4% 52 27% 284 22% 75 40% 3 14% 78 38% 100 23% 462 24% 1,016 21% Black
1 4% 2 1% 11 1% 4 2% 1 5% 5 2% 8 2% 24 1% 72 2% Hispanic
3 2% 3 2% 13 1% 10 2% 23 1% 50 1% Asian
1 1% 6 0% 2 0% 8 0% 21 0% Indian
1 0% 1 0% 6 0% Non‐Resident
1 1% 1 0% 1 0% 5 0% Resident Alien
1 1% 1 4% 3 2% 10 1% 5 3% 5 2% 9 2% 24 1% 253 5% Unknown
1 1% 1 0% 1 0% 9 0% UndocumentedAge
37.2 40.04 45.13 38.76 38.9 48.18 33.96 Average
45 70 58 63 73 71 63 Oldest
28 21 29 24 21 33 21 YoungestReligious Preference
1 20% 73 53% 7 29% 69 35% 431 33% 118 63% 17 77% 135 65% 176 41% 742 38% 1,920 40% Baptist (Southern)
2 1% 4 2% 18 1% 10 5% 1 5% 11 5% 8 2% 37 2% 90 2% Baptist (other)
3 2% 3 13% 8 4% 75 6% 17 4% 92 5% 202 4% Catholic
3 2% 7 4% 39 3% 1 1% 1 0% 10 2% 50 3% 101 2% Presbyterian
13 9% 4 17% 21 11% 107 8% 9 5% 1 5% 10 5% 27 6% 144 7% 268 6% Methodist
4 3% 2 8% 1 1% 10 1% 4 1% 14 1% 36 1% United Methodist
4 80% 9 7% 3 13% 20 10% 110 8% 11 6% 1 5% 12 6% 49 11% 171 9% 402 8% Nondenom
1 1% 3 2% 11 1% 3 1% 14 1% 44 1% Pentacostal
1 1% 1 4% 3 2% 7 1% 2 0% 9 0% 46 1% Church of God
5 4% 1 4% 6 3% 36 3% 1 5% 1 0% 8 2% 45 2% 81 2% Lutheran
21 15% 3 13% 43 22% 434 33% 31 17% 1 5% 32 15% 107 25% 573 29% 1,494 31% Other
3 2% 10 5% 32 2% 6 3% 6 3% 17 4% 55 3% 84 2% No IndicationHome Residence
4 80% 92 67% 22 92% 154 79% 1147 88% 144 77% 16 73% 160 77% 322 75% 1,629 84% 3,837 80% North Carolina
1 20% 45 33% 1 4% 39 20% 149 11% 35 19% 3 14% 38 18% 72 17% 259 13% 453 10% South Carolina
1 0% 6 1% 7 0% 80 2% Georgia
1 0% 1 1% 1 0% 6 1% 8 0% 61 1% Florida
1 1% 2 0% 2 1% 1 5% 3 1% 2 0% 7 0% 22 0% Tennessee
1 1% 1 0% 2 1% 2 9% 4 2% 4 1% 9 0% 52 1% Virginia
1 0% 2 0% 3 0% 23 0% Ohio
14 0% Maryland
1 0% 1 0% 16 0% California
1 1% 1 0% 2 0% 3 0% 12 0% Alabama
1 4% 6 0% 2 1% 2 1% 9 2% 17 1% 161 3% Other US StatesInternational
1 0% 1 0% 15 0% Canada
2 0% 2 0% 25 1% Other Countries
428 1,946 4,76824 195 1310 186 22 2085 138
Total Post
Baccalaur
TotalAll
ProgramsTeacherDiscountProgram
Master'sNursing
Doctor of Nursing
EdDProgram
TOTAL
Graduate Programs School of Divinity GraduateSchool ofBusiness
Master ofDivinity
Doctor ofMinistry
TOTAL
Related Documents