Facts Monthly fund, analysis and market reviews Figures in July 2012 We are now We are turning a new leaf. We are turning a new leaf.

Welcome message from author
This document is posted to help you gain knowledge. Please leave a comment to let me know what you think about it! Share it to your friends and learn new things together.
Transcript

Facts Monthly fund, analysis and market reviews
Figures in
July 2012
We are now
We are turning a new leaf.We are turning a new leaf.

Post a strong rally in the previous month , the Indian benchmark indices ended July down ~1% on the back of global
risk-off sentiments and domestic woes.The Foreign Institutional Investors (FIIs) continued to be net buyers with an
inflow of ~$2.06 Bn during the month. Domestic institutions, on the other hand, were net sellers during the month
with outflows worth US$ 952 Mn during July.
In it’s recent credit policy, the Reserve
Bank of India (RBI) decreased the
Statutory Liquidity Ratio (SLR) was
cut from 24% to 23% as a liquidity easing measure. However,
the RBI left policy rates unchanged. With inflation remaining the
key priority and all inflation indices way above the RBI's comfort
zone of 4-5%, the RBI left all rates unchanged (repo at 8%;
reverse repo at 7% and CRR at 4.75%). The RBI has raised its
inflation estimate from 6.5% to 7% and lowered its FY13 GDP
estimates from 7.3% to 6.5% factoring in risks such as lower global growth, sub-par monsoons and slowdown in services, the risks highlighted
seem more likely to materialize.
June WPI was lower at 7.3% vis-à-vis the 7.6% number in May.
Though this was lower than consensus expectations, the recent
spate of prior data revisions has caused market reaction to the
data being somewhat tepid. The manufactured non-food
component at 4.9%, was slightly lower than the May print (5%)
as well.
May IIP print came in at 2.4%, a little higher than consensus
expectations of 1.8%. This was an improvement over the
previous month which was incidentally revised downwards
from 0.1% to -0.9%. The key drag in May was once again Capital
Goods which contracted 8%, meanwhile Consumer Goods were up – driven by a 9% expansion in durables.
The country's crucial monsoon rains continued to be below average in the month of July leading to a slow start to the four-month monsoon
season. This remains a key risk for a slowdown in demand and resurgence of food inflation.
Global worries persisted during July as well with Euro countries such as Spain receiving increased scrutiny post the bailout of its banks.
Domestically, policy inaction remains the key overhang over the markets. The parliament is scheduled to commence its monsoon session on
the 8th of August following. With the Presidential elections out of the way, the focus once again returned to some of the much awaited policy
moves such as hike in diesel prices and increasing FDI in certain sectors.
Data Source : Bloomberg LP (Unless indicated otherwise)
BOI AXA Investment Managers Pvt. Ltd.
EQUITYOUTLOOK
Gaurav KapurFUND MANAGER - EQUITY
2
%YoY
Source: CSO; RBI; Citi Research
India - Trends in Headline GDP (%YOY)
FY
02
10.0
9.0
8.0
7.0
6.0
5.0
4.0
3.0F
Y03
FY
04
FY
05
FY
06
FY
07
FY
08
FY
09
FY
10
FY
11
FY
12
FY
13E
5.8
3.8
8.5
7.6
9.5 9.6 9.3
6.7
8.4 8.4
RBI
6.5
estimate
6.5
Source: RBI
India - Trends in SLR and CRR (%)
SLR (LHS) CRR (RHS)
28
27
26
25
24
23
22
SLR%
Key rates:SLR reduction by 100bps to 23%CRR unchanged at 4.75%
25.0
20.0
CRR%
15.0
10.0
5.0
0.0
Aug-0
0
Aug-0
1
Aug-0
2
Aug-0
3
Aug-0
4
Aug-0
5
Aug-0
6
Aug-0
7
Aug-0
8
Aug-0
9
Aug-1
0
Aug-1
1
Aug-1
2

FIXED INCOME OUTLOOK
Data Source : Bloomberg LP (Unless indicated otherwise)
Last month RBI released its monetary policy statement, It surprised the market by lowering the SLR requirement
from 24% to 23%, while keeping the repo, reverse repo and CRR ratio unchanged at 8%, 7% and 4.75%
respectively. Which essentially indicate a cautious approach by RBI as maintained by its global peers like Fed and ECB
in the wake of volatile macro economic data and loose fiscal situation globally.
RBI refrained from lowering the policy rate as Wholesale Price Index (WPI) inflation continued to remain sticky
despite significant deceleration in growth. It was last reported 7.25% for the month of June marginally lower than
7.55% for April and 7.61% for May 2012. This can be largely attributed to high primary food inflation, which was in
double-digits during Q1 of 2012-13 due to an unusual spike in vegetable prices and sustained high inflation in protein items. This totally negated
the positive impact of lower fuel prices due to fall in international crude oil prices and lower Non-food manufactured products inflation, which
was last reported at 4.8%.
The lower than expected monsoon, persistent input price pressures due to both exchange rate movements and supply side constraints, shall
continue to exert pressure both on food and non-food manufactured products inflation. Therefore it makes a case of RBI to hold on the policy
rates at these levels for some time.
Hence, the bigger question on SLR reduction remains. RBI ever since it changed the monetary stance in March 2012 is constantly infusing
liquidity into the banking system by way to CRR cuts and OMO’s. These have helped the system from being over ̀ 100,000crs deficit to below
50,000crs deficit now. The cut in SLR will further increase the liquidity into the banking system and eventually increase the money supply (M3)
which was last reported at 14.3% in July, which was lower than the indicative trajectory of 15%, non-food credit growth at 17.4% was slightly
above the indicative projection of 17%.
The increased liquidity by way of reduction in SLR shall reduce the crowding off affect to some extent, which is high because of high fiscal
deficit. Higher liquidity will also result in lower short term rates in the economy, eventually lowering the funding curve and supporting growth.
This situation allow us to maintain that currently short terms curve is a better investment option as compared to long bonds as supply side
pressure and lower demand shall keep the long bond yield elevated, even if RBI continue with its OMO.
`
Get the latest Equity Market Outlook & Fixed Income Market Outlook regularly in your mail box.
Visit www.boiaxa-im.com & subscribe now!
Alok SinghCHIEF INVESTMENT OFFICER
FIXED INCOME
BOI AXA Investment Managers Pvt. Ltd.3
Growth 16.47Bonus 16.47Regular Dividend 11.61Quarterly Dividend 10.46
Growth 16.63Bonus 16.63 Regular Dividend 11.70Quarterly Dividend 10.57
NAV ( ` )
Regular Plan
Eco Plan
• For Dividend History please refer page no. 7
Regular Plan
NIL
1% if redeemed within 1 year from the date of allotment
Eco Plan
Entry Load
Exit Load
Investmentsthrough
SIP / STP
Investments through Liq-uity
InstitutionalPlan
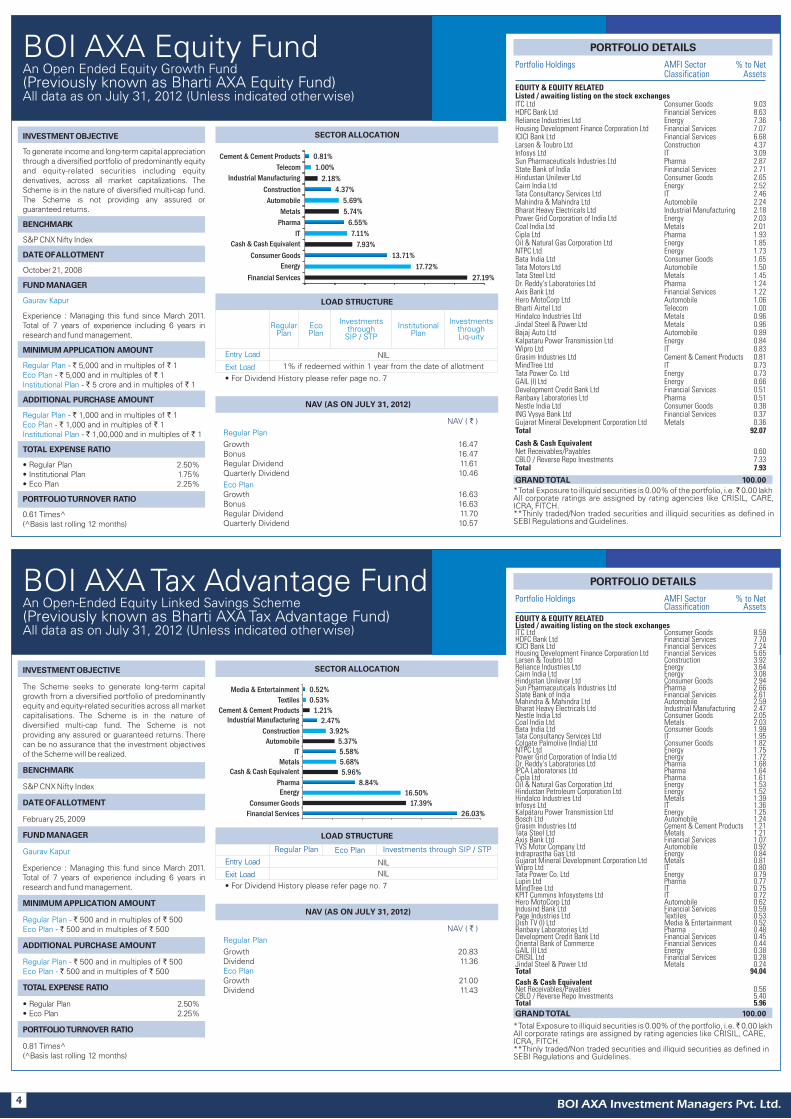
BOI An Open Ended Equity Growth Fund(Previously known as Bharti AXA Equity Fund) All data as on July 31, 2012 (Unless indicated otherwise)
AXA Equity Fund
SECTOR ALLOCATION
LOAD STRUCTURE
NAV (AS ON JULY 31, 2012)
* Total Exposure to illiquid securities is 0.00% of the portfolio, i.e. ̀ 0.00 lakhAll corporate ratings are assigned by rating agencies like CRISIL, CARE, ICRA, FITCH.**Thinly traded/Non traded securities and illiquid securities as defined in SEBI Regulations and Guidelines.
Portfolio Holdings AMFI Sector % to Net Classification Assets
EQUITY & EQUITY RELATEDListed / awaiting listing on the stock exchangesITC Ltd Consumer Goods 9.03HDFC Bank Ltd Financial Services 8.63Reliance Industries Ltd Energy 7.36Housing Development Finance Corporation Ltd Financial Services 7.07ICICI Bank Ltd Financial Services 6.68Larsen & Toubro Ltd Construction 4.37Infosys Ltd IT 3.09Sun Pharmaceuticals Industries Ltd Pharma 2.87State Bank of India Financial Services 2.71Hindustan Unilever Ltd Consumer Goods 2.65Cairn India Ltd Energy 2.52Tata Consultancy Services Ltd IT 2.46Mahindra & Mahindra Ltd Automobile 2.24Bharat Heavy Electricals Ltd Industrial Manufacturing 2.18Power Grid Corporation of India Ltd Energy 2.03Coal India Ltd Metals 2.01Cipla Ltd Pharma 1.93Oil & Natural Gas Corporation Ltd Energy 1.85NTPC Ltd Energy 1.73Bata India Ltd Consumer Goods 1.65Tata Motors Ltd Automobile 1.50Tata Steel Ltd Metals 1.45Dr. Reddy's Laboratories Ltd Pharma 1.24Axis Bank Ltd Financial Services 1.22Hero MotoCorp Ltd Automobile 1.06Bharti Airtel Ltd Telecom 1.00Hindalco Industries Ltd Metals 0.96Jindal Steel & Power Ltd Metals 0.96Bajaj Auto Ltd Automobile 0.89Kalpataru Power Transmission Ltd Energy 0.84Wipro Ltd IT 0.83Grasim Industries Ltd Cement & Cement Products 0.81MindTree Ltd IT 0.73Tata Power Co. Ltd Energy 0.73GAIL (I) Ltd Energy 0.66Development Credit Bank Ltd Financial Services 0.51Ranbaxy Laboratories Ltd Pharma 0.51Nestle India Ltd Consumer Goods 0.38ING Vysya Bank Ltd Financial Services 0.37Gujarat Mineral Development Corporation Ltd Metals 0.36Total 92.07
Cash & Cash EquivalentNet Receivables/Payables 0.60CBLO / Reverse Repo Investments 7.33Total 7.93
GRAND TOTAL 100.00
PORTFOLIO DETAILS
Growth 20.83Dividend 11.36
Growth 21.00Dividend 11.43
NAV ( ` )
Regular Plan
Eco Plan
• For Dividend History please refer page no. 7
NIL
NIL
Entry Load
Exit Load
BOI An Open-Ended Equity Linked Savings Scheme(Previously known as Bharti AXA Tax Advantage Fund) All data as on July 31, 2012 (Unless indicated otherwise)
AXA Tax Advantage Fund
SECTOR ALLOCATION
LOAD STRUCTURE
NAV (AS ON JULY 31, 2012)
* Total Exposure to illiquid securities is 0.00% of the portfolio, i.e. ̀ 0.00 lakhAll corporate ratings are assigned by rating agencies like CRISIL, CARE, ICRA, FITCH.**Thinly traded/Non traded securities and illiquid securities as defined in SEBI Regulations and Guidelines.
Portfolio Holdings AMFI Sector % to Net Classification Assets
EQUITY & EQUITY RELATEDListed / awaiting listing on the stock exchangesITC Ltd Consumer Goods 8.59HDFC Bank Ltd Financial Services 7.70ICICI Bank Ltd Financial Services 7.24Housing Development Finance Corporation Ltd Financial Services 5.65Larsen & Toubro Ltd Construction 3.92Reliance Industries Ltd Energy 3.64Cairn India Ltd Energy 3.08Hindustan Unilever Ltd Consumer Goods 2.94Sun Pharmaceuticals Industries Ltd Pharma 2.66State Bank of India Financial Services 2.61Mahindra & Mahindra Ltd Automobile 2.59Bharat Heavy Electricals Ltd Industrial Manufacturing 2.47Nestle India Ltd Consumer Goods 2.05Coal India Ltd Metals 2.03Bata India Ltd Consumer Goods 1.99Tata Consultancy Services Ltd IT 1.95Colgate Palmolive (India) Ltd Consumer Goods 1.82NTPC Ltd Energy 1.75Power Grid Corporation of India Ltd Energy 1.72Dr. Reddy's Laboratories Ltd Pharma 1.68IPCA Laboratories Ltd Pharma 1.64Cipla Ltd Pharma 1.61Oil & Natural Gas Corporation Ltd Energy 1.53Hindustan Petroleum Corporation Ltd Energy 1.52Hindalco Industries Ltd Metals 1.39Infosys Ltd IT 1.36Kalpataru Power Transmission Ltd Energy 1.25Bosch Ltd Automobile 1.24Grasim Industries Ltd Cement & Cement Products 1.21Tata Steel Ltd Metals 1.21Axis Bank Ltd Financial Services 1.07TVS Motor Company Ltd Automobile 0.92Indraprastha Gas Ltd Energy 0.84Gujarat Mineral Development Corporation Ltd Metals 0.81Wipro Ltd IT 0.80Tata Power Co. Ltd Energy 0.79Lupin Ltd Pharma 0.77MindTree Ltd IT 0.75KPIT Cummins Infosystems Ltd IT 0.72Hero MotoCorp Ltd Automobile 0.62Indusind Bank Ltd Financial Services 0.59Page Industries Ltd Textiles 0.53Dish TV (I) Ltd Media & Entertainment 0.52Ranbaxy Laboratories Ltd Pharma 0.48Development Credit Bank Ltd Financial Services 0.45Oriental Bank of Commerce Financial Services 0.44GAIL (I) Ltd Energy 0.38CRISIL Ltd Financial Services 0.28Jindal Steel & Power Ltd Metals 0.24Total 94.04
Cash & Cash EquivalentNet Receivables/Payables 0.56CBLO / Reverse Repo Investments 5.40Total 5.96
GRAND TOTAL 100.00
PORTFOLIO DETAILS
INVESTMENT OBJECTIVE
BENCHMARK
S&P CNX Nifty Index
DATE OF ALLOTMENT
October 21, 2008
FUND MANAGER
MINIMUM APPLICATION AMOUNT
- ` 5,000 and in multiples of ` 1 - ` 5,000 and in multiples of ` 1
- ` 5 crore and in multiples of ` 1
ADDITIONAL PURCHASE AMOUNT
- ` 1,000 and in multiples of ` 1 - ` 1,000 and in multiples of ` 1
- ` 1,00,000 and in multiples of ` 1
TOTAL EXPENSE RATIO
• Regular Plan 2.50%• Institutional Plan 1.75%• Eco Plan 2.25%
To generate income and long-term capital appreciation through a diversified portfolio of predominantly equity and equity-related securities including equity derivatives, across all market capitalizations. The Scheme is in the nature of diversified multi-cap fund. The Scheme is not providing any assured or guaranteed returns.
Experience : Managing this fund since March 2011. Total of 7 years of experience including 6 years in research and fund management.
Gaurav Kapur
Regular PlanEco PlanInstitutional Plan
Regular PlanEco PlanInstitutional Plan
PORTFOLIO TURNOVER RATIO
0.61 Times^(^Basis last rolling 12 months)
INVESTMENT OBJECTIVE
BENCHMARK
S&P CNX Nifty Index
DATE OF ALLOTMENT
February 25, 2009
FUND MANAGER
MINIMUM APPLICATION AMOUNT
- ` 500 and in multiples of ` 500 - ` 500 and in multiples of ` 500
ADDITIONAL PURCHASE AMOUNT
- ` 500 and in multiples of ` 500 - ` 500 and in multiples of ` 500
TOTAL EXPENSE RATIO
• Regular Plan 2.50%• Eco Plan 2.25%
The Scheme seeks to generate long-term capital growth from a diversified portfolio of predominantly equity and equity-related securities across all market capitalisations. The Scheme is in the nature of diversified multi-cap fund. The Scheme is not providing any assured or guaranteed returns. There can be no assurance that the investment objectives of the Scheme will be realized.
Experience : Managing this fund since March 2011. Total of 7 years of experience including 6 years in research and fund management.
Gaurav Kapur
Regular PlanEco Plan
Regular PlanEco Plan
PORTFOLIO TURNOVER RATIO
0.81 Times^(^Basis last rolling 12 months)
BOI AXA Investment Managers Pvt. Ltd.4
Investments through SIP / STPEco PlanRegular Plan
27.19%
17.72%
13.71%
7.93%
7.11%
6.55%
5.74%
5.69%
4.37%
2.18%
1.00%
0.81%
Financial Services
Energy
Consumer Goods
Cash & Cash Equivalent
IT
Pharma
Metals
Automobile
Construction
Industrial Manufacturing
Telecom
Cement & Cement Products
26.03%
17.39%
16.50%
8.84%
5.96%
5.68%
5.58%
5.37%
3.92%
2.47%
1.21%
0.53%
0.52%
Financial Services
Consumer Goods
EnergyPharma
Cash & Cash EquivalentMetals
IT
Automobile
Construction
Industrial ManufacturingCement & Cement Products
Textiles
Media & Entertainment

BOI An Open Ended Equity Scheme(Previously known as Bharti AXA Focused Infrastructure Fund) All data as on July 31, 2012 (Unless indicated otherwise)
AXA Focused Infrastructure Fund
SECTOR ALLOCATION
LOAD STRUCTURE
* Total Exposure to illiquid securities is 0.00% of the portfolio, i.e. ̀ 0.00 lakh
Portfolio Holdings AMFI Sector % to Net Classification Assets
EQUITY & EQUITY RELATEDListed / awaiting listing on the stock exchangesLarsen & Toubro Ltd Construction 8.68Housing Development Finance Corporation Ltd Financial Services 7.66Reliance Industries Ltd Energy 7.34Oil & Natural Gas Corporation Ltd Energy 6.23NTPC Ltd Energy 5.21Coal India Ltd Metals 5.05Power Grid Corporation of India Ltd Energy 4.34Tata Steel Ltd Metals 4.08Bharat Heavy Electricals Ltd Industrial Manufacturing 3.78Cairn India Ltd Energy 3.16Bharti Airtel Ltd Telecom 3.13Castrol (I) Ltd Energy 2.69LIC Housing Finance Ltd Financial Services 2.67Infrastructure Development Finance Company Ltd Financial Services 2.43Grasim Industries Ltd Cement & Cement Products 2.27Jindal Steel & Power Ltd Metals 2.10Tata Power Co. Ltd Energy 1.88Hindalco Industries Ltd Metals 1.78Kalpataru Power Transmission Ltd Energy 1.76Kajaria Ceramics Ltd Construction 1.65GAIL (I) Ltd Energy 1.57Steel Authority of India Ltd Metals 1.40NMDC Ltd Metals 1.37Engineers India Ltd Construction 1.26Indian Oil Corporation Ltd Energy 1.18UltraTech Cement Ltd Cement & Cement Products 1.13Rural Electrification Corporation Ltd Financial Services 1.10Hindustan Petroleum Corporation Ltd Energy 1.03Sterlite Industries (I) Ltd Metals 1.02Power Finance Corporation Ltd Financial Services 1.00Indraprastha Gas Ltd Energy 0.94Ambuja Cements Ltd Cement & Cement Products 0.92Reliance Power Ltd Energy 0.87Gujarat Mineral Development Corporation Ltd Metals 0.71ACC Ltd Cement & Cement Products 0.63Mangalore Refinery and Petrochemicals Ltd Energy 0.50Bharat Petroleum Corpn. Ltd Energy 0.50Oil India Ltd Energy 0.36Total 95.38
Cash & Cash EquivalentNet Receivables/Payables 1.80CBLO / Reverse Repo Investments 2.82Total 4.62
GRAND TOTAL 100.00
PORTFOLIO DETAILS
BOI An Open Ended Income Scheme(Previously known as Bharti AXA Regular Return Fund) All data as on July 31, 2012 (Unless indicated otherwise)
AXA Regular Return Fund
SECTOR ALLOCATION
LOAD STRUCTURE
Portfolio Holdings Rating/ % to Net Industry Assets
EQUITY & EQUITY RELATEDListed / awaiting listing on the stock exchangesITC Ltd Consumer Goods 1.96KPIT Cummins Infosystems Ltd IT 1.61Mahindra & Mahindra Ltd Automobile 1.56HDFC Bank Ltd Financial Services 1.54Indusind Bank Ltd Financial Services 1.40Tata Motors Ltd Automobile 1.30Apollo Tyres Ltd Automobile 1.28State Bank of India Financial Services 1.21Cairn India Ltd Energy 1.05Hindalco Industries Ltd Metals 1.00Hindustan Unilever Ltd Consumer Goods 0.92Oriental Bank of Commerce Financial Services 0.75TVS Motor Company Ltd Automobile 0.69Coal India Ltd Metals 0.65Kalpataru Power Transmission Ltd Energy 0.42Tata Steel Ltd Metals 0.32Total 17.66
MONEY MARKET INSTRUMENTSCertificate of Deposit**IDBI Bank Ltd CRISIL A1+ 31.28State Bank of Patiala ICRA A1+ 27.19Punjab National Bank CARE A1+ 12.47Total 70.94
Cash & Cash EquivalentNet Receivables/Payables 2.25CBLO / Reverse Repo Investments 9.15Total 11.40
GRAND TOTAL 100.00
PORTFOLIO DETAILS
INVESTMENT OBJECTIVE
BENCHMARK
BSE 100 Index
DATE OF ALLOTMENT
March 05, 2010
FUND MANAGER
MINIMUM APPLICATION AMOUNT
` 5,000 and in multiples of ` 1
ADDITIONAL PURCHASE AMOUNT
` 1,000 and in multiples of ` 1
TOTAL EXPENSE RATIO
2.50%
The Scheme seeks to generate long term capital appreciation through a portfolio of predominantly equity and equity related securities of companies engaged in infrastructure and infrastructure related sectors.
However, there can be no assurance that the investment objectives of the Scheme will be realized. The Scheme is not providing any assured or guaranteed returns.
Experience : Managing this fund since March 2011. Total of 7 years of experience including 6 years in research and fund management.
Gaurav Kapur
PORTFOLIO TURNOVER RATIO
0.82 Times^(^Basis last rolling 12 months)
INVESTMENT OBJECTIVE
BENCHMARK
CRISIL MIP Blended Index
DATE OF ALLOTMENT
March 18, 2009
FUND MANAGER
MINIMUM APPLICATION AMOUNT
- ` 10,000 and in multiples of ` 1 - ` 10,000 and in multiples of ` 1
ADDITIONAL PURCHASE AMOUNT
- ` 1,000 and in multiples of ` 1 - ` 1,000 and in multiples of ` 1
TOTAL EXPENSE RATIO
• Regular Plan 2.00%• Eco Plan 1.75%
The Scheme seeks to generate regular income through investments in fixed income securities and also to generate long term capital appreciation by investing a portion in equity and equity related instruments. However, there can be no assurance that the income can be generated, regular or otherwise, or the investment objectives of the Scheme will be realized.
Experience : Managing this fund since May 2012. Around 12 years of experience, including 7 years in mutual fund industry.
Alok Singh
Regular PlanEco Plan
Regular PlanEco Plan
AVERAGE MATURITY & MODIFIED DURATION
Average Maturity - 0.06 YearsModified Duration - 0.05 Years
BOI AXA Investment Managers Pvt. Ltd.5
NAV ( ` )
Regular Plan
Eco Plan
Growth 12.2692Monthly Dividend 10.9992Quarterly Dividend 10.9940Annual Dividend 12.2692
Growth 12.3751Monthly Dividend 11.4272Quarterly Dividend 10.3335Annual Dividend 12.3751
• For Dividend History please refer page no. 7
NIL
1 % if redeemed before 1 year from date of allotment
Entry Load
Exit Load
NAV (AS ON JULY 31, 2012)
Growth 7.83
Regular Dividend 7.83
Quarterly Dividend 7.83
NAV ( ` )
• For Dividend History please refer page no. 7
NIL
1% if redeemed within 1 year from the date of allotment
Entry Load
Exit Load
NAV (AS ON JULY 31, 2012)
Equity & equity related securities Money Market Instruments
Cash & Cash Equivalent
17.66%
70.94%
11.40%
All corporate ratings are assigned by rating agencies like CRISIL, CARE, ICRA, FITCH.**Thinly traded/Non traded securities and illiquid securities as defined in SEBI Regulations and Guidelines.* Total Exposure to illiquid securities is 0.00% of the portfolio, i.e. ̀ 0.00 lakh
COMPOSITION BY ASSETS
39.56%
17.51%
14.86%
11.59%
4.95%
4.62%
3.78%
3.13%
Energy
Metals
Financial Services
Construction
Cement & Cement Products
Cash & Cash Equivalent
Industrial Manufacturing
Telecom
11.40%
4.90%
4.83%
2.88%
1.97%
1.61%
1.47%
Cash & Cash Equivalent
Financial Services
Automobile
Consumer Goods
Metals
IT
Energy

BOI AXA Investment Managers Pvt. Ltd.6
BOI An Open Ended Liquid Scheme(Previously known as Bharti AXA Liquid Fund) All data as on July 31, 2012 (Unless indicated otherwise)
AXA Liquid Fund
CREDIT PROFILEINVESTMENT OBJECTIVE
BENCHMARK
CRISIL Liquid Fund Index
DATE OF ALLOTMENT
July 16, 2008
FUND MANAGER
MINIMUM APPLICATION AMOUNT
ADDITIONAL PURCHASE AMOUNT
TOTAL EXPENSE RATIO
• Regular Plan 0.15%• Institutional Plan 0.10%• Super 0.05%
AVERAGE MATURITY & MODIFIED DURATION
The Scheme seeks to deliver reasonable market related returns with lower risk and higher liquidity through portfolio of debt and money market instruments. The Scheme is not providing any assured or guaranteed returns.
Experience : Managing this fund since June 2010. Total of around 12 years experience in fund and portfolio management including forex portfolio management.
Ramesh Rachuri
Regular Plan Institutional PlanSuper Institutional Plan -
Regular Plan Institutional PlanSuper Institutional Plan -
- ` 5,000 and in multiples of ` 1 - ` 1 crore and in multiples of ` 1
` 5 crore and in multiples of ` 1
- ` 1,000 and in multiples of ` 1 - ` 1,00,000 and in multiples of ` 1
` 1,00,000 and in multiples of ` 1
Institutional Plan
Average Maturity - 27 DaysModified Duration - 24 Days
LOAD STRUCTURE
Growth 1276.6537Daily Dividend 1000.0252Weekly Dividend 1000.2509
Growth 1295.5372Daily Dividend 1000.0138Weekly Dividend -
Growth 1301.6160Daily Dividend 1000.0457Weekly Dividend -
NAV ( ` )
Regular Plan
Institutional Plan
Super Institutional Plan
• For Dividend History please refer page no. 7
NIL
NIL
Entry Load
Exit Load
NAV (AS ON JULY 31, 2012)
81.35%
CashA1+
18.65%
Portfolio Holdings Rating/ % to Net Industry Assets
MONEY MARKET INSTRUMENTSCertificate of Deposit**UCO Bank CRISIL A1+ 15.45Corporation Bank CRISIL A1+ 15.43Punjab & Sind Bank ICRA A1+ 11.58Allahabad Bank ICRA A1+ 11.18Punjab National Bank CARE A1+ 8.63Canara Bank CRISIL A1+ 5.39State Bank of Patiala ICRA A1+ 4.76State Bank of Hyderabad ICRA A1+ 4.60IDBI Bank Ltd CRISIL A1+ 4.33Total 81.35
Cash & Cash EquivalentNet Receivables/Payables 0.15CBLO / Reverse Repo Investments 18.50Total 18.65
GRAND TOTAL 100.00
PORTFOLIO DETAILS
All corporate ratings are assigned by rating agencies like CRISIL, CARE, ICRA, FITCH.**Thinly traded/Non traded securities and illiquid securities as defined in SEBI Regulations and Guidelines.
Money Market Instruments Cash & Cash Equivalent
81.35%
18.65%
COMPOSITION BY ASSETS
BOI An Open Ended Income Scheme(Previously known as Bharti AXA Treasury Advantage Fund) All data as on July 31, 2012 (Unless indicated otherwise)
AXA Treasury Advantage Fund
CREDIT PROFILEINVESTMENT OBJECTIVE
BENCHMARK
CRISIL Liquid Fund Index
DATE OF ALLOTMENT
July 16, 2008
FUND MANAGER
MINIMUM APPLICATION AMOUNT
ADDITIONAL PURCHASE AMOUNT
TOTAL EXPENSE RATIO
• Regular Plan 0.15%• Institutional Plan 0.10%
AVERAGE MATURITY & MODIFIED DURATION
The Scheme seeks to deliver reasonable market related returns with lower risk and higher liquidity through portfolio of debt and money market instruments. The Scheme is not providing any assured or guaranteed returns.
Experience : Managing this fund since June 2010. Total of around 12 years experience in fund and portfolio management including forex portfolio management.
Ramesh Rachuri
Regular Plan Institutional Plan
Regular Plan Institutional Plan
- ` 5,000 and in multiples of ` 1 - ` 1 crore and in multiples of ` 1
- ` 1,000 and in multiples of ` 1 - ` 1,00,000 and in multiples of ` 1
Average Maturity - 39 DaysModified Duration - 35 Days
LOAD STRUCTURE
Growth 1,302.0263Daily Dividend 1,000.0439Weekly Dividend 1,000.9845
Growth 1,322.8871Daily Dividend 1,000.0439Weekly Dividend -
NAV ( ` )
Regular Plan
Institutional Plan
• For Dividend History please refer page no. 7
NIL
0.25% if redeemed within 7 days from the date of allotment
Entry Load
Exit Load
NAV (AS ON JULY 31, 2012)
92.03%
CashA1+, Sovereign
7.97%
Portfolio Holdings Rating/ % to Net Industry Assets
MONEY MARKET INSTRUMENTSCertificate of Deposit**State Bank of Hyderabad ICRA A1+ 22.52Canara Bank CRISIL A1+ 20.98IDBI Bank Ltd CRISIL A1+ 11.68State Bank of Patiala ICRA A1+ 9.67Punjab & Sind Bank ICRA A1+ 8.10Allahabad Bank ICRA A1+ 7.71Punjab National Bank CARE A1+ 4.98Total 85.64
Treasury BillTBILL 182 DAY 2012 SOV 6.39Total 6.39
Cash & Cash EquivalentNet Receivables/Payables 1.20CBLO / Reverse Repo Investments 6.77Total 7.97
GRAND TOTAL 100.00
PORTFOLIO DETAILS
All corporate ratings are assigned by rating agencies like CRISIL, CARE, ICRA, FITCH.**Thinly traded/Non traded securities and illiquid securities as defined in SEBI Regulations and Guidelines.
Money Market Instruments Cash & Cash Equivalent
92.03%
7.97%
COMPOSITION BY ASSETS

Up to 3 months 100
4 months to 6 months Nil
7 months to 1 year Nil
> 1 year Nil
% of Assets Duration
BOI An Open Ended Income Scheme(Previously known as Bharti AXA Short Term Income Fund) All data as on July 31, 2012 (Unless indicated otherwise)
AXA Short Term Income Fund
CREDIT PROFILEINVESTMENT OBJECTIVE
BENCHMARK
CRISIL Short Term Bond Fund Index
DATE OF ALLOTMENT
December 18, 2008
FUND MANAGER
MINIMUM APPLICATION AMOUNT
ADDITIONAL PURCHASE AMOUNT
TOTAL EXPENSE RATIO
• Regular Plan 1.25%• Institutional Plan 0.60%
AVERAGE MATURITY & MODIFIED DURATION
The Scheme seeks to deliver reasonable market The Scheme seeks to generate income and capital appreciation by investing in a diversified portfolio of debt and money market securities. However, there can be no assurance that the income can be generated, regular or otherwise, or the investment objectives of the Scheme will be realized. The Scheme is not providing any assured or guaranteed returns.
Experience : Managing this fund since June 2010. Total of around 12 years experience in fund and portfolio management including forex portfolio management.
Ramesh Rachuri
Regular Plan Institutional Plan
Regular Plan Institutional Plan
- ` 5,000 and in multiples of ` 1 - ` 1 crore and in multiples of ` 1
- ` 1,000 and in multiples of ` 1 - ` 1,00,000 and in multiples of ` 1
Average Maturity - 0.10 YearsModified Duration - 0.09 Years
LOAD STRUCTURE
Growth 12.1583Monthly Dividend 10.3105
Growth -Weekly Dividend -
NAV ( ` )
Regular Plan
Institutional Plan
Quarterly Dividend 10.1347
Monthly Dividend -
• For Dividend History please refer page no. 7
NIL
0.50% if redeemed within 6 months from date of allotment
Entry Load
Exit Load
NAV (AS ON JULY 31, 2012)
95.23%
CashA1+, Sovereign
4.77%
Portfolio Holdings Rating/ % to Net
Industry Assets
MONEY MARKET INSTRUMENTS
Certificate of Deposit**
Punjab National Bank CARE A1+ 31.80
State Bank of Patiala ICRA A1+ 30.02
IDBI Bank Ltd CRISIL A1+ 20.15
Allahabad Bank ICRA A1+ 4.99
Total 86.96
Treasury Bill
TBILL 182 DAY 2012 SOV 8.27
Total 8.27
Cash & Cash Equivalent
Net Receivables/Payables 0.73
CBLO / Reverse Repo Investments 4.04
Total 4.77
GRAND TOTAL 100.00
PORTFOLIO DETAILS
All corporate ratings are assigned by rating agencies like CRISIL, CARE, ICRA, FITCH.**Thinly traded/Non traded securities and illiquid securities as defined in SEBI Regulations and Guidelines.
COMPOSITION BY ASSETS
^Pursuant to payment of dividend, NAV of the Dividend Option of the Plan/Scheme falls to the extent of such dividend payment and applicable statutory levy (taxes, levies, cess etc.), if any. a b $Individual/HUFs Others Past performance may or may no be sustained in the future. Face Value - ` 10/- #Since there are no investors in BOI AXA Equity Fund - Institutional Plan - Regular Dividend and Institutional Plan - Quarterly Dividend the data of NAV as on record date is not provided
$EQUITY FUNDS$HYBRID FUND
Record Date Dividend/ Unit NAV^as onDeclared (in ` ) Record Date
BOI AXA Equity Fund
Regular Plan - Regular Dividend
Regular Plan - Quarterly Dividend
Eco Plan - Regular Dividend
Eco Plan - Quarterly Dividend
Institutional Plan - #
Regular Dividend
Institutional Plan - #Quarterly Dividend
29-May-09 1.00 15.2123-September-09 1.00 15.2115-October-09 1.00 14.9625-November-09 1.00 14.3129-April-10 1.00 13.96
29-May-09 0.50 - 23-September-09 0.50 - 25-November-09 1.00 - 29-March-10 1.00 - 29-April-10 1.00 -
23-September-09 0.50 15.7325-November-09 1.00 16.4329-March-10 1.00 15.5129-April-10 1.00 15.1427-September-10 2.00 14.7027-June-11 0.50 11.41
29-May-09 1.00 15.2423-September-09 1.00 15.2415-October-09 1.00 15.0025-November-09 1.00 14.3529-April-10 1.00 13.99
23-September-09 0.50 15.7625-November-09 1.00 16.4629-March-10 1.00 15.5529-April-10 1.00 15.1927-September-10 2.00 14.7727-June-11 0.50 11.50
29-May-09 1.00 - 23-September-09 1.00 - 15-October-09 1.00 - 25-November-09 1.00 - 29-April-10 1.00 -
$EQUITY FUNDS
Record Date Dividend/ Unit NAV^as onDeclared (in ` ) Record Date
BOI AXA Tax Advantage Fund
Regular Plan
Eco Plan
04-June-09 1.00 18.8423-December-09 3.00 21.5125-January-10 3.00 18.2316-March-10 3.00 15.43
04-June-09 1.00 18.8523-December-09 3.00 21.5425-January-10 3.00 18.2716-March-10 3.00 15.45
DEBT / INCOME FUNDS
Record Date Dividend/ Unit NAV^as onDeclared (in ` ) Record Date
$BOI AXA Short Term Income FundInstitutional Monthly Dividend
Institutional - Quarterly Dividend
Regular Monthly Dividend
Regular Quarterly Dividend
a25-November-10 0.044799 10.1584
b25-November-10 0.041754 10.1584
a27-December-10 0.043921 10.1575
b27-December-10 0.040935 10.1575
a25-January-11 0.043921 10.1704
b25-January-11 0.040935 10.1704
a25-February-11 0.052705 10.1881
b25-February-11 0.049122 10.1881
a29-December-09 0.1751890 10.2708
b29-December-09 0.1630520 10.2708
a27-February-12 0.070473 10.3098
b27-February-12 0.060402 10.3098
a26-March-12 0.070473 10.2868
b26-March-12 0.060402 10.2868
a25-April-12 0.070473 10.2698
b25-April-12 0.060402 10.2698
a25-July-12 0.070473 10.3780
b25-July-12 0.060402 10.3780
a26-March-12 0.211419 10.3535
b26-March-12 0.181207 10.3535
a25-June-12 0.211419 10.2994
b25-June-12 0.181207 10.2994
Record Date Dividend/ Unit NAV^as on
Declared (in ` ) Record Date
BOI AXA Regular Return Fund
Regular Monthly Dividend
Regular Quarterly Dividend
Eco Monthly Dividend
Eco Quarterly Dividend
a26-April-2010 0.0746660 10.2992
b26-April-2010 0.0695890 10.2992
a25-October-2010 0.074666 10.3666
b25-October-2010 0.069589 10.3666
a25-November-2010 0.074666 10.2258
b25-November-2010 0.069589 10.2258
a27-December-2010 0.040406 10.1991
a27-December-2010 0.037659 10.1991
a25-March-2010 0.2233660 10.4878
b25-March-2010 0.2078920 10.4878
a29-December-2010 0.114195 10.4804
a29-December-2010 0.106431 10.4804
a26-March-2012 0.176182 10.9116
a26-March-2012 0.151006 10.9116
a25-February-2010 0.0744550 10.2741
b25-February-2010 0.0692970 10.2741
a25-March-2010 0.0744550 10.3359
b25-March-2010 0.0692970 10.3359
a26-September-2011 0.132137 10.1673
b26-September-2011 0.113255 10.1673
a26-March-2012 0.176182 10.4563
b26-March-2012 0.151006 10.4563
a25-June-2012 0.176182 10.4142
b25-June-2012 0.151006 10.4142
BOI AXA Investment Managers Pvt. Ltd.7
Dividend History

Scheme Performance (Fund Manager wise)All data as on July 31, 2012 (Unless indicated otherwise)
BOI AXA Investment Managers Pvt. Ltd.8
PERFORMANCE (as on June 29, 2012)
Period
#NAV Per Unit ( )
(Face Value ` 10)
` Scheme Returns (%) ^
Benchmark Returns
(S&P CNX Nifty) (%)
Additional Benchmark Returns (%) Scheme (`)
Current Value of Standard Investment of ` 10,000 in the
Benchmark (S&P CNX Nifty) (`)
Additional Benchmark (`)
Since inception* till June 29, 2012 (CAGR)
June 30, 2011 to June 29, 2012 (Absolute)
June 30, 2010 to June 30, 2011 (Absolute)
20.80 25.9175% 21.4020% N.A.
Not applicable
20.80 -6.4748% -6.5251% N.A.
22.24 0.2253% 6.3040% N.A.
^ Past performance may or may not be sustained in the future. *Date of first NAV - February 27, 2009. #NAV as on the last date of the respective periods above.
BOI AXA Tax Advantage Fund - Regular Plan - Growth Option (Previously known as Bharti AXA Tax Advantage Fund)
June 30, 2009 to June 30, 2010 (Absolute) 22.19 33.5942% 23.8028% N.A.
N.A.19,10121,577
PERFORMANCE (as on June 29, 2012)
Period
#NAV Per Unit ( )
(Face Value ` 10)
` Scheme Returns (%) ^
Benchmark Returns
(BSE 100 Index) (%)
Additional Benchmark
Returns (%) (S&P CNX Nifty) Scheme (`)
Current Value of Standard Investment of ` 10,000 in the
Benchmark (BSE 100 Index) (`)
Additional Benchmark (`)(S&P CNX Nifty)
Since inception* till June 29, 2012 (CAGR)
June 30, 2011 to June 29, 2012 (Absolute)
June 30, 2010 to June 30, 2011 (Absolute)
7.87 -10.8974% 0.0118% 1.3659%
Not applicable
7.87 -16.3656% -7.1583% -6.5251%
9.41 -8.8178% 3.8264% 6.3040%
^ Past performance may or may not be sustained in the future. *Date of first NAV - March 10, 2010. #NAV as on the last date of the respective periods above.
BOI AXA Focused Infrastructure Fund - Growth Option (Previously known as Bharti AXA Focused Infrastructure Fund)
10,31810,0037,663
PERFORMANCE (as on June 29, 2012)
Period
#NAV Per Unit ( )
(Face Value ` 10)
` Scheme Returns (%) ^
Benchmark Returns
(S&P CNX Nifty) (%)
Additional Benchmark Returns (%) Scheme (`)
Current Value of Standard Investment of ` 10,000 in the
Benchmark (S&P CNX Nifty) (`)
Additional Benchmark (`)
Since inception* till June 29, 2012 (CAGR)
June 30, 2011 to June 29, 2012 (Absolute)
June 30, 2010 to June 30, 2011 (Absolute)
16.50 15.9749% 20.0888% N.A. 17,223 19,573 N.A.
Not applicable
16.50 -5.8219% -6.5251% N.A.
17.52 1.4476% 6.3040% N.A.
^ Past performance may or may not be sustained in the future. *Date of first NAV - October 29, 2008. #NAV as on the last date of the respective periods above.
BOI AXA Equity Fund - Regular Plan - Growth Option (Previously known as Bharti AXA Equity Fund)
June 30, 2009 to June 30, 2010 (Absolute) 17.27 20.5164% 23.8028% N.A.
Mr. Gaurav Kapur
PERFORMANCE (as on June 29, 2012)
^ Past performance may or may not be sustained in the future. *Date of first NAV - March 20, 2009. #NAV as on the last date of the respective periods above. **The returns for Additional Benchmark in respect of debt/ liquid schemes will be published as and when made available by market data providers.
Period
#NAV Per Unit ( )
(Face Value ` 10)
` Scheme Returns (%) ^
Benchmark Returns
(CRISIL MIPBlended Index) (%)
Additional Benchmark
Returns ** (%) Scheme (`)
Current Value of Standard Investment of ` 10,000 in the
Benchmark (CRISIL MIP
Blended Index) (`)
Additional Benchmark (`)
Since inception* till June 29, 2012 (CAGR)
June 30, 2011 to June 29, 2012 (Absolute)
June 30, 2010 to June 30, 2011 (Absolute)
12.1860 6.1813% 8.6941% N.A. 12,174 13,144 N.A.
Not applicable
12.1860 6.3703% 6.5425% N.A.
11.4562 3.6835% 5.0258% N.A.
BOI AXA Regular Return Fund - Regular Plan - Growth Option (Previously known as Bharti AXA Regular Return Fund)
June 30, 2009 to June 30, 2010 (Absolute) 11.0492 2.8397% 7.6615% N.A.
Mr. Alok Singh
June 30, 2009 to June 30, 2010 (Absolute) N.A. N.A. N.A. N.A.

BOI AXA Investment Managers Pvt. Ltd.9
Scheme Performance (Fund Manager wise)All data as on July 31, 2012 (Unless indicated otherwise)
PERFORMANCE (as on June 29, 2012)
Period
#NAV Per Unit (`)
(Face Value ` 1,000)
Scheme Returns (%) ^
Benchmark Returns (CRISIL Liquid Fund
Index) (%)
Additional Benchmark Returns(CRISIL 91 Day T-Bill
Index) (%) Scheme (`)
Current Value of Standard Investment of ` 10,000 in the
Benchmark (CRISIL Liquid Fund
Index) (`)
Additional Benchmark (CRISIL 91 DayT-Bill Index) (`)
Since inception* till June 29, 2012 (CAGR)
June 30, 2011 to June 29, 2012 (Absolute)
June 30, 2010 to June 30, 2011 (Absolute)
Not applicable
^ Past performance may or may not be sustained in the future. *Date of first NAV - July 18, 2008. #NAV as on the last date of the respective periods above.
BOI AXA Liquid Fund - Institutional Plan - Growth Option (Previously known as Bharti AXA Liquid Fund)
June 30, 2009 to June 30, 2010 (Absolute)
7 Days (Simple Annualized)
15 Days (Simple Annualized)
30 Days (Simple Annualized)
1285.8657
1285.8657
1188.2924
1114.3672
6.5484%
8.2112%
6.6338%
3.9787%
6.8488%
8.6822%
7.1837%
3.2874%
5.0369%
8.0068%
4.7198%
2.3301%
8.0418%
7.8340%
7.9886%
8.3084%
8.1005%
8.2418%
7.8908%
6.8302%
8.0660%
12,848 12,992 12,143
PERFORMANCE (as on June 29, 2012)
^ Past performance may or may not be sustained in the future. *Date of first NAV - July 18, 2008. #NAV as on the last date of the respective periods above.
Period
#NAV Per Unit (`)
(Face Value ` 1,000)
Scheme Returns (%) ^
Benchmark Returns
(CRISIL Liquid FundIndex) (%)
Additional Benchmark Returns(CRISIL 91 Day T-Bill
Index) (%) Scheme (`)
Current Value of Standard Investment of ` 10,000 in the
Benchmark (CRISIL Liquid Fund
Index) (`)
Since inception* till June 29, 2012 (CAGR)
June 30, 2011 to June 29, 2012 (Absolute)
June 30, 2010 to June 30, 2011 (Absolute) Not applicable
BOI AXA Treasury Advantage Fund - Regular Plan - Growth Option (Previously known as Bharti AXA Treasury Advantage Fund)
June 30, 2009 to June 30, 2010 (Absolute)
Additional Benchmark (CRISIL 91 DayT-Bill Index) (`)
1292.0727
1292.0727
1193.1896
1116.7821
6.6801%
8.2873%
6.8418%
4.2008%
6.8488%
8.6822%
7.1837%
3.2874%
5.0369%
8.0068%
4.7198%
2.3301%
12,911 12,992 12,143
PERFORMANCE (as on June 29, 2012)
^ Past performance may or may not be sustained in the future. *Date of first NAV - December 22, 2008. #NAV as on the last date of the respective periods above.
Period
#NAV Per Unit (`)
(Face Value ` 1,000)
Scheme Returns (%) ^
Benchmark Returns
(CRISIL Short TermBond FundIndex) (%)
Additional Benchmark Returns
(CRISIL 1 Year T-Bill Index) (%) Scheme (`)
Current Value of Standard Investment of ` 10,000 in the
Benchmark (CRISIL Short Term
Bond Fund Index) (`)
Since inception* till June 29, 2012 (CAGR)
June 30, 2011 to June 29, 2012 (Absolute)
June 30, 2010 to June 30, 2011 (Absolute)
BOI AXA Short Term Income Fund - Regular Plan - Growth Option (Previously known as Bharti AXA Short Term Income Fund)
June 30, 2009 to June 30, 2010 (Absolute)
Additional Benchmark (CRISIL 1 Year T-Bill
Index) (`)
Not applicable
11,77812,62311,8254.7574%
7.7284%
4.4264%
1.9677%
6.8410%
8.8132%
5.5855%
4.8519%
4.8760%
7.5091%
6.6166%
3.9100%
12.0780
12.0780
11.2344
10.5372
Mr. Ramesh Rachuri

This report is as of July 31, 2012 unless indicated otherwise. Statements relating to outlook and forecast are the opinions of the Author. The views expressed by the
author are personal and are not necessarily that of BOI AXA Investment Managers Private Limited (AMC). This report is for information purpose only and is not
intended to be any investment advice. Please make independent research/ obtain professional help before taking any decision of investment / sale. AMC makes no
representation as to the quality, liquidity or market perception of any securities/ issuer / borrower, if described in the report above, nor does it provide any guarantee
whatsoever. Information and material used in this report are believed to be from reliable sources. However, AMC does not warrant the accuracy, reasonableness
and/or completeness of any information. AMC does not undertake to update any information or material in this report. Decisions taken by you based on the
information provided in this report are to your own account and risk. AMC and any of its officers, directors and employees shall not be liable for any loss or damage of
any nature, as also any loss of profit in any way arising from the use of this material in any manner. AMC or its directors, officers and employees, including author of
this report / persons involved in the preparation or issuance of this report may, from time to time, have long or short positions in, and buy or sell the securities, if any,
mentioned herein or have other potential conflict of interest with respect to any recommendation and related information and opinions given in the report /report. This
report, or any part of it, should not be duplicated, or contents altered / modified, in whole or in part in any form and or re-distributed without AMC’s prior written
consent.
Mutual Fund investments are subject to market risks, read all scheme related documents carefully.
© BOI AXA Investment Managers Private Limited 2012.
Disclaimer/Statutory Details
BOI AXA Investment Managers Pvt. Ltd.10

WE ARE IN NEWS

• Ahmedabad - Shop No.:- 405, 4th Floor, Zodiac Plaza, Plot no: - 229, Village Kochrab, H. L. College Road, Navrangpura, Ahmedabad - 380 009. • Bangalore - 957,
Regus Business Centre, Bangalore Pvt. Ltd., Level 9, Raheja Towers, 26 - 27, Mahatma Gandhi Road, Bangalore - 560 001. • Chandigarh - 205,
SCO-333-334, Ist Floor, Sec-35B Chandigarh - 160 022. • Chennai - Cabin No 203, Apeejay Business Center No: 39/12, Haddows Road, Nungambakkam,
Chennai - 600 006. • Hyderabad - Cabin 23, Apeejay Business Centre, Tresorie, The Park, 22 Rajbhavan Road, Somajiguda, Hyderabad - 500 082. • Jaipur - Office No.
154, First Floor, Ganpati Plaza, M. I. Road, Jaipur - 302 001. • Kolkata - Cabin 06, Block - A, 8th Floor, Apeejay House, 15 Park Street, Kolkata - 700 016.
• Lucknow - Office No-504, 5th Floor, Sriram Tower, 13 Ashok Marg, Hazratganj, Lucknow - 226 001. • Mumbai - 51, East Wing, Kalpataru Synergy, Opp. Grand Hyatt,
Vakola, Santacruz (E), Mumbai - 400 055. • New Delhi - Room No. 610, Avanta Business Center, 4th Floor, Statesman House, Barakhamba Road, Connaught Place,
New Delhi - 110 001. • Pune - Apeejay Business Centre, 1st Floor, Pride House, S.No. 108/7, Shivajinagar, University Road, Pune - 411 016. • Vadodara - 118, 1st Floor,
Siddharth Complex, R C Dutt Road, Alkapuri, Vadodara - 390 005.
• Ahmedabad - 201,Shail Building, Opp Madhusudhan House, Nr. Navrangpura Telephone Exchange, Navrangpura, Ahmedabad - 380 006. • Asansol - Hotel Ashok,
2nd Floor, 18, G. T. Road, Asansol - 713 301. • Bangalore - No : 51/25, 1st Floor, Surya Building, Ratna Avenue, Richmond Road, Bangalore - 560 025. • Baroda - SB-
4&5, Mangaldeep Complex, Opposite Mesonic Hall, Productivity Road, Alkapuri, Vadodara - 390 007. • Bhopal - Kay Kay Business Centre, 133 Zone, I M P Nagar, Bhopal
- 462 021. • Bhubaneswar - Plot No- 104/105(P), Jaydev Vihar, Besides Hotel Pal Heights, Bhubaneswar - 751 013. • Chandigarh - Sco-371-372, First Floor, Above
HDFC Bank, Sector 35B, Chandigarh - 160 022. • Chennai - Flat No F11, First Floor, Akshya Plaza,(Erstwhile Harris Road), Opp. Chief City Metropolitan Court, # 108,
Adhithanar Salai, Egmore, Chennai - 600 002. • Cochin - Room no 2, IInd Floor, Jewel Arcade, (Above Oriental Insurance Ltd), Layam Road, Cochin - 682 011.
• Coimbatore - 1057/1058, Jaya Enclave, Avanashi Road, Coimbatore - 641 018. • Dehradun - Kaulagarh Road, Near Sirmaur Marg, Above Reliance Webworld,
Dehradun - 248 001. • Gorakhpur - Above V.I.P. House, Adjacent A.D. Girls Inter College, Bank Road, Gorakhpur - 273 001. • Guwahati - 54, Sagarika Bhawan, R G
Baruah Road, (AIDC Bus Stop), Guwahati - 781 024. • Gwalior - Shindi Ki Chawani, Nadi Gate Pul, MLB Road, Gwalior - 474 001. • Hubli - 8 & 9, Upper Ground Floor, C
Block, Akshaya Park, Gokul Road, Hubli - 580 030. • Hyderabad - 8-2-596, Karvy Plaza, Avenue 4, Street No.1, Banjara Hills, Hyderabad - 500 034. • Indore - G - 7, Royal
Ratan Building, M.G. Road, Opp. Kotak Mahindra Bank, Indore - 452 010. • Jabalpur - 43, Naya Bazar, Opposite Shyam Talkies, Jabalpur - 482 001. • Jaipur - S-16 A, 3rd
Floor, Land Mark, Opposite Jaipur Club, Mahavir Marg, C-Scheme, Jaipur - 302 001. • Jamshedpur - Kanchan Tower, 3rd Floor, Chhaganlal Dayalji @ Sons, 3-S B Shop
Area, (Near Traffic Signal), Main Road, Bistupur, Jamshedpur - 831 001. • Jodhpur - 203, Modi Arcade, Chupasni Road, Jodhpur - 342 001. • Kanpur - 15/46, Opp. Muir
Mills, Civil Lines, Kanpur - 208 001. • Kolhapur - 610, K Vardhaman Chambers, 2nd Lane, Shahupuri, Kolhapur - 416 001. • Kolkata - 16, Jatin Bagchi Road, Kolkata -
700 029. • Lucknow - Usha Sadan, 24, Prem Nagar, Ashok Marg, Lucknow - 226 001. • Ludhiana - Sco-3, Bawa Building, Feroze Gandhi Market, Ludhiana - 141 001.
• Mumbai - Office Number: 01/04, 24/B, Raja Bahadur Compound, Ambalal Doshi Marg, Behind Bombay Stock Exchange, Fort, Mumbai - 400 001. • Nagpur - 1st Floor,
Sadoday Arcade, WHC Road, Above Top N Town, Dharampeth, Nagpur - 440 001. • Nashik - S-12, Second Floor, Suyojit Sankul, Sharanpur Road, Nashik - 422 002.
• New Delhi - 305, 3rd Floor, New Delhi House, Bara Khamba Road,Connaught Place, New Delhi - 110 001 • Noida - 307, Jaipuria Plaza, D 68 A, 2nd Floor, Opp Delhi
Public School, Sector 26, Noida - 201 301. • Panjim - City Business Centre, Coelho Pereira Building, Room Nos.18, 19 & 20, Dada Vaidya Road, Panjim - 403 001.
• Patna - 3A, 3rd Floor, Anand Tower, Beside Chankya Cinema Hall, Exhibition Road, Patna - 800 001. • Pune - Shop No. 16, 17 & 18, Ground Floor, Sreenath Plaza,
Dyaneshwar Paduka Chowk, F C Road, Pune - 411 004. • Raipur - Room No. TF 31, 3rd Floor, Millennium Plaza, Behind Indian Coffee House, G E Road, Raipur - 492 001.
• Rajkot - 104, Siddhi Vinayak Complex, Dr Yagnik Road, Opp Ramkrishna Ashram, Rajkot - 360 001. • Shillong - Mani Bhawan, Thana Road, Lower Police Bazar, Shillong
- 739 001. • Surat - G-6, Empire State Building, Near Parag House, Udhna Darwaja, Ring Road, Surat - 395 002. • Varanasi - D-64/132, KA 1st Floor, Anant Complex,
Sigra, Varanasi - 221 010. • Visakhapatnam - 47-14-5/1, Eswar Paradise, Dwaraka Nagar, Main Road, Visakhapatnam - 530 016.
Megabyte Business
Centre,
Karvy Computershare Private Limited Branches - Investor Service Centers (ISC's)
BOI AXA Investment Managers’ Branches - Investor Service Centers (ISC's)
AMC Website: www.boiaxa-im.com is also an Investor Service Centre (for online transactions)
Note:
1. Investors desiring to purchase/ redeem Units in BOI AXA Equity Fund, BOI AXA Tax Advantage Fund and BOI AXA Focused Infrastructure Fund through the Stock Exchange Facility may do so through Eligible Stock Brokers. Eligible Stock Brokers are considered as Official Points of Acceptance for transactions through Stock Exchange Facility.
2. Investors who are holding Units in Demat mode in above schemes may transact only through the Stock Exchange Facility. Further, such Unit holders must submit their non-financial requests such as change in bank mandate, address, etc only to their Depository Participants.
51, 5th Floor, East Wing, Kalpataru Synergy, Opp. Grand Hyatt, Vakola, Santacruz (E), Mumbai - 400 055
Toll free number : 1800-103-2263 • Alternate number : 020 - 40112300 • Website : www.boiaxa-in.com • Email : [email protected]
BOI AXA Investment Managers Pvt. Ltd.(Investment Manager for BOI AXA Mutual Fund)
Related Documents