District of Central Saanich Facility Long-Term Asset Management Plan (F-LAMP) Report No.1 – MUNICIPAL BUILDINGS Submitted by: LEVELTON CONSULTANTS LTD. June 08, 2015 Levelton File # R514-1802-00

Welcome message from author
This document is posted to help you gain knowledge. Please leave a comment to let me know what you think about it! Share it to your friends and learn new things together.
Transcript
District of Central Saanich
Facility Long-Term Asset Management Plan
(F-LAMP)
Report No.1 – MUNICIPAL BUILDINGS
Submitted by: LEVELTON CONSULTANTS LTD.
June 08, 2015 Levelton File # R514-1802-00
Levelton File # R514-1802-00
June 08, 2015
District of Central Saanich
Facility Long-Term Asset Management Plan
Report No.1 – Municipal Buildings
Page i
LEVELTON CONSULTANTS LTD.Victoria Office
760 Enterprise CrescentVictoria, BC V8Z 6R4
T: 250.475.1000 F: [email protected]
www.levelton.com
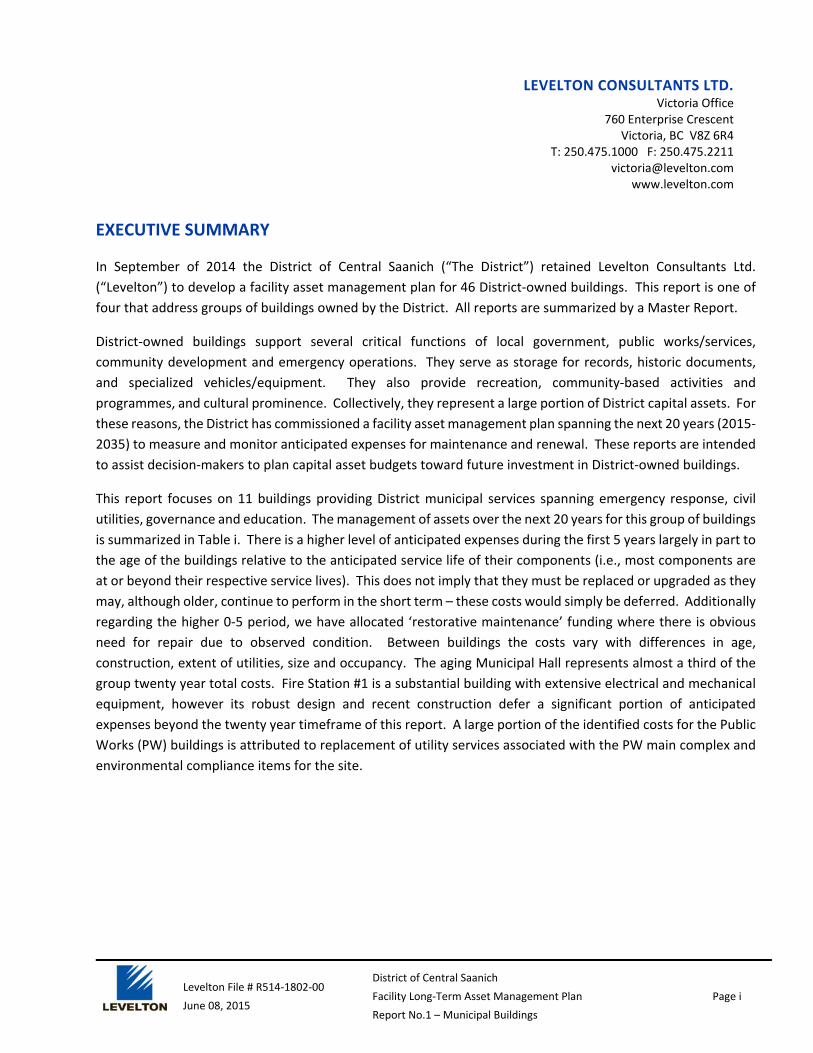
EXECUTIVE SUMMARY
In September of 2014 the District of Central Saanich (“The District”) retained Levelton Consultants Ltd.
(“Levelton”) to develop a facility asset management plan for 46 District-owned buildings. This report is one of
four that address groups of buildings owned by the District. All reports are summarized by a Master Report.
District-owned buildings support several critical functions of local government, public works/services,
community development and emergency operations. They serve as storage for records, historic documents,
and specialized vehicles/equipment. They also provide recreation, community-based activities and
programmes, and cultural prominence. Collectively, they represent a large portion of District capital assets. For
these reasons, the District has commissioned a facility asset management plan spanning the next 20 years (2015-
2035) to measure and monitor anticipated expenses for maintenance and renewal. These reports are intended
to assist decision-makers to plan capital asset budgets toward future investment in District-owned buildings.
This report focuses on 11 buildings providing District municipal services spanning emergency response, civil
utilities, governance and education. The management of assets over the next 20 years for this group of buildings
is summarized in Table i. There is a higher level of anticipated expenses during the first 5 years largely in part to
the age of the buildings relative to the anticipated service life of their components (i.e., most components are
at or beyond their respective service lives). This does not imply that they must be replaced or upgraded as they
may, although older, continue to perform in the short term – these costs would simply be deferred. Additionally
regarding the higher 0-5 period, we have allocated ‘restorative maintenance’ funding where there is obvious
need for repair due to observed condition. Between buildings the costs vary with differences in age,
construction, extent of utilities, size and occupancy. The aging Municipal Hall represents almost a third of the
group twenty year total costs. Fire Station #1 is a substantial building with extensive electrical and mechanical
equipment, however its robust design and recent construction defer a significant portion of anticipated
expenses beyond the twenty year timeframe of this report. A large portion of the identified costs for the Public
Works (PW) buildings is attributed to replacement of utility services associated with the PW main complex and
environmental compliance items for the site.
Levelton File # R514-1802-00
June 08, 2015
District of Central Saanich
Facility Long-Term Asset Management Plan
Report No.1 – Municipal Buildings
Page ii
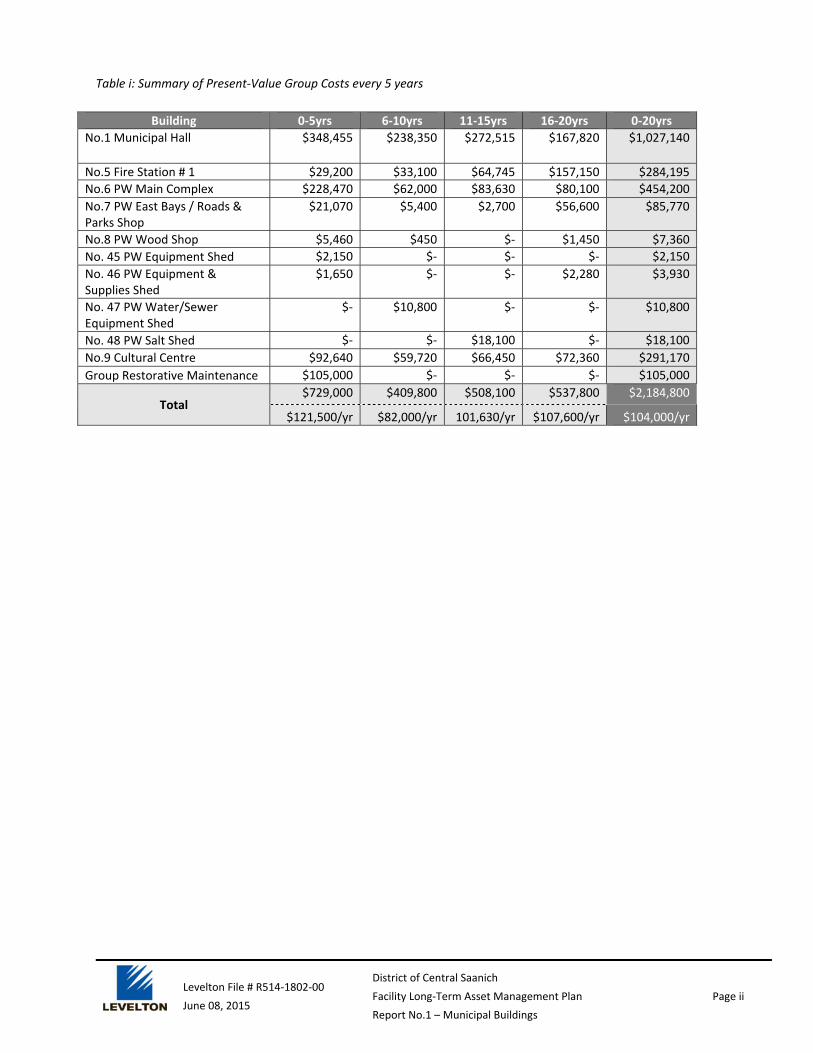
Table i: Summary of Present‐Value Group Costs every 5 years
Building 0‐5yrs 6‐10yrs 11‐15yrs 16‐20yrs 0‐20yrs
No.1 Municipal Hall $348,455 $238,350 $272,515 $167,820 $1,027,140
No.5 Fire Station # 1 $29,200 $33,100 $64,745 $157,150 $284,195
No.6 PW Main Complex $228,470 $62,000 $83,630 $80,100 $454,200
No.7 PW East Bays / Roads & Parks Shop
$21,070 $5,400 $2,700 $56,600 $85,770
No.8 PW Wood Shop $5,460 $450 $- $1,450 $7,360
No. 45 PW Equipment Shed $2,150 $- $- $- $2,150
No. 46 PW Equipment & Supplies Shed
$1,650 $- $- $2,280 $3,930
No. 47 PW Water/Sewer Equipment Shed
$- $10,800 $- $- $10,800
No. 48 PW Salt Shed $- $- $18,100 $- $18,100
No.9 Cultural Centre $92,640 $59,720 $66,450 $72,360 $291,170
Group Restorative Maintenance $105,000 $- $- $- $105,000
Total $729,000 $409,800 $508,100 $537,800 $2,184,800
$121,500/yr $82,000/yr 101,630/yr $107,600/yr $104,000/yr

Levelton File # R514-1802-00
June 08, 2015
District of Central Saanich
Facility Long-Term Asset Management Plan
Report No.1 – Municipal Buildings
Page iii
TABLE OF CONTENTS PAGE Executive Summary .................................................................................................................................................. i 1. Introduction ................................................................................................................................................ - 5 -
1.1. Terms of Reference ............................................................................................................................. - 5 - 1.2. Scope of Work ..................................................................................................................................... - 5 - 1.3. Report Organization ............................................................................................................................ - 5 - 1.4. District Objectives ............................................................................................................................... - 6 - 1.5. District Preferences ............................................................................................................................. - 7 - 1.6. Assumptions ........................................................................................................................................ - 7 -
2. Building Group No.1 .................................................................................................................................... - 8 -
2.1. Group Background .............................................................................................................................. - 8 - 2.2. Group Summary ................................................................................................................................ - 14 - 2.3. Report 1: Municipal Buildings - Restorative Maintenance ............................................................... - 16 - 2.4. Exclusions .......................................................................................................................................... - 18 -
3. Building Reporting .................................................................................................................................... - 19 -
3.1. Overall Visual Condition Summary ................................................................................................... - 19 - 3.2. Context for Planning or Deferring ..................................................................................................... - 19 - 3.3. No. 1 – Municipal Hall ....................................................................................................................... - 20 - 3.4. No. 5 – Fire Station #1 ....................................................................................................................... - 22 - 3.5. No. 6 – Public Works Main Complex ................................................................................................. - 24 - 3.6. No. 7 – Public Works East Bays / Roads & Parks Shop ...................................................................... - 27 - 3.7. No. 8 – Public Works Wood Shop ..................................................................................................... - 28 - 3.8. No. 45 – Public Works Equipment Shed ........................................................................................... - 29 - 3.9. No. 46 – Public Works Equipment & Supplies Shed ......................................................................... - 30 - 3.10. No. 47 – Public Works Water/Sewer Equipment Shed ..................................................................... - 31 - 3.11. No. 48 – Public Works Salt Shed ....................................................................................................... - 32 - 3.12. No. 49 – Public Works Environmental Compliance .......................................................................... - 33 - 3.13. No. 9 – Cultural Centre...................................................................................................................... - 34 -
List of Figures
Figure 1 : Location of Municipal Buildings ........................................................................................................ - 11 - Figure 2. Municipal Hall by Construction Phase ............................................................................................... - 12 - Figure 3 Public Works Site Plan from Municipality of Central Saanich ............................................................. - 13 - Figure 4: Projected Maintenance and Replacement Expenses (Future Value) for Municipal Group .............. - 15 - Figure 5: Effect of Maintenance on Service Life ............................................................................................... - 18 -
List of Tables
Table i: Summary of Present-Value Group Costs every 5 years ............................................................................. ii Table 1: Distribution Outline of Reports. ............................................................................................................ - 6 - Table 2: Municipal Building Group Information ................................................................................................. - 8 - Table 3: Summary of Present-Value Group Costs every 5 years ...................................................................... - 14 - Table 4: Chronological List of Top‐5 Monetary Years for Maintenance and Replacement in Municipal Buildings . - 15 - Table 5: List of Restorative Maintenance Items .............................................................................................. - 17 - Table 6: Description of Condition Statement ................................................................................................... - 19 - Table 7: Condition of Building Systems – No. 1 Municipal Hall ........................................................................ - 20 - Table 8: Summary of Present-Value Building Costs every 5 years – No.1 Municipal Hall ................................ - 22 -

Levelton File # R514-1802-00
June 08, 2015
District of Central Saanich
Facility Long-Term Asset Management Plan
Report No.1 – Municipal Buildings
Page iv
Table 9: Condition of Building Systems – No. 5 Fire Station #1 ........................................................................ - 23 - Table 10: Summary of Present-Value Building Costs every 5 years – No. 5 Fire Station #1 ............................. - 24 - Table 11: Condition of Building Systems – No. 6 Public Works Main Complex ................................................ - 25 - Table 12: Summary of Present-Value Building Costs every 5 years – No. 6 Public Works Main Complex ....... - 26 - Table 13: Condition of Building Systems – No. 7 Public Works East Bays / Roads & Parks Shop ..................... - 27 - Table 14: Summary of Present-Value Building Costs every 5 years – No. 7 Public Works East Bays/Roads & Parks Shop ......................................................................................................................................................... - 28 - Table 15: Condition of Building Systems – No. 8 Public Works Wood Shop .................................................... - 28 - Table 16: Summary of Present-Value Building Costs every 5 years – No. 8 Public Works Wood Shop ........... - 29 - Table 17: Condition of Building Systems- No. 45 Public Works Equipment Shed ............................................ - 30 - Table 18: Summary of Present-Value Building Costs every 5 years – No. 45 Public Works Equipment Shed .. - 30 - Table 19: Condition of Building Systems- No. 46 Public Works Equipment & Supplies Shed .......................... - 31 - Table 20: Summary of Present-Value Building Costs every 5 years – No. 46 Public Works Equipment & Supplies Shed .................................................................................................................................................................. - 31 - Table 21: Condition of Building Systems- No. 47 Public Works Water/Sewer Equipment Shed ...................... - 32 - Table 22: Summary of Present-Value Building Costs every 5 years–No.47 Public Works Water/Sewer Equipment Shed ................................................................................................................................................ - 32 - Table 23: Condition of Building Systems- No. 48 Public Works Salt Shed ........................................................ - 32 - Table 24: Summary of Present-Value Building Costs every 5 years – No. 48 Public Works Salt Shed ............. - 33 - Table 25: Summary of Present-Value Costs – No. 49 Public Works Environmental Compliance ..................... - 34 - Table 26: Condition of Building Systems- No. 9 Cultural Centre ...................................................................... - 34 - Table 27: Summary of Present-Value Building Costs every 5 years – No. 9 Cultural Centre ............................ - 35 -
List of Appendices
Appendix I – 20 Year Group Plan
Appendix II – Building Worksheets
Appendix III – Restorative Maintenance Photographs
Appendix IV – Building Discovery Sheet
Appendix V – Glossary of Terms
© 2015 ALL RIGHTS RESERVED
THIS DOCUMENT IS PROTECTED BY COPYRIGHT LAW AND MAY NOT BE REPRODUCED IN ANY MANNER, OR FOR ANY PURPOSE, EXCEPT BY WRITTEN
PERMISSION OF LEVELTON CONSULTANTS LTD.
Levelton File # R514-1802-00
June 08, 2015
District of Central Saanich
Facility Long-Term Asset Management Plan
Report No.1 – Municipal Buildings
Page - 5 -
1. INTRODUCTION
1.1. TERMS OF REFERENCE
In September of 2014 the District of Central Saanich (“The District”) retained Levelton Consultants Ltd.
(“Levelton”) to develop a facility asset management plan for 46 District-owned buildings.
Levelton has prepared this report solely for the use of The District. Levelton accepts no responsibility for
damages suffered by third parties as a result of decisions or actions based on this report. Levelton does not
claim to have uncovered or identified all building system deficiencies during the course of this work.
1.2. SCOPE OF WORK
Levelton conducted the scope of work provided as per the Levelton Consultants Ltd. proposal dated August 5,
2014. This scope of work included:
A start-up meeting with Levelton staff and the District to confirm intentions, priorities, methodology,
and district contacts for each building group.
Site visits to each building, accompanied by District staff or external users, gathering information on
each building system (interior finishes, building envelope, electrical, mechanical, and miscellaneous
where appropriate) condition, apparent deficiencies, restorative maintenance, and further
investigation.
A progress meeting with Levelton staff and the District to discuss findings and garner feedback
Development of a prioritized 20-year plan for each facility asset from estimated remaining service life,
last renewal date and period of renewal.
In all cases, an asset pertaining to a particular building was included if it was a part of the building’s construction
secured to the structure of the building. Some exceptions were made: for example, kitchen equipment at ball-
diamond concessions was excluded. A more detailed list of exclusions can be found in Section 2.4. Levelton
sub-contracted electrical and mechanical services to Houle Electric Ltd. and West Bay Mechanical, respectively.
Levelton coordinated the sub-contractors and incorporated their findings into the reporting.
While the collective building stock assessed consists of 46 buildings, this report addresses 11 buildings that house
public works/services, government and emergency operations, and storage of records, historic documents and
specialized vehicles/equipment. For information regarding other buildings in the asset-management plan,
please refer to the Master Report or the other three reports (Parks and Recreation, Heritage or External Users).
1.3. REPORT ORGANIZATION
Section 1 of this report provides general information regarding the scope of work, objectives, preferences and
assumptions made in the reporting.
Sections 2 and 3 of this report provide the Group and building reporting, respectively. The Group reporting gives
a high-level description of the building stock, anticipated maintenance and renewal expenses at five-year
Levelton File # R514-1802-00
June 08, 2015
District of Central Saanich
Facility Long-Term Asset Management Plan
Report No.1 – Municipal Buildings
Page - 6 -
increments over the next twenty years, and an aggregated restorative maintenance summary. Building-level
reporting in the appendices provides detail into the building system descriptions, visual review and projected
maintenance/renewal expenses pertaining to each building. Appendix II contains further detail and forecasting
for each building at an item-by-item level, while Appendix I contains forecasting for the group of buildings at the
item category level.
This report exists as one of four reports that address different groups of buildings within the District. Each report
is then summarized collectively by a Master Report. The individual buildings are each described in further detail
within their respective reports as described in Table 1. Buildings 1-3 were originally designated individually as
Administration, Police and Fire Station #2, however after discussion with The District, treating the buildings as
one collective entity, the Municipal Hall, was preferred.
Table 1: Distribution Outline of Reports.
Master Report
Report 1 Report 2 Report 3 Report 4
Municipal Parks and Recreation Heritage External Users
Buildings 1(a,b,c) – Municipal Hall 5-9, and 45-49
10 – Rom Knott and 11-19, 39 and 44
20 – Butterfield Barn and Coop and 21, 22, 23, 24, 25, 26, 27, 28, 29, 30, 31, 32, 34, 35, 36, 37, and 38
4 – Fire Museum and 40, 41, 42, and 43
Total (46) 11 12 18 5
Notes: Excluded: boat building shed (No. 33) Refer to Table 2 for buildings specific to this report. For details on all buildings refer to the ‘Building Discovery Sheet’ found in the Appendices.
Although every effort has been made to ensure that the report is appropriate for a non-technical audience, some
readers may not be familiar with the terminology used in building science. Therefore a glossary of technical
terms is included in Appendix V Glossary of Terms.
1.4. DISTRICT OBJECTIVES
District-owned buildings support several critical functions of local government, public works/services,
community development and emergency operations. They serve as storage for records, historic documents,
and specialized vehicles/equipment. Furthermore, they provide recreation, community-based activities and
programmes, and cultural prominence. Collectively, they represent a substantial portion of District capital
assets. For these reasons, the District has commissioned a facility asset management plan, spanning the next
twenty years (2015-2035), to measure and monitor anticipated expenses in maintenance and renewal Expenses
included in this report represent F-LAMP expenses. As a brief aside, F-LAMP expenses differ from operating
expenses (janitorial, annual servicing/inspection) in that they occur less frequently (upwards of 80-year renewal
periods), are financially great enough to require advance planning and funding, and their condition is
fundamental to the operation, performance, health and safety of the building.

Levelton File # R514-1802-00
June 08, 2015
District of Central Saanich
Facility Long-Term Asset Management Plan
Report No.1 – Municipal Buildings
Page - 7 -
The District has outlined the following objectives for the plan:
Create a framework for predictable expenses over the long-term
Maximize useful life of each facility
Protection of assets
Cost savings over the long term
Enhanced public safety and health
Reduced disruption of services and greater efficiencies
By performing the facility asset management plan, the following benefits are also anticipated:
Improved health and safety of all building inhabitants
Efficient building operation and performance
A productive environment for employees
Preserved integrity and character of heritage facilities
Creating a 20-year plan for District building infrastructure provides for a more informed means to obtain and
allocate funds toward their building portfolio, with subsequent clarity regarding specific action for maintenance
and renewal. These reports are intended to assist decision makers with planning of capital asset budgets toward
future investment in District-owned buildings.
1.5. DISTRICT PREFERENCES
Within the request for proposal, and at start-up and progress meetings, the District described some preferences
that were addressed within Levelton’s reporting. The general intention with the building components is
maintenance in perpetuity without renewal, a common example being diligent maintenance of wood board
siding (cleaning, substrate prep, and painting) instead of replacing the siding. Where required, renewal is
prioritized by building function and operation. Health-and-safety services such as fire, police, and government
are given greatest priority.
Preference towards heritage buildings is to maintain indefinitely at steady state, and to prevent deterioration
while preserving heritage appeal. The District generally adheres to the Government of Canada’s “Standards &
Guidelines for the Conservation of Historic Places in Canada – Second Edition” in their approach to managing the
maintenance of heritage buildings. These guidelines primarily deal with preserving the original form and
character of heritage sites, advocating repair and stabilization over replacement of components.
The District requested that costs for restorative maintenance (Section 2.3) be allocated in aggregate for each
report, rather than being an itemized list of locations and actions each with an assigned cost. Phasing
maintenance and renewal by elevation (varying exposures) was deemed too detailed for the District’s intentions
and this report. In all cases, the intended future use(s) of the building was considered when determining the
level of renewal required to fulfill the building’s remaining service life.
1.6. ASSUMPTIONS
A number of reasonable assumptions were necessary to simplify the reporting process. Where architectural
drawings were not available to perform quantity takeoffs, a measuring-wheel, measuring-tape and photographs

Levelton File # R514-1802-00
June 08, 2015
District of Central Saanich
Facility Long-Term Asset Management Plan
Report No.1 – Municipal Buildings
Page - 8 -
were used to estimate building dimensions. Where specific ages or previous maintenance of building
components were unavailable, assumptions for the next maintenance/replacement year were based on visual
review. Assumptions regarding the age of mechanical and electrical equipment were made by sub-contractors
where applicable. Where installation dates were not available from The District, the sub-contractor assigned an
age to each respective component from assessment of physical condition, generation of technology, and
technical knowledge. Estimates provided by Levelton, Houle Electric, and West Bay Mechanical are of class 4/5
nature (to feasibility). At the time of replacement it is expected that The District will seek a quotation from
specific contractors or tendering proponents.
2. BUILDING GROUP NO.1
2.1. GROUP BACKGROUND
Municipal buildings owned and managed by The District date from 1965-present. The buildings can be split into
three use/service types: government and emergency operations, public works/services, and community
services. Government and emergency services include the Municipal Hall in Saanichton (Admin, Police and Fire
Station #2) and the recently constructed Fire Station #1 near the intersection of Keating Cross Road and West
Saanich Road. The Public Works Yard includes the main complex, service bays and shops, equipment and supply
sheds, and environmental compliance infrastructure. The Cultural Centre at Brentwood Bay Village is a multi-
purpose building for community services and programs with the primary service being the District’s library.
Reference information and locations for the buildings can be found in Table 2 and Figure 1.
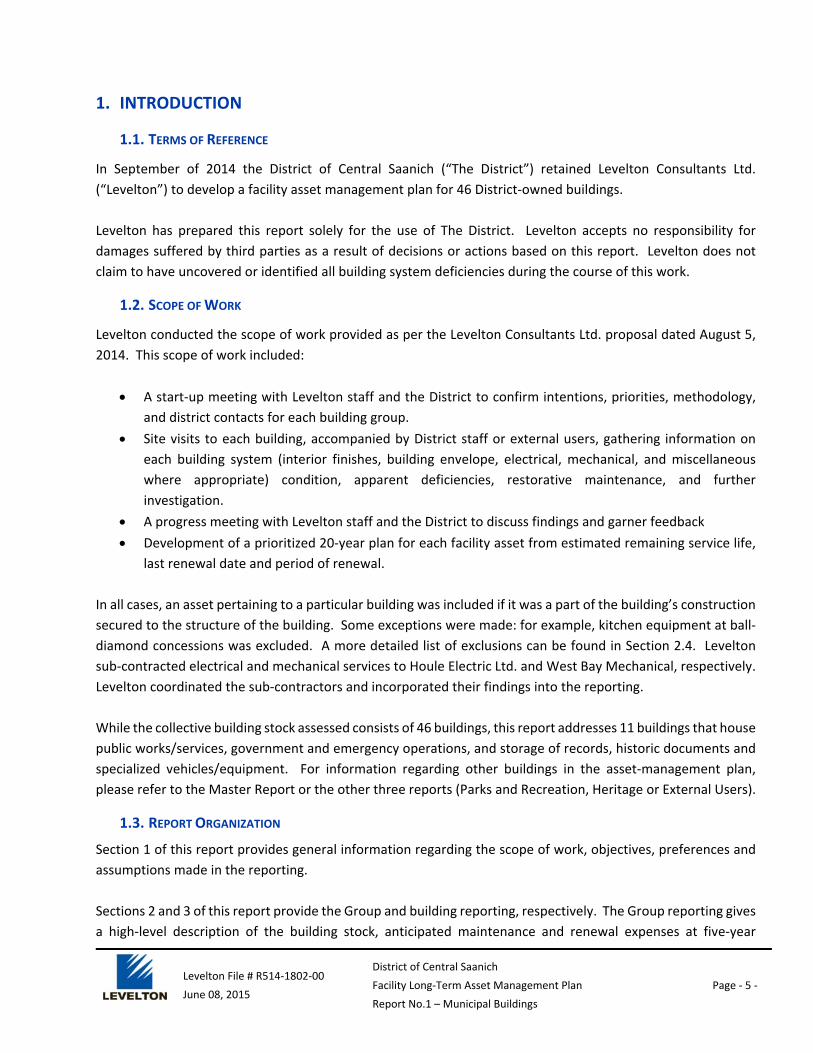
Table 2: Municipal Building Group Information
Ref No.
Building Year Built
Building Photographs CRD Atlas Aerial
Photo
Approx. Current Usage/ Occupant
Load
1 Municipal Hall (Admin/Police/Fire Stn#2)
1965, 1977, 1979
50 staff +10 visitors/ daytime workdays
5 Fire Station #1 2013
6 F/T staff 24/7
25-30 pers 5 reg.hr.days
6 Public Works Main Complex
1973
40-50 pers / day5 reg.hr.days

Levelton File # R514-1802-00
June 08, 2015
District of Central Saanich
Facility Long-Term Asset Management Plan
Report No.1 – Municipal Buildings
Page - 9 -
Ref No.
Building Year Built
Building Photographs CRD Atlas Aerial
Photo
Approx. Current Usage/ Occupant
Load
7
Public Works East Bays / Roads & Parks Shop
1974
10 pers / day 5 reg.hr.days
8 Public Works Wood Shop
1979 None, Storage.
45 Public Works Equipment Shed
1995
None, Storage
46 Public Works Equipment & Supplies Shed
1997
None, Storage
47
Public Works Water/Sewer Equipment Shed
1989/ 2010
None, Storage
48 Public Works Salt Shed
2012
None, Storage
Levelton File # R514-1802-00
June 08, 2015
District of Central Saanich
Facility Long-Term Asset Management Plan
Report No.1 – Municipal Buildings
Page - 10 -
Ref No.
Building Year Built
Building Photographs CRD Atlas Aerial
Photo
Approx. Current Usage/ Occupant
Load
49 Public Works Environmental Compliance
N/A
N/A
9 Cultural Centre
1988
Varies, 60-120 pers., 5-7 days, reg. hours some
evenings

Levelton File # R514-1802-00
June 08, 2015
District of Central Saanich
Facility Long-Term Asset Management Plan
Report No.1 – Municipal Buildings
Page - 11 -
Figure 1 : Location of Municipal Buildings
The municipal hall is the most complex building of all the buildings reported. It has been constructed in three
phases shown in Figure 2: the original administration in 1965, police department in 1977, and the fire
department and hose tower in 1979. Various alterations to the different wings of the building have occurred
over the years. Originally Levelton addressed the municipal hall as three individual buildings, however after
discussion with The District they were accrued to align with financial planning preferences.
The various years of construction and installation of building systems were still considered when modelling over
the twenty year period.
# 6‐8 & 45‐49
#1
#5
Municipal Buildings #1-Municipal Hall (Admin, Police & Fire Station #2) #5-Fire Station #1 #6-8 & 45-49 - Public Works Yard #9-Cultural Centre
#9

Levelton File # R514-1802-00
June 08, 2015
District of Central Saanich
Facility Long-Term Asset Management Plan
Report No.1 – Municipal Buildings
Page - 12 -
Figure 2. Municipal Hall by Construction Phase
1965 1977 1979
Construction Phases by Year

Levelton File # R514-1802-00
June 08, 2015
District of Central Saanich
Facility Long-Term Asset Management Plan
Report No.1 – Municipal Buildings
Page - 13 -
The Public Works Yard is comprised of seven buildings and supplemental environmental compliance
infrastructure. The yard supports water/sewer, parks and roads/drains departments as well as service to The
Districts’ vehicle fleet. The buildings are a mixture of offices, service bays, storage areas, and operation
equipment. Upon District review of the Public Works Yard it became apparent that the built infrastructure was
unique and strikingly different than most other sites/facilities in the District’s facility asset inventory. In addition
to traditional buildings, several accessory structures and outdoor spaces or “stations” exist for specialized
purposes that are integral for daily operations and are therefore included as infrastructure. These include: the
fuel dispensing system; decant wash station; internal refuse separation and brine station. These items have
previously been identified as requiring attention in order to achieve environmental compliance on-site, lending
them well to be grouped together. As the scope of the F-LAMP is limited to ‘maintenance and replacement of
building systems or equipment associated with existing buildings’, the projected timing and expenses for
maintenance, replacement and upgrading these environmental items have been assigned collectively to Building
#49-Environmental Compliance.
Figure 3 Public Works Site Plan from Municipality of Central Saanich

Levelton File # R514-1802-00
June 08, 2015
District of Central Saanich
Facility Long-Term Asset Management Plan
Report No.1 – Municipal Buildings
Page - 14 -
2.2. GROUP SUMMARY
The management of assets over the next 20 years for Report No.1, Municipal Buildings, is summarized in Table
3 where anticipated expenses are combined in five-year increments. The costs vary with differences in age,
construction, extent of utilities, size and occupancy. The aging Municipal Hall represents close to 40% of the
group twenty year total costs. Fire Station #1 is a substantial building with extensive electrical and mechanical
equipment, however its robust design and recent construction defer a significant portion of anticipated
expenses beyond the twenty year timeframe of this report. A large portion of the identified costs for the Public
Works buildings are attributed to upgrading utility services (sewer and water) at the Main Complex in the first
five years.
Table 3: Summary of Present‐Value Group Costs every 5 years
Building 0‐5yrs 6‐10yrs 11‐15yrs 16‐20yrs 0‐20yrs
No.1 Municipal Hall $348,455 $238,350 $272,515 $167,820 $1,027,140
No.5 Fire Station # 1 $29,200 $33,100 $64,745 $157,150 $284,195
No.6 PW Main Complex $228,470 $62,000 $83,630 $80,100 $454,200
No.7 PW East Bays / Roads & Parks Shop
$21,070 $5,400 $2,700 $56,600 $85,770
No.8 PW Wood Shop $5,460 $450 $- $1,450 $7,360
No. 45 PW Equipment Shed $2,150 $- $- $- $2,150
No. 46 PW Equipment & Supplies Shed
$1,650 $- $- $2,280 $3,930
No. 47 PW Water/Sewer Equipment Shed
$- $10,800 $- $- $10,800
No. 48 PW Salt Shed $- $- $18,100 $- $18,100
No.9 Cultural Centre $92,640 $59,720 $66,450 $72,360 $291,170
Group Restorative Maintenance $105,000 $- $- $- $105,000
Total $834,000 $409,800 $508,100 $537,800 $2,289,800
$139,000/yr $82,000/yr 101,630/yr $107,600/yr $109,000/yr
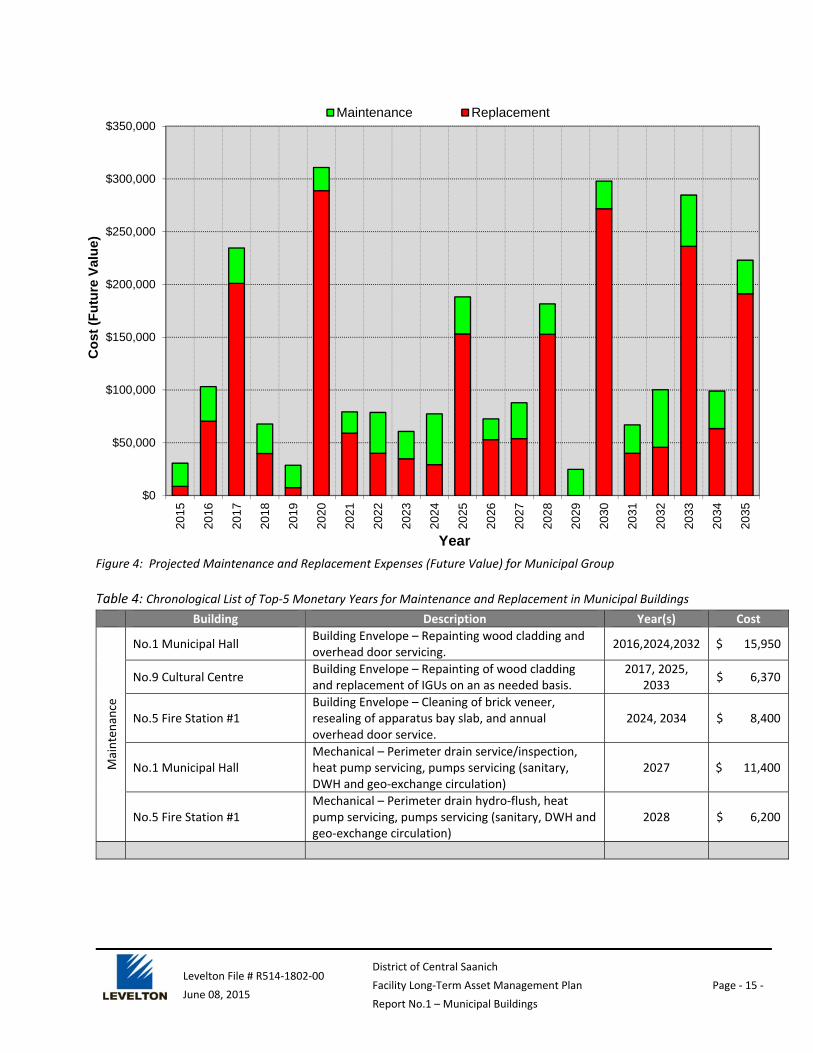
Figure 4 displays the maintenance and replacement expenses over the next 20 years. The largest expense years
are projected within the first five years and final five years. Within the first five years, large costs are occurring
from improving the Public Works infrastructure and replacing electrical and mechanical equipment at the
Municipal Hall. The large years near the end of the twenty years (2030 and 2033) can be attributed to roofing
replacement at the Municipal Hall and the beginning of electrical and mechanical equipment replacements at
the highly automated Fire Station #1. Replacement costs are more scattered, while maintenance expenses are
distributed fairly evenly over the twenty years.
The five largest monetary years for both maintenance and replacement across the group are drawn from the
forecasting tables in Appendix II and Appendix I, and are summarized chronologically in Table 4.
Levelton File # R514-1802-00
June 08, 2015
District of Central Saanich
Facility Long-Term Asset Management Plan
Report No.1 – Municipal Buildings
Page - 15 -
Figure 4: Projected Maintenance and Replacement Expenses (Future Value) for Municipal Group
Table 4: Chronological List of Top‐5 Monetary Years for Maintenance and Replacement in Municipal Buildings
Building Description Year(s) Cost
Maintenance
No.1 Municipal Hall Building Envelope – Repainting wood cladding and overhead door servicing.
2016,2024,2032 $ 15,950
No.9 Cultural Centre Building Envelope – Repainting of wood cladding and replacement of IGUs on an as needed basis.
2017, 2025, 2033
$ 6,370
No.5 Fire Station #1 Building Envelope – Cleaning of brick veneer,resealing of apparatus bay slab, and annual overhead door service.
2024, 2034 $ 8,400
No.1 Municipal Hall Mechanical – Perimeter drain service/inspection, heat pump servicing, pumps servicing (sanitary, DWH and geo-exchange circulation)
2027 $ 11,400
No.5 Fire Station #1 Mechanical – Perimeter drain hydro-flush, heat pump servicing, pumps servicing (sanitary, DWH and geo-exchange circulation)
2028 $ 6,200
$0
$50,000
$100,000
$150,000
$200,000
$250,000
$300,000
$350,000
2015
2016
2017
2018
2019
2020
2021
2022
2023
2024
2025
2026
2027
2028
2029
2030
2031
2032
2033
2034
2035
Co
st (
Fu
ture
Val
ue)
Year
Maintenance Replacement

Levelton File # R514-1802-00
June 08, 2015
District of Central Saanich
Facility Long-Term Asset Management Plan
Report No.1 – Municipal Buildings
Page - 16 -
Building Description Year(s) Cost
No.1 Municipal Hall
Electrical – Lighting fixtures, backup generator, wiring devices, electric door openers.
2016 $ 65,185
No.6 Public Services Complex Miscellaneous - Installation of new decant wash station and premise isolation at city main and decant wash station.
2017 $ 85,000
No.6 Public Services Complex Miscellaneous – Upgrade of sewer line to public works and new sewer pump station.
2020 $ 65,000
No.1 Municipal Hall Building Envelope – Three phases of SBS roofing membrane.
2025, 2030 & 2035
$ 64,120
No.5 Fire Station #1 Electrical – Interior/exterior lighting fixtures, wiring devices
2033 $ 85,800
2.3. REPORT 1: MUNICIPAL BUILDINGS ‐ RESTORATIVE MAINTENANCE
Restorative Maintenance (RM) is a term used here to relate to the identification and correction of localized
defects (components that have already failed), which if left unrepaired, may continue to deteriorate and
introduce further failure to materials adjacent to the ‘defect’. Regular maintenance such as painting is
considered ‘preventative’ as opposed to ‘restorative’. Two examples which may help illustrate the term in
greater clarity:
1. Preventative maintenance for an industrial fan would include lubricating its bearings semi-annually. If
this preventative maintenance lapses the bearings may seize and contribute to motor failure.
Restorative maintenance would include renewing the bearings and motor so that the fan assembly is
restored to good working order.
2. With the case of a building, maintenance of a wooden surface (painting) may lapse, permitting the
underlying wood to become compromised. Restorative maintenance, in the form of new wood is
preferred over repainting so that the defect is corrected and not allowed to propagate.
Restorative maintenance therefore refers to removal and reinstatement of underlying components in the near
future so that meaningful investment in regular maintenance can resume.
For each building we may report an observation of concern that relates to restorative maintenance (RM). Rather
than assigning a cost to this work, which might best be executed with other types of RM work, we have advised
that the RM work is considered relatively urgent and would best be completed within 5 years as one of a number
of potential projects. Thus, we combine individual RM project work for all buildings in this group into one
cumulative cost, which is then equally divided as an expense each year. This general allocation will allow the
District the flexibility to address RM projects individually or collectively at its discretion, with the goal that all
RM projects can be funded and completed during the next 5 years. We have, in the Master Report, combined
restorative maintenance (RM) investment for all buildings so that RM project investment from this report can
be understood as part of all RM projects for The District.
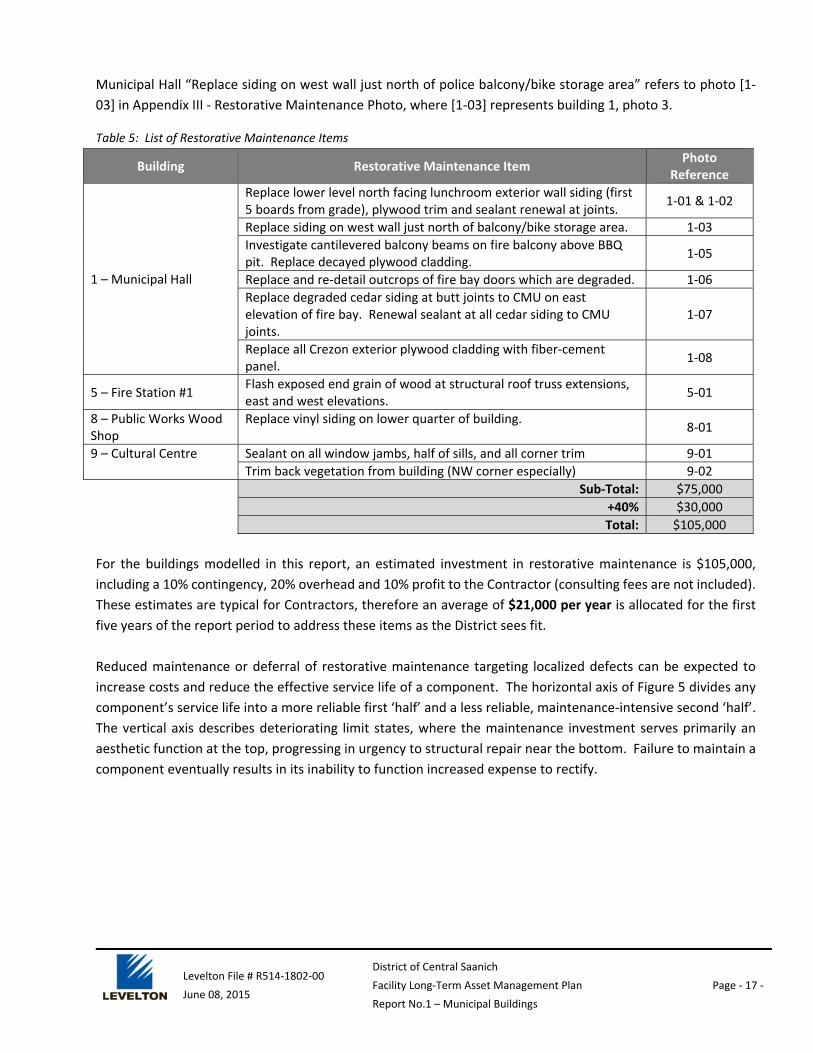
RM projects, if applicable, (excluding mechanical and electrical observations) are listed in Table 5. The RM
projects range from installing sealant at material transitions to replacing exterior plywood at the Municipal Hall
with fiber-cement panel. Each item is referenced to a photo (where available): for example, Building No.1 –
Levelton File # R514-1802-00
June 08, 2015
District of Central Saanich
Facility Long-Term Asset Management Plan
Report No.1 – Municipal Buildings
Page - 17 -
Municipal Hall “Replace siding on west wall just north of police balcony/bike storage area” refers to photo [1-
03] in Appendix III - Restorative Maintenance Photo, where [1-03] represents building 1, photo 3.
Table 5: List of Restorative Maintenance Items
Building Restorative Maintenance Item Photo
Reference
1 – Municipal Hall
Replace lower level north facing lunchroom exterior wall siding (first 5 boards from grade), plywood trim and sealant renewal at joints.
1-01 & 1-02
Replace siding on west wall just north of balcony/bike storage area. 1-03
Investigate cantilevered balcony beams on fire balcony above BBQ pit. Replace decayed plywood cladding.
1-05
Replace and re-detail outcrops of fire bay doors which are degraded. 1-06
Replace degraded cedar siding at butt joints to CMU on east elevation of fire bay. Renewal sealant at all cedar siding to CMU joints.
1-07
Replace all Crezon exterior plywood cladding with fiber-cement panel.
1-08
5 – Fire Station #1 Flash exposed end grain of wood at structural roof truss extensions, east and west elevations.
5-01
8 – Public Works Wood Shop
Replace vinyl siding on lower quarter of building.8-01
9 – Cultural Centre Sealant on all window jambs, half of sills, and all corner trim 9-01
Trim back vegetation from building (NW corner especially) 9-02
Sub‐Total: $75,000
+40% $30,000
Total: $105,000
For the buildings modelled in this report, an estimated investment in restorative maintenance is $105,000,
including a 10% contingency, 20% overhead and 10% profit to the Contractor (consulting fees are not included).
These estimates are typical for Contractors, therefore an average of $21,000 per year is allocated for the first
five years of the report period to address these items as the District sees fit.
Reduced maintenance or deferral of restorative maintenance targeting localized defects can be expected to
increase costs and reduce the effective service life of a component. The horizontal axis of Figure 5 divides any
component’s service life into a more reliable first ‘half’ and a less reliable, maintenance-intensive second ‘half’.
The vertical axis describes deteriorating limit states, where the maintenance investment serves primarily an
aesthetic function at the top, progressing in urgency to structural repair near the bottom. Failure to maintain a
component eventually results in its inability to function increased expense to rectify.

Levelton File # R514-1802-00
June 08, 2015
District of Central Saanich
Facility Long-Term Asset Management Plan
Report No.1 – Municipal Buildings
Page - 18 -
Figure 5: Effect of Maintenance on Service Life
2.4. EXCLUSIONS
During the reporting process, Levelton and The District confirmed on a number of areas that would be excluded
from the funding model. Exclusions were either due to their age, durability, user priority, renewal date beyond
20 years, low cost, or likelihood that they would be replaced promptly from an operating budget as they must
remain functional and safe. As time passes, components can be added or deleted from this list based on
changing conditions or rising repair costs; some of items excluded are listed below:
Kitchen assets such as cooking equipment (grill, fryer, exhaust).
Assets forming part of the ground-works or site infrastructure beyond the building footprint
such as perimeter fencing, roadways, parking areas, picnic tables. An exception was made for
Public Works Yard infrastructure (see section 2.1) that was deemed unique to other buidlings
in that is was vital to the operations of the Public Works buildings.
Low-voltage wiring
Washroom/change-room fixtures
Supplemental space heaters
IT equipment
Interior doors
Ceiling tile
Counters, cabinets, tables

Levelton File # R514-1802-00
June 08, 2015
District of Central Saanich
Facility Long-Term Asset Management Plan
Report No.1 – Municipal Buildings
Page - 19 -
Wall fixtures
Fixtures or components not attached to the buildings
3. BUILDING REPORTING
This section of the report addresses each building on an individual basis. The building is further broken down,
where applicable, into four main systems: interior finishes, building envelope, electrical and mechanical.
3.1. OVERALL VISUAL CONDITION SUMMARY
A visual-only review was performed for this report and study. A general condition of good, average, fair, poor
or concealed was used to describe the condition of each item as observed during the visual review. More
substantial commentary on preventative maintenance is beyond the scope of this report. However, please refer
to Table 6 for a description of the condition statements. Additionally, some restorative maintenance items may
have been noted and are commented on further in building sheets found in Appendix II.
Table 6: Description of Condition Statement
Condition Description
No Action Good
The condition of the element appears newer, may outlast its life expectancy and may potentially be replaced further into the future than anticipated.
Average The element is wearing evenly or as should be expected, based on the age and life expectancy of the material/ assembly.
Monitor Fair The element is generally “Average” and performing its intended function. However, its material integrity is no longer intact.
Action Required Poor Replacement of the element should happen before the expected life is reached.
To be Confirmed Concealed
Visual review was not possible due to access, concealment, or danger of putting the component’s performance at risk. It may require a separate follow up. The condition is therefore “Concealed” and is “To be Confirmed”. In most circumstances, we assume an “Average” condition unless we feel it appropriate to highlight an item.
3.2. CONTEXT FOR PLANNING OR DEFERRING
If Owners or users wish to defer or not renew some items, it is important to first consider the consequence of
failure for each item within the categories below. The list below describes some of the consequences of failure
for the majority of items within each component category.
1. Building Envelope: the failure to maintain an item can result in water ingress or damage to other
components or the building structure itself. As these components are constantly exposed to weather,
inaction is not recommended.
2. Mechanical failure can result in the loss of equipment as a whole, interior conditions (which affect
worker/user productivity, attendance and comfort) and in some, less common cases, a fire hazard.
3. Electrical component failure is not common, but can cause damage to electrical appliances, a fire risk,
and unexpected and potentially catastrophic loss of power requiring potential shutdown of a facility.
4. Interior finishes are typically aesthetic and their failure is predominately driven by aesthetic
requirements placed there by the users; failure of interior finishes do not typically result in further
damage to other components or greater hazards to the users. As such, it is possible for some of the
items to be postponed or deferred with little risk of further damage to other components. Cleanliness
(or the appearance thereof) may affect morale or attendance over time.

Levelton File # R514-1802-00
June 08, 2015
District of Central Saanich
Facility Long-Term Asset Management Plan
Report No.1 – Municipal Buildings
Page - 20 -
3.3. NO. 1 – MUNICIPAL HALL
3.3.1. Description
Located at 1903 Mount Newton Cross Road in the village of Saanichton, the Municipal Hall is the central building
to District administration and governance. The building is divided into three connected wings with differing
dates of construction: administration (1965), police (1977) and fire (1979). The administration wing includes
office and meeting space which includes the Mayor’s office and Council chambers. The police department also
features office space as well as a lunch room, holding cells, locker-rooms and garage/sally port areas. The fire
department (Fire Station #2) includes a large apparatus bay, hose tower, changing rooms, and meeting spaces.
The recent construction of Fire Station #1 has relocated the offices of the Fire Chief and supporting staff.
The building is two levels and features a low-sloped SBS membrane roof. All windows and storefront doors are
aluminum-framed, including a pressure plate skylight assembly at the main foyer entrance. Cladding for the
building is primary wood based with cedar siding, trim and Crezon plywood with battens. Painted concrete
masonry unit (CMU) is featured at areas such as vaults, holding cells and the fire apparatus bay. Interior flooring
is divided between linoleum public areas and carpeted staff areas. Space heat for the building is provided by
multiple heat pumps, two forced-air electric furnaces and electric baseboard. Four electric tanks supply hot
water for domestic use. Fire suppression is managed by a sprinkler system serving the prisoner holding cells and
fire extinguishers representing the remainder of the building. The electrical system is extensive and is backed
up by two generators to ensure critical services are not interrupted. In 2014 Omicron performed a ‘High Risk
Health and Deficiency Study’ of the Municipal Hall. Issues identified in the study included lack of fire resistance
ratings, seismic resistance of structures, and accessibility concerns. These items are recognized by The District
but are not considered part of the scope for this report.
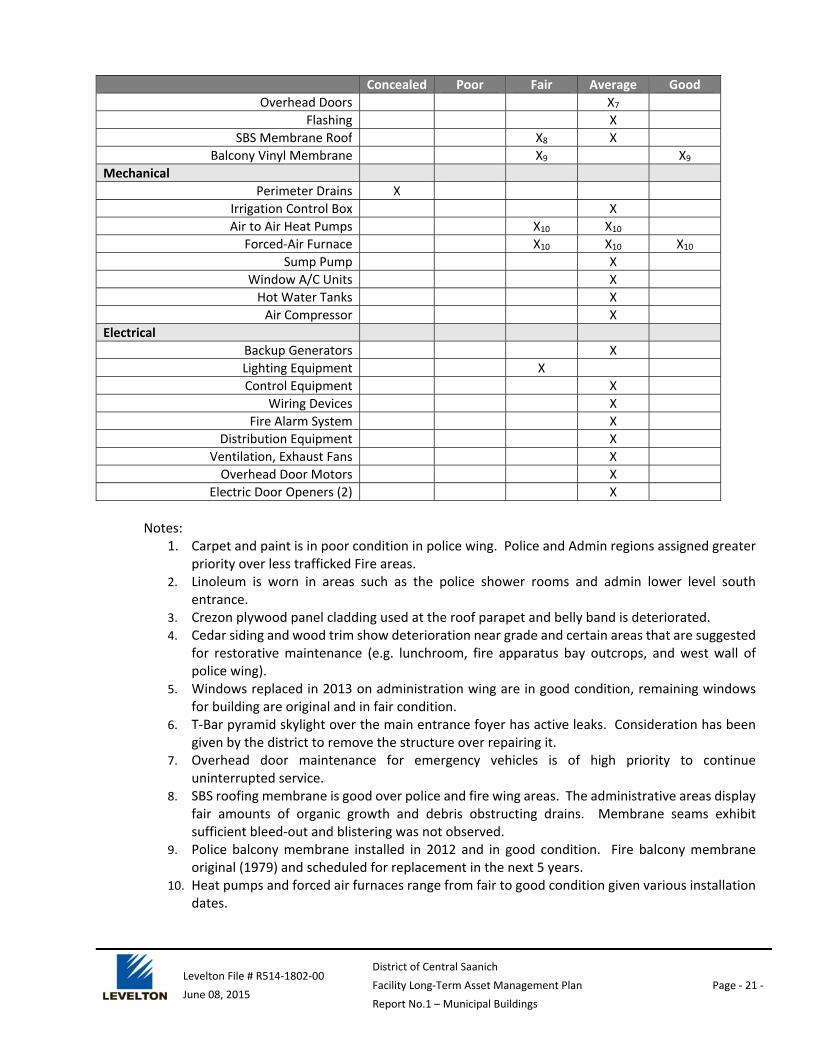
3.3.2. Visual Review
The following table refers to the visual review performed onsite by Levelton during fieldwork. The table lists the
building systems and their individual items, or group of elements as one item, and provides a statement
regarding their respective condition as observed. For the description of the condition statements refer to Table
6 in Section 3.1.
Table 7: Condition of Building Systems – No. 1 Municipal Hall
Concealed Poor Fair Average Good
Interior Finish
Interior Paint X1 X
Linoleum Flooring X2
Carpet Flooring X1 X
Building Envelope
Painted Crezon Plywood Panels X3
Cedar Siding X4
Wood Fascia Board and Trim X4
Painted CMU X
Windows, Aluminum X5 X5Storefront Door Assemblies, Aluminum X
T-Bar Skylight X6
Exterior Metal Doors X
Levelton File # R514-1802-00
June 08, 2015
District of Central Saanich
Facility Long-Term Asset Management Plan
Report No.1 – Municipal Buildings
Page - 21 -
Concealed Poor Fair Average Good
Overhead Doors X7
Flashing X
SBS Membrane Roof X8 X
Balcony Vinyl Membrane X9 X9Mechanical
Perimeter Drains X
Irrigation Control Box X
Air to Air Heat Pumps X10 X10 Forced-Air Furnace X10 X10 X10
Sump Pump X
Window A/C Units X
Hot Water Tanks X
Air Compressor X
Electrical
Backup Generators X
Lighting Equipment X
Control Equipment X
Wiring Devices X
Fire Alarm System X
Distribution Equipment X
Ventilation, Exhaust Fans X
Overhead Door Motors X
Electric Door Openers (2) X
Notes:
1. Carpet and paint is in poor condition in police wing. Police and Admin regions assigned greater priority over less trafficked Fire areas.
2. Linoleum is worn in areas such as the police shower rooms and admin lower level south entrance.
3. Crezon plywood panel cladding used at the roof parapet and belly band is deteriorated. 4. Cedar siding and wood trim show deterioration near grade and certain areas that are suggested
for restorative maintenance (e.g. lunchroom, fire apparatus bay outcrops, and west wall of police wing).
5. Windows replaced in 2013 on administration wing are in good condition, remaining windows for building are original and in fair condition.
6. T-Bar pyramid skylight over the main entrance foyer has active leaks. Consideration has been given by the district to remove the structure over repairing it.
7. Overhead door maintenance for emergency vehicles is of high priority to continue uninterrupted service.
8. SBS roofing membrane is good over police and fire wing areas. The administrative areas display fair amounts of organic growth and debris obstructing drains. Membrane seams exhibit sufficient bleed-out and blistering was not observed.
9. Police balcony membrane installed in 2012 and in good condition. Fire balcony membrane original (1979) and scheduled for replacement in the next 5 years.
10. Heat pumps and forced air furnaces range from fair to good condition given various installation dates.
Levelton File # R514-1802-00
June 08, 2015
District of Central Saanich
Facility Long-Term Asset Management Plan
Report No.1 – Municipal Buildings
Page - 22 -
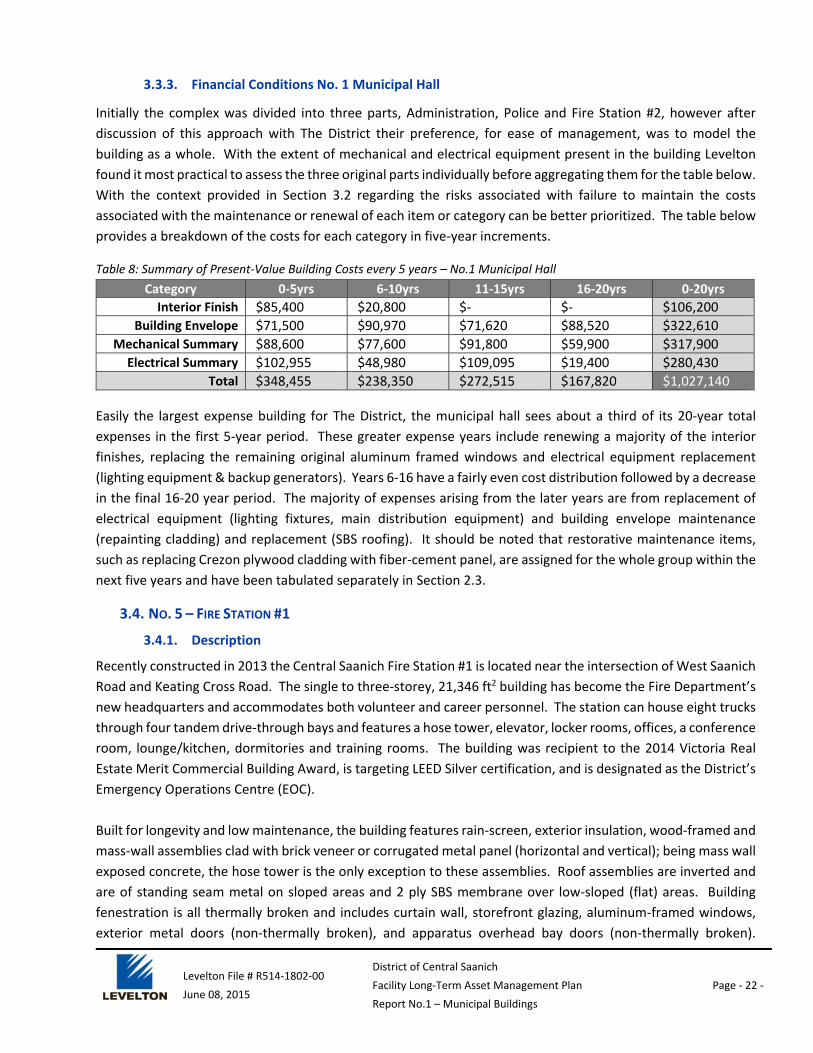
3.3.3. Financial Conditions No. 1 Municipal Hall
Initially the complex was divided into three parts, Administration, Police and Fire Station #2, however after
discussion of this approach with The District their preference, for ease of management, was to model the
building as a whole. With the extent of mechanical and electrical equipment present in the building Levelton
found it most practical to assess the three original parts individually before aggregating them for the table below.
With the context provided in Section 3.2 regarding the risks associated with failure to maintain the costs
associated with the maintenance or renewal of each item or category can be better prioritized. The table below
provides a breakdown of the costs for each category in five-year increments.
Table 8: Summary of Present‐Value Building Costs every 5 years – No.1 Municipal Hall
Category 0‐5yrs 6‐10yrs 11‐15yrs 16‐20yrs 0‐20yrs
Interior Finish $85,400 $20,800 $- $- $106,200
Building Envelope $71,500 $90,970 $71,620 $88,520 $322,610
Mechanical Summary $88,600 $77,600 $91,800 $59,900 $317,900
Electrical Summary $102,955 $48,980 $109,095 $19,400 $280,430
Total $348,455 $238,350 $272,515 $167,820 $1,027,140
Easily the largest expense building for The District, the municipal hall sees about a third of its 20-year total
expenses in the first 5-year period. These greater expense years include renewing a majority of the interior
finishes, replacing the remaining original aluminum framed windows and electrical equipment replacement
(lighting equipment & backup generators). Years 6-16 have a fairly even cost distribution followed by a decrease
in the final 16-20 year period. The majority of expenses arising from the later years are from replacement of
electrical equipment (lighting fixtures, main distribution equipment) and building envelope maintenance
(repainting cladding) and replacement (SBS roofing). It should be noted that restorative maintenance items,
such as replacing Crezon plywood cladding with fiber-cement panel, are assigned for the whole group within the
next five years and have been tabulated separately in Section 2.3.
3.4. NO. 5 – FIRE STATION #1
3.4.1. Description
Recently constructed in 2013 the Central Saanich Fire Station #1 is located near the intersection of West Saanich
Road and Keating Cross Road. The single to three-storey, 21,346 ft2 building has become the Fire Department’s
new headquarters and accommodates both volunteer and career personnel. The station can house eight trucks
through four tandem drive-through bays and features a hose tower, elevator, locker rooms, offices, a conference
room, lounge/kitchen, dormitories and training rooms. The building was recipient to the 2014 Victoria Real
Estate Merit Commercial Building Award, is targeting LEED Silver certification, and is designated as the District’s
Emergency Operations Centre (EOC).
Built for longevity and low maintenance, the building features rain-screen, exterior insulation, wood-framed and
mass-wall assemblies clad with brick veneer or corrugated metal panel (horizontal and vertical); being mass wall
exposed concrete, the hose tower is the only exception to these assemblies. Roof assemblies are inverted and
are of standing seam metal on sloped areas and 2 ply SBS membrane over low-sloped (flat) areas. Building
fenestration is all thermally broken and includes curtain wall, storefront glazing, aluminum-framed windows,
exterior metal doors (non-thermally broken), and apparatus overhead bay doors (non-thermally broken).

Levelton File # R514-1802-00
June 08, 2015
District of Central Saanich
Facility Long-Term Asset Management Plan
Report No.1 – Municipal Buildings
Page - 23 -
Interior finishes include painted gypsum board walls and sealed concrete flooring. The building features a geo-
exchange water to water heat pump system providing space heat and rooftop solar hot water preheat for
domestic hot water. A large-volume rain catch system on the east side of the building provides grey water for
use in training and testing of equipment.
3.4.2. Visual Review
The following table refers to the visual review performed onsite by Levelton during fieldwork. The table lists the
building systems and their individual items, or group of elements as one item, and provides a statement
regarding their respective condition as observed. For the description of the condition statements refer to Table
6 in Section 3.1.
Table 9: Condition of Building Systems – No. 5 Fire Station #1
Concealed Poor Fair Average Good
Interior Finish
Interior Paint X
Concrete Flooring and Finishes X
Ceramic Tiled Flooring X
Interior Doors X
Building Envelope
Brick Veneer X
Corrugated Metal Panel Siding X
Exposed Concrete (Hose Tower) X
SBS Membrane Roof X
Standing Seam Metal Roof X
Windows, Aluminum X
Storefront Door Assemblies, Aluminum X
Curtain Wall X
Exterior Metal Doors X
Overhead Doors X
Flashing X
Mechanical
Perimeter Drains and Clean Outs X
Irrigation Control Box X
Water to Water Heat Pumps X
Solar Hot Water Collector X
Tankless Domestic Hot Water X
Domestic Hot Water Storage Tanks X
Domestic Hot Water Pumps X
Sanitary Pump X
Server Room AC X
Exhaust Fan Parking Garage X
Heat Recovery Ventilator X
Exhaust Fans (Various) X
Geo-exchange Circulation Pumps X
Tankless Boiler X
Fan Coil Units X
Supply Fan Heater (Hose Tower) X
Reclaim Water Storage Tanks X

Levelton File # R514-1802-00
June 08, 2015
District of Central Saanich
Facility Long-Term Asset Management Plan
Report No.1 – Municipal Buildings
Page - 24 -
Concealed Poor Fair Average Good
Elevator X
Electrical
Backup Generator X
Lighting Equipment X
Control Equipment X
Wiring Devices X
Fire Alarm System X
Distribution Equipment X
Overhead Door Motors X
Roller Door Motor X
Hoist XNotes: The recent construction of the building has all of the building components in good condition.
3.4.3. Financial Conditions No. 5 Fire Station #1
The table below provides a breakdown of the costs for each category in five-year increments.
Table 10: Summary of Present‐Value Building Costs every 5 years – No. 5 Fire Station #1
Category 0‐5yrs 6‐10yrs 11‐15yrs 16‐20yrs 0‐20yrs
Interior Finish $- $- $- $17,550 $17,550
Building Envelope $12,000 $17,200 $12,000 $16,400 $57,600
Mechanical Summary $15,700 $14,500 $32,400 $36,150 $98,750
Electrical Summary $1,500 $1,400 $20,345 $87,050 $110,295
Total $29,200 $33,100 $64,745 $157,150 $284,195 Note: Deferral of costs should take into account relative consequence of failure, see section 3.2.
Costs progressively rise throughout the four periods as building components begin to reach 5-20 year
maintenance/replacement periods. The robust envelope design places the substantial portion of expenses on
maintenance of mechanical equipment throughout the twenty years. Much of the building envelope costs
originate from annual servicing of the eight overhead bay doors (critical to delivering emergency response
services) and mechanical HVAC equipment. Replacement costs creep into the twenty year frame in years 16-20
as electrical (lighting fixtures and wiring devices) and mechanical components (various pumps, solar hot water
collector) begin to reach estimated service lives.
3.5. NO. 6 – PUBLIC WORKS MAIN COMPLEX
3.5.1. Description
The Public Works Yard is located at 1703 Keating Cross Road. Seven buildings in the yard have been addressed
in this report along with environmental compliance infrastructure. This section deals with the main complex
located at the north edge of the site. Originally built in 1974, the complex has had additions, most recently an
upper level office/lunchroom area in 1990. The lower level contains the main office, mechanic shop and welding
bays, water/sewer shop and change rooms. The upper level is comprised of the roads office, water/sewer office,
lunch room, washrooms and balcony with exterior staircase. The building is clad on the upper level with vinyl
siding and corrugated metal panel fascia while the lower level is painted CMU. The low-sloped roof is 2-ply SBS
membrane all windows are aluminum-framed. The mechanic shop area has four overhead garage doors for
vehicle servicing needs. The building is heated by a horizontal gas furnace with supplementary baseboard heat.

Levelton File # R514-1802-00
June 08, 2015
District of Central Saanich
Facility Long-Term Asset Management Plan
Report No.1 – Municipal Buildings
Page - 25 -
Hot water for domestic and service use is provided by three electric tanks. As the building’s use is primarily
servicing, notable pieces of mechanical and electrical equipment were included in modelling such as a pressure
washer, air compressor with dryer, three vehicle lifts, and overhead door motors.
3.5.2. Visual Review
The following table refers to the visual review performed onsite by Levelton during fieldwork. The table lists the
building systems and their individual items, or group of elements as one item, and provides a statement
regarding their respective condition as observed. For the description of the condition statements refer to Table
6 in Section 3.1.
Table 11: Condition of Building Systems – No. 6 Public Works Main Complex
Concealed Poor Fair Average Good
Interior Finish
Interior Paint X1 X
Linoleum Flooring X2 X2
Building Envelope
Vinyl Siding X3 X3
Painted CMU X
Corrugated Metal Panel X
SBS Membrane Roof X4
Windows, Aluminum X
Exterior Metal Doors X
Overhead Doors X
Flashing X
Mechanical
Perimeter Drains and Clean Outs X
Air Compressor X
Air Dryer (for compressed air) X
Electric Fan Heaters (Shop) X
Horizontal Gas Furnace X
Domestic Hot Water Tanks X
Window A/C Units X
Ductless Split A/C X
Pressure Washer X
Exhaust Fans X
Fire Extinguishers X
Electrical
Lighting Equipment X5
Control Equipment X
Wiring Devices X
Baseboard Heating X
Fire Alarm System X
Distribution Equipment X6 X6
Overhead Door Motors X
Sewer Pump X8
Vehicle Lifts X

Levelton File # R514-1802-00
June 08, 2015
District of Central Saanich
Facility Long-Term Asset Management Plan
Report No.1 – Municipal Buildings
Page - 26 -
Concealed Poor Fair Average Good
Miscellaneous
Replace water line to complex & premise Isolation
N/A7
Upgrade Sewer Line and install new pump Station
X8
Notes: 1. Interior paint is in poor condition in select rooms which are scheduled to be repainted in 2015. 2. Linoleum flooring is fair condition on second level lunchroom/washrooms with some areas of lifting.
Linoleum at the main office is original (1974) and is worn, replacement there is scheduled within the next three years.
3. Vinyl siding is in poor condition along the lower course and is not secured to cross-cavity flashing in a number of locations.
4. SBS membrane replacement divided into three phases to distribute cost. 5. Lighting retrofit undertaken in 2010 on select fixtures. 6. Distribution panels 6 and 11 are original, in fair condition, and recommended for replacement in the
coming years. Remaining distribution is < 15 years in service life and in average condition. 7. N/A indicates component will be new install. 8. New pump station with a sewer line upgrade is scheduled to replace existing station that is in poor
condition.
3.5.3. Financial Conditions No. 6 Public Works Main Complex
The table below provides a summary of the costs for each category in five-year increments. Additional costs for
miscellaneous infrastructure related to the building have been included in the summary.
Table 12: Summary of Present‐Value Building Costs every 5 years – No. 6 Public Works Main Complex
Category 0‐5yrs 6‐10yrs 11‐15yrs 16‐20yrs 0‐20yrs
Interior Finish $6,980 $5,000 $- $5,000 $16,980
Building Envelope $19,200 $17,600 $21,400 $65,400 $123,600
Mechanical Summary $14,000 $24,800 $13,500 $4,700 $57,000
Electrical Summary $38,290 $14,600 $48,730 $5,000 $106,620
Misc. Summary $150,000 $- $- $- $150,000
Total $228,470 $62,000 $83,630 $80,100 $454,200
Note: Deferral of costs should take into account relative consequence of failure, see section 3.2.
The miscellaneous infrastructure items (water line with premise isolation and sewer system upgrade) represent
a substantial portion of the overall costs for the Main Complex. A part from these miscellaneous costs in the
first period, the building envelope comprises the largest category of cost. Major envelope components include
replacement of aluminum-framed windows, vinyl siding and SBS roofing membrane. Electric equipment
replacement (wiring devices, overhead door motors, vehicle lift, and lighting equipment) in the first and third
periods and mechanical equipment replacement (air compressor, furnace, and pressure-washer) in the second
period represent other significant areas of cost.

Levelton File # R514-1802-00
June 08, 2015
District of Central Saanich
Facility Long-Term Asset Management Plan
Report No.1 – Municipal Buildings
Page - 27 -
3.6. NO. 7 – PUBLIC WORKS EAST BAYS / ROADS & PARKS SHOP
3.6.1. Description
The Public Works East Bays / Roads & Parks Shop is located along the east side of the service yard at 1703 Keating
Cross Road. The 1974 building consists of a main shop area, roads shop, water/sewer bay areas and the parks
office. The building is single-storey with high bay ceiling for large vehicles and loft storage. The building is clad
with wood siding, features sloped standing seam metal roofing, aluminum-framed windows and six roll-up
garage doors. The garage areas are unfinished while the parks office features linoleum flooring and painted
gypsum wall board. A central heating system is not present given the majority of the building is unconditioned
garage, conditioned areas are space heated by portable electric heaters.
3.6.2. Visual Review
The following table refers to the visual review performed onsite by Levelton during fieldwork. The table lists the
building systems and their individual items, or group of elements as one item, and provides a statement
regarding their respective condition as observed. For the description of the condition statements refer to Table
6 in Section 3.1.
Table 13: Condition of Building Systems – No. 7 Public Works East Bays / Roads & Parks Shop
Concealed Poor Fair Average Good
Interior Finish
Interior Paint X
Linoleum Flooring X
Building Envelope
Wood Cladding (Board and Plywood) X1 X1
Wood Trim X1 X1
Standing Seam Metal Roofing X2
Windows, Aluminum X
Exterior Metal Doors X
Overhead Doors X
Mechanical
Perimeter Drains and Clean Outs X
Portable Electric Heaters X
Fire Extinguishers X
Electrical
Lighting Equipment X3 X
Wiring Devices X
Fire Alarm System X
Distribution Equipment X3 X
Overhead Door Motors X
Notes: 1. North and west walls are weathered (poor) while east walls are in average condition. 2. North portion of roof over high bays displays corrosion. 3. Component age is beyond estimated service life; component is functioning.

Levelton File # R514-1802-00
June 08, 2015
District of Central Saanich
Facility Long-Term Asset Management Plan
Report No.1 – Municipal Buildings
Page - 28 -
3.6.3. Financial Conditions No. 7 Public Works East Bays / Roads & Parks Shop
The table below provides a breakdown of the costs for each category in five-year increments.
Table 14: Summary of Present‐Value Building Costs every 5 years – No. 7 Public Works East Bays/Roads & Parks Shop
Category 0‐5yrs 6‐10yrs 11‐15yrs 16‐20yrs 0‐20yrs
Interior Finish $2,500 $- $- $- $2,500
Building Envelope $7,000 $2,800 $600 $51,600 $62,000
Mechanical Summary $2,000 $2,600 $2,000 $2,000 $8,600
Electrical Summary $9,570 $- $100 $3,000 $12,670
Total $21,070 $5,400 $2,700 $56,600 $85,770 Note: Deferral of costs should take into account relative consequence of failure, see section 3.2.
The building envelope category comprises almost three quarters of the total twenty year costs for the garage.
Major envelope components include replacement of the standing seam metal roof in the final period,
replacement of aluminum framed windows in the second period and repainting wood cladding in the first and
final 5-year periods. The costs for this building are generally kept low through greater
maintenance/replacement periods given its primary use as a storage area. Much of the electrical system is
beyond its estimated service life, including lighting equipment, wiring devices and the main distribution (panel
and breakers). These overdue items have been modelled for replacement within the first period. Mechanical
expenses are limited to perimeter drain maintenance (hydro-flush) in each five-year period.
3.7. NO. 8 – PUBLIC WORKS WOOD SHOP
3.7.1. Description
The Public Works Wood Shop building is located along the west side of the service yard, south of the main
complex. The single-storey building features one room which contains wood-working equipment and work
benches. Constructed in 1979, the building is clad with vinyl siding and gable-end vertical wood siding.
Fenestration for the building includes aluminum-framed windows, a single metal door entrance and a roll-up
garage door. The roof is sloped asphalt shingle, finished with wood fascia board at eaves. Space heat is provided
by portable electric heaters and ventilation exists in the form of a single exhaust fan.
3.7.2. Visual Review
The following table refers to the visual review performed onsite by Levelton during fieldwork. The table lists the
building systems and their individual items, or group of elements as one item, and provides a statement
regarding their respective condition as observed. For the description of the condition statements refer to Table
6 in Section 3.1.
Table 15: Condition of Building Systems – No. 8 Public Works Wood Shop
Concealed Poor Fair Average Good
Building Envelope
Vinyl Siding X1
Sloped Asphalt Shingle Roof X
Windows, Aluminum X
Exterior Metal Door X
Overhead Doors X
Levelton File # R514-1802-00
June 08, 2015
District of Central Saanich
Facility Long-Term Asset Management Plan
Report No.1 – Municipal Buildings
Page - 29 -
Concealed Poor Fair Average Good
Mechanical
Portable Electric Heaters X2
Free Standing Exhaust Fan X2
Electrical
Lighting Equipment X2
Wiring Devices X2
Distribution Equipment X
Notes: 1. Blistering of vinyl near grade. Most prevalent along south elevation. 2. Component age is beyond estimated service life.
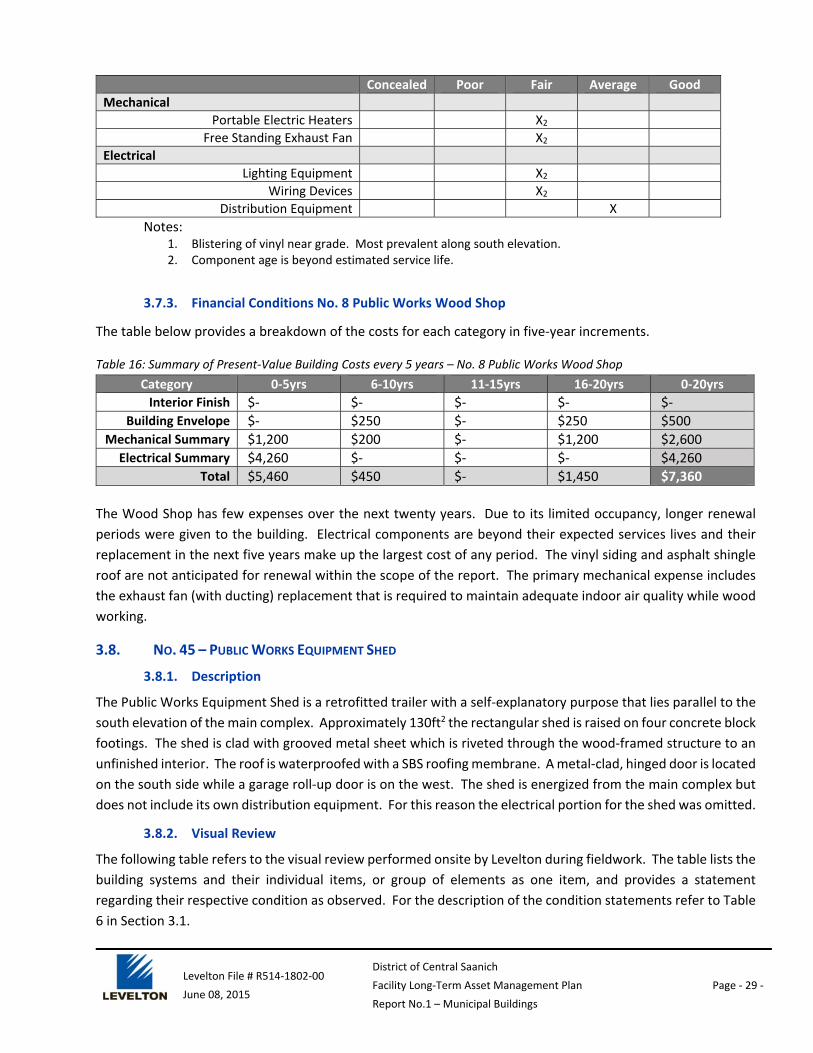
3.7.3. Financial Conditions No. 8 Public Works Wood Shop
The table below provides a breakdown of the costs for each category in five-year increments.
Table 16: Summary of Present‐Value Building Costs every 5 years – No. 8 Public Works Wood Shop
Category 0‐5yrs 6‐10yrs 11‐15yrs 16‐20yrs 0‐20yrs
Interior Finish $- $- $- $- $-
Building Envelope $- $250 $- $250 $500
Mechanical Summary $1,200 $200 $- $1,200 $2,600
Electrical Summary $4,260 $- $- $- $4,260
Total $5,460 $450 $- $1,450 $7,360
The Wood Shop has few expenses over the next twenty years. Due to its limited occupancy, longer renewal
periods were given to the building. Electrical components are beyond their expected services lives and their
replacement in the next five years make up the largest cost of any period. The vinyl siding and asphalt shingle
roof are not anticipated for renewal within the scope of the report. The primary mechanical expense includes
the exhaust fan (with ducting) replacement that is required to maintain adequate indoor air quality while wood
working.
3.8. NO. 45 – PUBLIC WORKS EQUIPMENT SHED
3.8.1. Description
The Public Works Equipment Shed is a retrofitted trailer with a self-explanatory purpose that lies parallel to the
south elevation of the main complex. Approximately 130ft2 the rectangular shed is raised on four concrete block
footings. The shed is clad with grooved metal sheet which is riveted through the wood-framed structure to an
unfinished interior. The roof is waterproofed with a SBS roofing membrane. A metal-clad, hinged door is located
on the south side while a garage roll-up door is on the west. The shed is energized from the main complex but
does not include its own distribution equipment. For this reason the electrical portion for the shed was omitted.
3.8.2. Visual Review
The following table refers to the visual review performed onsite by Levelton during fieldwork. The table lists the
building systems and their individual items, or group of elements as one item, and provides a statement
regarding their respective condition as observed. For the description of the condition statements refer to Table
6 in Section 3.1.
Levelton File # R514-1802-00
June 08, 2015
District of Central Saanich
Facility Long-Term Asset Management Plan
Report No.1 – Municipal Buildings
Page - 30 -
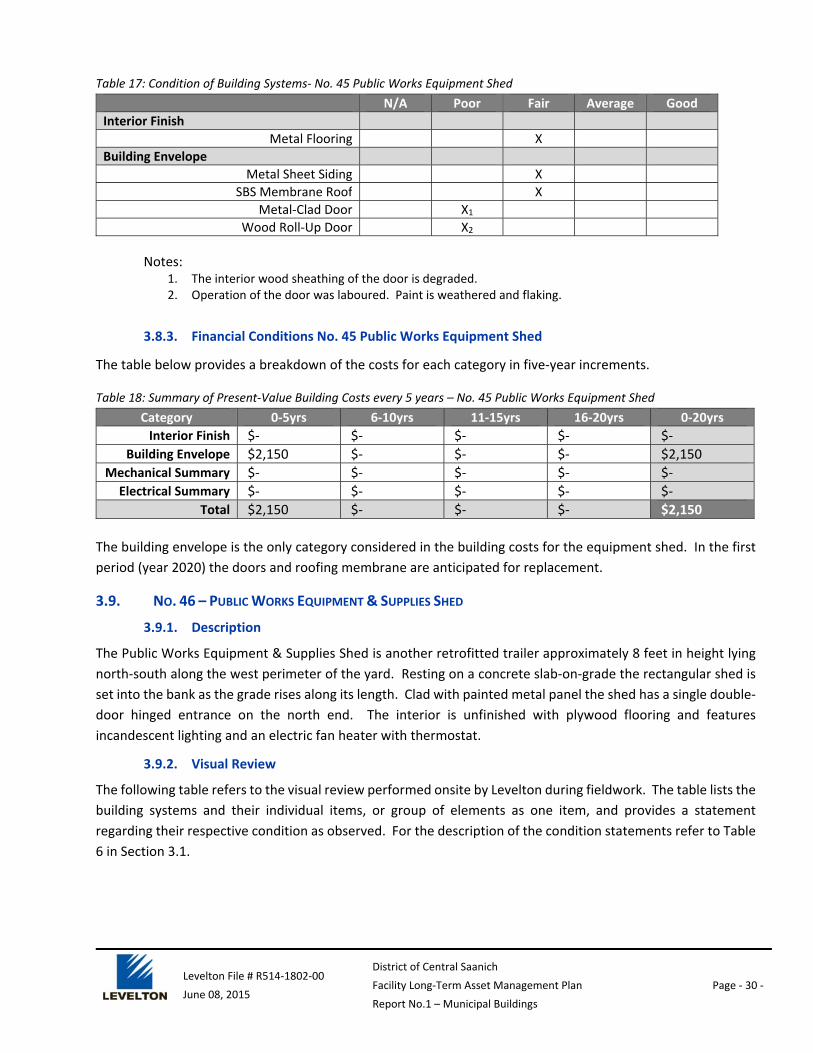
Table 17: Condition of Building Systems‐ No. 45 Public Works Equipment Shed
N/A Poor Fair Average Good
Interior Finish
Metal Flooring X
Building Envelope
Metal Sheet Siding X
SBS Membrane Roof X
Metal-Clad Door X1
Wood Roll-Up Door X2
Notes: 1. The interior wood sheathing of the door is degraded. 2. Operation of the door was laboured. Paint is weathered and flaking.
3.8.3. Financial Conditions No. 45 Public Works Equipment Shed
The table below provides a breakdown of the costs for each category in five-year increments.
Table 18: Summary of Present‐Value Building Costs every 5 years – No. 45 Public Works Equipment Shed
Category 0‐5yrs 6‐10yrs 11‐15yrs 16‐20yrs 0‐20yrs
Interior Finish $- $- $- $- $-
Building Envelope $2,150 $- $- $- $2,150
Mechanical Summary $- $- $- $- $-
Electrical Summary $- $- $- $- $-
Total $2,150 $- $- $- $2,150
The building envelope is the only category considered in the building costs for the equipment shed. In the first
period (year 2020) the doors and roofing membrane are anticipated for replacement.
3.9. NO. 46 – PUBLIC WORKS EQUIPMENT & SUPPLIES SHED
3.9.1. Description
The Public Works Equipment & Supplies Shed is another retrofitted trailer approximately 8 feet in height lying
north-south along the west perimeter of the yard. Resting on a concrete slab-on-grade the rectangular shed is
set into the bank as the grade rises along its length. Clad with painted metal panel the shed has a single double-
door hinged entrance on the north end. The interior is unfinished with plywood flooring and features
incandescent lighting and an electric fan heater with thermostat.
3.9.2. Visual Review
The following table refers to the visual review performed onsite by Levelton during fieldwork. The table lists the
building systems and their individual items, or group of elements as one item, and provides a statement
regarding their respective condition as observed. For the description of the condition statements refer to Table
6 in Section 3.1.
Levelton File # R514-1802-00
June 08, 2015
District of Central Saanich
Facility Long-Term Asset Management Plan
Report No.1 – Municipal Buildings
Page - 31 -
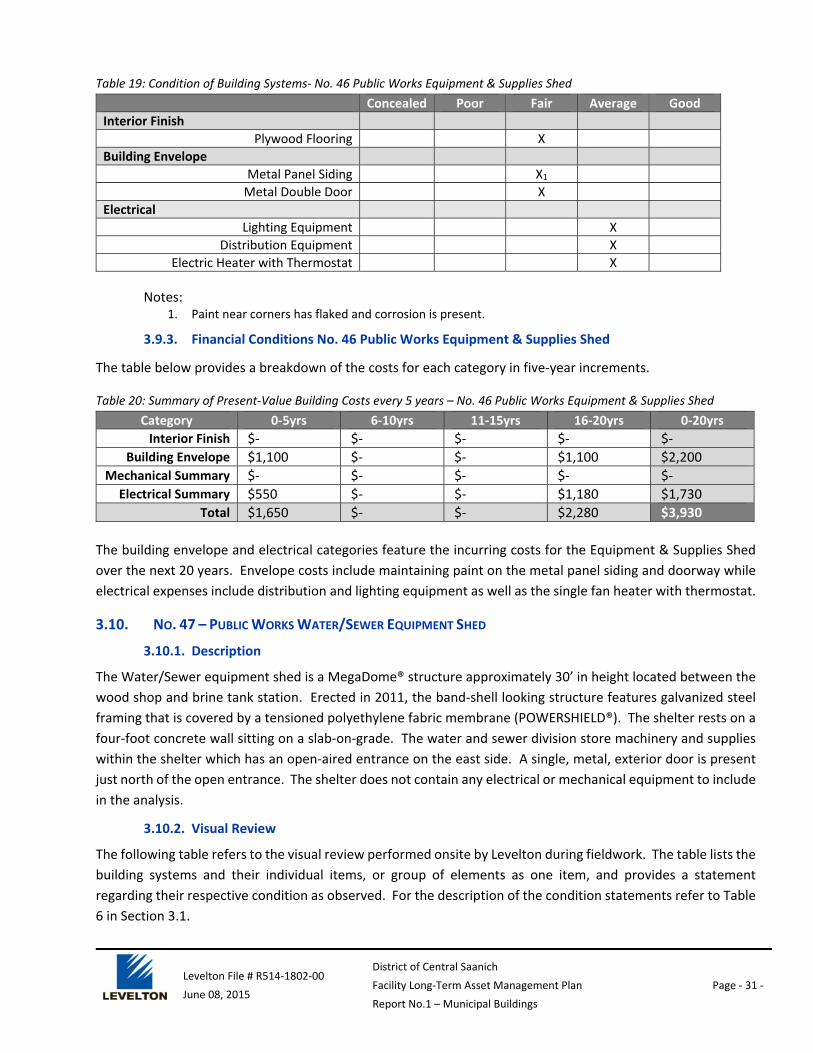
Table 19: Condition of Building Systems‐ No. 46 Public Works Equipment & Supplies Shed
Concealed Poor Fair Average Good
Interior Finish
Plywood Flooring X
Building Envelope
Metal Panel Siding X1
Metal Double Door X
Electrical
Lighting Equipment X
Distribution Equipment X
Electric Heater with Thermostat X
Notes: 1. Paint near corners has flaked and corrosion is present.
3.9.3. Financial Conditions No. 46 Public Works Equipment & Supplies Shed
The table below provides a breakdown of the costs for each category in five-year increments.
Table 20: Summary of Present‐Value Building Costs every 5 years – No. 46 Public Works Equipment & Supplies Shed
Category 0‐5yrs 6‐10yrs 11‐15yrs 16‐20yrs 0‐20yrs
Interior Finish $- $- $- $- $-
Building Envelope $1,100 $- $- $1,100 $2,200
Mechanical Summary $- $- $- $- $-
Electrical Summary $550 $- $- $1,180 $1,730
Total $1,650 $- $- $2,280 $3,930
The building envelope and electrical categories feature the incurring costs for the Equipment & Supplies Shed
over the next 20 years. Envelope costs include maintaining paint on the metal panel siding and doorway while
electrical expenses include distribution and lighting equipment as well as the single fan heater with thermostat.
3.10. NO. 47 – PUBLIC WORKS WATER/SEWER EQUIPMENT SHED
3.10.1. Description
The Water/Sewer equipment shed is a MegaDome® structure approximately 30’ in height located between the
wood shop and brine tank station. Erected in 2011, the band-shell looking structure features galvanized steel
framing that is covered by a tensioned polyethylene fabric membrane (POWERSHIELD®). The shelter rests on a
four-foot concrete wall sitting on a slab-on-grade. The water and sewer division store machinery and supplies
within the shelter which has an open-aired entrance on the east side. A single, metal, exterior door is present
just north of the open entrance. The shelter does not contain any electrical or mechanical equipment to include
in the analysis.
3.10.2. Visual Review
The following table refers to the visual review performed onsite by Levelton during fieldwork. The table lists the
building systems and their individual items, or group of elements as one item, and provides a statement
regarding their respective condition as observed. For the description of the condition statements refer to Table
6 in Section 3.1.

Levelton File # R514-1802-00
June 08, 2015
District of Central Saanich
Facility Long-Term Asset Management Plan
Report No.1 – Municipal Buildings
Page - 32 -
Table 21: Condition of Building Systems‐ No. 47 Public Works Water/Sewer Equipment Shed
Concealed Poor Fair Average Good
Building Envelope
POWERSHIELD® Membrane X
Galvanized Steel Framing X
Exposed Concrete X
3.10.3. Financial Conditions No. 47 Public Works Water/Sewer Equipment Shed
The table below provides a breakdown of the costs for each category in five-year increments.
Table 22: Summary of Present‐Value Building Costs every 5 years–No.47 Public Works Water/Sewer Equipment Shed
Category 0‐5yrs 6‐10yrs 11‐15yrs 16‐20yrs 0‐20yrs
Interior Finish $- $- $- $- $-
Building Envelope $- $10,800 $- $- $10,800
Mechanical Summary $- $- $- $- $-
Electrical Summary $- $- $- $- $-
Total $- $10,800 $- $- $10,800
Costs for this building are limited to the building envelope given its use and lack of electrical or mechanical
equipment. The majority of the total 20-year costs are seen from the renewal of the POWERSHIELD® membrane
in 2025. During the membrane renewal maintenance costs associated with the concrete foundation wall and
steel framing are also expected.
3.11. NO. 48 – PUBLIC WORKS SALT SHED
3.11.1. Description
The Public Works Salt Shed is nearly identical to building No.47, a MegaDome® structure consisting of galvanized
steel framing covered in tensioned polyethylene fabric membrane (POWERSHIELD®). The 2013 structure rests
on a perimeter wall of standard, keyed, concrete lock-block stacked three units high which are protected on the
interior face with a protective coating. Lock-block is also present along the centre of the sheltered bay to provide
separation between the two materials, brine salt and road salt/sand, presently stored there. The MegaDome®
is completely open aired on the east side for material access. The shelter does not contain any electrical or
mechanical equipment to include in the analysis.
3.11.2. Visual Review
The following table refers to the visual review performed onsite by Levelton during fieldwork. The table lists the
building systems and their individual items, or group of elements as one item, and provides a statement
regarding their respective condition as observed. For the description of the condition statements refer to Table
6 in Section 3.1.
Table 23: Condition of Building Systems‐ No. 48 Public Works Salt Shed
Concealed Poor Fair Average Good
Building Envelope
POWERSHIELD® Membrane X
Galvanized Steel Framing X
Standard Keyed Concrete Lock-Block X

Levelton File # R514-1802-00
June 08, 2015
District of Central Saanich
Facility Long-Term Asset Management Plan
Report No.1 – Municipal Buildings
Page - 33 -
3.11.3. Financial Conditions No. 48 Public Works Salt Shed
The table below provides a breakdown of the costs for each category in five-year increments.
Table 24: Summary of Present‐Value Building Costs every 5 years – No. 48 Public Works Salt Shed
Category 0‐5yrs 6‐10yrs 11‐15yrs 16‐20yrs 0‐20yrs
Interior Finish $- $- $- $- $-
Building Envelope $- $- $18,100 $- $18,100
Mechanical Summary $- $- $- $- $-
Electrical Summary $- $- $- $- $-
Total $- $- $18,100 $- $18,100
Costs for this building are similar to Building No.47 by design and are limited to the building envelope given its
use and lack of electrical or mechanical equipment. The majority of the total 20-year costs are seen from the
renewal of the POWERSHIELD® membrane in 2027. During the membrane renewal maintenance costs
associated with the concrete lock-block wall and steel framing are also expected.
3.12. NO. 49 – PUBLIC WORKS ENVIRONMENTAL COMPLIANCE
3.12.1. Description
As previously mentioned in Section 2.1, after consideration by The District, a number of environmental
compliance infrastructure items pertaining to operations of the Public Works Yard were noted for inclusion in
F-LAMP reporting. The items are included here for reference only (not included in F-LAMP financial analysis) as
their funding will be sourced separately to F-LAMP items. Environmental compliance items include: the fuel
dispensing system; decant wash station; internal refuse separation and brine station. All of these items have
previously been identified as requiring attention in order to achieve environmental compliance on-site. The
scope of future work related to these items includes:
Decommissioning existing below-grade fuel tanks in two phases and replacing with equivalent, or greater capacity, above-grade tanks.
Installing premise isolation at the decant wash station.
Installing MegaDome® shelters over the decant wash and brine farm stations.
Installing 12 industrial dumpsters for sorting of internal refuse with a slab on grade footing.
The timeline for these items has been expressed within the Public Works 5-year plan.
3.12.2. Financial Conditions No. 49 Public Works Environmental Compliance
The table below summarizes the, reference only, miscellaneous environmental compliance items in the coming
years.

Levelton File # R514-1802-00
June 08, 2015
District of Central Saanich
Facility Long-Term Asset Management Plan
Report No.1 – Municipal Buildings
Page - 34 -
Table 25: Summary of Present‐Value Costs – No. 49 Public Works Environmental Compliance
Category 2015 2016 2017 2018 2019
Brine Station $20,000
Decant Wash Station $60,000
Internal Refuse Separation $30,000
Replace Fuel Dispensing System $120,000
Decommission below‐grade fuel tanks (Phase 1)
$50,000
Decommission below‐grade fuel tanks (Phase 2)
$190,000
Total $120,000 $50,000 $190,000 $50,000 $60,000
Note: Values shown here are Class 4/5 estimates and are provided for planning purposes only.
3.13. NO. 9 – CULTURAL CENTRE
3.13.1. Description
The District’s Cultural Centre is located at 1209 Clarke Road in Brentwood Bay village. Just west of West Saanich
School (Building No.38), the centre is connected to The Centre for Active Living (Building No. 41). The centre
contains the Public library, washrooms and two activity rooms (50-75 person capacity) that are available for
recreational use, community programs or private rental. Constructed in 1988, this single storey building with
basement features a cupola for additional day-lighting over the library area and is clad entirely with wood siding
and trim. The majority of the roof is low-sloped SBS membrane while the cupola area over the library is asphalt
shingle. Windows are aluminum-framed with wood trim and exterior doors are metal or metal with glazing
inserts. Interior flooring consists of linoleum throughout foyers, corridors, staff/lunchroom, activity room B,
washrooms and stairwells. Carpeting is present in activity room A and the library. Air to air heat pumps
condition the building, while space and baseboard heaters provide supplemental heat when needed.
3.13.2. Visual Review
The following table refers to the visual review performed onsite by Levelton during fieldwork. The table lists the
building systems and their individual items, or group of elements as one item, and provides a statement
regarding their respective condition as observed. For the description of the condition statements refer to Table
6 in Section 3.1.
Table 26: Condition of Building Systems‐ No. 9 Cultural Centre
Concealed Poor Fair Average Good
Interior Finish
Interior Paint X
Linoleum Flooring X
Carpeting X
Interior Doors X
Building Envelope
Wood Siding X1
Wood Trim X2
SBS Membrane Roof X3
Sloped Asphalt Shingle Roof X
Windows, Aluminum X4

Levelton File # R514-1802-00
June 08, 2015
District of Central Saanich
Facility Long-Term Asset Management Plan
Report No.1 – Municipal Buildings
Page - 35 -
Concealed Poor Fair Average Good
Storefront Door Assemblies, Aluminum X
Exterior Metal Doors X
Flashing X
Mechanical
Perimeter Drains and Clean Outs X
Irrigation Control Box X
Air to Air Heat Pumps X
Space Heaters – Force Flow X
Hot Water Tank X
Exhaust Fans (Various) X
Electrical
Lighting Equipment X5
Control Equipment X
Wiring Devices X
Fire Alarm System X
Distribution Equipment X
Electric Entrance Door Opener X
Notes:
1. Paint is worn in areas, south elevations in particular. 2. Trim at several corners and library cupola recommended for replacement. 3. SBS membrane over activity room A exhibits alligatoring, other areas are in average condition. 4. Failed glazing units (condensation between panes) noted in lunchroom and library. 5. T-8 lighting retrofit in 2009.
3.13.3. Financial Conditions No. 9 Cultural Centre
The table below provides a breakdown of the costs for each category in five-year increments.
Table 27: Summary of Present‐Value Building Costs every 5 years – No. 9 Cultural Centre
Category 0‐5yrs 6‐10yrs 11‐15yrs 16‐20yrs 0‐20yrs
Interior Finish $23,880 $- $32,130 $- $56,010
Building Envelope $12,690 $30,570 $2,750 $43,710 $89,720
Mechanical Summary $4,400 $13,050 $7,850 $27,400 $52,700
Electrical Summary $51,670 $16,100 $23,720 $1,250 $92,740
Total $92,640 $59,720 $66,450 $72,360 $291,170
Building envelope and electrical categories constitute the majority of expected expenses, (roughly two thirds),
for the Cultural Centre. Large items within these categories include light fixture replacement in the first 5-year
period and roofing (SBS membrane and asphalt shingles) replacement in the second and final periods.
Supplementary building envelope expenses include repainting exterior cladding every eight years and ongoing
glazing unit replacement. Repainting interior walls and replacement of flooring makeup the interior finish costs
shown. Mechanical expenses are relatively low during the first three periods until the final period where heat
pump replacement is expected. In terms of overall expenses the first period is the largest while the following
three are fairly consistent.
Levelton File # R514-1802-00
June 08, 2015
District of Central Saanich
Facility Long-Term Asset Management Plan
Report No.1 – Municipal Buildings
APPENDIX I 20‐YEAR GROUP PLAN
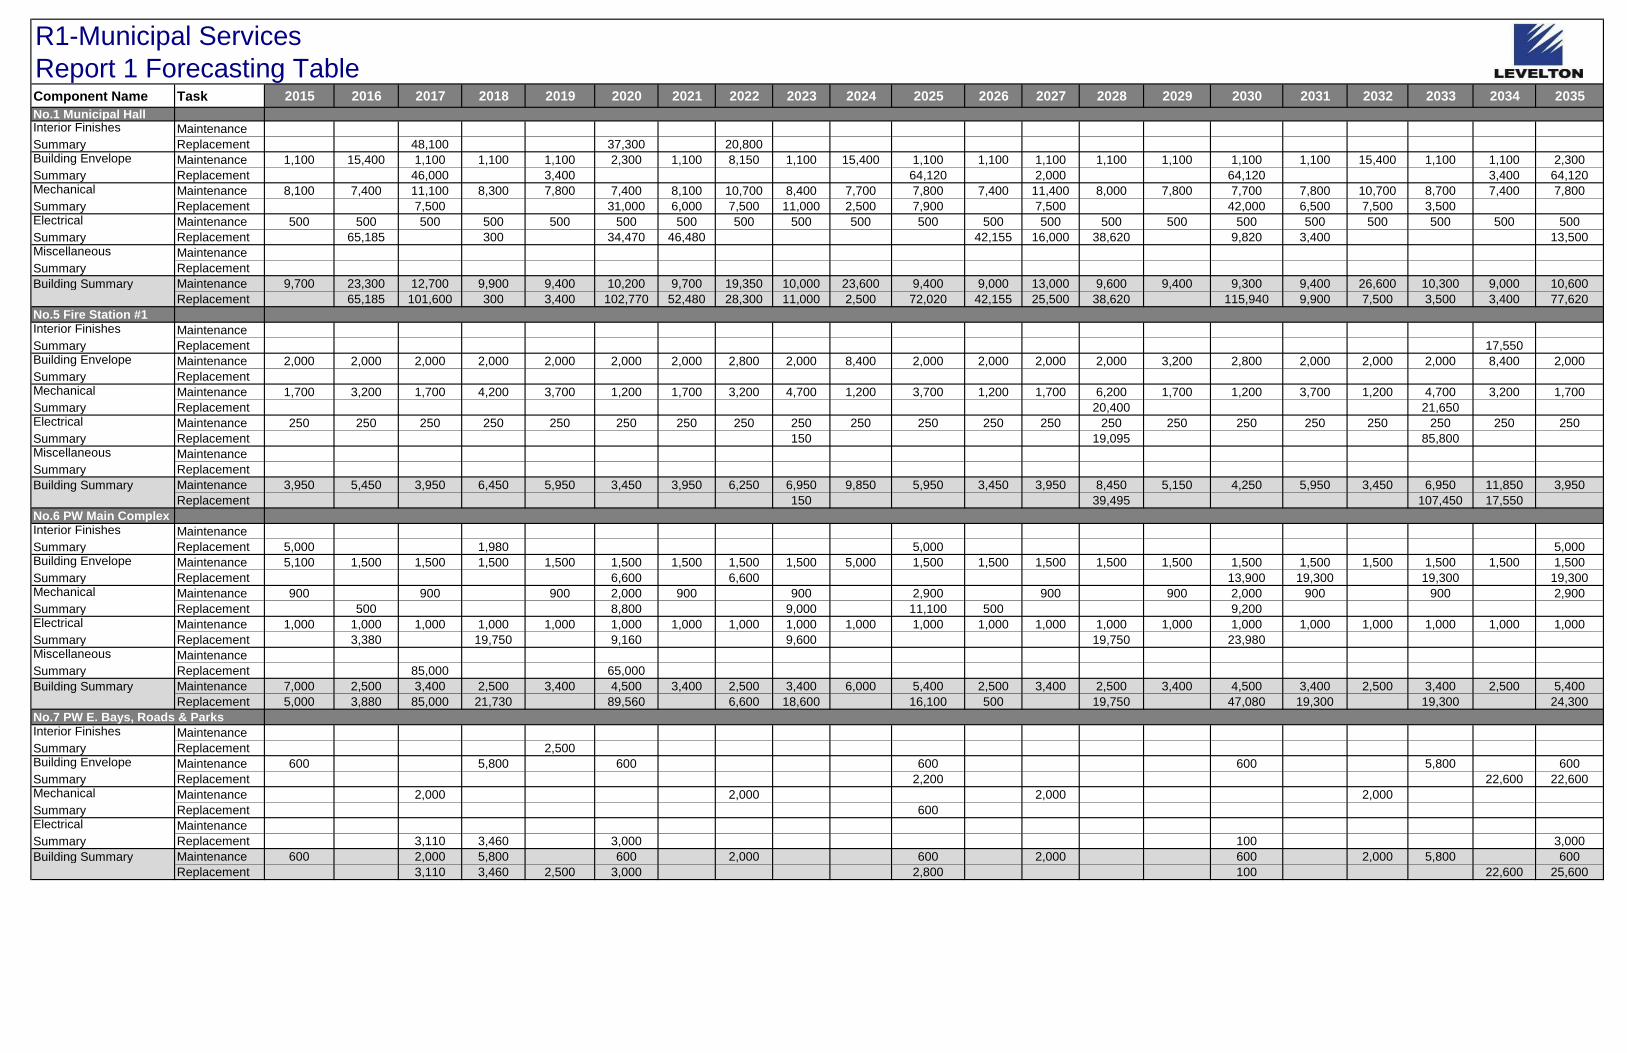
R1-Municipal Services
Report 1 Forecasting TableComponent Name Task 2015 2016 2017 2018 2019 2020 2021 2022 2023 2024 2025 2026 2027 2028 2029 2030 2031 2032 2033 2034 2035
No.1 Municipal HallInterior Finishes Maintenance
Summary Replacement 48,100 37,300 20,800Building Envelope Maintenance 1,100 15,400 1,100 1,100 1,100 2,300 1,100 8,150 1,100 15,400 1,100 1,100 1,100 1,100 1,100 1,100 1,100 15,400 1,100 1,100 2,300
Summary Replacement 46,000 3,400 64,120 2,000 64,120 3,400 64,120Mechanical Maintenance 8,100 7,400 11,100 8,300 7,800 7,400 8,100 10,700 8,400 7,700 7,800 7,400 11,400 8,000 7,800 7,700 7,800 10,700 8,700 7,400 7,800
Summary Replacement 7,500 31,000 6,000 7,500 11,000 2,500 7,900 7,500 42,000 6,500 7,500 3,500Electrical Maintenance 500 500 500 500 500 500 500 500 500 500 500 500 500 500 500 500 500 500 500 500 500
Summary Replacement 65,185 300 34,470 46,480 42,155 16,000 38,620 9,820 3,400 13,500Miscellaneous Maintenance
Summary Replacement
Building Summary Maintenance 9,700 23,300 12,700 9,900 9,400 10,200 9,700 19,350 10,000 23,600 9,400 9,000 13,000 9,600 9,400 9,300 9,400 26,600 10,300 9,000 10,600
Replacement 65,185 101,600 300 3,400 102,770 52,480 28,300 11,000 2,500 72,020 42,155 25,500 38,620 115,940 9,900 7,500 3,500 3,400 77,620
No.5 Fire Station #1Interior Finishes Maintenance
Summary Replacement 17,550Building Envelope Maintenance 2,000 2,000 2,000 2,000 2,000 2,000 2,000 2,800 2,000 8,400 2,000 2,000 2,000 2,000 3,200 2,800 2,000 2,000 2,000 8,400 2,000
Summary ReplacementMechanical Maintenance 1,700 3,200 1,700 4,200 3,700 1,200 1,700 3,200 4,700 1,200 3,700 1,200 1,700 6,200 1,700 1,200 3,700 1,200 4,700 3,200 1,700
Summary Replacement 20,400 21,650Electrical Maintenance 250 250 250 250 250 250 250 250 250 250 250 250 250 250 250 250 250 250 250 250 250
Summary Replacement 150 19,095 85,800Miscellaneous Maintenance
Summary Replacement
Building Summary Maintenance 3,950 5,450 3,950 6,450 5,950 3,450 3,950 6,250 6,950 9,850 5,950 3,450 3,950 8,450 5,150 4,250 5,950 3,450 6,950 11,850 3,950
Replacement 150 39,495 107,450 17,550
No.6 PW Main ComplexInterior Finishes Maintenance
Summary Replacement 5,000 1,980 5,000 5,000Building Envelope Maintenance 5,100 1,500 1,500 1,500 1,500 1,500 1,500 1,500 1,500 5,000 1,500 1,500 1,500 1,500 1,500 1,500 1,500 1,500 1,500 1,500 1,500
Summary Replacement 6,600 6,600 13,900 19,300 19,300 19,300Mechanical Maintenance 900 900 900 2,000 900 900 2,900 900 900 2,000 900 900 2,900
Summary Replacement 500 8,800 9,000 11,100 500 9,200Electrical Maintenance 1,000 1,000 1,000 1,000 1,000 1,000 1,000 1,000 1,000 1,000 1,000 1,000 1,000 1,000 1,000 1,000 1,000 1,000 1,000 1,000 1,000
Summary Replacement 3,380 19,750 9,160 9,600 19,750 23,980Miscellaneous Maintenance
Summary Replacement 85,000 65,000
Building Summary Maintenance 7,000 2,500 3,400 2,500 3,400 4,500 3,400 2,500 3,400 6,000 5,400 2,500 3,400 2,500 3,400 4,500 3,400 2,500 3,400 2,500 5,400
Replacement 5,000 3,880 85,000 21,730 89,560 6,600 18,600 16,100 500 19,750 47,080 19,300 19,300 24,300
No.7 PW E. Bays, Roads & ParksInterior Finishes Maintenance
Summary Replacement 2,500Building Envelope Maintenance 600 5,800 600 600 600 5,800 600
Summary Replacement 2,200 22,600 22,600Mechanical Maintenance 2,000 2,000 2,000 2,000
Summary Replacement 600Electrical Maintenance
Summary Replacement 3,110 3,460 3,000 100 3,000
Building Summary Maintenance 600 2,000 5,800 600 2,000 600 2,000 600 2,000 5,800 600
Replacement 3,110 3,460 2,500 3,000 2,800 100 22,600 25,600
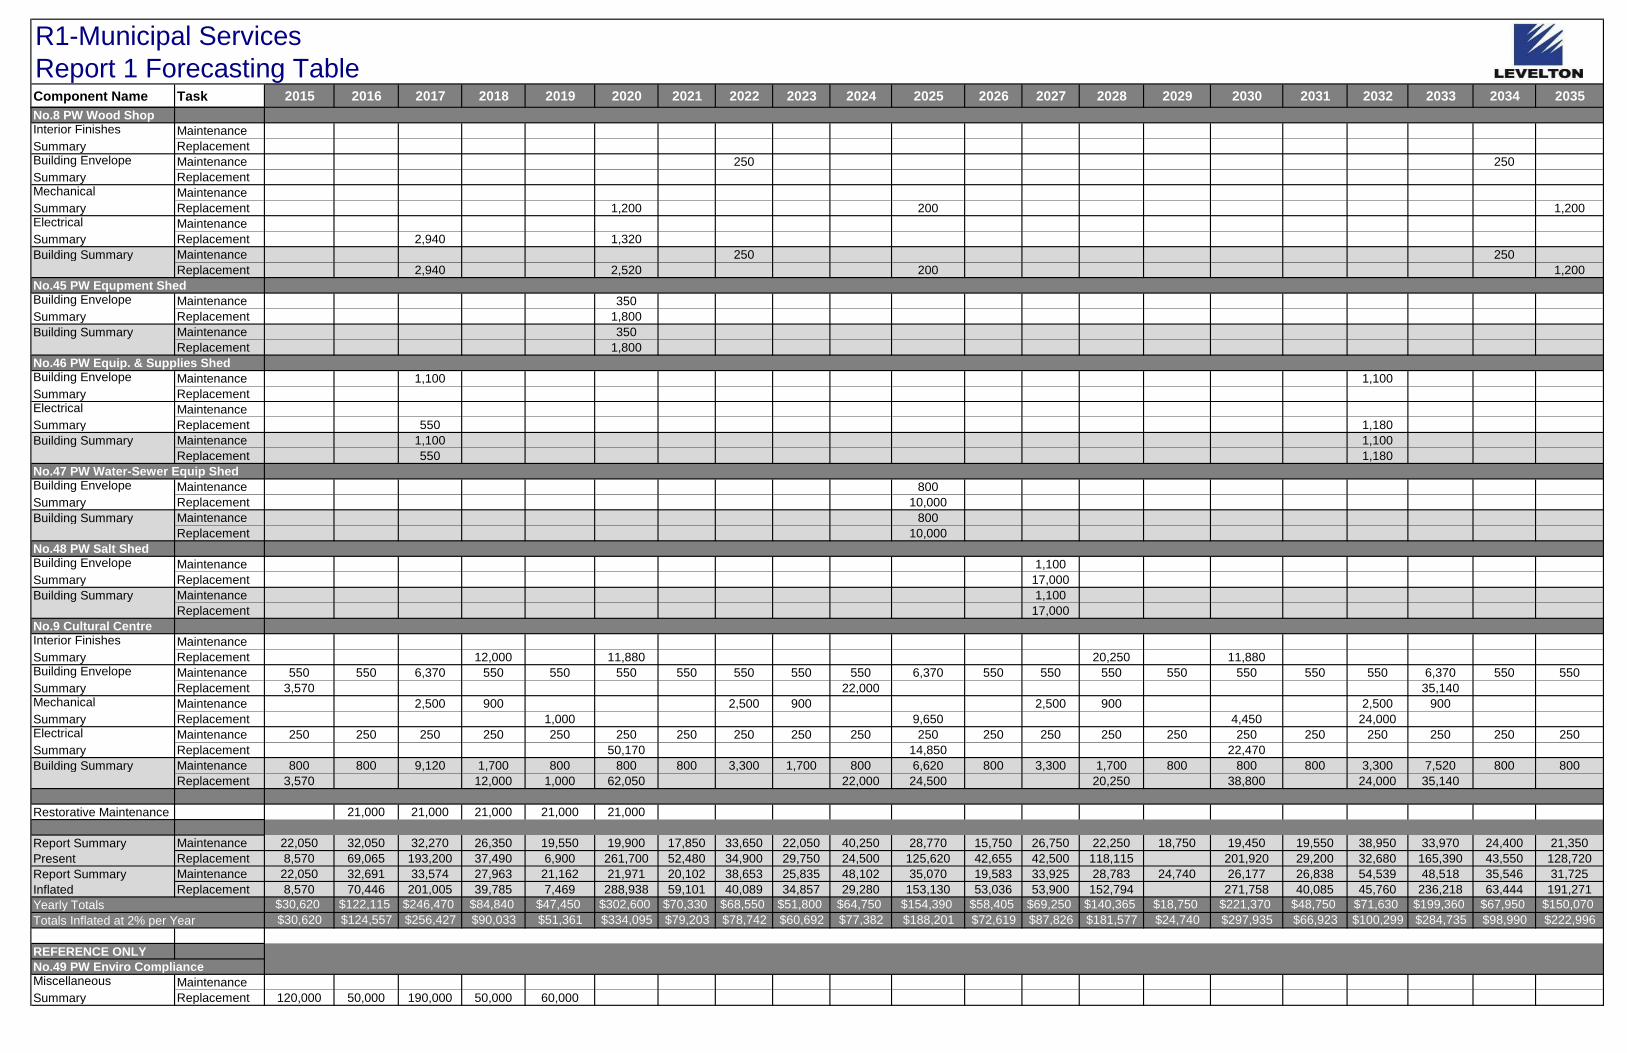
R1-Municipal Services
Report 1 Forecasting TableComponent Name Task 2015 2016 2017 2018 2019 2020 2021 2022 2023 2024 2025 2026 2027 2028 2029 2030 2031 2032 2033 2034 2035
No.8 PW Wood ShopInterior Finishes Maintenance
Summary ReplacementBuilding Envelope Maintenance 250 250
Summary ReplacementMechanical Maintenance
Summary Replacement 1,200 200 1,200Electrical Maintenance
Summary Replacement 2,940 1,320
Building Summary Maintenance 250 250
Replacement 2,940 2,520 200 1,200
No.45 PW Equpment ShedBuilding Envelope Maintenance 350
Summary Replacement 1,800
Building Summary Maintenance 350
Replacement 1,800
No.46 PW Equip. & Supplies ShedBuilding Envelope Maintenance 1,100 1,100
Summary ReplacementElectrical Maintenance
Summary Replacement 550 1,180
Building Summary Maintenance 1,100 1,100
Replacement 550 1,180
No.47 PW Water-Sewer Equip ShedBuilding Envelope Maintenance 800
Summary Replacement 10,000
Building Summary Maintenance 800
Replacement 10,000
No.48 PW Salt ShedBuilding Envelope Maintenance 1,100
Summary Replacement 17,000
Building Summary Maintenance 1,100
Replacement 17,000
No.9 Cultural CentreInterior Finishes Maintenance
Summary Replacement 12,000 11,880 20,250 11,880Building Envelope Maintenance 550 550 6,370 550 550 550 550 550 550 550 6,370 550 550 550 550 550 550 550 6,370 550 550
Summary Replacement 3,570 22,000 35,140Mechanical Maintenance 2,500 900 2,500 900 2,500 900 2,500 900
Summary Replacement 1,000 9,650 4,450 24,000Electrical Maintenance 250 250 250 250 250 250 250 250 250 250 250 250 250 250 250 250 250 250 250 250 250
Summary Replacement 50,170 14,850 22,470
Building Summary Maintenance 800 800 9,120 1,700 800 800 800 3,300 1,700 800 6,620 800 3,300 1,700 800 800 800 3,300 7,520 800 800
Replacement 3,570 12,000 1,000 62,050 22,000 24,500 20,250 38,800 24,000 35,140
Restorative Maintenance 21,000 21,000 21,000 21,000 21,000
Report Summary Maintenance 22,050 32,050 32,270 26,350 19,550 19,900 17,850 33,650 22,050 40,250 28,770 15,750 26,750 22,250 18,750 19,450 19,550 38,950 33,970 24,400 21,350
Present Replacement 8,570 69,065 193,200 37,490 6,900 261,700 52,480 34,900 29,750 24,500 125,620 42,655 42,500 118,115 201,920 29,200 32,680 165,390 43,550 128,720
Report Summary Maintenance 22,050 32,691 33,574 27,963 21,162 21,971 20,102 38,653 25,835 48,102 35,070 19,583 33,925 28,783 24,740 26,177 26,838 54,539 48,518 35,546 31,725
Inflated Replacement 8,570 70,446 201,005 39,785 7,469 288,938 59,101 40,089 34,857 29,280 153,130 53,036 53,900 152,794 271,758 40,085 45,760 236,218 63,444 191,271
Yearly Totals $30,620 $122,115 $246,470 $84,840 $47,450 $302,600 $70,330 $68,550 $51,800 $64,750 $154,390 $58,405 $69,250 $140,365 $18,750 $221,370 $48,750 $71,630 $199,360 $67,950 $150,070
Totals Inflated at 2% per Year $30,620 $124,557 $256,427 $90,033 $51,361 $334,095 $79,203 $78,742 $60,692 $77,382 $188,201 $72,619 $87,826 $181,577 $24,740 $297,935 $66,923 $100,299 $284,735 $98,990 $222,996
REFERENCE ONLY
No.49 PW Enviro ComplianceMiscellaneous Maintenance
Summary Replacement 120,000 50,000 190,000 50,000 60,000
Levelton File # R514-1802-00
June 08, 2015
District of Central Saanich
Facility Long-Term Asset Management Plan
Report No.1 – Municipal Buildings
APPENDIX II
BUILDING WORKSHEETS
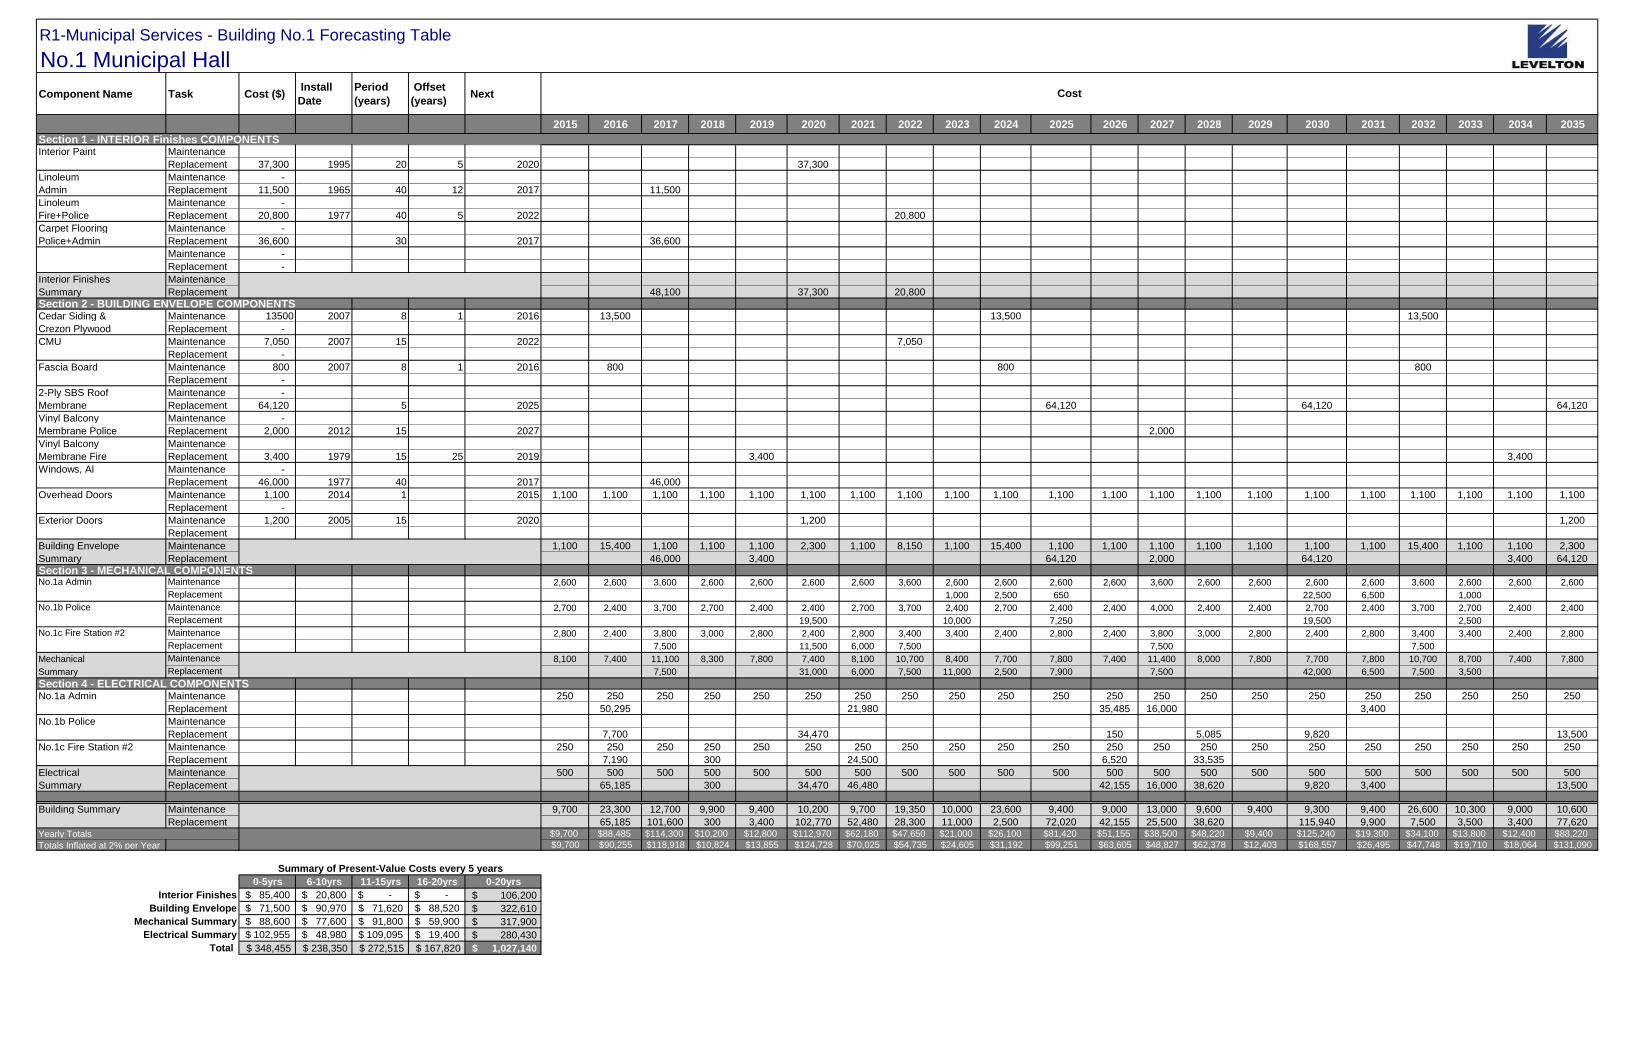
R1-Municipal Services - Building No.1 Forecasting Table
No.1 Municipal Hall
Component Name Task Cost ($) Install
Date
Period
(years)
Offset
(years) Next
2015 2016 2017 2018 2019 2020 2021 2022 2023 2024 2025 2026 2027 2028 2029 2030 2031 2032 2033 2034 2035
Section 1 - INTERIOR Finishes COMPONENTSInterior Paint Maintenance
Replacement 37,300 1995 20 5 2020 37,300
Linoleum Maintenance -
Admin Replacement 11,500 1965 40 12 2017 11,500
Linoleum Maintenance -
Fire+Police Replacement 20,800 1977 40 5 2022 20,800
Carpet Flooring Maintenance -
Police+Admin Replacement 36,600 30 2017 36,600
Maintenance -
Replacement -
Interior Finishes Maintenance
Summary Replacement 48,100 37,300 20,800
Section 2 - BUILDING ENVELOPE COMPONENTSCedar Siding & Maintenance 13500 2007 8 1 2016 13,500 13,500 13,500
Crezon Plywood Replacement -
CMU Maintenance 7,050 2007 15 2022 7,050
Replacement -
Fascia Board Maintenance 800 2007 8 1 2016 800 800 800
Replacement -
2-Ply SBS Roof Maintenance -
Membrane Replacement 64,120 5 2025 64,120 64,120 64,120
Vinyl Balcony Maintenance -
Membrane Police Replacement 2,000 2012 15 2027 2,000
Vinyl Balcony Maintenance
Membrane Fire Replacement 3,400 1979 15 25 2019 3,400 3,400
Windows, Al Maintenance -
Replacement 46,000 1977 40 2017 46,000
Overhead Doors Maintenance 1,100 2014 1 2015 1,100 1,100 1,100 1,100 1,100 1,100 1,100 1,100 1,100 1,100 1,100 1,100 1,100 1,100 1,100 1,100 1,100 1,100 1,100 1,100 1,100
Replacement -
Exterior Doors Maintenance 1,200 2005 15 2020 1,200 1,200
Replacement
Building Envelope Maintenance 1,100 15,400 1,100 1,100 1,100 2,300 1,100 8,150 1,100 15,400 1,100 1,100 1,100 1,100 1,100 1,100 1,100 15,400 1,100 1,100 2,300
Summary Replacement 46,000 3,400 64,120 2,000 64,120 3,400 64,120
Section 3 - MECHANICAL COMPONENTSNo.1a Admin Maintenance 2,600 2,600 3,600 2,600 2,600 2,600 2,600 3,600 2,600 2,600 2,600 2,600 3,600 2,600 2,600 2,600 2,600 3,600 2,600 2,600 2,600
Replacement 1,000 2,500 650 22,500 6,500 1,000
No.1b Police Maintenance 2,700 2,400 3,700 2,700 2,400 2,400 2,700 3,700 2,400 2,700 2,400 2,400 4,000 2,400 2,400 2,700 2,400 3,700 2,700 2,400 2,400
Replacement 19,500 10,000 7,250 19,500 2,500
No.1c Fire Station #2 Maintenance 2,800 2,400 3,800 3,000 2,800 2,400 2,800 3,400 3,400 2,400 2,800 2,400 3,800 3,000 2,800 2,400 2,800 3,400 3,400 2,400 2,800
Replacement 7,500 11,500 6,000 7,500 7,500 7,500
Mechanical Maintenance 8,100 7,400 11,100 8,300 7,800 7,400 8,100 10,700 8,400 7,700 7,800 7,400 11,400 8,000 7,800 7,700 7,800 10,700 8,700 7,400 7,800
Summary Replacement 7,500 31,000 6,000 7,500 11,000 2,500 7,900 7,500 42,000 6,500 7,500 3,500
Section 4 - ELECTRICAL COMPONENTSNo.1a Admin Maintenance 250 250 250 250 250 250 250 250 250 250 250 250 250 250 250 250 250 250 250 250 250
Replacement 50,295 21,980 35,485 16,000 3,400
No.1b Police Maintenance
Replacement 7,700 34,470 150 5,085 9,820 13,500
No.1c Fire Station #2 Maintenance 250 250 250 250 250 250 250 250 250 250 250 250 250 250 250 250 250 250 250 250 250
Replacement 7,190 300 24,500 6,520 33,535
Electrical Maintenance 500 500 500 500 500 500 500 500 500 500 500 500 500 500 500 500 500 500 500 500 500
Summary Replacement 65,185 300 34,470 46,480 42,155 16,000 38,620 9,820 3,400 13,500
Building Summary Maintenance 9,700 23,300 12,700 9,900 9,400 10,200 9,700 19,350 10,000 23,600 9,400 9,000 13,000 9,600 9,400 9,300 9,400 26,600 10,300 9,000 10,600
Replacement 65,185 101,600 300 3,400 102,770 52,480 28,300 11,000 2,500 72,020 42,155 25,500 38,620 115,940 9,900 7,500 3,500 3,400 77,620Yearly Totals $9,700 $88,485 $114,300 $10,200 $12,800 $112,970 $62,180 $47,650 $21,000 $26,100 $81,420 $51,155 $38,500 $48,220 $9,400 $125,240 $19,300 $34,100 $13,800 $12,400 $88,220
Totals Inflated at 2% per Year $9,700 $90,255 $118,918 $10,824 $13,855 $124,728 $70,025 $54,735 $24,605 $31,192 $99,251 $63,605 $48,827 $62,378 $12,403 $168,557 $26,495 $47,748 $19,710 $18,064 $131,090
0-5yrs 6-10yrs 11-15yrs 16-20yrs 0-20yrs
Interior Finishes 85,400$ 20,800$ -$ -$ $ 106,200
Building Envelope 71,500$ 90,970$ 71,620$ 88,520$ $ 322,610
Mechanical Summary 88,600$ 77,600$ 91,800$ 59,900$ $ 317,900
Electrical Summary 102,955$ 48,980$ 109,095$ 19,400$ $ 280,430
Total $ 348,455 $ 238,350 $ 272,515 $ 167,820 $ 1,027,140
Cost
Summary of Present-Value Costs every 5 years

No.1 Municipal HallBuilding Summary
No.1 Municipal Hall
Report No. 1
$0
$20,000
$40,000
$60,000
$80,000
$100,000
$120,000
$140,000
20
15
20
16
20
17
20
18
20
19
20
20
20
21
20
22
20
23
20
24
20
25
20
26
20
27
20
28
20
29
20
30
20
31
20
32
20
33
20
34
20
35
Co
st
(201
5 D
oll
ars
)
Year
PROJECTED REPLACEMENT EXPENSES (Present Value)
InteriorFinishes
BuildingEnvelope
Mechanical
Electrical
$0
$5,000
$10,000
$15,000
$20,000
$25,000
$30,000
20
15
20
16
20
17
20
18
20
19
20
20
20
21
20
22
20
23
20
24
20
25
20
26
20
27
20
28
20
29
20
30
20
31
20
32
20
33
20
34
20
35
Co
st
(201
5 D
oll
ars
)
Year
PROJECTED MAINTENANCE EXPENSES (Present Value)
InteriorFinishes
BuildingEnvelope
Mechanical
Electrical

ItemCost
($)
Last(Year)
Period(yrs)
Adjusted(yrs)
Next(Year)
Interior Paint Maintenance
Replacement 37,300$ 1995 20 5 2020
Linoleum MaintenanceAdmin Replacement 11,500$ 1965 40 12 2017
Linoleum Maintenance
Fire+Police Replacement 20,800$ 1977 40 5 2022
Carpet Flooring Maintenance
Police+Admin Replacement 36,600$ 30 2017
NOTES:
No.1 Municipal HallInterior Finishes
Maintenance: Replacement:Maintenance of interior finishes assumed to be addressed
within regular building maintenance services.
Metal and wooden interior doors are not expected to be
replaced. Maintenance of doors is assumed to occur as
required by district staff.
Interior paint replacement cost is for whole building. It excludes
vaults, storage and utility rooms, holding cells and garage areas
at this time due to low visibility and cost-benefit reasons.
Linoleum flooring is addressed in two phases, administrative
areas (1965) and then fire and police areas (c.1977). It includes
lobbies, stairwells and washrooms. Administrative areas are
given priority as they are accessible to the public (main foyer and
stairwells).
Carpet replacement is modeled for high priority areas which
include the police (poor condition) and general admin areas.
The graph shows the costs associated with the maintenance and/or replacement of the component over time. The dollar axis is in logarithmic scale for ease of presentation.
No.1 Municipal Hall
Report No. 1
$1
$10
$100
$1,000
$10,000
$100,000
20
15
20
16
20
17
20
18
20
19
20
20
20
21
20
22
20
23
20
24
20
25
20
26
20
27
20
28
20
29
20
30
20
31
20
32
20
33
20
34
20
35
Co
st
(201
5 D
oll
ars
)
Year
PROJECTED EXPENSES (Present Value)
Maintenance
Replacement

ItemCost
($)
Last(Year)
Period(yrs)
Adjusted(yrs)
Next(Year)
Cedar Siding & Maintenance 13,500$ 2007 8 1 2016
Crezon Plywood Replacement -$
CMU Maintenance 7,050$ 2007 15 2022Replacement
Fascia Board Maintenance 800$ 2007 8 1 2016
Replacement
2-Ply SBS Roof Maintenance
Membrane Replacement 64,120$ 5 2025
Vinyl Balcony MaintenanceMembrane Police Replacement 2,000$ 2012 15 2027Vinyl Balcony MaintenanceMembrane Fire Replacement 3,400$ 1979 15 25 2019Windows, Al Maintenance
Replacement 46,000$ 1977 40 2017Overhead Doors Maintenance 1,100$ 2014 1 2015
ReplacementExterior Doors Maintenance 1,200$ 2005 15 2020
NOTES: Replacement
Maintenance: Replacement:
No.1 Municipal Hall
Report No. 1
Restorative Maintenance (photo reference in parentheses):
(1-01,02) - Replace lower level lunchroom exterior wall siding (first 5 boards from grade) and sealant renewal at joints.
(1-03) - Replace siding on West wall just North of balcony/bike storage area.
(1-05) - Investigate cantilevered balcony beams on Fire balcony above BBQ pit. Replace decayed plywood cladding.
Replace exterior Crezon plywood cladding with fibre cement panel.
(1-06) - Replace and re-detail outcrops of fire bay doors which are degraded
(1-07) - Replace degraded cedar siding at butt joints to CMU and renewal sealant.
For wood cladding (siding & plywood), maintenance in
perpetuity over replacement is preferred by District. The
cladding appears worn and decayed in areas near grade or
with greater UV exposure. Repainting is recommended every
8 years.
Fascia board repainted every eight years at same time as
siding and plywood.
CMU walls repainted every 15 years. Includes fire hose
tower.
Exterior door and overhead door maintenance includes
replacing hardware, adjustment and touch-up painting.
The annual overhead door maintenance is vital to maintain
uninterrupted emergency services.
2-ply SBS roofing membrane renewal is split into three phases
over ten years as is historically popular.
Vinyl membrane replacement for police balcony (fascia-
mounted railing) will be straightforward. For the fire hall
balcony, the top-mounted railing will need to be removed to
replace the membrane. At that time the District may want to
consider installing a fascia-mounted railling; the top-mounted
railing, if reused, will require re-certification.
Remaining original (1965-1979) aluminum-framed windows are
nearing end of their service life. Recommendation is to replace
whole window (frame&glazing together)to minimize cost and
disruption. Replacement estimate based on market values and
recent (2013) replacement of 33 windows in the administration-
wing. New administration windows are not anticipated for
replacement.
The graph shows the costs associated with the maintenance and/or replacement of the component over time. The dollar axis is in logarithmic scale for ease of presentation.
No.1 Municipal HallBuilding Envelope
$1
$10
$100
$1,000
$10,000
$100,000
20
15
20
16
20
17
20
18
20
19
20
20
20
21
20
22
20
23
20
24
20
25
20
26
20
27
20
28
20
29
20
30
20
31
20
32
20
33
20
34
20
35
Co
st
(20
15
Do
lla
rs)
Year
PROJECTED EXPENSES (Present Value)
Maintenance
Replacement
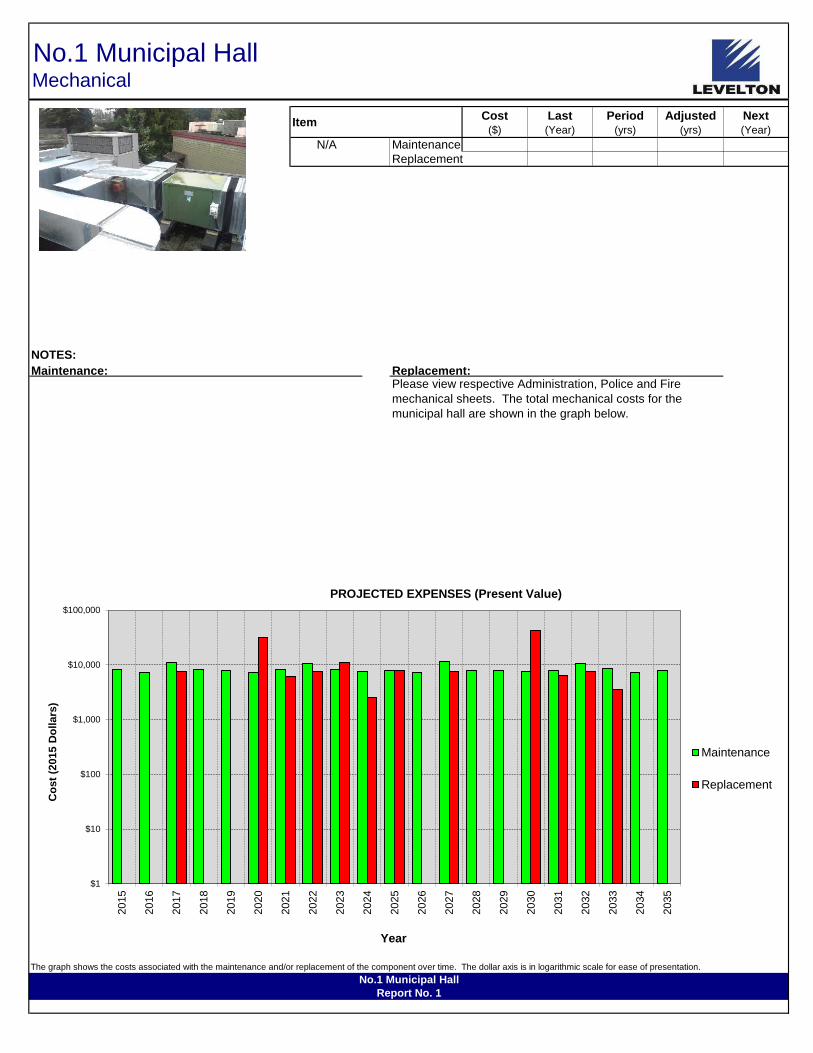
ItemCost
($)
Last(Year)
Period(yrs)
Adjusted(yrs)
Next(Year)
N/A Maintenance
Replacement
NOTES:
No.1 Municipal HallMechanical
Maintenance: Replacement:Please view respective Administration, Police and Fire
mechanical sheets. The total mechanical costs for the
municipal hall are shown in the graph below.
The graph shows the costs associated with the maintenance and/or replacement of the component over time. The dollar axis is in logarithmic scale for ease of presentation.
No.1 Municipal Hall
Report No. 1
$1
$10
$100
$1,000
$10,000
$100,000
20
15
20
16
20
17
20
18
20
19
20
20
20
21
20
22
20
23
20
24
20
25
20
26
20
27
20
28
20
29
20
30
20
31
20
32
20
33
20
34
20
35
Co
st
(2015 D
ollars
)
Year
PROJECTED EXPENSES (Present Value)
Maintenance
Replacement

ItemCost
($)
Last(Year)
Period(yrs)
Adjusted(yrs)
Next(Year)
N/A Maintenance
Replacement
NOTES:
No.1 Municipal HallElectrical
Maintenance: Replacement:Please view respective Admin, Police and Fire electrical
sheets. The total electrical costs for the municipal hall are
shown in the graph below.
The graph shows the costs associated with the maintenance and/or replacement of the component over time. The dollar axis is in logarithmic scale for ease of presentation.
No.1 Municipal Hall
Report No. 1
$1
$10
$100
$1,000
$10,000
$100,000
20
15
20
16
20
17
20
18
20
19
20
20
20
21
20
22
20
23
20
24
20
25
20
26
20
27
20
28
20
29
20
30
20
31
20
32
20
33
20
34
20
35
Co
st
(2015 D
ollars
)
Year
PROJECTED EXPENSES (Present Value)
Maintenance
Replacement

R1-Municipal Services - Building No.1a Forecasting Table
No.1a Admin
Component Name Task Cost ($) Install
Date
Period
(years)
Offset
(years) Next
2015 2016 2017 2018 2019 2020 2021 2022 2023 2024 2025 2026 2027 2028 2029 2030 2031 2032 2033 2034 2035
Section 3 - MECHANICAL COMPONENTSPerimeter Drains Maintenance 1,000 2012 5 2017 1,000 1,000 1,000 1,000
Replacement -
Packaged Heat Maintenance 2,000 2010 1 2015 2,000 2,000 2,000 2,000 2,000 2,000 2,000 2,000 2,000 2,000 2,000 2,000 2,000 2,000 2,000 2,000 2,000 2,000 2,000 2,000 2,000
Pump (3) Replacement 22,500 2010 20 2030 22,500
Power Ventilation Maintenance -
Fan Replacement 2,500 2009 15 2024 2,500
Irrigation Control Maintenance -
Box Replacement 650 2005 20 2025 650
Hot Water Tank Maintenance -
Replacement 1,000 2013 10 2023 1,000 1,000
Ductless Heat Maintenance 600 2011 1 2015 600 600 600 600 600 600 600 600 600 600 600 600 600 600 600 600 600 600 600 600 600
Pump Replacement 6,500 2011 20 2031 6,500
Mechanical Maintenance 2,600 2,600 3,600 2,600 2,600 2,600 2,600 3,600 2,600 2,600 2,600 2,600 3,600 2,600 2,600 2,600 2,600 3,600 2,600 2,600 2,600
Summary Replacement 1,000 2,500 650 22,500 6,500 1,000
Section 4 - ELECTRICAL COMPONENTSLighting Maintenance
Equipment Replacement 30,895 1986 20 10 2016 30,895
Photo Cells Maintenance -
Replacement 900 2006 10 5 2021 900 900
Wiring Devices Maintenance -
Replacement 7,900 1986 30 5 2021 7,900
Baseboard Heating Maintenance -
and Ventilation Replacement 13,180 1986 30 5 2021 13,180
Emergency Maintenance -
Lighting Replacement 4,900 1986 20 10 2016 4,900
Fire Alarm Maintenance 250 2014 1 2015 250 250 250 250 250 250 250 250 250 250 250 250 250 250 250 250 250 250 250 250 250
System Replacement 16,000 2007 20 2027 16,000
Distribution Maintenance -
Equipment Replacement 23,485 1986 40 2026 23,485
Backup Generator Maintenance -
Replacement 12,000 1986 10 20 2016 12,000 12,000
Electric Door Maintenance -
Opener Replacement 2,500 1986 15 15 2016 2,500 2,500
Electrical Maintenance 250 250 250 250 250 250 250 250 250 250 250 250 250 250 250 250 250 250 250 250 250
Summary Replacement 50,295 21,980 35,485 16,000 3,400
Cost

ItemCost
($)
Last(Year)
Period(yrs)
Adjusted(yrs)
Next(Year)
Perimeter Drains Maintenance 1,000$ 2012 5 2017
Replacement
Packaged Heat Maintenance 2,000$ 2010 1 2015Pump (3) Replacement 22,500$ 2010 20 2030Power Ventilation Maintenance
Fan Replacement 2,500$ 2009 15 2024
Irrigation Control Maintenance
Box Replacement 650$ 2005 20 2025
Hot Water Tank MaintenanceReplacement 1,000$ 2013 10 2023
Ductless Heat Maintenance 600$ 2011 1 2015Pump Replacement 6,500$ 2011 20 2031
NOTES:
No.1a AdminMechanical
Maintenance: Replacement:Perimeter drains are recommended for camera inspection
and servicing (hydro-flushed where appropriate) every five
years.
Heat pump servicing includes change of filters and lubrication,
performed bi-annually. Model limits are a minimum period of
1 year, therefore the maintenance cost has been doubled and
set to a period of 1 year.
The graph shows the costs associated with the maintenance and/or replacement of the component over time. The dollar axis is in logarithmic scale for ease of presentation.
No.1a Admin
Report No. 1
$1
$10
$100
$1,000
$10,000
$100,000
20
15
20
16
20
17
20
18
20
19
20
20
20
21
20
22
20
23
20
24
20
25
20
26
20
27
20
28
20
29
20
30
20
31
20
32
20
33
20
34
20
35
Co
st
(2015 D
ollars
)
Year
PROJECTED EXPENSES (Present Value)
Maintenance
Replacement
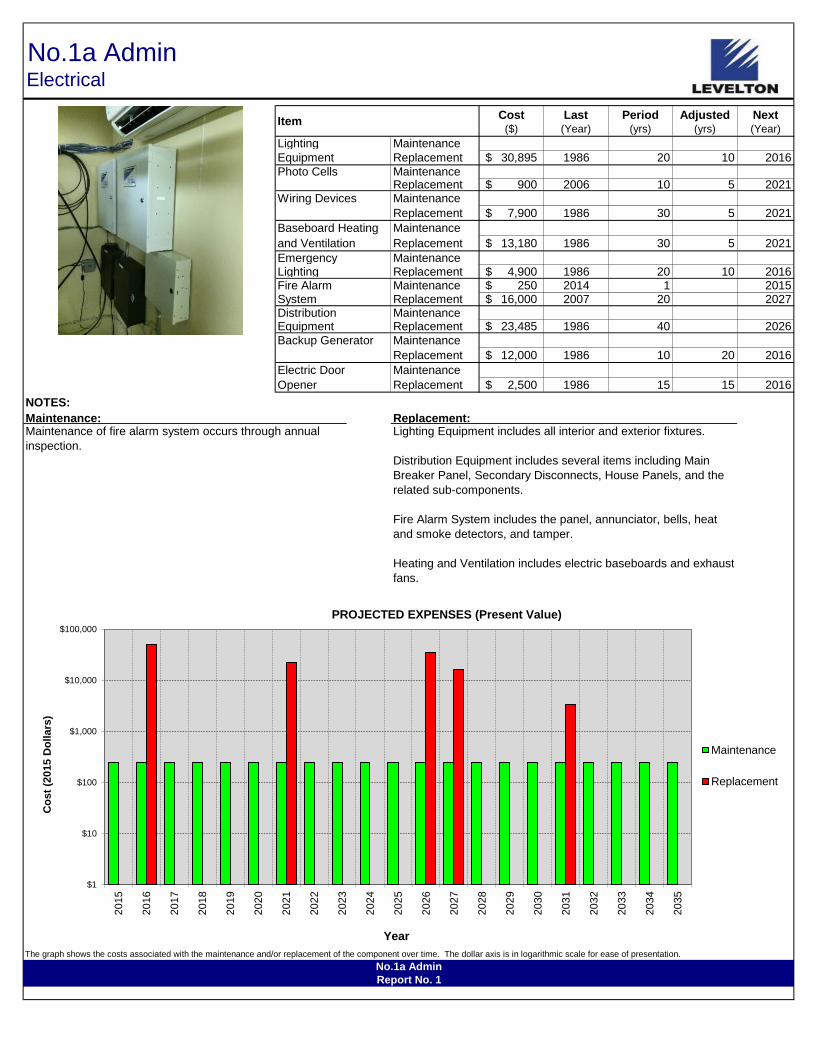
ItemCost
($)
Last(Year)
Period(yrs)
Adjusted(yrs)
Next(Year)
Lighting Maintenance
Equipment Replacement 30,895$ 1986 20 10 2016
Photo Cells MaintenanceReplacement 900$ 2006 10 5 2021
Wiring Devices Maintenance
Replacement 7,900$ 1986 30 5 2021
Baseboard Heating Maintenance
and Ventilation Replacement 13,180$ 1986 30 5 2021
Emergency MaintenanceLighting Replacement 4,900$ 1986 20 10 2016Fire Alarm Maintenance 250$ 2014 1 2015System Replacement 16,000$ 2007 20 2027Distribution MaintenanceEquipment Replacement 23,485$ 1986 40 2026
Backup Generator Maintenance
Replacement 12,000$ 1986 10 20 2016
Electric Door Maintenance
Opener Replacement 2,500$ 1986 15 15 2016
NOTES:
No.1a AdminElectrical
Maintenance: Replacement:Maintenance of fire alarm system occurs through annual
inspection.
Lighting Equipment includes all interior and exterior fixtures.
Distribution Equipment includes several items including Main
Breaker Panel, Secondary Disconnects, House Panels, and the
related sub-components.
Fire Alarm System includes the panel, annunciator, bells, heat
and smoke detectors, and tamper.
Heating and Ventilation includes electric baseboards and exhaust
fans.
The graph shows the costs associated with the maintenance and/or replacement of the component over time. The dollar axis is in logarithmic scale for ease of presentation.
No.1a Admin
Report No. 1
$1
$10
$100
$1,000
$10,000
$100,000
20
15
20
16
20
17
20
18
20
19
20
20
20
21
20
22
20
23
20
24
20
25
20
26
20
27
20
28
20
29
20
30
20
31
20
32
20
33
20
34
20
35
Co
st
(2015 D
ollars
)
Year
PROJECTED EXPENSES (Present Value)
Maintenance
Replacement
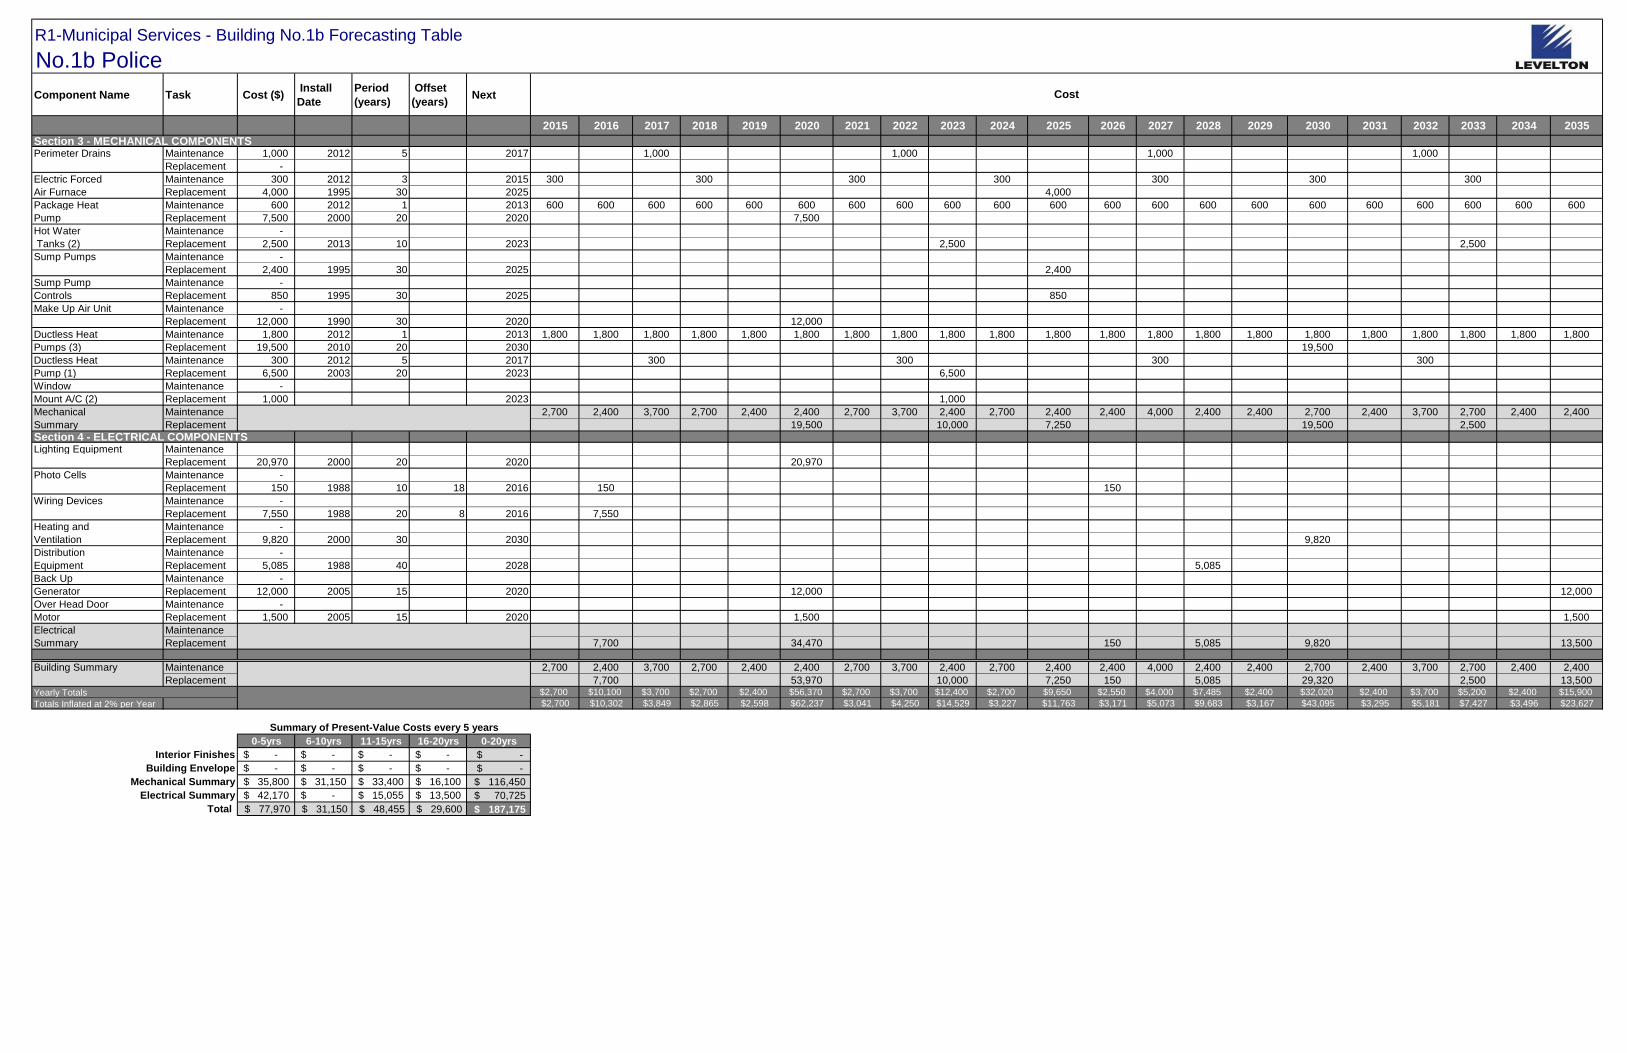
R1-Municipal Services - Building No.1b Forecasting Table
No.1b Police
Component Name Task Cost ($) Install
Date
Period
(years)
Offset
(years) Next
2015 2016 2017 2018 2019 2020 2021 2022 2023 2024 2025 2026 2027 2028 2029 2030 2031 2032 2033 2034 2035
Section 3 - MECHANICAL COMPONENTSPerimeter Drains Maintenance 1,000 2012 5 2017 1,000 1,000 1,000 1,000
Replacement -
Electric Forced Maintenance 300 2012 3 2015 300 300 300 300 300 300 300
Air Furnace Replacement 4,000 1995 30 2025 4,000
Package Heat Maintenance 600 2012 1 2013 600 600 600 600 600 600 600 600 600 600 600 600 600 600 600 600 600 600 600 600 600
Pump Replacement 7,500 2000 20 2020 7,500
Hot Water Maintenance -
Tanks (2) Replacement 2,500 2013 10 2023 2,500 2,500
Sump Pumps Maintenance -
Replacement 2,400 1995 30 2025 2,400
Sump Pump Maintenance -
Controls Replacement 850 1995 30 2025 850
Make Up Air Unit Maintenance -
Replacement 12,000 1990 30 2020 12,000
Ductless Heat Maintenance 1,800 2012 1 2013 1,800 1,800 1,800 1,800 1,800 1,800 1,800 1,800 1,800 1,800 1,800 1,800 1,800 1,800 1,800 1,800 1,800 1,800 1,800 1,800 1,800
Pumps (3) Replacement 19,500 2010 20 2030 19,500
Ductless Heat Maintenance 300 2012 5 2017 300 300 300 300
Pump (1) Replacement 6,500 2003 20 2023 6,500
Window Maintenance -
Mount A/C (2) Replacement 1,000 2023 1,000
Mechanical Maintenance 2,700 2,400 3,700 2,700 2,400 2,400 2,700 3,700 2,400 2,700 2,400 2,400 4,000 2,400 2,400 2,700 2,400 3,700 2,700 2,400 2,400
Summary Replacement 19,500 10,000 7,250 19,500 2,500
Section 4 - ELECTRICAL COMPONENTSLighting Equipment Maintenance
Replacement 20,970 2000 20 2020 20,970
Photo Cells Maintenance -
Replacement 150 1988 10 18 2016 150 150
Wiring Devices Maintenance -
Replacement 7,550 1988 20 8 2016 7,550
Heating and Maintenance -
Ventilation Replacement 9,820 2000 30 2030 9,820
Distribution Maintenance -
Equipment Replacement 5,085 1988 40 2028 5,085
Back Up Maintenance -
Generator Replacement 12,000 2005 15 2020 12,000 12,000
Over Head Door Maintenance -
Motor Replacement 1,500 2005 15 2020 1,500 1,500
Electrical Maintenance
Summary Replacement 7,700 34,470 150 5,085 9,820 13,500
Building Summary Maintenance 2,700 2,400 3,700 2,700 2,400 2,400 2,700 3,700 2,400 2,700 2,400 2,400 4,000 2,400 2,400 2,700 2,400 3,700 2,700 2,400 2,400
Replacement 7,700 53,970 10,000 7,250 150 5,085 29,320 2,500 13,500Yearly Totals $2,700 $10,100 $3,700 $2,700 $2,400 $56,370 $2,700 $3,700 $12,400 $2,700 $9,650 $2,550 $4,000 $7,485 $2,400 $32,020 $2,400 $3,700 $5,200 $2,400 $15,900
Totals Inflated at 2% per Year $2,700 $10,302 $3,849 $2,865 $2,598 $62,237 $3,041 $4,250 $14,529 $3,227 $11,763 $3,171 $5,073 $9,683 $3,167 $43,095 $3,295 $5,181 $7,427 $3,496 $23,627
0-5yrs 6-10yrs 11-15yrs 16-20yrs 0-20yrs
Interior Finishes -$ -$ -$ -$ $ -
Building Envelope -$ -$ -$ -$ $ -
Mechanical Summary 35,800$ 31,150$ 33,400$ 16,100$ $ 116,450
Electrical Summary 42,170$ -$ 15,055$ 13,500$ $ 70,725
Total $ 77,970 $ 31,150 $ 48,455 $ 29,600 $ 187,175
Summary of Present-Value Costs every 5 years
Cost

ItemCost
($)
Last(Year)
Period(yrs)
Adjusted(yrs)
Next(Year)
Perimeter Drains Maintenance 1,000$ 2012 5 2017
Replacement
Electric Forced Maintenance 300$ 2012 3 2015Air Furnace Replacement 4,000$ 1995 30 2025Package Heat Maintenance 600$ 2012 1 2013
Pump Replacement 7,500$ 2000 20 2020
Hot Water Maintenance
Tanks (2) Replacement 2,500$ 2013 10 2023
Sump Pumps MaintenanceReplacement 2,400$ 1995 30 2025
Sump Pump MaintenanceControls Replacement 850$ 1995 30 2025Make Up Air Unit Maintenance
Replacement 12,000$ 1990 30 2020
Ductless Heat Maintenance 1,800$ 2012 1 2013
Pumps (3) Replacement 19,500$ 2010 20 2030
Ductless Heat Maintenance 300$ 2012 5 2017
Pump (1) Replacement 6,500$ 2003 20 2023
Window Maintenance
Mount A/C (2) Replacement 1,000$ 2023
NOTES:
No.1b PoliceMechanical
Maintenance: Replacement:Perimeter drains are recommended for camera inspection
and servicing (hydro-flushed where appropriate) every five
years.
Heat pump servicing includes change of filters and
lubrication, performed bi-annually. Model limits are a
minimum period of 1 year, therefore the maintenance cost
has been doubled and set to a period of 1 year.
The graph shows the costs associated with the maintenance and/or replacement of the component over time. The dollar axis is in logarithmic scale for ease of presentation.
No.1b Police
Report No. 1
$1
$10
$100
$1,000
$10,000
$100,000
20
15
20
16
20
17
20
18
20
19
20
20
20
21
20
22
20
23
20
24
20
25
20
26
20
27
20
28
20
29
20
30
20
31
20
32
20
33
20
34
20
35
Co
st
(20
15
Do
lla
rs)
Year
PROJECTED EXPENSES (Present Value)
Maintenance
Replacement
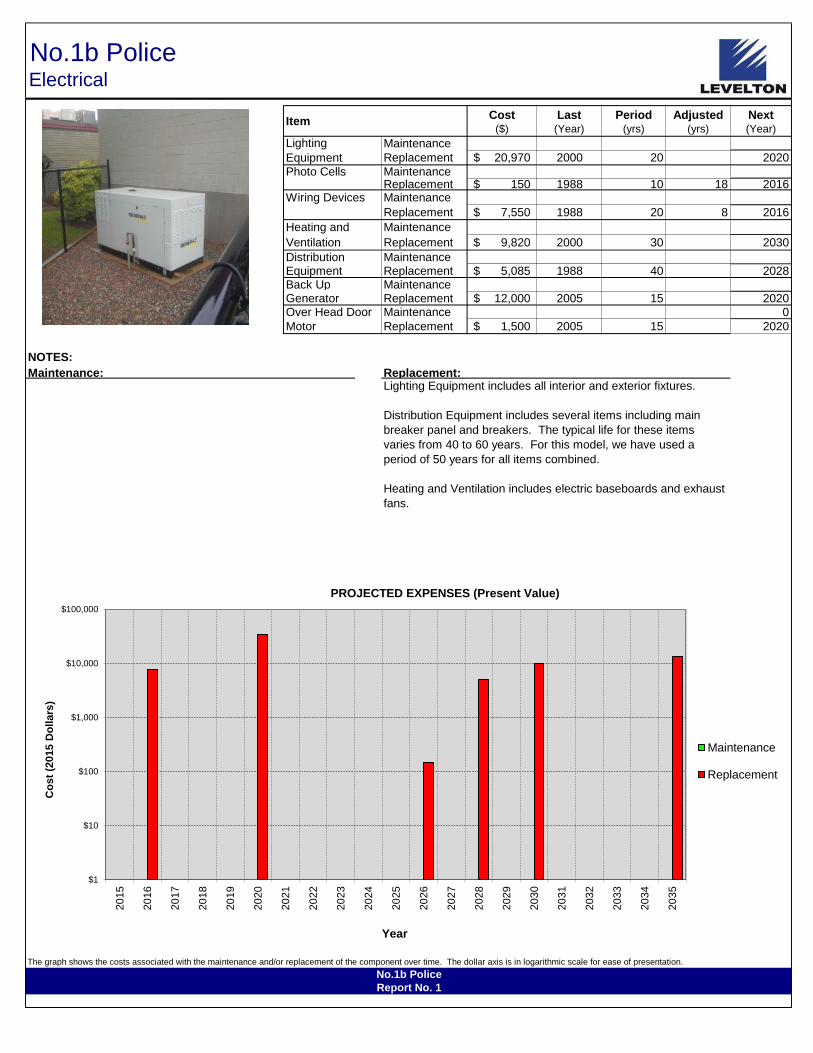
ItemCost
($)
Last(Year)
Period(yrs)
Adjusted(yrs)
Next(Year)
Maintenance
Replacement 20,970$ 2000 20 2020
Photo Cells MaintenanceReplacement 150$ 1988 10 18 2016
Wiring Devices Maintenance
Replacement 7,550$ 1988 20 8 2016
Heating and Maintenance
Ventilation Replacement 9,820$ 2000 30 2030
Distribution MaintenanceEquipment Replacement 5,085$ 1988 40 2028Back Up MaintenanceGenerator Replacement 12,000$ 2005 15 2020Over Head Door Maintenance 0
Motor Replacement 1,500$ 2005 15 2020
NOTES:
No.1b PoliceElectrical
Maintenance: Replacement:Lighting Equipment includes all interior and exterior fixtures.
Distribution Equipment includes several items including main
breaker panel and breakers. The typical life for these items
varies from 40 to 60 years. For this model, we have used a
period of 50 years for all items combined.
Heating and Ventilation includes electric baseboards and exhaust
fans.
Lighting
Equipment
The graph shows the costs associated with the maintenance and/or replacement of the component over time. The dollar axis is in logarithmic scale for ease of presentation.
No.1b Police
Report No. 1
$1
$10
$100
$1,000
$10,000
$100,000
20
15
20
16
20
17
20
18
20
19
20
20
20
21
20
22
20
23
20
24
20
25
20
26
20
27
20
28
20
29
20
30
20
31
20
32
20
33
20
34
20
35
Co
st
(2015 D
ollars
)
Year
PROJECTED EXPENSES (Present Value)
Maintenance
Replacement

R1-Municipal Services - Building No.1c Forecasting Table
No.1c Fire Station #2
Component Name Task Cost ($) Install
Date
Period
(years)
Offset
(years) Next
2015 2016 2017 2018 2019 2020 2021 2022 2023 2024 2025 2026 2027 2028 2029 2030 2031 2032 2033 2034 2035
Section 3 - MECHANICAL COMPONENTSPerimeter Drains Maintenance 1,000 2012 5 2017 1,000 1,000 1,000 1,000
Replacement -
Air Compressor Maintenance -
Replacement 6,500 1988 30 2 2020 6,500
Packaged Heat Maintenance 2,400 2010 1 2015 2,400 2,400 2,400 2,400 2,400 2,400 2,400 2,400 2,400 2,400 2,400 2,400 2,400 2,400 2,400 2,400 2,400 2,400 2,400 2,400 2,400
Pump (4) Replacement 7,500 1997 5 15 2017 7,500 7,500 7,500 7,500
Exhaust Fans (3) Maintenance 600 2010 5 3 2018 600 600 600 600
Replacement 6,000 1988 30 3 2021 6,000
Electric Forced Maintenance 400 2012 2 2015 400 400 400 400 400 400 400 400 400 400 400
Air Furnace Replacement 4,000 1988 30 2 2020 4,000
Hot Water Tank Maintenance -
Replacement 1,000 1995 20 5 2020 1,000
Mechanical Maintenance 2,800 2,400 3,800 3,000 2,800 2,400 2,800 3,400 3,400 2,400 2,800 2,400 3,800 3,000 2,800 2,400 2,800 3,400 3,400 2,400 2,800
Summary Replacement 7,500 11,500 6,000 7,500 7,500 7,500
Section 4 - ELECTRICAL COMPONENTSLighting Maintenance
Equipment Replacement 33,235 2008 20 2028 33,235
Photo Cells Maintenance -
Replacement 300 2008 10 2018 300 300
Wiring Devices Maintenance -
Replacement 5,390 1986 20 10 2016 5,390
Heating and Maintenance -
Ventilation Replacement 1,800 1986 30 2016 1,800
Distribution Maintenance -
Equipment Replacement 6,520 1986 40 2026 6,520
Fire Alarm System Maintenance 250 2014 1 2015 250 250 250 250 250 250 250 250 250 250 250 250 250 250 250 250 250 250 250 250 250
Replacement 3,250 2008 30 2038
Over Head Door Maintenance -
Motor Replacement 24,500 1986 15 20 2021 24,500
Electrical Maintenance 250 250 250 250 250 250 250 250 250 250 250 250 250 250 250 250 250 250 250 250 250
Summary Replacement 7,190 300 24,500 6,520 33,535
Building Summary Maintenance 3,050 2,650 4,050 3,250 3,050 2,650 3,050 3,650 3,650 2,650 3,050 2,650 4,050 3,250 3,050 2,650 3,050 3,650 3,650 2,650 3,050Replacement 7,190 7,500 300 11,500 30,500 7,500 6,520 7,500 33,535 7,500
Yearly Totals $3,050 $9,840 $11,550 $3,550 $3,050 $14,150 $33,550 $11,150 $3,650 $2,650 $3,050 $9,170 $11,550 $36,785 $3,050 $2,650 $3,050 $11,150 $3,650 $2,650 $3,050
Totals Inflated at 2% per Year $3,050 $10,037 $12,017 $3,767 $3,301 $15,623 $37,783 $12,808 $4,277 $3,167 $3,718 $11,402 $14,648 $47,585 $4,024 $3,567 $4,187 $15,613 $5,213 $3,861 $4,532
0-5yrs 6-10yrs 11-15yrs 16-20yrs 0-20yrs
Interior Finishes -$ -$ -$ -$ $ -
Building Envelope -$ -$ -$ -$ $ -
Mechanical Summary 36,200$ 28,300$ 21,900$ 22,300$ $ 108,700
Electrical Summary 8,990$ 25,750$ 41,305$ 1,250$ $ 77,295
Total $ 45,190 $ 54,050 $ 63,205 $ 23,550 $ 185,995
Summary of Present-Value Costs every 5 years
Cost

ItemCost
($)
Last(Year)
Period(yrs)
Adjusted(yrs)
Next(Year)
Perimeter Drains Maintenance 1,000$ 2012 5 2017
Replacement
Air Compressor MaintenanceReplacement 6,500$ 1988 30 2 2020
Packaged Heat Maintenance 2,400$ 2010 1 2015
Pump (4) Replacement 7,500$ 1997 5 15 2017
Exhaust Fans (3) Maintenance 600$ 2010 5 3 2018
Replacement 6,000$ 1988 30 3 2021
Electric Forced Maintenance 400$ 2012 2 2015Air Furnace Replacement 4,000$ 1988 30 2 2020Hot Water Tank Maintenance
Replacement 1,000$ 1995 20 5 2020
NOTES:
No.1c Fire Station #2Mechanical
Maintenance: Replacement:Perimeter drains are recommended for camera inspection
and servicing (hydro-flushed where appropriate) every five
years.
Heat pump and furnace servicing includes change of filters
and lubrication, performed bi-annually. To prevent corrosion
of susceptible surfaces, zinc-rich paint and resealing of duct
work are recommended. Model limits are a minimum period
of 1 year, therefore the maintenance cost has been doubled
and set to a period of 1 year.
Four packaged heat pumps are present with various dates of
install (1997,2000,2004,2011). A period and adjustment factor
have been tailored to distribute the four replacements evenly
over the 20 year period. Estimated service life for each unit is 20
years.
The hot water tank was not accessible for review. It was
assumed to be 20 years of age and is therefore beyond its
estimated service life. Replacement is scheduled within the next
five years.
Exhaust fans (3) refers to 2 ventilation fans and the vehicle
exhaust extraction ventilation.
The graph shows the costs associated with the maintenance and/or replacement of the component over time. The dollar axis is in logarithmic scale for ease of presentation.
No.1c Fire Station #2
Report No. 1
$1
$10
$100
$1,000
$10,000
$100,000
20
15
20
16
20
17
20
18
20
19
20
20
20
21
20
22
20
23
20
24
20
25
20
26
20
27
20
28
20
29
20
30
20
31
20
32
20
33
20
34
20
35
Co
st
(2015 D
ollars
)
Year
PROJECTED EXPENSES (Present Value)
Maintenance
Replacement
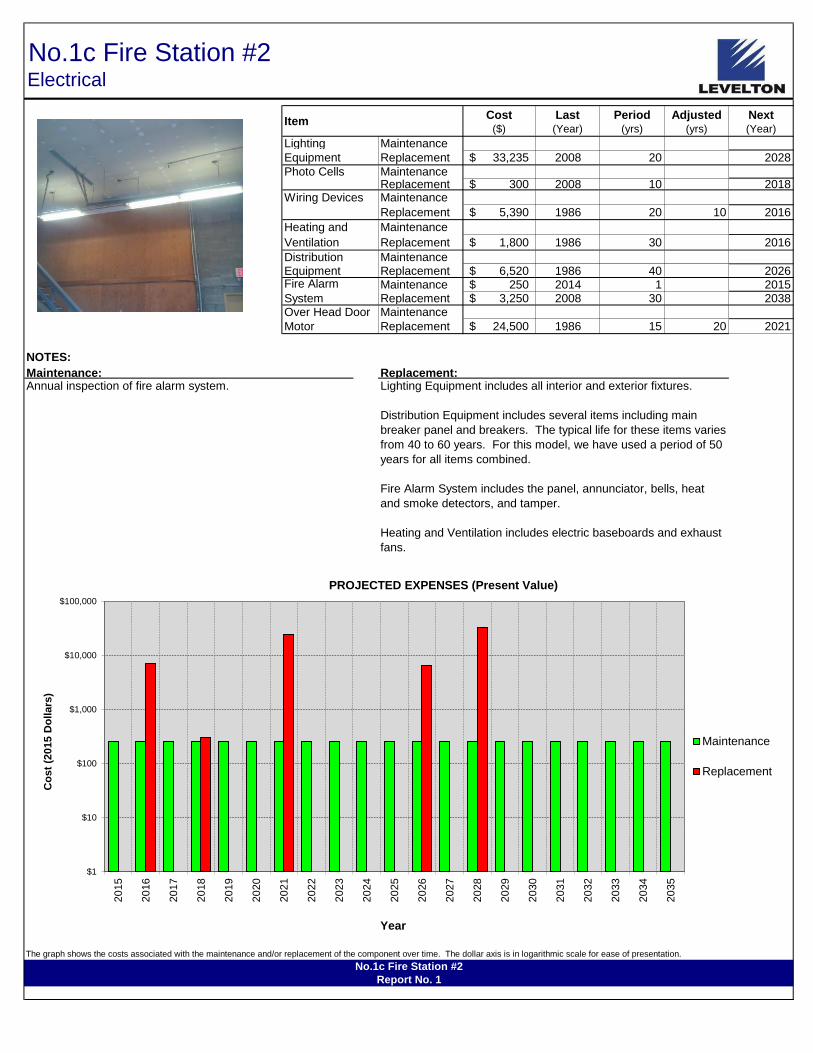
ItemCost
($)
Last(Year)
Period(yrs)
Adjusted(yrs)
Next(Year)
Lighting Maintenance
Equipment Replacement 33,235$ 2008 20 2028
Photo Cells MaintenanceReplacement 300$ 2008 10 2018
Wiring Devices Maintenance
Replacement 5,390$ 1986 20 10 2016
Heating and Maintenance
Ventilation Replacement 1,800$ 1986 30 2016
Distribution MaintenanceEquipment Replacement 6,520$ 1986 40 2026
Maintenance 250$ 2014 1 2015Replacement 3,250$ 2008 30 2038
Over Head Door Maintenance
Motor Replacement 24,500$ 1986 15 20 2021
NOTES:
No.1c Fire Station #2Electrical
Maintenance: Replacement:Annual inspection of fire alarm system. Lighting Equipment includes all interior and exterior fixtures.
Distribution Equipment includes several items including main
breaker panel and breakers. The typical life for these items varies
from 40 to 60 years. For this model, we have used a period of 50
years for all items combined.
Fire Alarm System includes the panel, annunciator, bells, heat
and smoke detectors, and tamper.
Heating and Ventilation includes electric baseboards and exhaust
fans.
Fire Alarm
System
The graph shows the costs associated with the maintenance and/or replacement of the component over time. The dollar axis is in logarithmic scale for ease of presentation.
No.1c Fire Station #2
Report No. 1
$1
$10
$100
$1,000
$10,000
$100,000
20
15
20
16
20
17
20
18
20
19
20
20
20
21
20
22
20
23
20
24
20
25
20
26
20
27
20
28
20
29
20
30
20
31
20
32
20
33
20
34
20
35
Co
st
(2015 D
ollars
)
Year
PROJECTED EXPENSES (Present Value)
Maintenance
Replacement

R1-Municipal Services - Building No.5 Forecasting Table
No.5 Fire Station #1
Component Name Task Cost ($) Install
Date
Period
(years)
Offset
(years) Next
2015 2016 2017 2018 2019 2020 2021 2022 2023 2024 2025 2026 2027 2028 2029 2030 2031 2032 2033 2034 2035
Section 1 - INTERIOR Finishes COMPONENTSPaint Maintenance
Interior Finishes Maintenance
Summary Replacement 17,550
Section 2 - BUILDING ENVELOPE COMPONENTSBrick Veneer Maintenance 3500 2014 10 2024 3,500 3,500
Replacement
Exterior Doors Maintenance 1200 2014 15 2029 1,200
Replacement
Wood Trusses Maintenance 800 2014 8 2022 800 800
Replacement
Appartus Bay Slab Maintenance 2900 2014 10 2024 2,900 2,900
Replacement
Overhead Doors Maintenance 2000 2014 1 2015 2,000 2,000 2,000 2,000 2,000 2,000 2,000 2,000 2,000 2,000 2,000 2,000 2,000 2,000 2,000 2,000 2,000 2,000 2,000 2,000 2,000
Replacement
Building Envelope Maintenance 2,000 2,000 2,000 2,000 2,000 2,000 2,000 2,800 2,000 8,400 2,000 2,000 2,000 2,000 3,200 2,800 2,000 2,000 2,000 8,400 2,000
Summary Replacement
Section 3 - MECHANICAL COMPONENTSPerimeter Drains Maintenance 3000 2013 5 2018 3,000 3,000 3,000 3,000
Replacement
Solar Hot Water Maintenance
Replacement 14000 2013 20 2033 14,000
Pumps Maintenance 2000 2013 3 2016 2,000 2,000 2,000 2,000 2,000 2,000 2,000
Replacement 12400 2013 15 2028 12,400
Ventilation Maintenance
Replacement 7000 2013 20 2033 7,000
Server Room A/C Maintenance
Replacement 8000 2013 15 2028 8,000
Irrigation Maintenance
Control Box Replacement 650 2013 20 2033 650
Water to Water Maintenance 1200 2014 1 2015 1,200 1,200 1,200 1,200 1,200 1,200 1,200 1,200 1,200 1,200 1,200 1,200 1,200 1,200 1,200 1,200 1,200 1,200 1,200 1,200 1,200
Heat Pumps (2) Replacement
System Tankless Maintenance 500 2013 2 2015 500 500 500 500 500 500 500 500 500 500 500
Boiler Replacement
Mechanical Maintenance 1,700 3,200 1,700 4,200 3,700 1,200 1,700 3,200 4,700 1,200 3,700 1,200 1,700 6,200 1,700 1,200 3,700 1,200 4,700 3,200 1,700
Summary Replacement 20,400 21,650
Section 4 - ELECTRICAL COMPONENTSLighting Maintenance
Equipment Replacement 73000 2013 20 2033 73,000
Controls Maintenance
Replacement 6675 2013 15 2028 6,675
Wiring Devices Maintenance
Replacement 12650 2013 20 2033 12,650
Overhead Door Maintenance
Motors Replacement 1920 2013 15 2028 1,920
Roller Door Motor Maintenance
Replacement 150 2013 10 2023 150 150
Electric Door Maintenance
Opener Replacement 7500 2013 15 2028 7,500
Hoist Maintenance
Replacement 3000 2013 15 2028 3,000
Fire Alarm System Maintenance 250 2014 1 2015 250 250 250 250 250 250 250 250 250 250 250 250 250 250 250 250 250 250 250 250 250
Replacement
Electrical Maintenance 250 250 250 250 250 250 250 250 250 250 250 250 250 250 250 250 250 250 250 250 250
Summary Replacement 150 19,095 85,800
Building Summary Maintenance 3,950 5,450 3,950 6,450 5,950 3,450 3,950 6,250 6,950 9,850 5,950 3,450 3,950 8,450 5,150 4,250 5,950 3,450 6,950 11,850 3,950
Replacement 150 39,495 107,450 17,550
Yearly Totals $3,950 $5,450 $3,950 $6,450 $5,950 $3,450 $3,950 $6,250 $7,100 $9,850 $5,950 $3,450 $3,950 $47,945 $5,150 $4,250 $5,950 $3,450 ####### $29,400 $3,950
Totals Inflated at 2% per Year $3,950 $5,559 $4,110 $6,845 $6,440 $3,809 $4,448 $7,179 $8,319 $11,772 $7,253 $4,290 $5,010 $62,022 $6,795 $5,720 $8,168 $4,831 $163,391 $42,830 $5,869
0-5yrs 6-10yrs 11-15yrs 16-20yrs 0-20yrs
Interior Finishes -$ -$ -$ 17,550$ $ 17,550
Building Envelope 12,000$ 17,200$ 12,000$ 16,400$ $ 57,600
Mechanical Summary 15,700$ 14,500$ 32,400$ 36,150$ $ 98,750
Electrical Summary 1,500$ 1,400$ 20,345$ 87,050$ $ 110,295
Total $ 29,200 $ 33,100 $ 64,745 $ 157,150 $ 284,195
Summary of Present-Value Costs every 5 years
Cost

No.5 Fire Station #1Building Summary
No.5 Fire Station #1
Report No. 1
$0
$20,000
$40,000
$60,000
$80,000
$100,000
$120,000
20
15
20
16
20
17
20
18
20
19
20
20
20
21
20
22
20
23
20
24
20
25
20
26
20
27
20
28
20
29
20
30
20
31
20
32
20
33
20
34
20
35
Co
st
(201
5 D
oll
ars
)
Year
PROJECTED REPLACEMENT EXPENSES (Present Value)
InteriorFinishes
BuildingEnvelope
Mechanical
Electrical
$0
$2,000
$4,000
$6,000
$8,000
$10,000
$12,000
$14,000
20
15
20
16
20
17
20
18
20
19
20
20
20
21
20
22
20
23
20
24
20
25
20
26
20
27
20
28
20
29
20
30
20
31
20
32
20
33
20
34
20
35
Co
st
(201
5 D
oll
ars
)
Year
PROJECTED MAINTENANCE EXPENSES (Present Value)
InteriorFinishes
BuildingEnvelope
Mechanical
Electrical

ItemCost
($)
Last(Year)
Period(yrs)
Adjusted(yrs)
Next(Year)
Paint Maintenance
Replacement 17,550$ 2014 20 2034
NOTES:
No.5 Fire Station #1Interior Finishes
Maintenance: Replacement:Replacement of interior paint limited to offices, corridors and
common areas. Apparatus bay, stairwells, storage, and
ultility rooms not included.
Flooring is concrete topping which is not anticipated to be
replaced in next 20 years.
The graph shows the costs associated with the maintenance and/or replacement of the component over time. The dollar axis is in logarithmic scale for ease of presentation.
No.5 Fire Station #1
Report No. 1
$1
$10
$100
$1,000
$10,000
$100,000
20
15
20
16
20
17
20
18
20
19
20
20
20
21
20
22
20
23
20
24
20
25
20
26
20
27
20
28
20
29
20
30
20
31
20
32
20
33
20
34
20
35
Co
st
(2015 D
ollars
)
Year
PROJECTED EXPENSES (Present Value)
Maintenance
Replacement

ItemCost
($)
Last(Year)
Period(yrs)
Adjusted(yrs)
Next(Year)
Brick Veneer Maintenance 3,500$ 2014 10 2024
Replacement
Exterior Doors Maintenance 1,200$ 2014 15 2029Replacement
Wood Trusses Maintenance 800$ 2014 8 2022
Replacement
Appartus Bay SlabMaintenance 2,900$ 2014 10 2024
Replacement
Overhead Doors Maintenance 2,000$ 2014 1 2015Replacement
NOTES:
No.5 Fire Station #1Building Envelope
Maintenance: Replacement:Brick veneer, porous material, cleaned to prevent org. growth
Exterior metal door maintenance includes new
weatherstripping, gaskets, and hardware as required.
Resealing apparatus bay slab for crack prevention.
Reseal all exterior wood
Overhead door operation is essential service for resident
safety. Annual servicing is recommended.
No replacement costs expected in scope of report.
SBS roofing membrane renewal beyond 20 year scope (25 year
service life).
Restorative Maintenance:
Flash exposed end grain of wood at structural roof truss extensions.
The graph shows the costs associated with the maintenance and/or replacement of the component over time. The dollar axis is in logarithmic scale for ease of presentation.
No.5 Fire Station #1
Report No. 1
$1
$10
$100
$1,000
$10,000
20
15
20
16
20
17
20
18
20
19
20
20
20
21
20
22
20
23
20
24
20
25
20
26
20
27
20
28
20
29
20
30
20
31
20
32
20
33
20
34
20
35
Co
st
(2015 D
ollars
)
Year
PROJECTED EXPENSES (Present Value)
Maintenance
Replacement

ItemCost
($)
Last(Year)
Period(yrs)
Adjusted(yrs)
Next(Year)
Perimeter Drains Maintenance 3,000$ 2013 5 2018
Replacement
Solar Hot Water MaintenanceReplacement 14,000$ 2013 20 2033
Pumps Maintenance 2,000$ 2013 3 2016
Replacement 12,400$ 2013 15 2028
Ventilation Maintenance
Replacement 7,000$ 2013 20 2033
Server Room A/C MaintenanceReplacement 8,000$ 2013 15 2028
Irrigation MaintenanceControl Box Replacement 650$ 2013 20 2033Water to Water Maintenance 1,200$ 2014 1 2015
Heat Pumps (2) Replacement
System Tankless Maintenance 500$ 2013 2 2015
NOTES: Boiler Replacement
No.5 Fire Station #1Mechanical
Maintenance: Replacement:Perimeter drains should be hydo-flushed every five years
along with a camera inspection.
Heat pumps and boiler servicing includes change of filters
and lubrication.
As the building is newly constructed, mechanical items with >20
years of remaining service life are not modelled. Please view
appended mechanical sub-contractor worksheets for details on
those items.
Pumps include sanitary, domestic hot water, and geo-exchange
system circulation.
Exhaust Fans include garage, kitchen, washrooms, hose tower,
and work shop.
The graph shows the costs associated with the maintenance and/or replacement of the component over time. The dollar axis is in logarithmic scale for ease of presentation.
No.5 Fire Station #1
Report No. 1
$1
$10
$100
$1,000
$10,000
$100,000
20
15
20
16
20
17
20
18
20
19
20
20
20
21
20
22
20
23
20
24
20
25
20
26
20
27
20
28
20
29
20
30
20
31
20
32
20
33
20
34
20
35
Co
st
(2015 D
ollars
)
Year
PROJECTED EXPENSES (Present Value)
Maintenance
Replacement

ItemCost
($)
Last(Year)
Period(yrs)
Adjusted(yrs)
Next(Year)
Lighting Maintenance
Equipment Replacement 73,000$ 2013 20 2033
Controls MaintenanceReplacement 6,675$ 2013 15 2028
Wiring Devices Maintenance
Replacement 12,650$ 2013 20 2033
Overhead Door Maintenance
Motors Replacement 1,920$ 2013 15 2028
Roller Door Motor MaintenanceReplacement 150$ 2013 10 2023
Electric Door MaintenanceOpener Replacement 7,500$ 2013 15 2028Hoist Maintenance
Replacement 3,000$ 2013 15 2028
Fire Alarm SystemMaintenance 250$ 2014 1 2015
NOTES: Replacement
No.5 Fire Station #1Electrical
Maintenance: Replacement:Annual inspection of fire alarm system. Lighting Equipment includes all interior and exterior fixtures.
Control equipment includes times clocks, photos cells, motion
sensors, contractors for chillers and CO detectors.
The graph shows the costs associated with the maintenance and/or replacement of the component over time. The dollar axis is in logarithmic scale for ease of presentation.
No.5 Fire Station #1
Report No. 1
$1
$10
$100
$1,000
$10,000
$100,000
20
15
20
16
20
17
20
18
20
19
20
20
20
21
20
22
20
23
20
24
20
25
20
26
20
27
20
28
20
29
20
30
20
31
20
32
20
33
20
34
20
35
Co
st
(2015 D
ollars
)
Year
PROJECTED EXPENSES (Present Value)
Maintenance
Replacement
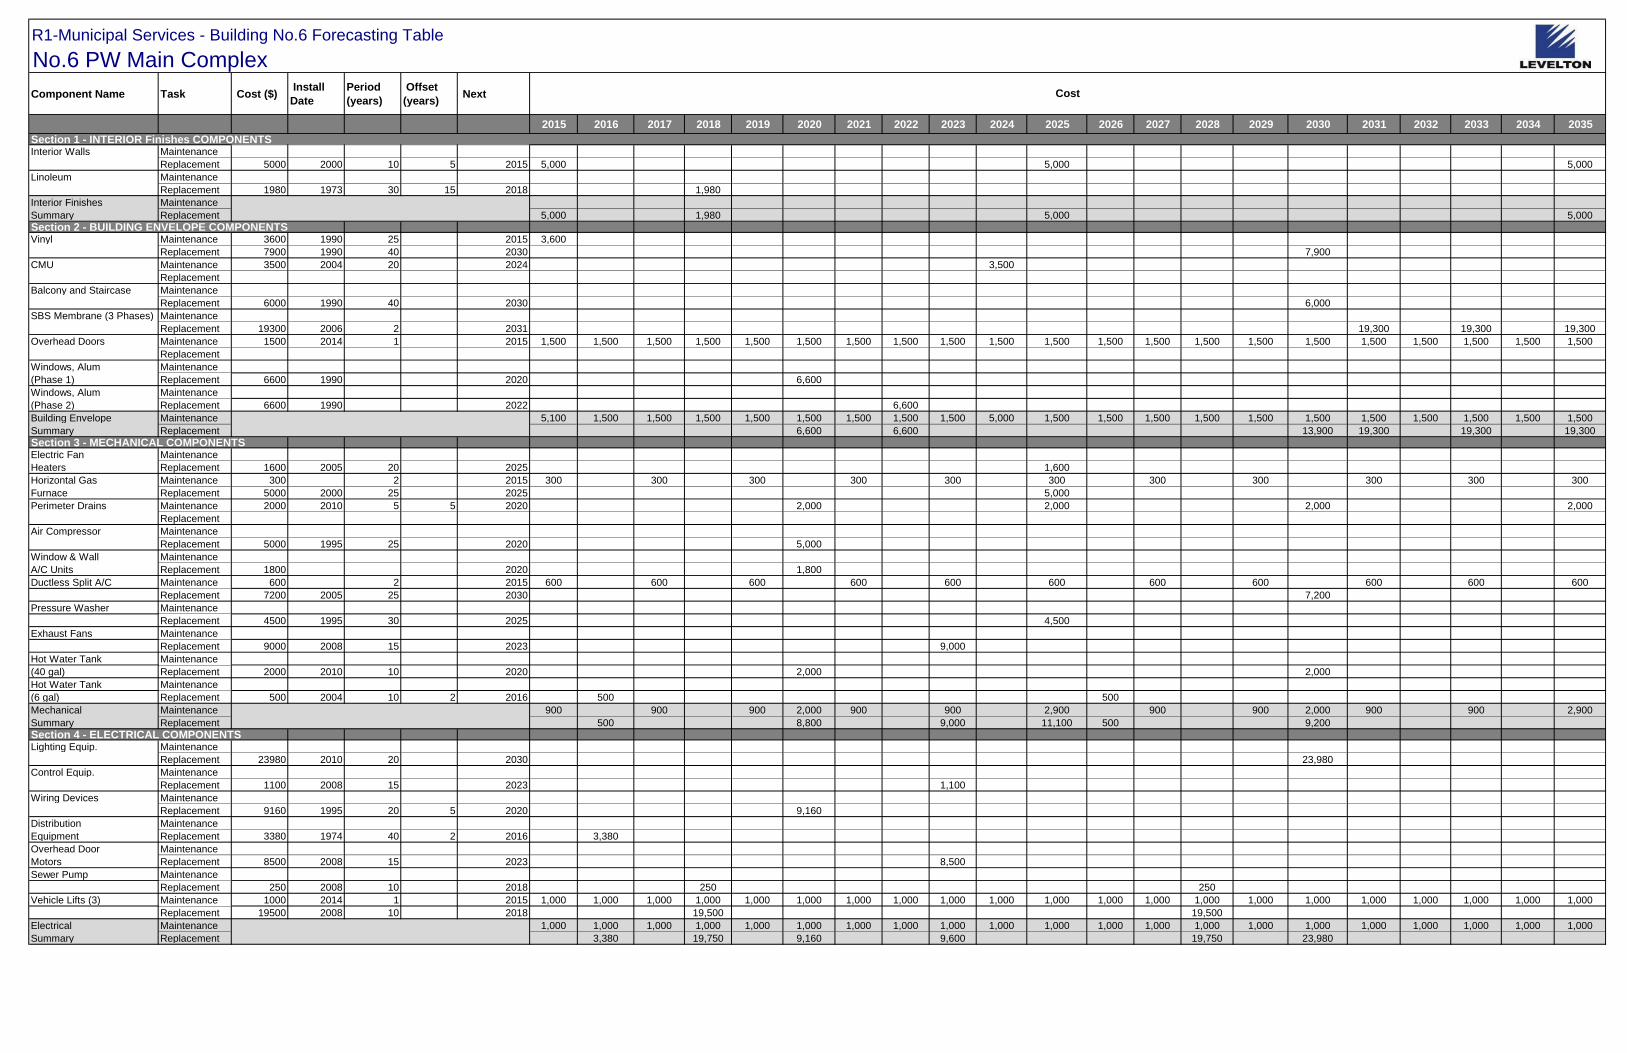
R1-Municipal Services - Building No.6 Forecasting Table
No.6 PW Main Complex
Component Name Task Cost ($) Install
Date
Period
(years)
Offset
(years) Next
2015 2016 2017 2018 2019 2020 2021 2022 2023 2024 2025 2026 2027 2028 2029 2030 2031 2032 2033 2034 2035
Section 1 - INTERIOR Finishes COMPONENTSInterior Walls Maintenance
Replacement 5000 2000 10 5 2015 5,000 5,000 5,000
Linoleum Maintenance
Replacement 1980 1973 30 15 2018 1,980
Interior Finishes Maintenance
Summary Replacement 5,000 1,980 5,000 5,000
Section 2 - BUILDING ENVELOPE COMPONENTSVinyl Maintenance 3600 1990 25 2015 3,600
Replacement 7900 1990 40 2030 7,900
CMU Maintenance 3500 2004 20 2024 3,500
Replacement
Balcony and Staircase Maintenance
Replacement 6000 1990 40 2030 6,000
SBS Membrane (3 Phases) Maintenance
Replacement 19300 2006 2 2031 19,300 19,300 19,300
Overhead Doors Maintenance 1500 2014 1 2015 1,500 1,500 1,500 1,500 1,500 1,500 1,500 1,500 1,500 1,500 1,500 1,500 1,500 1,500 1,500 1,500 1,500 1,500 1,500 1,500 1,500
Replacement
Windows, Alum Maintenance
(Phase 1) Replacement 6600 1990 2020 6,600
Windows, Alum Maintenance
(Phase 2) Replacement 6600 1990 2022 6,600
Building Envelope Maintenance 5,100 1,500 1,500 1,500 1,500 1,500 1,500 1,500 1,500 5,000 1,500 1,500 1,500 1,500 1,500 1,500 1,500 1,500 1,500 1,500 1,500
Summary Replacement 6,600 6,600 13,900 19,300 19,300 19,300
Section 3 - MECHANICAL COMPONENTSElectric Fan Maintenance
Heaters Replacement 1600 2005 20 2025 1,600
Horizontal Gas Maintenance 300 2 2015 300 300 300 300 300 300 300 300 300 300 300
Furnace Replacement 5000 2000 25 2025 5,000
Perimeter Drains Maintenance 2000 2010 5 5 2020 2,000 2,000 2,000 2,000
Replacement
Air Compressor Maintenance
Replacement 5000 1995 25 2020 5,000
Window & Wall Maintenance
A/C Units Replacement 1800 2020 1,800
Ductless Split A/C Maintenance 600 2 2015 600 600 600 600 600 600 600 600 600 600 600
Replacement 7200 2005 25 2030 7,200
Pressure Washer Maintenance
Replacement 4500 1995 30 2025 4,500
Exhaust Fans Maintenance
Replacement 9000 2008 15 2023 9,000
Hot Water Tank Maintenance
(40 gal) Replacement 2000 2010 10 2020 2,000 2,000
Hot Water Tank Maintenance
(6 gal) Replacement 500 2004 10 2 2016 500 500
Mechanical Maintenance 900 900 900 2,000 900 900 2,900 900 900 2,000 900 900 2,900
Summary Replacement 500 8,800 9,000 11,100 500 9,200
Section 4 - ELECTRICAL COMPONENTSLighting Equip. Maintenance
Replacement 23980 2010 20 2030 23,980
Control Equip. Maintenance
Replacement 1100 2008 15 2023 1,100
Wiring Devices Maintenance
Replacement 9160 1995 20 5 2020 9,160
Distribution Maintenance
Equipment Replacement 3380 1974 40 2 2016 3,380
Overhead Door Maintenance
Motors Replacement 8500 2008 15 2023 8,500
Sewer Pump Maintenance
Replacement 250 2008 10 2018 250 250
Vehicle Lifts (3) Maintenance 1000 2014 1 2015 1,000 1,000 1,000 1,000 1,000 1,000 1,000 1,000 1,000 1,000 1,000 1,000 1,000 1,000 1,000 1,000 1,000 1,000 1,000 1,000 1,000
Replacement 19500 2008 10 2018 19,500 19,500
Electrical Maintenance 1,000 1,000 1,000 1,000 1,000 1,000 1,000 1,000 1,000 1,000 1,000 1,000 1,000 1,000 1,000 1,000 1,000 1,000 1,000 1,000 1,000
Summary Replacement 3,380 19,750 9,160 9,600 19,750 23,980
Cost

No.6 PW Main Complex
Component Name Task Cost ($) Install
Date
Period
(years)
Offset
(years) Next
2015 2016 2017 2018 2019 2020 2021 2022 2023 2024 2025 2026 2027 2028 2029 2030 2031 2032 2033 2034 2035
Cost
Section 5 - MISCELLANEOUS COMPONENTSReplace Water Maintenance
Line & Premise Iso Replacement 85000 2017 85,000
Sewer System Maintenance
Upgrade Replacement 65000 2020 65,000
Miscellaneous Maintenance
Summary Replacement 85,000 65,000
Maintenance 7,000 2,500 3,400 2,500 3,400 4,500 3,400 2,500 3,400 6,000 5,400 2,500 3,400 2,500 3,400 4,500 3,400 2,500 3,400 2,500 5,400
Replacement 5,000 3,880 85,000 21,730 89,560 6,600 18,600 16,100 500 19,750 47,080 19,300 19,300 24,300
Yearly Totals $12,000 $6,380 $88,400 $24,230 $3,400 $94,060 $3,400 $9,100 $22,000 $6,000 $21,500 $3,000 $3,400 $22,250 $3,400 $51,580 $22,700 $2,500 $22,700 $2,500 $29,700
Totals Inflated at 2% per Year $12,000 $6,508 $91,971 $25,713 $3,680 $103,850 $3,829 $10,453 $25,777 $7,171 $26,208 $3,730 $4,312 $28,783 $4,486 $69,420 $31,162 $3,501 $32,421 $3,642 $44,133
0-5yrs 6-10yrs 11-15yrs 16-20yrs 0-20yrs
Interior Finishes 6,980$ 5,000$ -$ 5,000$ $ 16,980
Building Envelope 19,200$ 17,600$ 21,400$ 65,400$ $ 123,600
Mechanical Summary 14,000$ 24,800$ 13,500$ 4,700$ $ 57,000
Electrical Summary 38,290$ 14,600$ 48,730$ 5,000$ $ 106,620
Miscellaneous Summary 150,000$ -$ -$ -$ $ 150,000
Total $ 228,470 $ 62,000 $ 83,630 $ 80,100 $ 454,200
Building Summary
Summary of Present-Value Costs every 5 years
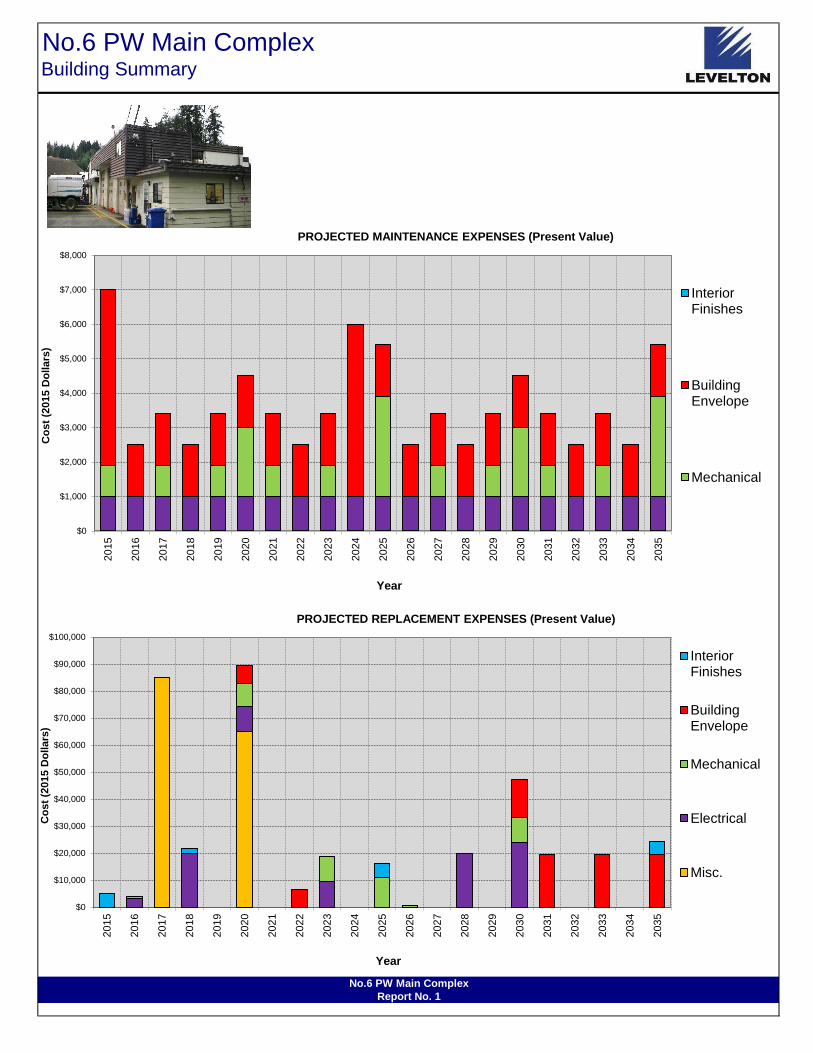
No.6 PW Main ComplexBuilding Summary
No.6 PW Main Complex
Report No. 1
$0
$10,000
$20,000
$30,000
$40,000
$50,000
$60,000
$70,000
$80,000
$90,000
$100,000
20
15
20
16
20
17
20
18
20
19
20
20
20
21
20
22
20
23
20
24
20
25
20
26
20
27
20
28
20
29
20
30
20
31
20
32
20
33
20
34
20
35
Co
st
(201
5 D
oll
ars
)
Year
PROJECTED REPLACEMENT EXPENSES (Present Value)
InteriorFinishes
BuildingEnvelope
Mechanical
Electrical
Misc.
$0
$1,000
$2,000
$3,000
$4,000
$5,000
$6,000
$7,000
$8,000
20
15
20
16
20
17
20
18
20
19
20
20
20
21
20
22
20
23
20
24
20
25
20
26
20
27
20
28
20
29
20
30
20
31
20
32
20
33
20
34
20
35
Co
st
(201
5 D
oll
ars
)
Year
PROJECTED MAINTENANCE EXPENSES (Present Value)
InteriorFinishes
BuildingEnvelope
Mechanical
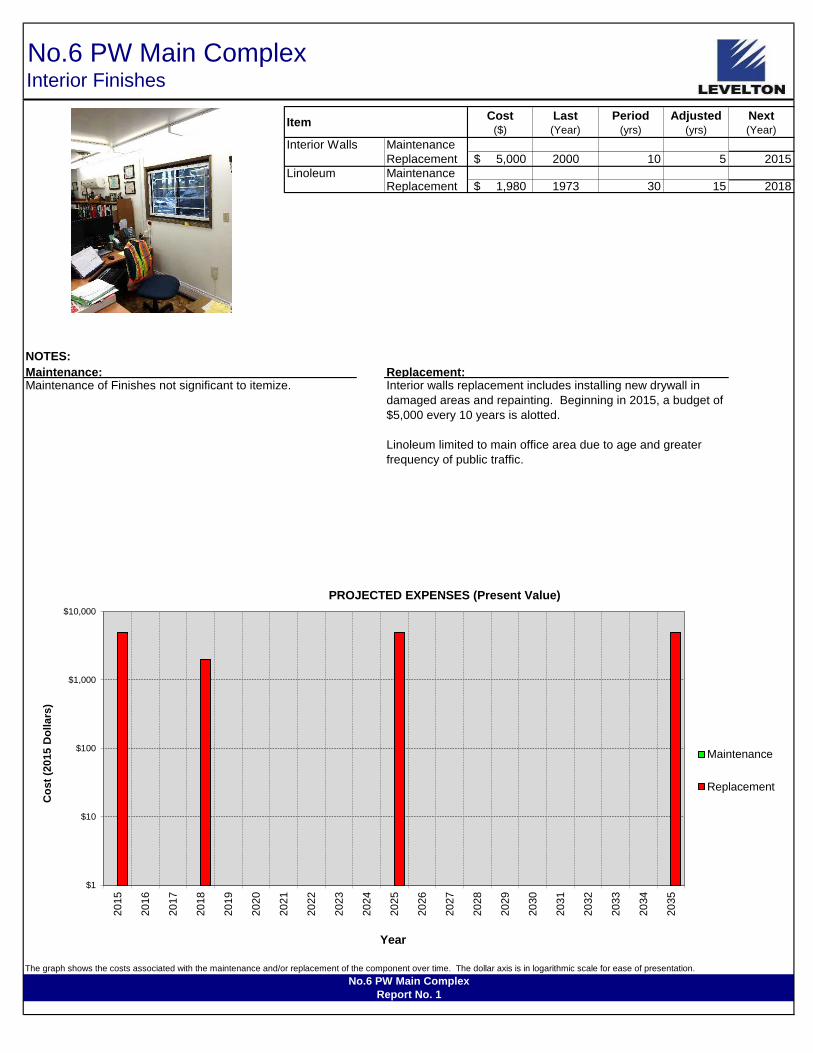
ItemCost
($)
Last(Year)
Period(yrs)
Adjusted(yrs)
Next(Year)
Interior Walls Maintenance
Replacement 5,000$ 2000 10 5 2015
Linoleum MaintenanceReplacement 1,980$ 1973 30 15 2018
NOTES:
No.6 PW Main ComplexInterior Finishes
Maintenance: Replacement:Maintenance of Finishes not significant to itemize. Interior walls replacement includes installing new drywall in
damaged areas and repainting. Beginning in 2015, a budget of
$5,000 every 10 years is alotted.
Linoleum limited to main office area due to age and greater
frequency of public traffic.
The graph shows the costs associated with the maintenance and/or replacement of the component over time. The dollar axis is in logarithmic scale for ease of presentation.
No.6 PW Main Complex
Report No. 1
$1
$10
$100
$1,000
$10,000
20
15
20
16
20
17
20
18
20
19
20
20
20
21
20
22
20
23
20
24
20
25
20
26
20
27
20
28
20
29
20
30
20
31
20
32
20
33
20
34
20
35
Co
st
(2015 D
ollars
)
Year
PROJECTED EXPENSES (Present Value)
Maintenance
Replacement
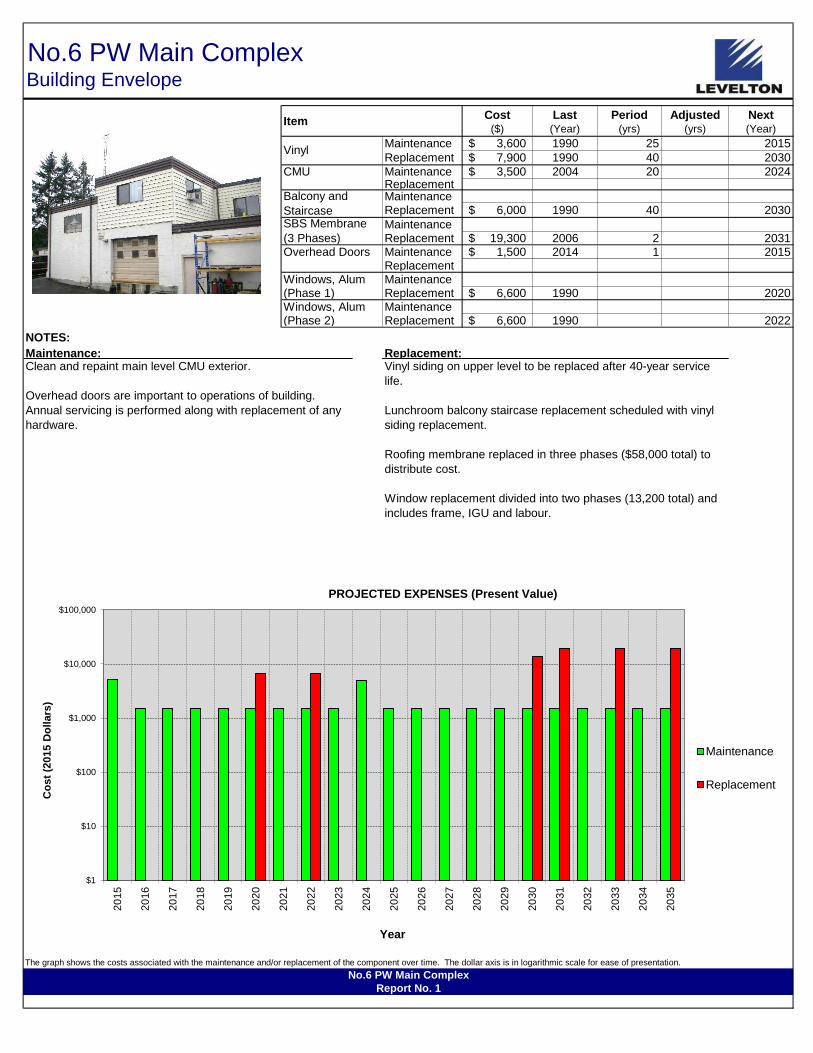
ItemCost
($)
Last(Year)
Period(yrs)
Adjusted(yrs)
Next(Year)
Maintenance 3,600$ 1990 25 2015
Replacement 7,900$ 1990 40 2030
CMU Maintenance 3,500$ 2004 20 2024ReplacementMaintenanceReplacement 6,000$ 1990 40 2030
MaintenanceReplacement 19,300$ 2006 2 2031
Overhead Doors Maintenance 1,500$ 2014 1 2015Replacement
Windows, Alum Maintenance(Phase 1) Replacement 6,600$ 1990 2020Windows, Alum Maintenance(Phase 2) Replacement 6,600$ 1990 2022
NOTES:
No.6 PW Main ComplexBuilding Envelope
Maintenance: Replacement:Clean and repaint main level CMU exterior.
Overhead doors are important to operations of building.
Annual servicing is performed along with replacement of any
hardware.
Vinyl siding on upper level to be replaced after 40-year service
life.
Lunchroom balcony staircase replacement scheduled with vinyl
siding replacement.
Roofing membrane replaced in three phases ($58,000 total) to
distribute cost.
Window replacement divided into two phases (13,200 total) and
includes frame, IGU and labour.
Balcony and
StaircaseSBS Membrane
(3 Phases)
Vinyl
The graph shows the costs associated with the maintenance and/or replacement of the component over time. The dollar axis is in logarithmic scale for ease of presentation.
No.6 PW Main Complex
Report No. 1
$1
$10
$100
$1,000
$10,000
$100,000
20
15
20
16
20
17
20
18
20
19
20
20
20
21
20
22
20
23
20
24
20
25
20
26
20
27
20
28
20
29
20
30
20
31
20
32
20
33
20
34
20
35
Co
st
(2015 D
ollars
)
Year
PROJECTED EXPENSES (Present Value)
Maintenance
Replacement

ItemCost
($)
Last(Year)
Period(yrs)
Adjusted(yrs)
Next(Year)
Electric Fan Maintenance
Heaters Replacement 1,600$ 2005 20 2025
Horizontal Gas Maintenance 300$ 2 2015Furnace Replacement 5,000$ 2000 25 2025Perimeter Drains Maintenance 2,000$ 2010 5 5 2020
Replacement
Air Compressor Maintenance
Replacement 5,000$ 1995 25 2020
Window & Wall MaintenanceA/C Units Replacement 1,800$ 2020
Maintenance 600$ 2 2015
Replacement 7,200$ 2005 25 2030
Pressure
WasherMaintenance
Replacement 4,500$ 1995 30 2025
Exhaust Fans Maintenance
Replacement 9,000$ 2008 15 2023
Hot Water Tank Maintenance
(40 gal) Replacement 2,000$ 2010 10 2020
Hot Water Tank Maintenance
(6 gal) Replacement 500$ 2004 10 2 2016
NOTES:
No.6 PW Main ComplexMechanical
Maintenance: Replacement:Perimeter drains should be hydo-flushed every five years
along with a camera inspection.
A/C units and Gas Furnace servicing every second year.
Exhaust fans include welding station, mechanics shop and three
washrooms.
Mean install date for the two hot water tanks taken as 2010.
Ductless Split A/C
The graph shows the costs associated with the maintenance and/or replacement of the component over time. The dollar axis is in logarithmic scale for ease of presentation.
No.6 PW Main Complex
Report No. 1
$1
$10
$100
$1,000
$10,000
$100,000
20
15
20
16
20
17
20
18
20
19
20
20
20
21
20
22
20
23
20
24
20
25
20
26
20
27
20
28
20
29
20
30
20
31
20
32
20
33
20
34
20
35
Co
st
(2015 D
ollars
)
Year
PROJECTED EXPENSES (Present Value)
Maintenance
Replacement
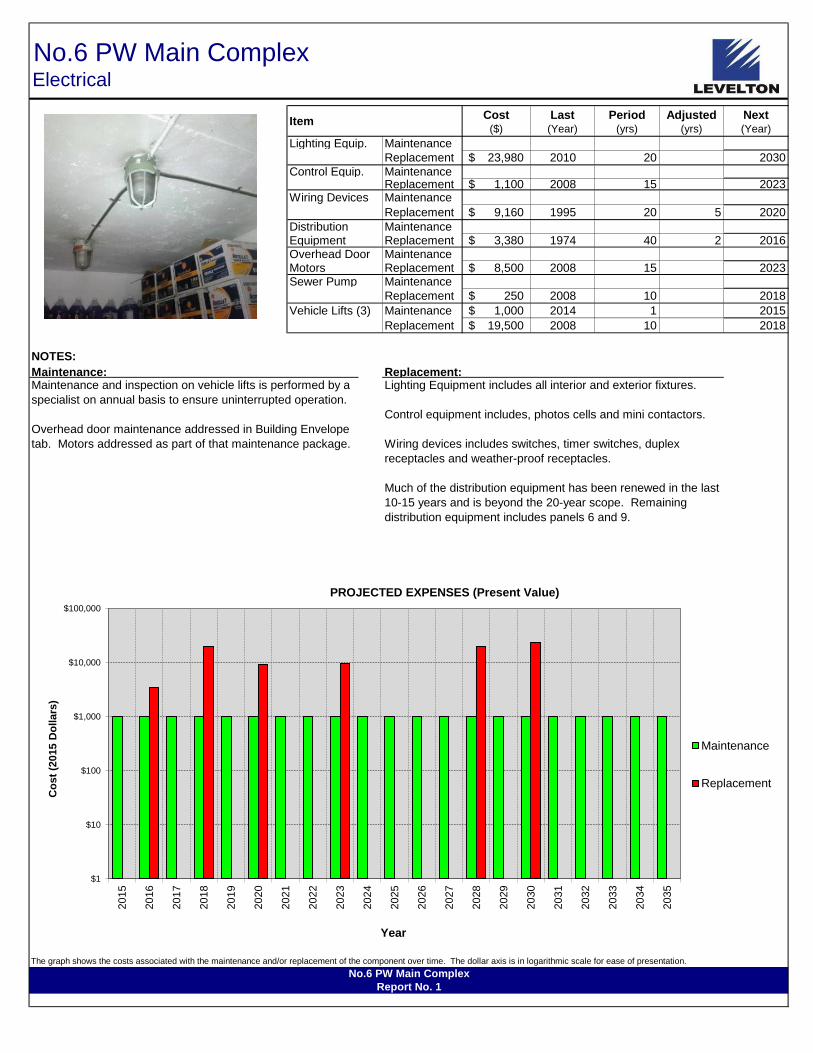
ItemCost
($)
Last(Year)
Period(yrs)
Adjusted(yrs)
Next(Year)
Lighting Equip. Maintenance
Replacement 23,980$ 2010 20 2030
Control Equip. MaintenanceReplacement 1,100$ 2008 15 2023
Wiring Devices Maintenance
Replacement 9,160$ 1995 20 5 2020
Distribution MaintenanceEquipment Replacement 3,380$ 1974 40 2 2016Overhead Door MaintenanceMotors Replacement 8,500$ 2008 15 2023Sewer Pump Maintenance
Replacement 250$ 2008 10 2018
Vehicle Lifts (3) Maintenance 1,000$ 2014 1 2015
Replacement 19,500$ 2008 10 2018
NOTES:
No.6 PW Main ComplexElectrical
Maintenance: Replacement:Maintenance and inspection on vehicle lifts is performed by a
specialist on annual basis to ensure uninterrupted operation.
Overhead door maintenance addressed in Building Envelope
tab. Motors addressed as part of that maintenance package.
Lighting Equipment includes all interior and exterior fixtures.
Control equipment includes, photos cells and mini contactors.
Wiring devices includes switches, timer switches, duplex
receptacles and weather-proof receptacles.
Much of the distribution equipment has been renewed in the last
10-15 years and is beyond the 20-year scope. Remaining
distribution equipment includes panels 6 and 9.
The graph shows the costs associated with the maintenance and/or replacement of the component over time. The dollar axis is in logarithmic scale for ease of presentation.
No.6 PW Main Complex
Report No. 1
$1
$10
$100
$1,000
$10,000
$100,000
20
15
20
16
20
17
20
18
20
19
20
20
20
21
20
22
20
23
20
24
20
25
20
26
20
27
20
28
20
29
20
30
20
31
20
32
20
33
20
34
20
35
Co
st
(2015 D
ollars
)
Year
PROJECTED EXPENSES (Present Value)
Maintenance
Replacement
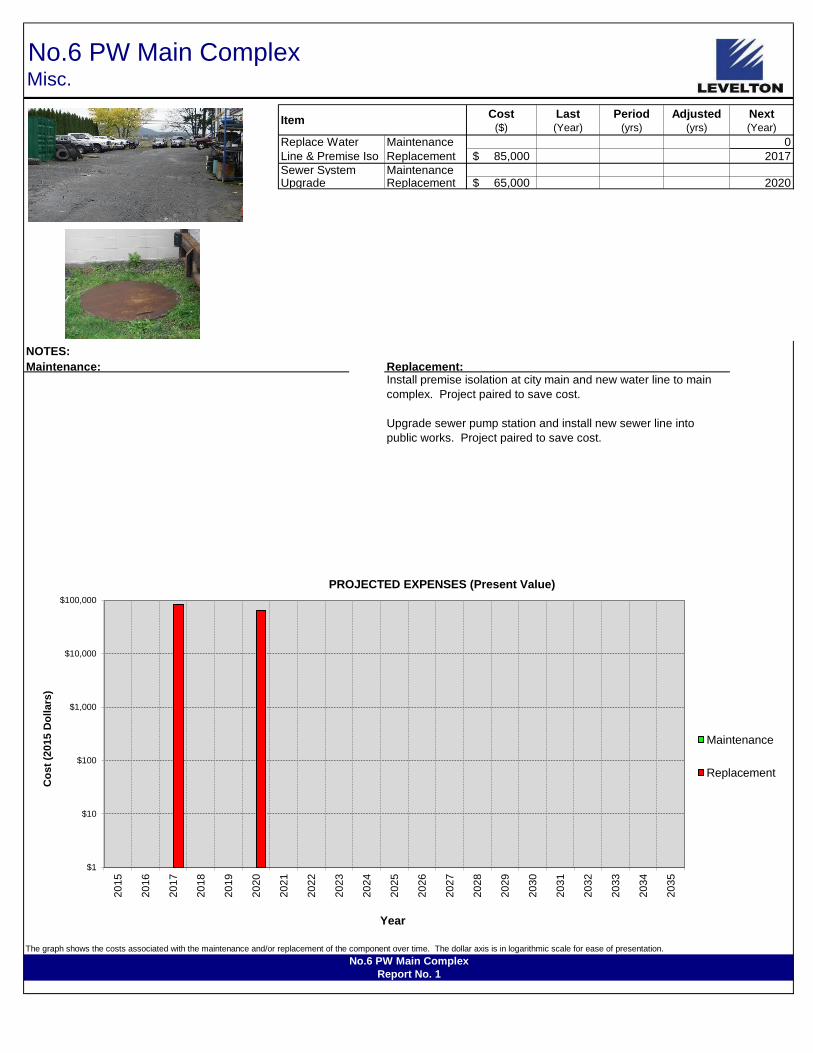
ItemCost
($)
Last(Year)
Period(yrs)
Adjusted(yrs)
Next(Year)
Replace Water Maintenance 0
Line & Premise Iso Replacement 85,000$ 2017
Sewer System MaintenanceUpgrade Replacement 65,000$ 2020
NOTES:
No.6 PW Main ComplexMisc.
Maintenance: Replacement:Install premise isolation at city main and new water line to main
complex. Project paired to save cost.
Upgrade sewer pump station and install new sewer line into
public works. Project paired to save cost.
The graph shows the costs associated with the maintenance and/or replacement of the component over time. The dollar axis is in logarithmic scale for ease of presentation.
No.6 PW Main Complex
Report No. 1
$1
$10
$100
$1,000
$10,000
$100,000
20
15
20
16
20
17
20
18
20
19
20
20
20
21
20
22
20
23
20
24
20
25
20
26
20
27
20
28
20
29
20
30
20
31
20
32
20
33
20
34
20
35
Co
st
(201
5 D
oll
ars
)
Year
PROJECTED EXPENSES (Present Value)
Maintenance
Replacement
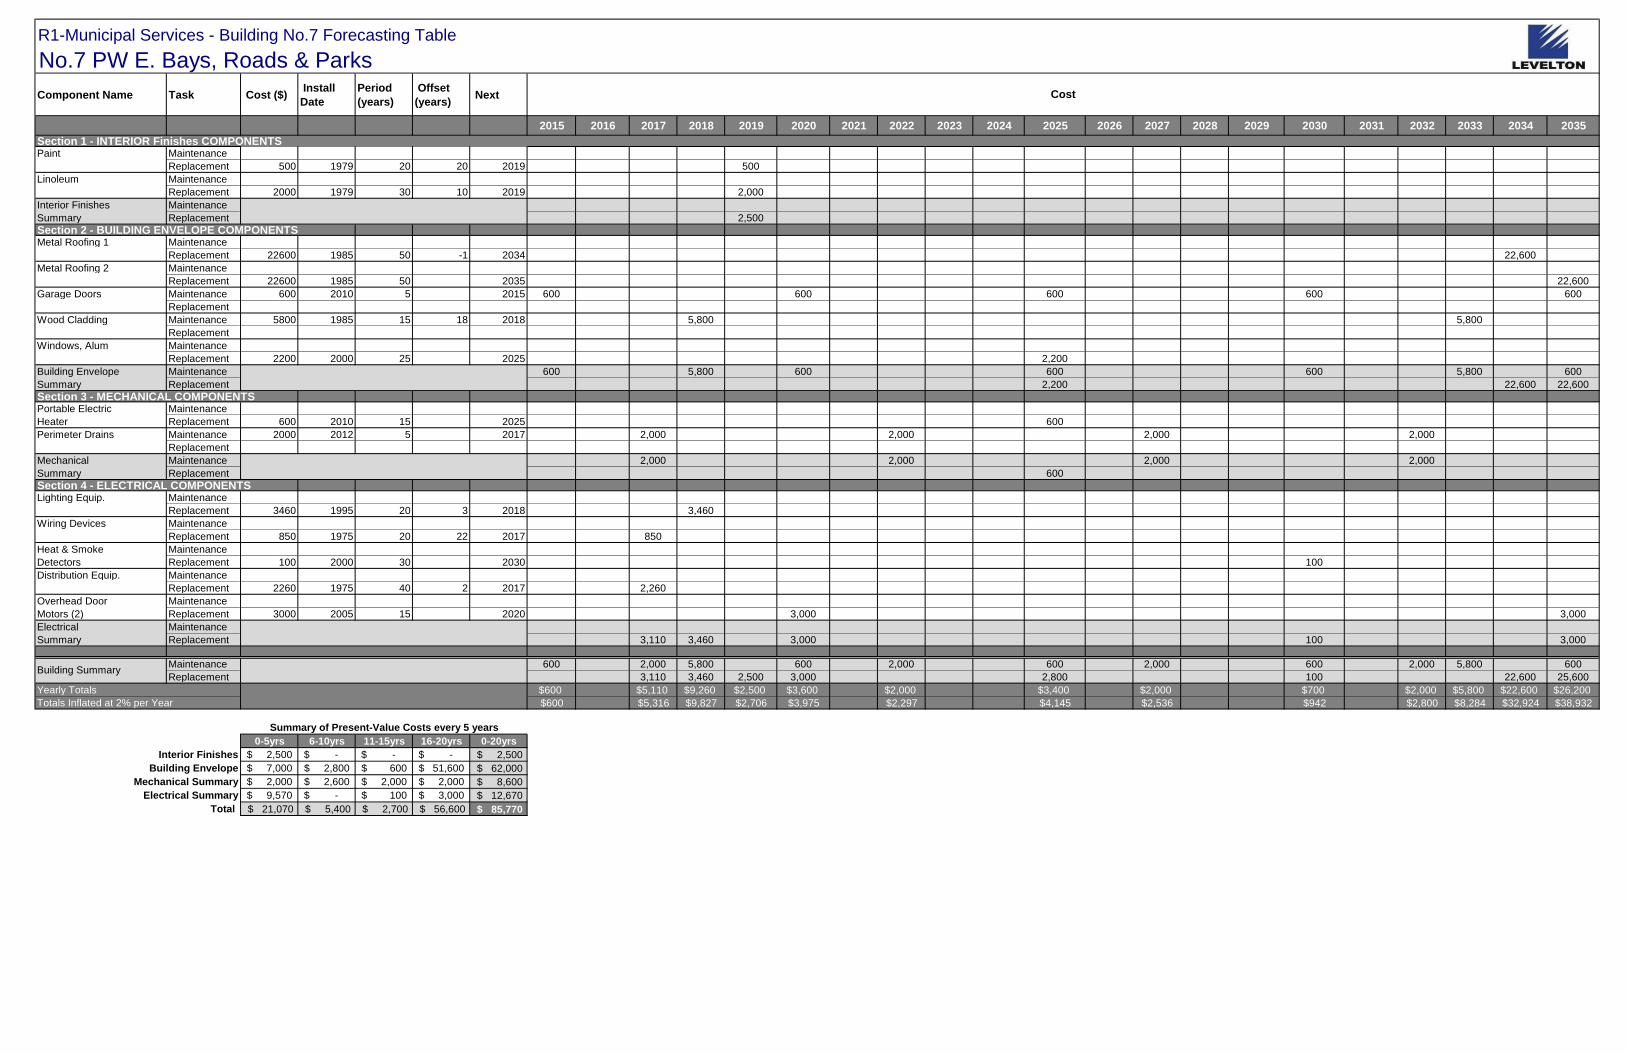
R1-Municipal Services - Building No.7 Forecasting Table
No.7 PW E. Bays, Roads & Parks
Component Name Task Cost ($) Install
Date
Period
(years)
Offset
(years) Next
2015 2016 2017 2018 2019 2020 2021 2022 2023 2024 2025 2026 2027 2028 2029 2030 2031 2032 2033 2034 2035
Section 1 - INTERIOR Finishes COMPONENTSPaint Maintenance
Replacement 500 1979 20 20 2019 500
Linoleum Maintenance
Replacement 2000 1979 30 10 2019 2,000
Interior Finishes Maintenance
Summary Replacement 2,500
Section 2 - BUILDING ENVELOPE COMPONENTSMetal Roofing 1 Maintenance
Replacement 22600 1985 50 -1 2034 22,600
Metal Roofing 2 Maintenance
Replacement 22600 1985 50 2035 22,600
Garage Doors Maintenance 600 2010 5 2015 600 600 600 600 600
Replacement
Wood Cladding Maintenance 5800 1985 15 18 2018 5,800 5,800
Replacement
Windows, Alum Maintenance
Replacement 2200 2000 25 2025 2,200
Building Envelope Maintenance 600 5,800 600 600 600 5,800 600
Summary Replacement 2,200 22,600 22,600
Section 3 - MECHANICAL COMPONENTSPortable Electric Maintenance
Heater Replacement 600 2010 15 2025 600
Perimeter Drains Maintenance 2000 2012 5 2017 2,000 2,000 2,000 2,000
Replacement
Mechanical Maintenance 2,000 2,000 2,000 2,000
Summary Replacement 600
Section 4 - ELECTRICAL COMPONENTSLighting Equip. Maintenance
Replacement 3460 1995 20 3 2018 3,460
Wiring Devices Maintenance
Replacement 850 1975 20 22 2017 850
Heat & Smoke Maintenance
Detectors Replacement 100 2000 30 2030 100
Distribution Equip. Maintenance
Replacement 2260 1975 40 2 2017 2,260
Overhead Door Maintenance
Motors (2) Replacement 3000 2005 15 2020 3,000 3,000
Electrical Maintenance
Summary Replacement 3,110 3,460 3,000 100 3,000
Maintenance 600 2,000 5,800 600 2,000 600 2,000 600 2,000 5,800 600
Replacement 3,110 3,460 2,500 3,000 2,800 100 22,600 25,600
Yearly Totals $600 $5,110 $9,260 $2,500 $3,600 $2,000 $3,400 $2,000 $700 $2,000 $5,800 $22,600 $26,200
Totals Inflated at 2% per Year $600 $5,316 $9,827 $2,706 $3,975 $2,297 $4,145 $2,536 $942 $2,800 $8,284 $32,924 $38,932
0-5yrs 6-10yrs 11-15yrs 16-20yrs 0-20yrs
Interior Finishes 2,500$ -$ -$ -$ $ 2,500
Building Envelope 7,000$ 2,800$ 600$ 51,600$ $ 62,000
Mechanical Summary 2,000$ 2,600$ 2,000$ 2,000$ $ 8,600
Electrical Summary 9,570$ -$ 100$ 3,000$ $ 12,670
Total $ 21,070 $ 5,400 $ 2,700 $ 56,600 $ 85,770
Cost
Building Summary
Summary of Present-Value Costs every 5 years
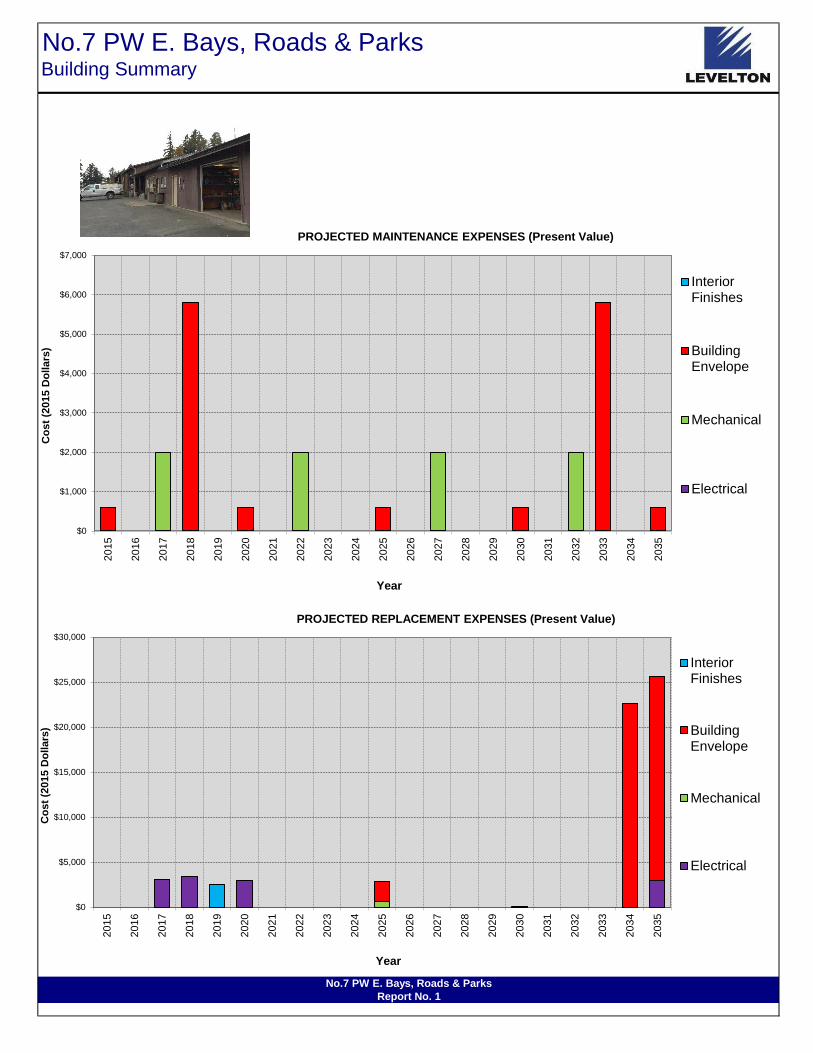
No.7 PW E. Bays, Roads & ParksBuilding Summary
No.7 PW E. Bays, Roads & Parks
Report No. 1
$0
$5,000
$10,000
$15,000
$20,000
$25,000
$30,000
20
15
20
16
20
17
20
18
20
19
20
20
20
21
20
22
20
23
20
24
20
25
20
26
20
27
20
28
20
29
20
30
20
31
20
32
20
33
20
34
20
35
Co
st
(201
5 D
oll
ars
)
Year
PROJECTED REPLACEMENT EXPENSES (Present Value)
InteriorFinishes
BuildingEnvelope
Mechanical
Electrical
$0
$1,000
$2,000
$3,000
$4,000
$5,000
$6,000
$7,000
20
15
20
16
20
17
20
18
20
19
20
20
20
21
20
22
20
23
20
24
20
25
20
26
20
27
20
28
20
29
20
30
20
31
20
32
20
33
20
34
20
35
Co
st
(201
5 D
oll
ars
)
Year
PROJECTED MAINTENANCE EXPENSES (Present Value)
InteriorFinishes
BuildingEnvelope
Mechanical
Electrical

ItemCost
($)
Last(Year)
Period(yrs)
Adjusted(yrs)
Next(Year)
Paint Maintenance
Replacement 500$ 1979 20 20 2019
Linoleum MaintenanceReplacement 2,000$ 1979 30 10 2019
NOTES:
No.7 PW E. Bays, Roads & ParksInterior Finishes
Maintenance: Replacement:Maintenance of Finishes not significant to itemize. Interior Finishes replacement limited to park office spaces.
Replacement period extended for priorities of building.
The graph shows the costs associated with the maintenance and/or replacement of the component over time. The dollar axis is in logarithmic scale for ease of presentation.
No.7 PW E. Bays, Roads & Parks
Report No. 1
$1
$10
$100
$1,000
$10,000
20
15
20
16
20
17
20
18
20
19
20
20
20
21
20
22
20
23
20
24
20
25
20
26
20
27
20
28
20
29
20
30
20
31
20
32
20
33
20
34
20
35
Co
st
(2015 D
ollars
)
Year
PROJECTED EXPENSES (Present Value)
Maintenance
Replacement

ItemCost
($)
Last(Year)
Period(yrs)
Adjusted(yrs)
Next(Year)
Metal Roofing 1 Maintenance
Replacement 22,600$ 1985 50 -1 2034
Metal Roofing 2 Maintenance -$ Replacement 22,600$ 1985 50 2035
Garage Doors Maintenance 600$ 2010 5 2015
Replacement -$
Wood Cladding Maintenance 5,800$ 1985 15 18 2018
Replacement
Windows, Alum MaintenanceReplacement 2,200$ 2000 25 2025
NOTES:
No.7 PW E. Bays, Roads & ParksBuilding Envelope
Maintenance: Replacement:Garage doors are important to operations of building so
given 5-year maintenance period to adjust and replace any
hardware.
Wood siding and plywood should be repainted in next 5
years to maintain integrity of structure.
Metal roofing limited to roads section due to age. Corrosion
should be monitored.
Windows replacement limited to parks office. Includes new
frame, IGU and labour.
The graph shows the costs associated with the maintenance and/or replacement of the component over time. The dollar axis is in logarithmic scale for ease of presentation.
No.7 PW E. Bays, Roads & Parks
Report No. 1
$1
$10
$100
$1,000
$10,000
$100,000
20
15
20
16
20
17
20
18
20
19
20
20
20
21
20
22
20
23
20
24
20
25
20
26
20
27
20
28
20
29
20
30
20
31
20
32
20
33
20
34
20
35
Co
st
(201
5 D
oll
ars
)
Year
PROJECTED EXPENSES (Present Value)
Maintenance
Replacement
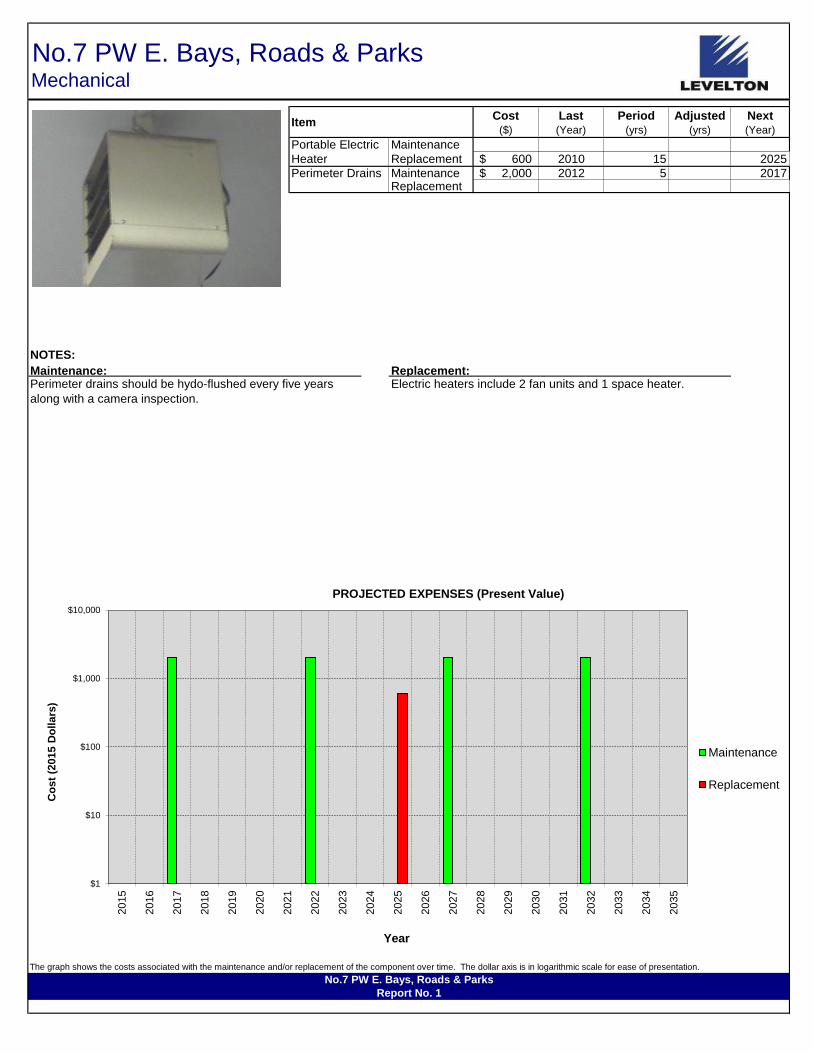
ItemCost
($)
Last(Year)
Period(yrs)
Adjusted(yrs)
Next(Year)
Portable Electric Maintenance
Heater Replacement 600$ 2010 15 2025
Perimeter Drains Maintenance 2,000$ 2012 5 2017Replacement
NOTES:
No.7 PW E. Bays, Roads & ParksMechanical
Maintenance: Replacement:Perimeter drains should be hydo-flushed every five years
along with a camera inspection.
Electric heaters include 2 fan units and 1 space heater.
The graph shows the costs associated with the maintenance and/or replacement of the component over time. The dollar axis is in logarithmic scale for ease of presentation.
No.7 PW E. Bays, Roads & Parks
Report No. 1
$1
$10
$100
$1,000
$10,000
20
15
20
16
20
17
20
18
20
19
20
20
20
21
20
22
20
23
20
24
20
25
20
26
20
27
20
28
20
29
20
30
20
31
20
32
20
33
20
34
20
35
Co
st
(201
5 D
oll
ars
)
Year
PROJECTED EXPENSES (Present Value)
Maintenance
Replacement
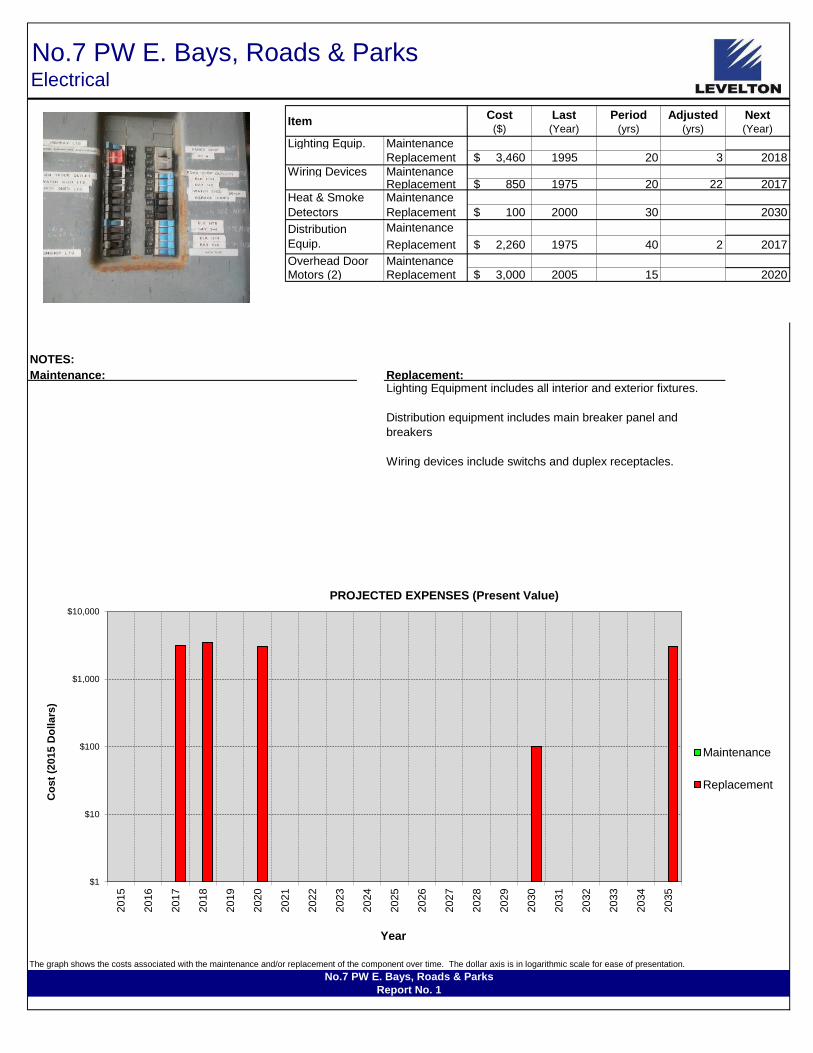
ItemCost
($)
Last(Year)
Period(yrs)
Adjusted(yrs)
Next(Year)
Lighting Equip. Maintenance
Replacement 3,460$ 1995 20 3 2018
Wiring Devices MaintenanceReplacement 850$ 1975 20 22 2017
Heat & Smoke Maintenance
Detectors Replacement 100$ 2000 30 2030
Maintenance
Replacement 2,260$ 1975 40 2 2017
Overhead Door MaintenanceMotors (2) Replacement 3,000$ 2005 15 2020
NOTES:
No.7 PW E. Bays, Roads & ParksElectrical
Maintenance: Replacement:Lighting Equipment includes all interior and exterior fixtures.
Distribution equipment includes main breaker panel and
breakers
Wiring devices include switchs and duplex receptacles.
Distribution
Equip.
The graph shows the costs associated with the maintenance and/or replacement of the component over time. The dollar axis is in logarithmic scale for ease of presentation.
No.7 PW E. Bays, Roads & Parks
Report No. 1
$1
$10
$100
$1,000
$10,000
20
15
20
16
20
17
20
18
20
19
20
20
20
21
20
22
20
23
20
24
20
25
20
26
20
27
20
28
20
29
20
30
20
31
20
32
20
33
20
34
20
35
Co
st
(2015 D
ollars
)
Year
PROJECTED EXPENSES (Present Value)
Maintenance
Replacement
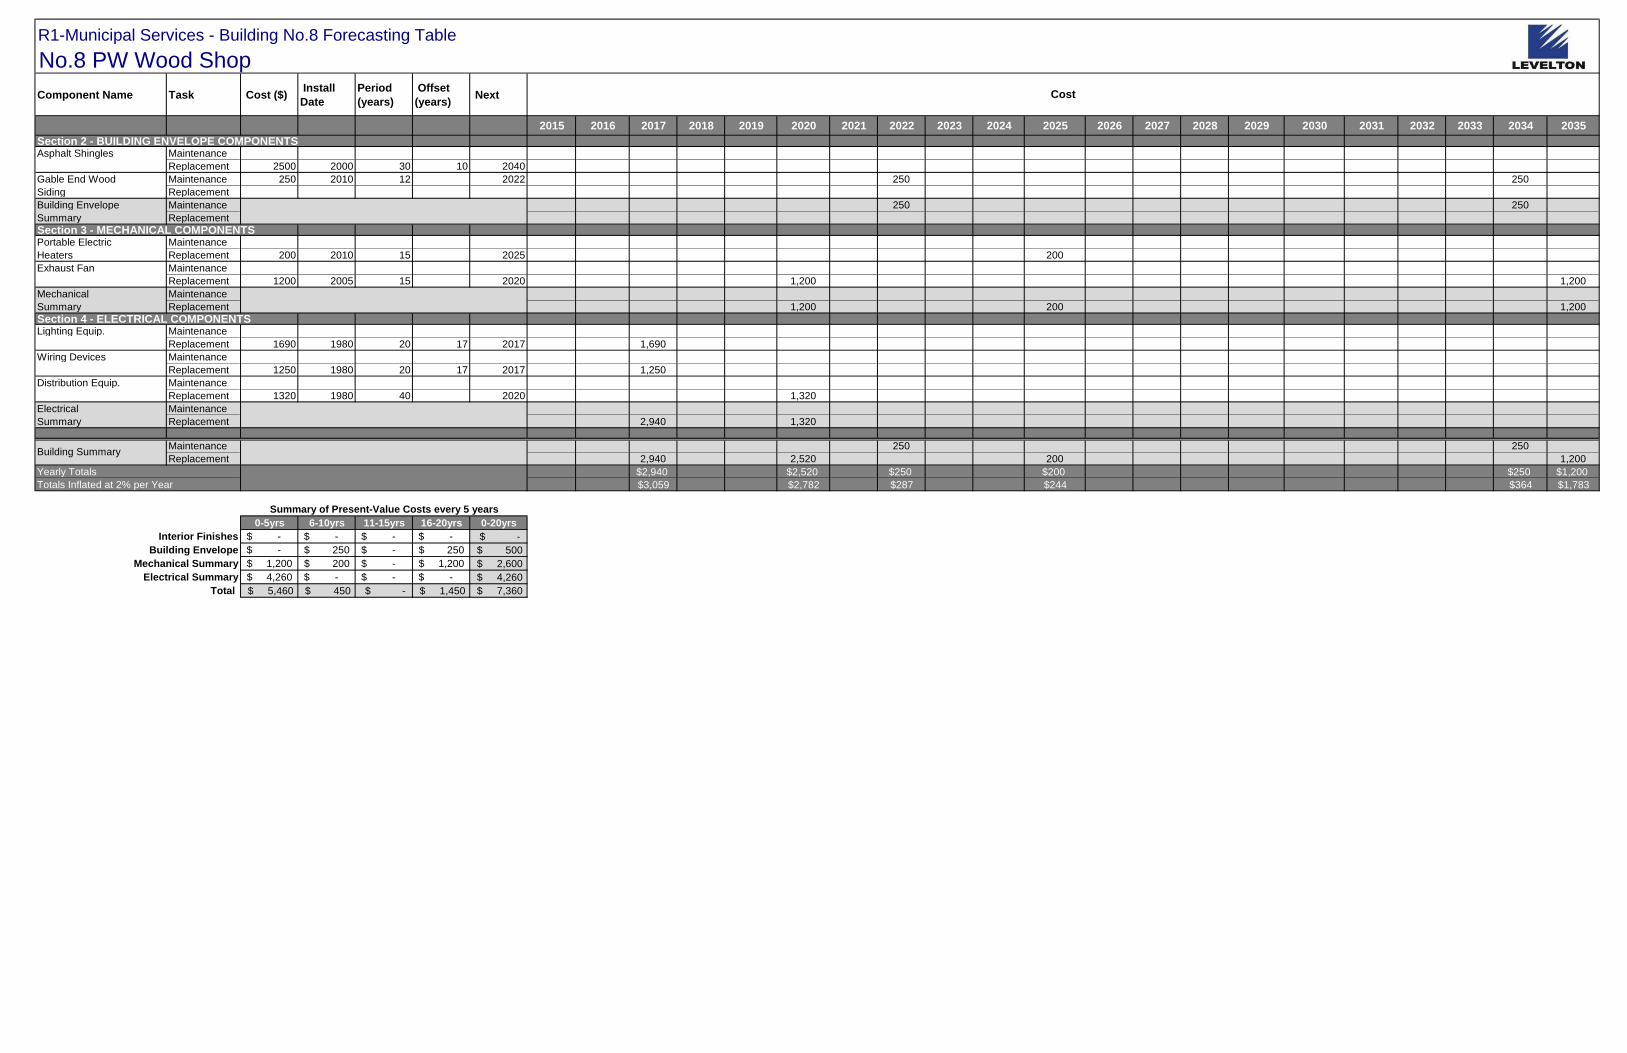
R1-Municipal Services - Building No.8 Forecasting Table
No.8 PW Wood Shop
Component Name Task Cost ($) Install
Date
Period
(years)
Offset
(years) Next
2015 2016 2017 2018 2019 2020 2021 2022 2023 2024 2025 2026 2027 2028 2029 2030 2031 2032 2033 2034 2035
Section 2 - BUILDING ENVELOPE COMPONENTSAsphalt Shingles Maintenance
Replacement 2500 2000 30 10 2040
Gable End Wood Maintenance 250 2010 12 2022 250 250
Siding Replacement
Building Envelope Maintenance 250 250
Summary Replacement
Section 3 - MECHANICAL COMPONENTSPortable Electric Maintenance
Heaters Replacement 200 2010 15 2025 200
Exhaust Fan Maintenance
Replacement 1200 2005 15 2020 1,200 1,200
Mechanical Maintenance
Summary Replacement 1,200 200 1,200
Section 4 - ELECTRICAL COMPONENTSLighting Equip. Maintenance
Replacement 1690 1980 20 17 2017 1,690
Wiring Devices Maintenance
Replacement 1250 1980 20 17 2017 1,250
Distribution Equip. Maintenance
Replacement 1320 1980 40 2020 1,320
Electrical Maintenance
Summary Replacement 2,940 1,320
Maintenance 250 250
Replacement 2,940 2,520 200 1,200
Yearly Totals $2,940 $2,520 $250 $200 $250 $1,200
Totals Inflated at 2% per Year $3,059 $2,782 $287 $244 $364 $1,783
0-5yrs 6-10yrs 11-15yrs 16-20yrs 0-20yrs
Interior Finishes -$ -$ -$ -$ $ -
Building Envelope -$ 250$ -$ 250$ $ 500
Mechanical Summary 1,200$ 200$ -$ 1,200$ $ 2,600
Electrical Summary 4,260$ -$ -$ -$ $ 4,260
Total $ 5,460 $ 450 $ - $ 1,450 $ 7,360
Cost
Building Summary
Summary of Present-Value Costs every 5 years

No.8 PW Wood ShopBuilding Summary
No.8 PW Wood Shop
Report No. 1
$0
$500
$1,000
$1,500
$2,000
$2,500
$3,000
$3,500
20
15
20
16
20
17
20
18
20
19
20
20
20
21
20
22
20
23
20
24
20
25
20
26
20
27
20
28
20
29
20
30
20
31
20
32
20
33
20
34
20
35
Co
st
(201
5 D
oll
ars
)
Year
PROJECTED REPLACEMENT EXPENSES (Present Value)
BuildingEnvelope
Mechanical
Electrical
$0
$50
$100
$150
$200
$250
$300
20
15
20
16
20
17
20
18
20
19
20
20
20
21
20
22
20
23
20
24
20
25
20
26
20
27
20
28
20
29
20
30
20
31
20
32
20
33
20
34
20
35
Co
st
(201
5 D
oll
ars
)
Year
PROJECTED MAINTENANCE EXPENSES (Present Value)
BuildingEnvelope
Mechanical
Electrical

ItemCost
($)
Last(Year)
Period(yrs)
Adjusted(yrs)
Next(Year)
Asphalt Shingles Maintenance
Replacement 2,500$ 2000 30 10 2040
Gable End Wood Maintenance 250$ 2010 12 2022Siding Replacement
NOTES:
No.8 PW Wood ShopBuilding Envelope
Maintenance: Replacement:Maintenance of gable wood board includes repainting. Asphalt shingle replacement beyond scope of report.
Replacement period adjusted for priority of building.
Restorative Maintenance:
Replace lower five rows of vinyl siding (degraded) around building perimeter.
The graph shows the costs associated with the maintenance and/or replacement of the component over time. The dollar axis is in logarithmic scale for ease of presentation.
No.8 PW Wood Shop
Report No. 1
$1
$10
$100
$1,000
20
15
20
16
20
17
20
18
20
19
20
20
20
21
20
22
20
23
20
24
20
25
20
26
20
27
20
28
20
29
20
30
20
31
20
32
20
33
20
34
20
35
Co
st
(2015 D
ollars
)
Year
PROJECTED EXPENSES (Present Value)
Maintenance
Replacement
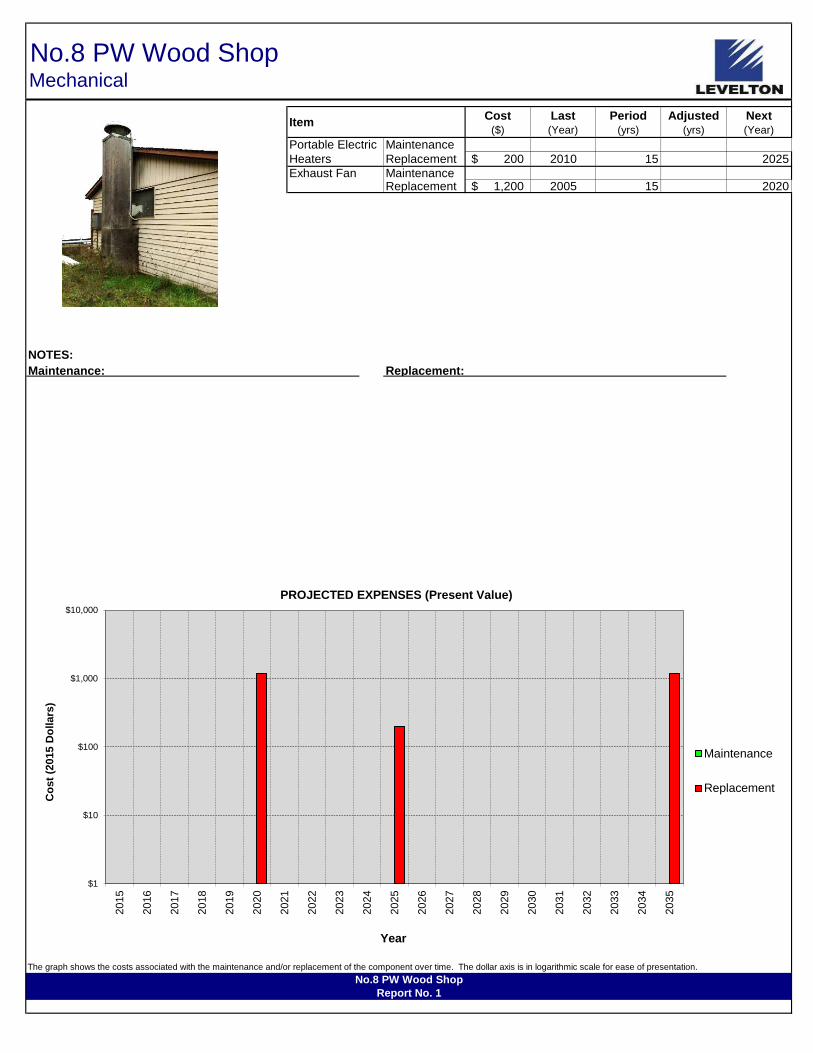
ItemCost
($)
Last(Year)
Period(yrs)
Adjusted(yrs)
Next(Year)
Portable Electric Maintenance
Heaters Replacement 200$ 2010 15 2025
Exhaust Fan MaintenanceReplacement 1,200$ 2005 15 2020
NOTES:
No.8 PW Wood ShopMechanical
Maintenance: Replacement:
The graph shows the costs associated with the maintenance and/or replacement of the component over time. The dollar axis is in logarithmic scale for ease of presentation.
No.8 PW Wood Shop
Report No. 1
$1
$10
$100
$1,000
$10,000
20
15
20
16
20
17
20
18
20
19
20
20
20
21
20
22
20
23
20
24
20
25
20
26
20
27
20
28
20
29
20
30
20
31
20
32
20
33
20
34
20
35
Co
st
(2015 D
ollars
)
Year
PROJECTED EXPENSES (Present Value)
Maintenance
Replacement
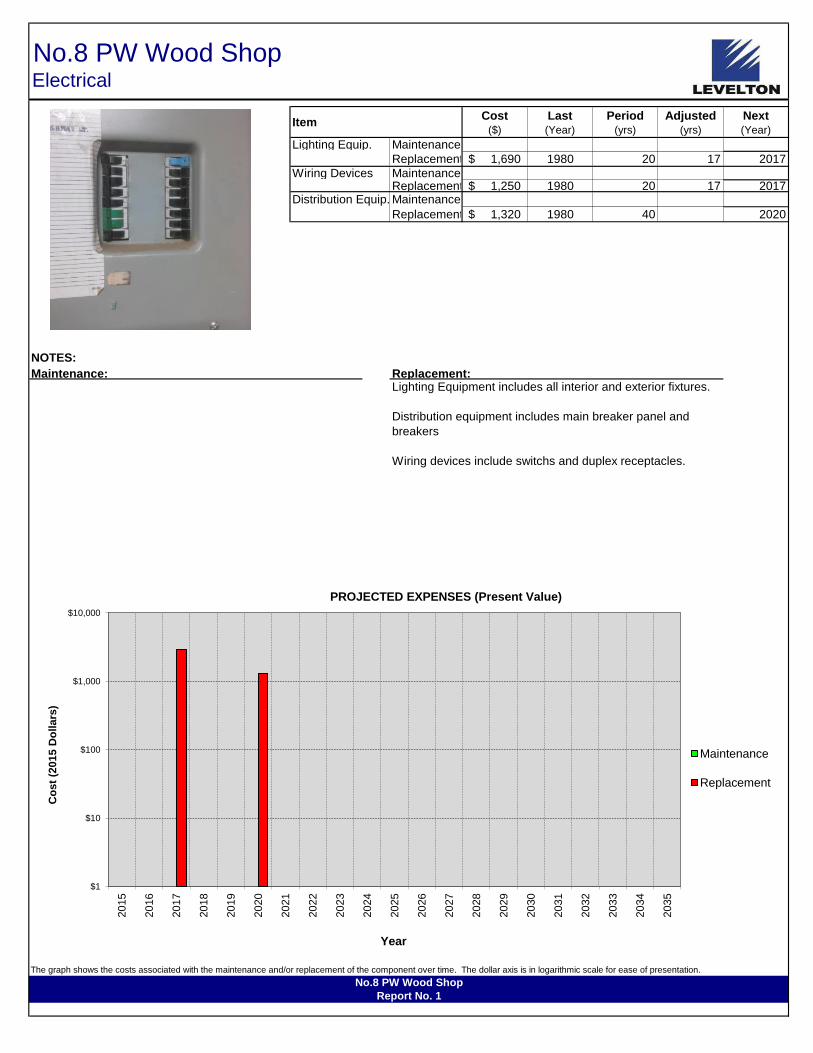
ItemCost
($)
Last(Year)
Period(yrs)
Adjusted(yrs)
Next(Year)
Lighting Equip. Maintenance
Replacement 1,690$ 1980 20 17 2017
Wiring Devices MaintenanceReplacement 1,250$ 1980 20 17 2017
Distribution Equip. Maintenance
Replacement 1,320$ 1980 40 2020
NOTES:
No.8 PW Wood ShopElectrical
Maintenance: Replacement:Lighting Equipment includes all interior and exterior fixtures.
Distribution equipment includes main breaker panel and
breakers
Wiring devices include switchs and duplex receptacles.
The graph shows the costs associated with the maintenance and/or replacement of the component over time. The dollar axis is in logarithmic scale for ease of presentation.
No.8 PW Wood Shop
Report No. 1
$1
$10
$100
$1,000
$10,000
20
15
20
16
20
17
20
18
20
19
20
20
20
21
20
22
20
23
20
24
20
25
20
26
20
27
20
28
20
29
20
30
20
31
20
32
20
33
20
34
20
35
Co
st
(2015 D
ollars
)
Year
PROJECTED EXPENSES (Present Value)
Maintenance
Replacement

R1-Municipal Services - Building No.45 Forecasting Table
No.45 PW Equipment Shed
Component Name Task Cost ($) Install
Date
Period
(years)
Offset
(years) Next
2015 2016 2017 2018 2019 2020 2021 2022 2023 2024 2025 2026 2027 2028 2029 2030 2031 2032 2033 2034 2035
Section 2 - BUILDING ENVELOPE COMPONENTSMetal-Clad Door Maintenance 350 1995 25 2020 350
Replacement
Wood Roll-Up Maintenance
Door Replacement 500 1995 25 2020 500
SBS Membrane Maintenance
Replacement 1300 1995 25 2020 1,300
Building Envelope Maintenance 350
Summary Replacement 1,800
Maintenance 350
Replacement 1,800
Yearly Totals $2,150
Totals Inflated at 2% per Year $2,374
0-5yrs 6-10yrs 11-15yrs 16-20yrs 0-20yrs
Interior Finishes -$ -$ -$ -$ $ -
Building Envelope 2,150$ -$ -$ -$ $ 2,150
Mechanical Summary -$ -$ -$ -$ $ -
Electrical Summary -$ -$ -$ -$ $ -
Total $ 2,150 $ - $ - $ - $ 2,150
Building Summary
Summary of Present-Value Costs every 5 years
Cost

No.45 PW Equipment ShedBuilding Summary
No.45 PW Equipment Shed
Report No. 1
$0
$200
$400
$600
$800
$1,000
$1,200
$1,400
$1,600
$1,800
$2,000
20
15
20
16
20
17
20
18
20
19
20
20
20
21
20
22
20
23
20
24
20
25
20
26
20
27
20
28
20
29
20
30
20
31
20
32
20
33
20
34
20
35
Co
st
(201
5 D
oll
ars
)
Year
PROJECTED REPLACEMENT EXPENSES (Present Value)
BuildingEnvelope
$0
$50
$100
$150
$200
$250
$300
$350
$400
20
15
20
16
20
17
20
18
20
19
20
20
20
21
20
22
20
23
20
24
20
25
20
26
20
27
20
28
20
29
20
30
20
31
20
32
20
33
20
34
20
35
Co
st
(201
5 D
oll
ars
)
Year
PROJECTED MAINTENANCE EXPENSES (Present Value)
BuildingEnvelope

ItemCost
($)
Last(Year)
Period(yrs)
Adjusted(yrs)
Next(Year)
Metal-Clad Door Maintenance 350$ 1995 25 2020
Replacement
Wood Roll-Up MaintenanceDoor Replacement 500$ 1995 25 2020SBS Membrane Maintenance
Replacement 1,300$ 1995 25 2020
NOTES:
No.45 PW Equipment ShedBuilding Envelope
Maintenance: Replacement:Maintenance for this shed is assumed to be performed as
needed and at low cost in relation to the other buildings at the
yard.
In year 2020 the doors and roofing membrane are anticipated
for replacement. The items are grouped together for cost
savings.
Metal sheet cladding is not anticipated for replacement
The graph shows the costs associated with the maintenance and/or replacement of the component over time. The dollar axis is in logarithmic scale for ease of presentation.
No.45 PW Equipment Shed
Report No. 1
$1
$10
$100
$1,000
$10,000
20
15
20
16
20
17
20
18
20
19
20
20
20
21
20
22
20
23
20
24
20
25
20
26
20
27
20
28
20
29
20
30
20
31
20
32
20
33
20
34
20
35
Co
st
(2015 D
ollars
)
Year
PROJECTED EXPENSES (Present Value)
Maintenance
Replacement
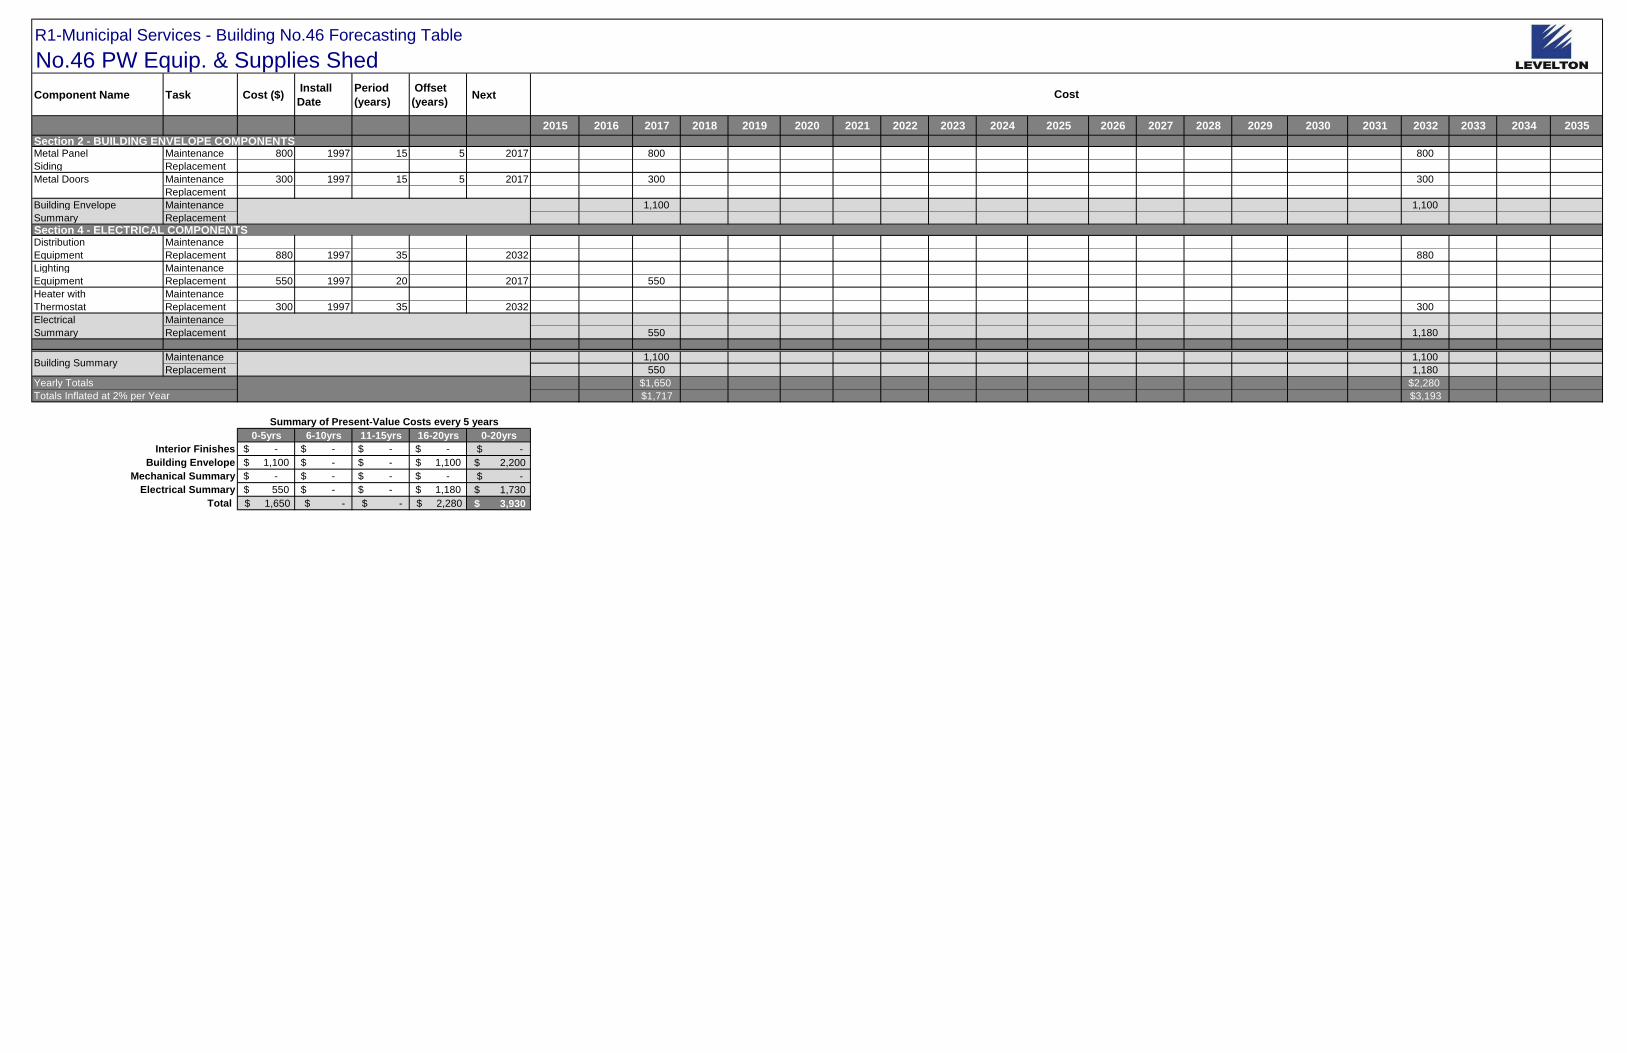
R1-Municipal Services - Building No.46 Forecasting Table
No.46 PW Equip. & Supplies Shed
Component Name Task Cost ($) Install
Date
Period
(years)
Offset
(years) Next
2015 2016 2017 2018 2019 2020 2021 2022 2023 2024 2025 2026 2027 2028 2029 2030 2031 2032 2033 2034 2035
Section 2 - BUILDING ENVELOPE COMPONENTSMetal Panel Maintenance 800 1997 15 5 2017 800 800
Siding Replacement
Metal Doors Maintenance 300 1997 15 5 2017 300 300
Replacement
Building Envelope Maintenance 1,100 1,100
Summary Replacement
Section 4 - ELECTRICAL COMPONENTSDistribution Maintenance
Equipment Replacement 880 1997 35 2032 880
Lighting Maintenance
Equipment Replacement 550 1997 20 2017 550
Heater with Maintenance
Thermostat Replacement 300 1997 35 2032 300
Electrical Maintenance
Summary Replacement 550 1,180
Maintenance 1,100 1,100
Replacement 550 1,180
Yearly Totals $1,650 $2,280
Totals Inflated at 2% per Year $1,717 $3,193
0-5yrs 6-10yrs 11-15yrs 16-20yrs 0-20yrs
Interior Finishes -$ -$ -$ -$ $ -
Building Envelope 1,100$ -$ -$ 1,100$ $ 2,200
Mechanical Summary -$ -$ -$ -$ $ -
Electrical Summary 550$ -$ -$ 1,180$ $ 1,730
Total $ 1,650 $ - $ - $ 2,280 $ 3,930
Building Summary
Summary of Present-Value Costs every 5 years
Cost
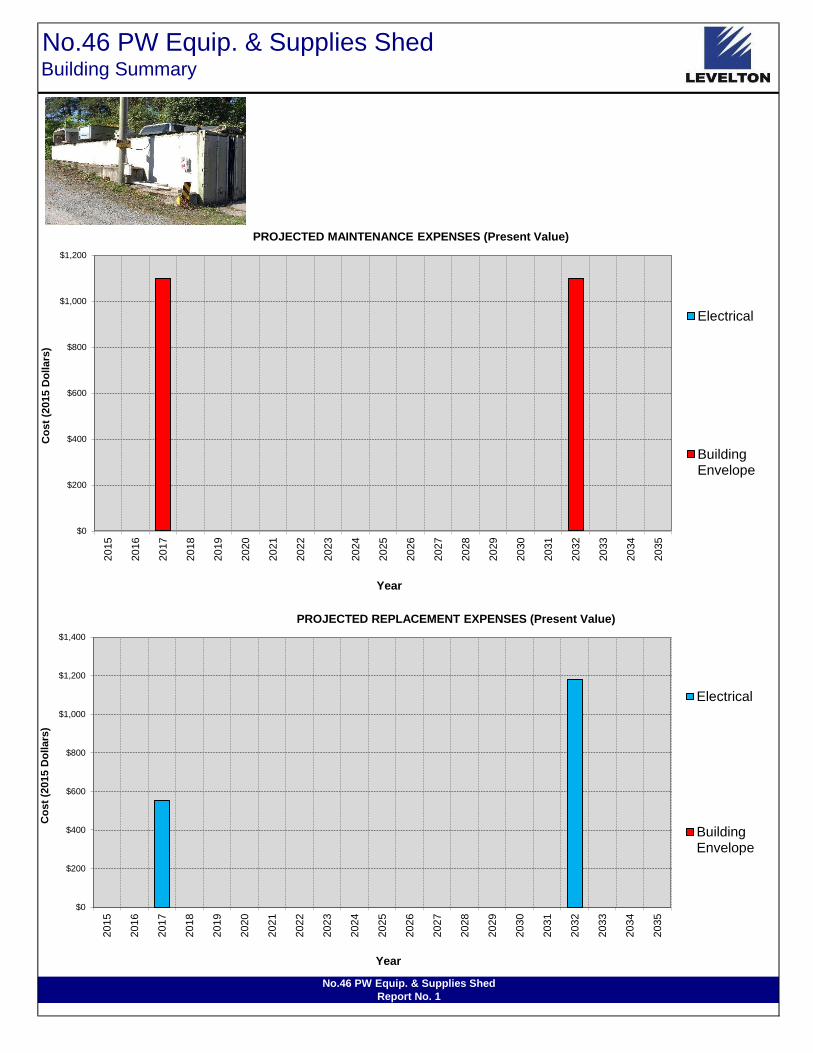
No.46 PW Equip. & Supplies ShedBuilding Summary
No.46 PW Equip. & Supplies Shed
Report No. 1
$0
$200
$400
$600
$800
$1,000
$1,200
$1,400
20
15
20
16
20
17
20
18
20
19
20
20
20
21
20
22
20
23
20
24
20
25
20
26
20
27
20
28
20
29
20
30
20
31
20
32
20
33
20
34
20
35
Co
st
(201
5 D
oll
ars
)
Year
PROJECTED REPLACEMENT EXPENSES (Present Value)
Electrical
BuildingEnvelope
$0
$200
$400
$600
$800
$1,000
$1,200
20
15
20
16
20
17
20
18
20
19
20
20
20
21
20
22
20
23
20
24
20
25
20
26
20
27
20
28
20
29
20
30
20
31
20
32
20
33
20
34
20
35
Co
st
(201
5 D
oll
ars
)
Year
PROJECTED MAINTENANCE EXPENSES (Present Value)
Electrical
BuildingEnvelope
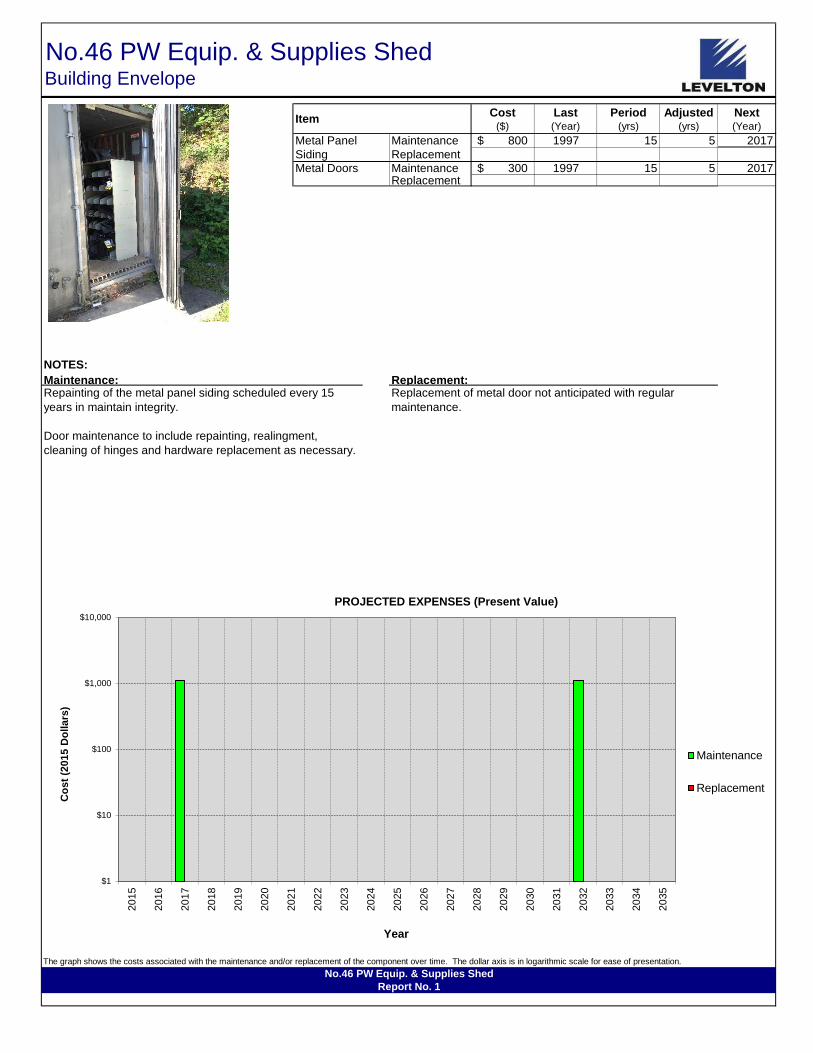
ItemCost
($)
Last(Year)
Period(yrs)
Adjusted(yrs)
Next(Year)
Metal Panel Maintenance 800$ 1997 15 5 2017
Siding Replacement
Metal Doors Maintenance 300$ 1997 15 5 2017Replacement
NOTES:
No.46 PW Equip. & Supplies ShedBuilding Envelope
Maintenance: Replacement:Repainting of the metal panel siding scheduled every 15
years in maintain integrity.
Door maintenance to include repainting, realingment,
cleaning of hinges and hardware replacement as necessary.
Replacement of metal door not anticipated with regular
maintenance.
The graph shows the costs associated with the maintenance and/or replacement of the component over time. The dollar axis is in logarithmic scale for ease of presentation.
No.46 PW Equip. & Supplies Shed
Report No. 1
$1
$10
$100
$1,000
$10,000
20
15
20
16
20
17
20
18
20
19
20
20
20
21
20
22
20
23
20
24
20
25
20
26
20
27
20
28
20
29
20
30
20
31
20
32
20
33
20
34
20
35
Co
st
(20
15
Do
lla
rs)
Year
PROJECTED EXPENSES (Present Value)
Maintenance
Replacement
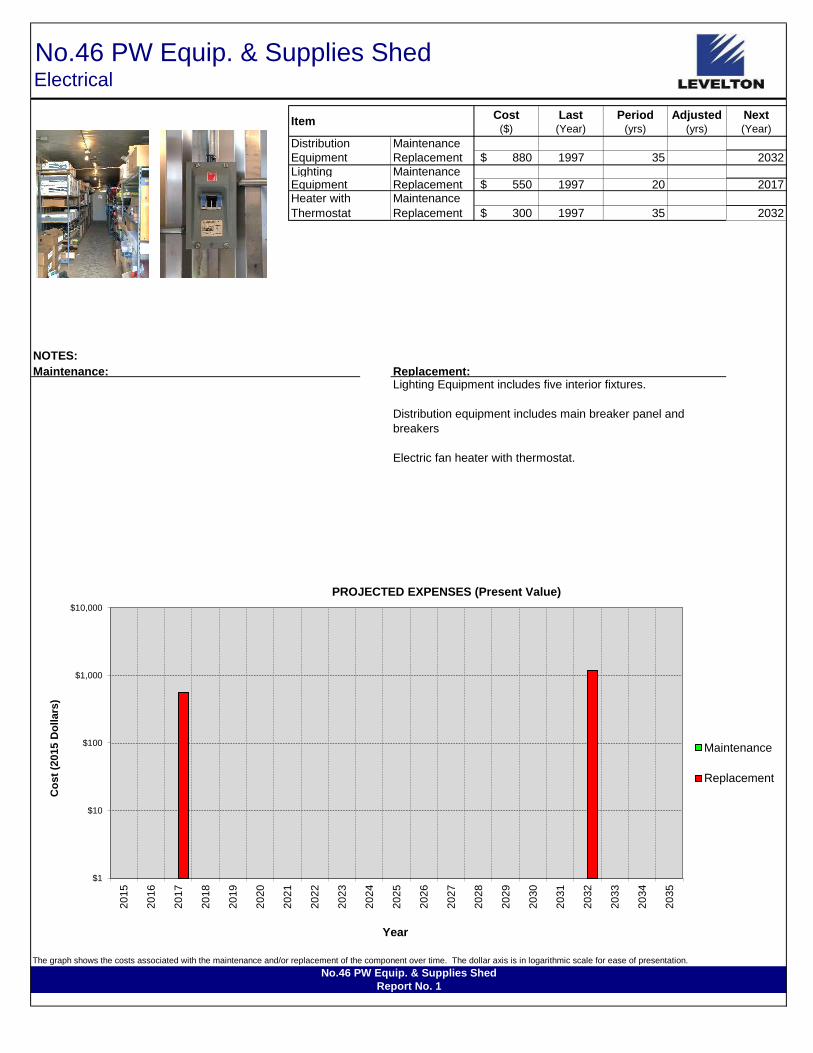
ItemCost
($)
Last(Year)
Period(yrs)
Adjusted(yrs)
Next(Year)
Distribution Maintenance
Equipment Replacement 880$ 1997 35 2032
Lighting MaintenanceEquipment Replacement 550$ 1997 20 2017Heater with Maintenance
Thermostat Replacement 300$ 1997 35 2032
NOTES:
No.46 PW Equip. & Supplies ShedElectrical
Maintenance: Replacement:Lighting Equipment includes five interior fixtures.
Distribution equipment includes main breaker panel and
breakers
Electric fan heater with thermostat.
The graph shows the costs associated with the maintenance and/or replacement of the component over time. The dollar axis is in logarithmic scale for ease of presentation.
No.46 PW Equip. & Supplies Shed
Report No. 1
$1
$10
$100
$1,000
$10,000
20
15
20
16
20
17
20
18
20
19
20
20
20
21
20
22
20
23
20
24
20
25
20
26
20
27
20
28
20
29
20
30
20
31
20
32
20
33
20
34
20
35
Co
st
(2015 D
ollars
)
Year
PROJECTED EXPENSES (Present Value)
Maintenance
Replacement
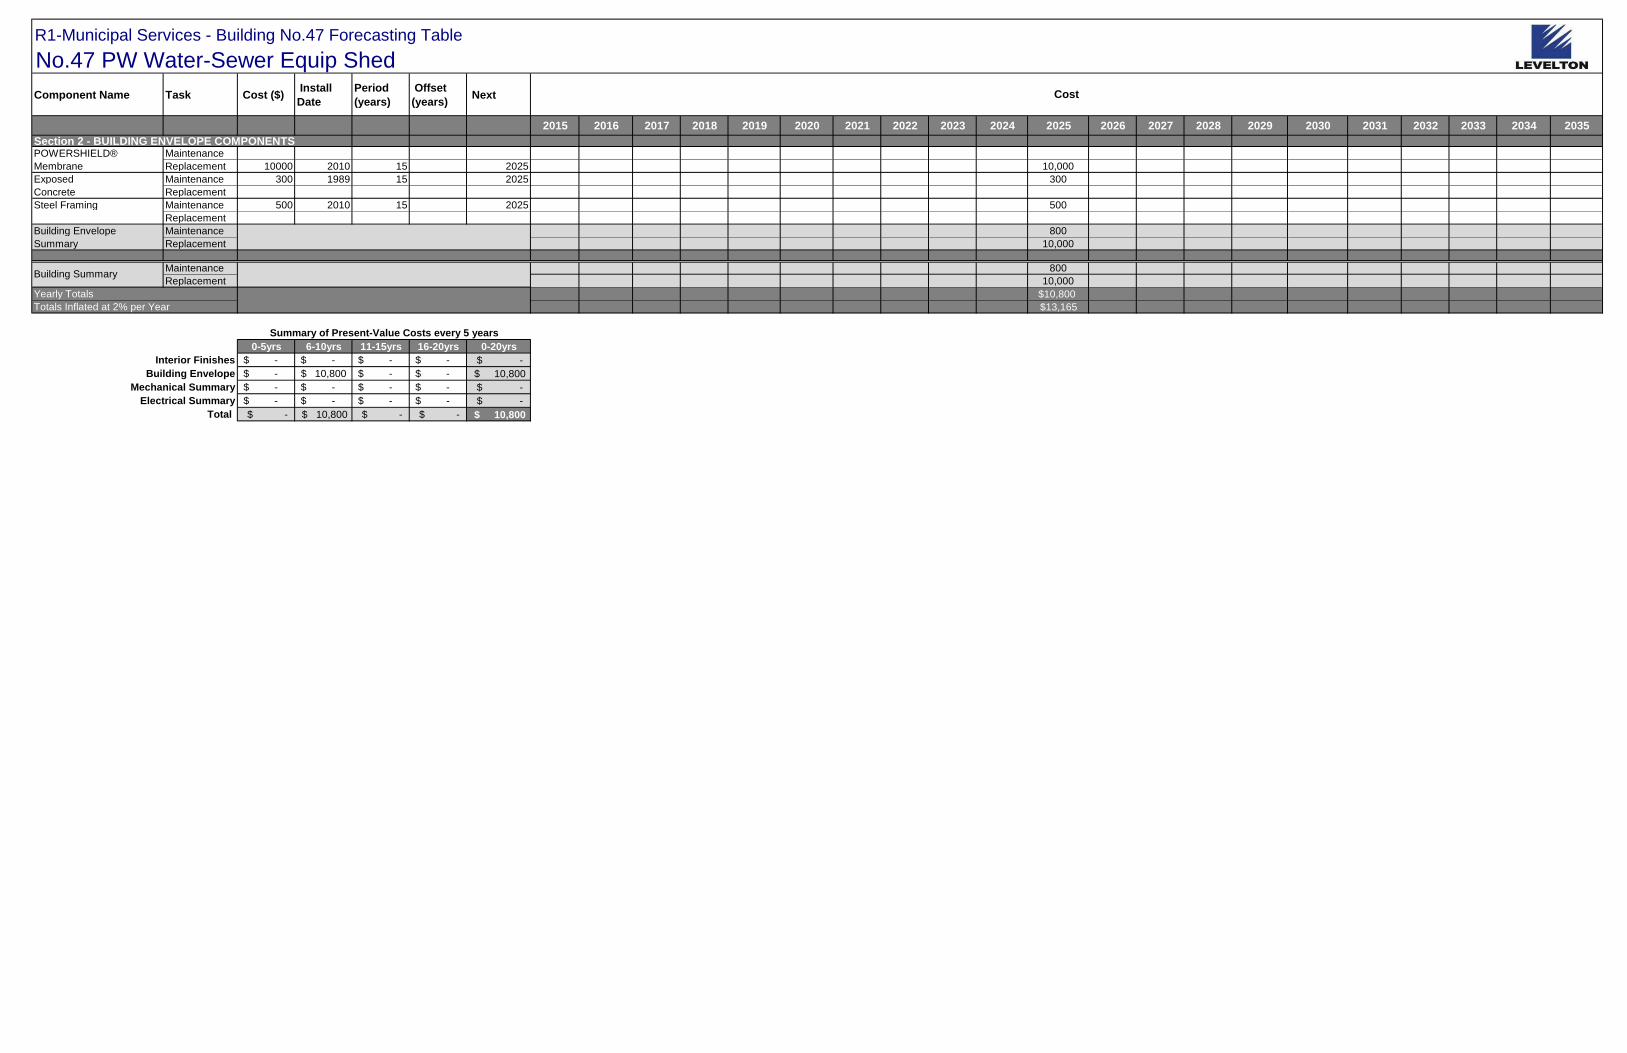
R1-Municipal Services - Building No.47 Forecasting Table
No.47 PW Water-Sewer Equip Shed
Component Name Task Cost ($) Install
Date
Period
(years)
Offset
(years) Next
2015 2016 2017 2018 2019 2020 2021 2022 2023 2024 2025 2026 2027 2028 2029 2030 2031 2032 2033 2034 2035
Section 2 - BUILDING ENVELOPE COMPONENTSPOWERSHIELD® Maintenance
Membrane Replacement 10000 2010 15 2025 10,000
Exposed Maintenance 300 1989 15 2025 300
Concrete Replacement
Steel Framing Maintenance 500 2010 15 2025 500
Replacement
Building Envelope Maintenance 800
Summary Replacement 10,000
Maintenance 800
Replacement 10,000
Yearly Totals $10,800
Totals Inflated at 2% per Year $13,165
0-5yrs 6-10yrs 11-15yrs 16-20yrs 0-20yrs
Interior Finishes -$ -$ -$ -$ $ -
Building Envelope -$ 10,800$ -$ -$ $ 10,800
Mechanical Summary -$ -$ -$ -$ $ -
Electrical Summary -$ -$ -$ -$ $ -
Total $ - $ 10,800 $ - $ - $ 10,800
Building Summary
Summary of Present-Value Costs every 5 years
Cost

No.47 PW Water-Sewer Equip ShedBuilding Summary
No.47 PW Water-Sewer Equip Shed
Report No. 1
$0
$2,000
$4,000
$6,000
$8,000
$10,000
$12,000
20
15
20
16
20
17
20
18
20
19
20
20
20
21
20
22
20
23
20
24
20
25
20
26
20
27
20
28
20
29
20
30
20
31
20
32
20
33
20
34
20
35
Co
st
(201
5 D
oll
ars
)
Year
PROJECTED REPLACEMENT EXPENSES (Present Value)
BuildingEnvelope
$0
$100
$200
$300
$400
$500
$600
$700
$800
$900
20
15
20
16
20
17
20
18
20
19
20
20
20
21
20
22
20
23
20
24
20
25
20
26
20
27
20
28
20
29
20
30
20
31
20
32
20
33
20
34
20
35
Co
st
(201
5 D
oll
ars
)
Year
PROJECTED MAINTENANCE EXPENSES (Present Value)
BuildingEnvelope
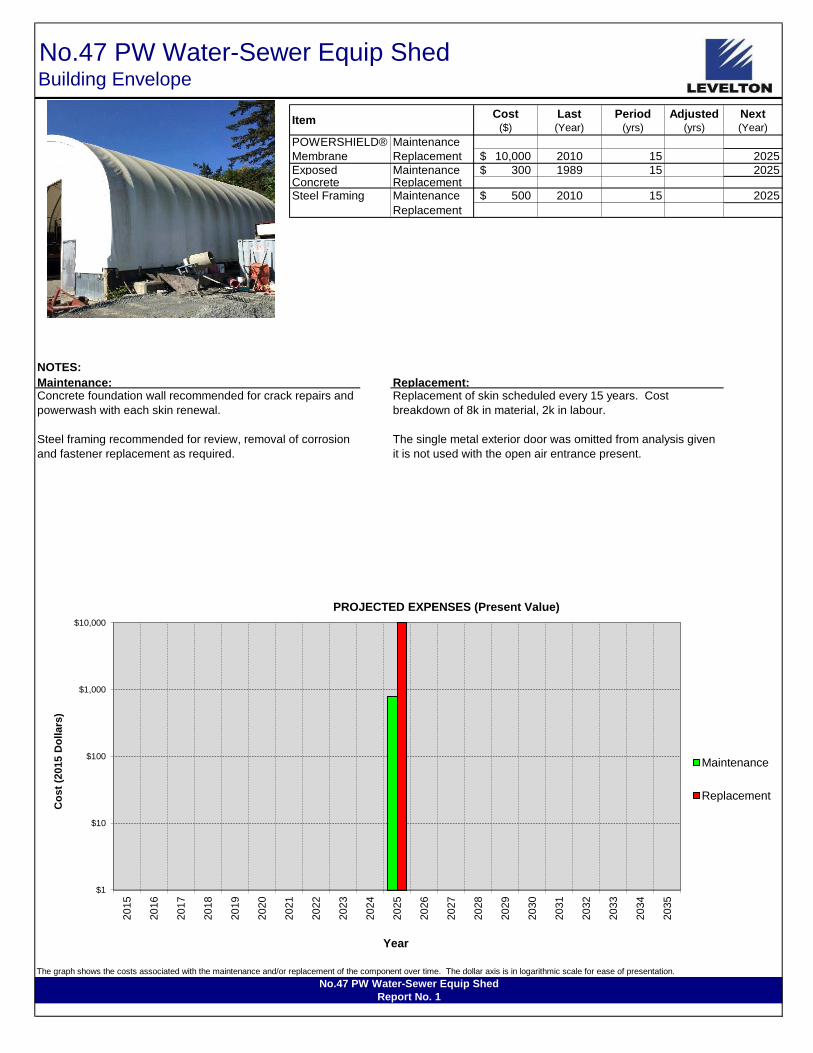
ItemCost
($)
Last(Year)
Period(yrs)
Adjusted(yrs)
Next(Year)
POWERSHIELD® Maintenance
Membrane Replacement 10,000$ 2010 15 2025
Exposed Maintenance 300$ 1989 15 2025Concrete ReplacementSteel Framing Maintenance 500$ 2010 15 2025
Replacement
NOTES:
No.47 PW Water-Sewer Equip ShedBuilding Envelope
Maintenance: Replacement:Concrete foundation wall recommended for crack repairs and
powerwash with each skin renewal.
Steel framing recommended for review, removal of corrosion
and fastener replacement as required.
Replacement of skin scheduled every 15 years. Cost
breakdown of 8k in material, 2k in labour.
The single metal exterior door was omitted from analysis given
it is not used with the open air entrance present.
The graph shows the costs associated with the maintenance and/or replacement of the component over time. The dollar axis is in logarithmic scale for ease of presentation.
No.47 PW Water-Sewer Equip Shed
Report No. 1
$1
$10
$100
$1,000
$10,000
20
15
20
16
20
17
20
18
20
19
20
20
20
21
20
22
20
23
20
24
20
25
20
26
20
27
20
28
20
29
20
30
20
31
20
32
20
33
20
34
20
35
Co
st
(201
5 D
oll
ars
)
Year
PROJECTED EXPENSES (Present Value)
Maintenance
Replacement

R1-Municipal Services - Building No.48 Forecasting Table
No.48 PW Salt Shed
Component Name Task Cost ($) Install
Date
Period
(years)
Offset
(years) Next
2015 2016 2017 2018 2019 2020 2021 2022 2023 2024 2025 2026 2027 2028 2029 2030 2031 2032 2033 2034 2035
Section 2 - BUILDING ENVELOPE COMPONENTSPOWERSHIELD® Maintenance
Membrane Replacement 17000 2012 15 2027 17,000
Concrete Maintenance 500 2012 15 2027 500
Lock-block Replacement
Steel Framing Maintenance 600 2012 15 2027 600
Replacement
Building Envelope Maintenance 1,100
Summary Replacement 17,000
Maintenance 1,100
Replacement 17,000
Yearly Totals $18,100
Totals Inflated at 2% per Year $22,955
0-5yrs 6-10yrs 11-15yrs 16-20yrs 0-20yrs
Interior Finishes -$ -$ -$ -$ $ -
Building Envelope -$ -$ 18,100$ -$ $ 18,100
Mechanical Summary -$ -$ -$ -$ $ -
Electrical Summary -$ -$ -$ -$ $ -
Total $ - $ - $ 18,100 $ - $ 18,100
Building Summary
Summary of Present-Value Costs every 5 years
Cost

No.48 PW Salt ShedBuilding Summary
No.48 PW Salt Shed
Report No. 1
$0
$2,000
$4,000
$6,000
$8,000
$10,000
$12,000
$14,000
$16,000
$18,000
20
15
20
16
20
17
20
18
20
19
20
20
20
21
20
22
20
23
20
24
20
25
20
26
20
27
20
28
20
29
20
30
20
31
20
32
20
33
20
34
20
35
Co
st
(201
5 D
oll
ars
)
Year
PROJECTED REPLACEMENT EXPENSES (Present Value)
BuildingEnvelope
$0
$200
$400
$600
$800
$1,000
$1,200
20
15
20
16
20
17
20
18
20
19
20
20
20
21
20
22
20
23
20
24
20
25
20
26
20
27
20
28
20
29
20
30
20
31
20
32
20
33
20
34
20
35
Co
st
(201
5 D
oll
ars
)
Year
PROJECTED MAINTENANCE EXPENSES (Present Value)
BuildingEnvelope
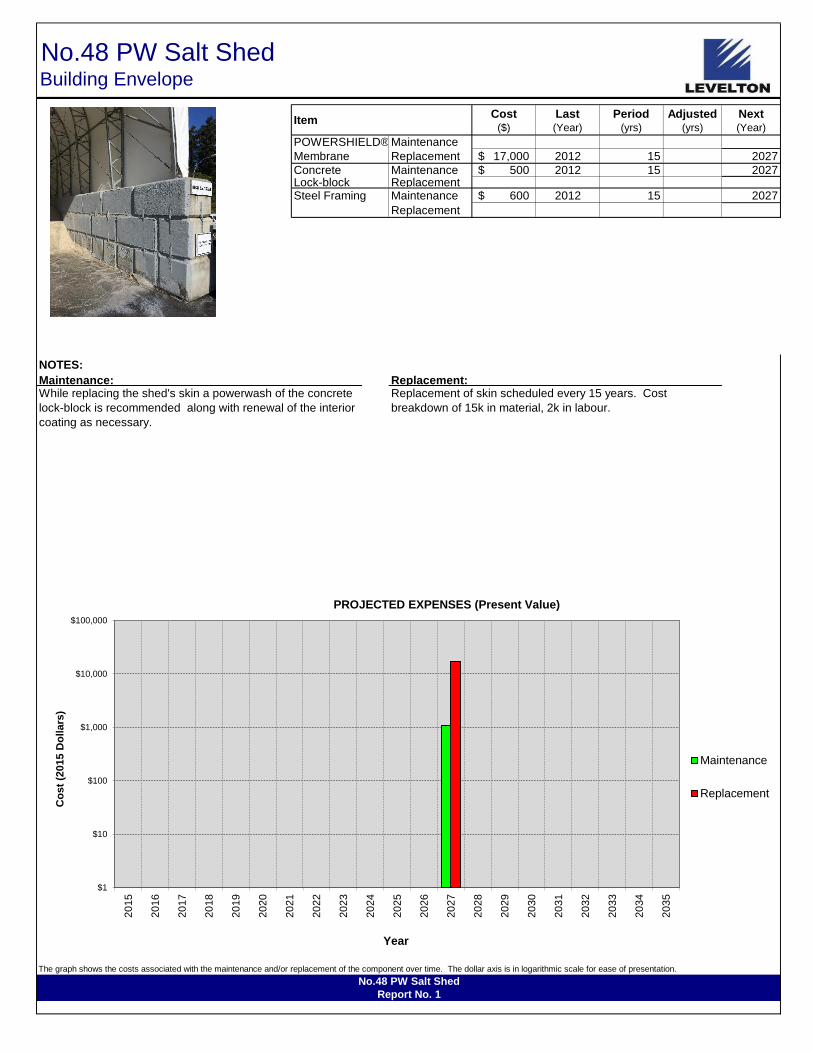
ItemCost
($)
Last(Year)
Period(yrs)
Adjusted(yrs)
Next(Year)
POWERSHIELD® Maintenance
Membrane Replacement 17,000$ 2012 15 2027
Concrete Maintenance 500$ 2012 15 2027Lock-block ReplacementSteel Framing Maintenance 600$ 2012 15 2027
Replacement
NOTES:
No.48 PW Salt ShedBuilding Envelope
Maintenance: Replacement:While replacing the shed's skin a powerwash of the concrete
lock-block is recommended along with renewal of the interior
coating as necessary.
Replacement of skin scheduled every 15 years. Cost
breakdown of 15k in material, 2k in labour.
The graph shows the costs associated with the maintenance and/or replacement of the component over time. The dollar axis is in logarithmic scale for ease of presentation.
No.48 PW Salt Shed
Report No. 1
$1
$10
$100
$1,000
$10,000
$100,000
20
15
20
16
20
17
20
18
20
19
20
20
20
21
20
22
20
23
20
24
20
25
20
26
20
27
20
28
20
29
20
30
20
31
20
32
20
33
20
34
20
35
Co
st
(2015 D
ollars
)
Year
PROJECTED EXPENSES (Present Value)
Maintenance
Replacement

R1-Municipal Services - Building No.49 Forecasting Table
No.49 PW Enviro Compliance
Component Name Task Cost ($) Install
Date
Period
(years)
Offset
(years) Next
2015 2016 2017 2018 2019 2020 2021 2022 2023 2024 2025 2026 2027 2028 2029 2030 2031 2032 2033 2034 2035
Section 5 - MISCELLANEOUS COMPONENTSBrine Station Maintenance
Replacement 20000 2018 20,000
Decant Wash Maintenance
Station Replacement 60000 2019 60,000
Internal Refuse Maintenance
Separation Replacement 30000 2018 30,000
Replace Fuel Maintenance
Dispensing System Replacement 120000 2015 120,000
Fuel Decommission Maintenance
Phase 1 Replacement 50000 2016 50,000
Fuel Decommission Maintenance
Phase 2 Replacement 190000 2017 190,000
Miscellaneous Maintenance
Summary Replacement 120,000 50,000 190,000 50,000 60,000
Maintenance
Replacement 120,000 50,000 190,000 50,000 60,000
Yearly Totals $120,000 $50,000 $190,000 $50,000 $60,000
Totals Inflated at 2% per Year $120,000 $51,000 $197,676 $53,060 $64,946
0-5yrs 6-10yrs 11-15yrs 16-20yrs 0-20yrs
-$ -$ -$ -$ $ -
Building Envelope -$ -$ -$ -$ $ -
Mechanical Summary -$ -$ -$ -$ $ -
Electrical Summary -$ -$ -$ -$ $ -
Miscellaneous Summary $ 470,000 -$ -$ -$ $ 470,000
Total $ 470,000 $ - $ - $ - $ 470,000
Building Summary
Summary of Present-Value Costs every 5 years
Cost
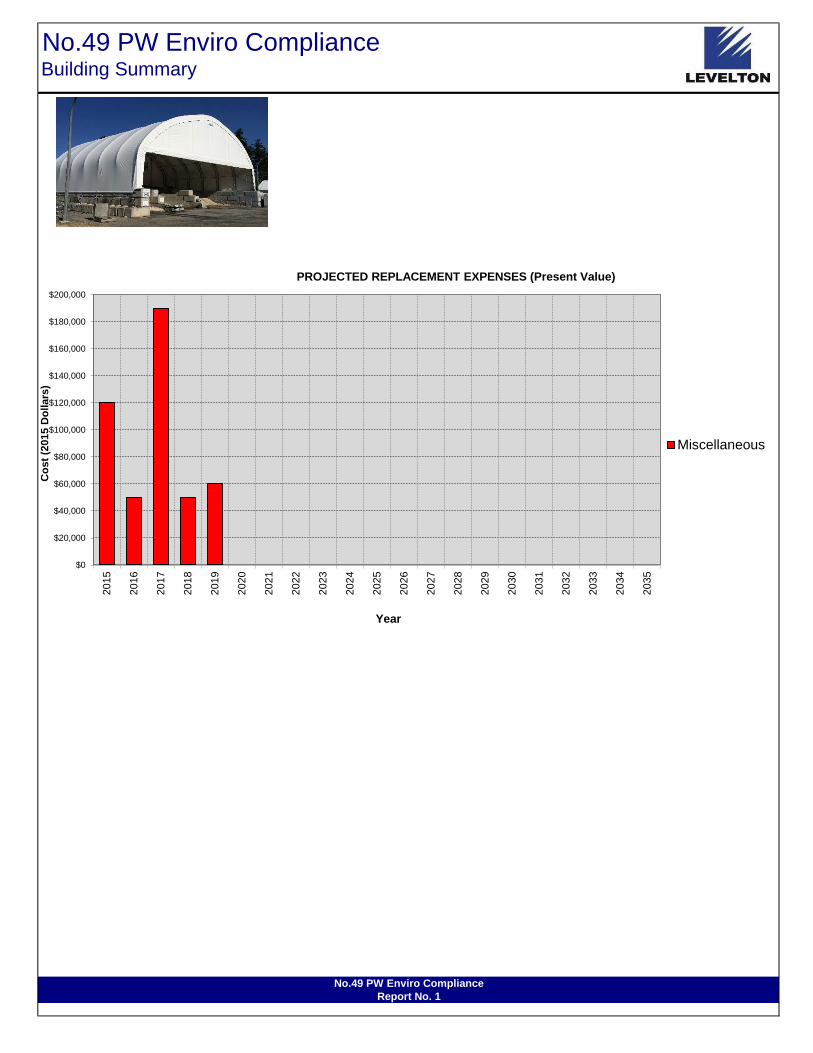
No.49 PW Enviro ComplianceBuilding Summary
No.49 PW Enviro Compliance
Report No. 1
$0
$20,000
$40,000
$60,000
$80,000
$100,000
$120,000
$140,000
$160,000
$180,000
$200,000
20
15
20
16
20
17
20
18
20
19
20
20
20
21
20
22
20
23
20
24
20
25
20
26
20
27
20
28
20
29
20
30
20
31
20
32
20
33
20
34
20
35
Co
st
(201
5 D
oll
ars
)
Year
PROJECTED REPLACEMENT EXPENSES (Present Value)
Miscellaneous

ItemCost
($)
Last(Year)
Period(yrs)
Adjusted(yrs)
Next(Year)
Brine Station Maintenance
Replacement 20,000$ 2018
Decant Wash MaintenanceStation Replacement 60,000$ 2019Internal Refuse Maintenance
Separation Replacement 30,000$ 2018
Replace Fuel Maintenance
Dispensing System Replacement 120,000$ 2015
Fuel Decommission MaintenancePhase 1 Replacement 50,000$ 2016Fuel Decommission MaintenancePhase 2 Replacement 190,000$ 2017
NOTES:
No.49 PW Enviro ComplianceMiscellaneous
Maintenance: Replacement:Decommis Brine station refers to installation of a new Mega-Dome
structure over existing hoppers and dispensing tanks.
Decant wash station refers to installing a shelter (MegaDome)
over the station as well as premise isolation.
Refuse transfer station includes 12 industrial dumpsters for
internal refuse (wood, metal, organics) on a concrete pad
footing.
Fuel tanks includes new above-grade storage and
decommission costs split into two phases.
The graph shows the costs associated with the maintenance and/or replacement of the component over time. The dollar axis is in logarithmic scale for ease of presentation.
No.49 PW Enviro Compliance
Report No. 1
$1
$10
$100
$1,000
$10,000
$100,000
$1,000,000
20
15
20
16
20
17
20
18
20
19
20
20
20
21
20
22
20
23
20
24
20
25
20
26
20
27
20
28
20
29
20
30
20
31
20
32
20
33
20
34
20
35
Co
st
(201
5 D
oll
ars
)
Year
PROJECTED EXPENSES (Present Value)
Replacement
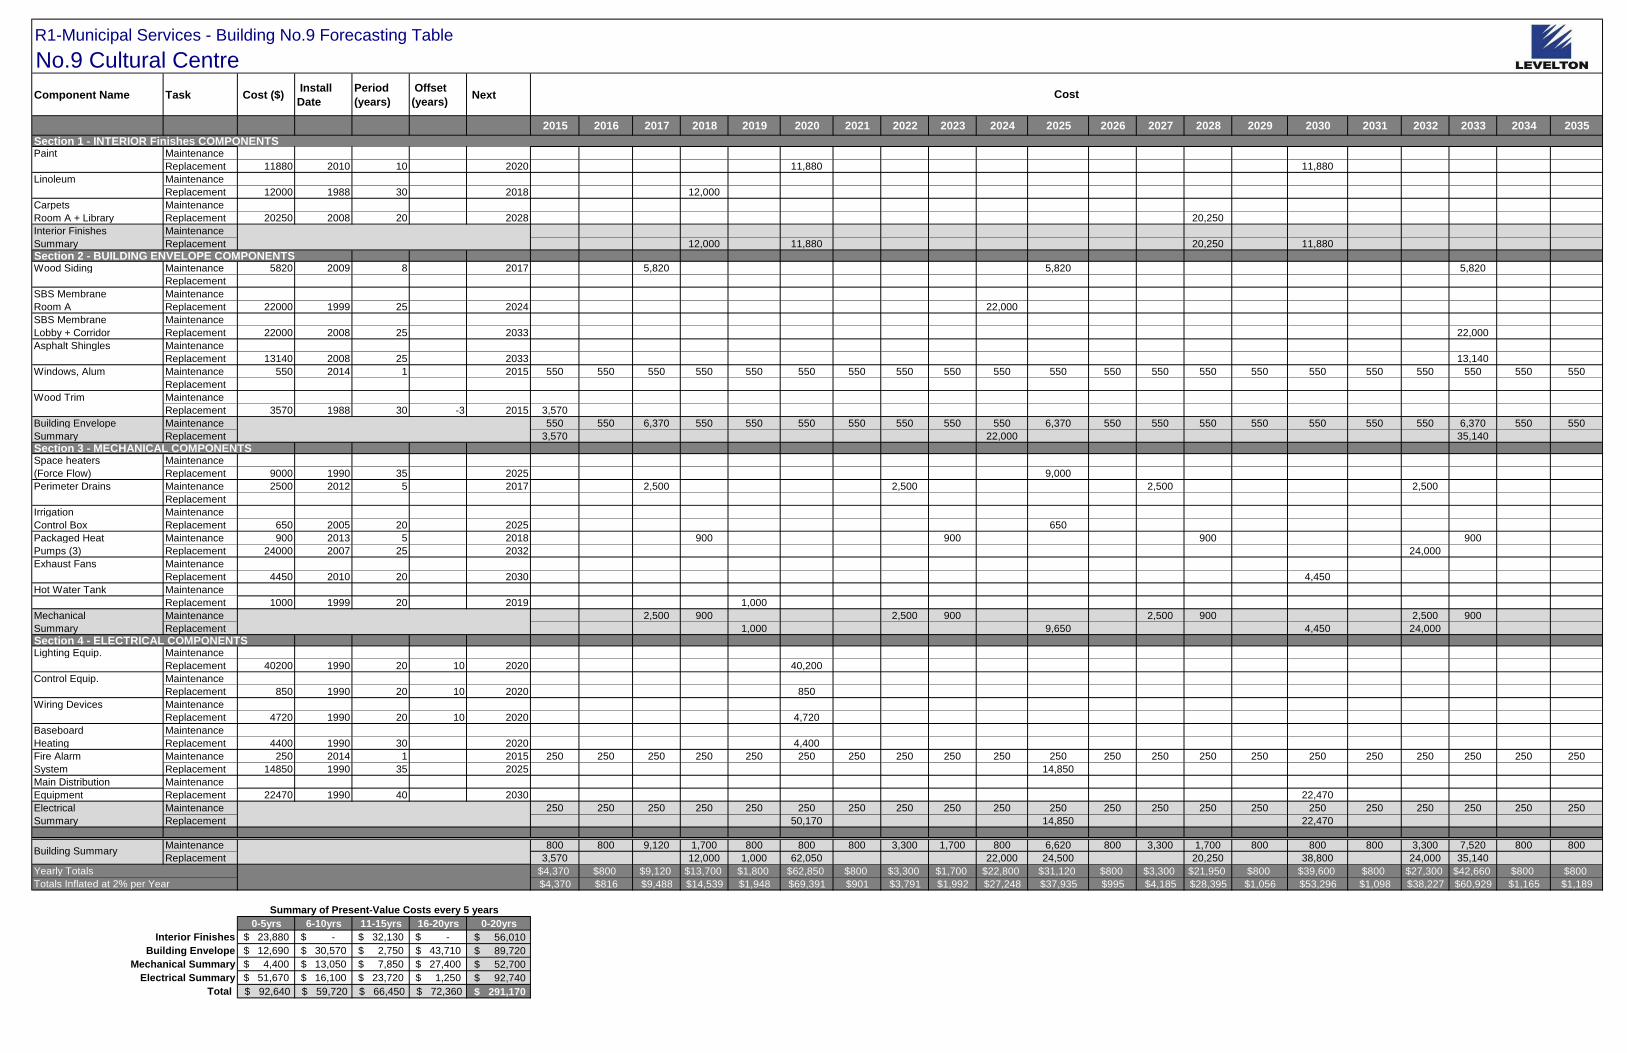
R1-Municipal Services - Building No.9 Forecasting Table
No.9 Cultural Centre
Component Name Task Cost ($) Install
Date
Period
(years)
Offset
(years) Next
2015 2016 2017 2018 2019 2020 2021 2022 2023 2024 2025 2026 2027 2028 2029 2030 2031 2032 2033 2034 2035
Section 1 - INTERIOR Finishes COMPONENTSPaint Maintenance
Replacement 11880 2010 10 2020 11,880 11,880
Linoleum Maintenance
Replacement 12000 1988 30 2018 12,000
Carpets Maintenance
Room A + Library Replacement 20250 2008 20 2028 20,250
Interior Finishes Maintenance
Summary Replacement 12,000 11,880 20,250 11,880
Section 2 - BUILDING ENVELOPE COMPONENTSWood Siding Maintenance 5820 2009 8 2017 5,820 5,820 5,820
Replacement
SBS Membrane Maintenance
Room A Replacement 22000 1999 25 2024 22,000
SBS Membrane Maintenance
Lobby + Corridor Replacement 22000 2008 25 2033 22,000
Asphalt Shingles Maintenance
Replacement 13140 2008 25 2033 13,140
Windows, Alum Maintenance 550 2014 1 2015 550 550 550 550 550 550 550 550 550 550 550 550 550 550 550 550 550 550 550 550 550
Replacement
Wood Trim Maintenance
Replacement 3570 1988 30 -3 2015 3,570
Building Envelope Maintenance 550 550 6,370 550 550 550 550 550 550 550 6,370 550 550 550 550 550 550 550 6,370 550 550
Summary Replacement 3,570 22,000 35,140
Section 3 - MECHANICAL COMPONENTSSpace heaters Maintenance
(Force Flow) Replacement 9000 1990 35 2025 9,000
Perimeter Drains Maintenance 2500 2012 5 2017 2,500 2,500 2,500 2,500
Replacement
Irrigation Maintenance
Control Box Replacement 650 2005 20 2025 650
Packaged Heat Maintenance 900 2013 5 2018 900 900 900 900
Pumps (3) Replacement 24000 2007 25 2032 24,000
Exhaust Fans Maintenance
Replacement 4450 2010 20 2030 4,450
Hot Water Tank Maintenance
Replacement 1000 1999 20 2019 1,000
Mechanical Maintenance 2,500 900 2,500 900 2,500 900 2,500 900
Summary Replacement 1,000 9,650 4,450 24,000
Section 4 - ELECTRICAL COMPONENTSLighting Equip. Maintenance
Replacement 40200 1990 20 10 2020 40,200
Control Equip. Maintenance
Replacement 850 1990 20 10 2020 850
Wiring Devices Maintenance
Replacement 4720 1990 20 10 2020 4,720
Baseboard Maintenance
Heating Replacement 4400 1990 30 2020 4,400
Fire Alarm Maintenance 250 2014 1 2015 250 250 250 250 250 250 250 250 250 250 250 250 250 250 250 250 250 250 250 250 250
System Replacement 14850 1990 35 2025 14,850
Main Distribution Maintenance
Equipment Replacement 22470 1990 40 2030 22,470
Electrical Maintenance 250 250 250 250 250 250 250 250 250 250 250 250 250 250 250 250 250 250 250 250 250
Summary Replacement 50,170 14,850 22,470
Maintenance 800 800 9,120 1,700 800 800 800 3,300 1,700 800 6,620 800 3,300 1,700 800 800 800 3,300 7,520 800 800
Replacement 3,570 12,000 1,000 62,050 22,000 24,500 20,250 38,800 24,000 35,140
Yearly Totals $4,370 $800 $9,120 $13,700 $1,800 $62,850 $800 $3,300 $1,700 $22,800 $31,120 $800 $3,300 $21,950 $800 $39,600 $800 $27,300 $42,660 $800 $800
Totals Inflated at 2% per Year $4,370 $816 $9,488 $14,539 $1,948 $69,391 $901 $3,791 $1,992 $27,248 $37,935 $995 $4,185 $28,395 $1,056 $53,296 $1,098 $38,227 $60,929 $1,165 $1,189
0-5yrs 6-10yrs 11-15yrs 16-20yrs 0-20yrs
Interior Finishes 23,880$ -$ 32,130$ -$ $ 56,010
Building Envelope 12,690$ 30,570$ 2,750$ 43,710$ $ 89,720
Mechanical Summary 4,400$ 13,050$ 7,850$ 27,400$ $ 52,700
Electrical Summary 51,670$ 16,100$ 23,720$ 1,250$ $ 92,740
Total $ 92,640 $ 59,720 $ 66,450 $ 72,360 $ 291,170
Cost
Building Summary
Summary of Present-Value Costs every 5 years
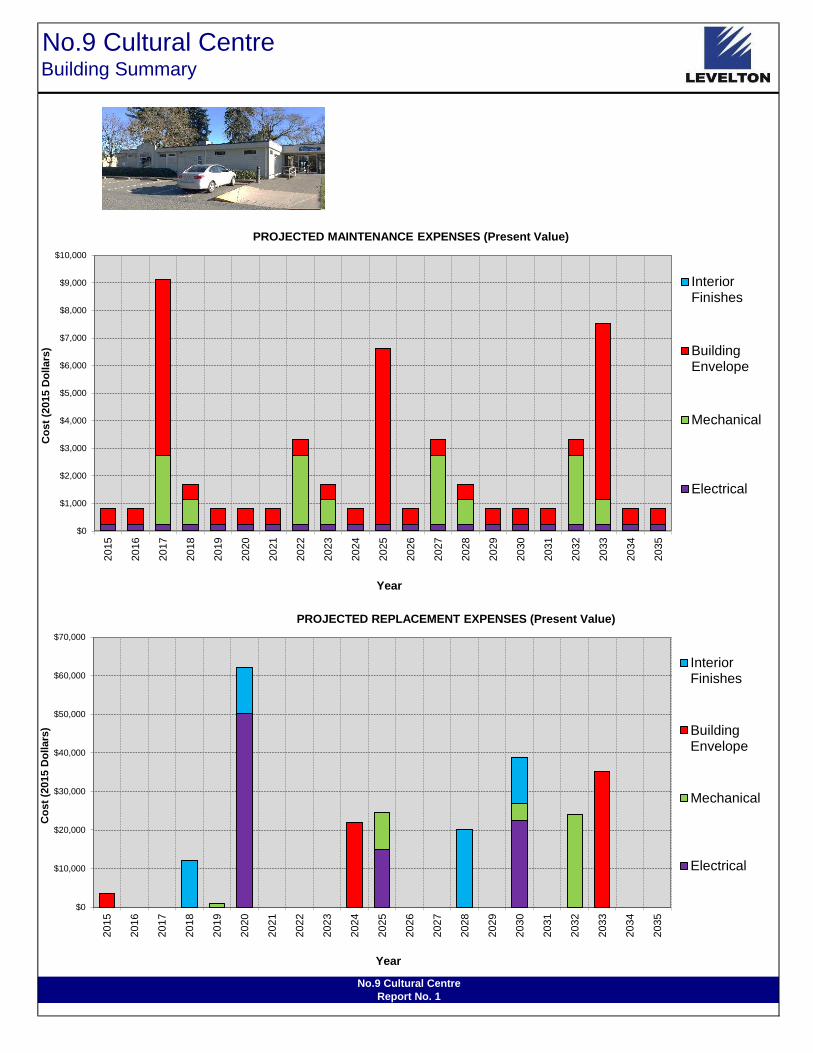
No.9 Cultural CentreBuilding Summary
No.9 Cultural Centre
Report No. 1
$0
$10,000
$20,000
$30,000
$40,000
$50,000
$60,000
$70,000
20
15
20
16
20
17
20
18
20
19
20
20
20
21
20
22
20
23
20
24
20
25
20
26
20
27
20
28
20
29
20
30
20
31
20
32
20
33
20
34
20
35
Co
st
(201
5 D
oll
ars
)
Year
PROJECTED REPLACEMENT EXPENSES (Present Value)
InteriorFinishes
BuildingEnvelope
Mechanical
Electrical
$0
$1,000
$2,000
$3,000
$4,000
$5,000
$6,000
$7,000
$8,000
$9,000
$10,000
20
15
20
16
20
17
20
18
20
19
20
20
20
21
20
22
20
23
20
24
20
25
20
26
20
27
20
28
20
29
20
30
20
31
20
32
20
33
20
34
20
35
Co
st
(201
5 D
oll
ars
)
Year
PROJECTED MAINTENANCE EXPENSES (Present Value)
InteriorFinishes
BuildingEnvelope
Mechanical
Electrical
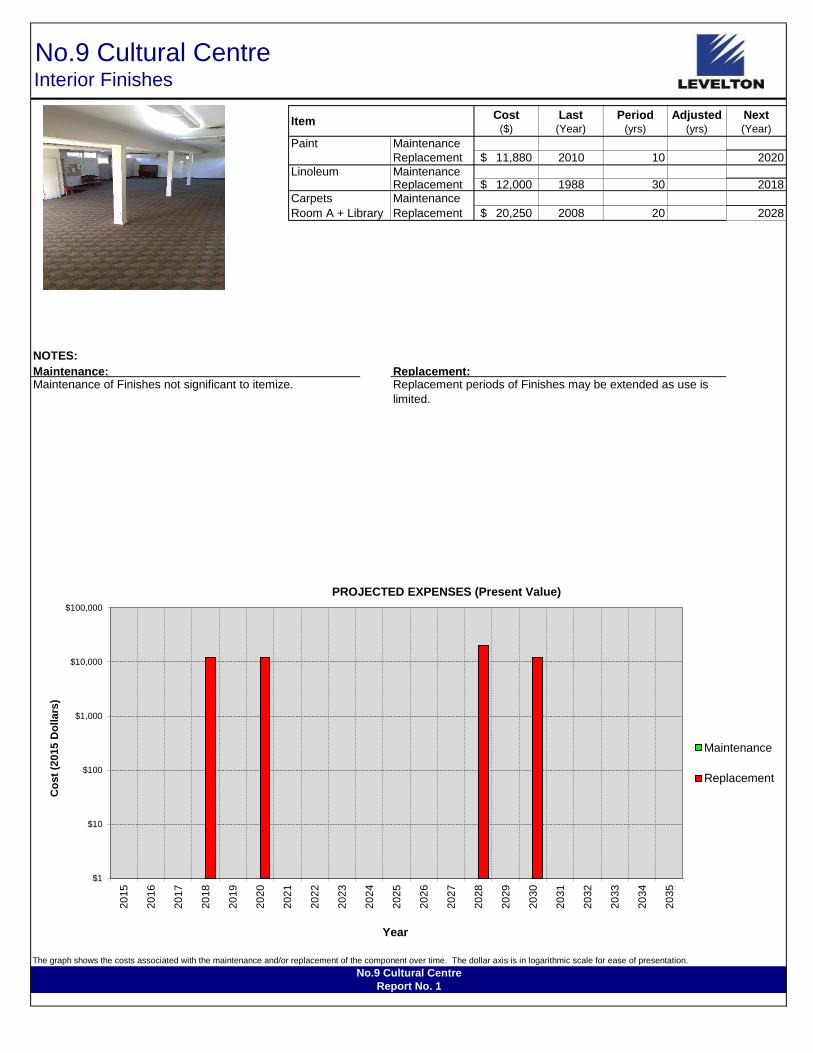
ItemCost
($)
Last(Year)
Period(yrs)
Adjusted(yrs)
Next(Year)
Paint Maintenance
Replacement 11,880$ 2010 10 2020
Linoleum MaintenanceReplacement 12,000$ 1988 30 2018
Carpets Maintenance
Room A + Library Replacement 20,250$ 2008 20 2028
NOTES:
No.9 Cultural CentreInterior Finishes
Maintenance: Replacement:Maintenance of Finishes not significant to itemize. Replacement periods of Finishes may be extended as use is
limited.
The graph shows the costs associated with the maintenance and/or replacement of the component over time. The dollar axis is in logarithmic scale for ease of presentation.
No.9 Cultural Centre
Report No. 1
$1
$10
$100
$1,000
$10,000
$100,000
20
15
20
16
20
17
20
18
20
19
20
20
20
21
20
22
20
23
20
24
20
25
20
26
20
27
20
28
20
29
20
30
20
31
20
32
20
33
20
34
20
35
Co
st
(2015 D
ollars
)
Year
PROJECTED EXPENSES (Present Value)
Maintenance
Replacement

ItemCost
($)
Last(Year)
Period(yrs)
Adjusted(yrs)
Next(Year)
Wood Siding Maintenance 5,820$ 2009 8 2017
Replacement
SBS Membrane MaintenanceRoom A Replacement 22,000$ 1999 25 2024SBS Membrane Maintenance
Lobby + Corridor Replacement 22,000$ 2008 25 2033
Asphalt Shingles Maintenance
Replacement 13,140$ 2008 25 2033
Windows, Alum Maintenance 550$ 2014 1 2015Replacement
Wood Trim MaintenanceReplacement 3,570$ 1988 30 -3 2015
NOTES:
No.9 Cultural CentreBuilding Envelope
Maintenance: Replacement:Wood siding repainted every 8 years. South façade should be
every 4 years and is accounted for in cost. Wood trim
included in this repaint cost.
Window frames not scheduled to be replaced. Maintenance
cost includes IGU replacement at an average of two (4'x4'-6'')
units per year.
Wood trim replacement at library cupola and at corners
showing end of life (18x10ft sections).
Aluminum frame service life can reach 40 years (2028), this
item is left at the districts discretion.
Restorative Maintenance
Sealant on all window jambs, half of sills, and all corner trim
Trim back vegetation from building (NW corner especially)
The graph shows the costs associated with the maintenance and/or replacement of the component over time. The dollar axis is in logarithmic scale for ease of presentation.
No.9 Cultural Centre
Report No. 1
$1
$10
$100
$1,000
$10,000
$100,000
20
15
20
16
20
17
20
18
20
19
20
20
20
21
20
22
20
23
20
24
20
25
20
26
20
27
20
28
20
29
20
30
20
31
20
32
20
33
20
34
20
35
Co
st
(2015 D
ollars
)
Year
PROJECTED EXPENSES (Present Value)
Maintenance
Replacement

ItemCost
($)
Last(Year)
Period(yrs)
Adjusted(yrs)
Next(Year)
Space heaters Maintenance
(Force Flow) Replacement 9,000$ 1990 35 2025
Perimeter Drains Maintenance 2,500$ 2012 5 2017Replacement
Irrigation Maintenance
Control Box Replacement 650$ 2005 20 2025
Packaged Heat Maintenance 900$ 2013 5 2018
Pumps (3) Replacement 24,000$ 2007 25 2032
Exhaust Fans MaintenanceReplacement 4,450$ 2010 20 2030
Hot Water Tank MaintenanceReplacement 1,000$ 1999 20 2019
NOTES:
No.9 Cultural CentreMechanical
Maintenance: Replacement:Perimeter drains should be hydo-flushed every five years
along with a camera inspection.
Heat pump servicing includes change of filters and lubrication.
Mean install date for heat pumps taken as 2007.
The graph shows the costs associated with the maintenance and/or replacement of the component over time. The dollar axis is in logarithmic scale for ease of presentation.
No.9 Cultural Centre
Report No. 1
$1
$10
$100
$1,000
$10,000
$100,000
20
15
20
16
20
17
20
18
20
19
20
20
20
21
20
22
20
23
20
24
20
25
20
26
20
27
20
28
20
29
20
30
20
31
20
32
20
33
20
34
20
35
Co
st
(2015 D
ollars
)
Year
PROJECTED EXPENSES (Present Value)
Maintenance
Replacement

ItemCost
($)
Last(Year)
Period(yrs)
Adjusted(yrs)
Next(Year)
Lighting Equip. Maintenance
Replacement 40,200$ 1990 20 10 2020
Control Equip. MaintenanceReplacement 850$ 1990 20 10 2020
Wiring Devices Maintenance
Replacement 4,720$ 1990 20 10 2020
Baseboard Maintenance
Heating Replacement 4,400$ 1990 30 2020
Fire Alarm Maintenance 250$ 2014 1 2015System Replacement 14,850$ 1990 35 2025Main Distribution MaintenanceEquipment Replacement 22,470$ 1990 40 2030
NOTES:
No.9 Cultural CentreElectrical
Maintenance: Replacement:Annual fire alarm system testing/service. Lighting Equipment includes all interior and exterior fixtures.
Distribution equipment includes main breaker panel and breakers
Wiring devices include switches and duplex receptacles.
Baseboard heating includes thermostats.
Fire Alarm system includes panel, annunciator, pull stations,
bells and heat/smoke detectors.
The graph shows the costs associated with the maintenance and/or replacement of the component over time. The dollar axis is in logarithmic scale for ease of presentation.
No.9 Cultural Centre
Report No. 1
$1
$10
$100
$1,000
$10,000
$100,000
20
15
20
16
20
17
20
18
20
19
20
20
20
21
20
22
20
23
20
24
20
25
20
26
20
27
20
28
20
29
20
30
20
31
20
32
20
33
20
34
20
35
Co
st
(201
5 D
oll
ars
)
Year
PROJECTED EXPENSES (Present Value)
Maintenance
Replacement
Levelton File # R514-1802-00
June 08, 2015
District of Central Saanich
Facility Long-Term Asset Management Plan
Report No.1 – Municipal Buildings
APPENDIX III
RESTORATIVE MAINTENANCE PHOTOGRAPHS
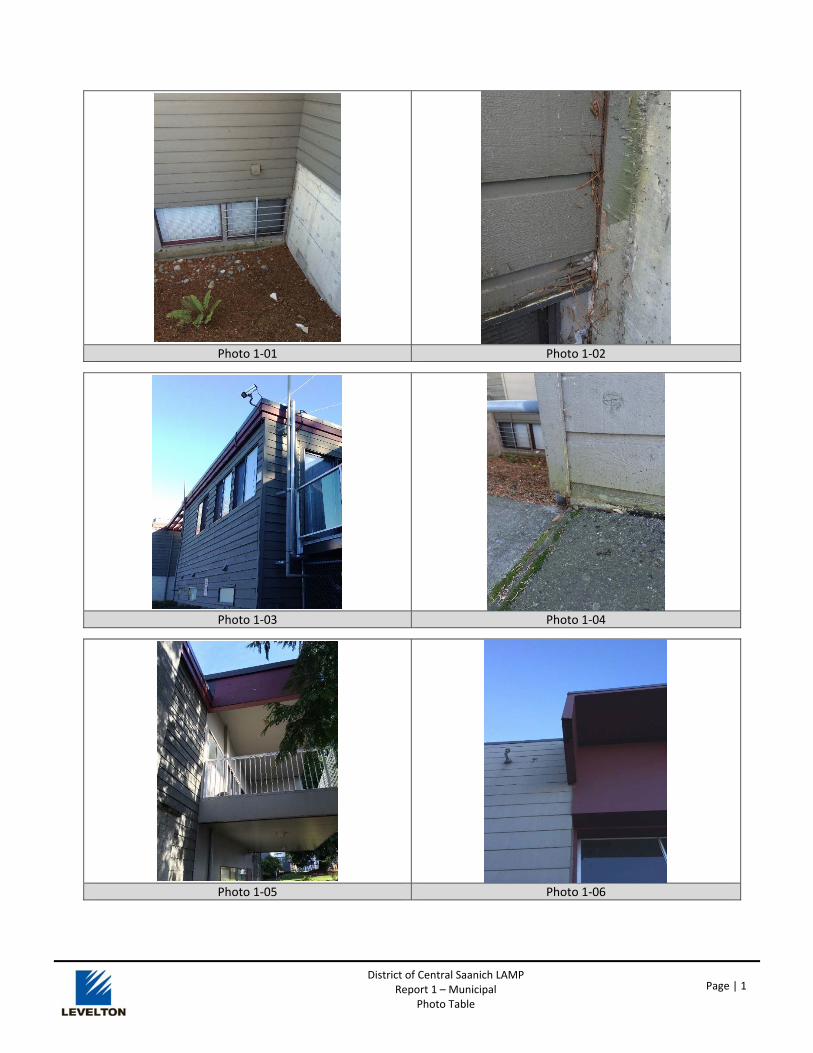
District of Central Saanich LAMP Report 1 – Municipal
Photo Table
Page | 1
Photo 1‐01 Photo 1‐02
Photo 1‐03 Photo 1‐04
Photo 1‐05 Photo 1‐06
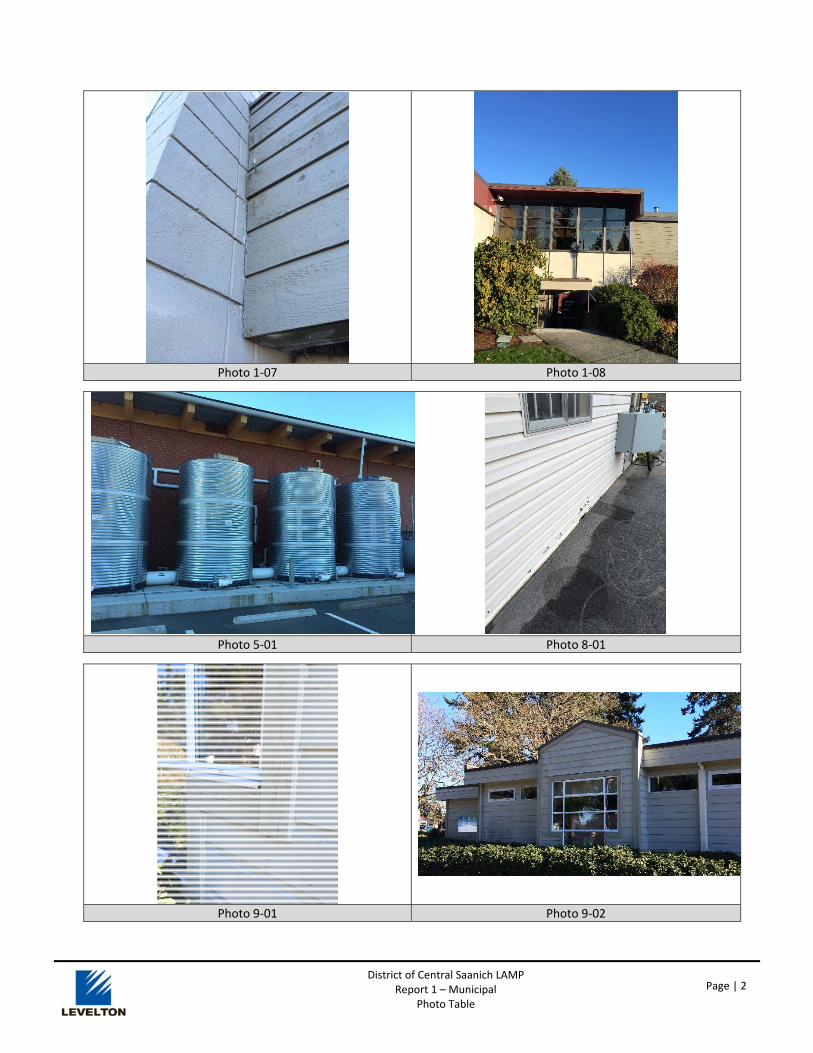
District of Central Saanich LAMP Report 1 – Municipal
Photo Table
Page | 2
Photo 1‐07 Photo 1‐08
Photo 5‐01 Photo 8‐01
Photo 9‐01 Photo 9‐02

Levelton File # R514-1802-00
June 08, 2015
District of Central Saanich
Facility Long-Term Asset Management Plan
Report No.1 – Municipal Buildings
APPENDIX IV
BUILDING DISCOVERY SHEET

(*1) = "N/N" etc.(and for example) Refers to NO past report/interest / NO future report, interest, for that specialization
(*2) = Seismic relates to building, Mech./Elect/ lighting etc. subconsults would include seismic restraint commentary in their scope where relevant Landlord standards and Leasee responsibilities may require further clarification in this report.
(*3) = 'Hazmat, Soils, Seismic, Building Enclosure, Energy Studies' are currently excluded from our scope.
Re
po
rt #
Re
f# Building Address Year BuiltFloor Area
(m2)
Energy
Sources Perspective Thumb CRD Aerial
He
rita
ge?
Eniv
ron
me
nta
l
(So
ils)?
Haz
Mat
?
Aft
er
Dis
aste
r?
Seis
mic
? (*
2)
Ene
rgy?
Encl
osu
re? Approx. Current
Usage? Occupant
Load?
% Used Intended Future Use(s)
Drawings
Available
(A,M,E,S)
Notes
1 1Municipal Hall
(Admin/Police/Fire Stn#2)
1903 Mt Newton
Road
1965,'77,'79
Rem in
'89&2000
2,828
Combined E/G/D N/N N/N Y/N
Y/N
*go
to
FS#
1
N/? Y/N Y/?
50 staff +10
visitors/
daytime
workdays
100% Same All
BECA 2009, Energy 2013, Health&Safety
2014, IAQ 2012, HazMat 2013, HVAC??
Post Disaster=holding cells, firearms etc.
Hose fire tower noted.
1 5 Fire Station #1 1512 Keating Cross Rd 2013 2,183 E n/a N/N n/a Y/Y Y/Y N/N N/N
6 F/T staff
24/7
25-30 pers
5 reg.hr.days
100%
Same, AND Emergency
Operations Centre/
Alternate City Hall/
Police Facility
All
1 6 Public Works Main Complex 1703 Keating Cross Rd 1973 772 E/P/D N/N N/Y Y/N N/Y N/Y Y/N N/?40-50 pers / day
5 reg.hr.days
65%
winter
50%
/24hrs.
Same Site Plan
Energy 2004
Below grade fuel tanks small leak
monitored. Asbestos Confirmed.
After disaster=maintain facilities vehicle
access e.g., doors only?
1 7Public Works East
Bays/Roads & Parks Shop1703 Keating Cross Rd 1974 726 E N/N N/N N/? N/Y N/Y Y/N N/?
Owner input
required.75% Same Site Plan
Energy 2004
More of a shell. New Roof.
After disaster=maintain facilities vehicle
access e.g., doors only?
1 8 Public Works Wood Shop 1703 Keating Cross Rd 1979 41 E N/N N/N N/? N/N N/N Y/N N/? None, Storage. 50% Site Plan
1 9 Cultural Centre (Library,
Meeting rooms)1209 Clarke Rd 1988 880 E N/N N/N Y/N N/? N/? Y/N N/?
Varies, 60-120
pers., 5-7 days, reg.
hours some
evenings
85% Same All
Lighting 2009
Paint 2009
Roof 2005-2008??
1 45Public Works Equipment
Shed1703 Keating Cross Rd 1995 12 E N/N N/N N/N N/N N/N N/N N/N None, Storage. Same None

Re
po
rt #
Re
f# Building Address Year BuiltFloor Area
(m2)
Energy
Sources Perspective Thumb CRD Aerial
He
rita
ge?
Eniv
ron
me
nta
l
(So
ils)?
Haz
Mat
?
Aft
er
Dis
aste
r?
Seis
mic
? (*
2)
Ene
rgy?
Encl
osu
re? Approx. Current
Usage? Occupant
Load?
% Used Intended Future Use(s)
Drawings
Available
(A,M,E,S)
Notes
1 46Public Works Equipment &
Supplies Shed1703 Keating Cross Rd 1997 42 E N/N N/N N/N N/N N/N N/N N/N None, Storage. Same None
1 47Public Works Water/Sewer
Equipment Shed1703 Keating Cross Rd 1989/2010 155 N/A N/N N/N N/N N/N N/N N/N N/N None, Storage. Same None
1 48 Public Works Salt Shed 1703 Keating Cross Rd 2012 280 N/A N/N N/N N/N N/N N/N N/N N/N None, Storage. Same None
1 49Public Works Environmental
Compliance1703 Keating Cross Rd N/A N/A N/A N/N Y/Y? Y/Y? N/N N/N N/N N/N N/A N/A N/A N/A
Not a building but associated
infrastructure that is included for
reference only.
2 10 Rom Knott Park Concession 1200 Sluggett Rd c.1984 95 E N/N N/N N/N N/N N/N N/N N/?Weekends,
Evenings, Seasonal30% Same A
2 11 Verdier Park Washrooms 819 Verdier Ave 2012 22 E N/N N/N N/N N/N N/N N/N N/? 2 -4 pers. 15% Same A
2 12 CP Fieldhouse 1809 Hovey Rd 1992 219 E N/N N/N N/N N/N N/N N/N N/?
Open Year 'Round,
washrooms open
daily, Meeting
room
80% Same AllNew Roof-2013
Lighting 2009
2 13 CP Diamond #1 Utility 7450 Wallace Dr 1985
"=168*
0.0929
=15
E N/N N/N N/N N/N N/N N/N N/? Seasonal, Low 15% Same No
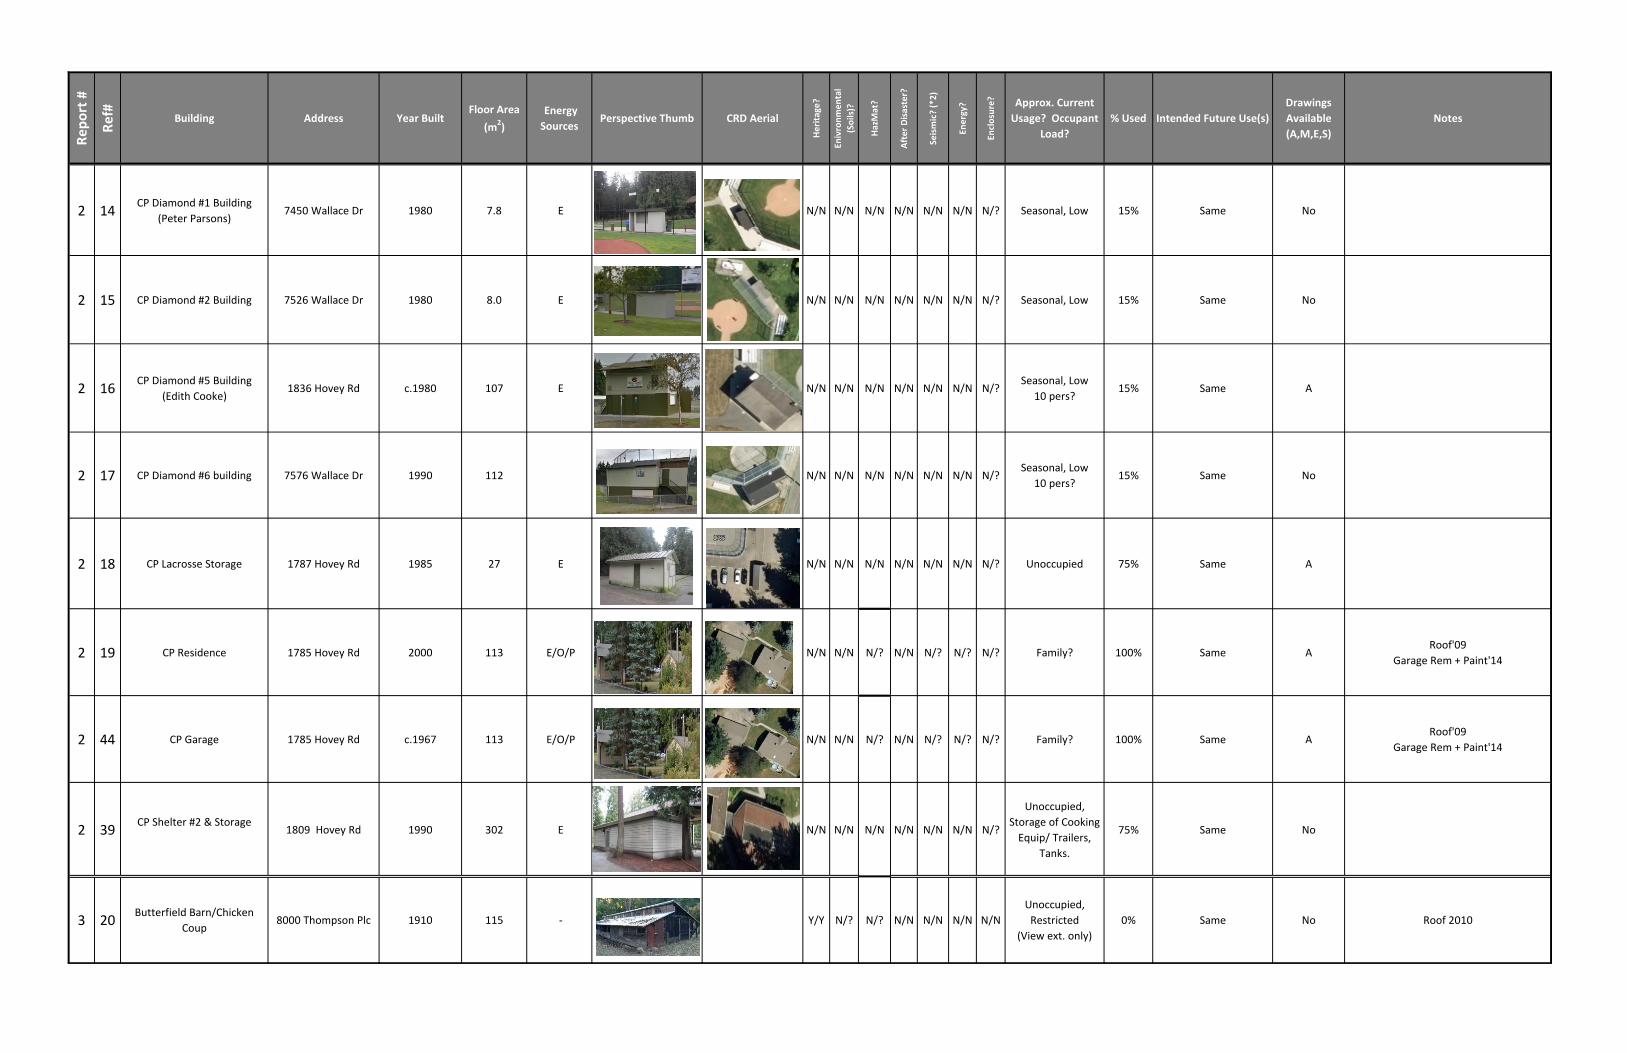
Re
po
rt #
Re
f# Building Address Year BuiltFloor Area
(m2)
Energy
Sources Perspective Thumb CRD Aerial
He
rita
ge?
Eniv
ron
me
nta
l
(So
ils)?
Haz
Mat
?
Aft
er
Dis
aste
r?
Seis
mic
? (*
2)
Ene
rgy?
Encl
osu
re? Approx. Current
Usage? Occupant
Load?
% Used Intended Future Use(s)
Drawings
Available
(A,M,E,S)
Notes
2 14CP Diamond #1 Building
(Peter Parsons)7450 Wallace Dr 1980 7.8 E N/N N/N N/N N/N N/N N/N N/? Seasonal, Low 15% Same No
2 15 CP Diamond #2 Building 7526 Wallace Dr 1980 8.0 E N/N N/N N/N N/N N/N N/N N/? Seasonal, Low 15% Same No
2 16CP Diamond #5 Building
(Edith Cooke)1836 Hovey Rd c.1980 107 E N/N N/N N/N N/N N/N N/N N/?
Seasonal, Low
10 pers?15% Same A
2 17 CP Diamond #6 building 7576 Wallace Dr 1990 112 N/N N/N N/N N/N N/N N/N N/?Seasonal, Low
10 pers?15% Same No
2 18 CP Lacrosse Storage 1787 Hovey Rd 1985 27 E N/N N/N N/N N/N N/N N/N N/? Unoccupied 75% Same A
2 19 CP Residence 1785 Hovey Rd 2000 113 E/O/P N/N N/N N/? N/N N/? N/? N/? Family? 100% Same ARoof'09
Garage Rem + Paint'14
2 44 CP Garage 1785 Hovey Rd c.1967 113 E/O/P N/N N/N N/? N/N N/? N/? N/? Family? 100% Same ARoof'09
Garage Rem + Paint'14
2 39CP Shelter #2 & Storage
1809 Hovey Rd 1990 302 E N/N N/N N/N N/N N/N N/N N/?
Unoccupied,
Storage of Cooking
Equip/ Trailers,
Tanks.
75% Same No
3 20Butterfield Barn/Chicken
Coup8000 Thompson Plc 1910 115 - Y/Y N/? N/? N/N N/N N/N N/N
Unoccupied,
Restricted
(View ext. only)
0% Same No Roof 2010

Re
po
rt #
Re
f# Building Address Year BuiltFloor Area
(m2)
Energy
Sources Perspective Thumb CRD Aerial
He
rita
ge?
Eniv
ron
me
nta
l
(So
ils)?
Haz
Mat
?
Aft
er
Dis
aste
r?
Seis
mic
? (*
2)
Ene
rgy?
Encl
osu
re? Approx. Current
Usage? Occupant
Load?
% Used Intended Future Use(s)
Drawings
Available
(A,M,E,S)
Notes
3 21 Butterfield Garage 8000 Thompson Plc 1930 61 E Y/Y N/N N/? N/N N/N N/N N/? Unoccupied 50% Same No
3 22 Butterfield Residence 8000 Thompson Plc 1910 170 E Y/Y N/N N/? N/N N/N N/N N/? Family? 100% Same No Roof+Chimney 2009
3 23 NF Main Farmhouse8073 Old Veyaness
Ave1905 77 N/A Y/Y Y/N N/? N/N N/N N/N N/N Unoccupied 0% Same No
Masselink Study
2007 for All
3 24 NF Garage / Workshop8073 Old Veyaness
Avec.1900 56 N/A Y/Y Y/N N/N N/N N/N N/N N/N Unoccupied 0% Same No
Main Farmhouse and outbuildings on first
Acre from 1905, remaining 15 acres likely
erected at a later date (year in italics,
TBC, currently as listed in Masselink
Stucy).
3 25 NF Chicken Coop8073 Old Veyaness
Avec.1900 9 N/A Y/Y Y/N N/N N/N N/N N/N N/N Unoccupied 0% Same No
Main Farmhouse and outbuildings OF
INTEREST to the Farmland's Trust as a
park = Future use.
3 26 NF West Shed8073 Old Veyaness
Avec.1900 16 N/A Y/Y Y/N N/N N/N N/N N/N N/N Unoccupied 0% Same No
3 27 NF Creamery8073 Old Veyaness
Avec.1900 7 N/A Y/Y Y/N N/N N/N N/N N/N N/N Unoccupied 0% Same No
3 28 NF Main Barn8073 Old Veyaness
Avec.1900 79 N/A Y/Y Y/N N/N N/N N/N N/N N/N Unoccupied 0% Same No
3 29 NF Original Cabin8073 Old Veyaness
Ave1896 20 N/A Y/Y Y/N N/N N/N N/N N/N N/N Unoccupied 0% Same No

Re
po
rt #
Re
f# Building Address Year BuiltFloor Area
(m2)
Energy
Sources Perspective Thumb CRD Aerial
He
rita
ge?
Eniv
ron
me
nta
l
(So
ils)?
Haz
Mat
?
Aft
er
Dis
aste
r?
Seis
mic
? (*
2)
Ene
rgy?
Encl
osu
re? Approx. Current
Usage? Occupant
Load?
% Used Intended Future Use(s)
Drawings
Available
(A,M,E,S)
Notes
3 30 NF Outhouse8073 Old Veyaness
Avec.1897 1.7 N/A Y/Y Y/N N/N N/N N/N N/N N/N Unoccupied 0% Same No
3 31 NF Guest Cabin8073 Old Veyaness
Avec.1930 12 N/A Y/Y Y/N N/N N/N N/N N/N N/N Unoccupied 0% Same No Sheep on site. Keep gates closed
3 32 NF Milking Shed8073 Old Veyaness
Avec.1900/1970 36 N/A Y/Y Y/N N/N N/N N/N N/N N/N Unoccupied 0% Same No Sheep on site. Keep gates closed
3 33 Boatbuilding Shed8073 Old Veyaness
Ave? 20 N/A Y/Y Y/N N/N N/N N/N N/N N/N Unoccupied 0% Same No
Building removed from inventory.
Beyond state of repairs.
3 34 NF East Shed8073 Old Veyaness
Avec.1930 6 N/A Y/Y Y/N N/N N/N N/N N/N N/N Unoccupied 0% Same No
3 35 NF North Boat House8073 Old Veyaness
Ave1931 32 N/A Y/Y Y/N N/N N/N N/N N/N N/N
Unoccupied, Used
by Paddling Club
for Storage
100% Same No
3 36 NF South Boat House8073 Old Veyaness
Ave1931 20 N/A Y/Y Y/N N/N N/N N/N N/N N/N
Unoccupied, Used
by Paddling Club
for Storage
100% Same No
3 37 NF Steam Shed8073 Old Veyaness
Ave1931 7 N/A Y/Y Y/N N/N N/N N/N N/N N/N Unoccupied 0% Same No
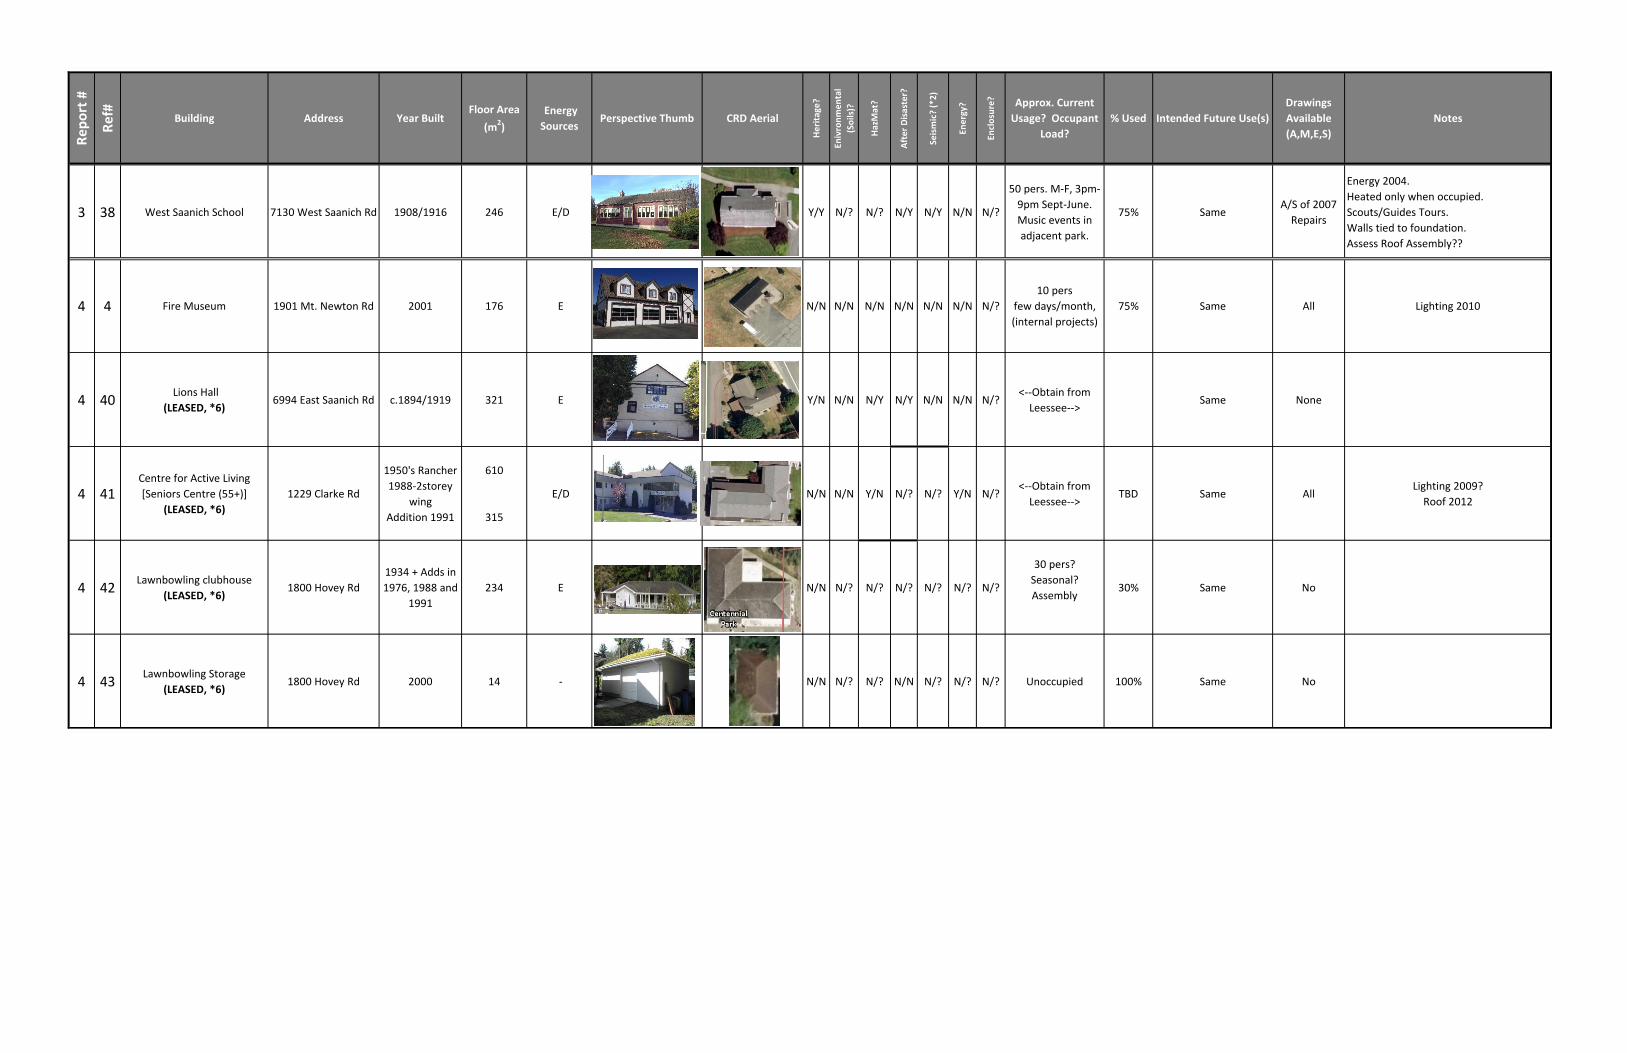
Re
po
rt #
Re
f# Building Address Year BuiltFloor Area
(m2)
Energy
Sources Perspective Thumb CRD Aerial
He
rita
ge?
Eniv
ron
me
nta
l
(So
ils)?
Haz
Mat
?
Aft
er
Dis
aste
r?
Seis
mic
? (*
2)
Ene
rgy?
Encl
osu
re? Approx. Current
Usage? Occupant
Load?
% Used Intended Future Use(s)
Drawings
Available
(A,M,E,S)
Notes
3 38 West Saanich School 7130 West Saanich Rd 1908/1916 246 E/D Y/Y N/? N/? N/Y N/Y N/N N/?
50 pers. M-F, 3pm-
9pm Sept-June.
Music events in
adjacent park.
75% SameA/S of 2007
Repairs
Energy 2004.
Heated only when occupied.
Scouts/Guides Tours.
Walls tied to foundation.
Assess Roof Assembly??
4 4 Fire Museum 1901 Mt. Newton Rd 2001 176 E N/N N/N N/N N/N N/N N/N N/?
10 pers
few days/month,
(internal projects)
75% Same All Lighting 2010
4 40 Lions Hall
(LEASED, *6)6994 East Saanich Rd c.1894/1919 321 E Y/N N/N N/Y N/Y N/N N/N N/?
<--Obtain from
Leessee-->Same None
4 41Centre for Active Living
[Seniors Centre (55+)]
(LEASED, *6)
1229 Clarke Rd
1950's Rancher
1988-2storey
wing
Addition 1991
610
315
E/D N/N N/N Y/N N/? N/? Y/N N/?<--Obtain from
Leessee-->TBD Same All
Lighting 2009?
Roof 2012
4 42Lawnbowling clubhouse
(LEASED, *6)1800 Hovey Rd
1934 + Adds in
1976, 1988 and
1991
234 E N/N N/? N/? N/? N/? N/? N/?
30 pers?
Seasonal?
Assembly30% Same No
4 43Lawnbowling Storage
(LEASED, *6)1800 Hovey Rd 2000 14 - N/N N/? N/? N/N N/? N/? N/? Unoccupied 100% Same No
Levelton File # R514-1802-00
June 08, 2015
District of Central Saanich
Facility Long-Term Asset Management Plan
Report No.1 – Municipal Buildings
APPENDIX V
GLOSSARY OF TERMS
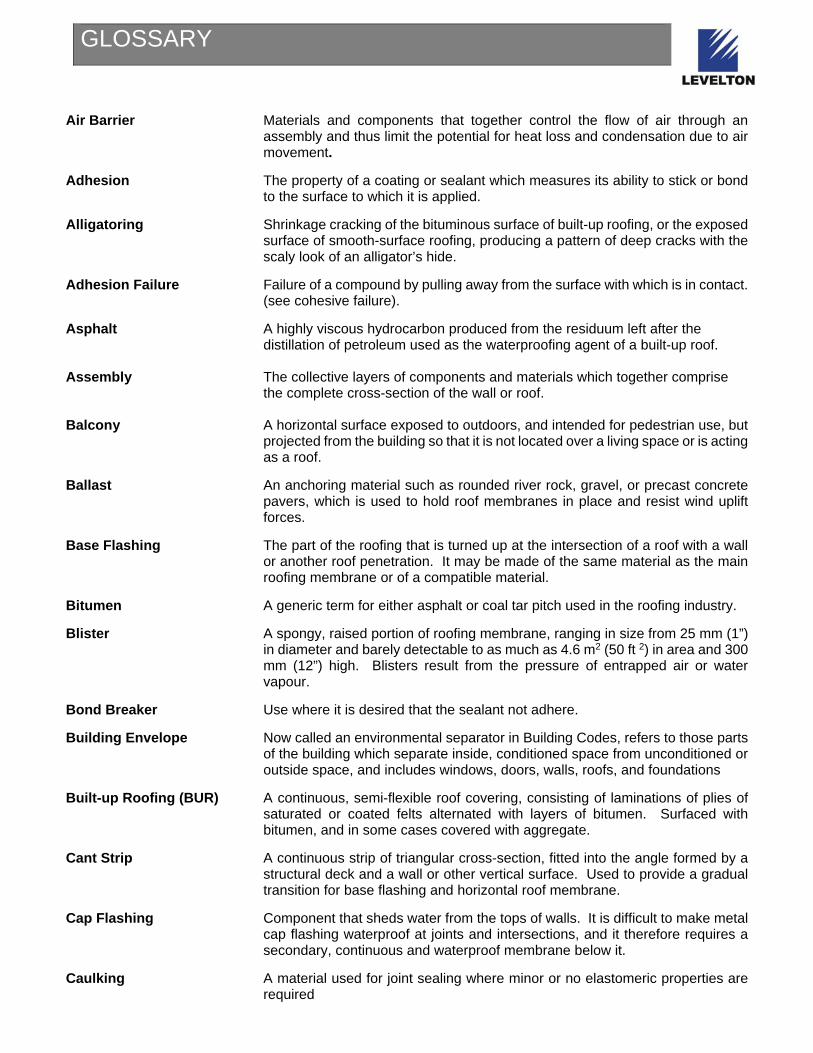
GLOSSARY
Air Barrier Materials and components that together control the flow of air through an
assembly and thus limit the potential for heat loss and condensation due to air movement.
Adhesion The property of a coating or sealant which measures its ability to stick or bond to the surface to which it is applied.
Alligatoring Shrinkage cracking of the bituminous surface of built-up roofing, or the exposed surface of smooth-surface roofing, producing a pattern of deep cracks with the scaly look of an alligator’s hide.
Adhesion Failure Failure of a compound by pulling away from the surface with which is in contact. (see cohesive failure).
Asphalt A highly viscous hydrocarbon produced from the residuum left after the distillation of petroleum used as the waterproofing agent of a built-up roof.
Assembly The collective layers of components and materials which together comprise
the complete cross-section of the wall or roof. Balcony A horizontal surface exposed to outdoors, and intended for pedestrian use, but
projected from the building so that it is not located over a living space or is acting as a roof.
Ballast An anchoring material such as rounded river rock, gravel, or precast concrete pavers, which is used to hold roof membranes in place and resist wind uplift forces.
Base Flashing The part of the roofing that is turned up at the intersection of a roof with a wall or another roof penetration. It may be made of the same material as the main roofing membrane or of a compatible material.
Bitumen A generic term for either asphalt or coal tar pitch used in the roofing industry.
Blister A spongy, raised portion of roofing membrane, ranging in size from 25 mm (1”) in diameter and barely detectable to as much as 4.6 m2 (50 ft 2) in area and 300 mm (12”) high. Blisters result from the pressure of entrapped air or water vapour.
Bond Breaker Use where it is desired that the sealant not adhere.
Building Envelope Now called an environmental separator in Building Codes, refers to those parts of the building which separate inside, conditioned space from unconditioned or outside space, and includes windows, doors, walls, roofs, and foundations
Built-up Roofing (BUR) A continuous, semi-flexible roof covering, consisting of laminations of plies of saturated or coated felts alternated with layers of bitumen. Surfaced with bitumen, and in some cases covered with aggregate.
Cant Strip A continuous strip of triangular cross-section, fitted into the angle formed by a structural deck and a wall or other vertical surface. Used to provide a gradual transition for base flashing and horizontal roof membrane.
Cap Flashing Component that sheds water from the tops of walls. It is difficult to make metal cap flashing waterproof at joints and intersections, and it therefore requires a secondary, continuous and waterproof membrane below it.
Caulking A material used for joint sealing where minor or no elastomeric properties are required
GLOSSARY
Cladding A material or component of the wall assembly, which forms the exterior surface of the wall and is exposed to the environment forces.
Cohesive Failure Splitting and opening of a compound resulting from over extension of the compound caused by excessive movement (see adhesion failure).
Concealed Barrier A strategy for rain penetration control that relies on the elimination of holes through a combination of the cladding and a secondary plane further into the assembly.
Contract The undertaking by the parties to perform their respective duties, responsibilities, and obligations as prescribed in the Contract Documents and represents the entire agreement between the parties.
Counter Flashing Prevents water from penetrating behind the top edge of base flashing, and consists of a separate piece of flashing placed over the top of the base flashing. It is usually made of sheet metal.
Cross Cavity Flashing Flashing that intercepts and directs water flowing down the cavity of a wall assembly to the outside of the building.
Deck A horizontal surface exposed to outdoors, located over a living space, and intended for pedestrian use in addition to performing the function of a roof.
Delamination Separation of the plies in a roof membrane system or separation of laminated layers of insulation.
Drainage Uses surfaces of the assembly to drain water away from the assembly.
Drip Flashing A component that directs water flowing down the face of vertical elements, such as walls or windows, away from the surface.
Durability Terminology describing the capacity of a material to tolerate environmental forces.
Efflorescence A white powdery deposit on the surface indicating moisture ingress through the concrete. This is caused when water travelling through the concrete reacts with calcium hydroxide.
Element A material or component within the assembly.
Emulsion An intimate mixture of bitumen and water, with uniform dispersion of the bitumen globules, achieved through a chemical of clay emulsifying agent.
Exterior Glazed Glass set from the exterior of the building.
Exterior Stop The removable molding or bead holding the glass or panel in place when it is on the exterior side of the glass or panel, as contrasted to an interior stop located on the interior side of the glass.
Face Seal A strategy for rain penetration control that relies on the elimination of holes through the cladding.
Felt A fabric made by the interlocking of fibres. Roofing felts are manufactured from cellulosic fibres (organic felts), asbestos fibres (asbestos felts), or glass fibres (glass fibre felts). Felts are either saturated, or saturated and coated with bitumen.
Fishmouth An opening formed by an edge wrinkle in a felt where it overlaps another felt in a built-up roofing membrane.

GLOSSARY
Flashing Connecting devices that seal membrane joints, drains, gravel stops and other places where the membrane is interrupted. Base flashing forms the upturned edges of the watertight membrane. Cap or counter flashing shields the exposed edges and joints of the base flashing.
Frame Outside member of a window unit, which encloses the sash. Compound of side jambs, head and sill.
Grade The classification of materials by quality. Also, the ground elevation or level, contemplated or existing, at the outside walls of a building, or elsewhere on the building site.
Granules Opaque, natural, or synthetically coloured aggregate commonly used to surface cap sheets and roofing shigles.
Gravel Coarse granular aggregate, having rounded edges, resulting from the natural erosion of rock.
Gravel Stop Flanged device, normally metallic, designed to prevent loose aggregate from washing off the roof and to provide a finished edge detail for the built-up roofing assembly.
HPO Homeowner Protection Office. The HPO is a provincial Crown corporation formed in response to the recommendations of the Barrett Commission.
Head The upper horizontal cross member, between the jambs, which forms the top of a door or window frame; may provide structural support for construction above if required, as a door head or window head.
Horizontal Joint A horizontal joint on a wall which provides capability for differential movement of portions of the building structure (expansion joint) or prevents or localizes cracking of brittle materials such as stucco (control joint).
Housewrap A sheet plastic material used as a breather type sheathing membrane. It is generally installed between the wall sheathing and the exterior cladding. Although at one time used as a proprietary term, housewrap is now used to represent a generic group of materials. One common type of housewrap consists of Spun-bonded Polyolefin (SBPO); another is made of perforated polyethylene.
Interior Glazed Glass set from the interior of the building.
Jamb A vertical member at either side of a doorframe, window frame or door lining.
Loosely Laid Membrane Membranes which are not attached to the substrate except at the perimeter of the roof. They are held in place with appropriate and adequate ballast.
Maintenance A scheduled process of periodic inspection and minor repairs to the building
envelope.
Modified Bitumen Asphalt enhanced by the addition of polymer modifiers to increase cold temperature flexibility and warm temperature flow resistance and stability. The most common modifiers are SBS (styrene butadiene styrene) and APP (atactic polypropylene).
Moisture Barrier Any material used to retard the passage or flow of moisture into the assembly, thus preventing condensation.
Moisture Content With respect to wood: The weight of water contained in wood expressed as a percentage of the weight of oven-dry wood.

GLOSSARY
Parapet The part of any wall entirely above the roof.
Penetration An intentional opening through an assembly.
Ply A layer of roofing membrane. A four-ply membrane has at least four plies of felt at any vertical cross section cut through the membrane.
Pressure Treatment A process for treatment of wood to provide greater durability against moisture.
PVC (Poly Vinyl Chloride) A thermoplastic sheet material used for single ply roofing membranes. Rainscreen A wall designed to prevent rain penetration by providing a cavity between the
cladding and the backup wall and vents the wall to allow moisture drainage.
Reglet A groove in a wall or other vertical surface adjoining a roof surface for the embedment of counter flashing.
Ridging An upward “testing” displacement of a roof membrane, frequently occurring over insulation joints, deck joints, and base sheet edges.
Saddle The junction of small horizontal surfaces, such as the top of a balcony guardrail or parapet wall, with a vertical surface, such as a wall.
Sealant Compound used to fill and seal joint or opening, contrasted to a sealer which is a liquid used to seal a porous surface.
Sealed Unit Two or more sheets of glass separated by a spacer bar and hermetically sealed for airtightness. Has a desiccant in between the sheets of glass to absorb and hold any moisture to prevent condensation inside the unit.
Service Life (Expected) The actual period during which building envelope materials, components and assemblies perform without unforeseen maintenance and renewal costs.
Sheathing Sheet material attached to the wall framing to provide structural backing for the cladding and sheathing paper. Can be designed to provide structural lateral stiffness for the wall.
Sheathing Membrane Sheet material in an exterior wall assembly used to retard penetration of water further into the structure once past the cladding. Waterproof type sheathing membranes can also perform the function of the air barrier and the vapour barrier. These materials include both breather type sheathing membranes such as sheathing paper and housewraps, and waterproof sheathing membranes.
Sheathing Paper Asphalt-impregnated organic sheet material (breather-type sheathing membrane) attached to the sheathing exterior which creates a water-shedding surface.
Sill The horizontal member that forms the bottom of a window frame. It is generally slanted down to the outside to shed standing water.
Single Ply Membrane Roofing membranes that are field applied using a pre-manufactured sheet of single layer membrane material (either homogenous or composite) rather than multiple layer.
Smooth-Surfaced Roof A built-up roofing membrane surfaced with a coating of hot asphalt, asphalt emulsion or asphalt cutback.
Stepped Flashing The material installed at the junction between a sloping roof and a wall running
parallel to the slope. Both base and counter flashing are overlapped and installed in pieces following the slope to form the complete stepped flashing.
GLOSSARY
Substantial Performance A stage that is reached when the work is ready for use or is being used for the purpose intended as is so certified by the consultant
Substrate The surface upon which the roofing membrane is placed – structural deck or insulation.
Threshold A strip fastened to the floor beneath a door, usually required to cover a joint where two types of floor material meet; may provide weather protection at exterior doors (also referred to as doorsill).
Through-wall Flashing A waterproof membrane or metal flashing that 1) allows water behind the cladding to shed away from the building, 2) prevents water from entering the wall at joints, and 3) prevents capillary transfer of moisture though porous materials such as concrete or masonry if the moisture source is below grade.
Valley Flashing Flashing installed in the valleys of sloping shingled roofs to give continuity to the roofing system.
Vapour Barrier A material with low vapour permeability that is located within the assembly to control the flow of vapour and limit the potential for condensation due to diffusion.
Vapour Retarder A material designed to restrict the passage of water vapour through a wall or roof assembly.
Walkway A pedestrian corridor exposed to outdoors, which provides access between suites and stairwells or elevators. It may also be a roof.
Weephole Opening at the base of a cavity wall to collect moisture and dispense it or breather put in to sealant to relieve moisture.
Work The total construction and related services required by the Contract Documents
Acknowledgement is given to: Canada Mortgage and Housing Corporation, “Best Practice Guide Wood Frame Envelopes in The Coastal Climate of British Columbia” 1st Edition, September 1998 as a basis for this glossary.
Canada Mortgage and Housing Corporation, “Building Envelope Rehabilitation – Consultants Guide” 1st Edition, 2001 Canadian Construction Documents Committee, “CCDC 2 – Definitions”, 1994Dictionary of Architecture and Construction, Edited by Harris, Cyril M., McGraw Hill Inc., 1975
Related Documents