.. , WARD-D-OO50, REV. 3 WARD-D Category 11 Clinch River Breeder Reactor Plant CRBRP CORE ASSEMBLIES HOT CHANNEL FACTORS PRELIMINARY ANALYSIS SEPTEMBER 1979 "" P0 3 El8|NAL Prepared for the United States Department of Energy t.nder contracts EY-76-C-15-2395 and EY-76-C-15-0003. Any Further Distribution by any Holder of this Document or of the Data Therein to Third Parties Representing Foreign Interest, Foreign Govern- ments, Foreign Companies and Foreign Subsidi- aries or Foreign Divisions of U.S. Companies Should be Coordinated with the Director, Division of Reactor Research and Technology, United States Department of Energy. _ W Westinghouse Electric Corporation ADVANCED RE ACTORS DIVISION B0X 158 f C7!L2 M ADISO N, PENNSY LV ANI A 15663 7oscuog

Welcome message from author
This document is posted to help you gain knowledge. Please leave a comment to let me know what you think about it! Share it to your friends and learn new things together.
Transcript

.. ,
WARD-D-OO50, REV. 3WARD-D Category 11
Clinch RiverBreeder Reactor Plant
CRBRP CORE ASSEMBLIESHOT CHANNEL FACTORSPRELIMINARY ANALYSIS
SEPTEMBER 1979
""P0 3 El8|NAL
Prepared for the United States Department ofEnergy t.nder contracts EY-76-C-15-2395 andEY-76-C-15-0003.
Any Further Distribution by any Holder of thisDocument or of the Data Therein to Third PartiesRepresenting Foreign Interest, Foreign Govern-ments, Foreign Companies and Foreign Subsidi-aries or Foreign Divisions of U.S. CompaniesShould be Coordinated with the Director, Divisionof Reactor Research and Technology, UnitedStates Department of Energy.
_
W Westinghouse Electric CorporationADVANCED RE ACTORS DIVISION
B0X 158f C7!L2M ADISO N, PENNSY LV ANI A 15663
7oscuog
. .
TITLE DOCUMENT NO.
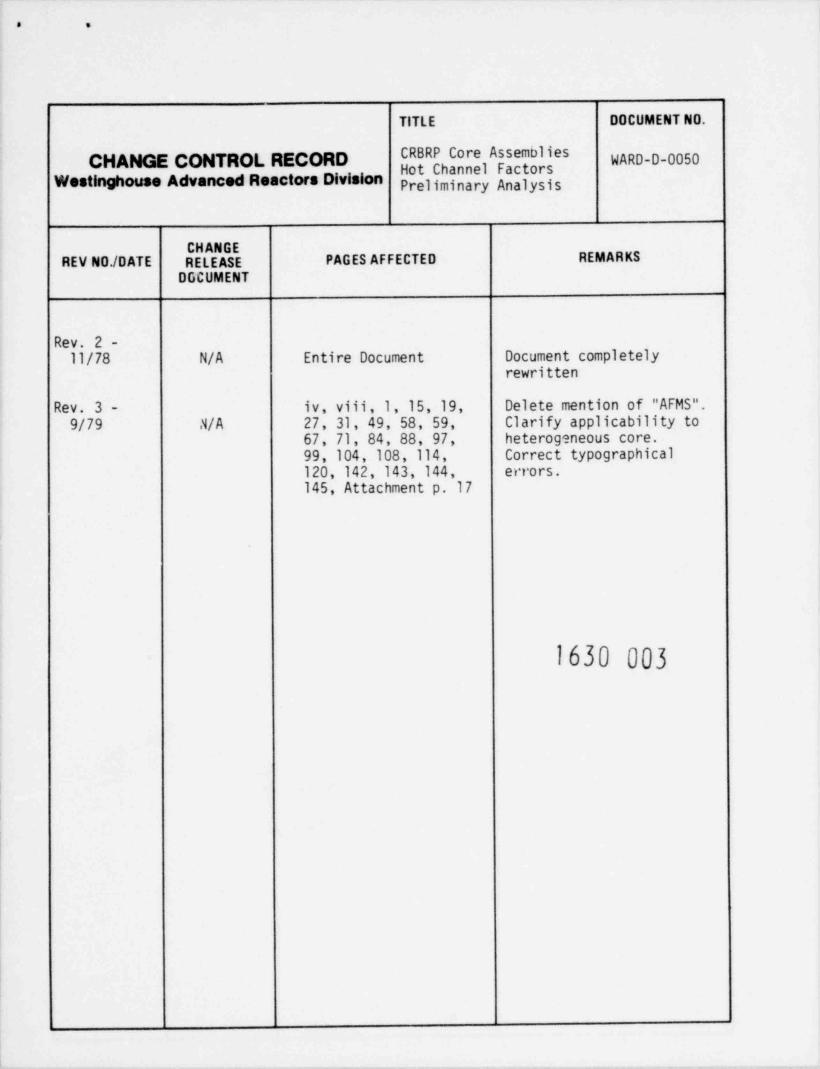
CRBRP Core AssemuliesCHANGE CONTROL RECORD WARD-D-0050" " torWestinghouse Advanced Reactors Division el nal
CHANGEREV N0/DATE RELEASE PAGES AFFECTED REMARKS
DGCUMENT
Rev. 2 -11/78 N/A Entire Document Document completely
rewritten
Rev. 3 - iv, viii,1,15,19, Delete mention of "AFMS".9/79 N/A 27, 31, 49, 58, 59, Clarify applicability to
67, 71, 84, 88, 97, heteroganeous core.99, 104, 108, 114, Correct typographical120, 142, 143, 144, errors.145, Attachment p.17
1630 003
. .
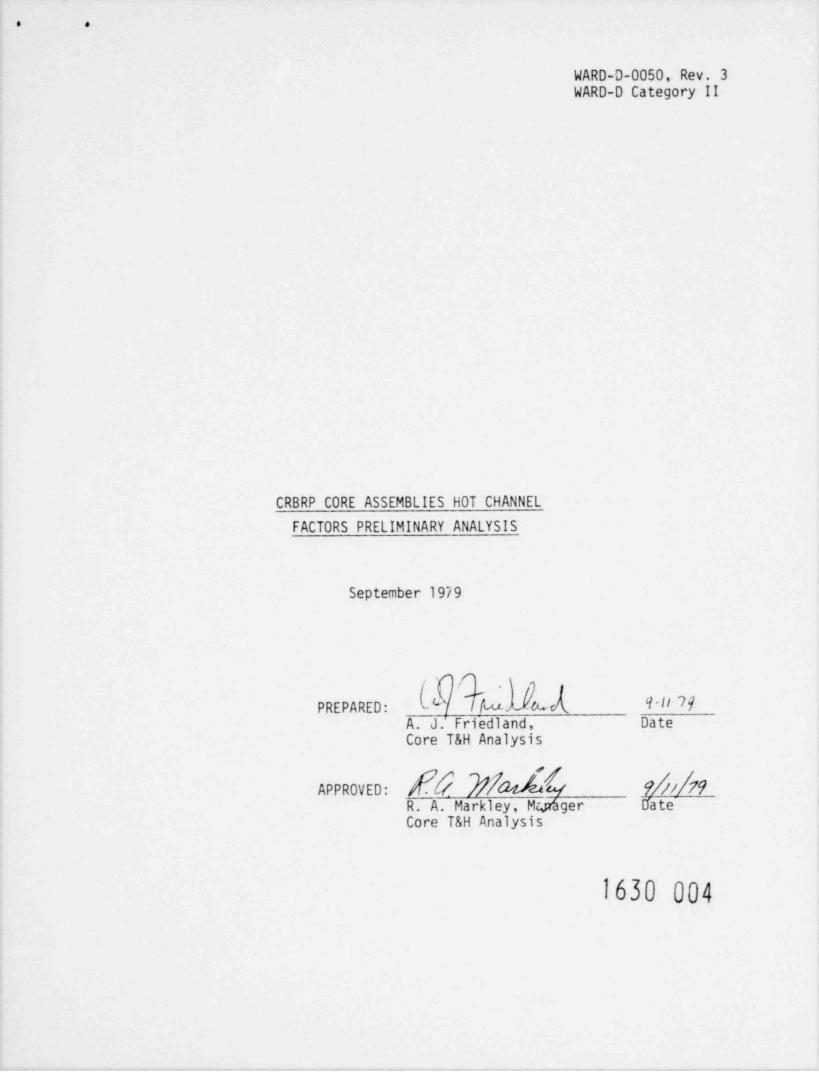
WARD-D-0050, Rev. 3WARD-D Category II
CRBRP CORE ASSEMBLIES HOT CHANNEL
FACTORS PRELIMINARY ANALYSIS
September 1979
PREPARED: wu A 4'I' 79A. J.' Friedland, DateCore T&H Analysis
9 / !79APPROVED: eVR. A. Markley, Mcp'ager UateCore T&H Analysis
1630 004

'
' iI ARD-0 TX)50 ~1
- .1 REV 2
g INFORMATI0f1 CONCERflING USE OF THIS DOCUMENT
|| PRELIMIflARY DOCUMENT|
This document contains information of a preliminary nature prepared in thecourse of work for the U. S. Department of Energy. This infonnation issubject to correction or modification upon the collection and evaluationof additional data,
it0TICE '
This document was prepared as an account of work sponsored by the United StatesGovernment. fleither the U. S. Department of Energy, nor any of their employees,nor any of their contractors, subcontractors, or their employees, makes anywarranty, express or implied, or assumes any legal liability or responsibilityfor the accuracy, completeness or usefulness of any information, apparatus,product or process disclosed, or represents that its use would not infringeprivately owned rights.
... -
C
WESTINGHOUSE ELECTRIC CORPORATION
ADVANCED REACTORS DIVISION
B0X 158
MADISON, PENNSYLVANIA 15663
!
1630 005
n
.. ..
. .
. . IARB-94 0050 . : .4Rt1 2 ,'
'
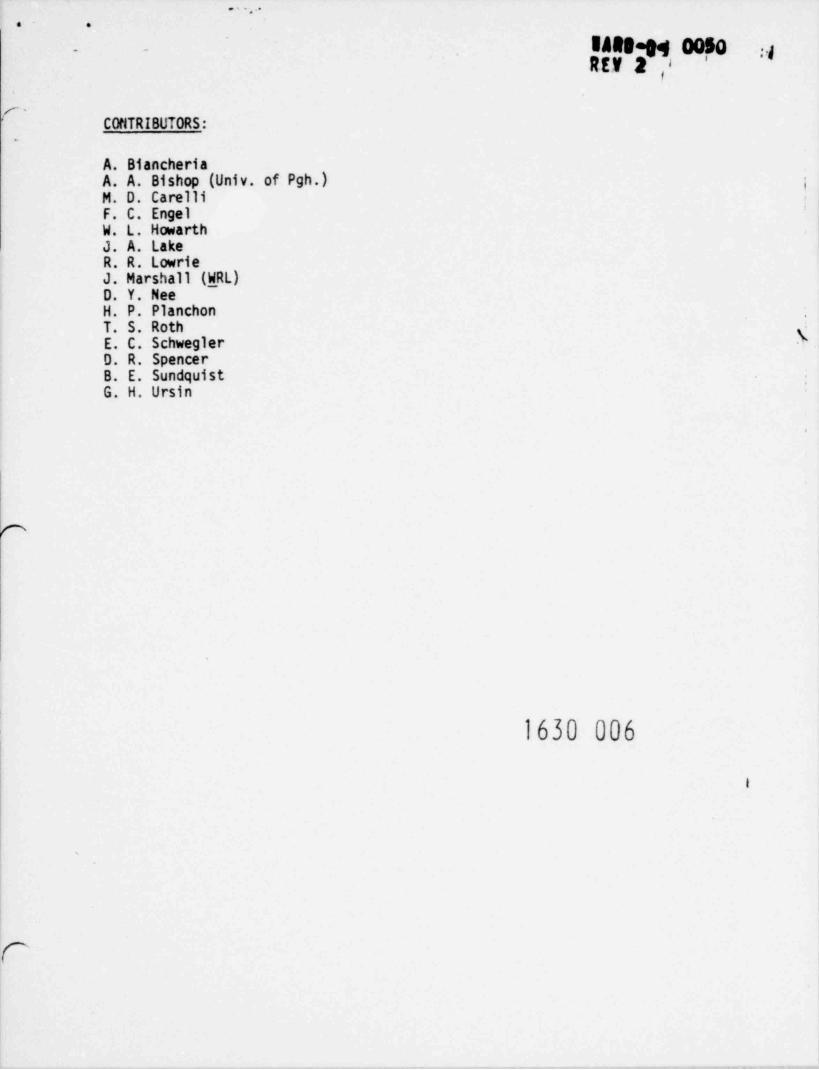
CONTRIBUTORS:.
A. BiancheriaA. A. Bishop (Univ. of Pgh.) iM. D. CarelliF. C. EngelW. L. HowarthJ. A. LakeR. R. LowrieJ. Marshall (WRL)D. Y. NeeH. P. Planchon .
T. S. RothE. C. Schwegler -(D. R. SpencerB. E. SundquistG. H. Ursin
.
1630 006
i
'

* ,
WARD-9905d .y-
SEV 2-
TABLE OF CONTENTS
C Page
1.0 INTRODUCTION AND SUMMARY l
2.0 ANALYTICAL PROCEDURES 3
2.1 Treatment of Statistical Factors 5
2.2 Tolerance Interval 6
2.3 Overall Uncertainty 8
2.4 Sample Calculation 10
3.0 FUEL ASSEliBLIES HOT SPOT FACTORS 13
3.1 Fuel Rod Cladding and Coolant Temperature Hot Spot 13Factors for Fuel Assemblies3.1.1 Power Level Measurement and Control System 13
Dead Band
3.1.2 Cladding Circumferential Temperature 13Variation
3.1.3 Reactor AT and Inlet Temperature Variation 14
3.1.4 Loop Temperature Imbalance 20
3.1.5 Inlet Flow Maldistribution 25
p 3.1.6 Flow Distribution Calculational Uncertainty 33
3.1.7 Wire Wrap Orientation 44
3.1.8 Subchannel Flow Area 44
3.1.9 Film Heat Transfer Coefficient 45
3.1.10 Pellet-Cladding Eccentricity 49
3.1.11 Cladding Thickness and Conductivity 49
3.1.12 Coolant Properties 51
3.1.13 Nuclear Uncertainties 53
3.2 Power-to-Melt Uncertainty Factors for Fuel Assemblies 59
3.2.1 Introduction 59
3.2.2 EBR-II Factors 62
3.2.3 Power-to-Melt in CRBRP 69-
3.2.4 Typical Power-to-Melt Analysis 71
3.3 Coolant Exit Mixed Mean Hot Spot Factors for Fuel 81Assemblies
c 1630 007
i

* . V
$gy gTA8LE OF CONTENTS (Con't)
Page
3.4 Fission Gas Plenum Pressure Uncertainty Factors 81
for Fuel Assemblies
4.0 BLANKET ASSEMBLIES HOT SPOT FACTORS 83
4.1 Fuel Rod Cladding and Coolant Temperatures Hot Spot 83Factors for Blanket Assemblies4.1.1 Cladding Circumferential Temperature Variation 83
4.1.2 Inlet Flow Maldistribution 83
4.1.3 Flow Distribution Calculational Uncertainty 87
4.1.4 Subchannel Flow Area 88 5
4.1.5 Film Heat Transfer Coefficient 89
4.1.6 Pellet-Cladding Eccentricity 89
4.1.7 Nuclear Uncertainties 89
4.2 Power-to-Melt Uncertainty Factors for Blanket 97Assemblies
4.2.1 Extrapolition Uncertainty 97
4.2.2 CRBRP Blanket Rod design Uncertainties 108
4.2.3 Total Blanket Rod Uncertainty and Design 108Criteria
4.3 Coolant Exit Mixed Mean Hot Spot Factors for Radial 113Blanket Assemblies
4.4 Fission Gas Plenum Pressure Uncertainty Factors for 113Radial Blanket Assemblies
5.0 PRIMARY CONTROL ASSEMBLIES HOT SPOT FACTORS j14
5.1 Absorber Pin Temperatures Hot Spot Factors for 114Primary Control Assemblies
5.1.1 Power Level Measurement and Control System j14
Dead Band
5.1.2 Inlet Flow Maldistribution 114'5.1.3 Assembly Flow Maldistributior Calculational 116
Uncertainties5.1.4 Bundle / Bypass Flow Split 116
5.1.5 Cladding Circumferential Temperature 116Variation
1630 008
ii
Rtv 2' '
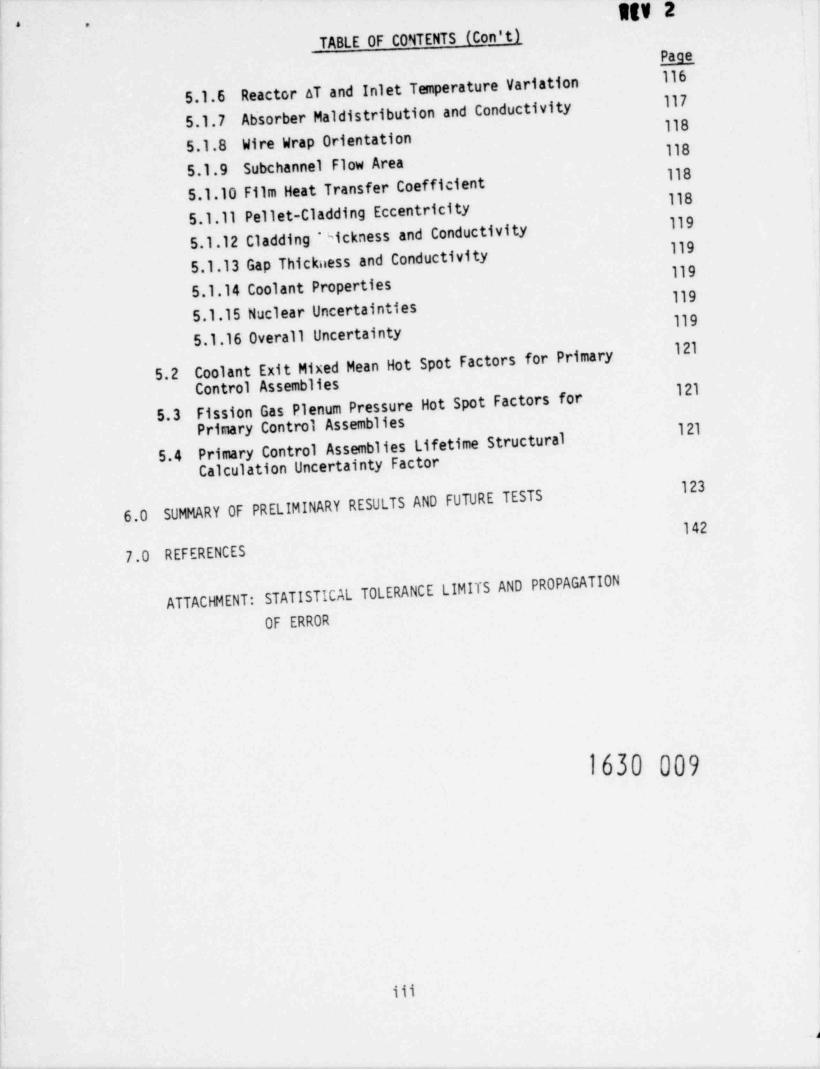
TABLE OF CONTENTS (Con't)_Pagg116
Reactor AT and Inlet Temperature Variation5.1.6 117Absorber Ma1 distribution and Conductivity5.1.7 118
5.1.8 Wire Wrap Orientation 118
5.1.9 Subchannel Flow Area 1185.1.10 Film Heat Transfer Coefficient 1185.1.11 Pellet-Cladding Eccentricity
1195.1.12 Cladding %ickness and Conductivity
1195.1.13 Gap Thickness and Conductivity
1195.1.14 Coolant Properties
1195.1.15 Nuclear Uncertainties 1195.1.16 Overall Uncertainty
1 21
Coolant Exit Mixed Mean Hot Spot Factors for Primary5.2Control Assemblies 1 21
Fission Gas Plenum Pressure Hot Spot Factors for5.3Prinary Control Assemblies 1 21
Primary Control Assemblies Lifetime Structuraj5.4Calculation Uncertainty Factor
123
SUMMARY OF PRELIMINARY RESULTS AND FUTURE TESTS6.0142
7.0 REFERENCES
STATISTICAL TOLERANCE LIMITS AND PROPAGATIONATTACHMENT:
OF ERROR
1630 009
iii

use-e+'5d 1- -
REV 3 -
TABLES e-
Page
2.1 Sample Calculation of Fuel Assembly Rod Cladding Miawall 12Temperature
3.1 Plant Expected Operating Conditions and Uncertainties 18
3.2 Plant Expected Conditions Considered in Heterogeneous Core 19Thermofluids Analyses
3.3 Results of Four IPFM Flow Distribution Tests at s100% Flow, 293 Loops
3.4 Results of Four IPFM Assembly-to-Assembly Flow Distribution 30Test Results at N100% Flow, 3 Loops
3.5 Flow Assembly Inlet Flow Maldistribution Subfactors (3a) 32
3.6 Ratio of Side Subchannel Axial Average Velocity to Bundle 43Axial Average Velocity
3.7 Suninary of Density Measurements for Liquid Sodium 52
3.8 Center Temperatures and Powers-to-Melt of Incipient Melt 61
Sections as Computed by LIFE-III Calibration T18/6000
3.9 Spatial Dependence of Power Uncertainty Calculations from 65Comparison of Measured and Calculated Control Rod Worths
3.10 Values of Uncertainties in EBR-II 68
3.11 CRBRP Fuel Rod Tolerances and Uncertainties 70
3.12 Sensitivity of Power-to-Melt to Design Uncertainties 77
3.13 Statistical Combination of Power-to-Melt Uncertainties 78Due to Design Uncertainties
3.14 Effect of Melting Point Uncertainty of = 5.8 F on Un- 79TMcertainty of Power-to-Melt
3.15 Total Uncertainty on CRBRP Reactor Power-to-Melt in Re- 80actor Power Units Where Nominal Full Power is 1.0
4.1. Results of Four IPFM Flow Distribution Tests at s100% 85Flow, 3 Loops
4.2 Blanket Assembly Inlet Flow Maldistribution Subfactors (3o) 86
4.3 Blanket Irradiation Tests 98
4.4 Extrapolation Uncertainties for Blanket Rods 109
1630 010
iv

IARD-DT050- -
StV 2TABLES (Continued)
Page
4.5 CRBRP Blanket Rod Tolerances and Uncertainties 110
4.6 Blanket Rod Sensitivities of Power-to-Melt to Design Un- 111certainties; Power-to-Melt Uncertainties Due to IndividualDesign Uncertainties; and the Statistical Combination ofThese Power-to-Melt Uncertainties
4.7 Total Uncertainty on CRBRP Reactor Power-to-Melt for 112Blanket Rod in Reactor Power Units Where Nominal FullPower is 1.0
5.1 Control Assembly Inlet Flow Maldistribution Subfactors (3a) 115
5.2 Comparison of Hot Spot Coolant Temperatures Calculated 120Using Current Uncertainties and Updated Uncertainties
6.lA CRBRP Fuel Assemblies Rod Temperature Engineering Uncer- 124tainty Factors
6.18 CRBRP Fuel Assemblies Rod Temperature Nuclear Uncertainty 125Factors
6.2A CRBRP Fuel Assemblies Mixed Mean Exit Temperature Engineering 126Hot Channel Factors
6.2B CRBRP Fuel Assemblies Mixed Mean Exit Temperature Nuclear 127Uncertainty Factors
6.3A CRBRP Fuel Assemblies Plenum Pressure Engineering Uncer- 128tainty Factors
6.3B CRBRP Fuel Assemblies Plenum Pressure Nuclear Uncertainty 129Factors
6.4A CRBRP Inner / Radial Blanket Assemblies Rod Temperatures 130Engineering Uncertainty Factors
6.4B CRBRP Inner / Radial Blanket Assemblies Rod Temperatures 131Nuclear Uncertainty Factors
6.5A CRBRP Inner / Radial Blanket Assemblies Mixed Mean Exit 132Temperature Engineering Uncertainty Factors
6.53 CRBRP Inner / Radial Blanket Assemblies Mixed Mean Exit 133Temperature Nuclear Uncertainty Factors
6.6A CRBRP Inner / Radial Blanket Assemblies Plenum Pressure 134Engineering Uncertainty Factors
6.6B CRBRP Inner / Radial Blanket Assemblies Plenum Pressure 135Nuclear Uncertainty Factors
1630 011y

WARD-D-0050. .
MV 2
TABLES (Continued)
Page
6.7 CRBRP Primary Control Assemblies Pin Temperatures Hot 136
Channel / Spot Factors
6.8 CRBRP Primary Control Assemblies Mixed Mean Exit Temper- 137
ature Hot Channel Factors
1386.9 CRBRP Primary Control Assemblies Plenum Pressure HotChannel Factors
6.10 CRBRP Primary Control Assemblies Lifetime Structural Cal- 139
culations Uncertainty Factors
6.11 Future Core Assemblies T&H Tests 140
1630 012
vi
*
WARO-5dOO50. - "
SEV 2.
FIGURES
Page
2-1 Graphical Illustration of Semistatistical Method 9
3-1 Deviations in Inlet Module Steady State Mixing Ratio from 21
Perfect Mixing for 3 Loop 100% Flow and Injection in Loop#1
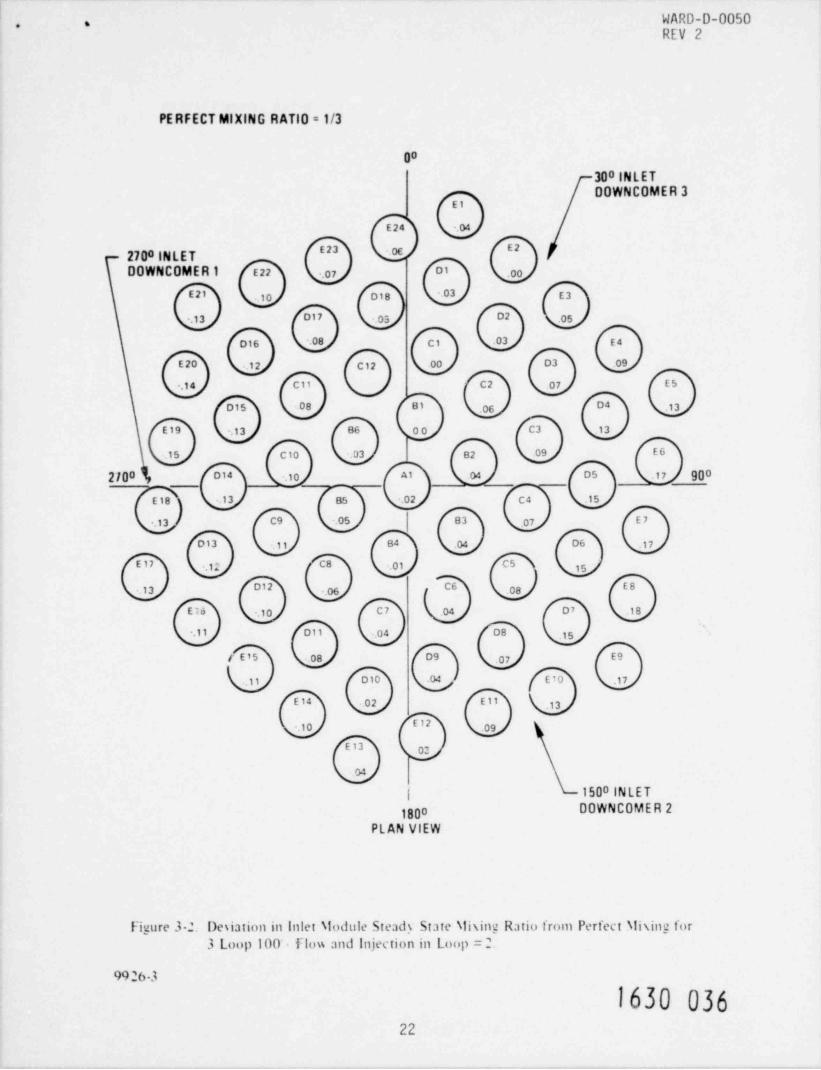
3-2 Deviations in Inlet Module Steady State Mixing Ratio from 22Perfect Mixing for 3 Loop 100% Flow and Injection inLoop #2
3-3 Deviations in Inlet Module Steady State Mixing Ratio from 23Perfect Mixing for 3 Loop 100% Flow and Injection inLoop #3
3-4 2a Inlet Module Temperature Uncertainty Based cn a Loop 24Temperature Imbalance of up to 34 F, for 3 Loop Operation
3-5 Fuel Assembly Inlet Nozzle Flow Resistance Versus Reynolds 26Number; Orifice Group Number 5
3-6 Core Flow Distribution Map, Run A5.2, i .8%, 3 Loop Flow, 28140 F
3-7 12 Inch HEDL Experimental Data 34
3-8 Comparison Between COTEC Results and HEDL Data at 24 Inches 35
3-9 Comparison Between COTEC Results and HEDL Data at 36 Inches 35
3-10 ORNL Test Series #2, Test #02, Run #105 36
3-11 ORNL Test Series #2, Test #02, Run #109 37
3-12 ORNL Test Series #2, Test #03, Run #201 38
3-13 ORNL Test Series #2, Test #04, Run #205 39
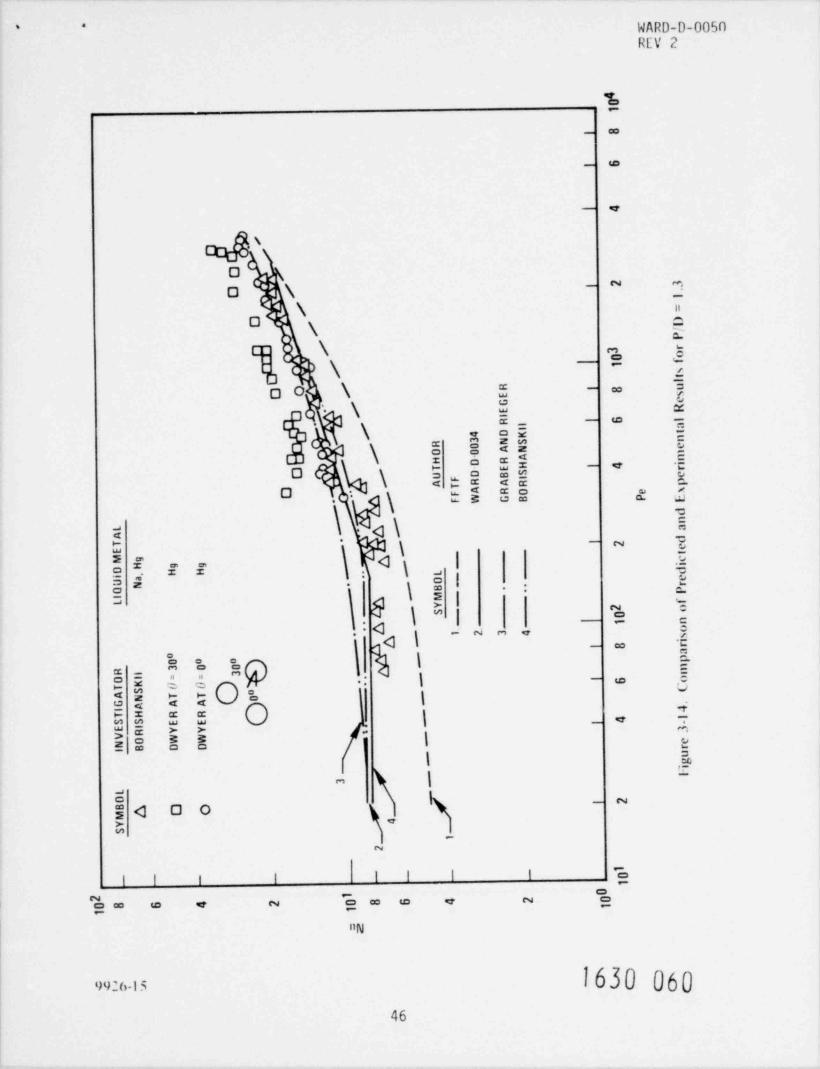
3-14 Comparison of Predicted and Experimental Results for 46
P/D = 1.3
3-15 Comparison of Predicted and Experimental Results for 47
P/D = 1.25
3-16 Comparison of Predicted and Experimental Results for 48
P/D = 1.2
3-17 LIFE-III Thermal Calibration T18/6000 60
3-18 Control Rod Worths for EBR-II Run 27A 64
1630 013vii
WARD-D T 50 1. -
Rit s
FIGURES (Continued)
Page
3-19 Power History Used in the Evaluation of Power-to-Melt 72Uncertainties
3-20 Variation of Power-to-Melt with Pellet Diameter 74
4-1 Comparison of Predicted and Experimental Results for 90P/D = 1.15
4-2 Comparison of Predicted and Experimental Results for 91
P/D = 1.1
4-3 Comparison of Predicted and Experimental Results for 92
P/D < 1.05_
4-4 Power-to-Melt Study, IB/A 128, Pin 27, X/L = 0.466 99EOC4 3c Operating Conditions
4-5 Comparison of Computed and Observed Central Hole Radii and 105Melt Radii
4-6 Comparison of Calculated and Predicted Central Hole Radii 106for Mechanical Calibration Pins
1630 014
viii

WARD-D-00$0<. .
REV S
1.0 INTRODUCTION AND SUMMARY
The impact of uncertainties associated with theoretical and experimentalanalyses, instrumentation accuracy, manufacturing tolerances, physical pro-perties and physical phenomena correlations must be considered in predictingthe reactor thermal-hydraulic performance to ensure the safe and reliableoperation of the CRBRP core and to guarantee that proper margins are pro-vided to meet both lifetime and safety design limits and requirements.
The effects of the various uncertainties are accounted for in the " hotchannel factors" or " hot spot factors" analyses. The basis of such analyses
is to characterize a hot channel as the one affected by the simultaneousoccurrence of all uncertainties and thereby predict the temperature of thehot channel or hot spot, which will be compared with the required limits.The use of hot channel factors has evolved over a long period of time,initially in light water reactors and more recently in liquid metal cooledfast breeder reactors.
This report documents the methodology, supporting bases including data baseand computed values for the hot channel factors used in the heterogeneous corethermal-hydraulic analyses. The analytical procedures are discussed in
Section 2.0. The hot channel factors for the fuel and blanket assemblies for theheterogeneous core are discussed in Sections ').O and 4.0, respectively, and are
summarized in Sectic 6.0. The not channel ft . ors for the primary control assem-
blies are preliminary values which were developed for the homogeneous core and
are being updated. They are discussed in Section 5.0 and are also summarized
in Section 6.0. The results presented here are preliminary in nature. Changes
in plant design and operating conditions. growth of the supporting data baseand ongoing development of analytical methods will result in continued updatingas the design proceeds. Final results will be presented in the FSAR.
The hot channel factors used ir, calculations of the coolant temperature,cladding temperature, and gas plenum pressure for the CRBRP fuel, blanket,and primary control assemblies are presented in Tables 6.lA through 6.10.Results of uncertainty analyses associated with fuel power-to-melt c.alcu-lations are addressed in the appropriate sections of this report.
1630 015

21g0 paid 056- .
.ssociated with the fuel and blanket as-For convenience, the un _ d.ci:o e
semblies are grouped acc. engineering (table numbers with the "A"
suffix) and nuclear consiw ons (table numbers with the "B" suffix).Note that 3a statistical values are applied to the plant thermal-hydraulicdesign conditions when pcri a. ety analyses. The 2a level is applied
to plant expected operating c; ''tions when calculating parameters such ascladding temperature and pressure, which are input to replaceable core as-sembly lifetime analyses. The hot channel factors in this report are ap-plicable at full power steady state conditions. The 3a uncertainties as-sociated with the tt.rmel-hydrau'ic values are conservatively used as theinitial conditions fot urgency and faulted transient and safety analyses.
The hot channel factors reported in Tables 6.lA through 6.10 are considered
to be conservative. This will be further established as additional databecome available from tests which are planned or in progress. These include:
additional irradiation experiments on fuel, blanket, and primary control rods;engineering mockup critical experiments in the ZPPR; pressure drop' tests offuel, blanket, and control assemblies and orifice configurations; heattransfer tests on a 61 fuel rod bundle in sodium; cross flow measurementsin a 5:1 scale blanket rod bundle sector in air; and heat transfer tests insodium on a prototypic blanket rod bundle. These data will be included inthe FSAR analyses. A more detailed tabulation of the forthcoming T&H testsis given in Table 6.11.
1630 O!6
.
2

8400F0" .
2.0 ANALYTICAL Ph2EDURE
The impact of theoretical and experimental analytic uncertainties, instru-mentation accuracy, manufacturing tolerances, physical properties andcorrelations uncertainties must be considered in predicting the reactor thermal-hydraulic performance to ensure the safe and reliable operation of the CRBRPcore and to guarantee that proper margins are provided so as not to exceed the
design limits and requirements.
The effects of the various uncertainties are accounted for in the " hot channelfactors" or " hot spot factors" analysis. The basis of such an analysis is tocharacterize a hot channel as the one offected by the simultaneous occurrenceof all uncertainties and thereby predict the temperature of the hot channel orhot spot, which will be compared with the required limits. .
Consistent with PWR, FFTF and Westinghouse proposal studies, the semi-
statistical hot spot analysis is used for the CRBRP. Use of the semi-statistical method requires the separation of the variables which cause thehot spot temperatures into two principal categories; one of statisticalorigin and the other non-statistical . The two categories are defined below.
A non-statistical (or direct) uncertainty is defined as a variation in a designvariable which is known or conservatively assumed to occur, but is not includedin the nominal analysis. Computationally, the non-statistical factors representmultipliers applied to the nominal magnitudes of the variables to provide the
worst values which will occur. A variable which has a random frequency distri-
bution of occurrence is treated statistically. For exartple, experimental data
(such as materials properties) are treated statistically since there is randomerror in their evaluation.
Direct and statistical factors employed in deriving CRBRP fuel rod hotchannel / spot temperatures, for example, are shown in Tables 6.lA and 6.1B.
The di,act factors in these tables are related to effects that are assumedto occur with certainty. That is, power level measurement and control system
deadband, inlet flow maldistribution direct bias, subchannel flow distribution
1630 0173

IARD-010050 :1- .
REV 2 I
simulation bias, cladding temperature increase beneath the wire wrap, pellet-cladding eccentricity, physics analysis calculational methods and control rodeffects are direct consequences of the design and result in known temperaturenon-uniformities at some time during core life. The statistical factors, on
the other hand, are based on random occurrences (i.e., timewise, spatial-wiseor data / tolerance distribution) such that the probability of departure fromthe nominal value is given by a probability distribution. Typical of such
random effects are manufacturing variability of fissile fuel content,dimensional tolerances, instrumentation uncertainties, and experimentaluncertainties in measured values. In the CRBRP statistical factors, manu-facturing variability and dimensional tolerances affect fissile fuel maldis-tribution, rod diameter and pitch, and cladding thickness; instrumentationuncertainties affect power level measurement; and uncertainties in experi-mental data affect nuclear power distribution, film coefficient, claddingconductivity and power-to-melt.
The hot channel factors may be grouped into categories which indicate thebasis for each factor:
Statistical - The data base is sufficient to provide a statistical
basis for the hot channel factor.
Empirical or Bounding - The data base is small and/or only abounding value can be calculated.
Engineering Judgement - Little or no data are available.
Analytical - Represents analytical adjustments to the nominalanalysis rather than uncertainties.
This report provides the basis for each factor and subfactor.
1630 018
4
'< .
-8-0050~
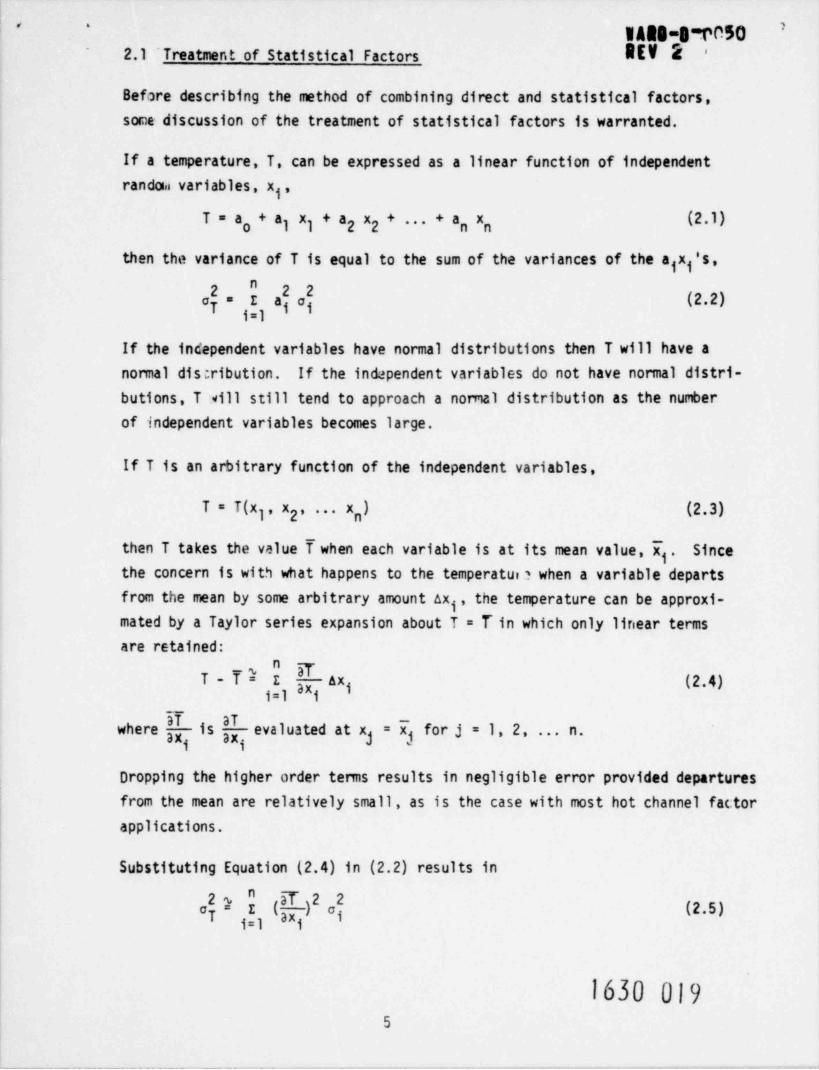
2.1 Treatment of Statistical Factors g
Before describing the method of combining direct and statistical factors,some discussion of the treatment of statistical factors is warranted.
If a temperature, T, can be expressed as a linear function of independentrandosa variables, x ,j
T=a + a) x) + a2 *2 + ... + an *n (2.1)g
then the variance of T is equal to the sum of the variances of the a x 's,jj
2o = a a (2.2)i=1
If the incependent variables have normal distributions then T will have anormal dis;ribution. If the indapendent variables do not have normal distri-butions, T will still tend to approach a normal distribution as the numberof independent variables becomes large.
If T is an arbitrary function of the independent variables,
T = T(x), x ' *** * ) (2.3)2 n
then T takes the value T when each variable is at its mean value, x . Sincejthe concern is with what happens to the temperatur a when a variable departsfrom the mean by some arbitrary amount ax , the temperature can be approxi-jmated by a Taylor series expansion about T = T in which only linear termsare retained:
T-T 2 ax (2.4)ji=1 i
where is evaluated at x) = xj for j = 1, 2, . . . n.
Dropping the higher order terms results in negligible error provided departuresfrom the mean are relatively small, as is the case with most hot channel factorapplications.
Substituting Equation (2.4) in (2.2) results in
2y } (R )2 2(2.5)c o
T ax ij,) j
1630 Ol95
IARD-OtK)50 i- -
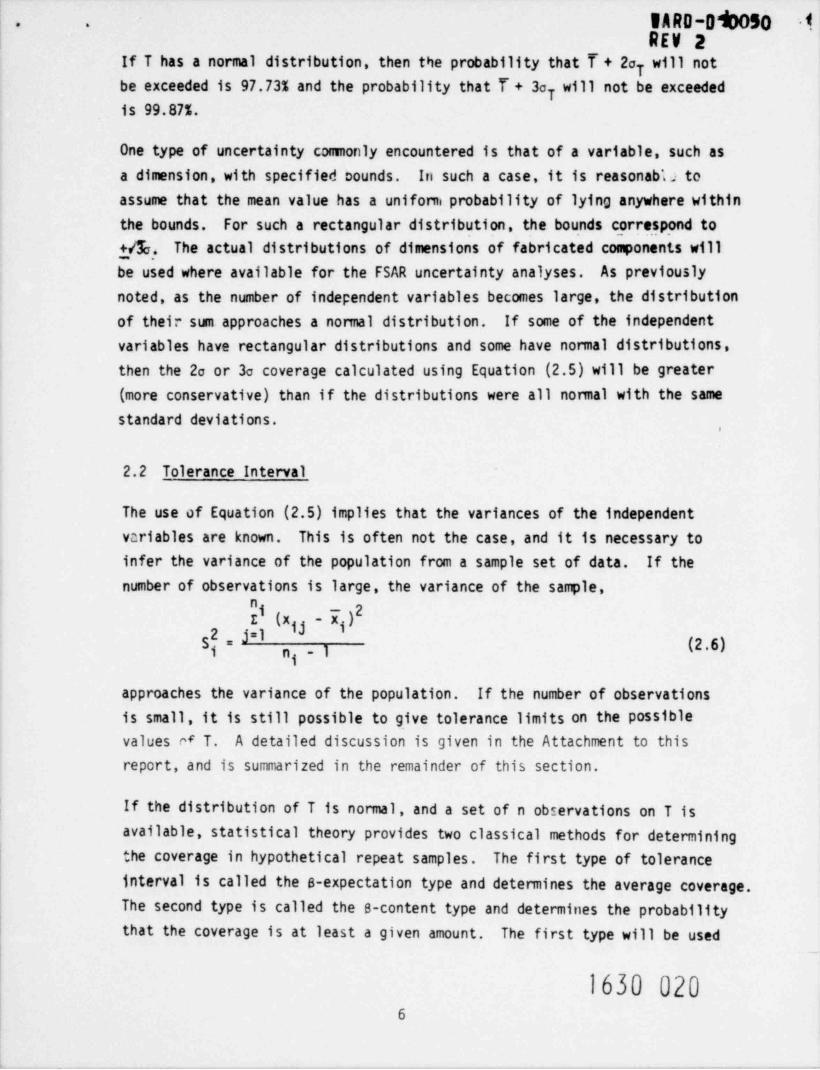
REV 2If T has a normal distribution, then the probability that T + 2a will not
Tbe exceeded is 97.73% and the probability that T + 3a will not be exceeded
Tis 99.87%.
One type of uncertainty comonly encountered is that of a variable, such asa dimension, with specified counds. In such a case, it is reasonab1; to
assume that the mean value has a unifom probability of lying anywhere withinthe bounds. For such a rectangular distribution, the bounds correspond to+fe . The actual distributions of dimensions of fabricated components willbe used where available for the FSAR uncertainty analyses. As previouslynoted, as the number of independent variables becomes large, the distributionof their sum approaches a normal distribution. If some of the independentvariables have rectangular distributions and some have normal distributions,then the 2a or 3a coverage calculated using Equation (2.5) will be greater
(more conservative) than if the distributions were all nomal with the samestandard deviations.
,
2.2 Tolerance Interval
The use of Equation (2.5) implies that the variances of the independentvariables are known. This is often not the case, and it is necessary toinfer the variance of the population from a sample set of data. If the
number of observations is large, the variance of the sample,
I (xjj-x)I j2s , p1 (2.6)n, - 1
approaches the variance of the population. If the number of observationsis small, it is still possible to give tolerance limits on the possiblevalues M T. A detailed discussion is given in the Attachment to thisreport, and is summarized in the remainder of this section.
If the distribution of T is normal, and a set of n observations on T isavailable, statistical theory provides two classical methods for determiningthe coverage in hypothetical repeat samples. The first type of toleranceinterval is called the 8-expectation type and determines the average coverage.The second type is called the 8-content type and determines the probabilitythat the coverage is at least a given amount. The first type will be used
_
1630 0206

IARO-B W 59'
- *
Rtt ~2for the hot channel factor analyses. This is felt to be more aporopriate, as thecoverage, 8, is more directly related to the coverage for the known variancecase. The upper tolera~nce limit is given by
T+tg (n - 1) /1 + 1/n S (2.7)
w!;&.~e tg (n - 1) is found from a table of the t-distribution. This is avalue which an n-1 degree of freedom t-variate will exceed with probability1-8
For the case where T is a linear function of x 's (Equation 2.1), with ajrandom sample of size n on each x , Satterthwaite's approximation is usedj jto determine the degrees of freedom to be associated with a linear combination
of variance estimates. The upper tolerance limit is given by
T+tg (v,) S, (2.8)
where S, = [ I Sj ) (nj +1)/n ] (2.9)ji=1
v,= (S,2)2f g " (,2 S,2(n,+1)/n,)2/v ] (2.10)ji=1
n ix, = ( r, j3)/n; (2.11)x]=1
S =( (x - x )2)/(n$ - 1) (2.12)j 43 jj=1
Using available t-tables, as a close approximation of the 2a and the 3elimits which are used for known o's, s = 0.975 is taken to correspond to"2c" and 8 = 0.999 is taken to correspond to "3a".
The interval computed by Equation (2.8) will have coverage 8 on the average.Another interpretation is that Equation (2.8) yields a 100s% confidence limitfor the next observation on T.
1630 021
7

1ARD-09050' '
REV 2 8
2.3 Overall Uncertainty
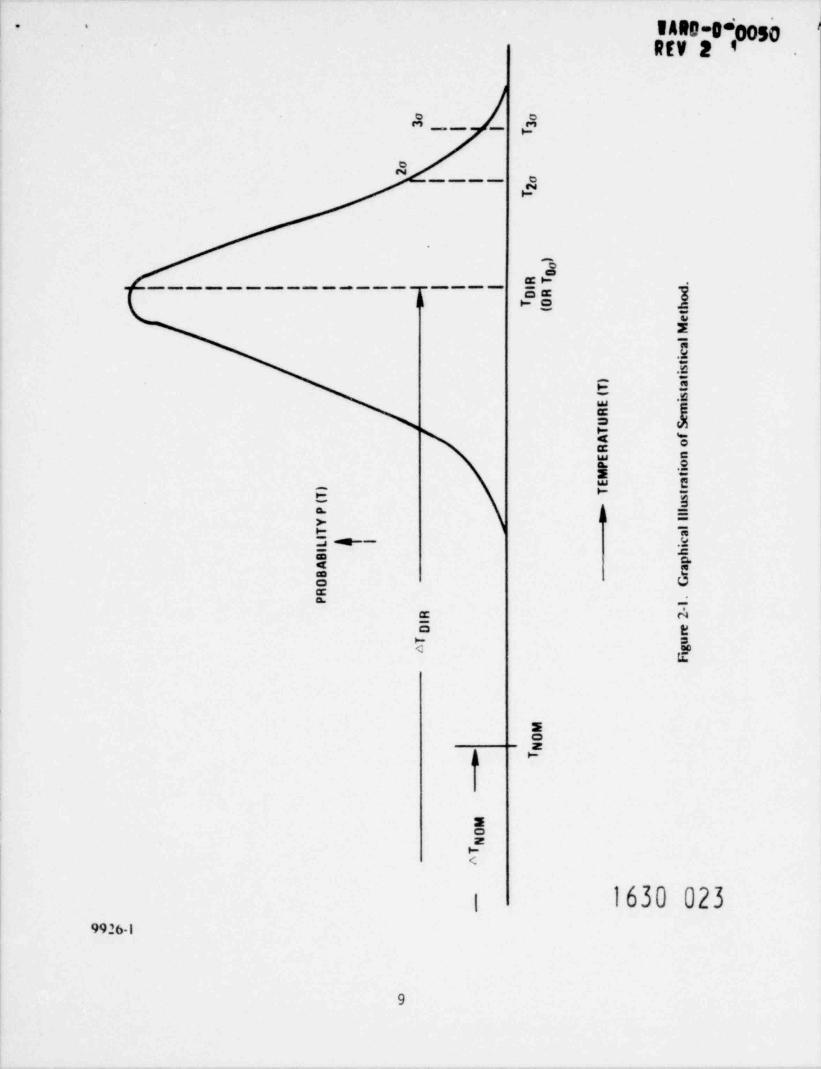
Calculation of fuel rod temperatures for the hot channel is shown in Figure
2.1. The nominal temperature difference AT is multiplied by the productnom
of the direct hot channel factors to give the temperature rise including non-statistical factors AT Using this value, the nominal temperature T
dir. nom
is increased to Tdir (or T0o). T represents the mean value about whichdir
the statistical uncertainties are applied. The nominal channel can be anychannel in the assembly, with the nominal channel coolant AT calculated using
subchannel analysis codes. In practice, the channel with the highest coolanttemperature is singled out for application of hot channel factors, thus calcu-lation of hot channel temperatures.
The hot channel factors used in the CRBRP analyses are shown in Tables 6.1A
through 6.10. Independent variables appear on separate horizontal lines. Hot
channel factors appearing on the same line are not independent, and theiroverall effect must be calculated directly before combining statistically withthe other factors. For example, in Table 6.lA, the statistical effect of pellet-cladding eccentricity affects both film and cladding AT's. Therefore, the
overall uncertainty in film and cladding AT's is calculated directly beforobeing combined statistically with the remaining statistical temperatureuncertainties. This will be illustrated by the sample cal.culation in thenext section.
It may be noted that a more conservative procedure was followed in the PSAR
analyses. In those analyses, the statistical uncertainties for a given com-ponent (coolant, film or cladding) were combined statistically and the resultingtemperature uncertainties for each component were added directly to provide theoverall temperature uncertainty. This " vertical-horizontal" procedure wasconservatively adopted for convenience in calculation and to provide additionalmargin in the early stages of design. However, the present procedure is moreexact, and is being used for future analyses.
Several approximations have been mentioned in the analytical procedure:a) the variables are assumed to have normal distributions when calculatingthe probability of exceeding the 2a or 3a value; and b) the temperature is
assumed to be a linear function of the variables.
1630 022
8
IARD-0*0050. .
REV 2 9
a__ - |
Aa____
-
^o
gi ,. _-------------------
a - e ,
t2_
e=s
O 2- .e
gm3 ga ser :2 =
_Uw
y -s-
aa =
-,-- ,,
z.- .2- -a w. -o Om- -
e ~o eE E
m
EoZ
Jk
5o2-<
i 1630 0239926-1
9
gy-pa >- -
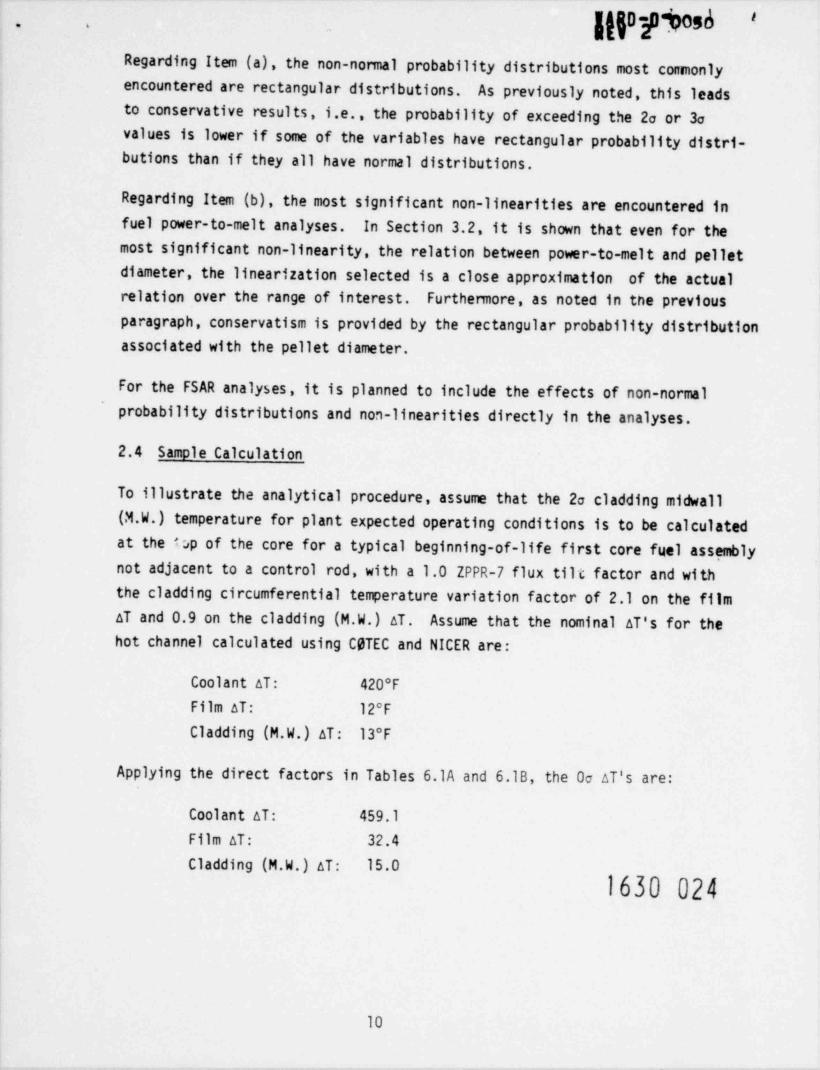
Regarding Item (a), the non-normal probability distributions most conmonlyencountered are rectangular distributions. As previously noted, this leadsto conservative results, i.e., the probability of exceeding the 2o or 3avalues is lower if some of the variables have rectangular probability distri-butions than if they all have normal distributions.
Regarding Item (b), the most significant non-linearities are encountered infuel power-to-melt analyses. In Section 3.2, it is shown that even for themost significant non-linearity, the relation between power-to-melt and pelletdiameter, the linearization selected is a close approximation of the actualrelation over the range of interest. Furthennore, as noted in the previousparagraph, conservatism is provided by the rectangular probability distributionassociated with the pellet diameter.
For the FSAR analyses, it is planned to include the effects of non-normal
probability distributions and non-linearities directly in the analyses.
2.4 Sample Calculation
To illustrate the analytical procedure, assume that the 2e cladding midwall(M.W.) temperature for plant expected operating conditions is to be calculated
at the 1:,p of the core for a typical beginning-of-life first core fuel assemblynot adjacent to a control rod, with a 1.0 ZPPR-7 flux tilt factor and withthe cladding circumferential temperature variation factor of 2.1 on the filmAT and 0.9 on the cladding (M.W.) AT. Assume that the nominal AT's for thehot channel calculated using COTEC and NICER are:
Coolant AT: 420 F
Film AT: 12 F
Cladding (M.W.)AT: 13 F
Applying the direct factors in Tables 6.lA and 6.18, the Oo AT's are:
Coolant AT: 459.1
Film AT: 32.4
Cladding (M.W.)AT: 15.0
1630 024
10

Irv a %n55''* '
ARD 8- '
Applying the statistical hot channel factors from Tables 6.lA and.6.lB to theseOo AT's, the temperature uncertainties shown in Table 2.1 are calculated.These uncertainties are added horizontally, and the resulting independenttemperature uncertainties in the right-hand column are combined statisticallyto give the overall 3a uncertainty of 87.3 F. Since the 2a uncertainty isrequired, 2/3 of this value is taken ( 58.2*F). Adding the AT's to the firstcore nominal plant expected inlet temperature of 704 F, results in the follow-ing maximum cladding midwall temperatures in this fuel assembly:
Nominal: 1149*F
Oo: 1210.5'F
2o: 1268.7'F
The above analysis is based on using the variance of a sangle as an estimateof the variance cf the total population. Applying the tolerance intervalmethod previously discussed to those uncertainties which are based directlyon the variance of small samples, and referring to the discussions in Section3.1 on the bases for the hot channel factors, the inlet flow maldistributionfactors of 1.059 on coolant aT and ' i on film AT and the coolant propertiesfactor of 1.017 on coolant AT may be broken down into subfactors (where n isthe number of data points):
HCF (3a) n
Coolant AT Film AT
#1.050 1.014 -
Flow Ma1 distribution 4 1.020 1.005 33
1.024 1.006 7
.009 -- -
C001 ant Properties1.01 5 5--
6
Repeating the analysis in Table 2.1 and applying Equations (2.9) through (2.12),
v = 13103e
3S = 87.6e
The effective three standard deviations, 3S,, is nearly identical with thatcal ulated in Table 2.1, the effective degrees of freedom, v , is extremely
elankt, and therefore the results are essentially the same as previouslyana.yzed.
H 1630 025

TABLE 2.1 -
SAMPLE CALCULATION OF FUEL ASSEMBLY R0D CLADDING MIDWALL TEMPERATURE
COMPONENT TEMPERATURES, *F
INLET COOLANT FILM CLADDINGT AT AT (M.W.)AT TOTAL
NOMINAL: 704 420 12 13 1149
Oo: 704 459.1 32.4 15.0 1210.5
3a TEMPERATURE UNCERTAINTIES, *F
Reactor AT and Inlet TemperatureVariation 62.2 62.2
Inlet Flow Ma1 distribution 27.1 0.5 27.6Loop Temperature Imbalance 7.4 7.4
% Wire Wrap Orientation 4.6 4.6Subchannel F1 Area 8.7 8.7Film Heat Transfer Coefficient 3.9 3.9Pellet-Cladding Eccentricity 5.6 2.6 8.2Cladding Thickness and Conductivity 0 0Coolant Properties 7.8 7.8Flow Distribution Calculational .
Uncertainty (Calibration) 26.6 0.2 26.8'
Experimental (Nuclear) 32.1 2.3 1.1 35.5Criticality 4.6 0.3 0.2 5.1Fissile Fuel Maldistribution 23.9 1.7 0.8 26.4
Overall 3a = [I(3a )2 1/2 = 87.33j
EE*=ms-
%u -oO 3
veo O'NCh
..
IARD-O*005n '- '
RW 2
3.0 FUEL ASSEMBLIES HOT SPOT FACTORS
3.1 Fuel Rod Cladding and Coolant Temperatures Hot Spot Factors for Fuel
Assemblies
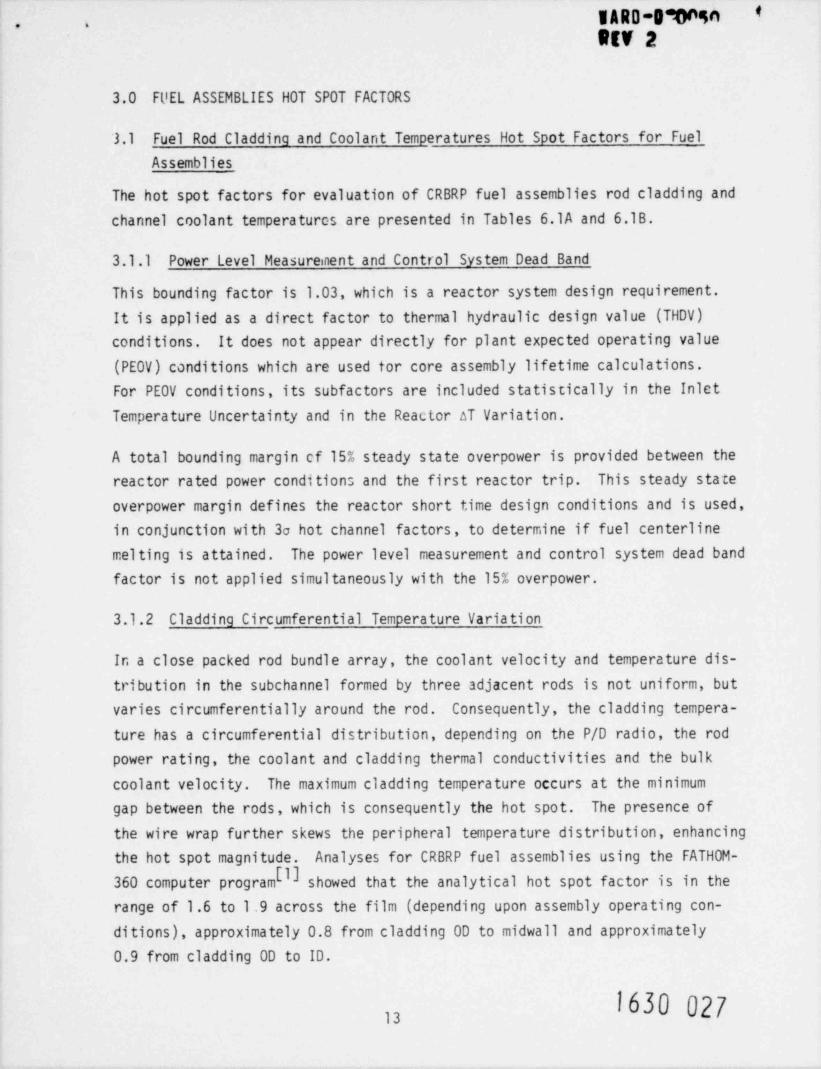
The hot spot factors for evaluation of CRBRP fuel assemblies rod cladding andchannel coolant temperatures are presented in Tables 6.l A and 6.18.
3.1.1 Power Level Measureinent and Control System Dead Band
This bounding factor is 1.03, which is a reactor system design requirement.It is applied as a direct factor to thermal hydraulic design value (THDV)condi tions . It does not appear directly for plant expected operating value(PE0V) conditions which are used for core assembly lifetime calculations.For PE0V conditions, its subfactors are included statistically in the InletTemperature Uncertainty and in the Reactor AT Variation.
A total bounding margin cf 15% steady state overpower is provided between thereactor rated power conditions and the first reactor trip. This steady stateoverpower margin defines the reactor short time design conditions and is used,in conjunction with 3a hot channel factors, to determine if fuel centerlinemelting is attained. The power level measurement and control system dead bandfactor is not applied simultaneously with the 15% overpower.
3.1.2 Cladding Circumferential Temperature Variation
In a close packed rod bundle array, the coolant velocity and temperature dis-tribution in the subchannel formed by three adjacent rods is not uniform, butvaries circumferentially around the rod. Consequently, the cladding tempera-ture has a circumferential distribution, depending on the P/D radio, the rodpower rating, the coolant and cladding thermal conductivities and the bulkcoolant velocity. The maximum cladding temperature occurs at the minimum
gap between the rods, which is consequently the hot spot. The presence ofthe wire wrap further skews the peripheral temperature distribution, enhancingthe hot spot magnitude. Analyses for CRBRP fuel assemblies using the FATHOM-
360 computer program showed that the analytical hot spot factor is in therange of 1.6 to 1.9 across the film (depending upon assembly operating con-ditions), approximately 0.8 from cladding OD to midwall and approximately0.9 from cladding OD to ID.
1630 02713

~~
WARD-D Ongn *- -
REV 2'
The analy as conservatively assumed uniform heat flux at the cladding innersurface and the coolant temperatures were determined by solving the turbulentmomentum and energy equations.
A detailed analysis is performed for the lifetime-limiting assembly in eachflow zone. In addition, a 20% uncertainty which is a bounding value basedon limiting case analyses is applied to the deviations from the nominal caseto conservatively account for uncertainties resulting from finite differencemodeling, flow distribution uncertainties and flow mixing uncertainties.
Hot spot temperatures have been experimentally measured at HEDL[2] and ORNL[3]
on wire-wrapped, electrically heated pins of nominal CRBRP dimensions. The
HEDL 7-pin tests indicate the ratio of hot spot / nominal film temperature dropis approximately 21*F/18 F. The ORNL 19-pin tests indicate the ratio isapproximately 27 F/17 F. Since these data result in film subfactors of about1.2 and 1.6, the previously mentioned application of 1.6 to 1.9 for thenominal film subfactor is conservative.
The effect of the cladding circumferential temperature variation and of thewire wrap is accounted for if calculating the local cladding temperature.For maximum fuel temperature calculations, however, an average cladding innerdiameter temperature is the most appropriate boundary condition; thus, thecladding circumferential variation factor in this case, is equal to 1 by
definition.
3.1.3 Reactor AT and Inlet Temperature Variation
Two sets of plant conditions are used in the thermal-hydraulic design, i.e. ,plant thermal-hydraulic design values (THDV) conditions and plant expectedoperating values (PE0V) conditions. The THDV conditions (730 F inlet /995 F
6outlet temperature; total reactor flow 41.446 x 10 lb/hr) are the ClinchRiver rated plant conditions and therefore no plant system uncertainties ap-ply to these values. They are used in: a) analyzing permanent componentswhich have the same 30 years lifetime as the plant's; b) transient and safetyanalyses, since they are more conservative than the plant expected conditions.This latter set represents the plant conditions at which the CRBRP is expectedto operate accounting for the operating conditions of the heat transfer systemssuch as pump characteristics, primary loop pressure drop uncertainties, fouling
1630 028y

"IARD-0-0050- *
REV 3
and plugging of heat exchangers, etc. Expected operating values for theprimary helt iransport system principal parameters (inlet, outlet tempera-ture and AT) are thus evaluated, together with the associated uncertainties.The results of this study, which comprised a Monte Carlo type analysis, arereported in Table 3.1. The study included: 1) the consideration of the pro-gressive fouling of the heat exchangers during the plant 30 years lifetime,which affects the predicted values of the plant operating conditions, and2) a comprehensive tccounting of .'1 uncertainties affecting plant operation.Empirical or bounding values were used for the effect of fouling and for theuncertainties affecting plant operation. Plant expected operating conditionsare adopted in core thermofluids analyses of replaceable components, such asthe core assemblies, chiefly in determining the fuel rod parameters (claddingtemperature, fission gas pressure) which are the basis for evaluating thestructural behavior and for assessing whether lifetime /burnup objectivesare actually met.
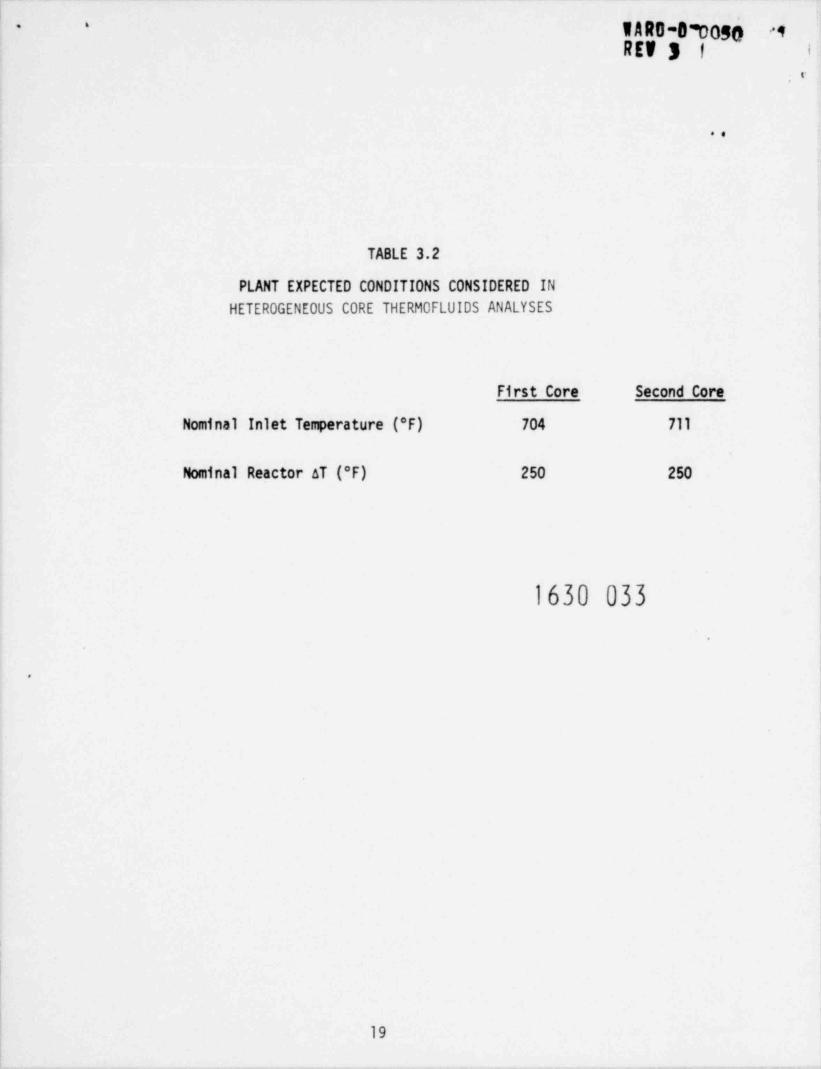
Plant expected operating conditions adopted in the first and second corethermal-hydraulic analyses are reported in Table 3.2. Following is a brief
discussion of the rationale in determining the values reported in Table 3.2from the ones in Table 3.1. PE0V conditions will be updated for the FSAR.
First, the mean values of Table 3.1 are chosen as the nominal values of
Table 3.2, thus including the bias factor directly into the nominal values.Since the most critical times for core assemblies is at the end-of-life, when
the cladding strain ard damage function are maximum, first core values havebeen selected as corresponding to two-year fouling and second core valuesas corresponding to four-year fouling conditions. Due to the fact thatfour-year fouling conditions were not evaluated, it was conservatively as-sumed that the same difference in plant parameters between year two and yearzero rep ts between year four and year two. Again, the selected approachis conservative for two reasons: 1) plant conditions have been consideredconstant over the two years span and equal to the worst end-of-span con-ditions, thus neglecting the more favorable conditions which exist through-out the core lifetime; and 2) the effect of fouling is not linear withtime, but it is rather pronounced at the beginning and then tapers offduring the plant lifetime, as can be seen by comparing plant parameters in
1630 029

IARD-Dhici i4-
REV 2
Table 3.1 for 0, 2, and 30 years. Thus, the assumption that the same dete-
rioration of plant conditions which occurs in the first two years (firstcore) also occurs during the third and fourth year (second core) is veryconservative.
If primary cold leg temperature (TRi) and primary AT (AT ) were statisticallyR
independent, then the primary hot leg temperature (TRo) variance would berelated to the other variances by
2 2 (3.1)cT " "T 2 + "AT
Ro Ri R
Since o is smaller than the value given by Equation (3.1), .it is e,HentTg
and AT , i.e., higher-than-that there is a negative correlation between TRi R
average values of T tend to be associatee with lower-than-average valuesRi
of AT . The more general form of Equation (3.1) which covers this case isR
+ + ( }"T T AT TRi, ATRRo Ri R
where o is the covariance between T and aT . From the two-yearTg , ATR Ri R
fouling data in Table 3.1,
oT= 169
h
oT = 121Ri
c " I44aTp
from which
2"TRi, ATR" "'
The coolant temperature rise in a given fuel asserrbly channel (AT ) is pro-c
portional to ATR
AT (3.3)aT =c R
From the definitions of variance and covariance,
,AT 2 . c ,AT 1630 0302 2
c R m

IARD-D"0050 'M- '
"TR1, AT TRi, ATRc
Therefore, the variance in T is given byc
"T T AT TRi, ATc R1 c c
+C, 2 + 2C (3.5)2"T Tg , ATg c
From the two-year fouling data in Table 3.1,
2oT 144 C - 96 C + 121 (3.6)
c
Also,
AT = 250R
so that Equation (3.6) may be written as
0.002304 AT - 0.384 aT + 121 (3.7)"T c cc
The o's in Table 3.1 show little variation with fouling and therefore Equation
(3.7) wil' be used for the second core as well as the first core.
Typical HCF values on AT are tabulated below:c
"CY (E"}AT "Tec
250 13 1.156
300 14.6 1.145
400 18.3 1.137
500 22.5 1.135
1630 031
17

,
e
TABLE 3.1
PLANT EXPECTED OPERATING CONDITIONS AND UNCERTAINTIES
Clean & Unplugged Heat Fouled & Plugged HeatExchangers Exchangers
Parameter (New Plant) Estimated (2 Year Fouling) (30 Year Fouling)
Nominal Mean a T Nominal Nan a T Nominal &an a T97.7 97.7 97.7_
Primary Hot Leg 943 946 13 968 950 954 13 976 960 964 13 987
Temperature, TRo ( F)
Primary Cold leg 698 697 13 722 705 704 11 725 714 714 12 736
Temperature, TRi ( F)
Primary AT, ATR ( F) 245 249 12 273 245 250 12 274 246 250 12 275
Power (MWt) 975 975 1004 975 975 1004 975 975 1004
NOTE: Design and control uncertainties are included
The T values are those that are not exceeded with 97.7% probability. If the distribution97.7
were normal these would equal the mean plus 2a.
e se~
& see >U 4 as
19 Y==
auN
..
WARD-07050 '4- '
REV 3 f.'
,e
..
TABLE 3.2
PLANT EXPECTED CONDITIONS CONSIDERED IN
HETEROGENEOUS CORE THERM 0 FLUIDS ANALYSES
First Core Second Core
Nominal Inlet Temperature (*F) 704 711
Nominal Reactor AT (*F) 250 250
1630 033
.
19

IARD-OiO56 '- '
StV 2
3 .1. 4 Loop Temperature Imbalance
The maximum cold leg loop-to-loop temperature imbalance is 34*F, whicha plant control system design requirement.
Loop imbalance mixing tests were performed in the Inlet Plenum Feature Model
at HEDL .
A test run consisted of injecting an electrolyte in a downcomer and measuringthe steady state concentration in the inlet modules. Individual loop in-
jection permitted the assessment of how that loop affected mixing in the 61inlet modules. From these data, inlet module fluid temperatures due to loop
temperatures imbalances were calculated. The results are shown in Figures
3.1 through 3.3.
A Monte Carlo type of analysis was performed in which the temperature im-balances in two of the loops were chosen at random (all values equally pro-bable) and the third one adjusted so that their sum was zero, subject to therestraint of a maximum difference of 34 F between loops. The resulting inlet
module 2o temperature uncertainties are shown in Figure 3.4. The maximum 2a
value for ali inlet modules is 4.6 F. The uncertainty in that value because
of the experimental error in the measured loop mixing constants is +0.3 Fgiving an overall maximum 2a bounding uncertainty of 4.9 F on inlet tempera-ture. Even though the analysis shows that this applies to only the worstmodule (7 core assemblies), it has conservatively been applied to allassemblies.
1630 034
20

*-WARD-D-0050REV 2
PERFECT MIXING RATIO = 1/3
00
300 INLETDOWNCOMER 3
#"'2700 IN LET00WNCOMER1 E22 .
01 33
11.07
00A2700
Rec
15G3 INLET00WNCOMER 2
1800PL AN VIEW
Figure 3-1. Desiation in inlet Slodule Steady State Mising Ratio from Perfect Mixing for 3Loop 100'; Flow and injection in Loop ::1.
9926-2 1630 03521
WARD-D-0050. *
REV 2
PERFECT MIXING RATIO = 1/3
00
300 INLETDOWNCOMER 3
El
E24 .
E2a E22700 INLET . oc 7
DOWNCOMER1 E22 . D1 oo
03..t o
0 0C110 0C2 0 0ESCIO B2 E6
2100$ M .io .04 . iy 900
@%@,e@ oC6 E8
OE76C7 D7
.11 011 .04 08
o ODIO e OE10e CE12 \
| 1500 INLET00WNCOMER 21800
PL AN VIEW
Figure 3-2. Desiation in inlet \lodule Stead.s State \lising Ratio from Perfect \lising for3 Loop 100 Flow and injection in Loop = 2.
9926-3
1630 03622

WARD-D-0050- 6
REV 2
PERFECT MIXING RATIO = 1/3
00
300 INLET00WNCOMER 3
**' "2700 INLETDOWNCOMER1 E22 13 D1 .10
.13.17
002700 s
cc e o e.11
1500 IN LET00WNCOMER 21800
PLAN VIEW
Figure 3-3. Deviation in inlet N1odule Steady State .\lising Ratio from Perfect Mising for3 Loop 100'; Flow and injection in 1;>op =3.
99264
1630 03723

- *
IARD-91050'
REV 2
2a lNLET MODULE TEMPERATURE UNCERTAINTY IN OF
00
300 INLET00WNCOMER3
41E24
"' ''' "NP lb El00WF'_MER1 4.4 3.3
W"g@ e@
A g692700
El.||:s5c81500 INLETDOWNCOMER 2
180aPLAN VIEW
Figure 3-4. 2a inlet Module Temperature Uncertainty Based on a Loop TemperatureImbalance of up to 340F,for 3-Loop Operation.
99265 1630 03824
EARD-D 0050. . -
REV 2 '
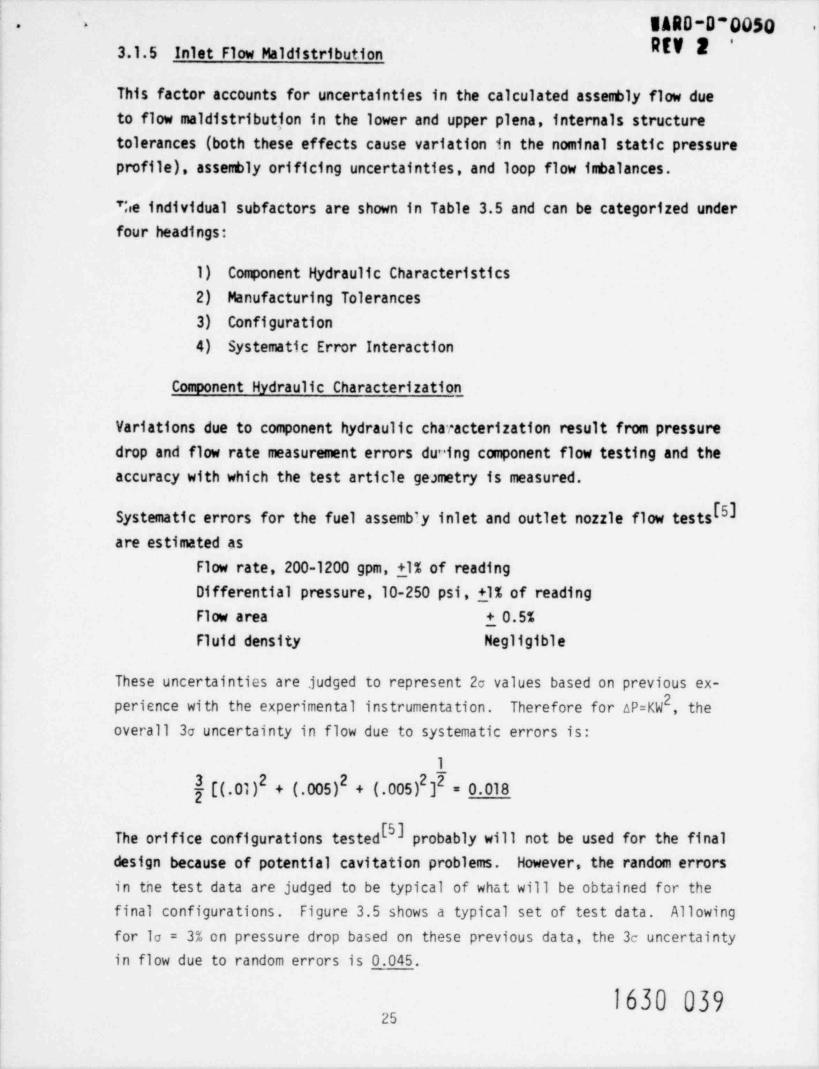
3.1.5 Inlet Flow Ma1 distribution
This factor accounts for uncertainties in the calculated assembly flow dueto flow maldistributjon in the lower and upper plena, internals structuretolerances (both these effects cause variation in the nominal static pressureprofile), assembly orificing uncertainties, and loop flow imbalances.
%e individual subfactors are shown in Table 3.5 and can be categorized underfour headings:
1) Component Hydraulic Characteristics2) Manufacturing Tolerances3) Configuration4) Systematic Error Interaction
Component Hydraulic Characterization
Variations due to component hydraulic characterization result from pressuredrop and flow rate measurement errors du"ing component flow testing and theaccuracy with which the test article geametry is measured.
Systematic errors for the fuel assembly inlet and outlet nozzle flow tests [5]
are estimated as
Flow rate, 200-1200 gpm,11% of readingDifferential pressure,10-250 psi,11% of readingFlow area 1 0.5%Fluid density Negligible
These uncertainties are judged to represent 2a values based on previous ex-2perience with the experimental instrumentation. Therefore for AP=KW , the
overall 3a uncertainty in flow due to systematic errors is:
1
f[(.01) + (.005)2 + (.005)2 2 = 0.0183
The orifice configurations tested [5] probably will not be used for the finaldesign because of potential cavitation problems. However, the random errors
in tne test data are judged to be typical of what will be obtained for the
final configurations. Figure 3.5 shows a typical set of test data. Allowingfor lo = 3% on pressure drop based on these previous data, the 3c uncertaintyin flow due to random errors is 0.045.
1630 03925

1ARD-O"0050 1' '
#fv 2
L180 CURVE FIT K = mRe170
HOLE160 SIZE m 1 % STO. E RROR
-
50 -
, , , , , , .,,,37, , ,,4 3 |140 E 199.65 -0.0587 1.160 |-
F 105.07 +0.0128 0.884 |130 G 219.15 -0.0186 0.590 |
125 I-
i120
|-
|115
|3
- 5-5 5 s-3333 G,
xI
'!O 2 O i A*A4M '
80 -I
-_ F
70 -
60 -
-e.,_, ., ,08 9 - - Eg
v - D40 -
30 -
25 -
20 -||i
15 -
| DESIGN ReI
I' ' ' I I I I '' '' ' ' ' ' ' '''10
105 106 107
INLET REYNOLDS NO.
Figure 3-5. Fuel Assembly inlet Noule Flow Resistance Versus Reynolds Number:Orifice Group No. S.
D:M,
1630 040
26
IARD-0 0050. -
REV 3 f
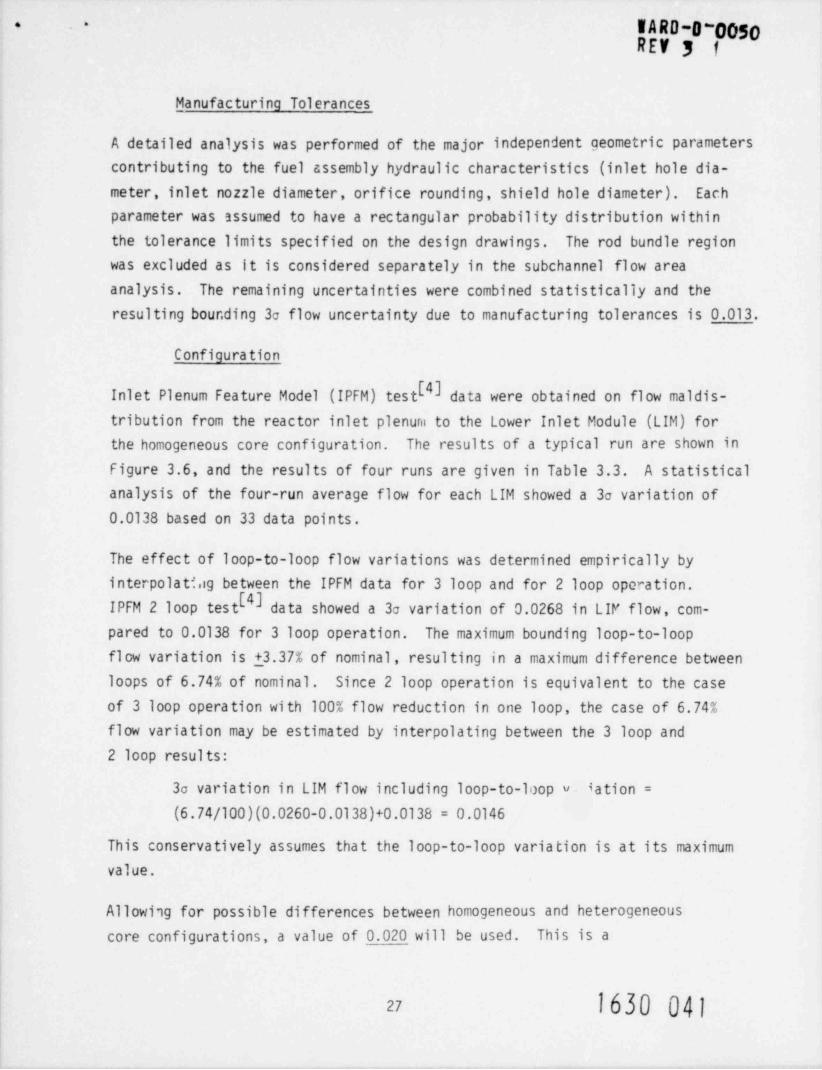
Manufacturing Tolerances
A detailed analysis was performed of the major independent geometric parameterscontributing to the fuel assembly hydraulic characteristics (inlet hole dia-meter, inlet nozzle diameter, orifice rounding, shield hole diameter). Each
parameter was assumed to have a rectangular probability distribution withinthe tolerance limits specified on the design drawings. The rod bundle regionwas excluded as it is considered separately in the subchannel flow areaanalysis. The remaining uncertainties were combined statistically and theresulting bour. ding 3a flow uncertainty due to manufacturing tolerances is 0.013.
Configura tion
E43Inlet Plenum Feature Model (IPFM) test data were obtained on flow maldis-tribution from the reactor inlet plenuni to the Lower Inlet Module (LIM) forthe homogeneous core configuration. The results of a typical run are shown in
Figure 3.6, and the results of four runs are given in Table 3.3. A statistical
analysis of the four-run average flow for each LIM showed a 3a variation of0.0138 based on 33 data points.
The effect of loop-to-loop flow variations was determined empirically byinterpolati.ig between the IPFM data for 3 loop and for 2 loop opo ation.
b43IPFM 2 loop test data showed a 3a variation of 0.0268 in LIP flow, com-pared to 0.0138 for 3 loop operation. The maximum bounding loop-to-loopflow variation is +3.37% of nominal, resulting in a maximum difference betweenloops of 6.74% of nominal. Since 2 loop operation is equivalent to the caseof 3 loop operation with 100% flow reduction in one loop, the case of 6.74%flow variation may be estimated by interpolating between the 3 loop and2 loop results:
3a variation in LIM flow including loop-to-loop u- iation =(6.74/100)(0.0260-0.0138)+0.0138 = 0.0146
This conservatively assumes that the loop-to-loop variation is at its maximumvalue.
Allowing for possible differences between homogeneous and heterogeneous
core configurations, a value of 0.020 will be used. This is a
1630 04127

.
.
'& OW ER3 A KET M DULE LOW
g@@e g@'@g (O @ @@@
e p):,e@,e eeOE191.08 to a2 Es 5 INDIVIDUAL FUEL ASSEMBLIE8 22.73
$ 2700 INLET Q [ o 21 os i ss / 900 2 INDIVIDUAL BLANKET ASSEMBLIES 5.96s s2o 20'D B5 * C4DOWN- E18
COMER 1 0 83 0.28 0.12
@g@@@@ ,[@@@@g@@gg= e e@@
E13
1500 INLET A-1 DET All 2
#"CD 1808 DOWNCOMER2 g:PLAN VIEW 7 INDIVIDUAL FUEL ASSEMBLIES 22.61 C
--g#
Figure 3-6. Core Flow Distribution Map, Run AS.2,103.M.3-Loop flow,1400F. o
.a

. -
IARD-0 f50REV 2( TABLE 3.3
RESULTS OF FOUR IPFM FLOW
DISTRIBUTION TESTS AT $100% FLOW, 3 LOOPS
FLOW DEVIATION FROM AVERAGE, %
LIM RUN 1 RUN 2 RUN 3 RUN 4
B1 .00 .20 .21 .1966 .53 .07 .15 .14B5 .28 .05 .03 .07B4 .75 .46 .59 .5383 .20 .26 .25 .2082 .21 .15 .09 .12C1 -1.05 -1.56 .99 .96C12 .40 .36 .31 .12C11 .71 .81 .74 .78C10 .52 .34 .33 .26C9 .72 .80 .66 .68
O C8 .88 .55 .46 .61C7 .79 .33 .60 .44C6 .39 .20 .20 .36C5 .66 .37 .34 -v37C4 .12 .40 .28 .34C3 .62 .09 .16 .01C2 .18 .10 .07 .0401 .66 .39 .42 .43016 .11 .14 .02 .14D15 .24 .17 .07 .17D14 .01 .02 .20 .11D13 -1.50 .97 -1.03 -1.26D11 .20 .16 .05 .0909 .60 .59 .20 .50DB .31 .14 .17 .2507 .59 .83 .85 .75D6 .05 .35 .03 .5005 .20 .06 .05 .01D4 .08 .11 .07 .16D3 .29 .01 .01 .00D2 .12 .27 .24 .29D10 .26 .02 .23 .04
.r
1630 043
') G
- '
WARD-O-0056 1
arv ar
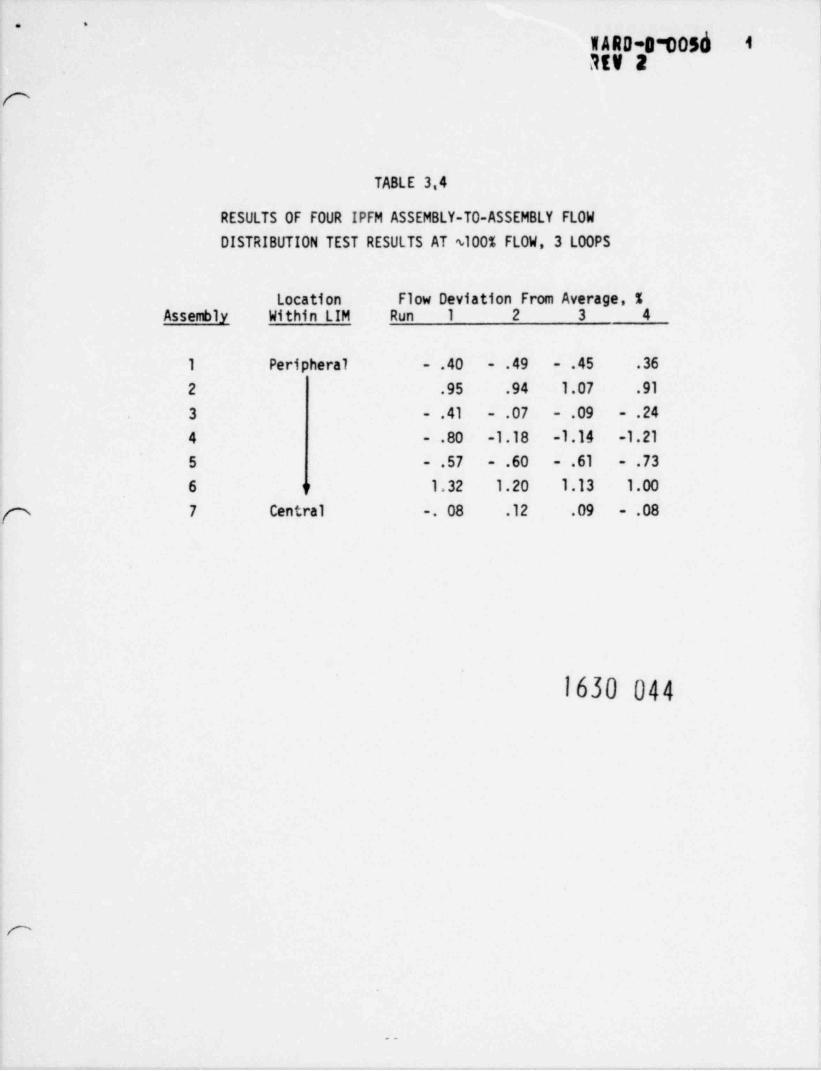
TABLE 3,4
RESULTS OF FOUR IPFM ASSEMBLY-TO-ASSEMBLY FLOW
DISTRIBUTION TEST RESULTS AT s100% FLOW, 3 LOOPS
Location Flow Deviation From Average, %Assembly Within LIM Run 1 2 3 4
1 Peripheral .40 .49 .45 .36
2 .95 .94 1.07 .91
3 .41 .07 .09 .24
4 .80 -1.18 -1.14 -1.21
5 .57 .60 .61 .73
6 o 1.32 1.20 1.13 1.00
p 7 Central . 08 .12 .09 .08
1630 044
c
--
. .
W A RD-D* 005'OREV 3 I
conservative estimate empirically based upon the observed differences betweenfuel assembly and radial blanket assembly (Section 4.1.2) LIM flow variationsin the IPFM test.
Assembly-to-assembly variation was determined by measuring the flow variationfor the seven assemblies within a LIM. The data for four runs are given in
Table 3.4.
The average peripheral assembly flow rate was nearly identical to the centralassembly flow rate. The four-run average flow for each assembly showed a3a variation of 0.0242 based on 7 data points. This value includes randomvariations among similarly located assemblies as well as any " side effects".
Systematic Error Interaction
This factor accounts for systematic errors in the calibration of one corecomponent affecting the flow to another core component. For example, ifsystematic errors cause the blanket assemblies to be overcooled they willresult in the fuel assemblies being undercooled, and vice versa. From Table
4.2, blanket assemblies can have 1.8% flow increase (3o) due to systematicerrors. An analysis of the reactor flow distribution with this change inthe flow impedance of all blanket assemblies resulted in a decrease in fuelassembly flow by a fz.ctor of 1.002. Thus the 3a uncertainty in fuel assemblyflow due to systematic error interaction is calculated to be 0.002.
Overall
The Inlet Flow Maldistribution 3a subfactors are listed in Table 3.5. The
overall factor calculated as the root-mean-square of the subfactors(F = 1 + (E(F -1)2)V2) is al:;o .shown. The effect of the small number of
9
data points for several subfactors on the overall tolerance interval isnegligible as shown in Section 2.4.
An additional direct bias of 1.02 is applied based on engineering judgementto blanket any additional t.ncertainties which may be uncovered in the hetero-geneous core design. Additional data from the fuel assembly flow and vibration
test and from the inlet nozzle flow test (see Table 6.11) will be utilized toupdate these uncertainties for the FSAR.
1630 0453,

. .. .
W ARD-09005kIII '2 f
n
TABLE 3.5
FUEL ASSEMBLY INLET FLOW MALDISTRIBUTION SUBFACTORS (3a)
Hydraulic CharacteristicsSystematic 1.018
Random 1.045
Manufacturing Tolerances 1.013
Configuration
Among LIM's 1.02 (33)*Among Assemblies 1.024 (7)*
Systematic Error Interaction 1.002
Overall (3c) 1.059_
p. * Number of data points shown in parentheses
1630 046
c
32

WARD-0-055h' ' -
REV 2 i
3.1.6 Flow Distribution Calculational Uncertainty
The coolant flow and temperature distribution within the various subchannelsof a wire wrapped assembly is calculated by subchannel analysis codes, e.g.,COTEC, COBRA and THI-30.
Empirical factors in the CSTEC code to model the effects of turbulent mixing,pumping (displacement of coolant by wire wrap), swecping (forced flow followingthe wire wrap) in the interior channels and swirl in the edge channels areselected by calibrat'on of the code against available experimental data. Anextensive comparison of the COTEC code with experimental data from ORNL (19 rodbundle FFM tests)[6] ANL (91 rod bundle mixing tests)[7,8], HEDL (217 rodbundle mixing tests) , ARD (11:1 scale section of a 217 pin wire wrapped rodbundle air flow test)[10] , and J0Y0 (experimental study on coolant mixing effectin J0YO 19 rod blanket assembly) was performed.
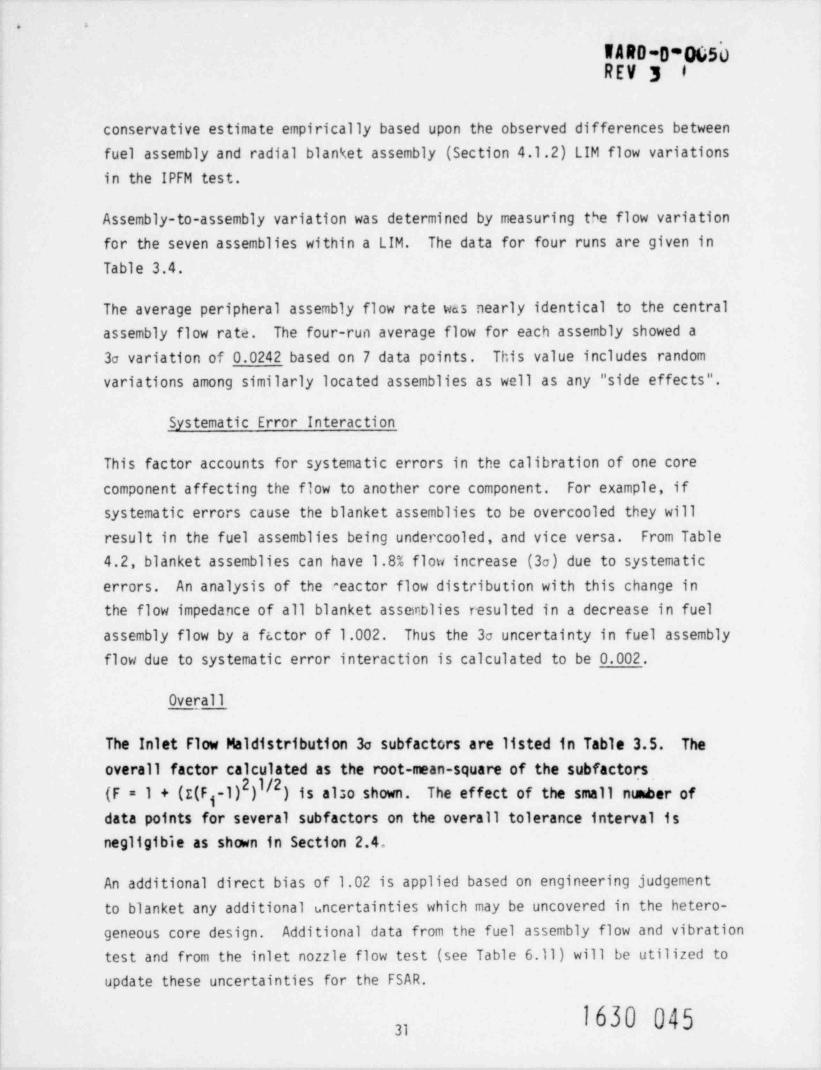
The 11:1 scale tests 10] were selected as providing the most detailed data forthe calibration of the COTEC factors for pumping, sweepin and swirl. Thesefactors were then used in COTEC analyses of the HEDL data 93 where the turbulentmixing factor, which has a secondary effect, was adjusted to provide the bestfit. Approximately 3000 data points from the HEDL tests were compared with theCOTEC predictions using the final calibration. Typical results are shown inFigures 3.7, 3.8 and 3.9. Figure 3.7 shows experimental data (average of fourruns) 12 inches downstream of the injection plane along the row of channels withthe highest concentrations. The data for all of the channels at the 12-inchlevel were used as input for a CBTEC analysis, and the results at 24 inches and36 inches are compared to the experimental data *n Figures 3.8 and 3.9.
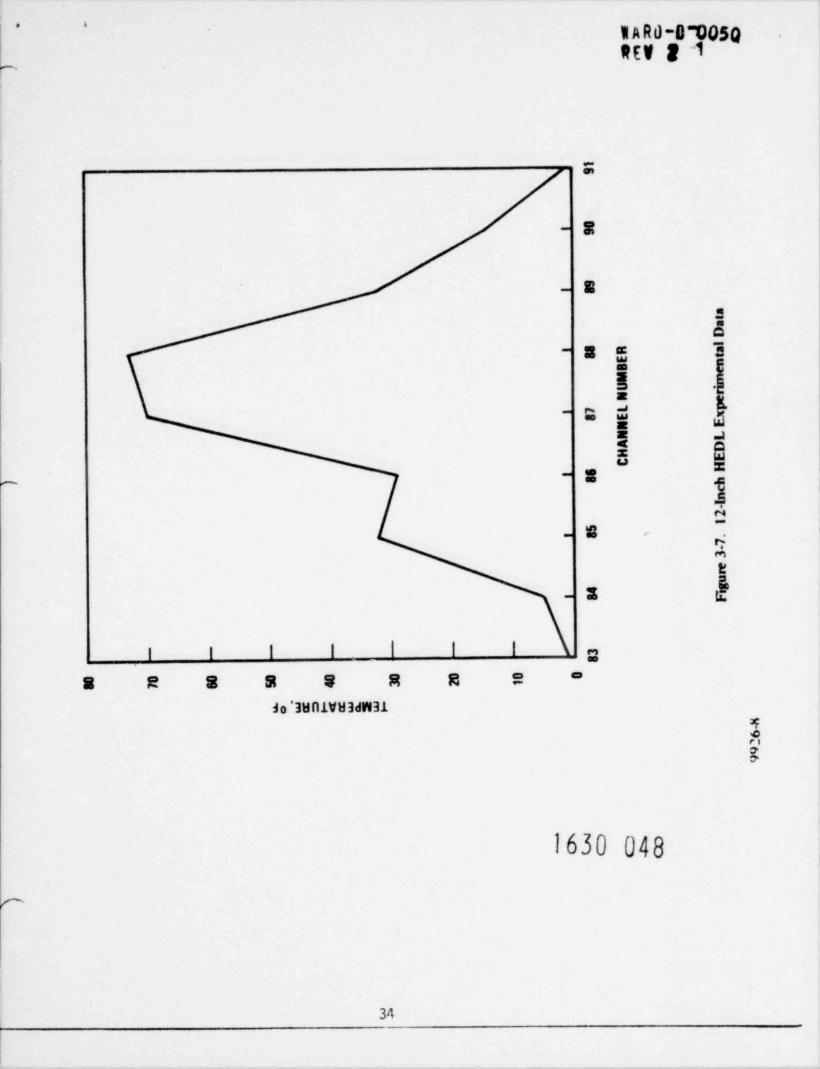
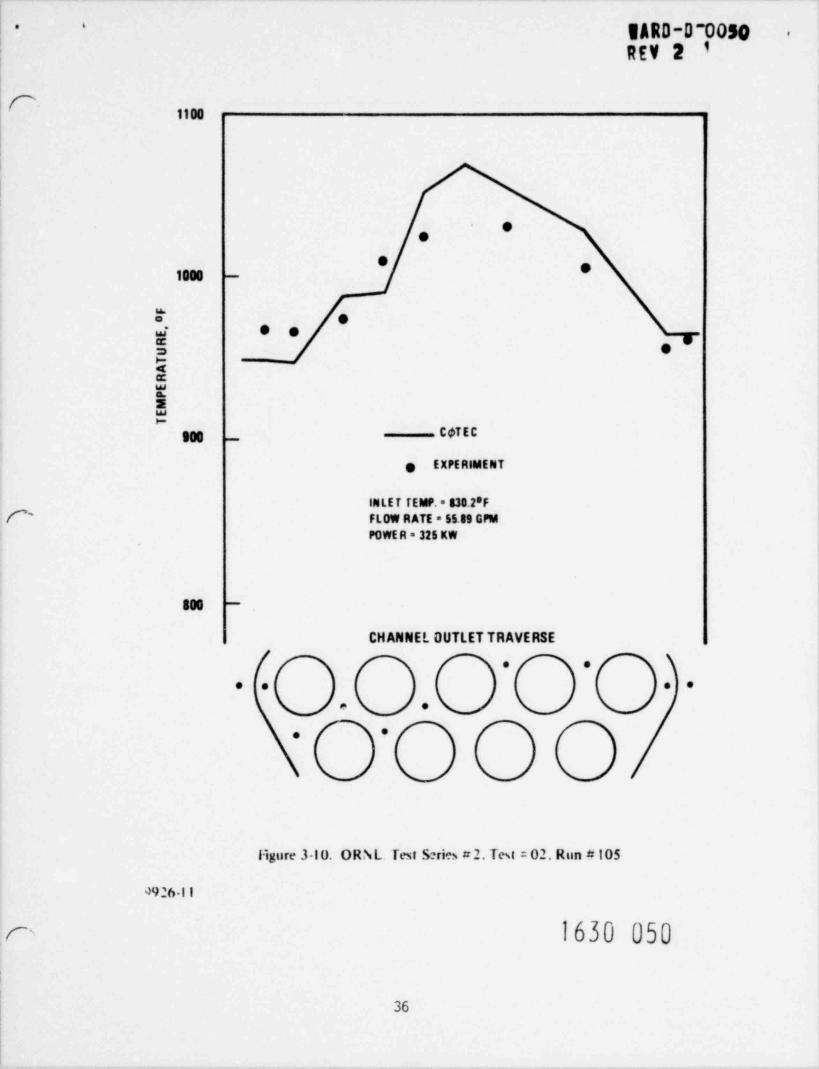
CSTEC predictions are also compared with the ORNL dataE in Figures 3.10through 3.13 for a heated 19-rod bundle in sodium. The present COTEC calibra-tion conservatively overpredicts the peak temperatures in the ORNL tests.
Regarding the statistical calibration uncertainty, the calibration analysistreats the differences between the COTEC calculated temperatures and themeasured or experimentally determined temperatures as a random
33 1630 047
. >
1AR0-0 105QREV 2 "1
r.
Si
E-
E-
5c
= 3aE-
6
[ 4
}= e-
= mE S" =._
" t-
4c
E - .-
mEife3 u:-
I I I I I 2s R S S 8 8 2 8
do '3Hil1VH3dW31
ya
1630 048
c
34

, ,
YARD-85005bREV 2
~
50
,r. CDTEC INPUT AT 12 INCHES
N40 / \ O-
\ _// / \/ \#/ \
i 30 -
/s\E / Nj
COTEC RESULTS sg
20 /-
) HEDL EXPERIMENTAL DATA \-j \
10 //
./ \'; i | | 1 1 I
O
83 84 85 86 87 88 89 90 91
CHANNEL NUMBER
Figure 3-8. Comparison Between COTEC Results and HEDL Data at 24 inches
D40
COTEC INPUT AT 12 INCHESHEOL
E XPE RIMENTAL g# g3g DATA
/ \_
$ COTEC RESULTS
d- \g
*%5m /< \/y '%J \
\
'10 - ,j
,
i | | | l i IO
g3 84 85 86 87 88 89 90 91
CHANNEL NUMBER
Figure 3-9. Comparison Between COTEC Results and HEDL Data at 36 inches
9426 9.10
1630 049
35
- 'IARD-D 0050 -
REV 2 1
1100
*e
'1000
* ee e-y
*B2e!.-
900 C$TEC-
g EXPERIMENT
INLEi TEMP. = 830.2'FI' FLOW RATE = 55 89 GPM
POWER = 325 KW
800 -
CHANNEL DUTLET TRAVERSE
(O )- -
. . \ , . .
v- .
..
\ | | |
Hgure 3-10. ORNL. Test Series #2. Test = 02. Run * 105
49261I
c' 1630 050
36

' '
1ARO-U W 50 i
REV 2 '1'
r1000
8INLET TEMP. = 628.8 F
FLOW R ATE = 54.48 GPM
POWER = 164 KW
900
Wg CCTEC
mat . EXPERIMENT
IW
800 -
C
*.
* e
./.- -
. . .
CH ANNEL OUTLET TRAVERSE |
( )-
. ... ..
. .
*.
|
Figure 3-11. ORNL. Test Series = 2 Tesi = 02 Riin e 109
9926 12
g.1630 051
37

i
IARD-8-003Q. t
REV 2 '
RJO ,.
CFLOW RATE * 54.58 GPM
INLET TEMP. = 5968F
POWER = 163 KW
CcTEC
e EXPERIMENT800 -
?afE&
E*
700 e-
e e
. . ./e -
ee
r..
600
CH ANNEL OUTLET TRAVERSE
'
%. (.- -
. .
e e
*e
Figure 3-12. ORNL. Test Series #2. Test #3, Run # 201
99 6.l.1
1630 052c
38
WARD-O-0050 i''
REV 2 1
n1100
INLET TEMP. = 623 4'F
FLOW R ATE: = 5.15 GPM
POWEH = 59 KW
,
1000
5a5
*g .
5&N
egg ae e ,6 e
CCTEC
e EXPEtilME N T
800 -
CH ANNEL OUTLET TRAVERSE
( %- -
., . . ,.
. .
..
ligur. .1-1.1 ORNt I e-t Series 2 2. Test =04. Rim 205
'H2614
F 1630 053
39
IARD-lp005b i--
REV 2 I
r variable, i.e., analogous to the displacement of a particle from its initialposition while undergoing a one-dimensional random walk. The absence of perfectagreement between CDTEC and experimental data is expected and it must be attri-buted to the inability of the COTEC mixing model to completely represent theaxial and transverse flows in a wire wrapped bundle. Thus, it can be deduced
that the local transverse coolant temperature distribution directly affects thedifferential increment of temperature calculational uncertainty, while a flattemperature profile would not contribute to a temperature calculation uncertainty.Since the average coolant temperature gradient in the assembly, (T -T
min)b23is
maxa coarse measure of the coolant temperature profile, the following equationrepresents the uncertainty associated with the use of COTEC:
U26T ,(x) = C) /* (Tmax(t) - Tmin(C)) dc (3.8)j
6T ,(x) = temperature variation (uncertainty at x)where j
Tmax(C) = maximum coolant temperature at elevation x = cn
Tmin(() = minimum coolant temperature at elevation x = c
x = elevation-IC = experimentally determined coefficient = 0.4376 x 10~4 in
.
The coefficient C was determined using an earlier COTEC calibration which didnot compare as well with the data as the present calibration, and is thereforeconservative.
The integrand depends upon the transverse gradient of coolant temperature withina one-sixth sector of the wire wrapped 217 pin bundle and will vary from assemblyto assembly with flow rate and power shape. Thus, to obtain an uncertaintyinterval for the coolant temperature and concomitant hot channel factor repre-sentative of all subassemblies of a specified type (e.g., fuel or blanket), itwas necessary to envelope the uncertainties by estimating the assembly flowrequirement and selecting the most critical assemblies (i.e., those with greatestpower skew and with largest total power) for analysis. COTEC calculations were
perfomed for these selected assemblies to compute the estimated uncertaintyintervals for each critical assembly.
40 1630 054

IARD-D-005Q* * '
REV 2
Numerical integration with Euler's method using a 2-inch step size was used tocalculate the temperature uncertainties. The temperature uncertainty increaseswith elevatior; and the uncertainty at the top of the core was used to calculatethe hot channel factor. This is the approximate location of the cladding peaktemperature elevation. The largest temperature uncertainty and hot channelfactor for the fuel assemblies occurs in the peak skew fuel assembly. Theanalytically derived statistical hot channel factor is 1.054 (3a). Adoptionof the maximum calculated value of the hot channel factor as an envelope forall fuel assemblies is obviously conservative.
In addition to the aforementioned factors in COTEC, it is also necessary tospecify the flow split among the several types of channels (interior, sideand corner) because in wire wrapped rod bundles, the flow split is not foundto agree with that predicted on the basis of the hydraulic diameter of thechannels. The results of a number of experiments on the ratio of side toaverage channel velocity are shown in Table 3.6. The information in Table 3.6was obtained from the referenced reports and / rom discussions with the experi-menters. The analysis of these results was limited to the turbulent flow
regime, so the laminar flow data of Chen and Todreas[13] (Re = 640) were
omitted. The dye tracer data of Pedersen, et. al .bO'I4] were rejected as
being inconsistent with the remaining data including Pederson's thermal tracerda ta . The reduced side wire data of Graves and Catton[15] , although confirming
the remaining data, were not included in the analysis as not prototypic ofCRBRP geometry. For the remaining seven investigations, the mean ratio ofside to average channel velocity, Us N , was 1.015 1 0.042 (2a). These results
are consistent with Us/U = 1.00 which was selected for the nominal COTECanalyses and with the maximum expected uncertainties reported in Table 3.6.The uncertainty factor on ii will be conservatively taken as 1.02 1 0.05 (2a).s
Interior channel flow uncertainty is found from the relation (total sidechannel flow) x (side channel flow uncertainty) = - (total interior channelflow) x (interior channel flow uncertainty). Thus, for a 217 rod bundle, the
corresponding uncertainty factor on interior coolant temperature rise, con-servatively neglecting inter-channel mixing is 1.005 1 0.013 (2a) or1.005 1 0.020 (30), i .e. , direct: 1.005; statistical (30): 1.020, due toflow split uncertainty.
1630 05541
IARD-0TC56. -
MV 2
The overall statistical uncertainty combining the COTEC calibration uncertaintyand flow split uncertainty is 1.058 (3o).
In addition to the statistical uncertainty, a direct factor of 1.03 is also
applied. This includes the direct flow split factor cf 1.005 as well as
additional margin, which based on previous experience with sodium heat transferexperiments in rod bundles is judged to be sufficient to cover the te'. tingbiases and uncertainties which might be uncovered during the heat transfertesting at ORNL of a 61 rod bundle in liquid sodium (See Table 6.11) sincethe experimental data for the 217 pin fuel assembly were derived from mixingtests which measured salt solution diffusion or from velocity measurement testsin simulation fluids (water, air). The code calibration and uncertainty data
from the 61 rod bundle test in sodium will be used in the FSAR evaluation.
i630 056
42

-
,
.
TABLE 3.6
RATIO 0F SIDE SUBCHANNEL AXIAL AVERAGE VELOCITY TO BUNDLE AXIAL AVERAGE VELOCITY
RODS-IN-BUNDLE EXPERIMENTER (s ) nominal REYNOLDS NUMBER METHOD MAXIMJM EXPECTED ERROR
t7 Ginsberg-Lorenz 1.00 13,000-17,000 Isokinetic
(Reference 16)19 Graves & Catton 1.00 10,000-90,000 Salt Tracer -+5%
(Reference 15)*
19 Graves & Catton 1.00 10,000-90,000 Salt Tracer -+5%(Reference 15)
61 Chen-Todreas 1.19 640 Laser Beam +4%
61 Chen-Todreas 1.04 4500 Laser Beam -+4%(Raference 13)
O 91 Pedersen, et al. 1.17 5,000-20,000 Dye Tracer +4%
91 Pedersen, et al. 1.03 5,000-20,000 Thermal Tracer -+4%(References 8,14 )
91 Lorenz, et al. 0.99 9,000-25,000 Isokinetic(Reference 17)
$ 217 Graves & Catton 1.00 10,000-90,000 Salt Tracer -+5%u (Reference 15)O *
217 Graves & Catton 1.00 10,000-90,000 Salt Tracero (Reference 15 )
-+5%
** **
( 217 Bartholet, et al. 1.04 73,000 Pitot Tube +5% mm(Reference 18 ) mp
#Eru}a
*Side channel area decreased by reducing wire wrap diameter;
" ection of 217 rod bundle. U converted to full bundle;Ss
IAll 12 subchannels sampled.
.
W '* .
Efre Wrap Orientation
Dae to the swirl flow induced by the wire wrap in the peripheral channels,the flow and temperature distribution in the assembly depends slightly onthe relative orientation of the wire wrap and the power skew. An analysisconducted with the COTEC code, investigating the power skew range in CRBRP
fuel assemblies and the six possible orientations of the wire wrap, indicateda maximum bounding deviation in the hot channel AT of the order of 1%.
3.1.8 Subchannel Flow Area
An analysis was made of the effects of rod bundle dimensional tolerances andfuel rod bowing on the hot channel coolant temperature. The rod diameter,wire wrap diameter and duct inside width were each assumed to have rectangularprobability distributions within the tolerance limits specified on the designdrawings. The actual distributions of dimensions of fabricated fuel assemblycomponents are expected to be available for the FSAR final hot channel factoranalyses. All of the rods and all of the wires within a fuel assembly wereasstrned to have the same diameters. This assumption is reasonable in thateach lot of rod cladding and of wire is sufficient to supply more than one fuelassembly, and leads to more conservative results than allowing the diametersto vary. The average rod spacing, S, for each subchannel was assumed to have
a rectangular probability distribution in the range 0 1 S 1 2Snom, and the rodspacings for the various subchannels were assumed to be independent.
COBRA I analyses were performed for the cases of a) a single nested subchannel(S = 0), b) six nested subchannels surrounding the hot rod, and c) the hotsubchannel and the three adjacent subchannels all nested. From the results
of these analyses, the influence of reduced flow in one subchannel on thetemperature distribution among all subchannels was detennined.
The overall 3a uncertainty in hot channel coolant temperature rise due touncertainties in rod, wire and duct dimensions and rod spacings, and includingthe influence of the other subchannels, was calculated by the preceding bounding
analyses to be 0.019.
This uncertainty applies at beginning of life. The effect of irradiation-induced swelling of rod, wire and duct was analyzed and was found to resultin reduced temperatures in the hot channel. Theref ore, it is conservative toapply the above uncertainty throughout life.
1630 058u
-
IARD-9 0050__ :1' .
'REV 2There is a tereiency for thennally-induced bowing to cause all of the rodsto bow toward the hottest channal. However, the thermal compressive force was
A calculeted to be negligible compared with the experimentally determinedbundle compressive forces. Therefore, thermal bow will not significantlychange the subchannel flow area.
In evaluating the corresponding film temperature drop hot channel factor, itNs found that the effect of the decrease in the unit cell hydraulic diameterwas dominant with respect to the effect of the decrease in the Nusselt number.The effect of the change in pitch-to-diameter ratio on the circumferentialtemperature distribution was minimal. Thus, a higher value of the film heattransfer coefficient and consequently, a film subfactor less than 1.0 willresult. Conservatively, a value equal to unity was adopted.
3.1.9 Film Heat Transfer Coefficient
1.iquid metal heat transfer data for parallel flow through rod bundles werereviewed in Reference 19. A conservative design correlation was selected in
1 /D 1 1.3 cor-Reference 19 for the rod pitch-to-diameter ratio range 1.2 P
responding to that in CRBRP fuel assemblies. The data base is shown in Figures3.14 to 3.16 together with the design correlation which is designated Curve 1.A 3a uncertainty of 0.12 was recommended based on the deviations of the datapoints overpredicted by the correlation.
The analysis was repeated taking into account the variation *wung investigators,which reduced the number'of data sets to n = 6. However, it was found that
applying Equation (2.8), the new analysis resulted in lower cladding tempera-tures at PE0V conditions and lower fuel centerline temperatures than thecorrelation recomended in Reference 19. Therefore, the latter correlation
is conservative and will still be used.
As a further indication of the conservatism in the correlation, it may benoted that in the range of interest, the correlation results in lower heat 'transfer coefficients than the theoretical lower limit calculated for thecase of turbulent flow through unbaffled rod bundles, under conditions ofuniform heat flux at the inside surface of the cladding, with heat transferby molecular conduction only through the sodium [ 0] ,
1630 059c
45
E@4580. .
i< Ne
401
8
I 6
I 4
-
O -
OI 2 3
1
, =
O D/ /
P
o' / r3 o0 f'
v/ lt
1s
UOo /
uR I 8E seGpI
l 6RE
ha/R l
l
ait4 D K n3 N SR 0 e/ -
Rl 4 ir
A NO 0 A mH D HT EO U D B I pS e
F R A RA T A R O s~ EFW G B* F
s. 'dnaL
A d
- sLT 2 eE
- i
t
M g cH g g
iD , H H d
- e'a Ou N - ' r-B . PQI
--
M - fL Y 2 o' ~ .
3 4
S 0
_ 1 no
- I 8i
1 2 s,
_ ra
"0 D -8 p0 0
mO
l
3 0Ri = = 3 % ,' - I 6 oKT O 0 CS "
- .
A N T T
I
O' _ I 4
G A A A4
T H R R 1
S S E E -E I
Y Y 3RV W W _O eNI B D D r
u_ ig
_I
3
LO I 2
A O OBMYS
2
1
- - - - _ - 0._. 1.
0120 8 6 4 2 0 8 6 2 0
11
1
3
.
& o o&o.
j'$ 7 _.
*

. . cEa458Oc2N
401
I 8
I 6
4
//
I 252
/ 1
/ =
D/
P
/3 r
O. 0 o1 f
s.t
I 8l
// I 6la
useR
.. t
n
- ' em
.sI 4 i
re
e p,- P x*E
/ ' dna
. - I 2 d.
et-
. , i
cL dA e
0, -T r
PE .
M _. f2 o
-DI
K 0a 1 nU NQ o
l ~ I 8 is
L. r
R .. a
~- pR E
mE GR I
-I 6G E oE
A 4 D KiCO I R
T Rl
- I 4
& 3 N S '.
5G 0 A N ^I R 0 1
AT E -
R -D H 3S B - E
V F I _E SA D E erR R A RN T .
_ igu
I G A R O 'FF W G B ^ r
I
- ~ -
2L
T%A-
-O -B . .
M O --Y
-S3 4 2 1
. . .
t 2 3 4
_ - - - - _ -, 1
01
0120 g 6 2 0 8 6 4 2 0
11
1
=-
- @Uo C&,_...
cc'g F
u"

.
*
c 102cy g
_
SYMBOL INVE STIG ATOR LIQUID METAL
h O PASHEK Na
6 -
A BO RISH ANS Kil Na
4 _ O so RiSH ANSKii Hg
O SU8BOTIN Hg
SYMBOL AUTHOR
1. FFTF y____
2. WARD-D 0034 .
3. . GHABER AND RIEGER * /.
4. BO RISH ANSKil~
/-- -
/1 33 10 c / A*/
/O eA.,
_ 2 m\ 0.0 . b. ...
/ *. 0'a ..
"6 - O '
O A1A_.____ "'
OO4 00 0@
o
2 -
$ 100 | I I I I I I I I I
LN 101 2 4 6 8 102 2 4 6 8 103 2 4 6 8 104O
Pe
C r, xx>ey
N 1 igure 3-16. Comparison of Predicted and thperimental Results for P/D = 1.2 <@"E
a8O
D 00> ,e
.1.10 Pellet-Cladding Eccentricity
An ~ eccentric position of the fuel pellet within the cladding will give riseto an increased heat flux in the area of minimum gap with consequent increases
in temperature rise through the coolant film and the cladding. Analyses indicatedthat the effect on the fuel temperature would be to shift the position of themaximum fuel temperature from the centerline; the value of the maximum fueltemperature being actually low for sccentric than for nominal, concentricconditions. Conservatively, a value equal to 1.0 was selected for power-to-melt analyses (Section 3.2).
The effect of pellet-cladding eccentricity on the film and cladding temperaturedrops was calculated assuming conservatively that pellet-cladding contactwill occur, but at some random circumferential orientation. For a typical
fresh fuel rod, the circumte.enual variation in heat flux as a result ofpellet-cladding eccentricity was calculated using the LIFE-III correlation forgap conductance. The axial variation of local cladding midwall temperaturebeneath the wire wrap for a centered pellet, and of coolant temperature were
obtained from a NICER run. The results were combined to detennine the maxi-mum cladding midwall temperature anywhere along the rod for each direction ofpellet displacement. This provided a probability distribution of maximumcladding midwall temperature. The resulting bounding uncertainty in film and
cladding temperature drops was the combination of a direct factor of 1.14and a 3a statistical factor of 1.174.
These factors apply only at beginning of life and decrease to unity at about0.5 to 1.5 atom % burnup.
It may be noted that the orientation of the fresh Fuel Assembly during shippingcan result in the pellets tending to be displaced in the direction which isdownward during shipping. Specifying the fresh fuel assembly orientation during
shipping so as to avoid any increase in the pellet-cladding eccentricity factordue to improper orientation is under consideration.
3.1.11 Cladding Thickness and Conductivity
The thennal conductivity of 316 SS is given in Reference 21 together with the
data base used. The values are based on unirradiated data. The estimated
C uncertainty is + 5%.
1630 06349

}A p050 i* '
The correlation used in the design analysis yields results which are 5% belowthe data given in Reference 21 1.e., the uncertainty is already conservatively
e included as a direct factor.
For maximum fuel temperature (power-to-melt) analyses, the worst case occurs
at beginning of life and no additional correction for irradiation effects isrequired. The effect of cladding ID and OD tolerances results in a
1-
[2( )2] 7 /3 = 0.08 (3a) uncertainty in temperature drop through the,
cladding. However, the combined statistical uncertainties in thermal con-ductivity and in cladding thickness have a smaller effect en the temperaturedrop than does the direct factor of 1.05 built into the design correlation.Therefore no additional uncertainty factor is required for maximum fuel temp-
erature calculations.
Maximum cladding midwall or 10 temperatures are used for fuel rod lifetime analyses.Minimizn fuel rod lifetime occurs when cladding thickness is at its minimumvalue, which also corresponds to minimum temperature drop through the cladding.Therefore, it is conservative to assume nominal cladding thickness for the
temperature calculation.
The effect of irradiation is accounted for by noting that for the most highlyirradiated fuel assembly at the end-of-life, volumetric swelling at thecladding hot spot is approximately 1.0% 10.5%, based on the correlation ofswelling test data given in Reference 21. Since swelling represents dispersedporosity (vacancies) in the cladding, the effect of irradiation swelling atthe cladding hot spot is calculated from the Maxwell-Eucken equation to
be 1.01510.008. In addition, a decrease in conductivity would be expected
due to interstitial lattice defects produced and remaining when vacancies arealso produced. Reference 23 gives some experimental data for the effect ofirradiation on the electrical conductivity of cold-worked 347 stainless steel,which is expected to be similar to the effect on the thermal conductivity ofthe cold-worked 316 stainless steel cladding. There was a reduction in
18 l9conductivity of 1-2% at low neutron exposures (10 to 10 fast nyt) and low
temperatures. At higher exposure there was a smaller change. At higher ir-radiation temperature (s300 C) the change was reduced by about 50%. Based
on this, an additional direct factor of 1.02 was conservatively applied.The irradiation swelling direct factor of 1.015, the interstitial latticedefect direct factor of 1.02, and the combined statistical uncertainties in
1630 06450

WARD-O-0050, .
REV 2 i
1
irradiation swelling and in thermal conductivity have a smaller effect onthe temperature drop than does the direct factor of 1.05 built into thedesign correlation. Therefore no additional uncertainty factor is requiredfor maximum cladding temperature calculations.
3.1.12 Coolant Properties
The enthalpy and the density of sodium are parameters used in the energyand momentum balance for the heated coolant channels to determine the localcoolant temperatures. The correlations are obtained from Reference 24.
The reconmended correlation for enthalpy was based on the data of Ginnings,et al.[25] They report a probable error of the mean from 0.01 to 0.03%(depending on the temperature). Taking into consideration their estimateof systematic errors, they estimate the probable error of the enthalpy tobe between 0.1 and 0.2% and the probable error of the heat capacity to bebetween 0.3 and 0.4%. For hot spot analyses, coolant temperature changesare large and the uncertainty associated with enthalpy rather than withheat capacity is more appropriate. The upper estimate 0.2% probable error(errors equally likely to be greater as smaller) converts to a 0.9% 3auncertainty.
More recent measurements by Fredrickson and Chasanov[26] showed excellent
agreement with Ginnings' data. For a typical 400*F temperature rise inCRBRP, Fredrickson's correlation gives an enthalpy rise within 0.01% of thatobtained with the recomrrended correlation.
The density correlation was derived by Stone, et al.[27] from the data ofE ')References 27 to 33. The deviations of these data and those of Gol'tsova
from the reconmended correlation are shown in Table 3.7. For the fiveinvestigators covering the present range of interest (References 30, 31(B),32,33,34),
RMS % Avg. Dev. = 0.674
% Avg. Dev. of Mean = 0.674 d=0.3377/5 /4
The average deviation of the mean of 0.337% converts to a 1.5% "30" uncertainty.The effect of the small number of data points on the overall tolerance intervalis negligible as shown in Section 2.4. The statistically combined enthalpy anddensity subfactors yield a sodium properties factor of (0.92 + 1.5 )V2 = 1.7%.2
1630 065

WARD-O%56- ' '
Rt.V 2
''
TABLE 3.7'
SUMMARY OF DENSITY MEASUREMENTS FOR LIQUID S0DIUM
% Average Deviation:Obse ved - CorrelationTemp. Range
Investigator ( F) Correlation
NRL[29] mp to 503 10.08Jackson [30] 937 to 1314 -0.74Rinck[32] 804 to 1183 +0.15Hagen[28] mp to 336 10.05NRL[27] 1577 to 2491 +0.17
Novikov[31](A) 248 to 505 0.14
(B) 275 to 1324 +0.71
Nishibayoshi[33] 486 to 1580 +1.09
Gol'tsova[34] 802 to 2754 10.11
n
1630 066
,
52
WARD-D*0050 1' '
Rtv 2 ;
3.1.13 Nuclear Uncertaintiesr
The total power or burnup uncertainty is composed of nuclear design methodsuncertainties and/or biases (based on comparisons of calculations and measure-
ments of isotopic fission and capture rates and gama heating in ZPPR-7),CRBRP design uncertainties relating primarily to absolute power normalizationand fissile content variations, and a general class of ir.odeling uncertainties.In the fuel, the power uncertainty is broken down into a statistical partwhich is combined in quadrature (root-mean-square) with other statisticaluncertainties, and a nonstatistical bias and uncertainty which is applieddirectly to envelope the upper limits of the peak power density. Due to thelimited scope of the available blanket data, only a nonstatistical uncertaintyis developed. Uncertainties are provided for the fuel, inner blanket andradial blanket assemblies. Where a basis exists for such, a spatial distri-bution of the uncertainty is provided (e.g., adjacent to, and removed from,the influence of inserted control rods, and by assembly-row in the radialblanket).
CExperimental verification of the calculational methods and data used to predictthe power distributions in CRBRP is provided by the measurements performed inthe ZPPR critical facility. ZPPR is a zero power critical mockup of the CRBRPconsisting of a matrix of rectangular drawers containing fuel, steel, andsodium plates loaded to simulate the average compositions of the CRBRP coreand blanket regions. CRBRP design methods are verified, and design bias factorsand uncertainties are derived, by direct comparison of calculated and measuredZPPR parameters. These parameters include isotopic fission and capture rateand gamma heating distributions in support of power distribution predictions.The design (methods) bias factors and uncertainties are subsequently appliedto the calculation of these parameters in CRBRP which are predicted with the '
same calculational tools and data.
1630 067
r
53

WARD-D 0050 44* '
RtV 2 ' '
The results presented herein are based primarily on the analysis of ZPPR-7
(Phases A-E) measurements. ZPPR-7 modeled the basic characteristics of aheterogeneous CRBRP core with annular rings of inner blanket assemblies.
Tables 6.lB and 6.2B list the statistical and nonstatistical uncertainties ap-
plicable to the predictions of both local and rod- or assembly-integrated powerdensity in the core fuel assemblies. The uncertainties are divided into thoseapplicable to fuel regions directly adjacent to the partially inserted row 7corner (R7C) control rods, and those applicable to all other core locations.The uncertainties for fuel assemblies adjacent to inserted R7C control rodsare shown for both the side adjacent to the R7C control rod and the far side.Uncertainty values are presented for the heat flux at the peak power position(peak power density near the core midplane), the heat flux at the top of thecore (power density at the core / upper axial blanket (UAB) interface) and thechannel coolant (rod-channel integrated power) in Table 6.lB and the assemblymixed mean cutlet temperature (assembly integrated power) in Table 6.28.
The peak and integrated power der.sities in the fuel are well predicted withthe standard.20-synthesis nuclear design techniques. However, the powerdensity at the top of the core is relatively poorly predicted due to diffi-culties in simultaneously modeling the behavior in this region while preservingthe integral and peak (core midplane) power in two dimensions. In addition,
the accuracy of few group diffusion theory is poorer in the presence of thesteep flux gradient and in the region of the core /UAB material discontinuity.
These factors are reflected in the larger " heat flux at top of core" unces tainty.
The statistical uncertainties consist of experimental uncertainties (fissionrates and gama heating) at the 3a level, criticality and control rod insertionuncertainties, and local fuel fissile content variations.
3.1.13.1 Experimental
The experimental power uncertainty consists primarily of Pu-239 and U-238fission rate and gama heating uncertainties. The experimental (statistical)power uncertainty is derived from the +2% (lo) root-mean-square deviation
1630 068
54
WARD-D*0050 i''
REV 2
between calculated and measured core fission rate (Pu-239, U-235) distributionsin ZPPR-7 covering a variety of reactor critical configurations. There is anobserved radial tilt in the calculation-to-experiment ratios for Pu-239 fissionin Phases A and B of ZPPR-7 which tends to overestimate (by 3-5%) the Pu-239fission rate in the area of the fuel " islands" in rows 7, 8 and 9 and speci-fically around the R7C control locations, in the beginning-of-life configuration.This overprediction, coupled with the application of a +3a power uncertainties,would result in an overly high estimate of the peak power in these locations.Consequently, the beginning-of-life (80Cl, B0C3, 80C5) power in the rows 7, 8,9 region of the core is biased downward in Table 6.lB (footnote 4) by 1-3% toremove the basic tilted characteristics in the fission rate (power shape).This radial tilt was not observed in the Phase C or D ZPPR-7 experiments withplutonium loaded in the inner blankets, so the aforementioned bias is notapplied to the end-of-life power shape.
The analysis of the ZPPR-7 experimental U-238 fission rate distribution
showed substantial fluctuations in the calculation-to-experiment ratios betweenfuel and inner blanket assemblies, possibly attributable to the infinite medium
C cross-section preparation scheme. Based on these ZPPR-7 results, a one-sided+20% U-238 fission uncertainty is indicated in the core fuel assemblies (althoughU-238 fission only accounts for about 6% of the total power in the fuel sothat this uncertainty accounts for approximately 1% on the high-side of thetotal power uncertainty).
Analysis of the preliminary ZPPR-7 gama heating measurements shows a scatter
of 110% in the calculation-to-experiment (C/E) ratios in the core regions anda consistent 15-20% underprediction in the radial blanket. There was someevidence in the ZPPR-4 gama heating measurements, however, that this under-
prediction behavior at the core / blanket interface is at least in part ananomaly caused by the comparison of homogeneous (cell-average) calculated
heating rates with point-measured values in regions of substantial gama finestructure. This uncertainty is therefore considered an upper bound. Gamaheating accounts for about 10% of the total fuel assembly power, so the 110%uncertainty accounts for approximately 11% of the total fuel assembly poweruncertainty.
/~''1630 069
55

IARD-0-0050 1' '
RFV 2 'i iThe direct combination of 16% (3a) plutonium fission rate uncertainty (=85%of the total core power), 120% U-238 fission rate uncertainty (=6% of the
O total core power, and 110% gama heating uncertainty (=10% of the totalcorepower) results in a 17% (approximately 3o) total experimental power uncer-tainty in the fuel, in addition to the space-dependent beginning-of-life biasdiscussed earlier. This uncertainty applies equally to the local pellet, rod,and fuel assembly power predictions. Due to the slight space-dependent trendsin the C/E distributions, this uncertainty is not statistically reducible forsmall groups of fuel assemblies.
The experimental fission rate uncertainties are based on well over 100 foilmeasurements in ZPPR-7.
3.1.13.2 Criticality Uncertainty
The uncertainty in the prediction of the hot critical state of the reactorresults in an uncertainty in the depth of primary control rod insertionwhich, in turn, affects the local power distribution (principally the radialand axial distributions in the imediate vicinity of the inserted controlrods, and to a lesser extent throughout the remainder of the core). This
O uncertainty is derived from a (3o) statistical value of the criticality uncertaintyof 10.5%Ak developed from the 4 unrodded critical configurations in ZPPR-7. Theresulting power uncertainty is derived parametrically by varying the control rodbank insertion by an amount corresponding to the 10.5%Ak to produce powerperturbation maps. The criticality power uncertainty applies approximatelyequally to the beginning and end-of-cycle power distributions due to a partialcancellation between the lesser influence of the nearly-withdrawn primary controlrods and the larger magnitude of the criticality uncertainty which includesburnup reactivity swing uncertainties near the end-of-cycle. This criticality(rod insertion) uricertainty results in a 11% power uncertainty throughout thecore with the exception of those assemblies directly adjacent to the insertedcontrol rods. The power distribution in the fuel assemblies directly adjacentto the inserted control rods is strongly influenced by the position (depth ofinsertion) of those rods so that the criticality uncertainty in these assembliesis both larger and space-dependent across the assemblies as indicated in
footnote (3) to Table 6.lB.
1630 070p
56

' '
VARD-D 0050 8
REV 2
3.1.13.3 Pellet Fissile Content Tolerance
The specified fuel pellet fissile content (manufacturing) tolerance resultsin a local fission rate bounding uncertainty of 13%. Because the pellets arefabricated in batches, this uncertainty is not reduced for groups of pelletscomprising a single fuel rod or a single fuel assembly. Very large numbersof fuel assemblies are, however, subject to a smaller specified 10.5% fissilecontent tolerance. For a rectangular probability profile, the 13% uncertaintyresults in a 3o uncertainty of 5.2%.
3.1.13.4 Modeling Uncertainties
Specific model uncertainties in the CRBRP core power distribution predictionsinclude parametric uncertainties arising from 3D effects (bounding), rod-powerinterpolation (bounding) and radial and axial burnup modeling (engineeringjudgement). The aforementioned modeling uncertainties are derived parametrically,so no specific o level can be assigned. The values quoted do, however, generallycover the range of variations noted. Modeling uncertainties are combined withother nonstatistical uncertainties directly rather than statistically.
CRBRP power, burnup and reaction rate distributions are predicted by atwo-dimensional (2D) synthesis technique whereby " radial" shape factors, F ,derived from hexagonal calculations, and axial shape factors F , derived fromRZ calculations, are superimposed on average power conditions to result in thethree-dimensional (3D) power distribution throughout the core and blankets.A bencnmark calculation with consistent 3D and 2D-synthesis models has been used
to infer the geometric modeling biases introduced by the 2D-synthesis techniqueat the beginning-of-life. In general, the agreement between the two modelsis good (with the exception of the regions strongly influenced by the partiallyinserted R7C control rods as noted in Table 6.lB) with the peak power densitypredicted within the range of 13% and rod- or assembly-integrated power pre-dicted within 11% in the core. The polynomial fit to power-by-rod, performedwith input from 24 mesh-per-assembly 2DB hexagonal calculations, introduces
an additional uncertainty of 11% in the radial power shape within an assembly.Burnup modeling in the core generally introduces little error in the powerdistribution in high-power locations, although some uncertainty is necessarily
1630 07157

WARD-O*0050 44. ,
' REV 3 i~
introduced in the end-of-life axial power shapes due to smoothing. The axialgpeak-to-average power has been shown to be nominally overpredicted by 2% inZPPR-4 and in ZPPR-7 The net peak power density modeling uncertainty through-out the core (with the exception of assemblies directly influenced by insertedcontrol rods) is therefore 12% (13% 3D effect plus 11% intra-assembly radialpower shape uncertainty less 2% axial peak-te,-ever6ge overprediction). Thisvalue increases to +10% on the high-side for the " heat flux at the top of thecore" with the inclusion of the 5% fall-off in the prediction of the axial
power shape indicated in the IPPR-4 and -7 experiments, and with some additionaluncertainty in the tail of the axial power shape. The 12% integrated rod power
uncertainty is made up of 41% 3D effect plus the .11% radial shape uncertairtty,whereas the 11% total assembly power modeling uncertainty is entirely 3D effect.
The radial and axial power shapes in the vicinity of inserted control rodsare particularly sensitive to control rod modeling. Partially insertedcontrol rods in the CRBRP are modeled with an " effective" amount of control*
volume fraction which results in the same reactivity worth inserted in the 20.hexagonal calculations as would result from an explicit 3D representation. Thistechnique results in a good representation of the average power in the surroundingfuel assemblies, but necessarily introduces some spatial bias in the radial powershape very close to the inserted control rods. In addition, the axial powe-
shape is selected to best represent the assembly-average power so that theshape is somewhat more perturbed in the region of the fuel pins directlyadjacent to the inserted control rod, and likewise somewhat less perturbedon the side of the assembly farthest from the inserted rod. The combinationof these radial and axial shape perturbations, derived primarily from the3D-2D synthesis comparison, results in a space-dependent modeling bias (un-certainty) which varies across the assembly as indicated in Table 6.18 (foot-note 1).
3.1.13.5 Control Rod Banking
The maximum control rod out-of-bank specified tolerance of 11.5 inches intro-duces a potential power asymmetry in the core. The bounding power uncertainty
resulting from the control insertion asymmetry is found from full-core para-metric calculations to be 12% except directly adjacent to the inserted rodswhere the bounding uncertainty is increased to 14%.
58
1630 072

* '
WARD-D7056REV 33.2 isower-To-Melt Uncertainty Factors for Fuel Assemblies
3.2.1 IntroductionrThis section presents a preliminary analysis of the uncertaf nties in power-to-melt calculations for the heterogeneous core. The results will be refined
and updated for the FSAR based on further analysis and additional experimentaldata. The primary data used for this work were the results. of the short-time.(low burnup) HEDL-P19 and P-20 tests [35,30 which were integral experimentsdesigned to provide thermal performance information.
The LIFE-III code was used as the calculational tool. The code is a detailedmodel for describing the thennal and mechanical behavior of fast reactorcxide fuel pins and has been calibrated and verified with the HEDL P-19
and P-20 tests in addition to a number of intermediate and high burnup pins.Figure 3.17 and Table 3.8 show how well the code represents the P-19 and P-20data. The code was used to calculate the power-to-melt of the CRBRP AFMS fuel -
and blanket rods, and the sensitivities to variations in fuel pin parametersused fo.' uncertainty analysis.
In the subsequent sections for fuel applications, the uncertainties in theC
code predictions of the power-to-melt arising from data scatter and theoverall accuracy of measurements in the EBR-II are first analyzed. The
uncertainties which occur when applying the code to the CRBRP conditions arethen evaluated. The factors considered here include the tolerances onfabrication parameters and reactor instrumentation and thermal hydraulic andsystematic uncertainties. The individual uncertainties were determined bycalculating the power-to-melt for the nominal peak rod conditions and designparameters followed by calculating the effect of a variation in each parameteror the nominal code result.
All the individual uncertainties are then statistically combined and theprobability distribution for the reacMr power-to-melt determined. The
design criterion can then be measured by detennining if the 115% of nominalpower is three standard deviations below the power-to-melt.
A'
1630 073
59

. .
*ARD-8*0050 't
REV 2 1
C
=
2 ie>=
5.3
E"
-
a =0 m =
E Oc a 3
= EE8 k
,
$ 2r~ ~
3 :
.EO w
u.
Ub--o
*_ e e.
~
5 O e= =
ocoo Za-
l I l IE
2" *2 2 0: x031V1031V3
?
1630 074
c
60

. ,
WARD-D-0050 .
REV 2 y I
n
TABLE 3.8
CENTER TEMPERATURES AND POWERS-TO-MELT OF INCIPIENT MELT SECTIONS
AS COMPUTED BY LIFE-III CALIBRATION T18/6000
Calculated ObservedCalculated T Power-to-W11t Power-to-Melt
Pin N3. 'F_ ('C) max kW/ft (kw/m) kW/ft (kw/m)
P19-35 5009 (2765) 16.62 (54.5) 16.69 (54.6)
P19-02 4978 (2748) 16.04 (52.6) 15.89 (52.1)
P19-24R 5024 (2773) 15.44 (50.6) 15.59 (51.1)P19-27R 4990 (2754) 19.23 (63.1 ) 19.16 (62.8)P19-28 4966 (2741) 19.02 (62.4) 18.82 (61.8)P19-30 5070 (2799) 17.22 (56.5) 17.79 (58.3)
O P19-08 5006 (2763) 15.36 (50.4) 15.40 (50.5)P20-07 5004 (2762) 15.72 (51.7) 15.75 (51.7)P20-30 4985 (2752) 16.82 ($5.2) 16.70 (54.8)
P2b-33 4982 (2750) 19.07 (62.5) 18.98 (62.2)
Average T = 5001 1 28 F r.m.s error
(2761 1 16*C) = 0.21 kw/ft (.69 kw/m)*
std. dev.= 0.24 kw/ft (.77 kw/m)
*Two degrees of freedom lost in calibrating LIFE-III parameters.
O 1630 075
61
'
WARD-D* 005O ), -
REV 2 1
3.2.2 EBR-II Factors
The factors associated with EBR-II experiments which contribute to uncnr-tainties in power to melt measurements are listed and defined below:
1. fab ( is the standard deviation) is due to variation in fuel pinfabrication parameters from their nominal values.
o IE is due to uncertainty in post-irradiation examination (PIE)2.P
measurements.
is due to uncertainties in the spatial dependence of neutronics3. ospacecalculations and local inhomogenieties in the EBR-II core.
oh is due to uncertainty on overall power level due to variations4.t
in EBR-II instrumentation and the uncertainty in the neutronicscalculation for a given core loading. This uncertainty causesrandom fluctuations in quoted power level that vary with time.
5. o is due to a difference between actual and quoted overall EBR-IIsys
power that doesn't change with time. It is known that a systematicshift in EBR-II power level exists and a correction is made by experi-
.menters. An estimate is required of the uncertainty on this correctionfor this analysis which is identified here as 0 This uncertainty
9ts .does not show up as scatter in the data. Such u systematic uncertainty
would show up in the scatter of data comparing different reactors.
The evaluation of each of these uncertainties will now be discussed.
" time
The major contribution to this uncertainty results from fluctuations in theprimary and secondary EBR-II coolant loop heat balance. This yields a 2%standarddeviation[37] Neutronic calculation of y recursors in the P-19
.
test introduce a further uncertainty of less than 1% 38] and a value of
0.8% was used. Accordingly this factor was evaluated as
" time 2 2%2 + 0.8%2= 2.2% (3.8)
1630 07662
IARD-DMOO5b 4- '
REV 2 '
This uncertainty would not show up as fluctuations in results from asingle subassembly since all pins would have been subjected to the sameerrors in overall power determination during the same times.
sys
A detailed analysis of the P-19 test indicated that a correction factorE38)of 0.94 must be applied to the calculated EBR-II power leve1 This.
factor has ban used in all reported analysis of these results and those ofthe P-20 test and was used for the LIFE-III calibration. Subsequent work
suggested a factor of 0.91[37] , while recent analysis by the EBR-II Projectindicates 0.96. As an interim position, the 0.94 factor is beingretained. An evaluation of the recent analysis by the EBR-II Project willbe perfonned when their report is issued. In addition, burnup analysis datawill be evaluated with respect to this factor. The EBR-II Project also estimatedthat further systematic bias should be no more than +2%. For work in
this document an uncertainty, sys, of 3% is used which covers both the.91 and .96 power factors and is more conservative than the 2% estimate byEBR-II.
" space
The spatial uncertainties in pin powers arise from uncertainties in neutrontransport calculations. Calculations have been checked by comparison of
measurements of control rod worth [38] Table 3.9 and Figure 3.18 show the result-.
ing percentage difference between measured and calculated flux, which has a
standard deviation, c' space, of 1.7%. In addition local flux peaks producean estimated uncertainty d of about 0.5%. Finally in the highlyspaceenriched fuel of P19, differences in the y absorption can produce a +0.7%to -0.7% variation in pin power going from the center to the outside ofthe assembly. This introduces a standard deviation of .7//3 2 0.4%.Combining these,
1.7 +.52 , ,42 = 1.8% (3.9)" space ;
1630 07763

WARD s* 005'O.,
REV 2'
O O contact noo nos.
CALCULATED
---- M ASURED
1
1so lk9 11
_.AI
\g / 140lh
/
120sh
/100th
h | I (1p
\ k" '
I /. ~ -
6 2
5 3
4
Figure .1-18. Control-Rod Worths for EBR-il Run 27 A
9926 19
1630 07864
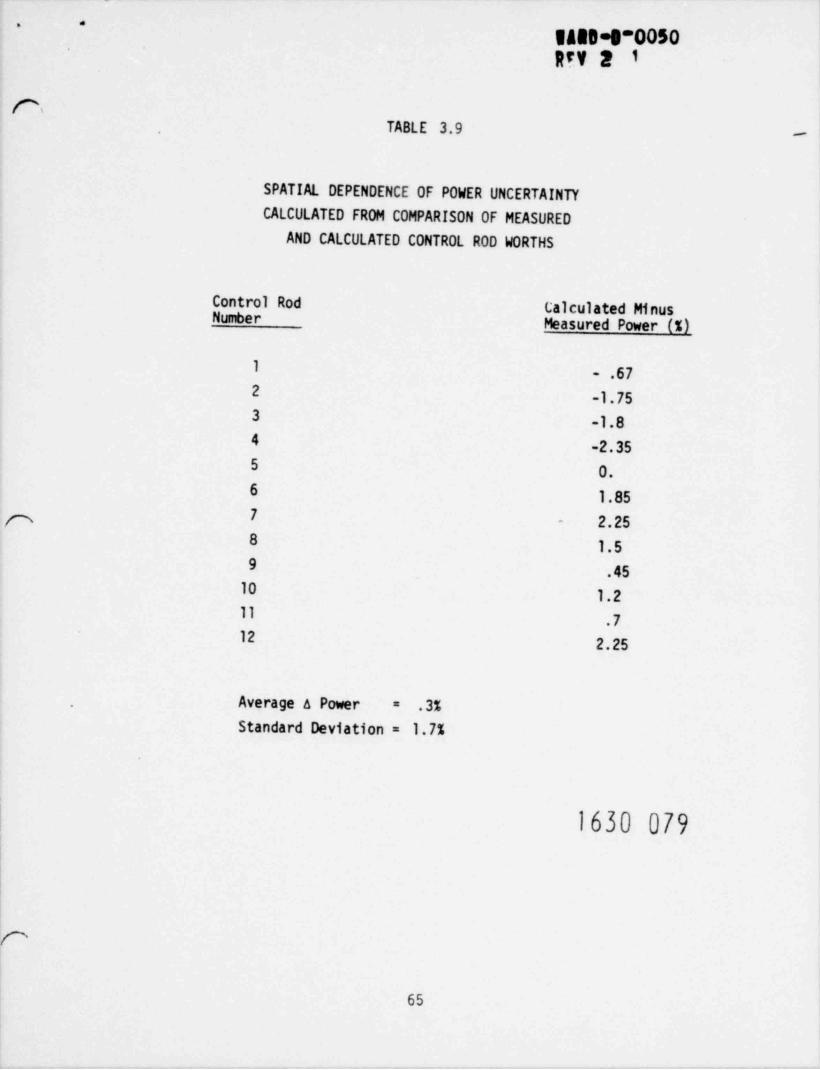
- '
IARD-9-0050REY 2 1
rsTABLE 3.9 -
SPATIAL DEPENDENCE OF POWER UNCERTAINTY
CALCULATED FROM COMPARISON OF MEASURED
AND CALCULATED CONTROL R0D WORTHS
Control Rod Calculated MinusNumber
Measured Power (%)
1 .672 -1.753 -1.84 -2.355 0.6 1.857 - 2.258 1.59 .45
10 1.211 .712 2.25
Average a Power .3%=
Standard Deviation = 1.7%
1630 079
r
65

,.
BARD-0*005Q ,
REW 3 1fab
The scatter in burnup measurements as compared to values calculated fromEBR-II powers has been analyzed and found to be 1.1%. This analysisBUis from individual subassemblies, and since pins in a subassembly are inthe reactor for the same time, they would not reflect the uncertainties
o ime and o The scatter in the burnup data includes a combination oft sys.EBR-II power uncertainties and uncertainty in the burnup measurementtechnique.
BU 2 1.1% 1 2+o 2+(0.5%[ p B)space fab
where the 0.5% is the estimated burnup measurement accuracy of the massspectrometry. The spatial uncertainty s .5% is that for an indivi-spacedual subassembly and not the entire core. The burnup uncertainty has alsobeen calculated by HEDL to be 3% (1o). In this work a single power factorfor all subassemblies was used. The data scatter due to power fluctuation
with time, a ime, and core wide spatial uncertainty, ospace, would thereforet
apply and the 3% standard deviation obtained can be attributed to
2! fab +(0.5%)2 (3.11)3% 2+o 2+tim space
Using the previously detemined values for and etime , space y spacein equations (3.10) and (3.11) the two self-consistent values for ofab amrespectively obtained,
fab = .85, .82% (3.12)
PIE
The scatter of the P-19 and P-20 experiments relative to the LIFE calibrationhas been calculated (see Table 3.8 and Figure 3.17). The standard deviationis about 1.3%. It is interesting to note that only one pin in this group wassignificantly outside this standard deviation, and that was P-19-30. If
P-19-30 had been excluded, the standard deviation would have been 0.8%.
1630 08066

*.
It might be core reasonable to use 0.8%, but to be conservative, 1.3% willbe used. The scatter in P19 and P20 data reflect uncertainties in fabrication,local spatial fluctuations and post irradiation examination measurementuncertainty. Since P20 powers were normalized to P19 results, P20 is notan independent experiment at a separate time and does not apply. Sotime
"P19/P20 ' l.3% ab + *space PIE (3.13)
Equation (3.13) then gives
PIE = 0.9%(3.14)
Values of the above uncertainties are sumarized in Table 3.10.
Total Uncertainty
The total uncertainty is a combination of all the components
2+# 2+ 2+o 2+o 2= 4.3% (3.15)tot fab PIE space time sys
Resolution of the EBR-II power factor is expected to reduce the systematicuncertainty to 2%, and will drop to 3.7%.
tot
tot represents the scatter and uncertainty in the power to melt data.The uncertainty in the average of these data is given by the standarddeviation of the mean. The standard deviation of the mean takes intoaccount the nunber of data points N, and is given by o/ 8. In the variouscomponents of tot, a separate measurement toward determining o w uldsysrequire use of a different reactor; a separate measurement for o
timewould require an experiment done at a different time and a separatemeasurement for o" space would require another experiment done in a differentposition in EBR-II. As explained above, P19 and P20 cannot be counted asbeing done at different times or different positions. So for o "
sys' spaceand o ime N=1. For the other components N = 10, the nunber of rodst
used. Thus
"mean"/#sys2+otime 2 + o " space 2 + ( fab 2+o 2+ 'PIE space)/10=4.1%
(3.16)
1630 081
67
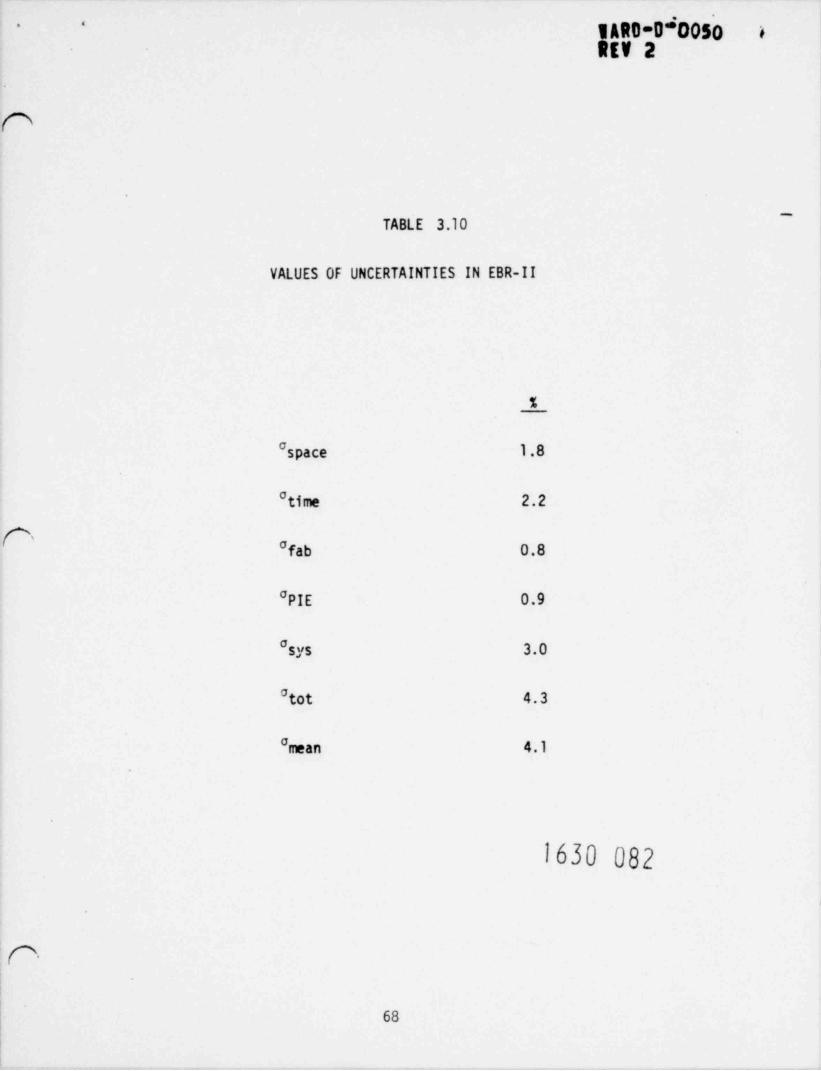
d- '
1ARD-O OO50 e
REV 2
O
TABLE 3.10-
VALUES OF UNCERTAINTIES IN EBR-II
%
space 1.8
time 2.2
Dafab 0.8
PIE 0.9
"sys 3.0
tot 4.3
"mean 4.1
1630 082
O
68

'-
D 090503-
o is dominated by and o ime with the other components making amean sys t
small contribution. The mean of the power to melt data is representedby the LIFE-III calibration and the uncertainty on this mean is given by
mean.
3.2.3 Power-to-Melt in CRBRP
The probability of melting in CRBRP must be evaluated. To do this the LIFE-IIIcalibration will be extrapolated from P19/P20 to CRBRP conditions. The power-
to-melt margin is lowest near beginning of fuel life. Since we are considering
only fresh and very low burnup fuel and this is the burnup range covered byP19/P20, the extrapolation is small and it is assumed that no biases are
introduced. The additional uncertainty comes from the use of fuel with 33%
Pu enrichment instead of 25% enrichment used in the calibration. An estimateof the values and uncertainties of power-to-melt in CRBR with reference fuelcan be made. Then the uncertainties in the CRBR power-to-melt are statistically
added to the P19/P20 uncertainty and to the extrapolation uncertaintymean
to define a probability of melting.
1. CRBRP Design Uncertainties
The uncertainties in a CRBRP power-to-melt due to the factors listed in
Table 3.11 will be considered. Fabrication and irradiation uncertaintiesarise from design tolerances and uncertainties in neutron physics and thermalhydraulic calculations. These uncertainties can be estimated from thedesign tolerances by computing their effect on power-to-melt using LIFE-III.The design tolerances will be for pellet density, cladding I .D., enrichment,
instrumentation and pellet diameter. There is also a tolerance on fuel weightper length which prevents certain combinations of density and diameter.To simplify analysis and add the conservatism of not taking credit 'for thisweight per length restriction, it will be neglected. Tolerances lead to
fabrication of parts whose means may lie with approximately uniform probabilityanywhere within the fabrication tolerance tounds. The bounds of such arectangular distribution correspond to + do. The tolerances are listed inTable 3.11. Actual distributions of dimensions and fuel density are expectedto be available for use in the FSAR hot channel factor analyses.
69

80~0T050.- *
R gTABLE 3.11
CRBRP FUEL R0D TOLERANCES AND UNCERTAINTIES
f UNCERTAINTIES REPRESENT /To
Nominal / Tog
Fuel Fellet Diameter .1935 i .0015 in.
Cladding Insile Diameter .200 i .0005 in.
Fuel Pellet Density 91.3 11.6% TD
Reactor Power * 15.07%
Cladding 0.D. Temperature il5.6*FNear Midplane **
D
* Statistical combination of nuclear data, criticality, and fissile
fuel maldistribution uncertainties.
** Due to thermal hydraulic uncertainties not including uncertaintiesin power.
1630 084
m
70

vARD-0-0056- --
Rtv 3 f'
3.2.4 Typical Power-to-Helt Analysis
LIFE-III runs are made to analyze the effect of variations in the parametersof Table 3.11 on the melting of the peak power pin. A progranined reactor
_
startup is specified by giving the steady state reactor power as a function oftime, REPOW (t). EPOW (t) is the total reactor power as determined bythe reactor control settings, and Q (t) is the corresponding linear powerincluding direct factors of the peak pin near its axial midplane at the locationof peak centerline fuel temperature. The reactor power units are normalized
to a value of 1.0 at nominal full power, i.e. REPOW (t) is 1.0 when thenominal power of the peak pin at X/L = .45, Q(t), is 12.73 kw/ft. Thisreactor power history remains the same for all the runs considered below.The power-to-melt is defined in LIFE-III by ramping the reactor power upuntil melting starts in the peak pin. This is done at various times duringthe steady state irradiation to obtain the burnup dependence. The prograninedstartup assumed for this study is illustrated in Figure 3.19.
3.2.4.1 LIFE-III Runs
A code run with the nominal conditions of Table 3.11 and the power history of
Figure 3.19 defines the mean reactor power-to-melt for the nominal peak pin
as follows:
REPOWg (nominal t) = C CIM(nminal,t)
where El is the peak pin linear power at X/L = .45 when the LIFE-III centerlinegtemperature reaches the fuel melting point and R7GI is the reactor power atg
CP, = 12.73 kw/ft because of the normalization of units chosen forthat time.reactor pcwer. REP 0W is labeled the mean reactor power-to-melt (signified
Mby the bar) since the mean of P19/P20 has been used to calibrate LIFE-III andthe P19/P20 power uncertainty will be subsequently added.
Code runs were also made for small perturbations of the design parameters toThedetennine the sensitivity of power-to-melt to variations in each parameter.
sensitivites are shown in Table 3.12 and the corresponding standard deviations in
power-to-melt obtained from the standard deviations in the parameters from
Table 3.11 are shown in Table 3.13.
1630 085
71
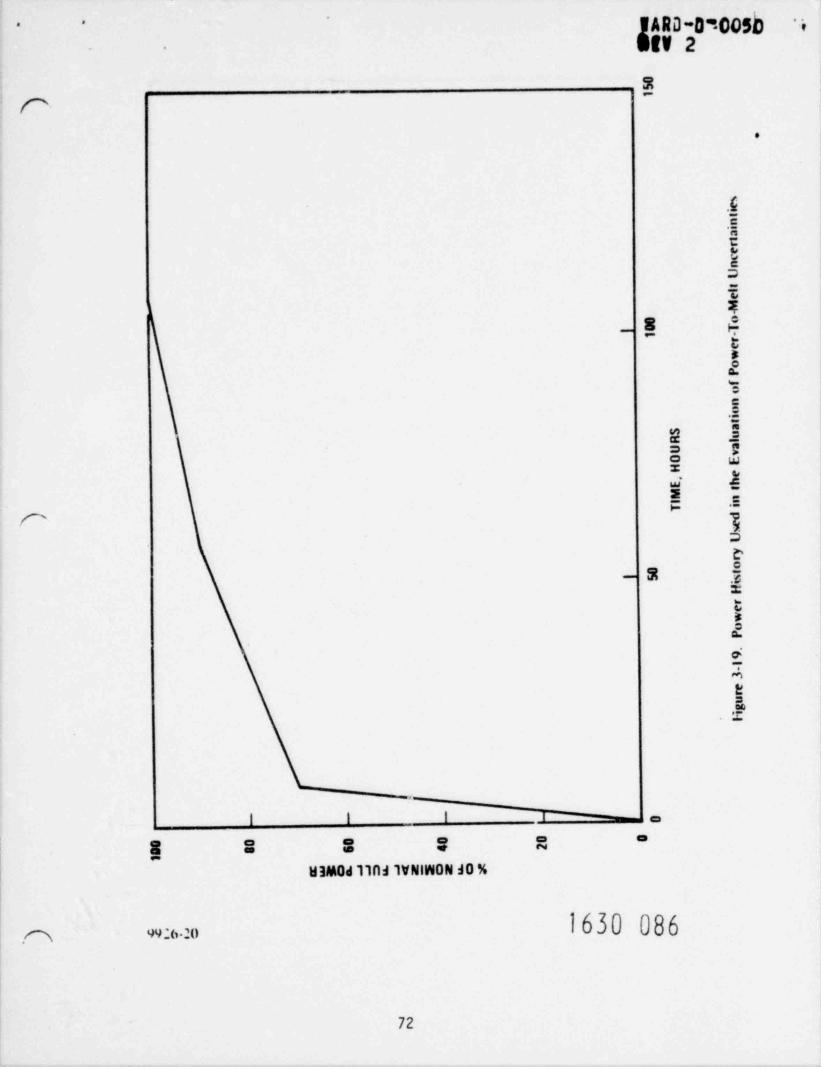
IARD-09005b '4..
try a.
s-
p..
.&ca=.ec2
54
E 4-
e,e%!
s .
= cE W
i 5i; =
e 1ae
S .$-
=c
m
#,
eE::
a
-g = = = =
W320d lifid 1VNIWON 30 %
1630 086.m w:<>.2n
72
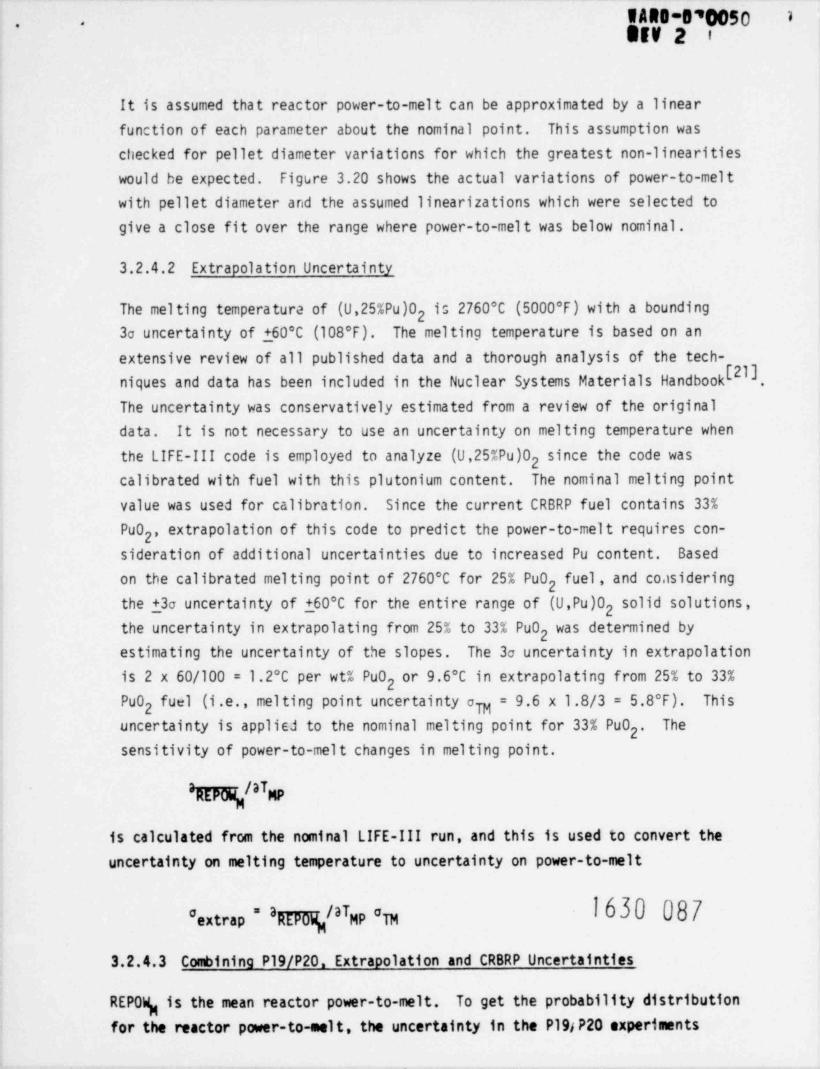
WARD-D'0050 1--
StV 2 '
It is assumed that reactor power-to-melt can be approximated by a linearfunction of each parameter about the nominal point. This assumption was
checked for pellet diameter variations for which the greatest non-linearitieswould be expected. Figure 3.20 shows the actual variations of power-to-meltwith pellet diameter and the assumed linearizations which were selected togive a close fit over the range where power-to-melt was below nominal .
3.2.4.2 Extrapolation Uncertainty
The melting temperatura of (U,25%Pu)0 is 2760 C (5000*F) with a bounding2
3a uncertainty of 160*C (108'F). The melting temperature is based on an
extensive review of all published data and a thorough analysis of the tech-E2niques and data has been included in the Nuclear Systems Materials Handbook .
The uncertainty was conservatively estimated from a review of the originalda ta . It is not necessary to use an uncertainty on melting temperature whenthe LIFE-III code is employed to analyze (U,25%Pu)0 since the code was
2calibrated with fuel with this plutonium content. The nominal melting point
value was used for calibration. Since the current CRBRP fuel contains 33%Pu0 , extrapolation of this code to predict the power-to-melt requires con-
2
sideration of additional uncertainties due to increased Pu content. Based
on the calibrated melting point of 2760 C for 25% Pu0 fuel, and co.isidering2
the 13a uncertainty of 160 C for the entire range of (U,Pu)0 solid solutions,2
the uncertainty in extrapolating from 25% to 33% Pu0 was determined by2
estimating the uncertainty of the slopes. The 3a uncertainty in extrapolationis 2 x 60/100 = 1.2 C per wt% Pu0 or 9.6 C in extrapolating from 25% to 33%
2Pu0 fuel (i .e., melting point uncertainty = 9.6 x 1.8/3 = 5.8 F). This
2 TMuncertainty is applied to the nominal melting point for 33% Pu0 . The
2
sensitivity of power-to-melt changes in melting point.
O /aTREPOW gpg
is calculated from the nominal LIFE-III run, and this is used to convert theuncertainty on melting temperature to uncertainty on power-to-melt
i630 087/ o'extrap = agg7 aTgp TM
3.2.4.3 Combining P19/P20, Extrapolation and CRBRP Uncertainties
REPOW is the mean reactor power-to-melt. To get the probability distributiongfor the reactor power-to-melt, the uncertainty in the P19/ P20 experiments
3
IARD-D 0050ee
RIV 2
c.
\\ \\ \
i \ 5-
g
3 0 \! \/\ '
! / /\ 1I \ ct
//\\ !
.
a 5 =s; i I /
\ : : \ u 5-
\ m x-
I / a Ii \ = _
' \ sb 'i-x -
O^
\ C -.a
// \ \ :n a ~: : // \ \\ \ |* *
J|I \ \ E|I \ \ 9,8 4/ \ ' -
.
II .i.'
'Il
| I I I l
5 $ $ 0 0 5 0
N 0d38
1630 088
e99_6 ;I
74
IARD-0-0050 1--
RE9 2 i
( mean) and the extrapolation uncertainties (aextrap) are added to the CRBRPdesign uncertainties (og), resulting in the probability distribution forreactor power-to-melt with standard deviation
REPOW(t)=!cy(t)2+"mean +oextrap
and a mean of REPOWg (nominal,t), where t is time-in-life.
3.2.4.4 Design Criterion
The design criterion is that the reactor control settings be low enough sothat
1.15* REPOW(t) < ITP5i (nominal,t) - 3aREP04(t)g
for all time, or that a 15% overpower is three standard deviations belowmelting power.
3.2.4.5 Results of CRBRP Power-to-Melt Uncertainties
The results of the analysis outlined above are suninarized in Tables 3.12
through 3.15. In Table 3.12, the derivatives of the power-to-melt with respectto the different parameters are calculated. In Table 3.13, these are used toconvert design uncertainties into uncertainties on power-to-melt which are thenstatistically contined.
The uncertainty on melting point due to extrapolation to a Pu enrichmentdifferent from P19/P20 is given in Table 3.14. The nominal LIFE _[I run isused to find the effect of a change in melting point on power-to-melt. Thisis used to convert the uncertainty of melting point into an uncertainty onpower-to-melt.
In Table 3.15, the uncertainties from the measured power-to-melt (converted to
reactor power units), the extrapolation to CRBRP conditions, and the CRBRP desion
uncertainties are statistically combined, and the design criterion for meltingis examined to sea if it is fulfilled for the programmed reactor startup chosen.
1630 08975

4WARD-0 0050-
"'
ret t n
P. The positive margin at all times shows that the power-to-melt criterion is metby the selected programed startup.
Applying Equation (2.8) to take into account the number of data points used in
obtaining o 19/P20 and a~ pace does not significantly affect the results.P s
1630 090.
\
C'
76

WARD-D*0050 1'
.,
REV 2 1'
r'
TABLE 3.12
SENSITIVITY OF POWER-TO-MELT TO DESIGN UNCERTAINTIES
CHANGE IN POWER-TO-MELT FOR ONE PERCENTCHANGE IN DESIGN UNCERTAINTY
[ ART 04/a(%xi nTIME' t X: p ,) D D er Thrs. REPOW j p pgj clad clad
8 0.7 .0040 .112 .098 .0107 .00092
58 0.9 .0017 .043 .062 .0027 .00069
108 1.0 .0051 .051 .060 .0093 .00081
158 1.0 .0051 - 050- .060 .010 .00081.
O
1630 091*Derivative taken from Figure 3.20.
.
77
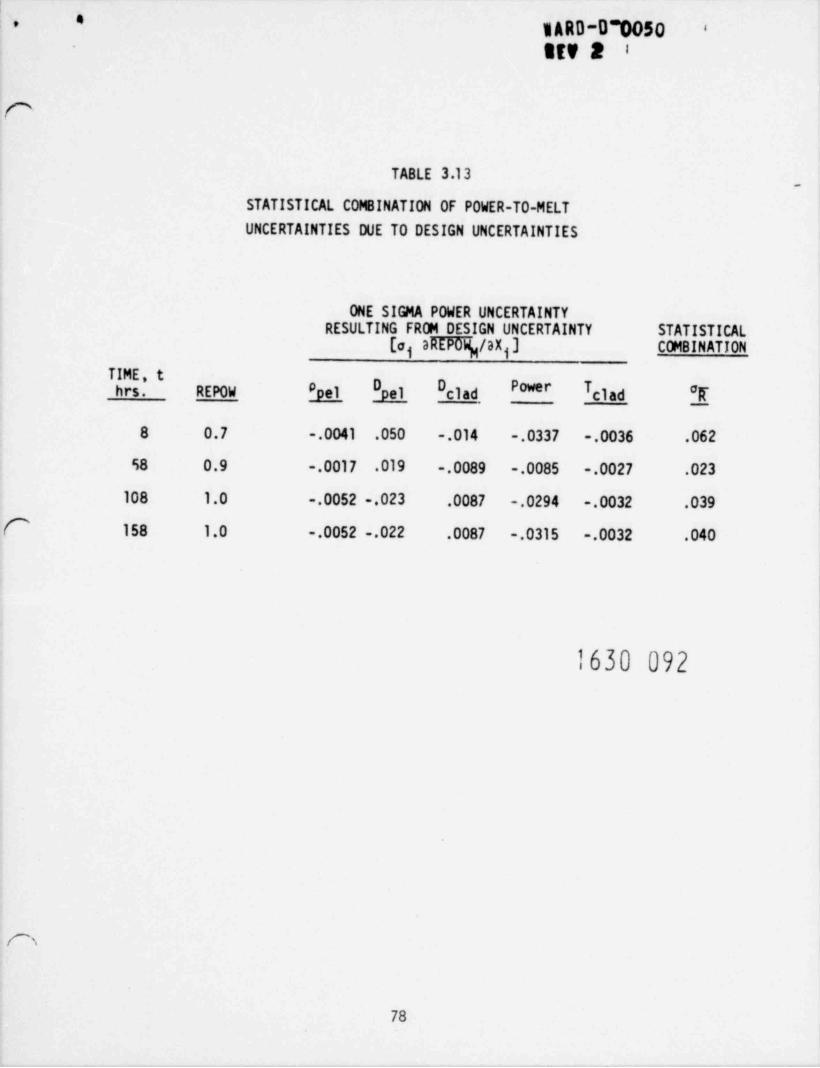
*1ARD-0 1050. '
- StV 2 8
C
TABLE 3.13,
STATISTICAL COMBINATION OF POWER-TO-MELT
UNCERTAINTIES DUE TO DESIGN UNCERTAINTIES
ONE SIGMA POWER UNCERTAINTYRESULTING FROM DESIGN UNCERTAINTY STATISTICAL
[aj aRU DIT/aX ] COMBINATIONM $
TIME * tD D Power Thrs. REPOW Ppel pgj clad clad 'E
8 0.7 .0041 .050 .014 .0337 .0036 .062
85 8 0.9 .0017 .019 .0089 .0085 .0027 .023
108 1.0 .0052 023 .0087 .0294 .0032 .039
C 158 1.0 .0052 .022 .0087 .0315 .0032 .040
1630 092
m
78
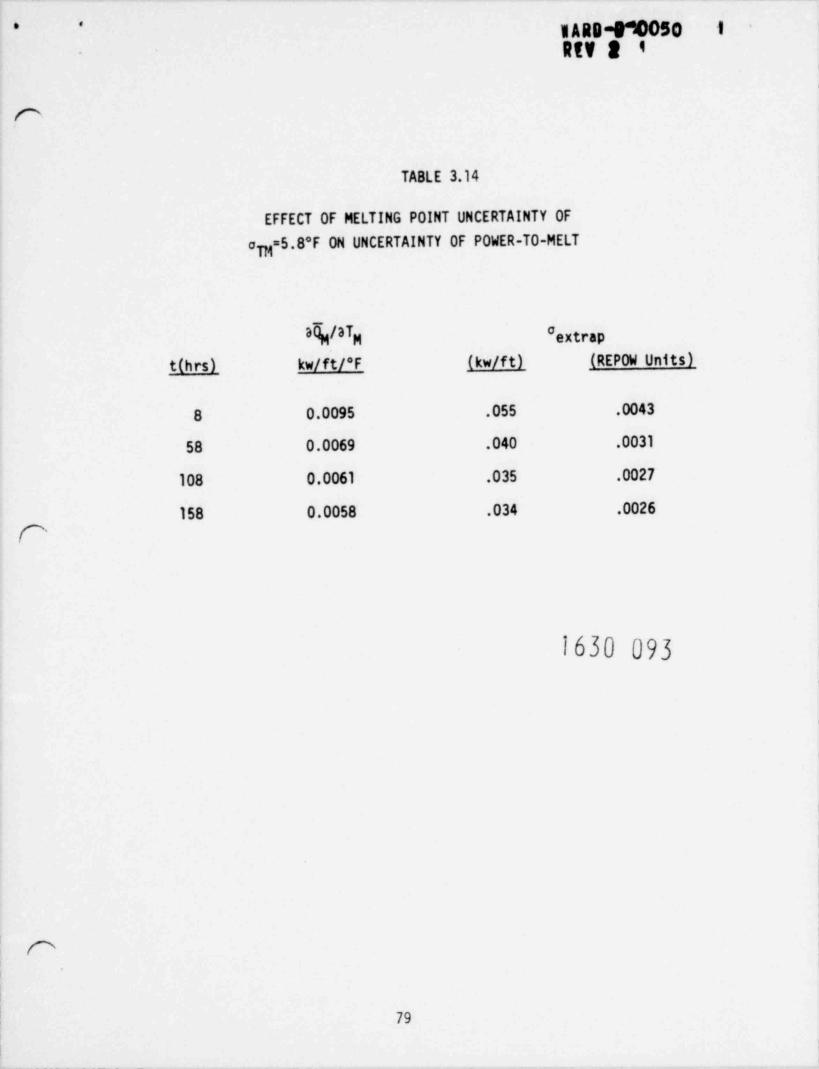
1ARD-9*4050 1* ' -
RtV 2 9
r
TABLE 3.14
EFFECT OF MELTING POINT UNCERTAINTY OF
o (5.8'F ON UNCERTAINTY OF POWER-TO-MELTp
3%/aTg extrapa
t(hrs) kw/ft/'F (kw/ft) (REPOW Units)
8 0.0095 .055 .0043
58 0.0069 .040 .0031
108 0.0061 .035 .0027
158 0.0058 .034 .0026
0
1630 093
o
79
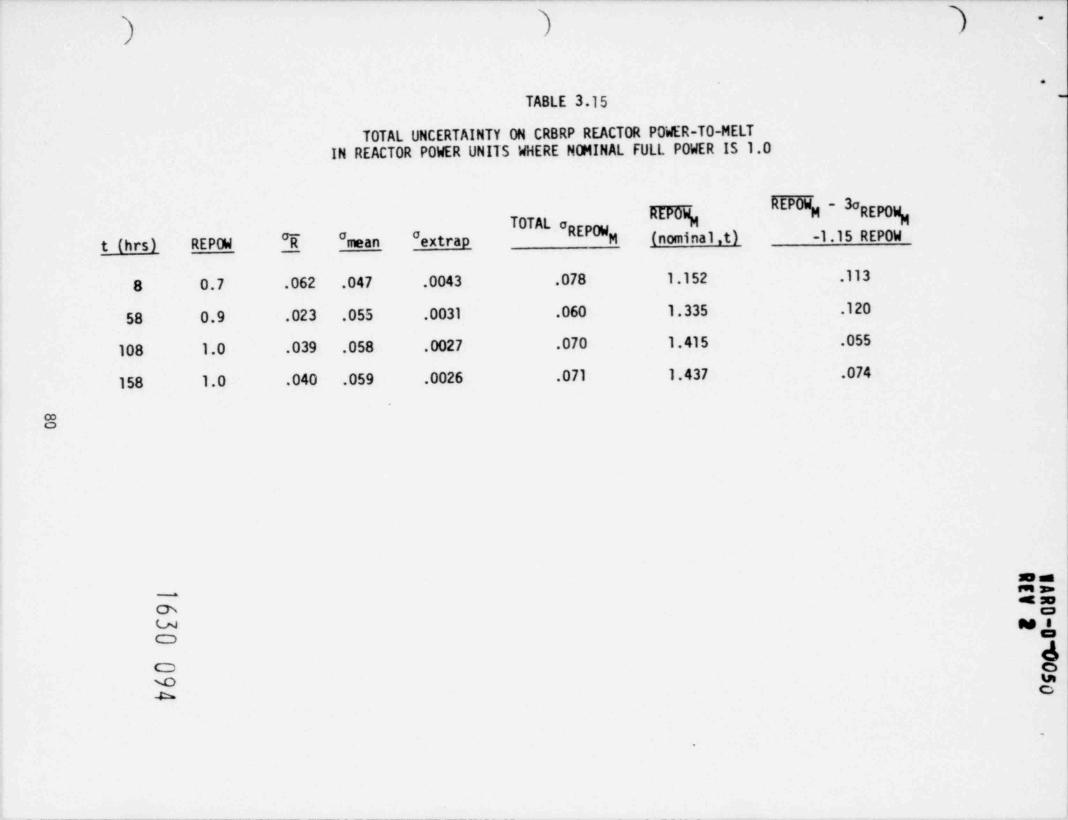
).
TABLE 3.15
TOTAL UNCERTAINTY ON CRBRP REACTOR POWER-TO-MELTIN REACTOR POWER UNITS WHERE NOMINAL FULL POWER IS 1.0
POW - 3aN M REPOW
TOTAL o M gREPOW
t (hrs) REPOW _T 'mean "extrap M (nominal,t) -1.15 REPOW
8 0.7 .062 .047 .0043 .078 1.152 .113
58 0.9 .023 .055 .0031 .060 1.335 .120
108 1.0 .039 .058 .0027 .070 1.415 .055
158 1.0 .040 .059 .0026 .071 1.437 .074
8
NC- ==& GU NfO da oe C
.
I ARD-D-0050 '1''
RF.V 2 1'
3.3 Coolant Exit Mixed Mean Hot Spot Factors for Fuel Assemblies
e This Section discusses the hot spot factors which apply to the average coolanttemperature (or enthalpy) rise for a single assembly.
Essentially, the same individual factors discussed in Section 3.1 for theenthalpy rise of the hot rod contribute te the coolant exit temperature; how-ever, integrated values over the assembly must be considered for the at.semblymixed mean exit.
The hot spot factors for evaluation of CRBRP fuel assemblies mixed mean exittemperature are presented in Tables 6.2A and 6.2B.
3.4 Fission Gas Plenum Pressure Uncertainty Factors for Fuel Assemblies
This Section discusses the uncertainties which apply to calculations of thefuel rod fission gas plenum pressure. The fission gas plenum pressure iscalculated through the perfect gas law:
p = nRT/V
C and consequently, depends on uncertainties affecting the rated value of:
e plenum volume
e plenum temperaturee amount of gas released to the plenum, which depends on burnup
(i.e., amount of gas produced) and fractional release.
The fission gas release model, its calibration against experimental data fromirradiation of mixed oxide fuels in EBR-II and the associated uncertaintyanalysis will be documented in a separate report for the FSAR.
With regard to plenum volume, the minimum volume considering all the geometricaltolerances is conservatively assumed for all plenum pressure calculations.
Finally, an uncertainty analysis of the various factors contributing to theplenum temperature and burnup w s conducted. Hot spot factors are reported
in Tables 6.3A and 6.38. Since the analysis is used for fuel lifetime calculations,the hot channel factors are evaluated for plant expected operatirg conditions.
C'Essentially, the same individual factors discussed in Section 3.1 for tneenthalpy rise of the hot rod are considered, keeping in mind that for plenum
1630 09581

1ARD-D-005b 't' '
- REV 2 1'
pressure calculations integrated values over the rod length and assemblyresidence time must be considered. The various subfactors are discussed inthe following.
3.4.1 Power Level Measurement and Control System Dead Band
The power measurement bounding uncertainty including calorimetric powermeasurement error, setting instrumentation error and drift in instrumentation
and electronics is 1.65% (2o). This appears in Table 6.3A as a 1.025 (3o)factor on burnup. The temperature effect appears as part of the reactor Pand inlet temperature variation factor.
The integrated effect of the 1 2% control system dead band over the assemblylifetime is estimated to be zero. The control rod stop which limits thecombined power level and control dead band uncertainty to a maximum of 13%
will conservatively be neglected.
3.4.2 Flow Distribution Calculational Uncertainty
Two fuel assembly analyses were performed using COTEC with different mixing
parameters. These results showed the uncertainty factor on coolant temperaturerise in the core region to be greater than the uncertainty on average plenumtemperature. It will be conservatively assumed that the factor for theplenum temperature is equal to that for the core region as discussed inSection 3.1.6.
3.4.3 Subchannel Flow Area
The uncertainty will be less than that in the core region as discussed inSection 3.1.8 because the gas plenum temperature is the average of the sixneighboring subchannels and because temperature uncertainties in the coreregion are reduced by coolant mixing in the gas plenum region. However,.for
the present analysis the uncertainty will be conservatively assumed to bethe same as for the core region.
3.4.4 Remaining Factors
The remaining uncertainty factors are the same as for the hot rod, as discussed
in Section 3.1.
1630 09682

W A RD-D-00Scret t.
4.0 BLANKET ASSEMBLIES HOT SPOT FACTORS
The inner and radial blanket hot spot factors are evaluated similarly to thecorresponding fuel hot spot factors even though the actual numerical value'r.ay be different, since a different type of assembly is considered. The
detailed discussion in Section 3 is still valid and therefore, it not re-
peated here; only the major differences are discussed in this Section.
4.1 Fuel Rod Cladding and Coolant Temperatures Hot Spot Factors for BlanketAssemblies
The hot spot factors for evaluation of CRBRP inner and radial blanket as-semblies rod cladding and channel coolant temperatures are presented in Tables6.4A arp 6.4B.
4.1.1 Cladding Circumferential Temperature Variation
Analyses of the blanket rod cladding circumferential temperature variationusing the FATHOM-360 computer program showed that the hot spot factor isin the range of 3.0 to 3.3 across the film (depending upon a',semtly operatingconditions), approximately 0.6 from cladding OD to midwall and approximately0.7 from cladding OD to ID. A detailed analysis is performed for the life-time-limiting assembly in each flore zone. In addition, a 20% bounding un-certainty is applied to the deviations from the nominal case to conservativelyaccount for uncertainties rasulting from finite-difference modeling, flowdistribution uncertainties and flow mixing uncertainties.
4.1. 2 Inlet Flow Maldistribution
Inlet flow maldistribution subfactors are the same as for Fuel Assemblies(Section 3.1.5) with the following exceptions. Manufacturing tolerances(excluding the rod bundle region which is considered separately in the Sub-channel Flow Area analysis) resulted in a bounding 3a flow uncertainty of0.023 for the Radial Bianket. For the Inner Blanket, the same value was
conservatively used as for the Fuel Assemblies.
IPFM test data for Fuel Assemblies also apply for Inner Blanket Assemblies.Test data for Radial Blanket LIM's are given in Table 4.1. A statistical
analysis of the four-run average flow for e 'h LIM showed a variation of
1630 09783
WARD-D"0050 .'
REV 3 |'-
O.0294 based on 26 data points. This was increased to 0.04 on the basis ofengineering judgement to allow margin to envelope possible differences betweenhomogeneous and heterogeneous core configurations. This is considered to beconservative since based upon the observed differences between fuel assembly
and radial blanket assembly LIM flow variations in the IPFM test, heterogeneouscore radial blanket LIM's are expected to show less scatter than homogeneous
core radial blanket LIM's.
The 3a uncertainty in blanket assembly flow due to fuel assembly systematicerror interation is calculated to be 0.011 by a similar analysis to thatdiscussed in Section 3.1.5.
An additional uncertainty occurs in the Radial Blanket because the number oforifices in the LIM is varied to achieve the goal assembly pressure drop.This step-wise approximation of the pressure drop requirements results in abounding 3a flow uncertainty of 0.043.
The remaining Inlet Flow Ma1 distribution subfactors are the same as for the
Fuel Assemblies. The 3a subfactors for the Inner Blanket and the RadialBlanket are listed in Table 4.2. The overall factor calculated as the root-mean-square of the subfactors is also shown.
1630 098
84

,
WARD-D-0050i
'*
'REV 2 1
OTABLE 4.1
RESULTS OF FOUR IPFM FLOW
DISTRIBUTION TESTS AT $100% FLOW, 3 LOOPS
FLOW DEVIATION FROM AVERAGE, %
LIM RUN 1 RUN 2 RUN 3 RUN 4
D17 .62 .53 .19 .48
D12 .00 .41 .07 .52
E1 .95 .91 .84 .52
E24 -1.37 .66 -1.10 .3?
E23 1.05 .99 .95 1.70E22 1.52 1.88 2.48 1.50E21 .06 .16 .43 .42
E20 .38 .94 .23 .61
E19 1.08 .10 1.02 .22
C E18 83 .88 .80 .56
E17 .66 .49 .42 .14
E16 .67 1.44 1.53 1.94EIS 1.42 .97 .19 1.03
E14 .10 .02 .05 .29
E13 .29 .17 .03 .01
E12 -2.15 .79 .38 -1.56Ell -2.19 .89 .15 .84
E10 -1.19 .77 .63 -1.35E9 .22 .22 .18 .42
E8 .64 98 -1.61 -1.36E7 -2.65 -1.88 -1.84 -1.74E6 1.68 1.32 1.35 .93
E5 2.36 1.39 1.12 1.31
E4 .87 -1.49 -1.43 -1.22-
E3 1.77 .13 .78 1.08
E2 .02 .21 .15 .16
1630 099
0
85

WARD-0-0050>
..
REV 2
r
TABLE 4.2
BLANKET ASSEMBLY INLET FLOW MALDISTRIBUTION SUBFACTORS (3a)
Inner RadialBlanket Blanket
Hydraulic CharacteristicsSystematic 1.018 1.018
Random 1.045 1.045
Manufacturing Tolerances 1.013 1.023
Orificing Inflexibility 1.043-----
ConfigurationAmong LIM's 1.02 (33)* 1.04 (26)*
p Among Assemblies 1.024(7)* 1.024(7)*Systematic Error Interation 1.011 1.011
Overall (3o) 1.060 1.084
* Number of data points shown in parentheses.
1630 100
r-
86
1ARD-0~0050'-
REV 2 1'
4.1.3 Flow Distribution Calculational Uncertainty
The flow distribution calculational uncertainty for the blankets was based onextrapolating from the analysis for the fuel asseQ1ies (Section 3.1.6). The
value of the coefficient C in Equation (3.8) was increased to 0.6945 x 10⁻³ in-Ito account for a possible bundle size effect. The value was obtained empirically
b93 and ORNL 19-rod [6] data. The valueby interpolating between HEDL 217-rodof th? COTEC empirical cross flow parameters were determined from data from
EO-II)exra iments in diverse geometries .
The uncertainty analysis was performed as for the fuel assemblies (Section 3.1.6)and the largest hot channel factors were found to occur in the peak skew assem-blies. The value at the cladding peak temperature elevation was 1.199 (3a).This was combined with the flow split uncertainty of 1.04 (3a) for a 61-rodbundle (Section 3.1.6) to give an overall statistical uncertainty of 1.203 (30).
In addition, a direct factor of 1.03 is applied. This includes the direct flowsplit factor of 1.01 for a 61-rod bundle (by the same method as in Section3.1.6) as well as additional margin which based on previous experience withsodium heat transfer experiments in rod bundles is judged to be sufficient tocover the testing biases and uncertainties which might be uncovered duringthe heat transfer testing of a prototypic rod bundle in sodium since theblanket analysis is based on the extrapolation of non-prototypic rod bundlemixing tests.
In a recent study [39] , the flow split was measured in a nearly prototypic
blanket geometry using the isokinetic sampling technique. The ratio of in-
terior-to-average subchannel velocity at the maximum flow rate tested wasreported to be 0.88. This study is being evaluated and may require modifi-cation of the flow split used in COTEC blanket analyses and recalculation ofAFMS assemblies flow distribution and temperatures.
Test data are forthcoming which will provide a more direct measure of the codecalibration and uncertainties for the FSAR analyses (See Table 6.11). A 5:1scale test at ARD of a sector of a blanket rod bundle using air will providedetailed crossflew data. Heat transfer tests in sodium are being performed
at ARD on a prototypic blanket rod bundle covering a range of power levels,flow rates, and power skews typical of blanket operating conditions in CRBRP.
87 1630 101

IARD-0 0050 ,-.
REV 3 I
<
4.1.4 Subchannel Flow Area
COBRA IV[40] analyses, similar to those discussed in Section 3.1.8 for thefuel rod bundle, were performed for the blanket rod bundle. In addition tothe nominal case, runs were made for the cases of a) a single nested subchannel,b) the hot subchannel and three adjacent subchannels all nested, c) maximumduct ID and mininum rod and wire 00, and d) minimum duct ID.
From these results, the overall bounding 3a uncertainty in hot channel coolanttemperature rise due to uncertainties in rod, wire and duct dimensions androd spacings, and including the influence of the other subchannels, was cal-culated to be 0.053. The uncertainty was increased to 0.07 based on engineeringjudgement to account for calculational uncertainties.
This uncertainty applies at the beginning of life. The effect of irradiation-
induced swelling of rod wire and duct was analyzed for a homogeneous coreradial blanket assembly assuming maximum distortion rates and resulted in a
direct factor of 1.020 at end-of-life. Using homogeneous core fuel assemblyswelling calculations, the heterogeneous core inner blanket direct factor wasestimated to be 1.029 at end-of-life. Because of the uncertainty in extrapolat-
ing from homogeneous to heterogeneous core conditions, a direct factor of 1.05at end-of-life will be used based on engineering judgement for both inner andradial blankets until the corresponding analyses are performed for heterogeneouscore conditions which will be done for the FSAR.
1630 102
88
WARD-0 iOch-.
REV 2
4.1.5 Film Heat Transfer Coefficient
A conservative design correlation was selected in Reference 19 for the rodpitch-to-diameter ratio range 1.05 s P/D s 1.15 corresponding to that inCRBRP blanket and control assemblies. The data base is shown in Figures 4.1
to 4.3, together with the design correlation which is designed Curve 2. A
3a uncertainty of 0.21 was recommended based on the deviations of the data
points overpredicted by the correlation.
As an indication of the conservatism of the correlation, it may be noted thatin the range of interest, the correlation results in lower heat transfercoefficients than the theoretical lower limit calculated for the case ofturbulent flow through unbaffled rod bundles, under conditions of uniformheat flux at the inside surface of the cladding, with heat transfer by molecular
bconduction only through the sodium .
4.1.6 Pellet-Cladding Eccentricity
The pellet eccentricity factor was assumed the same as for the fuel assemblies.Since it differs from unity only at beginning of life, it does not significantlyaffect blanket assembly lifetime.
4.1.7 Nuclear Uncertainties
Tables 6.48 and 6.5B list the uncertainties applicable to the predictions of localand rod or assembly-integrated power uncertainties in the inner and radial
blanket assemblies. Blanket uncertainties are divided into beginning and end-
of-life values primarily as a result of the large change in isotopic fissionra tes . Values are presented for the heat flux (power density) uncertaintynear the midplane at the location of the peak linear power and near the topof the 36-inch " core" (the approximate location of the peak clad temperature),and the channel coolant uncertainty (the rod-channel integrated power uncertainty
for application to the total channel enthalpy rise and to the total rod burn-up) in Table 6.4B, and for the assembly-integrated power uncertainty (for themixed mean coolant outlet temperature) in Table 6.5B. The blanket uncertainties
have been derived to best fit the ecspective high power locations.
1630 10389
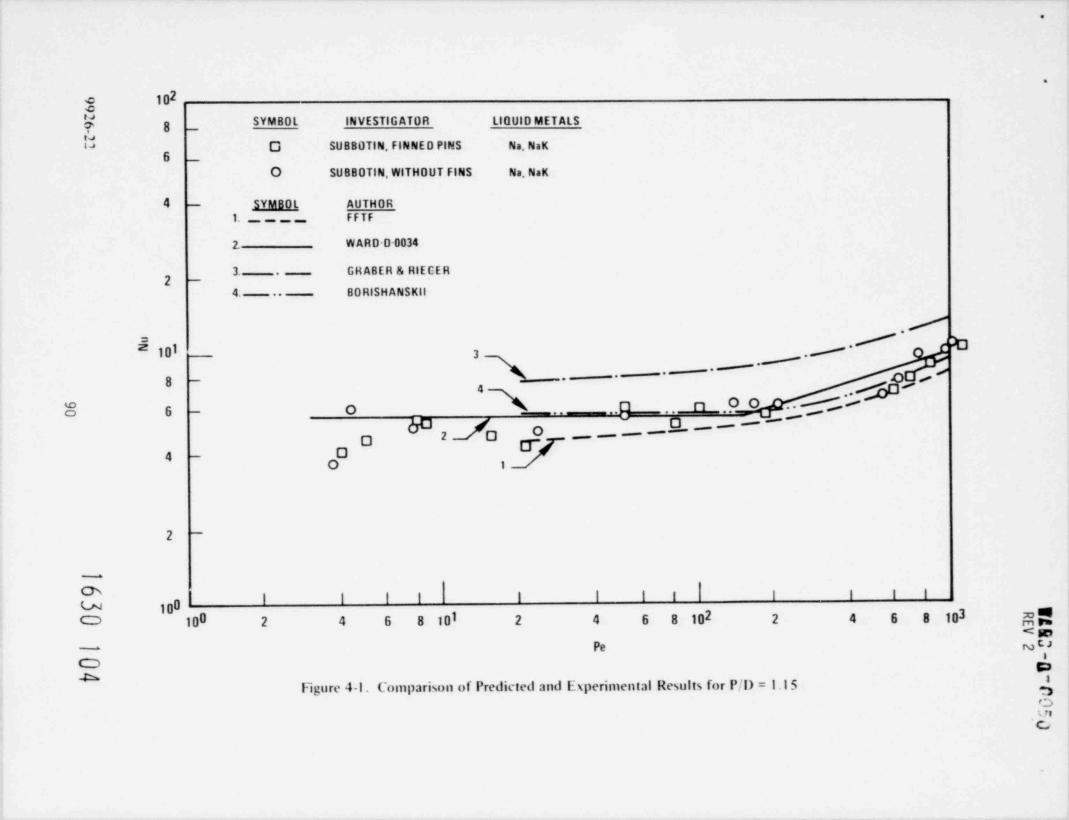
.
.
g 102
'p g _ SYMBOL INVESTIGATOR LIQUID MET ALS
!$ O SU BBOTIN, FINNE D PINS Na.NaK
O SUBBOTIN,WITHOUT FINS Na,NaK
4 - SYMBOL AUTHOR1. _ FFTF
2. WARD D 0034
3 GHABER & RIECER.
4. BORISHANSKit..
/p./ bs 10i 3
a - .-~'".#. '.o, ,.o n 00 .. g8 6 o
_
__ __9. ~ ~~ ~~~
bD 2 ja og4 -
O i
2
-
U 100O 100 2 4 6 8 101 2 4 6 8 102 2 4 6 8 103 g
<mt>Pe m-
8
O AA
Figure 4-1. Comparison of Predicted and Esperimental Results for P/D = 1.15 f>inC

.
.
c 102c'p g _ SYMBOL INVESTIG ATO R L10 Ul0 MET AL
U O BORISHANShil Na
6 -O BO RISH ANSKil Hg
4 _SYMBOL AUTHOR
1. - - - - FFTF
2. WARD-0 0034
/2 - *
3. GRABER & RIEGER.
#4. BO RISH ANSKil /. /..
,CYs
#,/-1012'
38 _
._,,,~.
'OOO O,
O OOo .. /6 -
T_ _ ___ _._ J2 O7, ' h .#..# 9O1
.
O4
---
O4 2O
O
2
100I ' ' ' ' '---^
Chu 101 2 4 6 8 102 2 4 6 8 103 2 4 6 8 104
:e :cO p* GE- "O Figure 4-2. Comparison of Predicted and Esperimental Results for P/D = 1.1
SUSO
4
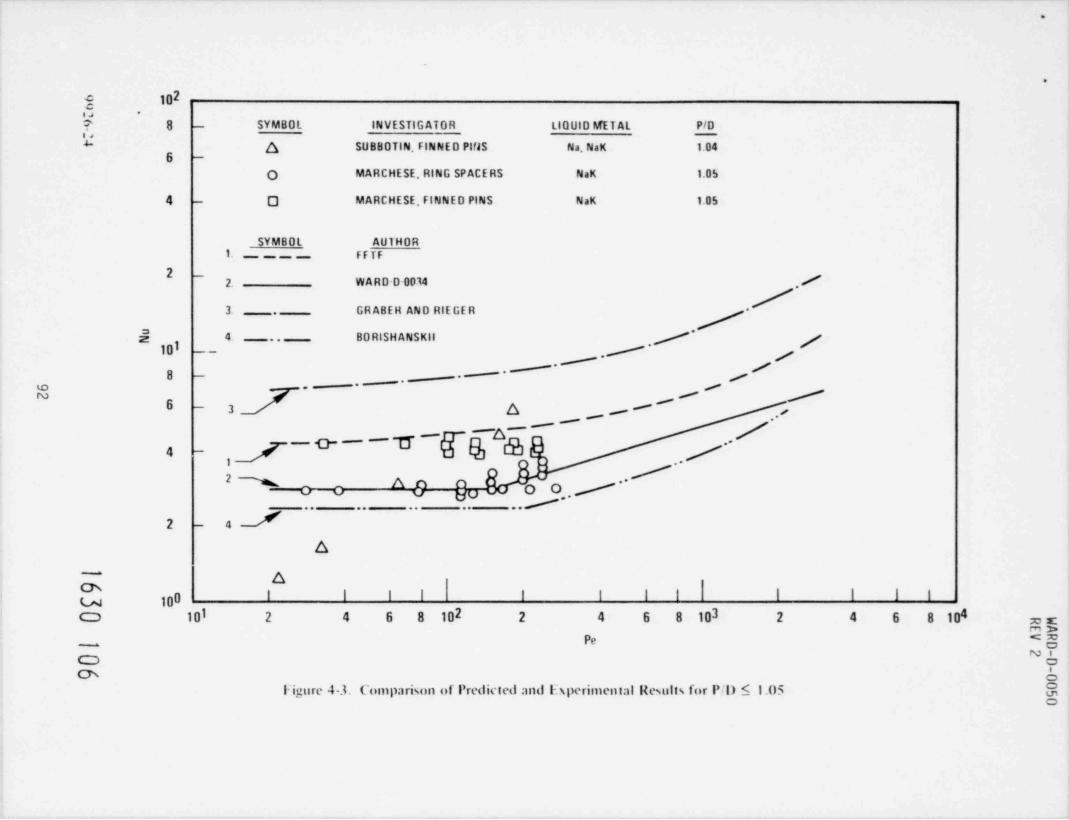
.
.
102,i, .
? 8 - SYMBOL INVESTIG ATOR LIQUID IWET AL P/DE4 ~
6 A SUBBOTIN, FINNE D PifJS Na,NaK 1.04
O MARCHESE, RING SPACERS NaK 1.05
4 O MARCHESE, FINNED PINS NaK 1.05
SY MB O L AU1 HOR1. FFTF----
-
2. W A R D-D-0014 ./3. GRABEH AND RIEGER -
.
$ 4 80 RISH ANSKil101 -- ./,/* /..
y8 - -. ~ ~ ' ' ,s-.
-
w ._
/
g~~~~ , ,
,, /~6 -
3 3 ,,
/_
4 - ]~ 00 / _, / '"'' a--c ^S Qu ../.. /
oo.. .. .. ..
2 - 4JA
~ A*u 100
I I I I I I 1 I
O 101 2 4 6 8 102 2 4 6 8 103 2 4 6 8 104 xxPe
~?-
O o& S
liigure 4-3. Comparison of Predicted and Experimental Results for P/l) $ 1.05 @o
vARD-D*0050 M--
REV 2
4.1.7.1 Experimental
Due to the somewhat limited scope of the measured blanket data in Phases A-Eof ZPPR-7, it is recommended that the experimental fission and capture rateand gamma heating uncertainty component be combined directly (rather than inquadrature as with the purely statistical uncertainties) with the other uncer-tainties in the inner blanket assemblies, which is a conservative approach.
The experimental uncertainty component is defined to be three times the roote
mean square combination of the Pu-239 fission rate, U-238 fission rate, U-238capture rate and ganma heating rate deviations, weighted by their respectivefractions of the total inner blanket power for any particular location andfor any particular time in life.
The beginning-of-life inner blanket power experimental uncertainty is domin-ated by the statistical 110% (3a) uncertainty in U-238 fission rate which con-tributes nearly 60% of the total fresh blanket power (compared to less than30% of the end-of-life power in the burned blankets). The remaining uncertaintyat the beginning-of-life results from the 15-20% uncertainty in the predictedblanket gamma heating which constitutes nearly 40% of the beginning-of-lifeblanket power and about 20% of the end-of-life blanket power. Pu-239 fissioncalculation-to-experiment ratios vary +3% to +5% (3a) at beginning and end-of-life, respectively.. In the inner blankets. In addition, the U-238 capture rate
(Pu-239 production rate) is substantially (914%) overpredicted, necessitatingthe application of an end-of-life fission rate bias of less than unity. Pu-239
fission comprises roughly 50% of the end-of-life inner blanket power. The 2%overprediction of axial peak-to-average power, as well as the s5% underpredictionof power density at the extremities of the (36") " core", are biased out of theinner blanket experimental uncertainties in Table 6.48. Combining the afore-
mentioned reaction rate anc ganma heating uncertainties with their fractionalcontributions to the total blanket power results in the time-dependent biasesand uncertainties shown in Table 6.4B. In particular, the peak power density
uncertainty is 110% at beginning-of-life and -515% at end-of-life.
1630 107
93

IARD-090050..
REV 2 1
The radial blanket calculation-to-experiment ratios of fission and capturerate data in ZPPR-7 exhibit a characteristic space dependence, falling-offof the order of 10% in the radial direction from the core-blanket interfaceout to the blanket-reflector interface. Due to the limited number of radialblanket measurements and the space-dependent nature of the data, the radialblanket experimental uncertainties are treated non-statistically for eachblanket row. The radial blanket experimental power uncertainty is derivedfrom the limits of the observed variations in blanket fission and capture rates
and gama heating. It is assumed that the observed variation limits represent1.5o limits so that 3a equivalent empirical uncertainties can be obtained bydoubling the maximum deviation from the mean of the Pu-239 fission rate,U-238 fission rate, U-238 capture rate and gamma heating rate variation limitsweighted by their respective fractions of the total blanket power at anyparticular radial location and for any particular time in life.
The beginning-of-life row 1 radial blanket power experimental uncertainty isagain dominated by the empirical +618% uncertainty in U-238 fission rate whichconstitutes approximately 60% of the fresh blanket power. In the second row,
the beginning-of-life U-238 fission rate empirical uncertainty is +23120% due to#
an apparent mis-prediction of the blanket spectral gradient. The remaining
uncertainty results from the 120% uncertainty in the blanket gamma heatingrate which constitutes about 40% of the fresh blanket power. The 2% over-
prediction of axial peak-to-average power, as well as the s5% underpredictionof the power density at the extremities of the 36 inch " core", are biased outof the radial blanket experimental uncertainties. The net resultant beginning-of-life radial blanket peak power density experimental uncertainties are
therefore +2 1 9% (row 1) and +10 1 14% (row 2).
At the end-of-life, the U-238 fission rate (15-25% of the total radial blanketpower) uncertainty increases to +13 i 12% (row 1) and +33 1 20% (row 2). TheU-238 capture rate (Pu-239 production rate) is again overpredicted (+1018%in the first row and +4 i 8% in the second row). Additionally, the end-of-life Pu-239 fission rate uncertainty is 14% (row 1) and +714% (row 2). TheU-238 capture rate (buildup) and Pu-239 fission rate uncertainties are both
p
1630 10894

WARD-0 0950...
REV 2 1'
applied to the 60-70% of the end-of-life radial blanket power attributable toPu-239 fission. Combining the Pu-239 fission rate, U-238 capture rate, U-238fission rate and gamma heating rate uncertainties with their fractional con-tributions to the total radial blanket power, and applying the aforementioned2% axial peak-to-average bias, results in the time and space-dependent experi-mental biases and uncertainties in Table 6.4B. The resulting net end-of-liferadial blanket peak power density experimental empirical uncertainty is -417%
in the first row and +518% in the second row.
4.1.7.2 Manufacturing Tolerances
The 11% blanket heavy metal theoretical density tolerance gives rise to asimilar bounding 11% uncertainty in blanket power generation. The U-235 con-
tent tolerance in the depleted uranium blanket feed material results in asmall (11%) uncertainty in the beginning-of-life blanket power, and a negligibleuncertainty in the end-of-life power where U-235 fission contributes only about2% of the total blanket power.
4.1.7.3 Modeling Uncertainties
Blanket modeling bounding uncertainties consist of power-by-rod interpolationuncertainties, intra-assembly burnup uncertainties, axial power shape andbuildup uncertainties and 3D geometric effects. The least-squares fit to
power-by-rod in the inner blankets is performed with input from 24 mesh-per-assembly 2DB calculations. Pin-by-pin burnup does not substantially increasethe peak end-of-life power in the highest power assemblies. The fitting uncer-
tainty in the inner blankets is assumed to be 15% at beginning-of-life (wherethe fresh blanket power is sensitive to both the total flux and neutron spectrumgradients), and 11% of the end-of-life (where the peak inner blanket power isrelatively flat and less fast-spectrum sensitive). The axial peak-to-averagepower shape uncertainty, deduced from RZ burnup calculations, is 11% near thecore midplane and 15% at the top of the 36 inch " core" region, primarily dueto smoothing at the end-of-life. Additional three-dimensional effects to not
contribute a substantial uncertainty in the inner blankets (il to 2%).
1630 10995
IAR0-0"0050 8
REV 2 f--
Radial blanket modeling uncertainties consist of power and burnup-by-rod
(PUMA) uncertainties, axial power and buildup uncertainties and 30 geometriceffects. The rod-fitted flux, cross-section and ganma heating and thtresulting composite power and burnup (buildup) distribution uncertaintiesare taken to be 15% at the beginning-of-life of 12 to 13% at the end-of-life
based on PUMA benchmark verification calculations.The axial power shape
uncertainty in the radial blankets is +l% at the core midplane at thebeginning-of-life,12% at the core midplane at the end-of-life based on achopped cosine approximation, and 15% at the top of 36 inch " core" regiondue to smoothing of the burnup distribution at end-of-life. The 2D powersynthesis is arranged to best predict the radial blanket power (11%) nearthe highest power locations on the sides of the assemblies closest to the
The net blanket modeling uncertainty is 17%.core.
4.1.7.s criticality and Control Rod Banking Uncertainties
Criticality and control rod banking bounding uncertainties primarily influencethe inner blanket power distributions. In addition to the effect of criticalityuncertainties on control rod insertion, and hence, on power distribution as
s
discussed earlier, the uncertainty in fuel enrichment specification resultsin a flux level uncertainty which ultimately results in a 11% plutoniumbuildup and end-of-life blanket power uncertainty.
1630 110
-
96

W A RD-0-0050 **
REV 3 1
-
,
4.2 Power-to-Melt Uncertainty Factors For Blanket Assemblies
4.2.1 Extrapolation Uncertaintyg.
The LIFE-III Code's thermal analysis has been well calibrated against low-burnup (<1.1%) fuel pin PIE measurements. Blanket pin irradiation tests are
in progress and additional tests are planned (see Table 4.3), but PIE datato verify the code are not currently available. Therefore, application ofthe LIFE-III Code to radial blanket pins involves extrapolation of fuel pindata. Three basic types of possible errors are involved.
1. Errors due to the larger diameter of radial blanket pins. i.e..if any model contains an incorrect dependency on length (e.g., thethermal-gradient dependency of pore velocity may not be linear asassumed), there will be an error which will show up in the thermalanalysis of a radial blanket pin even though the calibration correctsfor this error in fuel pins;
2. Errors due to uncertain dependencies of various fuel properties onPu0 content;
23. Errors due to extrapolation of thermal fuel pin data to higher burnups
C (%1.6%) and/or times (%13,000 hours) that characterize blanket pinswhen their power is at a maximum.
Each of these three potential error sources is evaluated below.
The present analysis uses the specifications and operating conditions ofIB/A 128, pin 27. Garmia heating was taken explicitly into account.However, the approximation was made that it all occurs in the fuel and notin the cladding and sodium. This is a conservative assumption. The pinstudied has the highest center temperature of any radial blanket pin. The
section at X/L = 0.466 was run since a preliminary study showed that thisvalue of X/L has the highest fuel center temperature. A power ramp wasimposed on the normal operating history at the end of Cycle 4, at whichtime the power is highest, to determine the power-to-melt. The results ofthe LIFE-III runs are given in Figure 4.4 for initial diametral gaps varyingfrom 4 to 9 mils. The powers-to-melt are all about 23.8 kW/ft (39% over-power) with very little dependence on initial gap size. The latest (Revision 5)
f'
1630 \\\
97

WARD-D-0050 '''
REV 2-
!
TABLE 4.3
SLANKET IRRADIATION TESTS
SCHEDULE FORDRS NO. FACILITY TEST COMPLETION PURPOSE
31.3.03 EBR-II WBA-20 9/80 Power Jump Test
WBA-21 9/83 2a Limit Test
31.3.04 FFTF WBA-40 9/87 RB/A Proof TestWBA-41 9/85 IB/A 2o Limit TestWBA-45/46 9/85 Instrumented Natural
Circulation Test;
Power-to-Mel t Test
1630 112
98

1ARD-01050-.
REV 3
** \ . _
= 40c. -
.- -
POWER TO MELT
23 -
30-
22 -
21
5>-20 gg
.$"
5 20 -goIE *2 _ _ _ _ _ _ _ _ _ _ _ _ _ _ _ _ _ _ _ _ _ _ _ _ _ _
15% OVERPOWER ABOVE NOMIN AL
19 -
,r-- 10
18 __
EOC4 FULL POWE R (3 - 0)
17- 0
-
t i I I I
164 5 6 7 8 9 10
DI AMETRAL G AP, MILS
Figure 44. Power-To-Melt Slutly. til A 128. Pin 27 X 'l = 0.466 EOC4.br Operating Conditions.
*M:6C 5
r
99

g3gD1050 i*-
cladding swelling equation was used, with a nominal r of 6.3. The NSMH[2dfuel melting temperature (solidus) was used. It takes burnup and Pu0
2e content explicitly into account. A Pu0 content at the end of Cycle 4
2of 4.5 wt.% was used. This gives a fuel melting temperature of 5057"F.
Error Source (1)
There are three possibilities for errors of this type:
(a) In addition to microscopic roughness, the surface roughness term inthe gap conductance equation includes " waviness" and " errors of form"which are likely to be proportional to the fuel pellet diameter eventhough LIFE-III assumes this roughness to be independent of pelletdiameter. To evaluate this error, it was assumed that the worst
possible case of zero microscopic fuel surface roughness appliesand that the entire fuel surface roughness is composed of wavinessand errors of form. Thus, the surface roughness term for radialblanket rods should be increased by the ratio of the blanket pelletdiameter to the feel pellet diameter (2.36). The effect of this changeon radial blanket power-to-melt was found to be a reduction from 23.58
o to 23.31 kW/ft., i.e., by 1.6% of nominal full power (16.86 kW/ft).The evidence as to the basic character of the surface roughness isin favor of it being composed of microscopic roughr.ess which isdetermined by the grinding operation (and hence independent of pelletdiameter). LITE-III uses roughness values characteristic of grindingoperations.
(b) The pore velocity equation may not be linear in thermal gradient asassumed. This is highly improbable, however, because all known
mechanisms for pore migration (surface diffusion, volume diffusion,vapor-phase transport) are all known to be linear in thermal gradient.
(c) The fuel swelling rate may not properly model changes in scale. Thus,there is an uncertainty in the state of the fuel-cladding gap. Inthe nominal case the gap is open by 0.17 mils (radial) at the startof the power ramp (at the end of Cycle 4). Because of uncertainty,however, the possibility of a significantly larger gap exists. Toevaluate the uncertainty in power-to-melt resulting from the uncertainty
n
1630 114100
WARD-DN0050 i'
REV 2 {-
in fuel swelling, the swelling rate was reduced by a factor of 10to represent a bcunding 3a uncertainty. This produced a start-of-jump gap of 0.60 mils, but it increased the power-to-melt to 24.1kw/ft. The reason for this result is that the fuel ran hotterduring its lifetime and consequently increased the central hole from9.4 mils to 16.2 mils.
The fuel swelling rate was then increased by a factor of 10 to causethe gap to be closed at the start of the power jump. This left the
central hole essentially unchanged and reduced the power-to-melt to
23.46 kw/ft. This sensitivity yields a bounding uncertainty of 0.71%of nominal full power. Since further fuel swelling rate increasescannot reduce the gap further, this uncertainty represents essentiallythe maximum that can be obtained.
Error Source (2)
Consider first the dependence of fuel thermal conductivity, K , on Pu0f 2
content. To take account of the lower Pu0 content (4.5% at end-of-life)2of the radial blanket pins relative to the 25% Pu0 content of the calibration
2pins, the nominal value of K was increased by 3.2% in accordance with the
7E4I3accepted dependence of K on Pu0 content. To estimate the 3a errorf 2
involved in this extrapolation to lower Pu0 content, it was assumed thst2
the 3a error in the gradient in the K vs. Pu0 function is t100%.f 2
Thus, the most negative uncertainty in K is -3.2%. This produces af
reduction in power-tc-melt of 3.1% of nominal full power.
Next, consider the dependence of gap conductance, Hg, on Pu0 content.2
There is no obvious reason why gap conductance should be dependent on Pu02
content in any but very minor ways. U0 -Pu0 hardness may be somewhat2 2
dependent on Pu0 content. However, since the stainless steel cladding is2
the softer material, the hardness of the fuel does not enter the gap conductanceequation. Pore migration velocities depend on Pu0 content by virtue of the
2different diffusivity and vapor pressure of Pu0 . The difference between2the vapor pressure of Pu0 and U0 gaseous species over solid U0 -Pu0 at
x x 2 2a given temperature is very small however. Thus, pore migration velocitiesshould be only slightly dependent on Pu0 content. This conclusion is2further supported by the fact that the rate of pore migration is controlledby the migration rate of the least-mobile species. Thus, over a wide range
I630 11510

IARD-garn50 'Tret 2 s
---
of Pu0 contents, only very little variation in pore-migration velocity is2expected. Therefore, uncertainties from this source are taken as negligibly y,
c small in this analysis.
Error Source (3)
The LIFE-III thermal analysis was calibrated and checked-out agdinst fuelpin PIE data that extended out to burnups of 1.1% and times of about 1,000hours. Radial blanket pins of interest here have peak burnups of about 1.6%and operating times of about 13,000 hours. Thus, extrapolations outsidethe calibration-checkout data base are implied by LIFE-III thermal analysesof the radial blanket pins. There are four basic extrapolations to be evaluatedhere:
(a) Melting temperature extrapolation
An uncertainty in radial blanket power-to-melt calculations arisesfrom the uncertainty in melting temperature. This uncertainty hastwo components:
(a) the uncertainty in the U0 -Pu0 solidus temperature, and2 2
(b) the uncertainty in the effect of burnup on melting temperature.The lo uncertainty values for these items are 25[42] and 24.5 C[43]-
respectively. A statistical combination of these yields a netlo uncertainty of 35 C. This temperature uncertainty translatesinto a power uncertainty of 1.05 kW/f t. (3o), i .e. , 6.2% of nominalfull power.
(b) Gap Conductance Extrapolation
Gap conductance, Hg, changes with time because the gap surface roughness,
is reduced by creep (which causes an increase in Hg.) LIFE-III doesnot model this creep-relaxation and hence predicts no increase in Hgdue purely to time. Hg does change with burnup, however, due to
(1) fission gas dilution of the plenum gas and (2) the buildup ofsolid fission products in the gap.
Fission gas dilution of the plenum gas is determined by the amount offission gas released and the initial moles of helium fill-gas. The fissiongas release model has been calibrated against fuel pins covering a widerange of burnups and times as part of the calibration of the mechanical
r
1630 116102

1ARD-0 0050 1. '
MV P
analysis of LIFE-III. However, there is some question as to the directapplicability of this model to radial blanket pins. As an estimate of the3a uncertainty associated with applying the present LIFE-III fission gasrelease model to radial blanket pins, the nominal fission gas release ratewas decreased by a factor of 100. This reduced the overall fission gasrelease from 85 to 41% which is considered to be about as large an error
in fission gas release that differences between fuel and blanket pins couldconceivably cause. This was found to reduce the power to melt by 0.36kW/ft. i.e. by 2.13% of nominal full power (16.86 kW/ft.). The effect ofa given amount of fission gas dilution of the plenum gas on gas thermalconductivity has been accurately measured over the full range of gas compositions
b44) The small uncertainties in the Vonby Von Ubish, Hall, and Srivastav .
Ubish et al measurements are negligible in comparison with the remaininguncertainties.
The buildup of solid fission products in the fuel-cladding gar is modeledonly quasi-empirically by using what is referred to as the "CRUDFIL" factor.To simulate the burnup dependence of this factor, the rate of transfer ofsolid fission products to the gap is taken to be directly proportional tothe-rate of release of gaseous fission products from the fuel.
The in-reactor behavior of UO r UO with lower Pu0 contents (blanket fuel)2 2 2
is very similar to core fuel (s25% Pu0 -UO ). Thus, it is expected that the2 2
"CRUDFIL" factor derived from core fuel experiments should apply to blanketfuel. However, there is some uncertainty concerning the exact value.
As a bounding estimate of the 3;r uncertainty associated with this model, itis assumed that the rate of transfer of solid fission products to the gap ina radial blanket pin is only 1/4 of the nominal rate used in LIFE-III forfuel pins. The basis for this assumption is that for this and smaller values,it was found that fuel temperatures in mechanical calibration pins become sohigh, that the fuel becomes too sof t to strain the cladding or develop acenter hole as observed in the experiments. Using 1/4 the nominal CRUDFILfactor on radial blanket pin 27 of IB/A 128 is found to reduce the power-to-
:1 t from 23.58 kw/f t to 22.89 kw/f t, representing a reduction of 4.1% ofnominal full end-of-life power (16.86 kw/f t).
1630 l17103

IARD-0-0050 i'-
REV 3 f
(c) Restructuring Rate Extrapolation
Restructuring is a function only of time and temperature. The bestr single indicator of tue overall rate of restructuring is the central
hole size. The LIFE-III calculation of central hole size has beencalibrated not only against low time, low burnup pins in the thennalcalibration, but also against a wide range of burnups and times in thecalibration of the mechanical analysis. The agreement between calculationand measurement is good over a wide range of burnups (0-16.5%) andtimes (0-21,000 hours). This is shown in Figures 4.5 and 4.6. The
standard deviation for the 37 comparisons was found to be 1.7 mils.This results in a 3o uncertainty of about 5.1 mils.
To relate the uncertainty in central hole radii to a correspondingerror in power-to-melt, the power-to-melt of several high temperaturefuel pins was determined with various central holeradii obtained by varying the assumed activation energy for as-fabricatedpore migration. It was found that the power-to-melt changed by 0.06to 0.08 kW/ft per 1-mil change in central hole radius. Thus a 5.1 miluncertainty in central hole radius results in an uncertainty of 0.31to 0.41 kW/ft in power-to-melt. For a nominal full power of 13.72ckW/f t this uncertainty is equivalent to 2.3 to 3.0% of nominal fullpower. This uncertainty of 3% (3a) of nominal full power was appliedto the blanket.
(d) Thermal Conductivity Extrapolation
Fuel thermal conductivity (K ) changes with time due to fuel restructuringf
which changes the porosity. It also changes with burnup due to thebuildup of fission products within the fuel. Because of the goodcorrelation of computed and measured central hole radii over a widerange of times and burnups it is unlikely that the extrapolation of the-
porosity-dependent factor in the LIFE-III equation for K to a burnupf
of about 1.6% involves any significant error.
The effect of fission product buildup on Kf has been measured out toonly 0.16 atom percent burnup[45] No change in thermal conductivity.
#1630 118
104
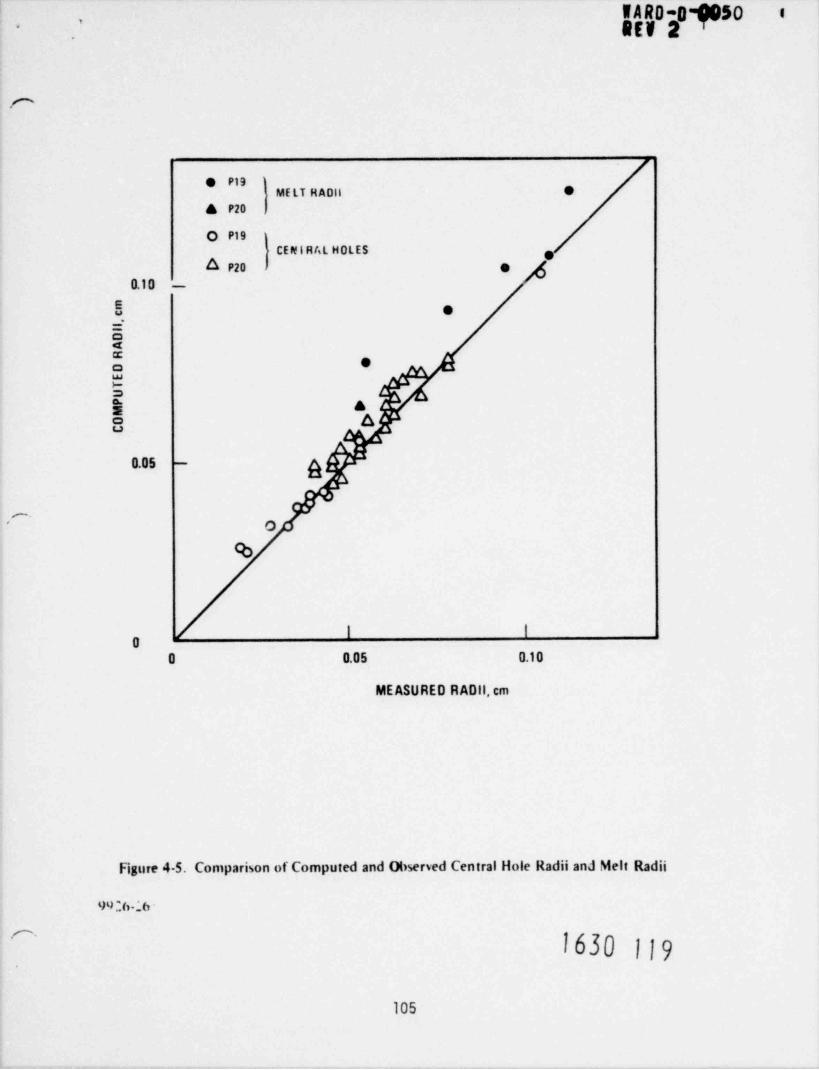
.
g'
.O
ME LT HADil 9
& P20
0 P19CENIR AL HOLES
O P20 e0.10 -
S e
Ne eaC:a
$ &S A
0.05 g
-
O'
D
00 0.05 0.10
ME ASURED R ADil, cm
Figure 4-5. Comparison of Computed and Observed Central Hole Radii and Melt Radii
99:6 _6 -
r-1630 |19
105
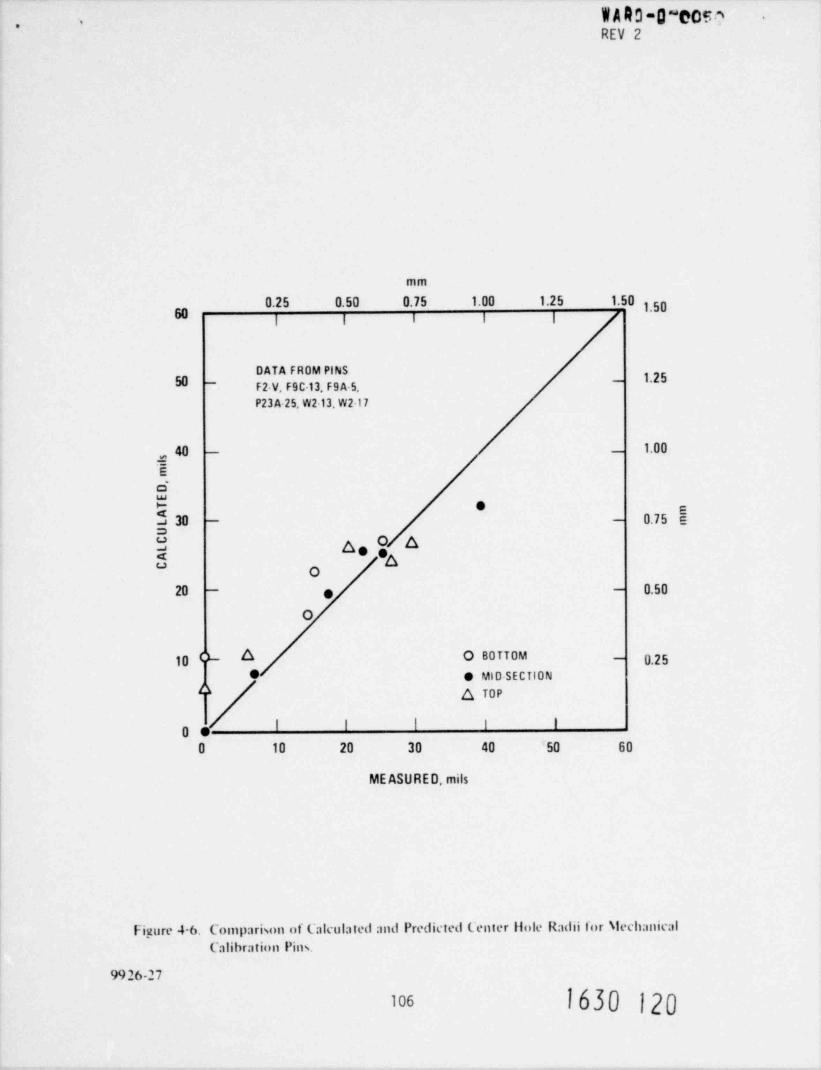
WARD-0~cosa -*
.
REV 2
mm
0.25 0.50 0.75 1.00 1.25 1.501.50
DATA FROM PINS-
F2-V, F9C 13, F9A 5
P23 A-25, W213. W2-17
40 - - 1.00
e
O,
a * eg 30 - - 0.75 e
S a, o a$ 'A
O
20 - e - 0.50
0
10 N A O BOTTOM - 0.258 e MID-SECTION
2 6 TOP
I I I I IOeO 10 20 30 40 '50 60
ME ASU RE D, mils
Figure 4-6. Comparison of Calculated and Predicted Center lloie Radii for \lechanicalCalibration Pins.
9926-27
1630 120los

g0-0 f5b :'-
was observed. For this preliminary analysis, a worst case estimatewas made by assuming that one hole percent of fission products isequivalent to one percent of porosit . In the low-porosity limit one
percent porosity changes Kf by 1.5%E O (which is about three times the
effect of Pu0 .) The porosity created by the 0.246 atoms per fission2
of Xe and Kr is already considered in the LIFE-III calculation of Kf.
This leaves 2.0 .246 = 1.754 fission product atoms per fission tobe accounted for. At a burnup of 1.6 a/o burnup this worst-case ap-proximation treatment yields a reduction in Kf of 4.2% (1.6 x 1.75 x 1.5).Such a reduction in Kf is found to reduce power-to-melt by about 4.0%in IB/A 128, pin 27. This is equivalent to a reduction of 5.6% ofnominal full power (16.86 kw/ft).
(e) Cladding Swelling
The uncertainty in the cladding swelling equation used is ex-pressed as an uncertainty in the parameter T. The empirical
worst value of 1 is 5.0 (3o), relative to a nominal (best fit)value of 6.3. A LIFE-III run with r = 5.0 and a diametral coldgap of 4 mils resulted in a reduction in power-to-melt of 2% ofnominal full power.
SUMY
As stated previously, extrapolating the LIPE-III code, which has beencalibrated against fuel pin data, to radial blanket pins involves threebasic types of uncertainties:
(I) Geometry effects;(II) Pu0 effects;
2(III) Burnup extrapolation effects
Each of these three categories has been further resolved into its primary,
components and these have been analyzed and estimates of the associated
uncertainties made. These are now summarized in Table 4.4.
1630 121
107

IARD-D-0054 1*.
4.2.2 CRBRP Blanket Rod Design Uncertainties
As had been done for the fuel rods, the uncertainties introduced by fabrication,
tolerances and irradiation uncertainties are estimated by LIFE-III runs inwhich a parameter is varied within its tolerance to see its effect on power-to-melt. Table 4.5 lists the tolerances considered. Table 4.6 shows the sensitivityof power-to-melt to variations in each parameter. These results are thenused to connect the fabrication and irradiation tolerances into uncertaintieson power-to-melt which are statistically combined to give the CRBR designcontribution to power-to-melt uncertainty, o_, which is also shown in Table 4.6.
R
4.2.3 Total Blanket Rod Uncertainty and Design Criteria
Using the same analysis procedure as for fuel, the EBR-II data base uncertainty
mean, the uncertainty due to extrapolation to CRBRP conditions, oextrap'and the design tolerance uncertainties are combined in Table 4.7 to give
the total uncertainty in blanket rod power-to-melt. REP 0N. Applicationof the design criterion of no melting at 115% of nominal f"ull power at a 3alevel of confidence shows that the design criterion is satisfied, and anadditional margin of 4.9% in power remains.
1630 122
108
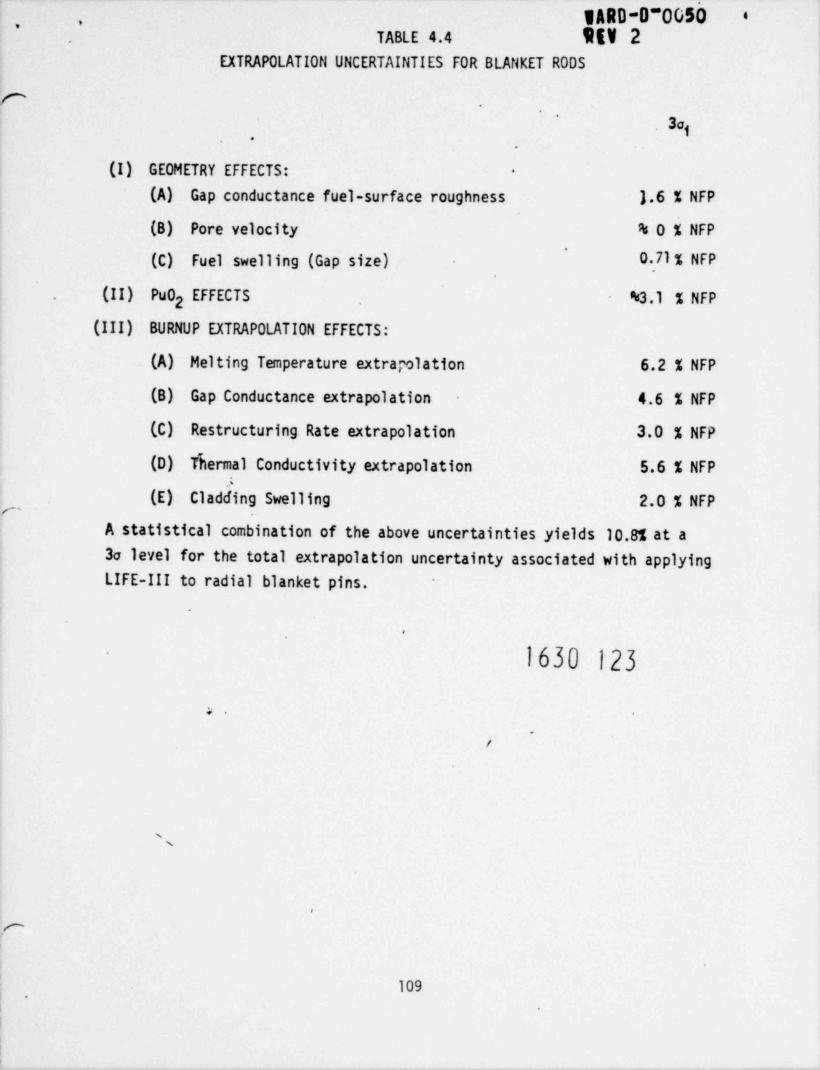
WARD-0~0050 i-.
TABLE 4.4 9EV 2EXTRAPOLATION UNCERTAINTIES FOR BLANKET RODS
r'
3aj*
.
(I) GEOMETRY EFFECTS: -
(A) Gap conductance fuel-surface roughness ).6 % NFP
(B) Pore velocity % 0 % NFP'
(C) Fuel swelling (Gap size) O.71 % NFP,
(II) Pu0 EFFECTS N3.1 % NFP2
(III) BURNUP EXTRAPOLATION EFFECTS:
(A) Melting Temperature extrapolation 6.2 % NFP
(B) Gap Conductance extrapolation 4.6 % NFP
(C) Restructuring Rate extrapolation 3.0 % NFP
(D) . T'hermal Conductivity extrapolation 5.6 % NFP
(E) CladifingSwelling 2.0 % NFPc-
A statistical combination of the above uncertainties yields 10.81 at a3o level for the total extrapolation uncertainty associated with applyingLIFE-III to radial blanket pins.
.
1630 123
.
/
's
e
109.

1ARD-D 0050- '.
SEV 2 '
TABLE 4.5
c CRBRP Blanket Rod Tolerances and UncertaintiesUncertainties represent T3a
Nominal dog
Fuel Pellet Diameter .470 i .001 in.Cladding Inside Diameter .4760 1 0005 in.Fuel Pellet Density 95.6 i 1.0%Reactor Power * 0
Cladding 0.D. TemperatureNear Midplane"* 25 F
e
* All power uncertainties included as direct factors in " nominal" rod power.** Due to thermal hydraulic uncertainties not including uncertainties
in power.
1630 124
c.
110

) 3 1 -
.
-
TABLE 4.6
Blanket Rod Sensitivities of Power-to-Melt to Design Uncertainties;Power-to-Melt Uncertainties due to Individual Design
Uncertainties; and the Statistical Combination of ThesePower-to-Melt Uncertainties
(a) Change in Power-to-Melt for one percent change in Design Uncertainty, [3REPOW /a(%X )]g $
(b) One Sigma Power Uncertainty Resulting From Design Uncertainty, [oj aREP0W /aX ] StatisticalM $
Combination
j pel pel clad Power clad pt)D D TX o
C (a) (b) (a) (b) (a) (b) (a) (b) (a) (b)m
.0019 .0011 .025 .0031 .0095 .0006 .0073 0.0 0.0 0.0 .0033
-
UCD som
$:ID~am
hafW-s8. o
M.
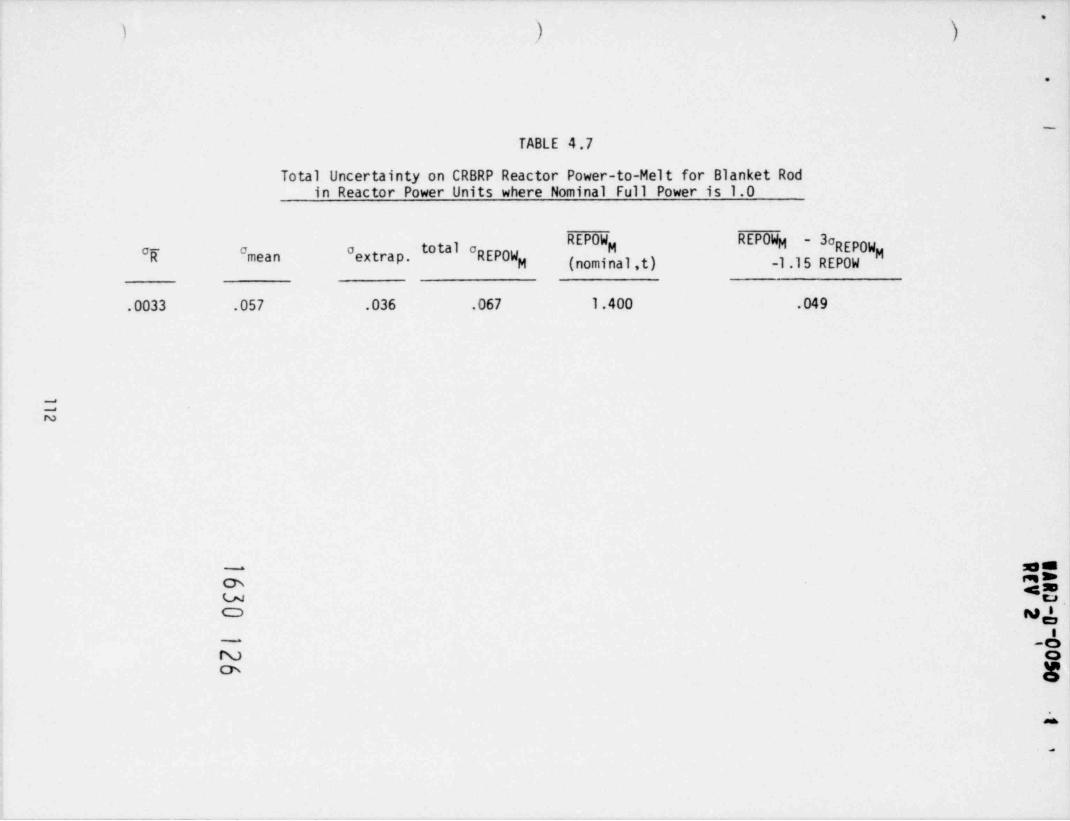
I ) )
.
_
TABLE 4.7
Total Uncertainty on CRBRP Reactor Power-to-Melt for Blanket Rodin Reactor Power Units where Nominal Full Power is 1.0
REPOW REP 0Wg -3g REP 0Wextrap. total eREPOW go ooR mean
M (nominal,t) -1.15 REPOW
.0033 .057 .036 .067 1.400 .049
%N
MM-
D 45t3w wa us
_a-
m o
.
.

.
'REV 2..
4.3 Coolant Exit Mixed Mean Hot Spot Factors for Blanket Assemblies
The blanket assemblies mixed mean hot spot factors are evaluated similarlyto the corresponding fuel assemblies factors (Section 3.3 and Tables 6.2Aand 6.28). The various subfactors are presented in Tables 6.5A and 6.5B.As previously pointed out in Section 4.1.7, different nuclear uncertaintiesmust be considered depending on the assembly radial position and time-in-life.
4.4 Fission Gas Plenum Pressure Hot Spot Factors for Blanket Assemblies
The blanket assemblies fission gas plenum pressure hot spot factors areevaluated similarly to the corresponding fuel assemblies factors (Section3.4 and Tables 6.3A and 6.3B). The remarks in Section 3.4 also applies tothis set of hot spot factors.
The various subfactors accounted for in evaluating the CRBRP blanket as-
semblies rod fission gas pressure are presented in Tables 6.6A and 6.68.
1630 127
113
gjo9050 8*
-
5.0 PRIMARY CONTROL ASSEMBLIES HOT SPOT FACTORS
Primary control assemblies (PCA) hot spot factors currently being used fordesign analyses are shown in Tables 6.7 through 6.10. These factors currently
in use were developed for the homogeneous core, and are being updated for the
heterogeneous core. Table 5.2 shows a comparison between the current uncer-
tainties and a preliminary updating, which shows that the current uncertaintiesgive overall conservative results. The PCA factors are generally more conser-
vative than those which have been adopted for fuel and blanket assemblies becauseof the less advanced status of the primary control assemblies design. Thefactors will be updated for the FSAR analyses as the design progresses, and more
data such as those from the test listed in Table 6.11 are obtained.
The primary control assemblies hot spot factors are evaluated in a similarfashion to the fuel assemblies hot spot factors discussed in Section 3, withfour exceptions. One difference is the introduction of three separate hot spotfactors to account for uncertainties in heat flux through the absorber, thecladding and the coolant. This is due to the fact that, while in the fuel and
blanket rods approximately 98% of the heat is generated in the fuel pellet,a sizeable amount (s20%) of heat is generated in the much thicker cladding ofthe control rod and in the coolant. A second major difference between control
and fuel assemblies is the introduction of a new factor to account for un-certainties in prediction of the flow split between absorber bundle andbypass; in fact, only the fraction of coolant flowing through the absorberbundle acts as an effective heat removal medium. A third difference is theinclusion of separate gap and absorber uncertainties, which were combined inthe equivalent fuel and blanket pin power-to-melt analyses. A fourth dif-ference is the need for a Lifetime Structural Calculations Uncertainty Factorwhich will be discussed in Section 5.4.
5.1 Absorber Pin Temperatures Hot Spot Factors for Primary Control Assemblies
5.1.1 Power level Measurement and Control System Dead Band
This factor is 1.03 and is identical to that for the fuel assembly as discussedin Section 3.1.1.
5.1.2 Inlet Flow Maldistribution 630 128
The coolant enthalpy rise factor is taken as a direct factor of 1.08.
An analysis similar to those for the fuel and blanket assemblies (Section 3.1.5and 4.1.3) was perfonned, and the results given in Table 5.1. The resulting
lla

'
--
IARD-D-Obbo- -
REV 2 -
n
TABLE 5.1
CONTROL ASSEMBLY INLET FLOW MALDISTRIBUTION SUBFACTORS (3o)
Hydraulic CharacteristicsSystematic 1.018
Random 1.045
Manufacturing Tolerances 1.023
ConfigurationAnong LIM's 1.02
Anong Assemblies 1.00
Systematic Error Interaction 1.011
Overall (3o) 1.058
r-
1630 129
.-
115
IARD-090050 i '*
-
REV 2 1
bounding uncertainty factor of 1.058 (3a) is less than the assumed directfacter of 1.08, and therefore the assumed factor is conservative.
More data will be forthcoming from the PCA hydraulic test (see Table 6.11)and will be used for the FSAR analyses.
5.1.3 Assembly Flow Ma1 distribution Calculational Uncertainties
A direct factor of 1.08 is taken, which based on available wire-wrapped rod
bundle data (see Sections 3.1.6 and 4.1.3), is judged to be sufficient toE473 calculations of subchannel temper-account for uncertainties in the THI-3D
ature distributions. A film coefficient uncertainty of 1.075 is conservativelyadopted, even though the correlation shows no variation with flow in thisrange (Figure 4.3). This value includes the uncertainties in inlet flow(previous Section) and bundle / bypass flow split (next Section).
5.1.4 Bundle / Bypass Flow Split
The control assembly flow splits into absorber assembly and bypass flow com-ponents; only the former contributes directly to absorber element cooling.The uncertainty in predicting the absorber assembly fraction of control as-sembly flow is estimated to be 10% on the following bases: a) the theoreticalflow split prediction shows[48] a maximum under-estimate of 6% when compared
with HEDL data; b) since the HEDL data were for a 61-rod bundle, based onengineering judgement an additional 4% was included to account for extra-polation to a 37 rod bundle. Future flow testing of the reference controlassembly (see Table 6.11) will reduce this uncertainty.
5.1.5 Cladding Circumferential Temperature Variation
The analysis of cladding circumferential temperature variation was performedby a similar method to that for the fuel pin. The factor was found to be1.286 at the cladding midwall . This was increased to 1.40 on the basis ofengineering judgement to allow for calculational uncertainties. This analysiswill be updated for the FSAR.
5.1.6 Reactor AT and Inlet Temperature Variation
Statistical factors (3a) of 1.02 for inlet temperature variation and 1.04 forreactor AT variation are assumed at Plant Expected Operating Conditions. In
addition, the assembly inlet temperature is increased by 16*F.
1630 130,,,
WARD-D-0050*.
REV 2 l'
As discussed in Sections 3.1.3 and 4.1.4, the factor should be about 1.14 (30)together with a 7.4 F (30) uncertainty in inlet temperature due to loop tem-perature imbalance. Therefore, the assumed factors are not sufficiently con-
serva tive. However, it will be shown in Section 5.1.16 that the updated totaluncertainty is less than that assumed in the analysis. Therefore, the overall
results are conservative even though the factors for reactor AT and inlettemperature variation are not sufficiently conservative.
5.1.7 Absorber Maldistributton and Conductivity
FFTF calculated the statistical hot channel factor for temperature drop throughthe pellet due to mechanical deviations to be 1.033. The uncertainty on localabsorber heat generation is equal to the uncertainty on pellet temperature dropdue to mechanical deviations. (Pellet temperature drop due to conductivityand restructuring is considered in a separate subfactor). The above uncertaintyvalue was adopted, pending further analysis for the specific conditions of CRBRPcontrol assemblies (37 vs. 61 pin design, hence larger diameter absorberpellets) which will be done for the FSAR.
A 2% uncertainty is assumed for coolant enthalpy rise since approximately20% of the coolant enthalpy rise is due to cladding gama heating and sincethe axially integrated effect of local absorber heating variation will beless than the 3.3% maximum local value.
The thermal conductivity of the B C absorber in the control assemblies was4
taken from Reference 14 and is valid for
20B-10 captures > 5 x 10 captures /cc
440 < T < 180 F
The maximum uncertainty was reported in Reference 48 to be in the range of6 to 9%. To conservatively accommodate this possible variation, a bounding un-certainty value of 10% (3o) has been incorporated in the thermal and structural
analyses of the absorber pin. Also, the use of an expression based on burnup20levels greater than 5 x 10 captures /cc provided further conservatism, since
for lower burnup, the B C thermal conductivity is much higher than that expressed4
by the equation.
Since the absorber centerline temperature is of the order of 2000 F,, aslight extrapolation of the correlation is necessary.
"71630 131
WAR 0-0-0050 t-
.
REV 2 ,
5.1.8 Wire Wrap Orientation
The maximum statistical variation in the hot channel AT is estimated to be1% based on the discussion in Section 3.1.7.
5.1.9 Subchannel Flow Area
A COBRA analysis which reduced to a minimum the area and rod to rod gapsof only the hot channel was compared to a nominal case. The result wasa hot channel subfactor of 1.059. In addition to the subfactor fordimensional variation, a value of 1.062 was included statistically to accountfor pin diametral increase consistent with FFTF analyses. The statisticallycombined value of dimensional variation and pin diametral increase is 1.086.
Since the film coefficient actually increases, a value of 1.00 is con-servatively taken for the film uncertainty.
Associated with the minimum channel area is a reduction in gamma heatconsequent to the reduced subchannel volume. For conservatism, a value
of 1.00 is assumed for coolant heat flux.
5.1.10 Film Heat Transfer Coefficient
An uncertainty factor of 1.21 for film heat transfer coefficient wasused consistently with the data and recomendations of Reference 19.
5.1.11 Pellet-Cladding Eccentricity
The phenomena accompanying pellet-cladding eccentricity in controlassembly absorber rods are similar to those discussed in Section 3.1.10for fuel rods. At the beginning of life with hot absorber pellet andcladding dimensions, the case of maximum absorber pellet to claddingeccentricity in the control assembly rods resulted in film and claddingsubfactors of 1.374 and 1.386, respectively. The film and cladding sub-factors are local and, as such, do not apply to fuel temperature calcu-lations. Fuel and gap subfactors of 1.0 were assumed for conservatism
(see discussion in Section 3.1.10).
1630 132
118

1ARD-D-0050 i''
REV 2 '
5.1.12 Cladding Thickness and Conductivity
A 1.10 uncertainty factor on irradiated cladding thermal conductivity inaddition to a 2.2% dimensional variation combines statistically to give a1.10 hot spot subfactor for cladding AT. This is conservative as discussedin Section 3.1.11.
The cladding dimensional variations result in a 1.044 subfactor for localcladding gannia heat generation and a subfactor less than 1.01 for coolantenthalpy rise since gamma heating is only about 20% of the total heating.
5.1.13 Gap Thickness and Conductivity
An empirical 10% uncertainty in thermal conductivity of the gap gas combinedstatistically with a bounding 8.1% statistical uncertainty on hot gap thick-ness results in a 1.128 value for the subfactor.
The uncertainty on hot gap thickness includes the thermal expansion uncertaintiesand cold dimensional tolerances of the cladding I.D. and the absorber pellet0.D. at beginning of life. The absorber pellets always swell faster than thecladding, so swelling, even with swelling uncertainties included, alwaysresults in gap closure and reduced gap AT. Thus, the hot spot gap AT ismaximum at the beginning of life when the fluence induced swelling is negligible.
5.1.14 Coolant Properties
The statistical coolant properties variation in the control assemblies isidentical to that discussed in Section 3.1.12 for fuel assemblies.
5.1.15 Nuclear Uncertainties
Uncertainties due to physics analysis calculational methods (15% on coolantenthalpy rise and on absorber, cladding and coolant heat generation) areapplied directly on nuclear radial peaking factors.
5.1.16 Overall Uncertainty
As an example, assume a nominal plant expected coolant temperature rise of
300 F in the hot channel. Table 5.2 shows a comparison of the coolant temper-ature rise for the cases of current uncertainties from Table 6.7 and updated
"9 1630 133

WARD-D-0050 1-
.
REV 3 f
TABLE 5.2
COMPARIS0N OF HOT SPOT COOLANT TEMPERATURES CALCULATED
USING CURRENT UNCERTAINTIES AND UPDATED UNCERTAINTIES
Assume Nominal Plant Expected Coolant AT = 300 F
Current Preliminary
Uncertainties UpdatedDirect (Table 6.7) Uncertainties
Power Level Measurement and
Control System Dead Band 1.03 1.03
Inlet Flow Ma1 distribution 1.08 1.02
Assembly Flow Maldistribution
Calculational Uncertainties 1.08 1.08
Bundle / Bypass Flow Split 1.10 1.10
Statistical (3o)
Inlet Flow Maldistribution 1.058---
Inlet Temperature Variation 1.02 1.146Reactor AT Variation 1.04jAbsorber Maldistribution
and Conductivity 1.02 1.02
Wire Wrap Orientation 1.01 1.01
Subchannel Flow Area 1.09 1.09Cladding Thickness and
Conductivity 1.01 1.01
Coolant Properties 1.01 1.017
Loop Temperature Imbalance --- 1.025
TOTAL 2o 1.413 1.402
3o 1.459 1.479
Coolant AT, F, abovenominal inlet: 2o: (1.413)(300)'= 424 (1.402)(300) = 421
Inlet: 16 ---
Total 440 421
3o: (1.459)(300) = 438 (1.479 )(300) = 444Inlet: 16 ---
Total: 454 444
1630 134

WARD-D-0050 t '*-
REV 2 8
uncertainties from the preceeding Sections. The updated inlet temperatureuncertainty of 7.4 F due to loop temperature imbalance has been converted toan equivalent uncertainty of 1.025 on coolant temperature rise. The coolanttemperature rise above nominal inlet is found to be 440 F (2a) and 454 F (3a)using current uncertainties, as compared sith 421 F (2a) and 444 F (30) usingupdated uncertainties. Therefore, the current uncertainties give overallconservative results.
5.2 Coolant Exit Mixed Mean Hot Spot Factors for Primary Control Assemblies
The control assemblies mixed mean hot spot factors are evaluated similarly tothe corresponding fuel assemblies factors previously discussed in Section 3.3.
The various subfactors are presented in Table 6.8. No flow split uncertainty
factor is considered in evaluation of the mixed mean outlet temperature, asthe flow is judged to be fully mixed at the assembly exit.
5.3 Fission Gas Plenum Pressure Hot Spot Factors for Primary Control Assemblies
Table 6.9 summarizes the hot spot factors applied in evaluation of the primarycontrol assembly absorber rod gas plenum pressure.
In addition, the minimum plenum volume and the HEDL recommended fission gas re-E493lease design correlation are conservatively considered in plenum pressure
calculations.
5.4 Primary Control Assemblies Lifetime Structural Calculations Uncertainty
Factor
In perfonning the cladding stress / strain mechanical analyses, properconsideration must be given to swelling of B C pellets and cladding
4during the absorber lifetime. Reference 49 reported that the diametralgrowth of the B C pellet is directly proportional to burnup but inversely
4proportional to the irradiation temperature. To assure conservative evalua-
tions: a) hot spot factors on burnup corresponding to the ones developed forthe plenum pressure calculations are used; b) due to the inverse relation-ship between pellet growth and temperature, the uncertainties affecting theabsorber temperature are such as to yield its minimum value.
1630 135121
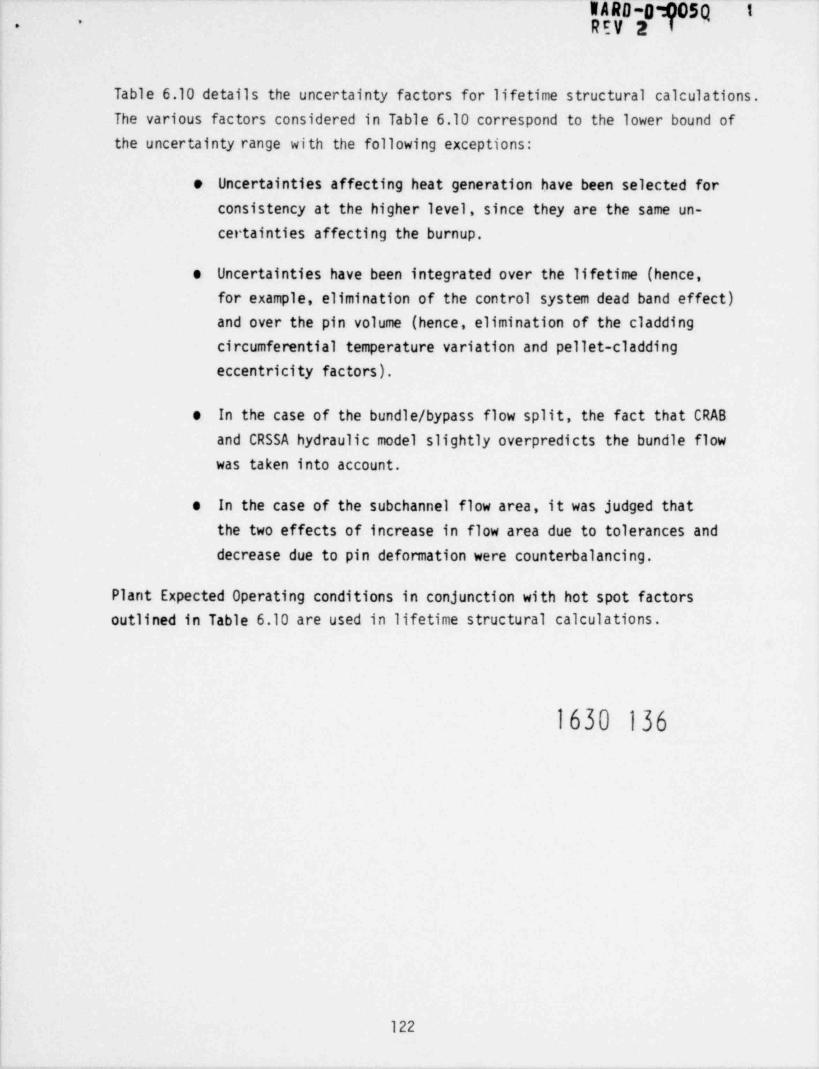
WARD-0 05q tREV 2
-.
Table 6.10 details the uncertainty factors for lifetime structural calculations.The various factors considered in Table 6.10 correspond to the lower bound ofthe uncertainty range with the following exceptions:
e Uncertainties affecting heat generation have been selected forconsistency at the higher level, since they are the same un-certainties affecting the burnup.
e Uncertainties have been integrated over the lifetime (hence,for example, elimination of the control system dead band effect)and over the pin volume (hence, elimination of the claddingcircumferential temperature variation and pellet-claddingeccentricity factors).
e In the case of the bundle / bypass flow split, the fact that CRABand CRSSA hydraulic model slightly overpredicts the bundle flowwas taken into account.
e In the case of the subchannel flow area, it was judged thatthe two effects of increase in flow area due to tolerances anddecrease due to pin deformation were counterbalancing.
Plant Expected Operating conditions in conjunction with hot spot factorsoutlined in Table 6.10 are used in lifetime structural calculations.
1630 136
122

WARD 'p050 1-
.
REV
6.0 SUMMARY OF PRELIMINARY RESULTS AND FUTURE TESTS
The hot channel factors used in calculations of the coolant temperature, clad-ding temperature, and gas plenum pressure for the CRBRP fuel, blanket, andprimary control assemblies which were discussed in the preceding sections aresummarized in Tables 6.1 A through 6.10.
For convenience, the uncertainties associated with the fuel and blanket as-
semblies, are grouped according to engineering (table numbers with the "A"
suffix) and nuclear considerations (table numbers with the "B" suffix). Ihte
that 3a statistical values are applied to the plant thermal-hydraulic designconditions when performing safety analyses. The 2e level is applied to plant
expected operating conditions when calculating parameters such as claddingtemperature and pressure, which are input to replaceable core assembly life-time analyses. The hot channel factors in this report are applicable at fullpower steady state conditions. The 3a uncertainties associated with the
thermal-hydraulic values are conservatively used as the initial conditionsfor emergency and faulted transient and safety analyses.
The hot channel factors reported in Tables 6.lA through 6.10 are consideredto be conservative. This will be further established as additional databecomes available from tests which are planned or in progress. These include:additional irradiation experiments on fuel, blanket, and primary control rods;engineering mockup critical experiments in the ZPPR; pressure drop tests offuel, blanket, and control assemblies and orifice configurations; heat transfertests on a 61 fuel rod bundle in sodium; cross-flow measurements in a 5:1 scaleblanket rod bundle sector in air; and heat transfer tests in sodium on aprototypic blanket rod bundle. These data will be included in the FSAR
analyses. A more detailed tabulation of the forthcoming T&H tests is givenin Table 6.11.
1630 137
123

TABLE 6.lA_
CRBRP FUEL ASSEMBLIES R00 TEMPERATURE ENGINEERING UNCERTAINTY FACTORS .
COOLANT FILM CLADDING
DIRECT")I
Power Level Measurement andControl System Dead Band 1.03 1.0) 1.03(1.0) 1.03(1.0)
Inlet Flow Ma1 distribution (Direct Bias) 1.02Flow Distribution Calculational > 1.006
Uncertainty (Simulation Bias) 1.03jCladding Circumferential Temperature
Varia tion 1.0(+)si.7-2.1(d) 1.0(+)s0.8(**d)@.9(e*d)Pellet-Cladding Eccentricity 1.14(*,4) 1.14(*,4)
STATISTICAL (3o)( )
Reactor AT and Inlet TemperatureVariation 1.0(sl .14)(a) 1.016
Inlet Flow Ma1 distribution 1.059% Loop Temperature Imbalance (b)* Wire Wrap Orientation 1 . 01
Subchannel Flow Area 1 .01 9 1.0Film Heat Transfer Coefficient
1.1 *)l.174(,'') 1.0(*)l.174(**+)Pellet-Cladding Eccentricity 1.0Cladding Thickness and Conductivity 1.00(c)Coolant Properties 1 .017Flow Distribution Calculational
Uncertainty (Calibration) 1.058 1.005
(*) For cladding midwall temperature calculations. $$(+ ) For fuel temperature calculations 4 88~
* (4 T Applies to BOL conditions y7(o) Nuclear Uncertainty Factors are given on Table 6.1B C
2(a) For given coolant AT, HCF (3a) = 1 + (3/AT) (0.002304aT - 0.384aT +.121)1/2 ,4(b) Maximum 3a uncertainty of 7.4 F in inlet temperature o-
W Direct factor of 1.05 included in design correlation ICo Calculated for lifetime-limiting assembly in each flow zone with FATHOM. Includes 20% uncertainty in HCF-1.e For cladding ID temperature calculations.
^NOTE: Same values of subfactors apply to both Plant T&H and Expected Operating conditions except whentwo values are given; in this case, the parenthesized values apply to Plant Expected Operatingconditions while the non-parenthesized values apply to T&H Operating conditions.
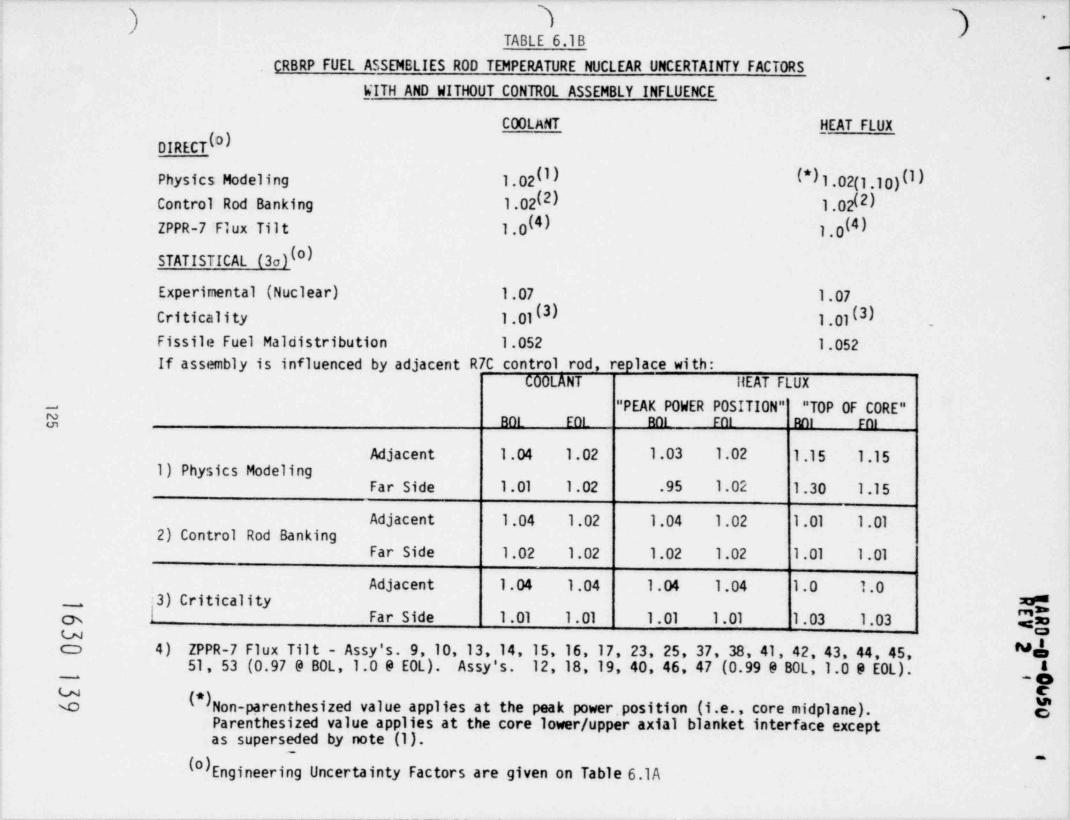
}TABLE 6.lB
CRBRP FUEL ASSEMELIES R0D TEMPERATURE NUCLEAR UNCERTAINTY FACTORS.
WITH AND WITHOUT CONTROL ASSEMBLY INFLUENCE
COOLANT HEAT FLUXIU)DIRECT
Physics Modeling 1.02(I) (*)1.02(1.10)II )Control Rod Banking 1.02(2) 1.02(2)ZPPR-7'F1ux Tilt 1.0(4) I4)1.0
STATISTICAL (3a)I )
Experimental (Nuclear) 1.07 1.07Criticali ty 1 .01 (3) 1 .01 (3) _
Fissile Fuel Ma1 distribution 1.052 1.052If assembly is influenced by adjacent R7C control rod, replace with:
COOLANT HEAT FLUX
" PEAK POWER POSITION" " TOP OF CORE"-
@ BOL E01 ROI FOl ROI FOI
Adjacent 1 .04 1.02 1.03 1.02 1.15 1.151) Physics Modeling
Far Side 1 .01 1.02 .95 1.02 1.30 1.15
Adjacent 1.04 1.02 1.04 1.02 1 .01 1 .012) Control Rod Banking
Far Side 1.02 1.02 1.02 1.02 1.01 1 .01
Adjacent 1.04 1.04 1.04 1.04 1.0 1.0I ) Criticality T:3_
Far Side 1 .01 1 . 01 1.01 1 .01 1.03 1.03 CmmU Tc3 4) ZPPR-7 Flux Til t - Assy's. 9, 10, 13, 14, 15, 16, 17, 23, 25, 37, 38, 41, 42, 43, 44, 45, eM
51, 53 (0.97 @ BOL,1.0 0 E0L). Assy's. 12,18,19, 40, 46, 47 (0.99 @ BOL,1.0 9 E0L). _f(*)Non-parenthesized value applies at the peak power. position (i.e., core midplane). bU
e oParenthesized value applies at the core lower / upper axial blanket interface exceptas superseded by note (1).
I ) Engineering Uncertainty Factors are given on Table 6.lA
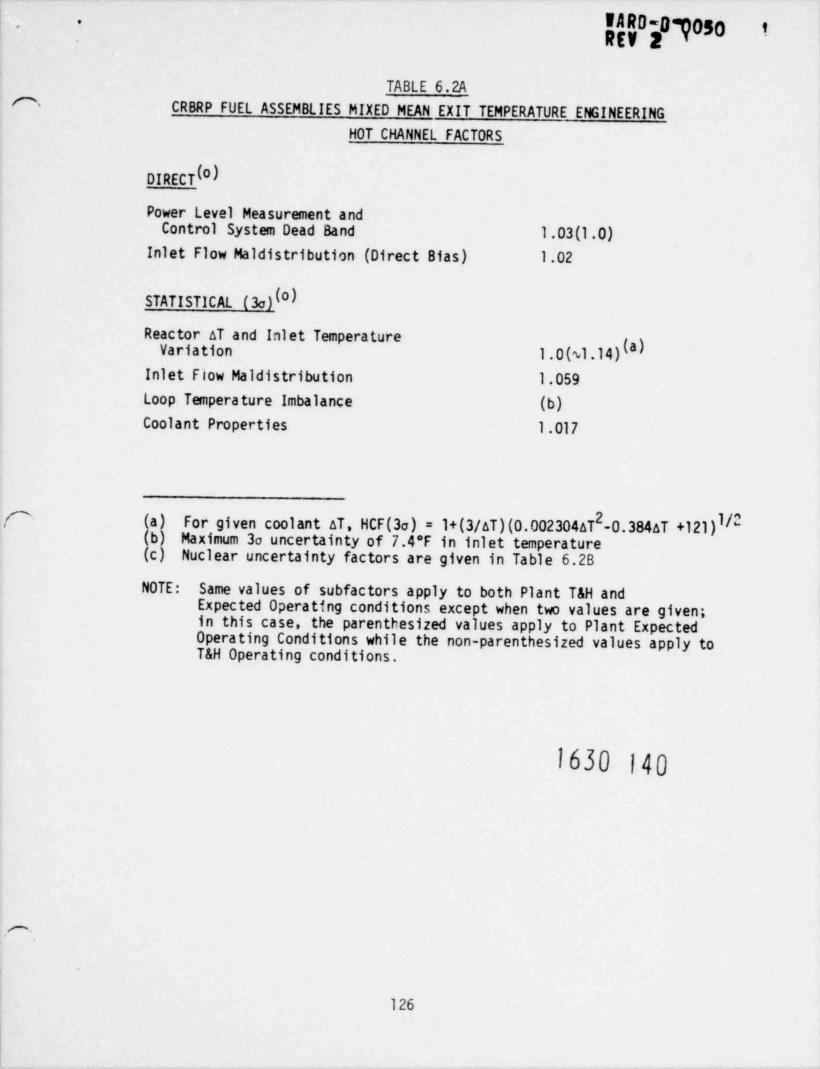
go-07050*
t.
TABLE 6.2AA-
CRBRP FUEL ASSEMBLIES MIXED MEAN EXIT TEMPERATURE ENGINEERING
HOT CHANNEL FACTORS
IU)DIRECT
Power Level Measurement andControl System Dead Band 1.03(1.0)
Inlet Flow Maldistribution (Direct Bias) 1.02
STATISTICAL (3a)( )
Reactor aT and Inlet TemperatureVariation 1.0(sl .14)(a)
Inlet Flow Maldistribution 1.059Loop Temperature Imbalance (b)Coolant Properties 1 .01 7
O (a) For given coolant AT, HCF(3a) = 1+(3/aT)(0.002304aT -0.384aT +121)l/2
(b) Maximum 3a uncertainty of 7.4*F in inlet temperature(c) Nuclear uncertainty factors are given in Table 6.2B
NOTE: Same values of subfactors apply to both Plant T&H andExpected Operating conditions except when two values are given;in this case, the parenthesized values apply to Plant ExpectedOperating Conditions while the non-parenthesized values apply toT&H Operating conditions.
1630 140
m
126
'
. .
.
TABLE 6.2B
CRBRP FUEL ASSEMBLIES MIXED MEAN EXIT TEMPERATURE NUCLEAR UNCERTAINTY FACTORS
~. _
ASSEMBLY EXIT
IO)DIRECT
Physics Modeling (*}l .01(1.02 9 BOL,1.01 9 EOL)(*)l.02(1.039BOL,1.029E0L)Control Rod Banking
ZPPR-7 Flux Tilt 1.0 (4)
STATISTICAL (3o)(0)
Experimental (Nuclear) 1.07
Criticality (*)l.01(1.02)Fissile Fuel Maldistribution 1.052
(4) ZPPR-7 Flux Tilt - Assy's. 9, 10, 13, 14, 15, 16, 17, 23, 25, 37, 38, 41, 42, 43, 44,51 5 (0.97 9 BOL,1.0 0 E0L). Assy's. 12, 18, 19, 40, 46, 47 (0.99 9 BOL,
Non-parenthesized values are applied for assemblies not adjacent to R7Ccontrol assemblies. Parenthesized values are applied for the controlassembly effect fo. assemblies adjacent to R7C control assemblies._.
*(o) Engineering uncertainty factors are given on Table 6.2A. 8gU ,
O 4 :=>
N*8-
A
x.
.
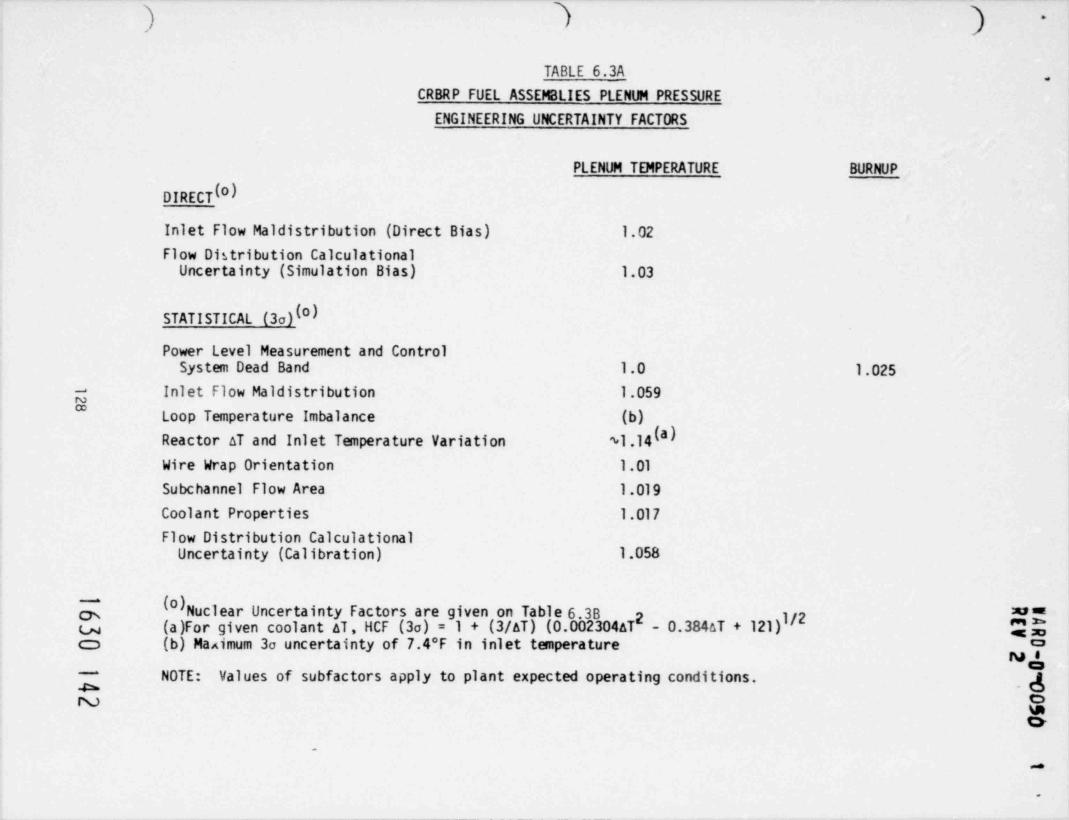
TABLE 6.3A .
CRBRP FUEL ASSEMBLIES PLENUM PRESSURE
ENGINEERING UNCEPTAINTY FACTORS
PLENUM TEMPERATURE BURNUP
IO)DIRECT
Inlet Flow Maldistribution (Direct Bias) 1.02
Flow Distribution CalculationalUncertainty (Simulation Bias) 1.03
STATISTICAL (3a)( )
Power Level Measurement and ControlSystem Dead Band 1.0 1.025
g Inlet Flow Maldistribution 1.059*
Loop Temperature Imbalance (b)Reactor AT and Inlet Temperature Variation Sl.14(a)Wire Wrap Orientation 1 .01
Subchannel Flow Area 1 .01 9
Coolant Properties 1 .01 7
Flow Distribution CalculationalUncertainty (Calibration) 1.058
$ I ) Nuclear Uncertainty Factors are given on Table 6.3B ""u (a)For given coolant AT, HCF (3o) = 1 + (3/AT) (0.002304aT - 0.384aT + 121)1/2 Q$2
cc (b) Maximum 3a uncertainty of 7.4 F in inlet temperature o
"SNOTE: Values of subfactors apply to plant expected operating conditions. ,f
N unc>
.
O
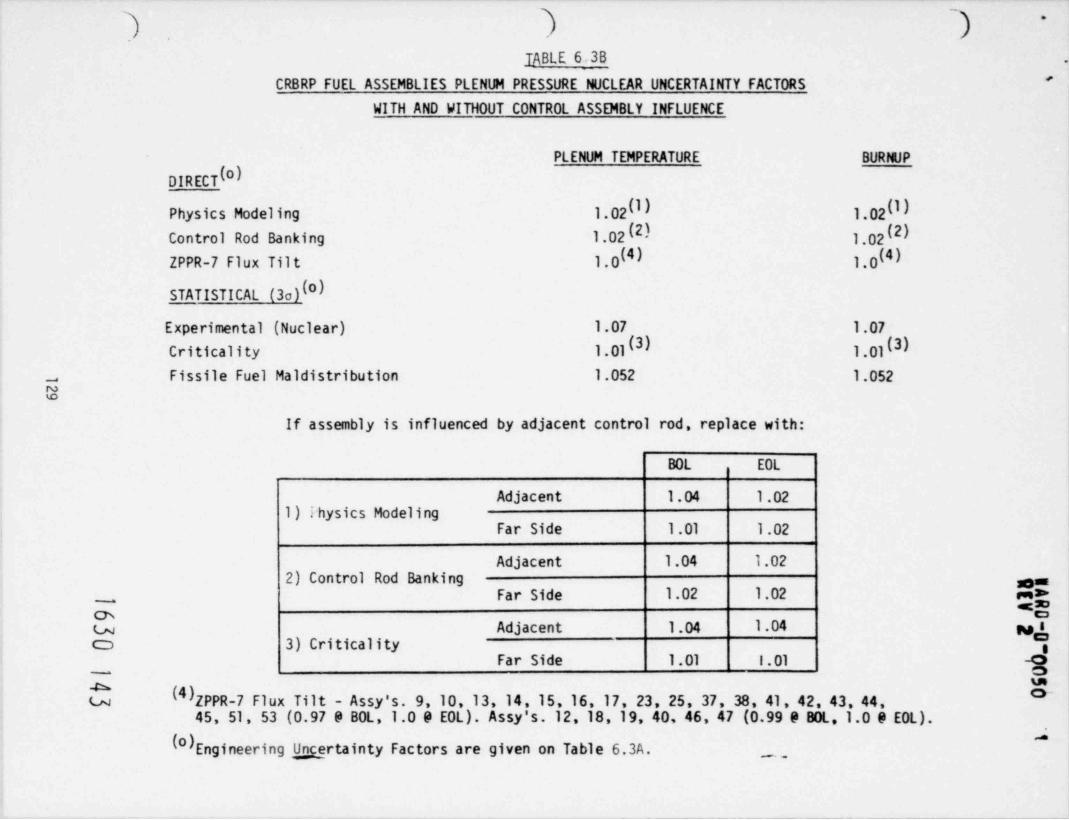
IABLE 6 3B'
CRBRP FUEL ASSEMBLIES PLENUM PRESSURE NUCLEAR UNCERTAINTY FACTORS
WITH AND WITHOUT CONTROL ASSEMBLY INFLUENCE
PLENUM TEMPERATURE BURNUP
I)DIRECT
II) II)Physics Modeling 1.02 1.02
Control Rod Banking 1.02(2) 1.02(2)I4) I4)ZPPR-7 Flux Tilt 1.0 1.0
STATISTICAL (3a)(0)
Experimental (Nuclear) 1.07 1.07
Criticality 1 .01 (3) 1.01(3)Fissile Fuel Ma1 distribution 1.052 1.052m
O
If assembly is influenced by adjacent control rod, replace with:
BOL EOL
Adjacent 1.04 1.021) ihysics Modeling
Far Side 1 .01 1.02
Adjacent 1.04 1.022) Control Rod Banking w as
Far Side 1.02 1.02 my_
ch ou Adjacent 1.04 1.04 wfc3 3) Criticality a
Far Side 1.01 1.01 -Oo-
(4)ZPPR-7 Flux Tilt - Assy's. 9, 10, 13, 14, 15, 16, 17, 23, 25, 37, 38, 41, 42, 43, 44,u45, 51, 53 (0.97 0 BOL,1.0 0 EOL). Assy's. 12,18,19, 40, 46, 47 (0.99 0 BOL.1.0 0 EOL).
I ) Engineering Umrtainty Factors are given on Table 6.3A.'
_.,
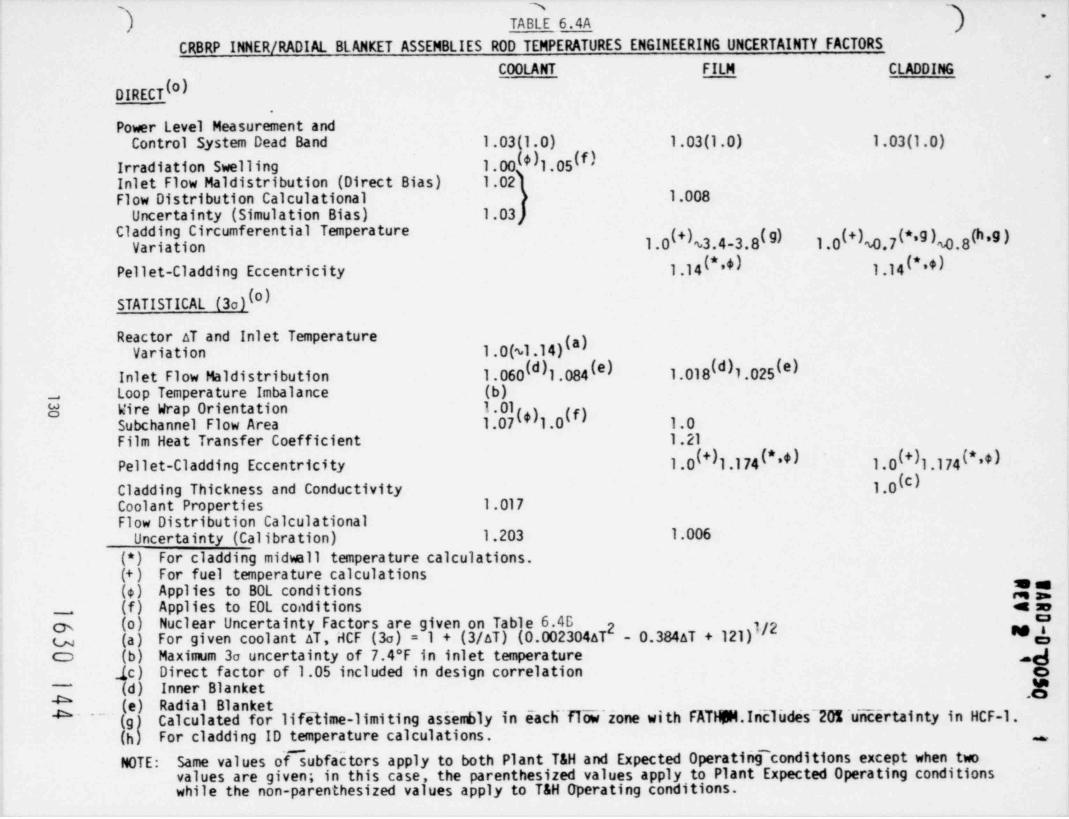
, _-
)*
TABLE 6.4A
CRBRP INNER / RADIAL BLANKET ASSEMBLIES R0D TEMPERATURES ENGINEERING UNCERTAINTY FACTORS
COOLANT FILM CLADDING
DIRECT (0)
Power Level Measurement andControl System Dead Band 1.03 1.0) 1.03(1,0) 1.03(1.0)
Irradiation Swelling 1.00 *)1.05(f)Inlet Flow Maldistribution (Direct Bias) 1.02Flow Distribution Calculational ) 1.008
Uncertainty (Simulation Bias) 1.03,C1 adding Circumferential Temperature 1.0(+)s3.4-3.8(g) 1.0(+)s0.7 (*'9 )s0.8(h '9 )VariationPellet-Cladding Eccentricity 1.14(***) 1.14(***)
STATISTICAL (3o)( )
Reactor AT and Inlet Temperature1.0(sl .14)(3)Variation
Inlet Flow Maldistribution 1.060(d )l .084 (*) 1.018(d)1.025 ')I
Loop Temperature Imbalance (b)m
1 . 018 Wire Wrap OrientationSubchannel Flow Area 1.07(,)1.0(f) 1.0Film Heat Transfer Coefficient 1 .21
Pellet-Cladding Eccentricity 1.0(+)l .174I***) 1.0(+)1.174(***)Cladding Thickness and Conductivity 1.0(c)Coolant Properties 1 .017Flow Distribution Calculational
Uncertainty (Calibration) 1.203 1.006
(*) For cladding midwall temperature calculations.(+ ) For fuel temperature calculations a se(4) Applies to BOL conditions(f) Applies to E0L conditions E$_
& (o) Nuclear Uncertainty Factors are given on Table 6.4B2 - 0.384aT + 121)I/2 Mdu (a ) For given coolant AT, HCF (3a) = 1 + (3/aT) (0.002304aT
o (b) Maximum 3a uncertainty of 7.4 F in inlet temperature Q.ic) Direct factor of 1.05 included in design correlation o
*(d) Inner Blanket-
* '
(e) Radial Blanket ~^~ ' (g) Calculated for lifelime-limiting assembly in each" flow zone with' FATHOM.InEludes 20% 'uiicErtainty in HCF-1.(h) For cladding ID temperature calculations. .
NOTE: Same values oflubfactors apply to both Plant T&H and Expected Operating' conditions except when twovalues are given; in this case, the parenthesized values apply to Plant Expected Operating conditionswhile the non-parenthesized values apply to T&H Operating conditions.

) ) ) -
.
TABLE 6.4B
CRBRP INNER / RADIAL BLANKET ASSEMBLIES R0D TEMPERATURE NUCLEAR UNCERTAINTY FACTORS
INNER BLANKET RADIAL BLANKET
Row 1 Row 2COOLANT HEAT FLUX COOLANT HEAT FLUX COOLANT HEAT FLUX
DIRECT (BOL)( }
Physics Modeling 1.06 (* )1.07 (1.11 ) 1.07 (* )1.07 (1.02 ) 1.03 (*)1.07(0.99)Control Rod Banking 1.02 1.02 1.02 1.02 1.02
(*)1.02I,1 .10(1.17) 1.13 (,)l .11 ( 1.18) 1.27 l.24(1.32)Experimental (Nuclear) 1.12 1
Criticality 1.02 1.02 ---- ---- ---- ----
Heavy Metal 1 . 01 1 .01 1 . 01 1 . 01 1 .01 1 .01
U-235 1 .01 1 .01 1.01 1 .01 1.01 1.01
Ta
DIRECT (E0L)( )
Physics Modeling 1.02 (* )l .04 (1.12) 1 .01 I*)l.07(1.05) 1 .01 I*)1.07(1.02)1.02 l.02 1.02 I,)1.02Control Rod Banking 1.02 (,)l.02
Experimental (Nuclear) 1.03 1.00(1.07) 1.05 (,)1.03(1.10) 1.15 l.13(1.21)Criticali ty 1. 01 1.01 ---- ---- ---- ----
Heavy Metal 1 .01 1 .01 1 .01 1 . 01 1 .01 1 .01
U-235 ---- ---- ---- ---- ---- ----
I*)Non-parenthesized values apply at the peak power position (i.e., near core midplane). Parenthesized*8y values apply at core upper / lower axial blanket interface extension. mg*E
,
u(0) Engineering Uncertainty Factors are given on Table 6.4A fWfCD
f-
b C
$s
- M-

*
'
TABLE 6.5A -
CRBRP INNER / RADIAL BLANKET ASSEMBLIES MIXED MEAN EXIT TEMPERATURE
ENGINEERING UNCERTAINTY FACTORS
DIRECT (0)
Power Level Measurement and ControlSystem Dead Band 1.03(1.0)
Inlet Flow Ma1 distribution (Direct Bias) 1.02Irradiation Swelling 1.00(*)1.055#)
STATISTICAL (3o)(0)
Reactor AT and Inlet Temperature Variation 1.0($1.14)(* }g Inlet Flow Ma1 distribution 1.060(c)1.084(d)"
Loop Temperature Imbalance (b)Coolant Properties 1 .01 7
(o) Nuclear Uncertainty Factors are given in Table 6.58.2(a) For given coolant AT, HCF (3o) = 1 + (3/AT) (0.002304aT - 0.384aT + 121)1/2 -
(b) Maximum 3a uncertainty of 7.4 F in inlet temperature.(c) Inner Blanket(d) Radial Blanket(e) Applies to BOL conditions(f) Applies to E0L conditions
~
m5".c :o&w caO
NOTE: Same values of subfactors apply to both plant T&H and expected "tboperating conditions except when two values are given; in this _f___.
case, the parenthesized values apply to plant expected operatinga o& conditions while the non-parenthesized values apply to T&H goperating conditions.
.._ . - _._. . , d
. .
O
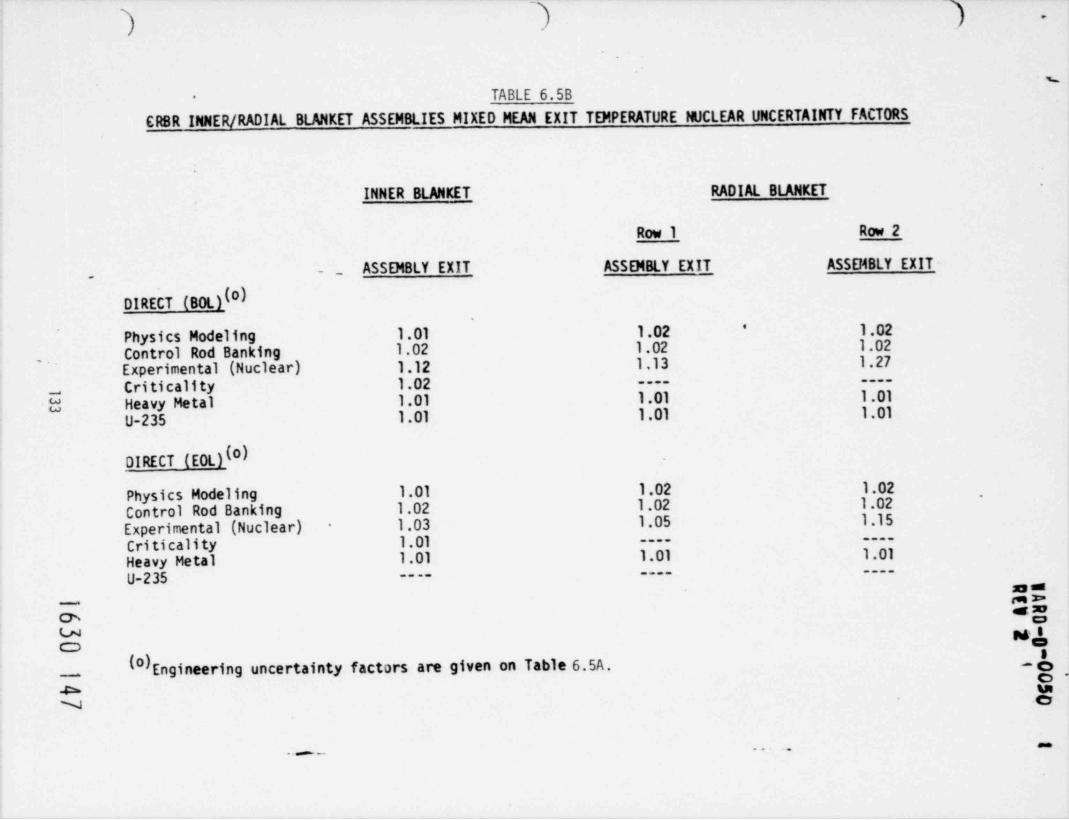
) *
s
TABLE 6.5B-
CRBR INNER / RADIAL BLANKET ASSEMBLIES MIXED MEAN EXIT TEMPERATURE NUCLEAR UNCERTAINTY FACTORS
.
INNER BLANKET _ RADIAL BLANKET
Row 1 Row 2
.ASSEMBLY EXIT ASSEMBLY EXIT ASSD48LY EXIT-
-
DIRECT (BOL)(8)
Physics Modeling 1.01 1.02 l.02'
Control Rod Banking 1.02 1.02 1.02.
Experimental (Nuclear) 1.12 1.13 1.27
Criticality 1.02 --------
O Heavy Metal 1.01 1.01 1.01-
U-235 1.01 1.01 1.01
DIRECT (E0L)(0)
Physics Modeling 1.01 1.02 1.02Control Rod Banking 1.02 1.02 1.02
'
1.03 1.05 1.15Experimental (Nuclear) -
Cri ticality 1.01 --------
Heavy Metal 1.01 1.01 1.01----
U-235--------
$.5~
g&u MdCD
I ) Engineering uncertainty factors are given on Table 6.5A. _$- O.n.N .cy
. . - -.. ..

'
TABLE 6.6A
CRBRP INNER / RADIAL BLANKET ASSEMBLIES PLENUM PRESSURE -
ENGINEERING UNCERTAINTY FACTORS
PLENUM TEMPERATURE BURNUP
DIRECT ( )
Inlet Flow Maldistribution (Direct Bias) 1.02Flow Distribution Calculational
Uncertainty (Simulation Bias) 1.03Irradiation Swelling 1.00(*}l.05II)
STATISTICAL (3o)( )
Power Level Measurement and ControlSystem Dead Band 1.0 1.025
Inlet Flow Maldistribution 1.060(c)l.084(d)m
N Loop Temperature Imbalance (b)Reactor AT and Inlet Temperature Variation sl.14(a)Wire Wrap Orientation 1.01
Subchannel Flow Area
Coolant Properties 1.017
Flow Gistribution CalculationalUncertainty (Calibration) 1.203
(o) Nuclear Uncertainty Factors are 2m (a) For given coolant AT, HCF (3o) =given on Table 6.6B1 + (3/aT) (0.002304aT - 0.384aT + 121)1/2 $$-
4:ou (b) Maximum 3a uncertainty of 7.4*F in inlet temperature yCD (c) Inner Blanket g
up
(d) Outer Blanket 4(e) Applies to BOL conditions-
eQ (f) Applies to E0L conditions gNOTE: Values of subfactors apply to plant expected operating conditions.
. .. n
a

'
.
TABLE 6.6B
CRBRP INNER / RADIAL BLANKET ASSEMEiCIES PLENUM PRESSURE NUCLEAR UNCERTAINTY FACTORS
INNER BLANKET RADIAL BLANKET
Row 1 Row 2
PLENUM TEMPERATURE BURNUP PLENUM TEMPERATURE BURNUP PLENUM TEMPERATURE BURNUP_
DIRECT (BOLL (0)
Physics Modeling 1.06 1.'06 1.07 1.07 1.'03 1.03Control Rod Banking 1.02 1.02 1.02 1.02 1.02 1.02
Experimental (Nuclear) 1.12 1.12 1.13 1.13 1.27 1.27
Criticality 1.02 1.02 ---- ---- ---- ----
- . , , Heavy Mbtal 1.01 1.01 1.01 1 .01 1.01 1.01
8 U-235 1.01 1.01 1.01 1.01 1.01 1.01-
DIRECT (EOLl )IO
Physics Modeling 1.02 1.02 1.01 1.01 1.01 1.01
Control Rod Banking 1.02 1.02 1.02 1.02 1.02 1.02
Experimental (Nuclear) 1.03 1.03 1.05 1.05 1.15 1.15.
Criticality 1.01 1.01 ---- ---- ---- ----
Heavy Metal 1.01 1.01 1.01 1.01 1.01 1.01---- ---- ---- ---- ---- ----
U-235
$$~4m&
(o)Engineeririg uncertainty factors are given on Table 6.6A $"o N
C-
A C
.

3 } =
-
TABLE 6.7
CRBRP PRIttARY CONTROL ASSEhBLIES PIN TEMPERATURES HOT CHANNEL / SPOT -FACTORS.
Maat GamerateCetltal @ Cladd%t2 ff2 Absorber Absor6er Clodrig Coelant
g(*)Power Level Measurement andCentrol Systen Dead Band 1.03 1 03 1.03 1.03-
Inlet Flow Maldistribution 1.085ebassembly Flow Maldistribution > - - -- * - -- l .07 5Calculational Uncertainties 1.08 . ,
Sundle/8ypass Flow Split 1.10,Cladding Circumferential 1.o(0) 1,o(0)Teocerature Variation (Note 1)
STATISTICAL (3o)(ol
1.02 M* 1.0 U.0Inlet Temperature Variation1.04Reactor AT Variation
Absorber Maldistribution ,
and Conductivity 1.02 1.10 1.03Wire Wrap Orientation 1.01. *
2 Subchannel Flow Area 1.09 - 1.0 1,o
1.21(* ) 1.39(*)Film Heat Transfer Coefficient .
1.37Pellet-Cladding Eccentricity .
Cladding Thickness andConductivity 1.01 1.10 1.04
Cap Thickness and Conductivity 1.13Coolant Propertjes 1.01
Oj, g !j ,*4 D j r*
* * -
, ,
(+) thcertainties due to, physics analysis calculational methods (15% on coolant enthalpy rise and on absorber cladding andcoolant h=st generation) are applied directly on nuclear radial peaking factors.,
(*)For local cladding temperature calculations. mg-
8"s ych (0)For average cladding, absorber temperature calculations. au (o) In addition. the assembly inlet temperature will be increased by 16*F. to account for primary loop temperature coolant
g :3gg
oncertainties. t- --
(e) Applies to Plant Expected Operating Conditions. J_ (t) Applies to Plant T&M Design Conditions eO (Note 1) Under the wire wrap local hot spot factors are 3.17, 1.40 and 1.20, for the claddiny 00, o
midwall and ID, respectively. Applies to the nominal temperature drop between claddingand bulk- coolant. ._
~

WARD -k054 '1'-
REV
TABLE 6.8* -
CRBRP PRIMARY CONTROL ASSEHCLIES MIXED MEAN EXIT TEMPERATURE HOTCHANNEL FACTORS
.
IDIRECT +I
Power Level Measurement andControl System Dead Band 1.03
Inlet Flow Maldistribution 1.08
STATISTICAL (3o)IO}
1.03*)l.0(*)I' Inlet Terrperature Variation
Reactor t.T Variation 1.04I4)l.0I#I~
Absorber Maldistribution 1.02
Cladding Thickness 1.01
Coolant Properties 1.01
TOTAL 2o 1.154 ($h.130 (t)1.175 ($ D .140 (t)D. 3o
(+) Uncertainties due to physics analysis calculational methods (15% for bothassembly and chimney exit) are applied directly on nuclear radial peakingfactors.
(+) Applies to Plant Expected Conditions.(t) Applies to Plant T&H Design Conditions.(o) In addition, the assembly inlet temperature will be increased by 16*F
(assembly exit) or 10"F (chimney exit), to account for primary loop tem-perature control uncertainties.
1630 151
.
%
, . ,
137,
.
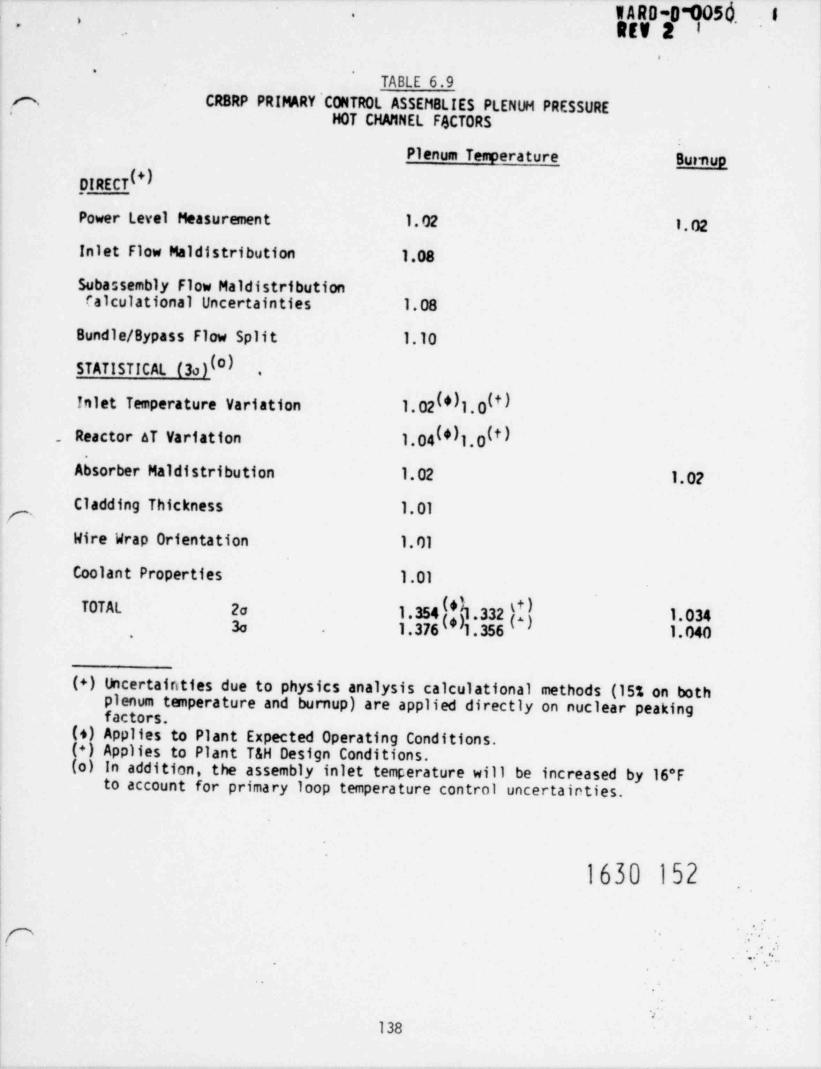
W A RD-O-005d'->
REV 2 8.
.
* '
TABLE 6.9
CRBRP PRIMARY' CONTROL ASSEN8 LIES PLENUM PRESSUREe,
;
HOT CHANNEL FSCTORS
Plenum Temperature Burnup
DIRECT +)I
Power Level Measurement 1.02 1.02
Inlet Flow Maldistribution 1.08
Subassembly Flow Ma1 distributionCalculational Uncertainties 1.08
Sundle/8ypass Flow Split 1.10
STATISTICAL (3o)IO) .
I I1.02 *)1.0 *)Inlet Temperature Variation
51.04 *3 .0It). Reactor AT Variation 1
Absorber Maldistribution 1.02 1.02
Cladding Thickness 1.01
Wire Wrap Orientation 1.01
Coolant Properties 1.01
.332ffTOTAL 2a 1.354 1.034
3a 1.376 1.356 1.040,
(+) Uncertainties due to physics analysis calculational methods (15% on bothplenum tenperature and burnup) are applied directly on nuclear peakingfactors.
(+) Applies to Plant Expected Operating Conditions.(+) Applies to Plant T&H Design Conditions.(o) In addition, the assembly inlet temperature will be increased by 16*F
to account for primary loop temperature control uncertainties.
1630 152
r .'. .
..;
.
e B
138
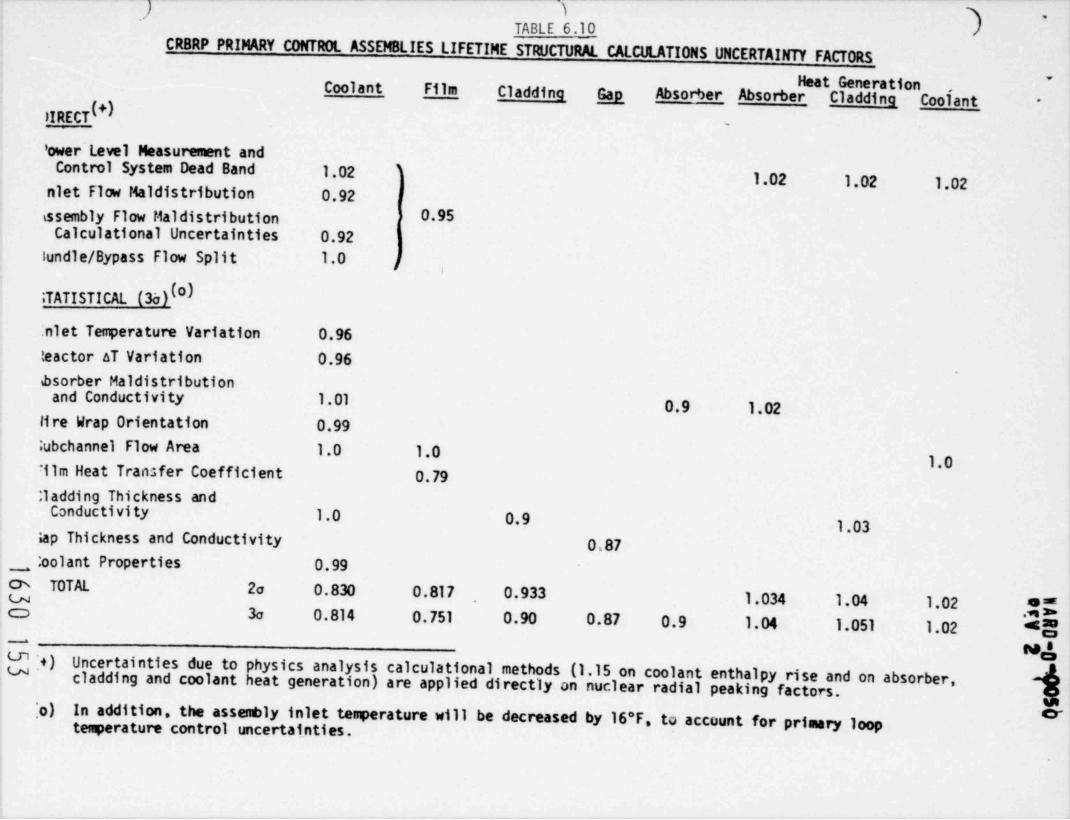
'
TABLE 6.10
CRBRP PRIMARY CONTROL ASSEMBLIES LIFETIME STRUCTURAL CALCULATIONS UNCERTAINTY FACTORS
Heat Generation~
Coolant Film Cladding Gap Absorber Absorber Cladding Cooiant -
}IIRECT -
'ower Level Measurement andControl System Dead Band 1.02 '
l.02 1.02 1.02niet Flow Ma1 distribution 0.92tssembly Flow Maldistribution y 0.95
Calculational Uncertainties 0.92lundle/ Bypass Flow Split 1.0 j
,
iTATISTICAL (3o)( )
:nlet Temperature Variation 0.96teactor aT Variation 0.96bsorber Maldistribution
and Conductivity 1.01 0.9 1.02lire Wrap Orientation 0.99;ubchannel Flow Area 1.0 1.0 1,0illm Heat Transfer Coefficient 0.79:ladding Thickness and
Conductivi ty 1.0 0.9 1.03iap Thickness and Conductivity 0.87
_ oolant Properties 0.99:
& TOTAL 2a 0.830 0.817 0.933 1.034 1.04 1.02 *"uca 3o 0.814 0.'751 0.90 0.87 0.9 1.04 1.051 1.02 *E
.Mb
_
M 'sW :+) cUncertainties due to physics analysis calculational methods (1.15 on coolant enthalpy rise and on absorber,Ucladding and coolant heat generation) are applied directly on nuclear radial peaking factors.
,,o)
In addition, the assembly inlet tegerature will be decreased by 16*F, to accuunt for primary loop o-temperature control uncertai_nties.
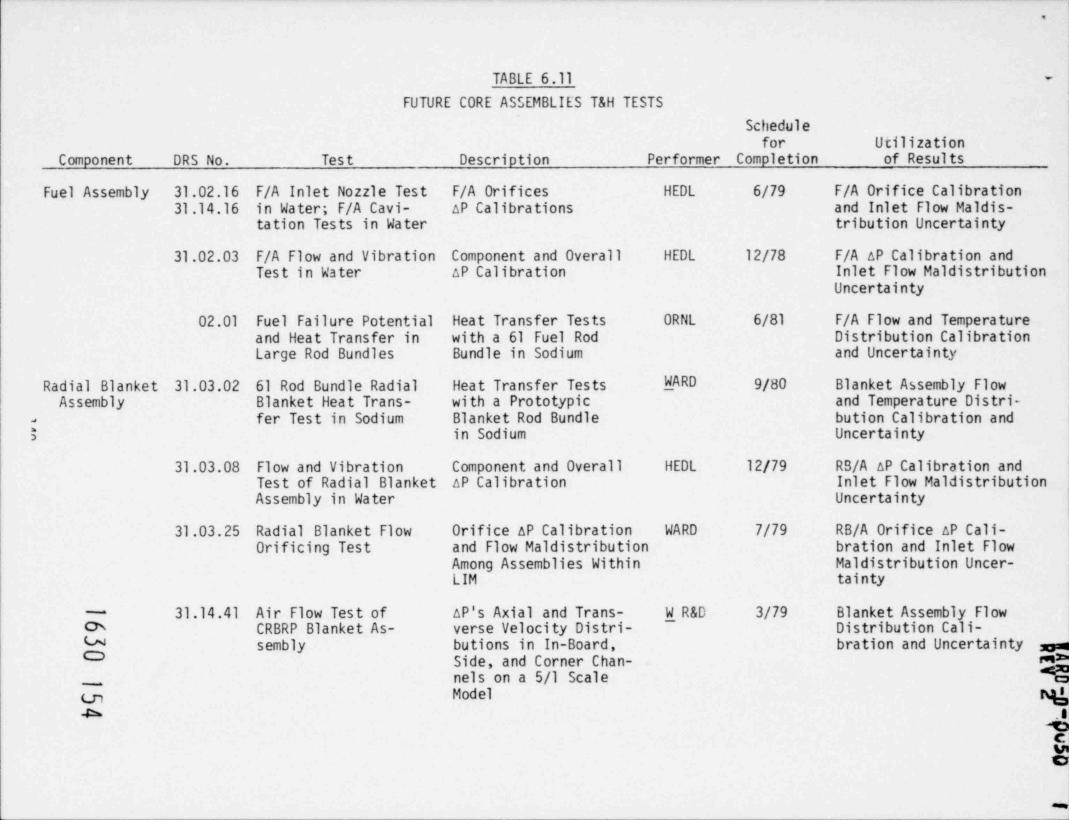
,
TABLE 6.11 .
FUTURE CORE ASSEMBLIES T&H TESTS
Schedulefor Utilization
Component DRS No. Test Description Performer Completion of Results
Fuel Assembly 31.02.16 F/A Inlet Nozzle Test F/A Orifices HEDL 6/79 F/A Orifice Calibration31.14.16 in Water; F/A Cavi- AP Calibrations and Inlet Flow Maldis-
tation Tests in Water tribution Uncertainty
31.02.03 F/A Flow and Vibration Component and Overall HEDL 12/78 F/A AP Calibration andTest in Water AP Calibration Inlet Flow Maldistribution
Uncertainty
02.01 Fuel Failure Potential Heat Transfer Tests ORNL 6/81 F/A Flow and Temperatureand Heat Transfer in with a 61 Fuel Rod Distribution CalibrationLarge Rod Bundles Bundle in Sodium and Uncertainty
Radial Blanket 31.03.02 61 Rod Bundle Radial Heat Transfer Tests WARD 9/80 Blanket Assembly FlowAssembly Blanket Heat Trans- with a Prototypic and Temperature Distri-
fer Test in Sodium Blanket Rod Bundle bution Calibration anda
5 in Sodium Uncertainty
31.03.08 Flow and Vibration Component and Overall HEDL 12/79 RS/A AP Calibration andTest of Radial Blanket AP Calibration Inlet Flow MaldistributionAssembly in Water Uncertainty
31.03.25 Radial Blanket Flow Orifice AP Calibration WARD 7/79 RB/A Orifice AP Cali-Orificing Test and Flow Maldistribution bration and Inlet Flow
Among Assemblies Within Maldistribution Uncer-LIM tainty
31.14.41 Air Flow Test of AP's Axial and Trans-C7s CRBRP Blanket As- verse Velocity Distri-
-W R&D 3/79 Blanket Assembly Flow---
Distribution Cali-l'4 sembly butions in In-Board, bration and Uncertainty sa=ac:) Side, and Corner Chan- rm2"
nels on a 5/1 Scale 'C55___
Model Qmad. .s
tcUtC7
~n

.
~
TABLE 6.11
(Continued)Schedule
for UtilizationComponent DRS_ iio. Test Description Performer Cmipletion of Results
Primary Con- 3;.08.07 Primary Control As- Component and Overall -WARD 6/79 PCA AP and Flow Splittrol Assembly sembly Hydraulic Test AP Calibration and Calibration and Uncer-
Flow Split tainty
Za
enemme
LNCD
Ln m5en <=
ts
-dSCs

EARD-0~0050 1**
REV 3 '
7.0 REFERENCES
1. M. C. Chuang, et. al ., "Three-Dimensional Thermal-Hydraulic Analysis ofWire-Wrapped Rods in Liquid-Metal Fast Breeder Reactor Core A ssemblies",Nucl. Sci. Eng. 64, pp. 244-257 (1977) .
2. R. E. Collingham, et. al. , " Development and Results of an ElectricallyHeated Seven-Pin Bundle Assembly for Thermal Hydraulic Testing in LiquidMetals," Liquid Metal Heat Transfer and Fluid Dynamics, pp. 41-49, AmericanSociety of Mechanical Engineers, New York, 19/0.
3. M. F. Fontana, et. al . , " Temperature Distribution in a 19-Rod SimulatedLMFf>R Fuel Assembly in a Hexagonal Duct (Fuel Failure Mockup Bundle 2A):Record of Experimental Data," ORNL-TM-4113, September 1973 (Availability:USD0E Technical Information Center).
4. P. M. McConnell, F. R. Fisher and R. G. White, " Inlet Plenum Feature ModelFlow Tests of the Clinch River Breeder Reactor: Addendum V Resul ts ,"HEDL-TME 76-33, March 1976 (Availability: USDOE Technical InformationCenter).
5. P. M. McConnell, " Clinch River Breeder Reactor Fuel Assembly Inlet /0utletNozzle Flow Tests," HEDL-TME 77-8, February 1977 (Availability: USDOETechnical Information Center).
6. M. H. Fontana , et. al . , " Temperature Distribution in a 19-Rod SimulatedLMFBR Fuel Assembly in a Hexagonal Duct - (Fuel Failure Mockup Bundle2 A) - Record of Experimental Data," 0RNL-TM-4113, September 1973(Availability: USD0E Technical Information Center).
7. J. J. Lorenz, T. Ginsberg, and R. A. Morris, " Experimental Mixing Studiesand Velocity Measurements with a Simulated 91-Element LMFBR Fuel Assemblj,"ANL-CT-74-09, March 1974 (Availability: USD0E Technical InformationCenter).
8. D. R. Pedersen, et. al . , " Experimental Investigation of the HydrodynamicEntrance Length and Subchannel Velocity Profiles in a 91-Element WireWrapped Subassembly," ANL/ RAS 74-5, April 1974 (Availability: USD0ETechnical Information Center).
9. R. E. Collingham, et. al . , "217-Pin Wire-Wrapped Bundle Coolant MixingTest," HEDL-TME 71-146, November 1971. R. E. Collingham, W. L. Thorne,and J. D. McCormack, " Coolant Mixing in a Fuel Pin Assembly UtilizingHelical Wire Wrap Spacers," Nucl . Eng. Des. 24, pp. 393-409 (1973).
10. R. M. Roidt, T. G. Bartholet, and L. J. Harper, " Experimental Deter-mination of Interior Subchannel Crossflow and Axial Flow in a Model ofthe Clinch River Breeder Reactor Fuel Assembly Rod Bundle with Wire-WrapSpacers ," ASME Paper 76/WA/HT-83. T. G. Bartholet, R. M. Roidt, andL. J. Harper, " Clinch River Breeder Reactor Plant; 11:1 Scale WireWrapped Rod Bundle Air Flow Tests. Interior Subchannels," CRBRP-ARD-0108,January 1977 (Availability: USD0E Technical Information Center).
142 1630 156

W A RO-0-T)050 t'
*.
'
RE4 3 I
11. K. Takanashi, K. Miyaguchi, and E. Ishibashi, " Experimental Study onCoolant Sodium Mixing Effect in "Joyo" Fuel Assembly with Spiral WireSpacer II, Result of Test of Blanket Fuel Assembly," JAPFNR-182,October 1974 (Availability: USDOE Technical Information Center).
12. E. Parzen, Modern Probability Theory and Its Applicatio_ns, J. Wiley andSons, New York, pp. 374-376, 1960.
13. Y. B. Chen, K. Ip and N. E. Todreas, " Velocity Measurements in EdgeChannels of Wire-Wrapped LMFBR Fuel Assemblies," Trans. Amer. Nucl . Soc.19_, pp. 323-324 (1974).
14. D. R. Pedersen, et. al . , " Cross Flow Mixing in a 91-Element Bundle", ANL/ RAS74-2, February 1974 (Availability: USD0E Technical Information Center).
15. A. W. Graves and I. Catton, "An Explicit Method for Predicting theThermal Performance of FBR ' dire-Wrapped Fuel Rod Assemblies," Trans. Amer.Nucl . Soc.15_, p. 404 (1972) .
16. T. Ginsberg and J. J. Lorenz, " Experimental Mixing Studies in SimulatedWire-Wrap Fuel Assemblies," Reactor Heat Transfer, pp.13-38,Gesellschaft fur Kernforschung, mbH , Karlsruhe, West Germany,1973.
17. J. J. Lorenz, et. al ., " Experimental Mixing Studies and Velocity Measure-ments with a Simulated 91-Element LMFBR Fuel Assembly," ANL-CT-74-09,March 1974 (Availability: USD0E Technical Information Center).
18. T. G. Bartholet, R. M. Roidt and J. E. Romano, " Clinch River BreederReactor Plant,11:1 Scale Wire Wrapped Rod Bundle Air Flow Test, SideSubchannels," CRBRP-ARD-0129, January 1977 (Availability: USD0E TechnicalInformation Center).
19. M. S. Kazimi, " Heat Transfer Correlation for Analysis of CRBRP Assemblies,"CRBRP-ARD-0034, November 1976 (Availability: USDOE Technical InformationCenter).
20. O. E. Dwyer and H. C. Berry, " Turbulent-Flow Heat Transfer for in-LineFlow Through Unbaffled Rod Bundles: Molecular Conduction Only," Nucl .Sci . Eng. 4_6, pp. 284-303 (1971) .6
21. " Nuclear Systems Materials Handbook," Hanford Engineering DevelopmentLab. , Richland , Washington, TID-26666.
22. M. Jakob, Heat Transfer, Vol .1, p. 85, John Wiley and Sons, New York,1949.
23. C. A. Bruch and W. E. McHugh, " Radiation Damage Studies of Seven Non-Fissionable Metals," Preprint 37, Session 26, presented at the NuclearEngineering and Science Conference, March 17-21, 1958, Chicago, Illinois.
24. G. H. Golden and J. V. Tokar, "Thermophysical Properties of Sodium"ANL-7323, August 1967.
25. D. C. Ginnings, T. B. Douglas and A. F. Ball, " Heat Capacity of Sodiumbetween 0 and 900 C, the Triple Point and Heat of Fusion," J. Res. Nat.Bur. Stand. 45_ pp. 23-33 (July 1950).
1630 157143

>
1ARD-0-0050 t.
Rtv 3
26. D. R. Fredrickson and M. G. Chasanov, "The Enthalpy of Liquid Sodium to1505K by Drop Calorimetry," J. Chem. Thermodyn. 6_, pp. 629-633 (1974).
27. J. P. Stone, et al . , "High-Temperature Properties of Sodium, NRL-6241,December 1964.
28. E. G. Hagen, "Ueber Die Wurmeausdehnung des Natriums, des Kaliums undDeren Leigirung im Festen und im Geschmolzenen Zustande," Ann. Phys.Chem.19_, pp. 436-474 (1883).
29. C. T. Ewing, et. al ., " Measurements of the Physical and Chemical Pro-perties of the Sodium-Potassium Alloys, Quarterly Progress Report, No. 7,"
NRL C-3287, May 1948.
30. C. T. Ewing , et al ., " Density of the System K-Na," Appendix C in " Measure-ment of the Physical and Chemical Properties of the Sodium-PotassiumAlloy, Quarterly Progress Report, No.1," NRL P-3010, September 1946
31. I. I. Novikov, et al., "The Heat Transfer and High Temperature Propertiesof Liquid Alkali Metals," Atomnaya En. 1, (4), 92 (1957).
32. M. E. Rinch and others, "Chimie Physique - Den Sites du Potassium duSodiume," Compt. Rend. H.189, pp. 39-41 (1929).
33. M. Nishibayashi," Density and Viscosity of Molten Materials, Part 1,Density of Sodium and Sodium Hydroxide," WADC 53-308, Part 1,November 1953.
34. E. I. Gol'tsova, " Density of Lithium, Sodium and Potassium up to1500-1600 C ," Teplofiz. Vys. Temper. 4_, No. 3, pp. 360-363 (1966).
35. R. B. Baker, R. D. Leggett and D. S. Dutt, " Interim Report: Effect ofBurnup on Heat-Rating-to Incipient Fuel Melting - HEDL P-20," HEDL-TME75-63,1975 (Availability: USD0E Technical Information Center).
36. R. D. Leggett, E. O. Ballard , R. B. Baker, G. R. Horn, and D. S. Dutt," Linear Heat Rating for Incipient Fuel Melting in UO2-Pu02 Fuel ,"Trans. Amer. Nucl . Soc.15, pp. 752-753 (1972).
37. G. H. Golden and others, " Correlation and Interpretation of Data Relativeto EBR-II Power Level," in Irradiation Experimentation in Fast Reactors,pp. 314-34 2, American Nuclear Society, Hinsdale, Ill .,1973.
38. L. B. Miller, et al., " Characterization of the Power in an ExperimentalIrradiation Subassembly of Mixed-Oxide Fuel in EBR-II", ANL/EBR-047,September 1971.
39. C. Chiu and N. E. Todreas, " Flow Split Measurements in an LMFBR RadialBlanket Assembly," Trans. Am. Nucl . Soc. 2_6_, pp. 455-456 (1977 ) .
40. C. L. Wheeler and others, " COBRA-IV-1: An Interim Version of COBRA forThermal-Hydraulic Analysis of Rod Bundle Nuclear Fuel Elements and Cores,"BNWL-1962, March 1976.
1630 158144

try j T 50 .
,-
41. A. B. G. Washington, " Preferred Values for the Thennal Conductivity ofSintered Ceramic Fuel for Fast Reactor Use," TRG - Report - 2236,September 1973.
42. J. A. Christensen, R. J. Allio and A. Biancheria, " Melting Point of Ir-radiated Uranium Dioxide," Trans. Amer. Nucl . Soc. _7_, pp. 390-391 (1964).
43. J. L. Krankota and C. N. Craig, "The Melting Point of Plutonia-UraniaMixed 0xide Irradiated to High Burnup," GEAP-13515, July 1969.
44. H. von Ubish, S. Hall, and R. Srivastav, " Thermal Conductivities ofMixtures of Fission Product Gases with Helium and with Argon," in Pro-ceedings of the Second United Nations International Conference on thePeaceful Uses of Atomic Energy, Geneva,1958, Vol . 7, pp. 697-700,United Nations, Geneva ,1958.
45. D. J. Clough and J. B. Sayers, "The Measurement of the Thermal Conductivityof UO2 under Irradiation in the Temperature Range 150 -1600 C, AERE-R-4690,December 1964.
46. A. Biancheria, "The Effect of Porosity on Thermal Conductivity of CeramicBodies," Trans. Amer. Nucl . Soc. 9_, p.15 (1966).
47. W. T. Sha and R. C. Schmitt, "THI-3D: A Computer Program for SteadyState Thermal-Hydraulic Mul ti-Channel Analysis ," ANL-8112, December 1975,(Availability: USD0E Technical Information Center).
48. M. D. Carelli, C. W. Bach and R. A. Markley, " Hydraulic and Scram DynamicsAnalysis on LMFBR Control Rod Assemblies," Trans. Amer. Nucl . Soc.16,pp. 218-219 (1973).
-
49. "A Compilation of Boron Carbide Design Support Data for LMFBR ControlElements," HEDL TC-40, December 1973 (Availability: USD0E TechnicalInformation Center).
1630 159
145

W A RD-01)050,
i.
SEV 2 8
ATTACHMENT
r
STATISTICAL TOLERANCE LIMITS ANDPROPAGATION OF ERROR
J. A. Marshall
e-
SUMMARY
In preparing a safety analysis of the Clinch River Breeder
Reactor Plant, the Advanced Reactors Division must take explicitaccount of various uncertainties. This work leads repeatedly to the needfor making a statistical inference in the framework of a propagation oferror problem. Unfortunately the problem has no satisfactory generalsolution. This report deals with a simplified version of the problemfor which a reasonable solution can be (and is) produced. Specificallywe derive approximate upper (statistical) tolerance limits for a
variable given as a linear combination of other variables which have
independently and normally distributed uncertainties and for which dataare available. These results will serve to produce answers for problemswhich satisfy the simplified assumptions and as a base from which toconsider more difficult problems. The latter will probably have to beapproached via computer simulation.
.
1630 160
i

IARD-010SdBEV 2 I
~i-
.
.-
1. INTRODUCTION
This report deals with the propagation of error problem in a
statistical context. In the general problem a (dependent) variable is
given as a function of other (independent) variables which have uncer-
tain values. This uncertainty propagates through the function to induce
a corresponding uncertainty in the dependent variable. In the simplest
statistical version of the problem the uncertainties are visualized in
terms of probability distributions and one wants to characterize the
induced (output) distribution given the (input) distributions of the
independent variables. Our problem has the added feature that we want
to take explicit account of the effect of incomplete specification of
the input distributions on knowledge of the output distribution. This''
last feature makes the problem one of statistical inference.
The treatment of the above problem that will be given here is
meant to provide an approach for certain calculations that arise in the
safety analysis of the Clinch River Breeder Reactor Plant (CRBRP). The
inference problem is a very difficult one for which no satisfactory
general solution exists. We will deal with a simplified version of the
problem for which we can produce a reasonable solution. This will serve
both to produce answers to those problems for which the simplified
assumptions are adequate and as a base from which to consider more
difficult problems. The latter will probably have to be approached via
computer simulation.
Statistical tolerance limits are a natural and of ten advocated
concept for use in dealing with inference problems of the type whichunderlie this report, Consequently our development is in terms of
tolerance limits of which two kinds are presented; one is the more common,
but the other is offered as the more relevant for present purposes.
..
1630 1611

WARD-O.0050 i-,
REV 2 1
-
The more technical treatment of the basic material is given in
Appendix A. Appendix B contains some remarks on the application of thebasic material to somewhat more complicated problems.
1630 162
-
-.
2
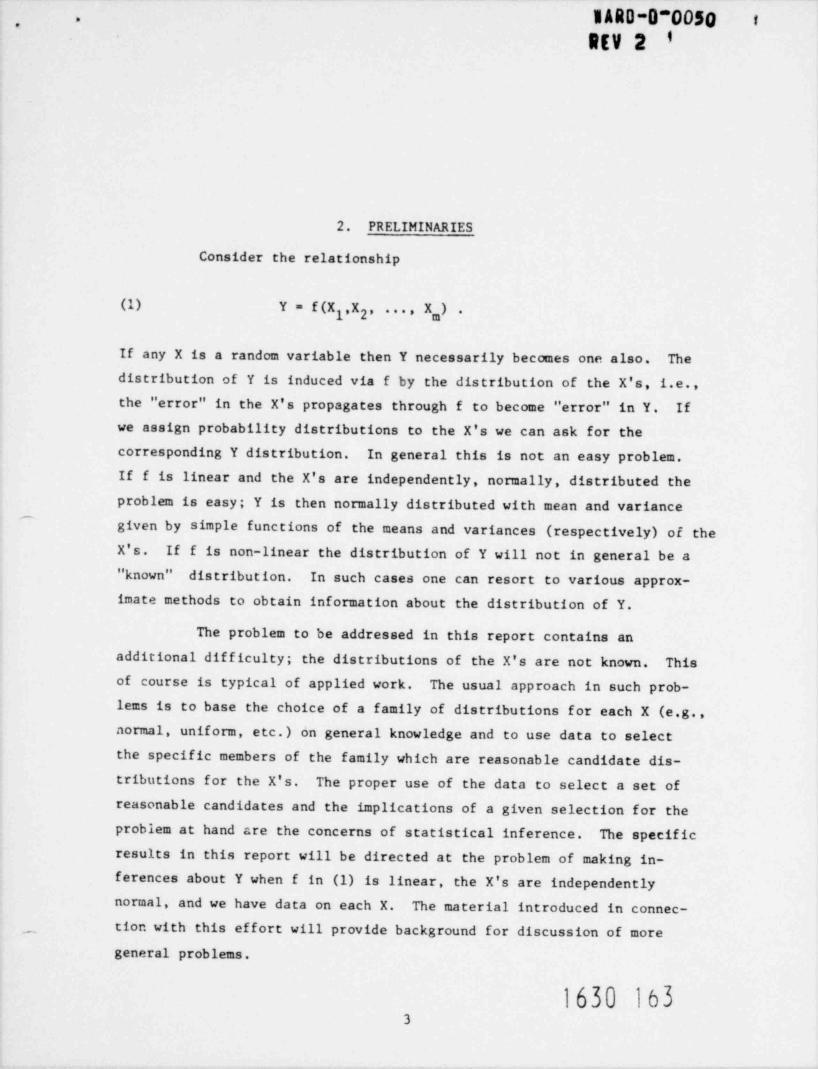
1ARD-D 0050 t"-
REV 2 '
2. PRELIMINARIES
Consider the relationship
(1) Y = f(X ,X , ..., X,) .1 2
If any X is a random variable then Y necessarily becomes one also. The
distribution of Y is induced via f by the distribution of the X's, i.e.,
the " error" in the X's propagates through f to become " error" in Y. If
we assign probability distributions to the X's we can ask for the
corresponding Y distribution. In general this is not an easy problem.
If f is linear and the X's are independently, normally, distributed theproblem is easy; Y is then normally distributed with mean and variance
''
given by simple functions of the means and variances (respectively) of theX's. If f is non-linear the distribution of Y will not in general be a"known" distribution. In such cases one can resort to various approx-imate methods to obtain information about the distribution of Y.
The problem to be addressed in this report contains anadditional difficulty; the distributions of the X's are not known. Thisof course is typical of applied work. The usual approach in such prob-lems is to base the choice of a family of distributions for each X (e.g.,normal, uniform, etc.) on general knowledge and to use data to selectthe specific members of the family which are reasonable candidate dis-tributions for the X's. The proper use of the data to select a set of
reasonable candidates and the implications of a given selection for theproblem at hand are the concerns of statistical inference. The specificresults in this report will be directed at the problem of making in-ferences about Y when f in (1) is linear, the X's are independentlynormal, and we have data on each X. The material introduced in connec-
,, tion with this effort will provide background for discussion of moregeneral problems.
1630 1633
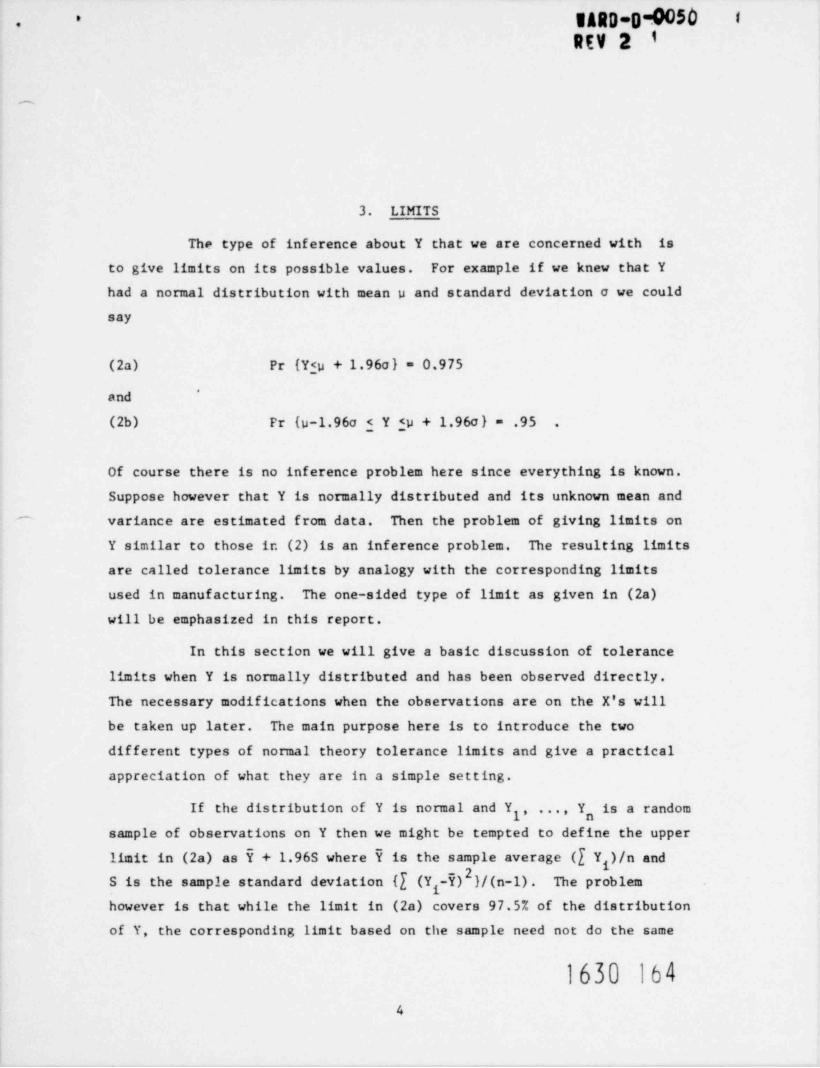
sARD-D-005D*-
REV 2 9
-
3. LIMITS
The type of inference about Y that we are concerned with is
to give limits on its possible values. For example if we knew that Y
had a normal distribution with mean u and standard deviation a we couldsay
(2a) Pr {Yfu + 1.960} = 0.975*
and
(2b) Fr {u-l.960 $ Y fu + 1.960) = .95 .
Of course there is no inference problem here since everything is known.
Suppose however that Y is normally distributed and its unknown mean and^ variance are estimated from data. Then the problem of giving limits on
Y similar to those in (2) is an inference problem. The resulting limits
are called tolerance limits by analogy with the corresponding limits
used in manufacturing. The one-sided type of limit as given in (2a)
will be emphasized in this report.
In this section we will give a basic discussion of tolerance
limits when Y is normally distributed and has been observed directly.
The necessary modifications when the observations are on the X's willbe taken up later. The main purpose here is to introduce the two
different types of normal theory tolerance limits and give a practical
appreciation of what they are in a simple setting.
If the distribution of Y is normal and Y , ..., Y is a random
sample of observations on Y then we might be tempted to define the upper
limit in (2a) as i + 1.96S where isthesampleaverage([Y)/nandSisthesamplestandarddeviation{[(Y-5) }/(n-1). The problemhowever is that while the limit in (2a) covers 97.5% of the distributionof Y, the corresponding limit based on the sample need not do the same
1630 164
4
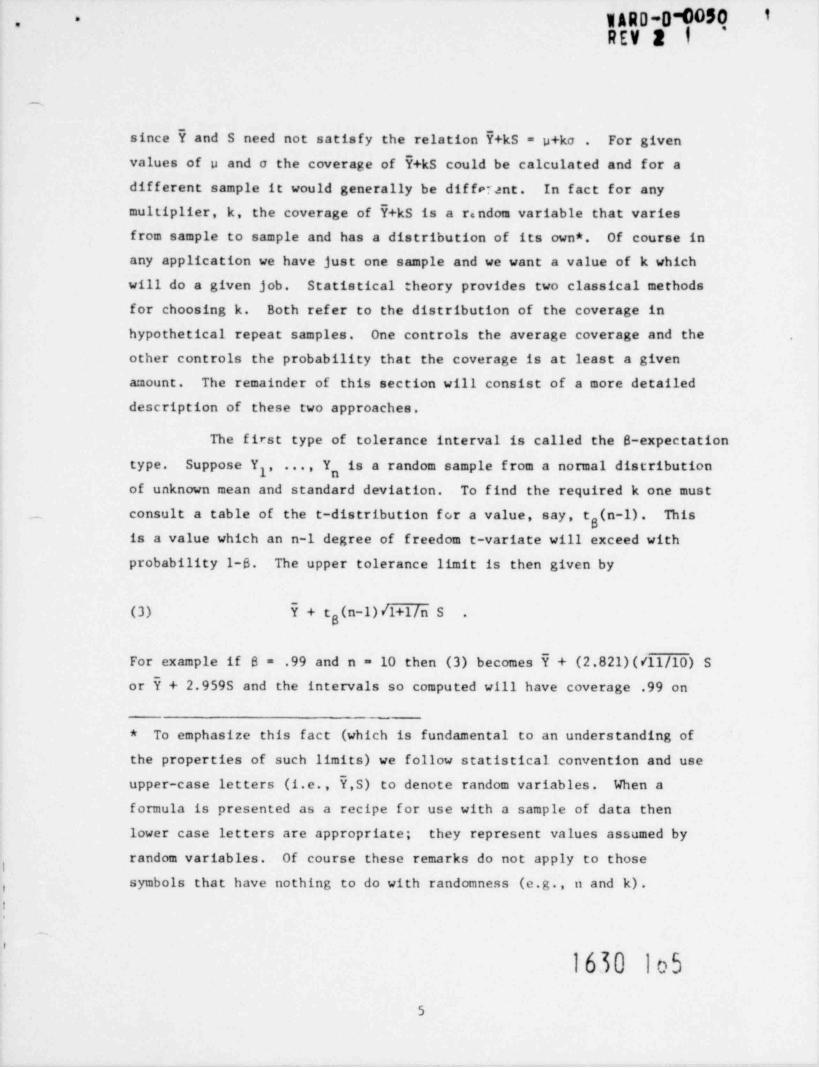
1ARD-0-0050 t-.
REV 2 f*
,
since i and S need not satisfy the relation +kS = p+ko . For given
values of p and a the coverage of i+kS could be calculated and for adifferent sample it would generally be differant. In fact for any
multiplier, k, the coverage of +kS is a rendom variable that varies
from sample to sample and has a distribution of its own*, Of course in
any application we have just one sample and we want a value of k whichwill do a given job. Statistical theory provides two classical methods
for choosing k. Both refer to the distribution of the coverage in
hypothetical repeat samples. One controls the average coverage and the
other controls the probability that the coverage is at least a given
amount. The remainder of this section will consist of a more detailed
description of these two approaches.
The first type of tolerance interval is called the 8-expectation
type. Suppose Y , ..., Y is a random sample f rom a normal distribution1
of unknown mean and standard deviation. To find the required k one must
_ consult a table of the t-distribution for a value, say, tg(n-1). This
is a value which an n-1 degree of freedom t-variate will exceed with
probability 1-8. The upper tolerance limit is then given by
(3) E+tg(n-1) /l+1/n S .
For example if 8 = .99 and n = 10 then (3) becomes i + (2.821)(/11/10) Sor Y + 2.959S and the intervals so computed will have coverage .99 on
* To emphasize this fact (which is fundamental to an understanding of
the properties of such limits) we follow statistical convention and use
upper-case letters (i.e., ,S) to denote random variables. When a
f ormula is presented as a recipe f or use with a sample of data then
lower case letters are appropriate; they represent values assumed by
random variables. Of course these remarks do not apply to those
symbols that have nothing to do with randomness (e.g., u and k).,
t.
_
1630 1oS
5
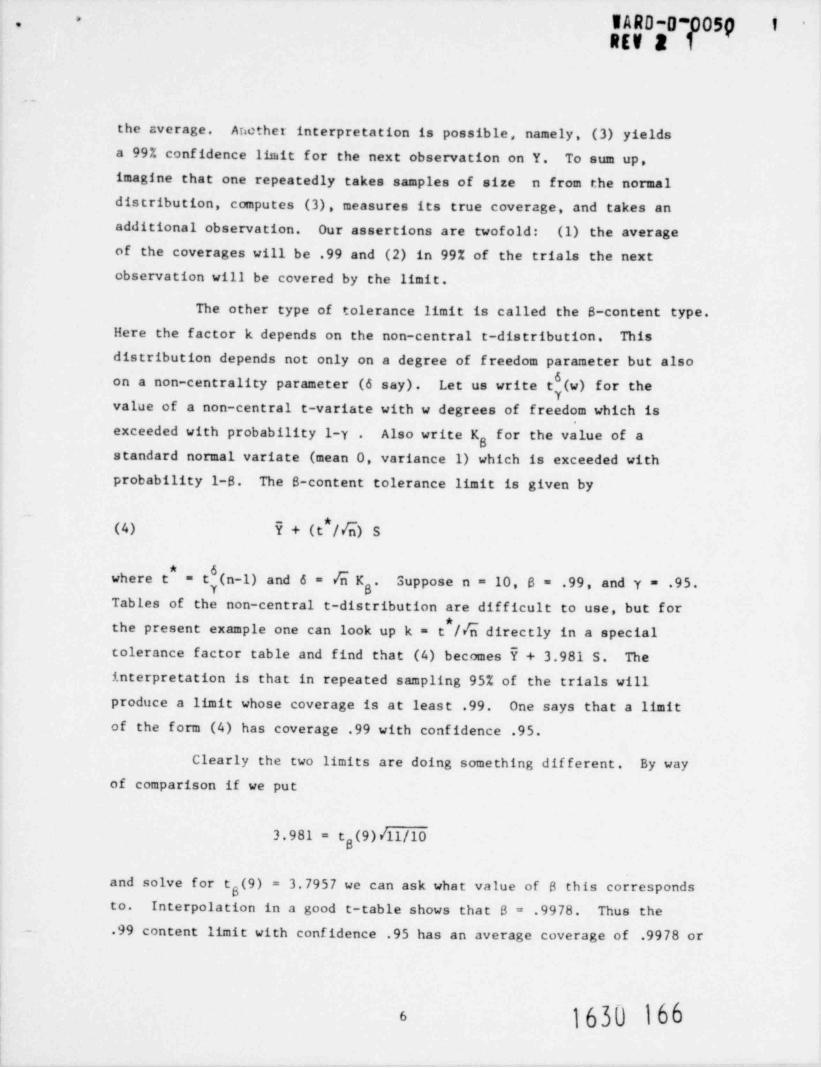
IARD-D D05p f. -'
REV 2 1
._
the cverage. Aacthet interpretation is possible, namely, (3) yieldsa 99% confidence limit for the next observation on Y. To sum up,
imagine that one repeatedly takes samples of size n from the normaldistribution, computes (3), measures its true coverage, and takes anadditional observation. Our assertions are twofold: (1) the average
of the coverages will be .99 and (2) in 99% of the trials the nextobservation will be covered by the limit.
The other type of tolerance limit is called the S-content type.Here the factor k depends on the non-central t-distribution. This
distribution depends not only on a degree of f reedom parameter but alsoon a non-centrality parameter (6 say). Let us write t (w) for thevalue of a non-central t-variate with w degrees of freedom which isexceeded with probability 1-y . Also write K for the value of a
gstandard normal variate (mean 0, variance 1) which is exceeded withprobability 1-8. The 8-content tolerance limit is given by
*(4) i + (t / 6) S
*
t (n-1) and 6 = 6 K . Suppose n = 10, 8 = .99, and y = .95.where t =
g
Tables of the non-central t-distribution are difficult to use, but forthe present example one can look up k = t / 6 directly in a specialtolerance factor table and find that (4) becomes + 3.981 S. The
interpretation is that in repeated sampling 95% of the trials willproduce a limit whose coverage is at least .99. One says that a limit
of the form (4) has coverage .99 with confidence .95.
Clearly the two limits are doing something different. By wayof comparison if we put
3.981 = tg(9) /ll/10
and solve for tB(9) = 3.7957 we can ask what value of 8 this correspondsto. Interpolation in a good t-table shows that B = .9978. Thus the
- .99 content limit with confidence .95 has an average coverage of .9978 or
)bb0 \6

WARD-O-0050 f '*-
REV 2 3'
.
alternatively it may be viewed as a 99.78% confidence limit for the nextobservation. It seems that in many design situations the appropriateinference is to the next " observation", i.e., to the (essentially only)
device that will be built using the design. Of course this is not truefor, say, production items where the 8-expectation tolerance limitcould be criticized for controlling the average and leaving the extremesunattended. In such a case the 8-content approach has merit. But for
a single large project it makes sense to use 8-expectation limits.
1630 167
._
%
7

1ARD-0-0050' Riv t f
'-
4. TOLERANCE LIMITS FOR Y = X +X2
The formulas of this section extend easily to the caseY=[aX with m terms but for convenience they will be presented forg1
the simple sum Y = X +X . Recall that the X's are supposed normal andy 2
independent. Now however instead of having observations directly on
Y we have n observations on X and n bservations on X . This spoilsg 1 2 2
the applicability of formulas (3) and (4) and it is the purpose of this
section to supply replacemer.ts based on a good approximation.
By way of additional notation let
"i
([X))/n5 =g i1
j=1-
and
, n
(X ) - E ) )/(n -1)(S =g g g
j=1
where X ) is the j* observation on Xg (i=1 or 2). Write v = n -1 for1 i1
the degrees of freedom for S Finally we need a suggestive notationg.for i +E which will play the role of i in (3) and (4); we will use
2
Y for this.
Now the 8-expectation tolerance limit is given by
B("e) s(5) + te
where S, plays the role of /1+1/n S in (3) and v, is its effectivedegrees of freedom. Specifically
S, {S (n +1)/ny + S (n2+1)/"2I=y y
andjggg(n+1)/n]hv1+I 2("2+1 "2I "2l*
2(S )22v, =
g y
8 1630 168

WARD-o-0090 f'-
REV 2 1
__
The notation tg(v,) was explained in connection with (3).
The 6-content tolerance limit with confidence Y is based onnon-central t as described in conaection with (4) in the previoussection; we will still be using the notation t (w) and K introduced
gthere. For the present application modifications to (4) similar to
those used in (5) above are required. The limit is
*(6) i + (t / 5) S
whereS = {S2 + S }1/2 ,y
,
8 /("2 1 + "18)N=nn 8y2 '
and*
Y(v)t =t ,
-
with
6=K5,g
and
v = (S ) /{(S ) /vy + (S ) /"2}2*
We turn now to examples of the use of these formulas in simple
situations of the type Y = X +X . The simgle modifications of (5) andy 2
(6)thatareneededtocoverthecaseY=[aX1 (X1 normal) are given1
in Appendix A.
1630 169
m
9
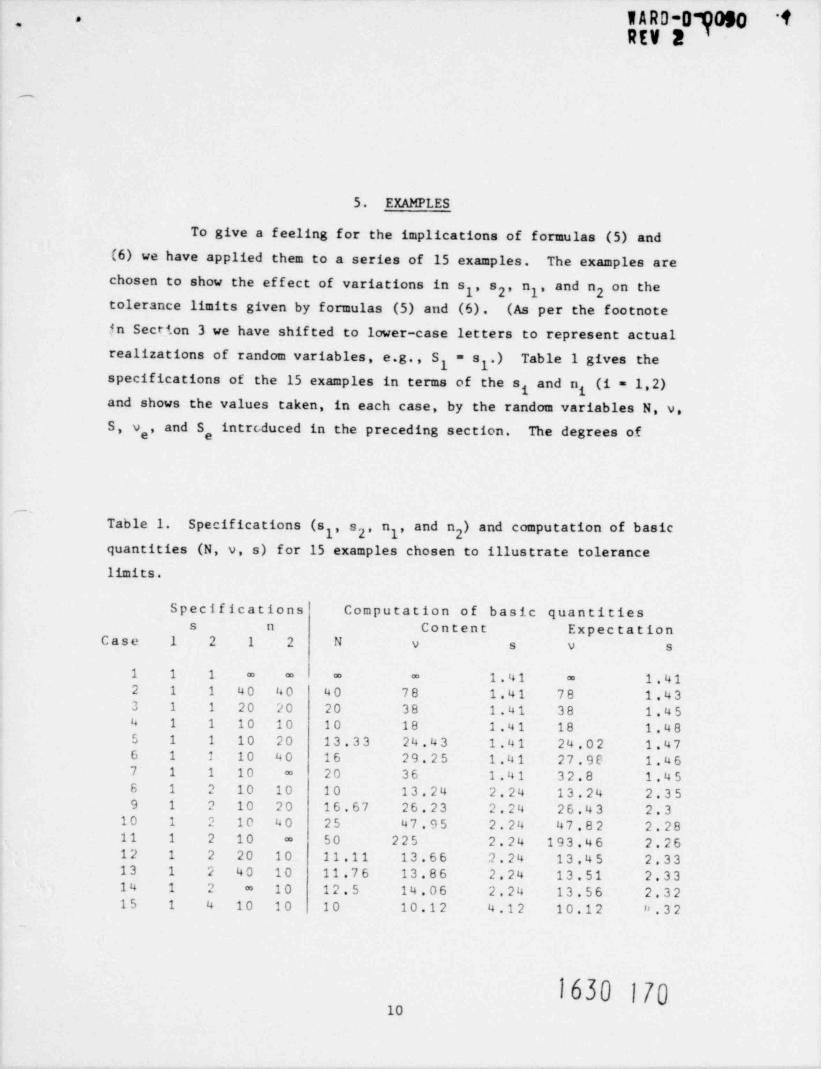
WARD-DyOSO 't-.
REV 2
-
5. EXAMPLES
To give a feeling for the implications of formulas (5) and(6) we have applied them to a series of 15 examples. The examples arechosen to show the effect of variations in s y, s ' "1, and n2 n the2tolerance limits given by formulas (5) and (6). (As per the footnote
$n Secr4.on 3 we have shifted to lower-case letters to represent actualrealizations of random variables, e.g., S = s .) Table 1 gives the
1 1
specifications of the 15 examples in terms of the s and ng (i = 1,2)1and shows the values taken, in each case, by the random variables N, v.S, v , and S, introduced in the preceding section. The degrees of
-
Table 1. Specifications (s , s.2' "1, and n ) and computation of basic2
quantities (N, v, s) for 15 examples chosen to illustrate tolerance
limits.
Specifications Computation of basic quantitiess n Content Expectation
Case 1 2 1 2 N v s v s
1 1 1 = = = = 1.41 1.41=
2 1 1 40 40 40 78 1.41 78 1.433 1 1 20 20 20 38 1.41 38 1.454 1 1 10 10 10 18 1,41 18 1.485 1 1 10 20 13.33 24.43 1.41 24.02 1.476 1 1 10 40 16 29.25 1.41 27.90 1.467 1 1 10 20 36 1.41 32.8 1.45=
6 1 2 10 10 10 13.24 2.24 13.24 2.359 1 2 10 20 16.67 26.23 2.24 26.43 2.3
10 1 2 10 40 25 47.95 2.24 47.82 2.2811 1 2 10 50 225 2.24 193.46 2.26=
12 1 2 20 10 11.11 13.66 2.24 13.45 2.3313 1 2 40 10 11.76 13.86 2.24 13.51 2.3314 1 2 = 10 12.5 14.06 2.24 13.56 2.3215 1 4 10 10 10 10.12 4.12 10.12 n.32
1630 17010
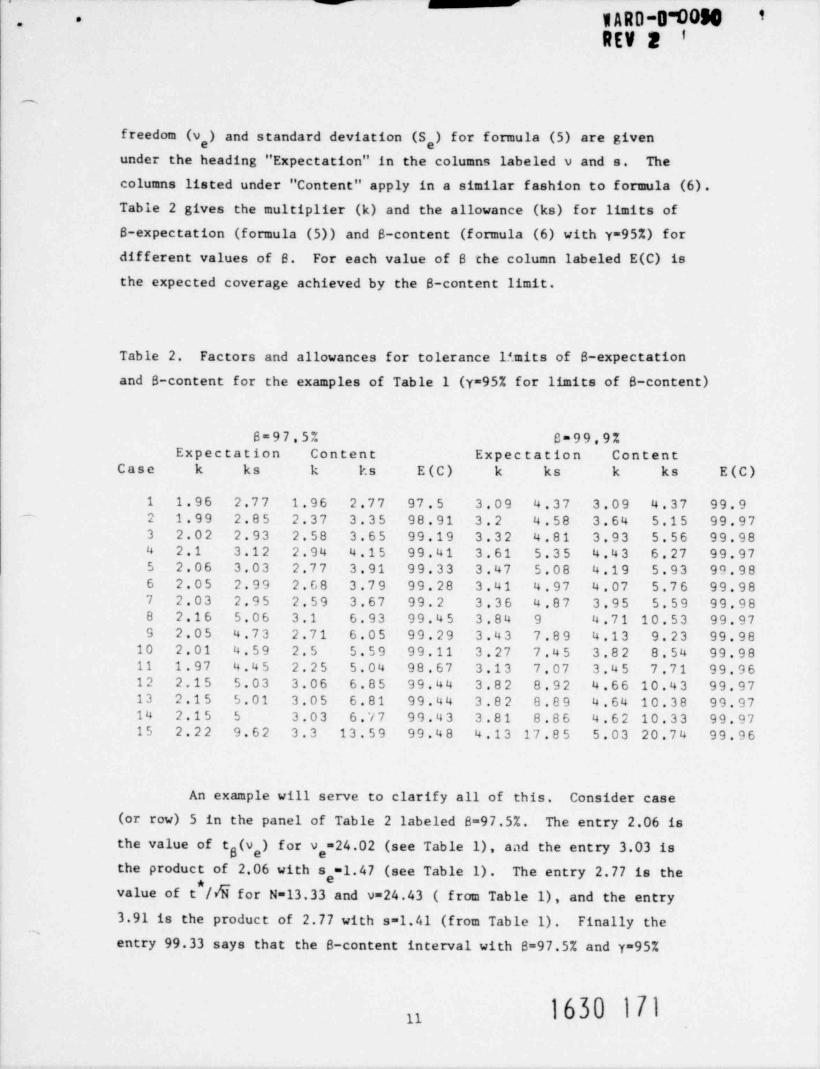
1 ARD-D-0050 $*-
REV 2 '
-
freedom (v ) and standard deviation (S,) for formula (5) are givenunder the heading " Expectation" in the columns labeled v and s. The
columns listed under " Content" apply in a similar fashion to formula (6).Table 2 gives the multiplier (k) and the allowance (ks) for limits of
8-expectation (formula (5)) and 8-content (f omula (6) with y=95%) for
different values of B. For each value of 8 the column labeled E(C) isthe expected coverage achieved by the 8-content limit.
Table 2. Factors and allowances for tolerance limits of S-expectation
and S-content for the examples of Table 1 (y=95% for limits of B-content)
8=97.5% C=99.9%Expectation Content Expectation Content
Case k ks k hs E(C) k ks k ks E(C)
1 1.96 2.77 1.96 2.77 97.5 3.09 4.37 3,09 4.37 99.9- 2 1.99 2.85 2.37 3.35 98.91 3.2 4.58 3.64 5.15 99.97
3 2.02 2.93 2.58 3.65 99.19 3.32 4.81 3.93 5.56 99.984 2.1 3.12 2.94 4.15 99.41 3.61 5.35 4.43 6.27 99.975 2,06 3.03 2.77 3.91 99.33 3.47 5.08 4.19 5.93 99.986 2.05 2.99 2.68 3.79 99.28 3.41 4.97 4.07 5.76 99.987 2.03 2.95 2.59 3.67 99.2 3.36 4.87 3.95 5.59 99.988 2.16 5.06 3.1 6.93 99.45 3.84 9 4.71 10.53 99.979 2.05 4.73 2.71 6.05 99.29 3.43 7.89 4.13 9.23 99.98
10 2.01 4.59 2.5 5.59 99.11 3.27 7.45 3.82 8.54 99.9811 1.97 4.45 2.25 5.04 98.67 3.13 7.07 3.45 7.71 99.9612 2.15 5.03 3.06 6.85 99.44 3.82 8.92 4.66 10.43 99.9713 2.15 5.01 3.05 6.81 99.44 3.82 8.89 4.64 10.38 99.9714 2.15 5 3.03 6.77 99.43 3.81 8.86 4.62 10.33 99.9715 2.22 9.62 3.3 13.59 99.48 4.13 17.85 5.03 20.74 99.96
An example will serve to clarify all of this. Consider case
(or row) 5 in the panel of Table 2 labeled 8-97.5%. The entry 2,06 is
the value of tS("e) f # "e=24.02 (see Table 1), and the entry 3.03 isthe product of 2.06 with a =1.47 (see Table 1). The entry 2.77 is the
**value of t /d for N=13.33 and v=24.43 ( from Table 1), and the entry3.91 is the product of 2.77 with s=1.41 (from Table 1) . Finally the
,
entry 99.33 says that the 8-content interval with 8=97.5% and y=95%
1630 171u
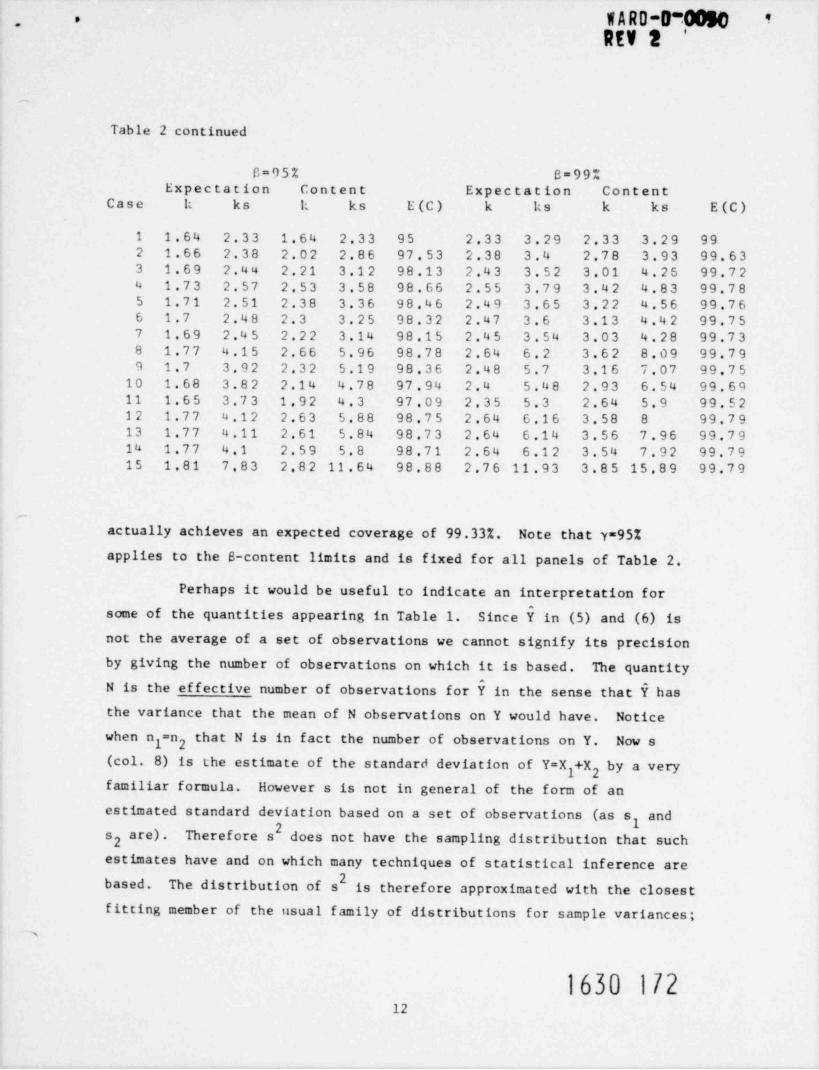
WARD-D-0050 '*.
'REV 2
-
Table 2 continued
C=95% B=99%Expectation Content Expectation Content
Case h ks k ks E(C) k ks k ks E(C)
1 1.64 2.33 1.64 2.33 95 2.33 3.29 2.33 3.29 992 1.66 2.38 2.02 2.86 97.53 2.38 3.4 2.78 3.93 99.633 1.69 2.44 2.21 3.12 98.13 2.43 3.52 3.01 4.26 99.724 1.73 2.57 2.53 3.58 98.66 2.55 3.79 3.42 4.83 99.785 1.71 2.51 2.38 3.36 98.46 2.49 3.65 3.22 4.56 99.766 1.7 2.48 2.3 3.25 98.32 2.47 3.6 3.13 4.42 99.757 1.69 2.45 2.22 3.14 98.15 2.45 3.54 3.03 4.28 99.738 1.77 4.15 2.66 5.96 98.78 2.64 6.2 3.62 8.09 99.799 1.7 3.92 2.32 5.19 98.36 2.48 5.7 3.16 7.07 99.75
10 1.68 3.82 2.14 4.78 97.94 2.4 5.48 2.93 6.54 99.6911 1.65 3.73 1.92 4.3 97.09 2.35 5.3 2.64 5.9 99.5212 1.77 4.12 2.63 5.88 98.75 2.64 6.16 3.58 8 99.7913 1.77 4.11 2.61 5.84 98.73 2.64 6.14 3.56 7.96 99.7914 1.77 4.1 2.59 5.8 98.71 2.64 6.12 3.54 7.92 99.7915 1.81 7.83 2.82 11.64 98.88 2.76 11.93 3.85 15.89 99.79
-
actually achieves an expected coverage of 99.33%. Note that y=95%
applies to the S-content limits and is fixed for all panels of Table 2.
Perhaps it would be useful to indicate an interpretation forsome of the quantities appearing in Table 1. Since in (5) and (6) isnot the average of a set of observations we cannot signify its precisionby giving the number of observations on which it is based. The quantityN is the effective number of observations for in the sense that i hasthe variance that the mean of N observations on Y would have. Notice
when n =n that N is in fact the number of observations on Y. Now sy 2
(col. 8) is the estimate of the standard deviation of Y=X +X by a veryy 2familiar formula. However s is not in general of the form of an
estimated standard deviation based on a set of observations (as s and2s are). Therefore s does not have the sampling distribution that such2
estimates have and on which many techniques of statistical inference arebased. The distribution of s is therefore approximated with the closestfitting member of the usual family of distributions for sample variances;
,
1630 17212

IAR0-0-0050 'io.
REV 2 1'
,
this fitting leads to the degrees of freedom for a represented by v (col. 7).Notice that when n =n and s =s so that the estimate a can be constructedy 2 y yalong conventional lines then v=(n -1) + (n -1) as expected. Finally sy 2and v (cols, 9 and 10) bear the same relationship to each other that sand v (cols. 7 and 8) do, but s (col. 10) is the estimate of the
variance of (i-Y') where Y' is a new observation (say Y'=Xh+X2v where
u=n +1 and v=n +1) fr m the distribution of Y.y 2
The factors k given in Table 2 for S-expectation and 6-contentlimits cover a broader range of cases than might at first be realized.For any case in the table the values of s and s can be multiplied byy 2the same constant without changing the value of k. Thus, e.g., case 5
applies to all situations where s =s ' "l=10, and n =20, and case 10y 2 2covets all cases where s =2sy, n =10, and n =40. The conventional "20"2 y 2and "30" limits that are of ten calculated correspond closely to our case1, Table 2, panels 97.5% and 99.9% respectively.
_
1630 173
_
13
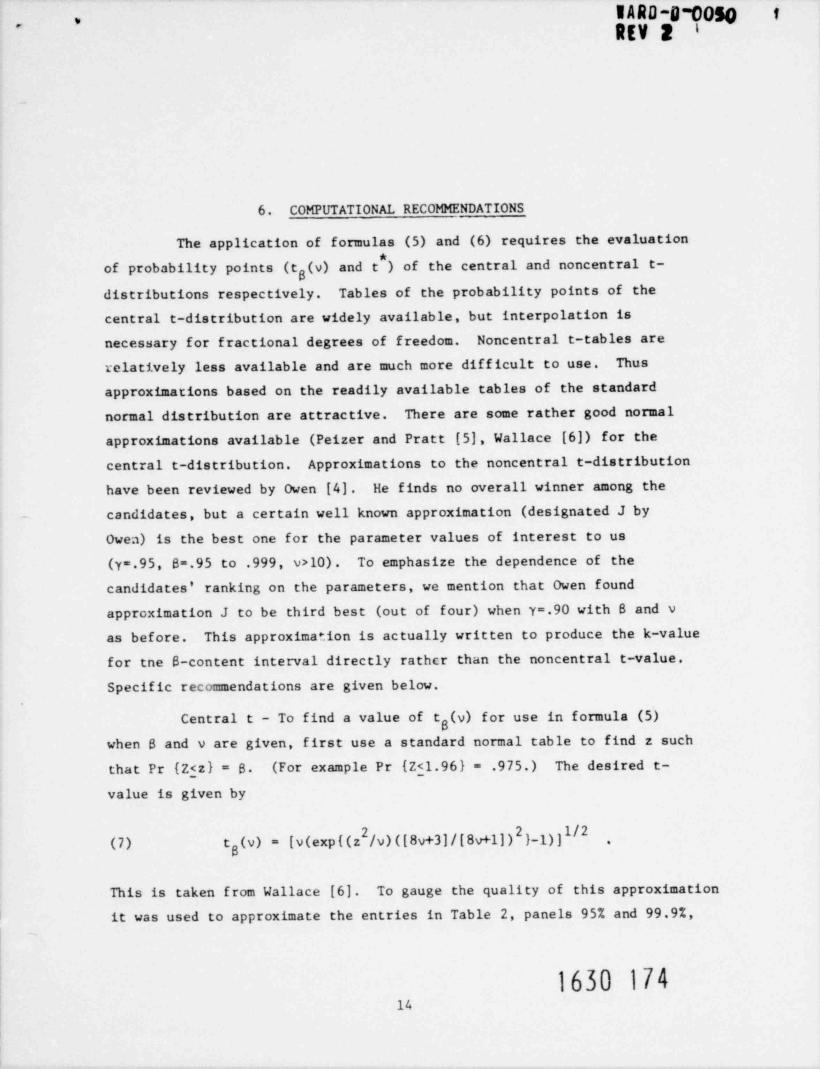
I ARD-01305kD f*REV 2 '-
6. COMPUTATIONAL RECOMMENDATIONS
The application of formulas (5) and (6) requires the evaluation*
of probability points (tg(v) and t ) of the central and noncentral t-distributions respectively. Tables of the probability points of thecentral t-distribution are widely available, but interpolation is
necessary for fractional degrees of freedom. Noncentral t-tables arerelatively less available and are much more difficult to use. Thus
approximations based on the readily available tables of the standardnormal distribution are attractive. There are some rather good normalapproximations available (Peizer and Pratt [5], Wallace [6]) for thecentral t-distribution. Approximations to the noncentral t-distributionhave been reviewed by Owen [4]. He finds no overall winner among the
- candidates, but a certain well known approximation (designated J byOwen) is the best one for the parameter values of interest to us(y=.95, 8=.95 to .999, v>10). To emphasize the dependence of the
candidates' ranking on the parameters, we mention that Owen found
approximation J to be third best (out of four) when Y=.90 with 8 and vas before. This approximation is actually written to produce the k-valuefor tne S-content interval directly rathcr than the noncentral t-value.
Specific recommendations are given below.
Central t - To find a value of tg(v) for use in formula (5)when 8 and v are given, first use a standard normal table to find z such
that Pr {Z$z} = 8 (For example Pr {Z$1.96 } = .975.) The desired t-
value is given by
g(v) = [v(exp{(z /v)([8v+3]/[8v+1])2)_1))l/2(7) t ,
This is taken from Wallace [6]. To gauge the quality of this approximation
it was used to approximate the entries in Table 2, panels 95% and 99.9%,~
l630 17414

R ARD-01050. T
REV 2 ''"-
-
columns " Expectation-k". These entries in Table 2 were obtained via
careful interpolation in a t-table. The comparison is presented in
Table 3 where an extra digit is carried to reveal smaller differences.
Table 3. Comparison of central t-values obtained from formula (7) with
those from Table 2.
S=95% 8=99.9%Case Formula Table 2 Formula Table 2
2 1.665 1.665 3.198 3.1983 1.686 1.686 3.319 3.3194 1.734 1.734 3.613 3.615 1.711 1.711 3.468 3.4676 1.701 1.701 3.409 3.4087 1.693 1.693 3.359 3.3588 1.769 1.769 3.841 3.8369 1.705 1.705 3.43 3.429
10 1.677 1.677 3.27 3.26911 1.653 1.652 3.133 3.132
-- 12 1.766 1.766 3.826 3.82213 1.766 1.766 3.822 3.81714 1.765 1.765 3.819 3.81515 1.81 1,81 4.138 4.128<
*Noncentral t - To find a value of k=t //N for use in formula
(6) when 8, Y, N, and V are given put
(8) k = (Kg + (K -AB} )/A
where
A = 1-K /2v ,
Y
B = K -K /N ,g
and K is the value of a standard normal variable which is exceeded withp
probability 1-P. This is taken from Owen [4]. Table 4 contains acomparison of formula (8) with certain appropriate entries from Table 2
1630 175
15
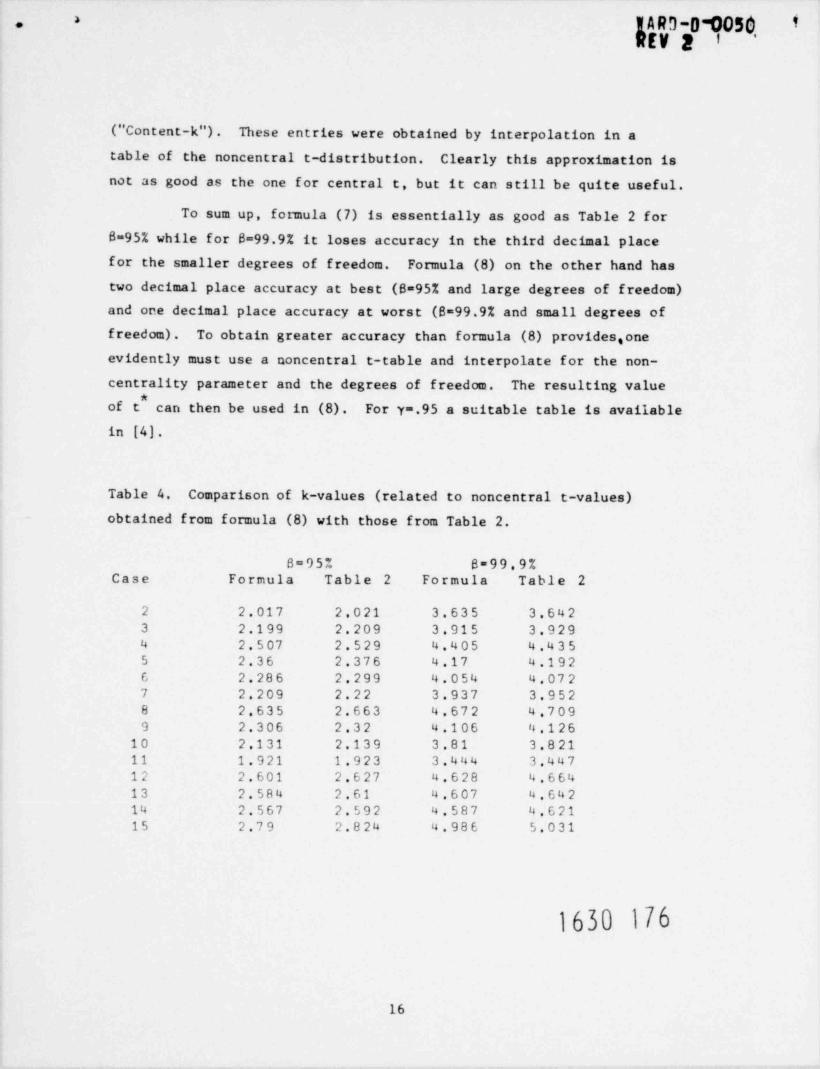
1 A RD-0105C i*.
REV 2 I'
(" Content-k"). These entries were obtained by interpolation in atable of the noncentral t-distribution. Clearly this approximation isnot as good as the one for central t, but it can still be quite useful.
To sum up, fomula (7) is essentially as good as Table 2 for8=95% while for B=99.9% it loses accuracy in the third decimal placefor the smaller degrees of freedom. Formula (8) on the other hand hastwo decimal place accuracy at best (8=95% and large degrees of freedom)and one decimal place accuracy at worst (8=99.9% and small degrees of
freedom). To obtain greater accuracy than formula (8) provides,oneevidently must use a noncentral t-table and interpolate for the non-centrality parameter and the degrees of freedom. The resulting value
*
of t can then be used in (8). For y=.95 a suitable table is available
in [4].
Table 4. Comparison of k-values (related to noncentral t-values)obtained from formula (8) with those from Table 2.
8=95% B=99.9%Case Formula Table 2 Formula Table 2
2 2.017 2.021 3.635 3.6423 2.199 2.209 3.915 3.9294 2.507 2.529 4.405 4.4355 2.36 2.376 4.17 4.1926 2.286 2.299 4.054 4.0727 2.209 2.22 3.937 3.9528 2.635 2.663 4.672 4.7099 2.306 2.32 4.106 4.126
10 2.131 2.139 3.81 3.82111 1.921 1.923 3.444 3.44712 2.601 2.627 4.628 4.66413 2.584 2.61 4.607 4.64214 2.567 2.592 4.587 4.62115 2.79 2.824 4.986 5.031
1630 176
16

.
MARD-D 0050 i^
Rtf 9 I
7. REFERENCES
[1] G.E.P. Box, "Some Theorems on Quadratic Fonns Applied in the Study ofAnalysis of Variance Problems: I. Effect of Inequality of Variancein the One-Way Classification", Annals Math. Stat. 25, pp. 290-302,(1954).
[2] K. A. Brownlee, Statistical Theory and Methodology in Science andEngineering, 2nd Edition, John Wiley, New York,1965.
[3] Irwin Guttman, Statistical Tolerance Regions: Classical and Bayesian,Hafner Press, New York, 1970.
[4] D. B. Owen, " Survey of Properties and A[ plications of NoncentralT-Distribution", Technometrics 10, pp. 445-478, (1968).
[5] David B. Peizer and John W. Pratt, " Approximating the Binomial, F,and Commonly Used Related Distributions, I", TR-12 (AD-643954),August 1966.
[6] David L. Wallace, " Bounds on Normal Approximations to Student's andthe Chi-Square Distributions", Annals Math. Stat. 30, pp.1121-1130,(1959).
1630 177
17
W ARD-O- 005p i --_
REV 2 1
-
%
8. APPENDIX A
DerivationsforthecaseY=[aXggm
SupposeY=[aX with the X independently N(p ,o ), andg g1
X ..., X is a random sample of size n on X1 (i=1,... m). We,
in g
want an upper tolerance limit on Y. Both the B-content type with
confidence y and the S-expectation type will be treated. The basic
reference for tolerance concepts will be Guttman Our basic approach.
is to modify the usual formulas for the case where Y , ...,Y is ayrandem sample from a N(p,o ). The modification comes from using
Satterthwaite's formula for the approximate degrees of freedom to be
associated with a linear combination of variance estimates. This willbe presented first.
Notice that with the above setup we have
2Vary =[aVarXg
andforanestimateofVarYonewoulduse[aS Here Var is the.
variance operator and S stands for the usual sample estimator of Var X
(with n -1 in the denominator). Now each S has a mean square dis-g
tribution with n -1 degrees of f reedom, but the distribution ofg
m22
(9) S =[a31
in general is not a member of the family of mean square distributions.The idea of using a mean square distribution that approximates the dis-tribution of S is developed in, e.g., BrownleeI I. The approximation
is based on calculating the degrees of freedom for a mean square
1630 17818

WARD-D-0050 't -*-
REV 2 1'
m
2distribution so that its mean and variance match those of S . The resultis called Satterthwaite's approximation (original references are givenin Brownlee) and in our case it comes to
2 2(S )2j , (3 )2fv(10) v =1
where v = n -1 is the degrees of freedom associated with S . This1
approximation has been studied by Box who gives numerical evidence
indicating that it is excellent for positive af.
To develop an upper 8-expectation tolerance limit for Y we
use a theorem due to Paulson and given by Guttman which says that a
confidence region of confidence 8 for a future observation from the
distribution of Y is a S-expectation tolerance region for the dis-tribution of Y. Thus let Y' be a next observation on Y, i.e., let
Y' = aXyh+8 X2h+***
where u = n +1, v = n +1, etc. Writei=[ai and observe thaty 2 gt
Y'-i N N(0, a2,y2Y)Y
where2 7,px2o
1
2, Z,22 1630 1790 oy ixand
!"i" "1
in an obvious notation. Now
, -m
Y
19
*W A RD-0- 0050 t-
REV 2 I'
.
%
Var (Y'- ) = a2 , ,2y y
- ao (n +1)/n1 i
and we will estimate this by
22S2=[ag(,,1)f,9
where of course S is the usual estimator of Var (X ) with v =n-11 g
degrees of freedom. Thus from Satterthwaite's approximation (10) wehave
v, = (S ) / (a (n +1)/n ) (S ) /vg g g1
and so approximately
S X (v,)
Var (Y'-i) v
Clearly
Y'-i N(0,1)
/ Var (Y '-i)
and therefore
t(v,)N
where t(v ) stands for a "t" distribution with v degrees of freedom
(the required independence between S, and derives from the classicalindependence between S and X and the assumed independence among the
t 1
X ).g
If we write tg(v) for a t-variate with v degrees of freedomwhich is exceeded with probability 1-8 then
^N Pr((Y'- )/S <t g(v,)) = 81630 180
20

!/R3-Ot050 1'-
REV 2 1'
m
and by the usual inversion this becomes
(11) Pr{Y' < i + tg(v,)S, } = 8 .
Therefore i + tg(v )S, is an upper confidence limit for Y' withconfidence 8; hence it is also an upper tolerance limit of S-expectation.To recapitulate briefly: Y' is a random variable with the distributionofY,i.e.,N([au,[ao); isanestimatorof[ap which isgg gindependent of Y'; and S2 is an estimator of Var (Y'-?) which is in-dependent of i.
Turning now to the 6-content tolerance limit let us write(with some redundancy)
[aXY =
[al=
ii
[aSS =
Var Y = ay
and
EY = py
where E is the expected value operator. In the present case the degreescf freedom for S as taken from Satterthwaite's approximation is givendirectly by (10). In this development it is convenient to be able towrite Var (k) as Var (Y)/N just as though k were the average of Nobservations on Y. The N so defined is called the effective number ofobservations. It is given by Var (Y)/ Var (h) or
N=([a*o )/([a*o /n')*1 *1 1630 181.
_
21
1ARD~Q=0990 i~-
REV 2 11
m
If the n had a common value n then N would equal n and not depend ong
the unknown variances. Of course if the unknown variances had a commonvalue then N would only depend on the a and n . In general we must
f g
approximate N by replacing the unknown variances by their estimatesS. That is
2([aS)/([aS/n)N .g
Let K be the value of a N(0,1) variate which is exceededg
with probability 1-8. We want a value of k so that Y+kS will be aB-content tolerance limit with confidence y . In other words k must be
such that
gy<k+kS)=y(12) Pr(p +Ko
since p +Ko has coverage exactly 8 and (12) says that i+kS has aty gyleast coverage B with probability y. Rewriting (12) we find
~
- _,
p -YNY + NK
a BY Ek =y(13) Pr <
*
23
2
y
Since
E(p-k)/o % N(0,1) ,
S /c % X (V)/V ,y
andSisindependentofk,theexpressionontheleftoftheinequalityin (13) has a noncentral t-distribution with noncentrality parameterEK and degrees of freedom v. If t is the value of such a variateg
*which is exceeded with probability 1-y then (13) holds with t = Ek or* 6. The more complete notation used in the report in place of t
*/k=t
1630 18222

WARD-D"0050 i" '
-
REV 2 1'
m
is t (v) where 6= 8K The 8-content tolerance limit isg.
(14) i+(t/M)S.
9. APPENDIX B
More general situations
Appendix A treats the problem of tolerance limits on a Y
given by Y=f(X , .X,) where the X's are independent and normal, f..1
is linear, and observations are available on the individual X's. The
approach taken to this problem is somewhat more general than it mightappear to be. In this appendix the additional generality will be-~
brought out.
Basically what is needed for a normal theory tolerance limit
onYisanormallydistributedestimateofthemeanofY,sayi,whosevariance is given by S /N (for some N) and for which S is an estimate
(independentofE)ofthevarianceofYhavingameansquaredistributionwith v degrees of freedom. The classical situation in which these
conditions are met is where a random sample Y , ..., Y,is available on1
Y and we put i= and S ={[(Y-5) }/(m-1). Then N=m and v=m-1.(Strictly speaking N is required only for the content type limits andnot for the expectation type.) In the situation treated in Appendix A
the tolerance limits had t.o be approximated. Approximation was neededfor two reasons: (1) the natural estimate of the variance of Y (or of{Y'-i) in the expectation type) did not have a mean square distributionand so an approximate one was provided and (2) the effective number of
observations (N) involved variances that had to be estimated.
.-
1630 183
23

IARD-01)050 i '*a
REV 2 ' '
-
The generalities that may be treated with little change in
approach include:
1) one or more X s determined from a regression on othervariables rather than from direct observation,
ii) f is nonlinear,
iii) X s not independent.
Consider first the case where an X in f(X , ..., X,) isg
determined from a previously established regression on some variablesZ. If the regression was linear (in the parameters) then for somek
matrix of constants (Z) and some vector of estimated coefficients (B)we estimate the X contribution to k as $ =zB. (We are here treatingg 1
f as linear.) In this notation z is a row vector expressing the values
of the z-variables at which the value of X is desired and B is ag
column vector. For example if tne regression were quadratic in a singleO 2 2z then k =a+b z+c z , B ' = {a ,b , c } , and z-{ 1, z , z } . The Z-matrix in this1
case consists of a column of l's, a column of z-values, and a column ofz-values squared. Nowtheestimateofthevarianceofk(=zB)isgiven
g
by
S = z(Z'Z) 1 'S2-
zg
where
S = { (X k) /(m-p)q
and X represents the values of X on which the regression is based.g g
These equations are for any linear regression based on m observations and
p parnmeters. The degrees of freedom for S is (m-p). This information
is sufficient to alter the formulas in Appendix A so that they would
apply to a case where one or more X{s are based on a linear regression.If the regression is not linear in the parameters the fit will be
2carried out by a series of linear approximations. The S and its
degrees of freedom from the final iteration can be used as above.,
1630 18424
dA 1ARD-D-0050 ~4'
REV 2 f'
OConsider next the case of a nonlinear f. An approach here
would be to linearize f. That is put
ms . . . . .
Y = f(X ..., X,) + [ { f (X . . . , X,) }{ (X -X ) }y 1 y f gi=1
where f is the partial of f with respect to coordinate i evaluated at(X ,..., X,). This presents Y as a linear combination of variables,y
which case has been dealt with. The accuracy of this approximationdepends on the variances of the distributions of the X and the severityof the nonlinearity of f. In practice one often finds the variances to
be sufficiently small that the approximation is a good one. It should
be noted that there are really two approximations here; one is thelinearization about a point and the other is the estimation of thatpoint by (X , . . . , X ) .y
Finally go back to a linear f and suppose the uncertaintiesinthenormalX{sarenotstatisticallyindependent. For simplicityOconsider Y=X +X . In the absence of independence we have1 2Var Y = Var X + Var X +2 Cov (X ,X ) where the last term is twice they 2 y 2
covariance of X with X . To find Var Y we must obtain Coy (X ,X )'1 2 y 2and there are two cases to be considered. In one case the dependence
arises from known physical relations and based on these an analysiswill show the covariance to be (perhaps approximately) a linear
combination of Var X and Var X . This makes Var Y a linear combination1 2
of variances and Satterthwaite's approximation can be used as before.In the other case Cov (X ,X ) will be known only through estimationy 2
based on data. To be able to make such an estimate we must have pairs
of observations (X ,X2j ) . But this is the same as having directobservations on Y (i.e. , Y =X +X ) which avoids any problem aboutcovariances.
1630 185>
_
.
25
Related Documents