Citation: Karayannis, P.; Saliakas, S.; Kokkinopoulos, I.; Damilos, S.; Koumoulos, E.P.; Gkartzou, E.; Gomez, J.; Charitidis, C. Facilitating Safe FFF 3D Printing: A Prototype Material Case Study. Sustainability 2022, 14, 3046. https://doi.org/ 10.3390/su14053046 Academic Editors: Mohammad Reza Khosravani and Payam Soltani Received: 25 January 2022 Accepted: 3 March 2022 Published: 4 March 2022 Publisher’s Note: MDPI stays neutral with regard to jurisdictional claims in published maps and institutional affil- iations. Copyright: © 2022 by the authors. Licensee MDPI, Basel, Switzerland. This article is an open access article distributed under the terms and conditions of the Creative Commons Attribution (CC BY) license (https:// creativecommons.org/licenses/by/ 4.0/). sustainability Article Facilitating Safe FFF 3D Printing: A Prototype Material Case Study Panagiotis Karayannis 1 , Stratos Saliakas 1 , Ioannis Kokkinopoulos 1 , Spyridon Damilos 1 , Elias P. Koumoulos 1, * , Eleni Gkartzou 2 , Julio Gomez 3 and Constantinos Charitidis 2 1 IRES—Innovation in Research & Engineering Solutions, Rue Koningin Astridlaan 59B, 1780 Wemmel, Belgium; [email protected] (P.K.); [email protected] (S.S.); [email protected] (I.K.); [email protected] (S.D.) 2 School of Chemical Engineering, R-Nano Lab, Laboratory of Advanced, Composite, Nanomaterials and Nanotechnology, National Technical University of Athens, 15773 Athens, Greece; [email protected] (E.G.); [email protected] (C.C.) 3 Avanzare Innovacion Tecnologica S.L., Av. Lentiscares 4-6, 26370 Navarrete, Spain; [email protected] * Correspondence: [email protected] Abstract: Three-dimensional (3D) printing has introduced a paradigm shift in the manufacturing world, and it is increasing in popularity. In cases of such rapid and widespread acceptance of novel technologies, material or process safety issues may be underestimated, due to safety research being outpaced by the breakthroughs of innovation. However, a definitive approach in studying the various occupational or environmental risks of new technologies is a vital part of their sustainable application. In fused filament fabrication (FFF) 3D printing, the practicality and simplicity of the method are juxtaposed by ultrafine particle (UFP) and volatile organic compound (VOC) emission hazards. In this work, the decision of selecting the optimal material for the mass production of a microfluidic device substrate via FFF 3D printing is supported by an emission/exposure assessment. Three candidate prototype materials are evaluated in terms of their comparative emission potential. The impact of nozzle temperature settings, as well as the microfluidic device’s structural characteristics regarding the magnitude of emissions, is evaluated. The projected exposure of the employees operating the 3D printer is determined. The concept behind this series of experiments is proposed as a methodology to generate an additional set of decision-support decision-making criteria for FFF 3D printing production cases. Keywords: exposure assessment; 3D printing; ultrafine particles; microfluidics; fused filament fabrication 1. Introduction 1.1. Additive Manufacturing The International Organization for Standardization (ISO) defines additive manufactur- ing (AM) as “the process of joining materials to make parts based on computer-generated 3D model data, usually layer upon layer, as opposed to subtractive manufacturing and formative manufacturing methodologies” [1]. Additive manufacturing is considered by part of the research community to be a revolutionary enabler for the manufacturing sec- tor, assisting in overcoming many of the barriers posed by conventional manufacturing techniques [2]. Since the first conception and implementation of additive manufacturing in 1984 by 3D Systems [3], this technological area has experienced massive breakthroughs. A multitude of AM techniques have been developed [4] and are projected to be applied in a wide field of applications, including the automotive industry [5], medicine [6], and aerospace [7]. In recent years, technological advances in the world of AM have resulted in fascinating achievements, including the 3D printing of graphene aerogels [8] and the bio-printing of several types of tissues and organs [9]. Sustainability 2022, 14, 3046. https://doi.org/10.3390/su14053046 https://www.mdpi.com/journal/sustainability

Welcome message from author
This document is posted to help you gain knowledge. Please leave a comment to let me know what you think about it! Share it to your friends and learn new things together.
Transcript
�����������������
Citation: Karayannis, P.; Saliakas, S.;
Kokkinopoulos, I.; Damilos, S.;
Koumoulos, E.P.; Gkartzou, E.;
Gomez, J.; Charitidis, C. Facilitating
Safe FFF 3D Printing: A Prototype
Material Case Study. Sustainability
2022, 14, 3046. https://doi.org/
10.3390/su14053046
Academic Editors: Mohammad
Reza Khosravani and Payam Soltani
Received: 25 January 2022
Accepted: 3 March 2022
Published: 4 March 2022
Publisher’s Note: MDPI stays neutral
with regard to jurisdictional claims in
published maps and institutional affil-
iations.
Copyright: © 2022 by the authors.
Licensee MDPI, Basel, Switzerland.
This article is an open access article
distributed under the terms and
conditions of the Creative Commons
Attribution (CC BY) license (https://
creativecommons.org/licenses/by/
4.0/).
sustainability
Article
Facilitating Safe FFF 3D Printing: A Prototype MaterialCase StudyPanagiotis Karayannis 1, Stratos Saliakas 1, Ioannis Kokkinopoulos 1, Spyridon Damilos 1 ,Elias P. Koumoulos 1,* , Eleni Gkartzou 2, Julio Gomez 3 and Constantinos Charitidis 2
1 IRES—Innovation in Research & Engineering Solutions, Rue Koningin Astridlaan 59B,1780 Wemmel, Belgium; [email protected] (P.K.); [email protected] (S.S.);[email protected] (I.K.); [email protected] (S.D.)
2 School of Chemical Engineering, R-Nano Lab, Laboratory of Advanced, Composite, Nanomaterials andNanotechnology, National Technical University of Athens, 15773 Athens, Greece;[email protected] (E.G.); [email protected] (C.C.)
3 Avanzare Innovacion Tecnologica S.L., Av. Lentiscares 4-6, 26370 Navarrete, Spain; [email protected]* Correspondence: [email protected]
Abstract: Three-dimensional (3D) printing has introduced a paradigm shift in the manufacturingworld, and it is increasing in popularity. In cases of such rapid and widespread acceptance of noveltechnologies, material or process safety issues may be underestimated, due to safety research beingoutpaced by the breakthroughs of innovation. However, a definitive approach in studying the variousoccupational or environmental risks of new technologies is a vital part of their sustainable application.In fused filament fabrication (FFF) 3D printing, the practicality and simplicity of the method arejuxtaposed by ultrafine particle (UFP) and volatile organic compound (VOC) emission hazards. Inthis work, the decision of selecting the optimal material for the mass production of a microfluidicdevice substrate via FFF 3D printing is supported by an emission/exposure assessment. Threecandidate prototype materials are evaluated in terms of their comparative emission potential. Theimpact of nozzle temperature settings, as well as the microfluidic device’s structural characteristicsregarding the magnitude of emissions, is evaluated. The projected exposure of the employeesoperating the 3D printer is determined. The concept behind this series of experiments is proposed asa methodology to generate an additional set of decision-support decision-making criteria for FFF 3Dprinting production cases.
Keywords: exposure assessment; 3D printing; ultrafine particles; microfluidics; fused filament fabrication
1. Introduction1.1. Additive Manufacturing
The International Organization for Standardization (ISO) defines additive manufactur-ing (AM) as “the process of joining materials to make parts based on computer-generated3D model data, usually layer upon layer, as opposed to subtractive manufacturing andformative manufacturing methodologies” [1]. Additive manufacturing is considered bypart of the research community to be a revolutionary enabler for the manufacturing sec-tor, assisting in overcoming many of the barriers posed by conventional manufacturingtechniques [2]. Since the first conception and implementation of additive manufacturingin 1984 by 3D Systems [3], this technological area has experienced massive breakthroughs.A multitude of AM techniques have been developed [4] and are projected to be appliedin a wide field of applications, including the automotive industry [5], medicine [6], andaerospace [7]. In recent years, technological advances in the world of AM have resultedin fascinating achievements, including the 3D printing of graphene aerogels [8] and thebio-printing of several types of tissues and organs [9].
Sustainability 2022, 14, 3046. https://doi.org/10.3390/su14053046 https://www.mdpi.com/journal/sustainability
Sustainability 2022, 14, 3046 2 of 26
The fundamental operating principles of manufacturing objects based on computer de-sign files, layer by layer, in an additive conceptual scheme leads to the following advantages,compared to traditional subtractive methods [10]:
• On-demand part manufacturing, with the potential to remove barriers posed byremote manufacturing and the delivery of parts, as well as the need to maintain alarge inventory.
• Economical production of small batches.• Individual customization of print objects and the uncomplicated redesign of parts.• Small waste generation.• Straightforward supply chains and a reduced need for tooling.• The increased involvement of consumers in the manufacturing process, as 3D printing
files can be distributed and will enable printing in non-professional settings.• Synergistic capabilities with 3D scanning technologies, enabling the cost-effective
replication of scanned objects, a highly beneficial feature for areas such as personalizedmedicine [11] and historical building restoration [12].
It is sensible to suggest that safety-related studies of AM should focus on emphasizingand accentuating these beneficial elements of AM, while also highlighting any safety risksand defining the best approach to mitigate them, in order to render AM’s full establishmentinto the manufacturing world easier to achieve.
1.2. Fused Filament Fabrication
The most common and widely investigated AM technique is fused filament fabrication(FFF), which is a material extrusion-based technology. This technique involves the heatingof solid thermoplastic filament feedstock close to the applied material’s melting point, withthe subsequent passage through an extrusion nozzle and the programmed extrusion of theresulting semi-liquid material. The object is formed layer by layer, based on the designfile, through the coordinated deposition and movement of the nozzle and/or the printbed platform. The platform is heated in most printer devices, as an assistive feature forlayer adhesion [1]. FFF allows the use of a multitude of filament materials, such as theordinarily applied polylactide (PLA) and acrylonitrile butadiene styrene (ABS), as wellas nylon, polyethylene terephthalate glycol (PETG), polycarbonate (PC), and high-impactpolystyrene (HIPS). The variety of available feedstock materials, along with the technique’slow cost and easy application, have contributed to its surging growth [4].
1.2.1. The Emission Potential of the FFF Technique
As demonstrated in the 3D printing emission/exposure assessment literature [13],fused filament fabrication (FFF) activities can lead to exposure to ultrafine particles (UFP)and volatile organic compounds (VOCs). Ultrafine particles have been defined as a con-cerning issue with regard to deteriorating air quality, due to their association with negativehealth effects [14].
Nozzle temperature is recognized as the main determinant factor for emission lev-els, with UFP concentrations often varying by multiple orders of magnitude at differenttemperatures. The bed temperature and the nozzle diameter, as well as most printingparameters, can affect emissions to different degrees. The choice of filament material heav-ily affects all aspects of particle releases, while its chemical composition determines thespecies of the emitted VOCs [13,15]. Many VOCs species that have been detected during 3Dprinting activities have hazardous effects; for example, styrene is released when printingwith ABS materials [16]. Interestingly, while 3D printing is not a process that commonlyinvolves nanomaterials, the fact that the main exposure concerns in these processes arenanoparticles/ultrafine particles emitted from the polymer’s partial decomposition rendersthe process widely compatible with being assessed via the methodologies and techniquesdeveloped in the nanosafety research field.
Early research on the measurement of emissions caused by fused filament fabricationgenerally targeted the most widely used FFF materials, PLA, and ABS filaments [17]. In
Sustainability 2022, 14, 3046 3 of 26
general, PLA is considered one of the low-emitting, comparatively safer materials, whileABS has been demonstrated to possess high emission profiles for both ultrafine particles andVOCs [13,15]. Other common materials, such as nylon, may display intermediate emissionhazards [18], while specific unconventional materials, such as laywood, may presenthigh UFP emission potential [19]. In the last two years, the research focus has shiftedconsiderably to the study of less common materials, while the inclusion of (nano)additiveshas been examined as well.
Bernatikova et al. [20] evaluated the UFP and VOC emissions of PETG and co-polyester(NGEN) filaments, using an enclosed printer. Potentially harmful particle emission rateswere reported, and the presence of VOCs was confirmed, although at a low level. Dunnet al. [21] investigated the exposure to ultrafine particles caused by printing filamentsthat contain carbon nanotubes (CNTs) and carbon nanofibers (CNFs) in concentrationsof up to 25% and 30%, respectively. While concentration increases were observed for allmaterials when measuring emissions inside an enclosure, no deviation from the backgroundwas recorded for the workroom, even when using 6 printers simultaneously. This wasattributed to the high ventilation flow rate applied. Zhu et al. [22] examined the particulatematter (PM) and VOC concentrations resulting from the inclusion of lignocellulose in PLAfilaments, while Alberts et al. [23] studied the impact of copper and tungsten additives inthe emission profiles of filaments inside a chamber, showing increased emissions for theadditivated filaments.
The morphology of emitted particles is a less widely examined field and, whenassessing the connected risks, they are usually evaluated in terms of spherical particles.However, Kartz et al. [24] found that emissions consist mainly of fractal particles that canpenetrate deeper into the lungs than spheres of equivalent volume, which finding wasestablished after performing TEM analysis on particles collected during 3D printing.
The mechanism of UFP generation has been discussed previously in the literature. Theformation of semi-volatile compounds (SVCs) leads to the generation of ultrafine particlesreleased during thermal decomposition [25], which are transferred by the airflow patterns.As the process progresses, there is further growth of the UFP, either by the emitted SVCsattracted to the surface of the UFP or by the agglomeration of the particles as a result ofparticle-particle interaction. During printing, there is a dynamic balance between particlegeneration and removal, due to diffusion, deposition, and particle agglomeration, showinga decrease in the generated UFP matter during printing conditions [26].
Expanded emission research on the topic of unique, additivated, and prototype fil-ament materials will most certainly support the application of new materials in the FFFtechnique, thus extending its technological value.
1.2.2. Toxicity of the Emitted Particles
A limited number of toxicity studies of fused filament fabrication 3D printer emissionshave been carried out so far, focusing primarily on ABS materials. In terms of in vitrostudies, Farcas et al. [27] evaluated the toxicity of 3D printing emissions with ABS filamentsin an in vitro model, using human small-airway epithelial cells. At 24 h post-exposure,ABS emissions caused significant dose-dependent cytotoxicity, oxidative stress, apoptosis,necrosis, and the production of pro-inflammatory cytokines and chemokines in epithelialcells. Furthermore, Zhang et al. [18] found that ABS emissions from a consumer-level3D printer caused decreased cell viability, increased oxidative stress, and inflammatoryresponses in rat alveolar macrophages and human tumorigenic lung epithelial cells.
In terms of in vivo studies, Farcas et al. [28] examined repeated whole-body inhalationexposure to FFF 3D printing emissions that were released from ABS filament in commer-cially available desktop 3D printers. This was tested in rats for 4 h/day for 1, 4, 8, 15,and 30 days of exposure (4 days/week). The authors observed that 3D printing emissionscaused minimal and transient pulmonary and systemic effects on rats. The study concludesthat the potential of further acute and chronic inflammatory responses is high, especiallyregarding the use of multiple printers and printing of prolonged duration.
Sustainability 2022, 14, 3046 4 of 26
Stefaniak et al. [29] investigated the acute toxic effects of ABS emissions on cardiovascu-lar function via a nose-only inhalation study in rats. Exposure to 1 mg/m3 of ABS emissionfor 3 h induced significantly higher mean arterial pressure, along with elevated restingarteriolar tone and impaired endothelium-dependent arteriolar dilation. These resultsindicated that the 3D printer emissions could potentially induce systemic toxic effects.
Gumperlein et al. [30] conducted a randomized, cross-over design study, where healthyhuman volunteers were exposed to ABS 3D printer emissions for 1 h. No acute effects on theinflammatory markers in nasal secretions or urine were found. However, a slight increasein exhaled nitric oxide was noted, which could be induced by eosinophilic inflammationfrom inhaled UFPs. These findings may indicate a connection with the results of Stefaniaket al. [29], as a correlation between lower concentrations of circulating nitric oxide, higharterial pressure, and impaired arteriolar dilation is common among many species [31,32].
Moreover, in a health survey, Chan et al. [33] found that about 60% of participantsusing 3D printing in commercial prototyping businesses, educational institutions, andpublic libraries reported weekly respiratory symptoms. The same study also determinedthat working with it for more than 40 h per week was significantly associated with asthmaor allergic rhinitis diagnosis. In addition, House et al. [34], in a case report study, found thata self-employed businessman with a history of childhood asthma operated ten 3D printerswith ABS filaments in a small work area and after 10 days of working with ABS printing,he experienced chest tightness, shortness of breath, and coughing.
The research generally points toward the need for additional examinations to furtherclarify the expected toxicological effects of 3D printing emissions.
1.2.3. Novel FFF Materials
Using the FFF technique with novel or additivated materials has been explored forvarious high-performance [35] or unique property applications [36]. In such cases, the useof customized prototype filament feedstock materials may be preferred for tailoring theproperties as required. Specialized filaments may be produced by means of the incorpo-ration of additives with special properties (e.g., nanomaterials, flame-resistant additives,metal particles) to a commonly used thermoplastic feedstock matrix. Using nanomaterialscontaining filaments can offer unique properties, such as electrical conductivity [37]. Thenano-inclusions introduce additional parameters, such as interparticle distance and theorientation of nanoparticles [38], that may influence printability and end-product proper-ties. Composite filaments, such as filaments containing short carbon fibers, can be usedfor achieving higher strength, stiffness, and dimensional stability [39]. Printing with otherunique filaments, such as foaming filament [40], requires precise control procedures forcrucial print parameters, such as a variable nozzle temperature and extrusion rate. Theseunique materials are, unsurprisingly, demanding in terms of printability assessment. Quiteimportantly, the introduction of unique additives can also significantly influence occupa-tional and environmental emissions and exposure potential. It is reasonable to assumethat the emission profile of the prototype materials will not be definitely known; there-fore, a quick and effective preliminary emission assessment before commencing the massproduction of parts would be vital for process safety optimization.
1.2.4. FFF and Microfluidics
The FFF technique is currently gaining increasing interest in the fabrication of microflu-idic devices. Glass and silicon—and later, polydimethylsiloxane (PDMS) [41]—have beenthe traditional materials by way of manufacturing microfluidic platforms via photolithog-raphy, soft lithography, and micromachining [42]. However, such techniques require anin-depth knowledge of operating specialized equipment, as well as the investment neededfor purchasing such devices. FFF is considered an economically viable alternative for themachining of microfluidic devices using PMMA, PLA, and ABS filaments down to approx.300 µm channels [41,43], due to the lower cost of the equipment, the ease of direct-printingthe devices, the wider variety of polymer materials, the lower temperature conditions re-
Sustainability 2022, 14, 3046 5 of 26
quired, and the wider accessibility of FFF to research groups of different backgrounds [44].However, the need for post-processing, such as the removal of the support structures, thelong manufacturing times (especially for larger pieces), the surface roughness, and imper-fect sealing between the 3D printed layers minimize the applicability of FFF [42]. Anotherissue is air entrapment between the printed layers, lowering the visibility of translucentpolymers [41].
In this context, the EU-funded project “M3DLoC” [45] (Grant Agreement 760662,Horizon 2020) deals with the development of a pilot line for the manufacturing of PLAmicrofluidic devices with conductive channels (using nano-enabled conductive inks), im-plementing FFF, that can be used as lab-on-chip platforms. The pilot line employs FFFtechnology for the manufacturing of polymer substrates, followed by additional worksta-tions for processing the device, and then quality assurance stations. The FFF technique is avital element of the M3DLoC pilot line and the production of biomedical microelectrome-chanical systems (BIOMEMS) for the production of PLA-based substrates with or withoutadditive nanomaterials in the polymer matrix. Therefore, the exposure assessment workdescribed herein is an important supportive component to the safe setup and operation ofthis innovative pilot line.
1.3. Utility of a Production Goal-Based Assessment
In this study, a production goal-based emission and exposure assessment is presented,from study conception and setup, to analysis, outputs, and decision support-orientedconclusions. A number of emission/exposure assessment tests were set up and performed,using the candidate materials for manufacturing the polymer substrate of the microfluidicdevice. The data produced are valuable for future decision support regarding the optimalmaterial and process configuration. The integrated workflow as a whole is presentedas a suggested approach that can be followed in terms of identifying emission safetyissues and defining the most appropriate material and process alternatives. The proposedmethodology can provide a basis for implementation in cases of similar scope and canbe applied by the relevant stakeholders or safety experts (e.g., safety engineers, exposureassessors, and safety consultants).
2. Materials and Methods2.1. Materials
In the framework of a M3DLoC project, PLA-blends and compounds were investigated,as part of a material development workflow for FFF processability enhancement and bulkmodification with additives targeted toward application-specific properties, e.g., surfaceenergy adjustment to customize the wetting behavior of water-based inks, heat dissipation,and insulating properties. Table 1 presents the 3D printing filament feedstock candidatematerials that were used in the emission/exposure assessment experiments, representing anindicative selection of pure PLA blends (Ingeo 3D850/3052D grades by NatureWorks LLC,Minneapolis, MN, USA) and PLA compounds with polybutylene adipate terephthalate(PBAT), inorganic filler (Ingeo 3D850/IS1335 ecovio™, kindly provided by BASF HellasSA, Marousi, Greece), and PLA nanocomposite by the incorporation of reduced grapheneoxide filler (rGO) via twin-screw extrusion. The rGO was prepared in a thermochemicalreduction process [46], starting with GO prepared using a modified Hummers’ method [47],as described in [48]. The rGO showed 43 µm of lateral size, as determined by laserdiffraction; thickness below 1 nm was determined by TEM and AFM, and 1.3 wt % ofoxygen was determined by XPS (49% C=O and 46% C-OH). The rGO showed thermalstability over 600 ◦C, as determined by TGA.
An important constraint in the present study was caused by the small quantities of thematerials that were allocated, considering that these were prototype materials; it is beneficialin such approaches to allocating small amounts of material for testing. Thus, the followingexperiments were adjusted accordingly. This feature can render the methodology applicable
Sustainability 2022, 14, 3046 6 of 26
even when numerous candidate materials are required to be tested since this process wouldnot need large volumes of production to be invested in the pre-assessment stage.
Table 1. Filaments used as 3D printer feedstocks during the exposure assessment experiments.
Material Name Composition Type of Material Quantity of Filament
Ingeo 3D850/3052D 4:1 blend (20 wt %) PLA/PLA 8 m
Ingeo 3D850/BASF ecovio IS1335 4:1 blend (20 wt %) PLA/PBAT/inorganic filler 8 m
Ingeo 3D850/reduced grapheneoxide (rGO) 0.05 wt % rGO PLA/reduced graphene oxide 8 m
2.2. Exposure Assessment Methodology
As of the time of conducting this study, there is only one standardized methodologyfor performing emission assessment in FFF 3D printing processes, as described in theANSI standard, ANSI/CAN/UL 2904 [49]. A similarly themed ISO standard, ISO/ASTMCD 52932 [50], remains in development. The methodology developed in [49] is focusedon assessing the emission rates of numerous combinations of filament/printer/print pa-rameter scenarios, using isolated environmental chambers of defined specifications. It wasdetermined that for the purposes of this study, this approach was not directly applicable.Additionally, based on the scope of this work being introduced as a suggestion for 3Dprinting workspaces, minimal interference or disruption to the normal process setup andworkflow is reasonably expected to be desirable before starting mass production. Therequirements of the material to be used for the emission test prints are also higher in [49],requiring prints that take at least 1.5 h, which is incompatible with the limited amounts ofprototype materials that were at our disposal.
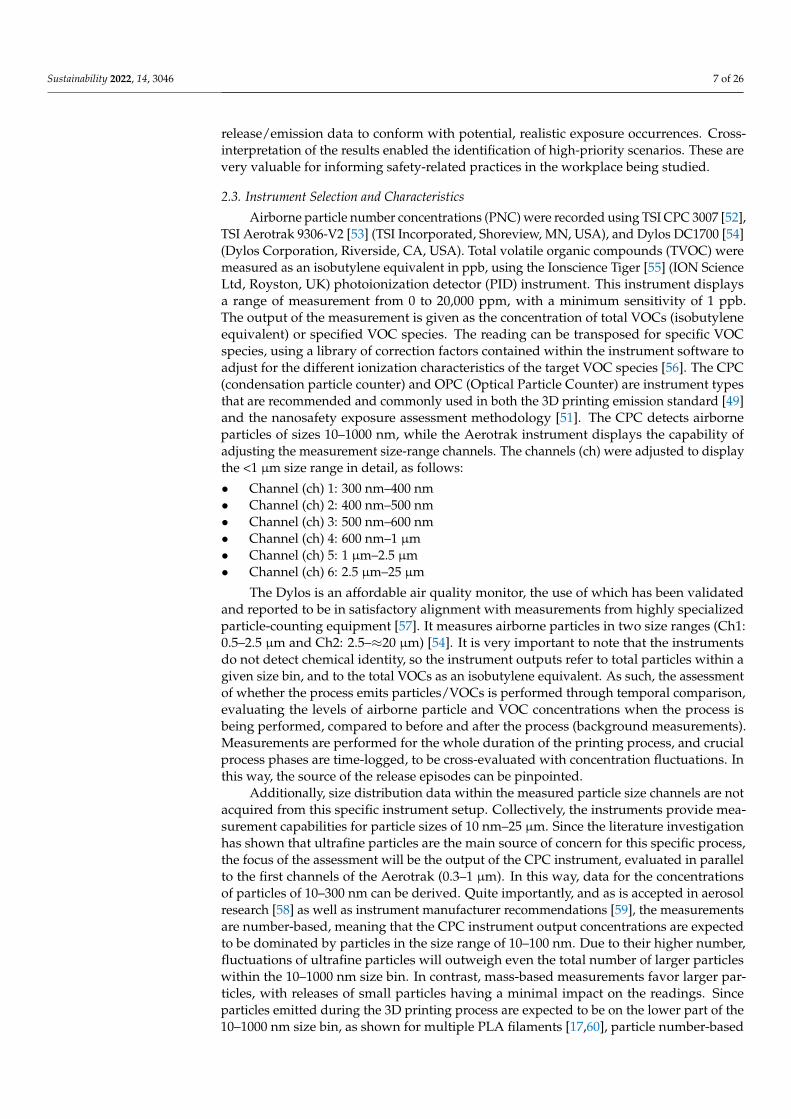
The customized methodology that was developed for this work (Figure 1) was basedon the Organization for Economic Co-operation and Development (OECD) harmonizedtiered framework for the exposure assessment of nanoparticles [51], aligned to some extentand in certain elements (such as equipment selection and temporal setup of measure-ments) with the 3D printing exposure assessment standard [49]. While this methodologyis tailored for engineered nanomaterials, FFF emissions are expected to consist mainly ofultrafine particles, as the literature confirms, displaying analogous behavior and exhibitingsimilar challenges.
Sustainability 2022, 14, 3046 7 of 27
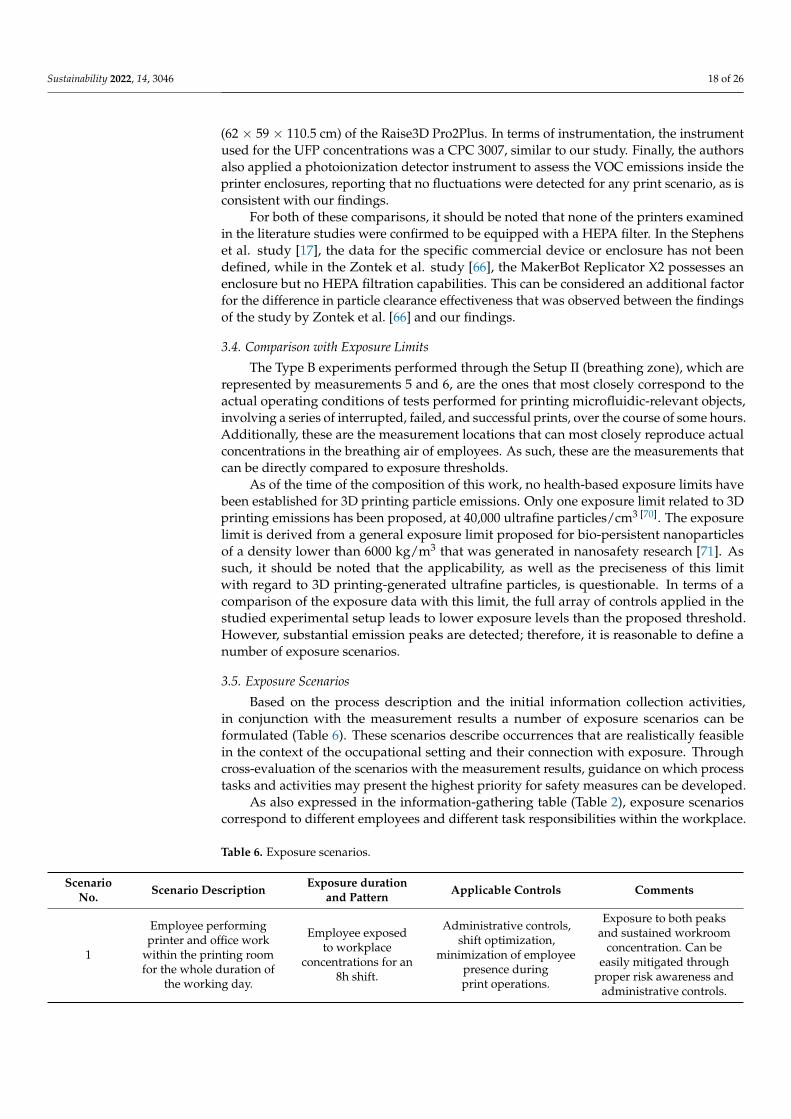
In parallel to the comparative assessment, based on the work practices already described, a set of exposure scenarios were defined that are necessary for transposing the release/emission data to conform with potential, realistic exposure occurrences. Cross-interpretation of the results enabled the identification of high-priority scenarios. These are very valuable for informing safety-related practices in the workplace being studied.
Figure 1. Methodology applied for the release and exposure measurements.
2.3. Instrument Selection and Characteristics Airborne particle number concentrations (PNC) were recorded using TSI CPC 3007
[52], TSI Aerotrak 9306-V2 [53] (TSI Incorporated, Shoreview, MN, USA), and Dylos DC1700 [54] (Dylos Corporation, Riverside, CA, USA). Total volatile organic compounds (TVOC) were measured as an isobutylene equivalent in ppb, using the Ionscience Tiger [55] (ION Science Ltd, Royston, UK) photoionization detector (PID) instrument. This instrument displays a range of measurement from 0 to 20,000 ppm, with a minimum sensitivity of 1 ppb. The output of the measurement is given as the concentration of total VOCs (isobutylene equivalent) or specified VOC species. The reading can be transposed for specific VOC species, using a library of correction factors contained within the instrument software to adjust for the different ionization characteristics of the target VOC species [56]. The CPC (condensation particle counter) and OPC (Optical Particle Counter) are instrument types that are recommended and commonly used in both the 3D printing emission standard [49] and the nanosafety exposure assessment methodology [51]. The CPC detects airborne particles of sizes 10 – 1000 nm, while the Aerotrak instrument displays the capability of adjusting the measurement size-range channels. The channels (ch) were adjusted to display the < 1 μm size range in detail, as follows: • Channel (ch) 1: 300 nm–400 nm • Channel (ch) 2: 400 nm–500 nm • Channel (ch) 3: 500 nm–600 nm • Channel (ch) 4: 600 nm–1 μm • Channel (ch) 5: 1 μm–2.5 μm • Channel (ch) 6: 2.5 μm–25 μm
The Dylos is an affordable air quality monitor, the use of which has been validated and reported to be in satisfactory alignment with measurements from highly specialized particle-counting equipment [57]. It measures airborne particles in two size ranges (Ch1: 0.5–2.5 μm and Ch2: 2.5–≈20 μm) [54]. It is very important to note that the instruments do not detect chemical identity, so the instrument outputs refer to total particles within a given size bin, and to the total VOCs as an isobutylene equivalent. As such, the assessment of whether the process emits particles/VOCs is performed through temporal comparison, evaluating the levels of airborne particle and VOC concentrations when the process is being performed, compared to before and after the process (background measurements). Measurements are performed for the whole duration of the printing process, and crucial process phases are time-logged, to be cross-evaluated with concentration fluctuations. In this way, the source of the release episodes can be pinpointed.
Additionally, size distribution data within the measured particle size channels are not acquired from this specific instrument setup. Collectively, the instruments provide
1Information Gathering
2Experiment
design
3Measurements
4Exposure scenario
description
5Cross-
interpretation of results
6Decision suport
for optimal process setup
Figure 1. Methodology applied for the release and exposure measurements.
The steps that were implemented can be summarized as follows. Initially, the first setof data on the process was acquired from the process operators, with the aim of gaininga deep understanding of the process’ specificities and details. Based on this dataset, therelease/exposure measurements were designed to offer the maximum gained informationin a short time span, and with the use of low material quantities. It has also assisted inadapting the methodology so as to involve simple object designs, which is compatible withprintability tests.
In parallel to the comparative assessment, based on the work practices already de-scribed, a set of exposure scenarios were defined that are necessary for transposing the
Sustainability 2022, 14, 3046 7 of 26
release/emission data to conform with potential, realistic exposure occurrences. Cross-interpretation of the results enabled the identification of high-priority scenarios. These arevery valuable for informing safety-related practices in the workplace being studied.
2.3. Instrument Selection and Characteristics
Airborne particle number concentrations (PNC) were recorded using TSI CPC 3007 [52],TSI Aerotrak 9306-V2 [53] (TSI Incorporated, Shoreview, MN, USA), and Dylos DC1700 [54](Dylos Corporation, Riverside, CA, USA). Total volatile organic compounds (TVOC) weremeasured as an isobutylene equivalent in ppb, using the Ionscience Tiger [55] (ION ScienceLtd, Royston, UK) photoionization detector (PID) instrument. This instrument displaysa range of measurement from 0 to 20,000 ppm, with a minimum sensitivity of 1 ppb.The output of the measurement is given as the concentration of total VOCs (isobutyleneequivalent) or specified VOC species. The reading can be transposed for specific VOCspecies, using a library of correction factors contained within the instrument software toadjust for the different ionization characteristics of the target VOC species [56]. The CPC(condensation particle counter) and OPC (Optical Particle Counter) are instrument typesthat are recommended and commonly used in both the 3D printing emission standard [49]and the nanosafety exposure assessment methodology [51]. The CPC detects airborneparticles of sizes 10–1000 nm, while the Aerotrak instrument displays the capability ofadjusting the measurement size-range channels. The channels (ch) were adjusted to displaythe <1 µm size range in detail, as follows:
• Channel (ch) 1: 300 nm–400 nm• Channel (ch) 2: 400 nm–500 nm• Channel (ch) 3: 500 nm–600 nm• Channel (ch) 4: 600 nm–1 µm• Channel (ch) 5: 1 µm–2.5 µm• Channel (ch) 6: 2.5 µm–25 µm
The Dylos is an affordable air quality monitor, the use of which has been validatedand reported to be in satisfactory alignment with measurements from highly specializedparticle-counting equipment [57]. It measures airborne particles in two size ranges (Ch1:0.5–2.5 µm and Ch2: 2.5–≈20 µm) [54]. It is very important to note that the instrumentsdo not detect chemical identity, so the instrument outputs refer to total particles within agiven size bin, and to the total VOCs as an isobutylene equivalent. As such, the assessmentof whether the process emits particles/VOCs is performed through temporal comparison,evaluating the levels of airborne particle and VOC concentrations when the process isbeing performed, compared to before and after the process (background measurements).Measurements are performed for the whole duration of the printing process, and crucialprocess phases are time-logged, to be cross-evaluated with concentration fluctuations. Inthis way, the source of the release episodes can be pinpointed.
Additionally, size distribution data within the measured particle size channels are notacquired from this specific instrument setup. Collectively, the instruments provide mea-surement capabilities for particle sizes of 10 nm–25 µm. Since the literature investigationhas shown that ultrafine particles are the main source of concern for this specific process,the focus of the assessment will be the output of the CPC instrument, evaluated in parallelto the first channels of the Aerotrak (0.3–1 µm). In this way, data for the concentrationsof particles of 10–300 nm can be derived. Quite importantly, and as is accepted in aerosolresearch [58] as well as instrument manufacturer recommendations [59], the measurementsare number-based, meaning that the CPC instrument output concentrations are expectedto be dominated by particles in the size range of 10–100 nm. Due to their higher number,fluctuations of ultrafine particles will outweigh even the total number of larger particleswithin the 10–1000 nm size bin. In contrast, mass-based measurements favor larger par-ticles, with releases of small particles having a minimal impact on the readings. Sinceparticles emitted during the 3D printing process are expected to be on the lower part of the10–1000 nm size bin, as shown for multiple PLA filaments [17,60], particle number-based
Sustainability 2022, 14, 3046 8 of 26
measurements were considered to be preferable. All instruments were zero-checked beforeevery experiment and had previously been calibrated by the manufacturer.
2.4. Information-Gathering
The first step in any exposure assessment measurement setup is the collection of basicinformation on the process. While FFF 3D printing is a highly automated process and astep like this may seem redundant, information such as controls that are active, workplace-specific worker practices, and potential incidental sources of particles are integral to datainterpretation. We suggest documenting a structured list of information as a basis for theassessment to be performed (Table 2). This should include, but may not be limited to:
• Equipment used;• Materials used;• Description of work practices;• Controls in place;• Maintenance schedule;• Potential incidental particle and VOC sources.
Table 2. Information-gathering for the 3D printing workplace being studied.
Basic Exposure-Related Information
Process Fused filament fabrication 3D printing
Release/exposure expected Emission of particles (ultrafine and microscale) and VOCs due to partial decomposition and the thermaldegradation of polymer filament.
Workroom characteristicsVolume: ≈45 m3
Air conditioning in function during the whole workdayTemperature: 24 ◦C–30 ◦C
Relative Humidity: 43–48%
Secondary processes conductedwithin the workroom
Office work supportive to the printer (e.g., STL file preparation, print video capture), print post-processing(e.g., support removal), print test result evaluation.
Materials usedIngeo 3D850/3052D—8 m of filament
Ingeo 3D850/BASF ecovio IS133—8 m of filamentIngeo 3D850/reduced Graphene Oxide(rGO)—8 m of filament
Process automation Manual process initiation (print start) and finish (print removal); printing itself requires only progressmonitoring. Manual stop and object removal in the case of critical defects.
Process containment Printer (Raise3D Pro2 Plus 3D [61]) is fully enclosed while operating. Specific process sub-phases requireshort-term enclosure disruption.
Process duration Full 8 h workday. Long prints may continue overnight, being monitored remotely.
Employees associated withthe process
2 employees are directly involved (applicable for exposure scenarios 1–5—see Section 3.5) and 2 employeesare indirectly involved (applicable for exposure scenarios 3–5—see Section 3.5).
Work patterns Specific print phases or maintenance, repair, and process optimization activities require employees to work inclose proximity to the printer, and with the main exposure control (printer enclosure) disabled.
Maintenance scheduleCleaning of the printer bed every day, removal of filament waste after every print, regular hot-end
replacement, regular HEPA (high-efficiency particulate absorbing filter) filter replacement (printer outflowand air purifier).
Primary particle emission source Main 3D printing process
Incidental particleemission sources
No other instruments that can lead to particle generation are used within the specific workroom during printoperations. No apparent sources of significant incidental ultrafine particle emissions. General workplace dustparticles may be present. Disturbance of settled/deposited particles on work surfaces may occur (e.g., due to
air conditioning airflow).
Primary VOC emission source Main 3D printing process
Incidental VOCemission sources Print bed adhesion sprays, print object coloring sprays
Current controls applied General Ventilation, Mechanical ventilation, HEPA filter in printer enclosure exhaust, Air purifier equippedwith HEPA filter, filtering facepiece respirators (FFP3) masks available in the workplace.
2.5. Hazard Identification
The work performed in this study is focused on determining release and exposurepotential from the 3D printing processes applied. However, a crucially important parameterin assessing the risk present from these emissions is the inherent danger of the particles.
Sustainability 2022, 14, 3046 9 of 26
No directly applicable/derivable results to the ones to be produced in this measurementcampaign can be found in the literature, due to the prototype materials used. Nevertheless,the presence of cytotoxic potential has been demonstrated for PLA-emitted particles in thescientific literature [18], leading to the assumption that cytotoxic effects are possible for theultrafine particle emissions of the PLA-based materials used within the scope of this study.
Between filament Ingeo 3D850/3052D and filament Ingeo 3D850/BASF ecovio IS133,any estimate on different levels of threat is unclear since no clear comparison betweenthe hazardousness of PBAT- and PLA- emitted particles can be performed. Similarly, thedifference in the expected size of the particles emitted within the ultrafine size range(1–100 nm) is also unclear. The hazard potential of these two materials can reasonably beassumed to be equal, in view of the absence of data.
However, the presence of rGO in the Ingeo 3D850/reduced Graphene Oxide(rGO)filament may be an indication of increased risk. Nano-reinforcement particles have beenreported to be emitted from nano-reinforced filaments [62]. This may be the source ofincreased risk for this specific filament. It is also unknown if the presence of rGO willimpact the thermal stability of the composite filament as a whole, resulting in a differentpattern or magnitude of general ultrafine particle emission. Additionally, an increased riskmay also be present due to the protrusion of rGO particles from the printed objects, an issuethat has been identified for similar CNT-reinforced 3D printed objects [62]. No significantdermal exposure is expected since the application (a microfluidic device) is not one thatnecessitates lengthy manual interaction (e.g., hand tools); however, precautions againstdermal irritation are applicable. The use of gloves is commonly suggested for handlinggraphene-containing filament or printed objects [63]. Quite importantly, mechanical stress(e.g., post-processing) of the objects printed using this specific filament may lead to thesmall-scale release of airborne particles containing rGO. These additional hazards areabsent from the non-nanomaterial-containing filaments. Therefore, from the preliminarystages, and following a precautionary approach, the rGO-containing filament is indicatedas displaying the potential for higher risk compared to the other two filament types.
In terms of VOC species emitted, the general findings from the literature show that forPLA, the main VOC species emitted is lactide [13,64]. The emission of methyl methacrylateand acetaldehyde is also possible, in lower but considerable concentrations [64]. Other,less hazardous, or negligible quantities of VOC species have been identified in PLA VOCemissions [13,64], such as decanal [64].
2.6. Measurement Campaign Design2.6.1. Instrument Placement
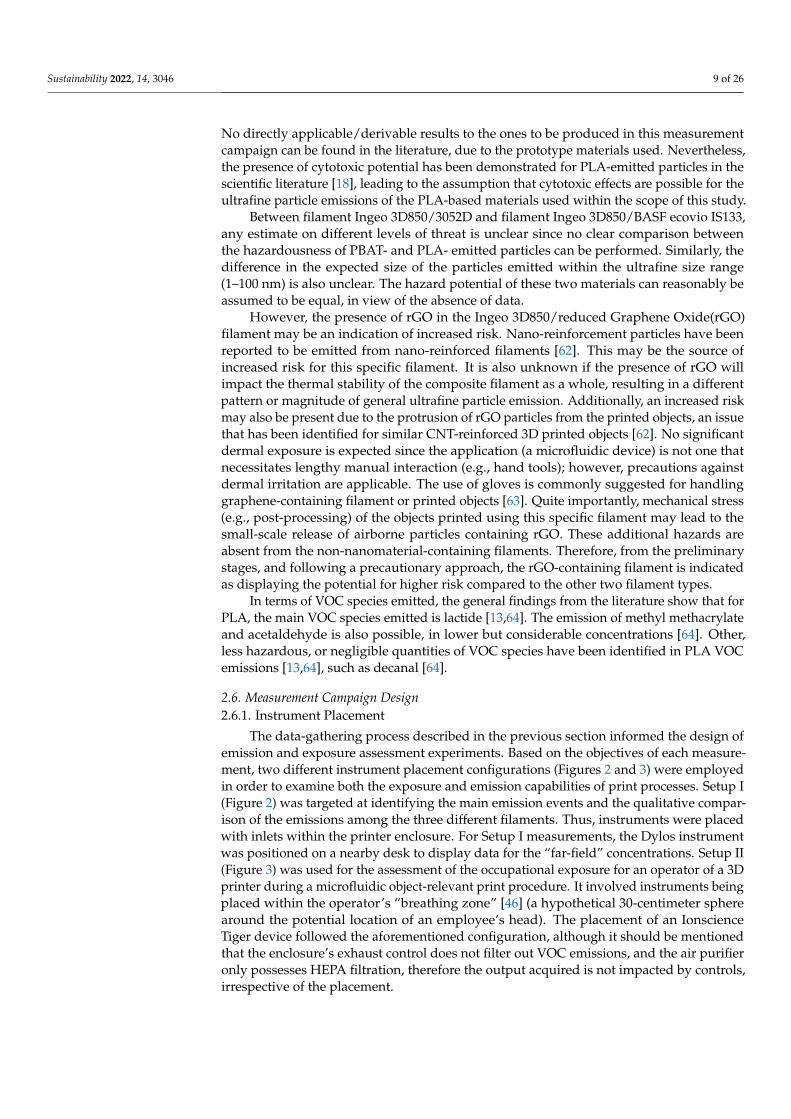
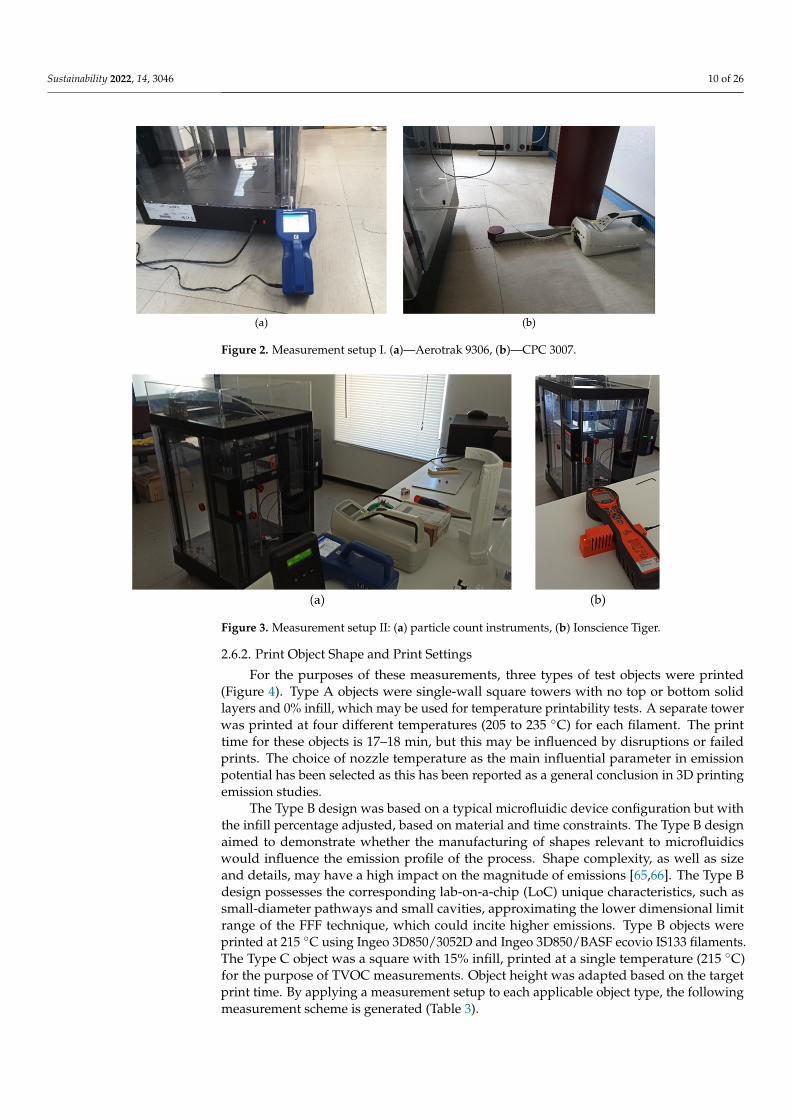
The data-gathering process described in the previous section informed the design ofemission and exposure assessment experiments. Based on the objectives of each measure-ment, two different instrument placement configurations (Figures 2 and 3) were employedin order to examine both the exposure and emission capabilities of print processes. Setup I(Figure 2) was targeted at identifying the main emission events and the qualitative compar-ison of the emissions among the three different filaments. Thus, instruments were placedwith inlets within the printer enclosure. For Setup I measurements, the Dylos instrumentwas positioned on a nearby desk to display data for the “far-field” concentrations. Setup II(Figure 3) was used for the assessment of the occupational exposure for an operator of a 3Dprinter during a microfluidic object-relevant print procedure. It involved instruments beingplaced within the operator’s “breathing zone” [46] (a hypothetical 30-centimeter spherearound the potential location of an employee’s head). The placement of an IonscienceTiger device followed the aforementioned configuration, although it should be mentionedthat the enclosure’s exhaust control does not filter out VOC emissions, and the air purifieronly possesses HEPA filtration, therefore the output acquired is not impacted by controls,irrespective of the placement.
Sustainability 2022, 14, 3046 10 of 26
Sustainability 2022, 14, 3046 10 of 27
may lead to the small-scale release of airborne particles containing rGO. These additional hazards are absent from the non-nanomaterial-containing filaments. Therefore, from the preliminary stages, and following a precautionary approach, the rGO-containing filament is indicated as displaying the potential for higher risk compared to the other two filament types.
In terms of VOC species emitted, the general findings from the literature show that for PLA, the main VOC species emitted is lactide [13,64]. The emission of methyl methacrylate and acetaldehyde is also possible, in lower but considerable concentrations [64]. Other, less hazardous, or negligible quantities of VOC species have been identified in PLA VOC emissions [13,64], such as decanal [64].
2.6. Measurement Campaign Design 2.6.1. Instrument Placement
The data-gathering process described in the previous section informed the design of emission and exposure assessment experiments. Based on the objectives of each measurement, two different instrument placement configurations (Figures 2 and 3) were employed in order to examine both the exposure and emission capabilities of print processes. Setup I (Figure 2) was targeted at identifying the main emission events and the qualitative comparison of the emissions among the three different filaments. Thus, instruments were placed with inlets within the printer enclosure. For Setup I measurements, the Dylos instrument was positioned on a nearby desk to display data for the “far-field” concentrations. Setup II (Figure 3) was used for the assessment of the occupational exposure for an operator of a 3D printer during a microfluidic object-relevant print procedure. It involved instruments being placed within the operator’s “breathing zone” [46] (a hypothetical 30-centimeter sphere around the potential location of an employee’s head). The placement of an Ionscience Tiger device followed the aforementioned configuration, although it should be mentioned that the enclosure’s exhaust control does not filter out VOC emissions, and the air purifier only possesses HEPA filtration, therefore the output acquired is not impacted by controls, irrespective of the placement.
Figure 2. Measurement setup I. (a)—Aerotrak 9306, (b)—CPC 3007. Figure 2. Measurement setup I. (a)—Aerotrak 9306, (b)—CPC 3007.
Sustainability 2022, 14, 3046 11 of 27
Figure 3. Measurement setup II: (a) particle count instruments, (b) Ionscience Tiger.
2.6.2. Print Object Shape and Print Settings For the purposes of these measurements, three types of test objects were printed
(Figure 4). Type A objects were single-wall square towers with no top or bottom solid layers and 0% infill, which may be used for temperature printability tests. A separate tower was printed at four different temperatures (205 to 235 °C) for each filament. The print time for these objects is 17–18 minutes, but this may be influenced by disruptions or failed prints. The choice of nozzle temperature as the main influential parameter in emission potential has been selected as this has been reported as a general conclusion in 3D printing emission studies.
The Type B design was based on a typical microfluidic device configuration but with the infill percentage adjusted, based on material and time constraints. The Type B design aimed to demonstrate whether the manufacturing of shapes relevant to microfluidics would influence the emission profile of the process. Shape complexity, as well as size and details, may have a high impact on the magnitude of emissions [65,66]. The Type B design possesses the corresponding lab-on-a-chip (LoC) unique characteristics, such as small-diameter pathways and small cavities, approximating the lower dimensional limit range of the FFF technique, which could incite higher emissions. Type B objects were printed at 215 °C using Ingeo 3D850/3052D and Ingeo 3D850/BASF ecovio IS133 filaments. The Type C object was a square with 15% infill, printed at a single temperature (215 °C) for the purpose of TVOC measurements. Object height was adapted based on the target print time. By applying a measurement setup to each applicable object type, the following measurement scheme is generated (Table 3).
Figure 3. Measurement setup II: (a) particle count instruments, (b) Ionscience Tiger.
2.6.2. Print Object Shape and Print Settings
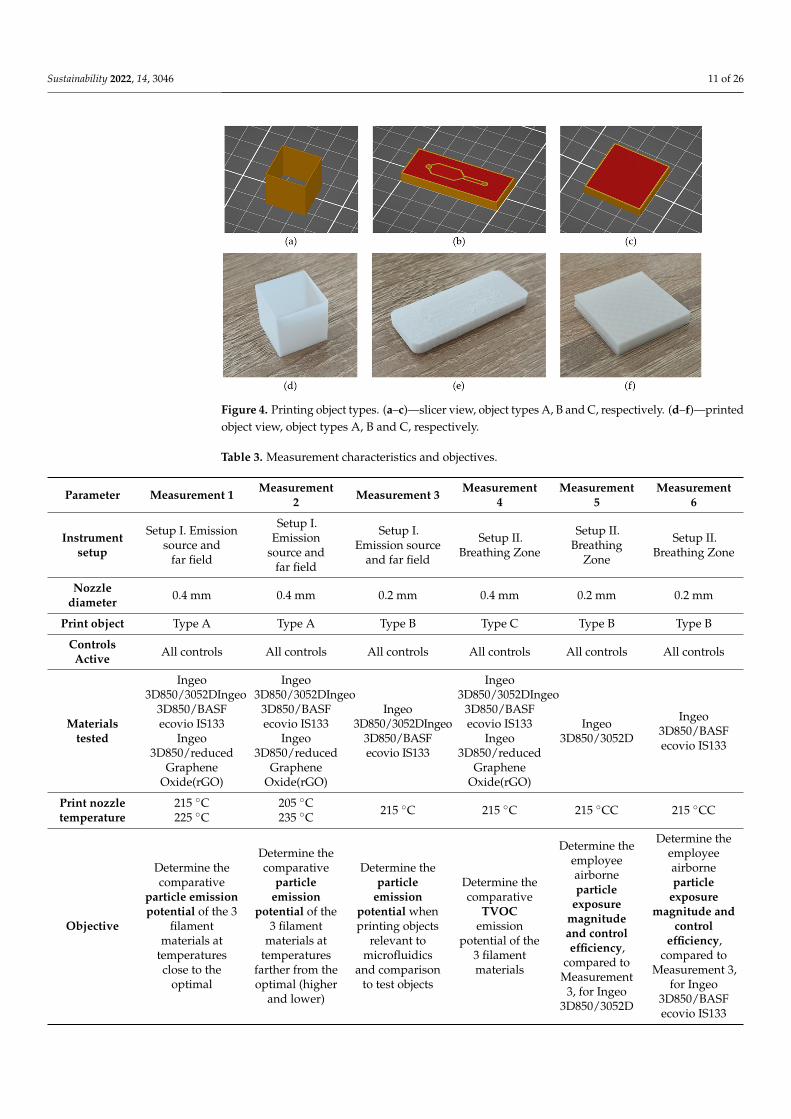
For the purposes of these measurements, three types of test objects were printed(Figure 4). Type A objects were single-wall square towers with no top or bottom solidlayers and 0% infill, which may be used for temperature printability tests. A separate towerwas printed at four different temperatures (205 to 235 ◦C) for each filament. The printtime for these objects is 17–18 min, but this may be influenced by disruptions or failedprints. The choice of nozzle temperature as the main influential parameter in emissionpotential has been selected as this has been reported as a general conclusion in 3D printingemission studies.
The Type B design was based on a typical microfluidic device configuration but withthe infill percentage adjusted, based on material and time constraints. The Type B designaimed to demonstrate whether the manufacturing of shapes relevant to microfluidicswould influence the emission profile of the process. Shape complexity, as well as sizeand details, may have a high impact on the magnitude of emissions [65,66]. The Type Bdesign possesses the corresponding lab-on-a-chip (LoC) unique characteristics, such assmall-diameter pathways and small cavities, approximating the lower dimensional limitrange of the FFF technique, which could incite higher emissions. Type B objects wereprinted at 215 ◦C using Ingeo 3D850/3052D and Ingeo 3D850/BASF ecovio IS133 filaments.The Type C object was a square with 15% infill, printed at a single temperature (215 ◦C)for the purpose of TVOC measurements. Object height was adapted based on the targetprint time. By applying a measurement setup to each applicable object type, the followingmeasurement scheme is generated (Table 3).
Sustainability 2022, 14, 3046 11 of 26Sustainability 2022, 14, 3046 12 of 27
Figure 4. Printing object types. (a–c)—slicer view, object types A, B, and C, respectively. (d–f)—printed object view, object types A,B, and C, respectively.
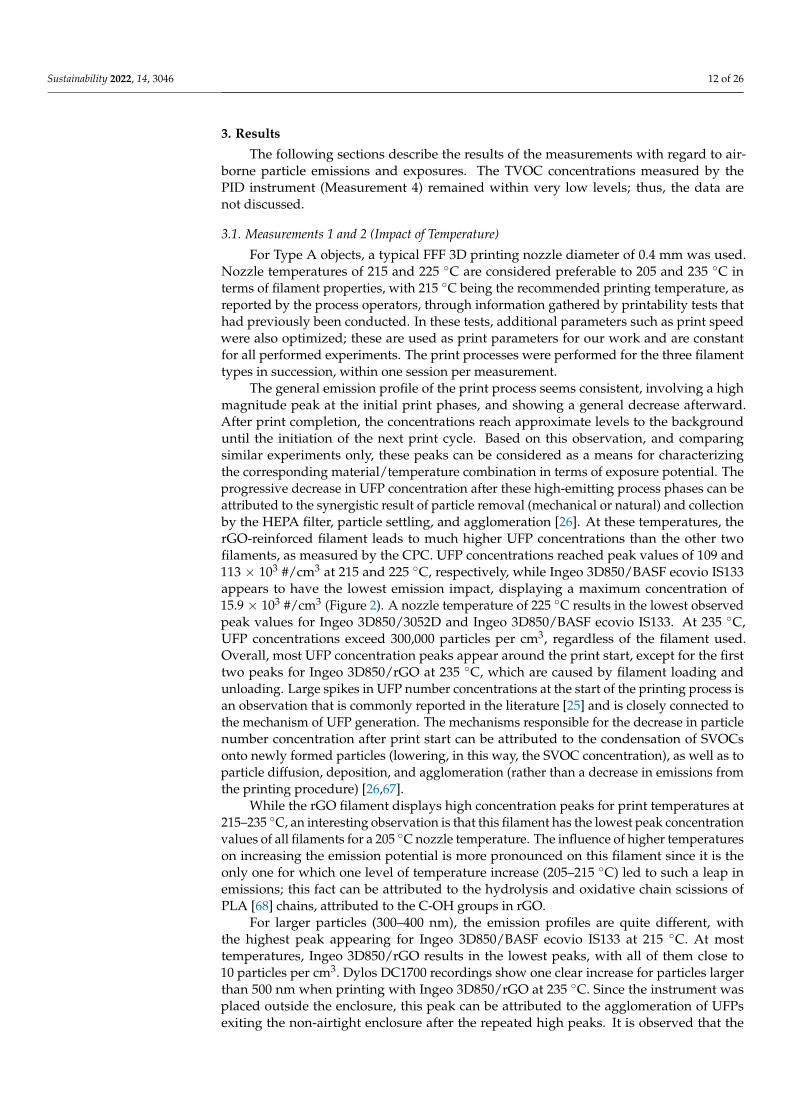
Table 3. Measurement characteristics and objectives.
Parameter Measurement 1 Measurement 2 Measurement 3 Measurement 4 Measurement 5 Measurement 6 Instrumen
t setup Setup I. Emission
source and far field Setup I. Emission
source and far field Setup I. Emission
source and far field Setup II. Breathing
Zone Setup II. Breathing
Zone Setup II. Breathing
Zone Nozzle
diameter 0.4 mm 0.4 mm 0.2 mm 0.4 mm 0.2 mm 0.2 mm
Print object Type A Type A Type B Type C Type B Type B
Controls Active All controls All controls All controls All controls All controls All controls
Materials tested
Ingeo 3D850/3052D Ingeo 3D850/BASF
ecovio IS133 Ingeo
3D850/reduced Graphene
Oxide(rGO)
Ingeo 3D850/3052D Ingeo 3D850/BASF
ecovio IS133 Ingeo
3D850/reduced Graphene
Oxide(rGO)
Ingeo 3D850/3052DIngeo 3D850/BASF
ecovio IS133
Ingeo 3D850/3052D Ingeo 3D850/BASF
ecovio IS133 Ingeo
3D850/reduced Graphene
Oxide(rGO)
Ingeo 3D850/3052DIngeo 3D850/BASF
ecovio IS133
Print nozzle
temperature
215 oC 225 oC
205 oC 235 oC
215 oC 215 oC 215 oC 215 oC
Objective
Determine the comparative
particle emission potential of the 3
filament materials at temperatures close
to the optimal
Determine the comparative
particle emission potential of the 3
filament materials at temperatures
farther from the optimal (higher and
lower)
Determine the particle emission potential when printing objects
relevant to microfluidics and comparison to test
objects
Determine the comparative TVOC emission potential of the 3 filament
materials
Determine the employee airborne particle exposure magnitude and
control efficiency, compared to
Measurement 3, for Ingeo 3D850/3052D
Determine the employee airborne particle exposure magnitude and
control efficiency, compared to
Measurement 3, for Ingeo 3D850/BASF
ecovio IS133
Figure 4. Printing object types. (a–c)—slicer view, object types A, B and C, respectively. (d–f)—printedobject view, object types A, B and C, respectively.
Table 3. Measurement characteristics and objectives.
Parameter Measurement 1 Measurement2 Measurement 3 Measurement
4Measurement
5Measurement
6
Instrumentsetup
Setup I. Emissionsource and
far field
Setup I.Emission
source andfar field
Setup I.Emission source
and far field
Setup II.Breathing Zone
Setup II.Breathing
Zone
Setup II.Breathing Zone
Nozzlediameter 0.4 mm 0.4 mm 0.2 mm 0.4 mm 0.2 mm 0.2 mm
Print object Type A Type A Type B Type C Type B Type B
ControlsActive All controls All controls All controls All controls All controls All controls
Materialstested
Ingeo3D850/3052DIngeo
3D850/BASFecovio IS133
Ingeo3D850/reduced
GrapheneOxide(rGO)
Ingeo3D850/3052DIngeo
3D850/BASFecovio IS133
Ingeo3D850/reduced
GrapheneOxide(rGO)
Ingeo3D850/3052DIngeo
3D850/BASFecovio IS133
Ingeo3D850/3052DIngeo
3D850/BASFecovio IS133
Ingeo3D850/reduced
GrapheneOxide(rGO)
Ingeo3D850/3052D
Ingeo3D850/BASFecovio IS133
Print nozzletemperature
215 ◦C225 ◦C
205 ◦C235 ◦C 215 ◦C 215 ◦C 215 ◦CC 215 ◦CC
Objective
Determine thecomparative
particle emissionpotential of the 3
filamentmaterials at
temperaturesclose to the
optimal
Determine thecomparative
particleemission
potential of the3 filament
materials attemperatures
farther from theoptimal (higher
and lower)
Determine theparticle
emissionpotential whenprinting objects
relevant tomicrofluidics
and comparisonto test objects
Determine thecomparative
TVOCemission
potential of the3 filamentmaterials
Determine theemployeeairborneparticle
exposuremagnitudeand controlefficiency,
compared toMeasurement
3, for Ingeo3D850/3052D
Determine theemployeeairborneparticle
exposuremagnitude and
controlefficiency,
compared toMeasurement 3,
for Ingeo3D850/BASFecovio IS133
Sustainability 2022, 14, 3046 12 of 26
3. Results
The following sections describe the results of the measurements with regard to air-borne particle emissions and exposures. The TVOC concentrations measured by thePID instrument (Measurement 4) remained within very low levels; thus, the data arenot discussed.
3.1. Measurements 1 and 2 (Impact of Temperature)
For Type A objects, a typical FFF 3D printing nozzle diameter of 0.4 mm was used.Nozzle temperatures of 215 and 225 ◦C are considered preferable to 205 and 235 ◦C interms of filament properties, with 215 ◦C being the recommended printing temperature, asreported by the process operators, through information gathered by printability tests thathad previously been conducted. In these tests, additional parameters such as print speedwere also optimized; these are used as print parameters for our work and are constantfor all performed experiments. The print processes were performed for the three filamenttypes in succession, within one session per measurement.
The general emission profile of the print process seems consistent, involving a highmagnitude peak at the initial print phases, and showing a general decrease afterward.After print completion, the concentrations reach approximate levels to the backgrounduntil the initiation of the next print cycle. Based on this observation, and comparingsimilar experiments only, these peaks can be considered as a means for characterizingthe corresponding material/temperature combination in terms of exposure potential. Theprogressive decrease in UFP concentration after these high-emitting process phases can beattributed to the synergistic result of particle removal (mechanical or natural) and collectionby the HEPA filter, particle settling, and agglomeration [26]. At these temperatures, therGO-reinforced filament leads to much higher UFP concentrations than the other twofilaments, as measured by the CPC. UFP concentrations reached peak values of 109 and113 × 103 #/cm3 at 215 and 225 ◦C, respectively, while Ingeo 3D850/BASF ecovio IS133appears to have the lowest emission impact, displaying a maximum concentration of15.9 × 103 #/cm3 (Figure 2). A nozzle temperature of 225 ◦C results in the lowest observedpeak values for Ingeo 3D850/3052D and Ingeo 3D850/BASF ecovio IS133. At 235 ◦C,UFP concentrations exceed 300,000 particles per cm3, regardless of the filament used.Overall, most UFP concentration peaks appear around the print start, except for the firsttwo peaks for Ingeo 3D850/rGO at 235 ◦C, which are caused by filament loading andunloading. Large spikes in UFP number concentrations at the start of the printing process isan observation that is commonly reported in the literature [25] and is closely connected tothe mechanism of UFP generation. The mechanisms responsible for the decrease in particlenumber concentration after print start can be attributed to the condensation of SVOCsonto newly formed particles (lowering, in this way, the SVOC concentration), as well as toparticle diffusion, deposition, and agglomeration (rather than a decrease in emissions fromthe printing procedure) [26,67].
While the rGO filament displays high concentration peaks for print temperatures at215–235 ◦C, an interesting observation is that this filament has the lowest peak concentrationvalues of all filaments for a 205 ◦C nozzle temperature. The influence of higher temperatureson increasing the emission potential is more pronounced on this filament since it is theonly one for which one level of temperature increase (205–215 ◦C) led to such a leap inemissions; this fact can be attributed to the hydrolysis and oxidative chain scissions ofPLA [68] chains, attributed to the C-OH groups in rGO.
For larger particles (300–400 nm), the emission profiles are quite different, withthe highest peak appearing for Ingeo 3D850/BASF ecovio IS133 at 215 ◦C. At mosttemperatures, Ingeo 3D850/rGO results in the lowest peaks, with all of them close to10 particles per cm3. Dylos DC1700 recordings show one clear increase for particles largerthan 500 nm when printing with Ingeo 3D850/rGO at 235 ◦C. Since the instrument wasplaced outside the enclosure, this peak can be attributed to the agglomeration of UFPsexiting the non-airtight enclosure after the repeated high peaks. It is observed that the
Sustainability 2022, 14, 3046 13 of 26
Dylos instrument concentration readings do not immediately follow the pattern of thoseof the Aerotrak. This can also be also attributed to the placement of the Dylos outside theenclosure, in the "far field" region.
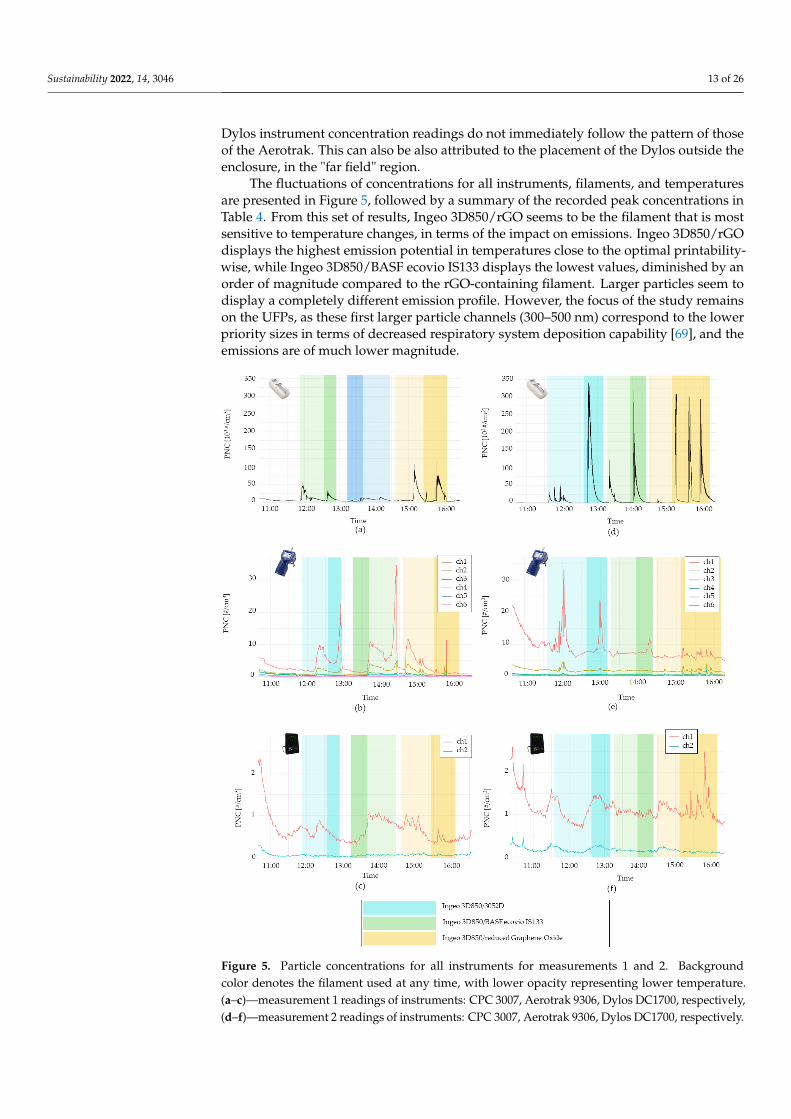
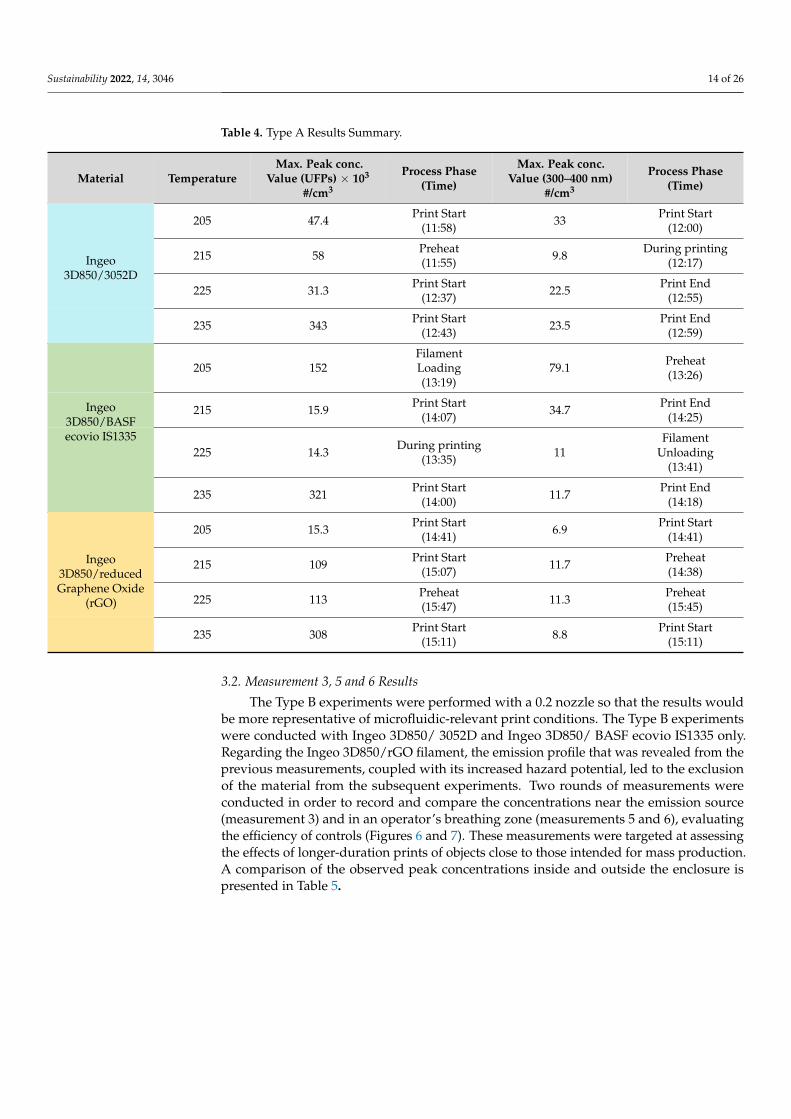
The fluctuations of concentrations for all instruments, filaments, and temperaturesare presented in Figure 5, followed by a summary of the recorded peak concentrations inTable 4. From this set of results, Ingeo 3D850/rGO seems to be the filament that is mostsensitive to temperature changes, in terms of the impact on emissions. Ingeo 3D850/rGOdisplays the highest emission potential in temperatures close to the optimal printability-wise, while Ingeo 3D850/BASF ecovio IS133 displays the lowest values, diminished by anorder of magnitude compared to the rGO-containing filament. Larger particles seem todisplay a completely different emission profile. However, the focus of the study remainson the UFPs, as these first larger particle channels (300–500 nm) correspond to the lowerpriority sizes in terms of decreased respiratory system deposition capability [69], and theemissions are of much lower magnitude.
Sustainability 2022, 14, 3046 14 of 27
exiting the non-airtight enclosure after the repeated high peaks. It is observed that the Dylos instrument concentration readings do not immediately follow the pattern of those of the Aerotrak. This can also be also attributed to the placement of the Dylos outside the enclosure, in the "far field" region.
The fluctuations of concentrations for all instruments, filaments, and temperatures are presented in Figure 5, followed by a summary of the recorded peak concentrations in Table 4. From this set of results, Ingeo 3D850/rGO seems to be the filament that is most sensitive to temperature changes, in terms of the impact on emissions. Ingeo 3D850/rGO displays the highest emission potential in temperatures close to the optimal printability-wise, while Ingeo 3D850/BASF ecovio IS133 displays the lowest values, diminished by an order of magnitude compared to the rGO-containing filament. Larger particles seem to display a completely different emission profile. However, the focus of the study remains on the UFPs, as these first larger particle channels (300–500 nm) correspond to the lower priority sizes in terms of decreased respiratory system deposition capability [69], and the emissions are of much lower magnitude.
Figure 5. Particle concentrations for all instruments for measurements 1 and 2. Backgroundcolor denotes the filament used at any time, with lower opacity representing lower temperature.(a–c)—measurement 1 readings of instruments: CPC 3007, Aerotrak 9306, Dylos DC1700, respectively,(d–f)—measurement 2 readings of instruments: CPC 3007, Aerotrak 9306, Dylos DC1700, respectively.
Sustainability 2022, 14, 3046 14 of 26
Table 4. Type A Results Summary.
Material TemperatureMax. Peak conc.
Value (UFPs) × 103
#/cm3
Process Phase(Time)
Max. Peak conc.Value (300–400 nm)
#/cm3
Process Phase(Time)
205 47.4 Print Start(11:58) 33 Print Start
(12:00)
215 58 Preheat(11:55) 9.8 During printing
(12:17)
225 31.3 Print Start(12:37) 22.5 Print End
(12:55)
Ingeo3D850/3052D
235 343 Print Start(12:43) 23.5 Print End
(12:59)
205 152FilamentLoading(13:19)
79.1 Preheat(13:26)
215 15.9 Print Start(14:07) 34.7 Print End
(14:25)Ingeo
3D850/BASFecovio IS1335
225 14.3 During printing(13:35) 11
FilamentUnloading
(13:41)
235 321 Print Start(14:00) 11.7 Print End
(14:18)
205 15.3 Print Start(14:41) 6.9 Print Start
(14:41)
215 109 Print Start(15:07) 11.7 Preheat
(14:38)Ingeo
3D850/reducedGraphene Oxide
(rGO) 225 113 Preheat(15:47) 11.3 Preheat
(15:45)
235 308 Print Start(15:11) 8.8 Print Start
(15:11)
3.2. Measurement 3, 5 and 6 Results
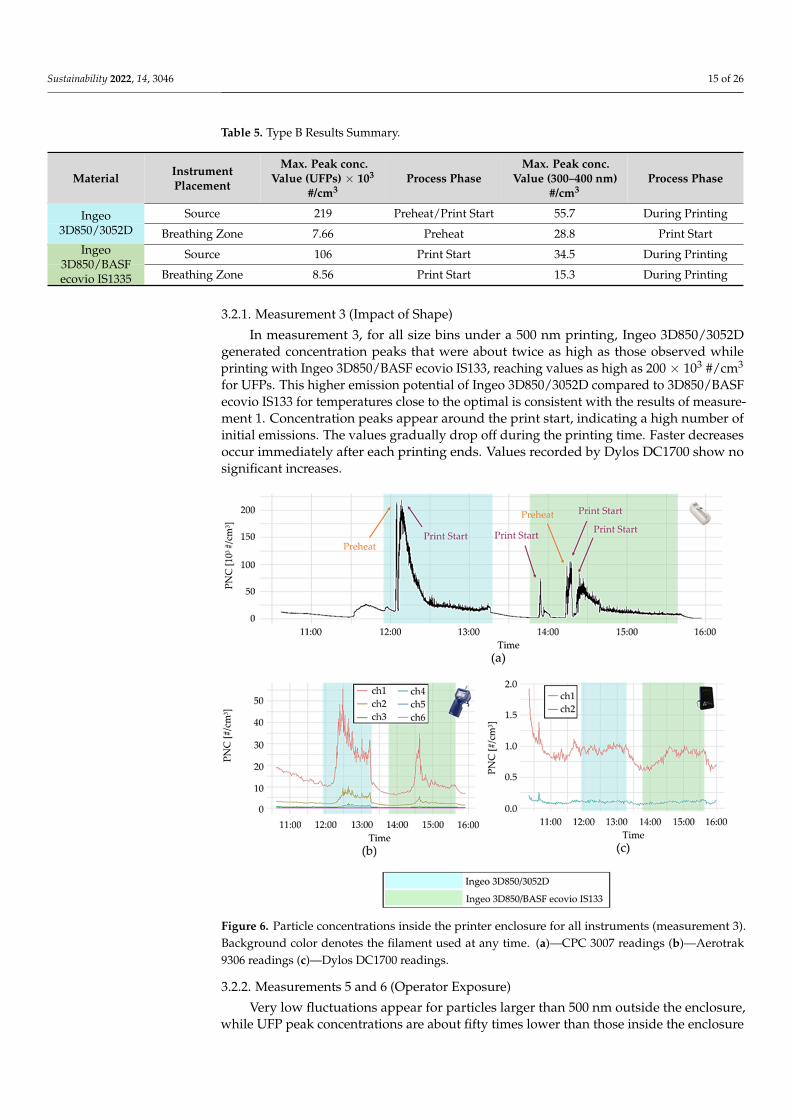
The Type B experiments were performed with a 0.2 nozzle so that the results wouldbe more representative of microfluidic-relevant print conditions. The Type B experimentswere conducted with Ingeo 3D850/ 3052D and Ingeo 3D850/ BASF ecovio IS1335 only.Regarding the Ingeo 3D850/rGO filament, the emission profile that was revealed from theprevious measurements, coupled with its increased hazard potential, led to the exclusionof the material from the subsequent experiments. Two rounds of measurements wereconducted in order to record and compare the concentrations near the emission source(measurement 3) and in an operator’s breathing zone (measurements 5 and 6), evaluatingthe efficiency of controls (Figures 6 and 7). These measurements were targeted at assessingthe effects of longer-duration prints of objects close to those intended for mass production.A comparison of the observed peak concentrations inside and outside the enclosure ispresented in Table 5.
Sustainability 2022, 14, 3046 15 of 26
Table 5. Type B Results Summary.
Material InstrumentPlacement
Max. Peak conc.Value (UFPs) × 103
#/cm3Process Phase
Max. Peak conc.Value (300–400 nm)
#/cm3Process Phase
Source 219 Preheat/Print Start 55.7 During PrintingIngeo3D850/3052D Breathing Zone 7.66 Preheat 28.8 Print Start
Source 106 Print Start 34.5 During PrintingIngeo3D850/BASFecovio IS1335 Breathing Zone 8.56 Print Start 15.3 During Printing
3.2.1. Measurement 3 (Impact of Shape)
In measurement 3, for all size bins under a 500 nm printing, Ingeo 3D850/3052Dgenerated concentration peaks that were about twice as high as those observed whileprinting with Ingeo 3D850/BASF ecovio IS133, reaching values as high as 200 × 103 #/cm3
for UFPs. This higher emission potential of Ingeo 3D850/3052D compared to 3D850/BASFecovio IS133 for temperatures close to the optimal is consistent with the results of measure-ment 1. Concentration peaks appear around the print start, indicating a high number ofinitial emissions. The values gradually drop off during the printing time. Faster decreasesoccur immediately after each printing ends. Values recorded by Dylos DC1700 show nosignificant increases.
Sustainability 2022, 14, 3046 16 of 27
Table 5. Type B Results Summary.
Material Instrument Placement
Max. Peak conc. Value (UFPs) × 103
#/cm3
Process Phase Max. Peak conc.
Value (300-400nm) #/cm3
Process Phase
Ingeo 3D850/ 3052D
Source 219 Preheat/Print
Start 55.7 During Printing
Breathing Zone 7.66 Preheat 28.8 Print Start Ingeo 3D850/ BASF ecovio
IS1335
Source 106 Print Start 34.5 During Printing
Breathing Zone 8.56 Print Start 15.3 During Printing
3.2.1. Measurement 3 (Impact of Shape) In measurement 3, for all size bins under a 500 nm printing, Ingeo 3D850/3052D
generated concentration peaks that were about twice as high as those observed while printing with Ingeo 3D850/BASF ecovio IS133, reaching values as high as 200 × 103 #/cm3 for UFPs. This higher emission potential of Ingeo 3D850/3052D compared to 3D850/BASF ecovio IS133 for temperatures close to the optimal is consistent with the results of measurement 1. Concentration peaks appear around the print start, indicating a high number of initial emissions. The values gradually drop off during the printing time. Faster decreases occur immediately after each printing ends. Values recorded by Dylos DC1700 show no significant increases.
Figure 6. Particle concentrations inside the printer enclosure for all instruments (measurement 3). Background color denotes the filament used at any time. (a)—CPC 3007 readings (b)—Aerotrak 9306 readings (c)—Dylos DC1700 readings.
Figure 6. Particle concentrations inside the printer enclosure for all instruments (measurement 3).Background color denotes the filament used at any time. (a)—CPC 3007 readings (b)—Aerotrak9306 readings (c)—Dylos DC1700 readings.
3.2.2. Measurements 5 and 6 (Operator Exposure)
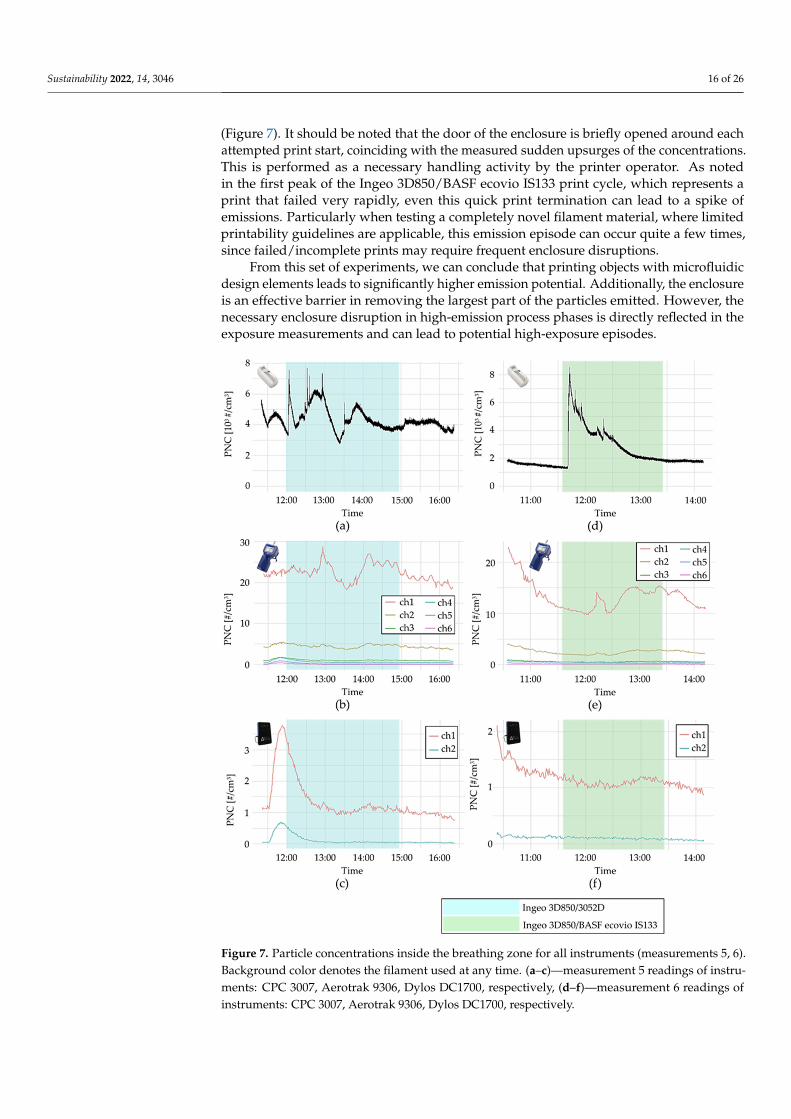
Very low fluctuations appear for particles larger than 500 nm outside the enclosure,while UFP peak concentrations are about fifty times lower than those inside the enclosure
Sustainability 2022, 14, 3046 16 of 26
(Figure 7). It should be noted that the door of the enclosure is briefly opened around eachattempted print start, coinciding with the measured sudden upsurges of the concentrations.This is performed as a necessary handling activity by the printer operator. As notedin the first peak of the Ingeo 3D850/BASF ecovio IS133 print cycle, which represents aprint that failed very rapidly, even this quick print termination can lead to a spike ofemissions. Particularly when testing a completely novel filament material, where limitedprintability guidelines are applicable, this emission episode can occur quite a few times,since failed/incomplete prints may require frequent enclosure disruptions.
From this set of experiments, we can conclude that printing objects with microfluidicdesign elements leads to significantly higher emission potential. Additionally, the enclosureis an effective barrier in removing the largest part of the particles emitted. However, thenecessary enclosure disruption in high-emission process phases is directly reflected in theexposure measurements and can lead to potential high-exposure episodes.
Sustainability 2022, 14, 3046 17 of 27
3.2.2. Measurements 5 and 6 (Operator Exposure) Very low fluctuations appear for particles larger than 500 nm outside the enclosure,
while UFP peak concentrations are about fifty times lower than those inside the enclosure (Figure 7). It should be noted that the door of the enclosure is briefly opened around each attempted print start, coinciding with the measured sudden upsurges of the concentrations. This is performed as a necessary handling activity by the printer operator. As noted in the first peak of the Ingeo 3D850/BASF ecovio IS133 print cycle, which represents a print that failed very rapidly, even this quick print termination can lead to a spike of emissions. Particularly when testing a completely novel filament material, where limited printability guidelines are applicable, this emission episode can occur quite a few times, since failed/incomplete prints may require frequent enclosure disruptions.
From this set of experiments, we can conclude that printing objects with microfluidic design elements leads to significantly higher emission potential. Additionally, the enclosure is an effective barrier in removing the largest part of the particles emitted. However, the necessary enclosure disruption in high-emission process phases is directly reflected in the exposure measurements and can lead to potential high-exposure episodes.
Figure 7. Particle concentrations inside the breathing zone for all instruments (measurements 5, 6).Background color denotes the filament used at any time. (a–c)—measurement 5 readings of instru-ments: CPC 3007, Aerotrak 9306, Dylos DC1700, respectively, (d–f)—measurement 6 readings ofinstruments: CPC 3007, Aerotrak 9306, Dylos DC1700, respectively.
Sustainability 2022, 14, 3046 17 of 26
3.3. Comparison with the Literature
Numerous FFF emission or exposure assessment studies have been described in theliterature [13,15]; however, the ones that have generated results that can be applicablefor comparison with the data produced in this study are those works that involved themeasurement of a printer within a workroom, excluding those measurements performed ina clean room or an environmental chamber. The comparison-valid results can be comparedwith the “breathing zone” particle measurements (measurements 5 and 6). The first studythat investigated 3D printing emissions was performed by Stephens et al. [17]. The measure-ments were performed in a small office space (45 m3) and several operating configurationswere evaluated. These included 2 printers with PLA material feedstock functioning, as wellas another setup where 2 PLA-material and 3 ABS-printing devices were functioning at thesame time. For a UFP concentration-measuring instrument, they used the TSI Nanoscanscanning mobility particle sizer (SMPS) 3910, which has a similar operating function asthe CPC used in our study. The objects manufactured were small-sized test objects (ap-proximately 3 × 3 × 3 cm shapes), although not displaying any LoC characteristics. Itis worth mentioning that the air exchange rate of the workroom in this study was notmonitored; therefore, there is uncertainty about the particle removal capabilities. Thevolume of the office space was also approximately 45 m3 and the instrument was similarlypositioned in a location close to the printer. The UFP concentrations were sustained at amean 27,800 #/cm3 for the entire course of the PLA filament measurements. It is worthnoting that the concentration increase profile is different from the one observed in our study.In the measurements taken by Stephens et al., the concentration is progressively increasingfor part of the print process, and reaches a generally steady value, resulting in this relativelyhigh mean. Concentrations only decreased after the print finished. Conversely, as alreadydescribed, in the presently measured case, the peak (7660 and 8560 #/cm3, correspondingto the two materials tested) is reached for the print start phase, followed by a tendency toa general concentration decrease afterward. This significant difference can be attributedto the enclosure and particle-filtering exhaust system of the printer used in this study, asopposed to [17], where it is not specified if the printers that were used were enclosed. Ad-ditionally, seeing that the workroom was a commercial office, the general ventilation maynot have been adequate to support sufficient removal, leading to the prolonged sustainingof higher concentrations in the room.
Zontek et al. [66] evaluated two types of print environments, a “well-ventilated”workroom accommodating a 3D printer with PLA feedstock material, and a “poorlyventilated” office space in which a 3D printer with ABS filament material was used. For the“well-ventilated” room, the concentration at the breathing zone spiked at 3780 #/cm3, atthe print start phase, in accordance with our measurements. For the “poorly ventilated”workroom, the authors noted a quick concentration increase to 10,000 #/cm3 close to theprinter, which was observed in the surrounding room as well, while the process continued.The particle concentration mapping showed that particle concentrations were increasedthroughout the poorly ventilated room, while they remained locally increased around theprinter for the room with good ventilation. Quite importantly, although both printers usedin the study were equipped with enclosures, there was still a release of particles in thework environment.
Similar peaks were also observed for the measurements inside the enclosures, betweenthe findings of [66] and our study. The authors report “print start” peaks higher than300 × 103 #/cm3 when printing PLA at 230 ◦C, as is similar to our measurements at a235 ◦C print temperature for all three filaments tested. Printing PLA material at 180 ◦C ledto concentration peaks of 200–250 × 103 #/cm3, which were significantly higher than theones observed for our set of “low print temperatures” at 205 ◦C, which ranged from 15.3 to152 × 103 #/cm3. However, it should be noted that the difference in enclosure sizes andclearance effectiveness or particle settling potential in enclosure walls is not accounted for.The printers used in this study are significantly smaller than the one we examined. TheMakerbot Replicator X2 has a volume of 95,468 cm3 (52 × 44 × 41 cm) vs the 404,209 cm3
Sustainability 2022, 14, 3046 18 of 26
(62 × 59 × 110.5 cm) of the Raise3D Pro2Plus. In terms of instrumentation, the instrumentused for the UFP concentrations was a CPC 3007, similar to our study. Finally, the authorsalso applied a photoionization detector instrument to assess the VOC emissions inside theprinter enclosures, reporting that no fluctuations were detected for any print scenario, as isconsistent with our findings.
For both of these comparisons, it should be noted that none of the printers examinedin the literature studies were confirmed to be equipped with a HEPA filter. In the Stephenset al. study [17], the data for the specific commercial device or enclosure has not beendefined, while in the Zontek et al. study [66], the MakerBot Replicator X2 possesses anenclosure but no HEPA filtration capabilities. This can be considered an additional factorfor the difference in particle clearance effectiveness that was observed between the findingsof the study by Zontek et al. [66] and our findings.
3.4. Comparison with Exposure Limits
The Type B experiments performed through the Setup II (breathing zone), which arerepresented by measurements 5 and 6, are the ones that most closely correspond to theactual operating conditions of tests performed for printing microfluidic-relevant objects,involving a series of interrupted, failed, and successful prints, over the course of some hours.Additionally, these are the measurement locations that can most closely reproduce actualconcentrations in the breathing air of employees. As such, these are the measurements thatcan be directly compared to exposure thresholds.
As of the time of the composition of this work, no health-based exposure limits havebeen established for 3D printing particle emissions. Only one exposure limit related to 3Dprinting emissions has been proposed, at 40,000 ultrafine particles/cm3 [70]. The exposurelimit is derived from a general exposure limit proposed for bio-persistent nanoparticlesof a density lower than 6000 kg/m3 that was generated in nanosafety research [71]. Assuch, it should be noted that the applicability, as well as the preciseness of this limitwith regard to 3D printing-generated ultrafine particles, is questionable. In terms of acomparison of the exposure data with this limit, the full array of controls applied in thestudied experimental setup leads to lower exposure levels than the proposed threshold.However, substantial emission peaks are detected; therefore, it is reasonable to define anumber of exposure scenarios.
3.5. Exposure Scenarios
Based on the process description and the initial information collection activities,in conjunction with the measurement results a number of exposure scenarios can beformulated (Table 6). These scenarios describe occurrences that are realistically feasiblein the context of the occupational setting and their connection with exposure. Throughcross-evaluation of the scenarios with the measurement results, guidance on which processtasks and activities may present the highest priority for safety measures can be developed.
As also expressed in the information-gathering table (Table 2), exposure scenarioscorrespond to different employees and different task responsibilities within the workplace.
Table 6. Exposure scenarios.
ScenarioNo. Scenario Description Exposure duration
and Pattern Applicable Controls Comments
1
Employee performingprinter and office work
within the printing roomfor the whole duration of
the working day.
Employee exposedto workplace
concentrations for an8h shift.
Administrative controls,shift optimization,
minimization of employeepresence duringprint operations.
Exposure to both peaksand sustained workroom
concentration. Can beeasily mitigated through
proper risk awareness andadministrative controls.
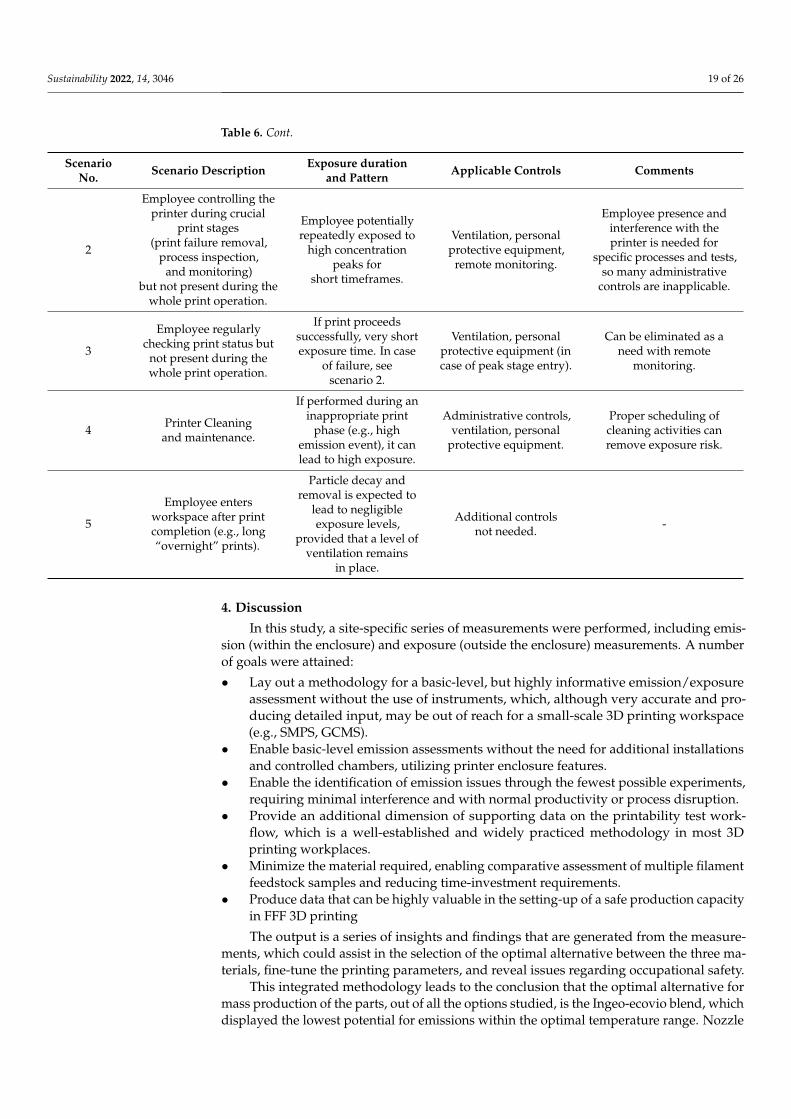
Sustainability 2022, 14, 3046 19 of 26
Table 6. Cont.
ScenarioNo. Scenario Description Exposure duration
and Pattern Applicable Controls Comments
2
Employee controlling theprinter during crucial
print stages(print failure removal,
process inspection,and monitoring)
but not present during thewhole print operation.
Employee potentiallyrepeatedly exposed to
high concentrationpeaks for
short timeframes.
Ventilation, personalprotective equipment,
remote monitoring.
Employee presence andinterference with theprinter is needed for
specific processes and tests,so many administrative
controls are inapplicable.
3
Employee regularlychecking print status but
not present during thewhole print operation.
If print proceedssuccessfully, very shortexposure time. In case
of failure, seescenario 2.
Ventilation, personalprotective equipment (incase of peak stage entry).
Can be eliminated as aneed with remote
monitoring.
4 Printer Cleaningand maintenance.
If performed during aninappropriate print
phase (e.g., highemission event), it canlead to high exposure.
Administrative controls,ventilation, personal
protective equipment.
Proper scheduling ofcleaning activities canremove exposure risk.
5
Employee entersworkspace after printcompletion (e.g., long“overnight” prints).
Particle decay andremoval is expected to
lead to negligibleexposure levels,
provided that a level ofventilation remains
in place.
Additional controlsnot needed. -
4. Discussion
In this study, a site-specific series of measurements were performed, including emis-sion (within the enclosure) and exposure (outside the enclosure) measurements. A numberof goals were attained:
• Lay out a methodology for a basic-level, but highly informative emission/exposureassessment without the use of instruments, which, although very accurate and pro-ducing detailed input, may be out of reach for a small-scale 3D printing workspace(e.g., SMPS, GCMS).
• Enable basic-level emission assessments without the need for additional installationsand controlled chambers, utilizing printer enclosure features.
• Enable the identification of emission issues through the fewest possible experiments,requiring minimal interference and with normal productivity or process disruption.
• Provide an additional dimension of supporting data on the printability test work-flow, which is a well-established and widely practiced methodology in most 3Dprinting workplaces.
• Minimize the material required, enabling comparative assessment of multiple filamentfeedstock samples and reducing time-investment requirements.
• Produce data that can be highly valuable in the setting-up of a safe production capacityin FFF 3D printing
The output is a series of insights and findings that are generated from the measure-ments, which could assist in the selection of the optimal alternative between the three ma-terials, fine-tune the printing parameters, and reveal issues regarding occupational safety.
This integrated methodology leads to the conclusion that the optimal alternative formass production of the parts, out of all the options studied, is the Ingeo-ecovio blend, whichdisplayed the lowest potential for emissions within the optimal temperature range. Nozzle
Sustainability 2022, 14, 3046 20 of 26
temperatures at 235 ◦C or higher should be avoided for the presently studied materialssince they led to higher peak emissions (Figure 2).
In terms of occupational exposure, results showed that although the 3D printing ofmicrofluidic items can lead to an increase in emission potential compared to simple objects,the fully enclosed 3D printing process leads to a concentration increase within the work-place that does not lead to surpassing the proposed exposure limits. However, in view ofthe uncertainties and the non-health-based status of the exposure limit, it is suggested thatoperators should keep exposures to a minimum. Particularly in the high-emitting phases,enclosure disruptions can lead to high short-term exposure; therefore, a standard operat-ing procedure (SOP) using an FFP3 respirator for these events is suggested. As alreadydefined, this disruption may be needed for print monitoring purposes. Interestingly, thehigh-emitting and more hazardous rGO-reinforced filament can be used in a low-emissionprocess profile, since the use of lower-range nozzle temperatures has been reported toresult in a substantially lower emission potential.
4.1. Suggesting a Methodology
The methodologies developed for the assessment of FFF process sustainability oughtto be aligned with the primary characteristics of the FFF method. In essence, they need tobe fast, uncomplicated, customizable, economical, and low in waste, in order to promotethe equivalent attributes of the FFF approach [4]. This applies if they are to be employedwidely and commonly in 3D printing workplaces.
Based on the objectives and the results of the measurement cycle, we have compiledthe main concepts of our approach into a proposed workflow for pre-assessment, leadingto optimized print processes. The proposed methodology, as implemented in this work, issummarized in the following step-by-step workflow (Figure 8).
• Perform emission assessment in print objects of low complexity (e.g., hollow cubes) toassess the different peak emission potential of the various candidate materials, as wellas the impact of different temperatures on emission potential.
• Perform an emission assessment in the objects to be produced, or objects display-ing similar structural properties, to assess if specific object qualities could lead tohigher emissions.
• Perform cross-evaluation of emission assessment with printability test results, to assessif there is any agreement or compromise between properties/printability and reducedemission potential. Conclude with an optimal set of parameters.
• Use the optimal set of parameters to perform exposure assessment for prolonged printsof the structurally relevant objects, to assess the efficiency of controls, and evaluatepotentially needed adjustments to work practices. Evaluation of the adequacy ofcontrols and the performance of amendments if this is deemed necessary.
• Compile data generated from the printability assessment, material performance, andemission/exposure studies, to support the selection of all-around viable options interms of material selection, print parameter definition, and work practice refinement.
In scenarios where the candidate materials are numerous, each step can lead to theexclusion of materials for use in subsequent steps, given that they exceed specific criteria(e.g., a substantial increase in emission potential for a specific material, as revealed in ourstudy). Therefore, feedback circuits from the different experiment sets can be maintained,to minimize the tests needed (e.g., not performing emission assessment in temperaturesthat do not produce the required properties).
The conducted printability tests that are performed to arrive at a set of print tempera-tures/settings for acceptable printability and quality should be cross-evaluated with theabove-produced results, as well as with any experiments related to the performance of thetest parts. This will lead to the definition of a balanced option between print quality, parteffectiveness, and emission safety.
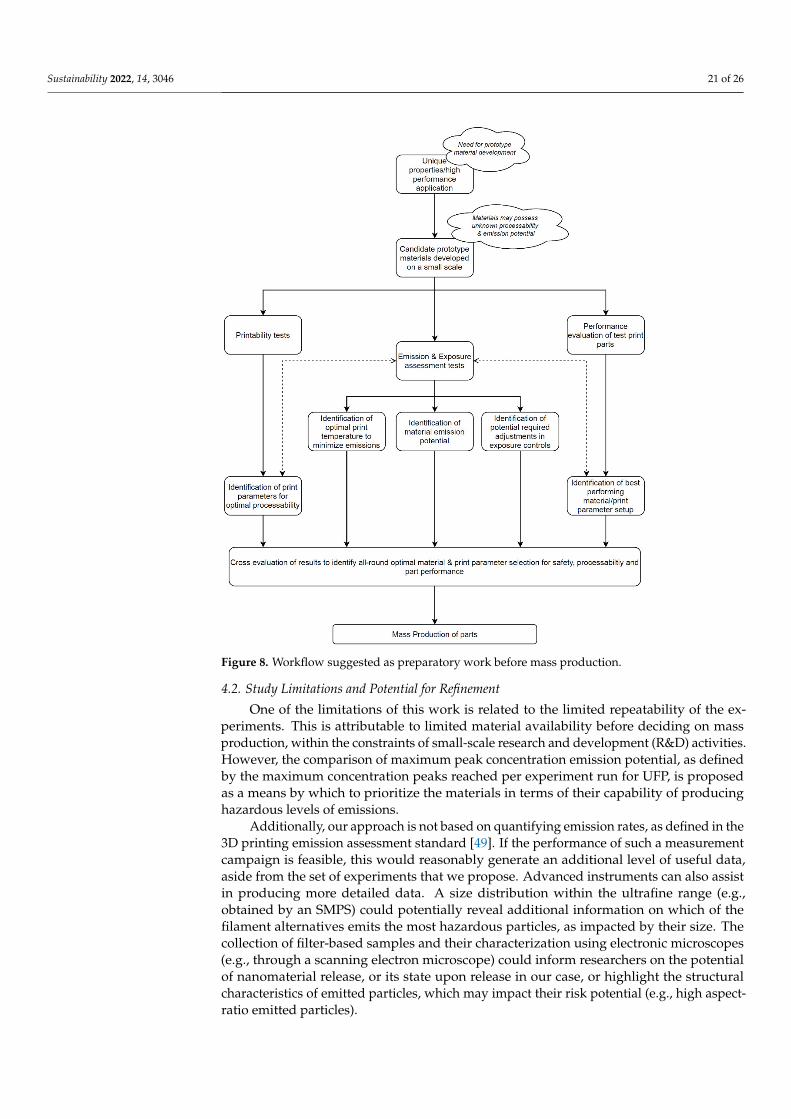
Sustainability 2022, 14, 3046 21 of 26
Sustainability 2022, 14, 3046 22 of 27
In scenarios where the candidate materials are numerous, each step can lead to the exclusion of materials for use in subsequent steps, given that they exceed specific criteria (e.g., a substantial increase in emission potential for a specific material, as revealed in our study). Therefore, feedback circuits from the different experiment sets can be maintained, to minimize the tests needed (e.g., not performing emission assessment in temperatures that do not produce the required properties).
The conducted printability tests that are performed to arrive at a set of print temperatures/settings for acceptable printability and quality should be cross-evaluated with the above-produced results, as well as with any experiments related to the performance of the test parts. This will lead to the definition of a balanced option between print quality, part effectiveness, and emission safety.
Figure 8. Workflow suggested as preparatory work before mass production.
4.2. Study Limitations and Potential for Refinement One of the limitations of this work is related to the limited repeatability of the
experiments. This is attributable to limited material availability before deciding on mass production, within the constraints of small-scale research and development (R&D) activities. However, the comparison of maximum peak concentration emission potential, as defined by the maximum concentration peaks reached per experiment run for UFP, is proposed as a means by which to prioritize the materials in terms of their capability of producing hazardous levels of emissions.
Figure 8. Workflow suggested as preparatory work before mass production.
4.2. Study Limitations and Potential for Refinement
One of the limitations of this work is related to the limited repeatability of the ex-periments. This is attributable to limited material availability before deciding on massproduction, within the constraints of small-scale research and development (R&D) activities.However, the comparison of maximum peak concentration emission potential, as definedby the maximum concentration peaks reached per experiment run for UFP, is proposedas a means by which to prioritize the materials in terms of their capability of producinghazardous levels of emissions.
Additionally, our approach is not based on quantifying emission rates, as defined in the3D printing emission assessment standard [49]. If the performance of such a measurementcampaign is feasible, this would reasonably generate an additional level of useful data,aside from the set of experiments that we propose. Advanced instruments can also assistin producing more detailed data. A size distribution within the ultrafine range (e.g.,obtained by an SMPS) could potentially reveal additional information on which of thefilament alternatives emits the most hazardous particles, as impacted by their size. Thecollection of filter-based samples and their characterization using electronic microscopes(e.g., through a scanning electron microscope) could inform researchers on the potentialof nanomaterial release, or its state upon release in our case, or highlight the structuralcharacteristics of emitted particles, which may impact their risk potential (e.g., high aspect-ratio emitted particles).
Sustainability 2022, 14, 3046 22 of 26
CPC and OPC are, however, the absolute minimum, as defined in the 3D printingemission assessment standard as well [49], and may be quite an effective investment for a 3Dprinting workplace. This is not only due to their accessible cost but also because the processoperational cost or the cost for exposure controls may be significantly reduced after thelong-term implementation of an emission assessment and reduction optimization strategy.
Based on the OECD methodology targeting engineered nanomaterials [51], high-tieredassessments are applied when there are indications of significant emissions during initialscreening assessments. An expansion of the methodology presented in this work couldbe an “advanced” level of assessment in cases where the highest-emitting material isultimately selected on the grounds that it outperforms every alternative selection in allother aspects, necessitating further study of its emissions. Alternatively, the expandedmethodology could be applied if a certain threshold of emissions is exceeded, to providefurther data on the nature of the emissions.
One of the sources of uncertainty during 3D printing exposure assessment studies isrelated to the shape of the print objects. Emission assessment should include prints of thefinal objects; however, assessing the impact of temperature and object type at the sametime is impractical. Our methodology suggests assessing the most basic elements of theprint characteristic setup, such as the temperature and shape. However, this may not beapplicable in different cases, therefore adjustments to the assessment parameters of themethodology may be required. Furthermore, in the case examined in this study, the resultswere moderately conclusive in terms of the most optimal choice. In cases of additionalcomplexity, significant conflicting results may be generated between the sustainabilityelements. This would present an opportunity for refinement of the approach.
The example used in the present study was the printing of a small LoC device. In theprocess of performing this methodology for different scenarios and larger/longer prints, itis reasonable to assume that a significant variation will be observed in the results for theimpact of the shape on emissions. Additionally, the printer that was employed possessedHEPA filtration capabilities. Adaptations may be needed to the methodology and interpre-tation of results when studying systems employing other emission control schemes (e.g.,simple enclosure, HEPA and activated carbon filter, outflow fan only, saturated/cloggedHEPA filter, etc.), which will result in a high impact on the concentration fluctuations.
The position and the flow rate of the air purifier equipped with a HEPA filter weremaintained as constant throughout this study in the different scenarios. Additional expo-sure experiments varying the position and the inlet velocity of the air purifier would benefitthe optimization of the room layout since changing these parameters greatly influenced theairflow patterns in the room [72–74].
5. Conclusions
In this work, we performed an exposure assessment in a 3D printing workspace as anassistive activity to material and process optimization. We identified the optimal materialsand print conditions and suggested safety practices. Based on our findings and lessonslearned from the measurement process, we propose a sequential workflow for assessmentbefore establishing the materials to be used and print properties to be applied for full-scalemass production, using basic instrumentation for exposure assessment.
We identified the highest-emitting materials, the impact of the projected printed objecton emissions, and the temperatures to avoid and determined a set of exposure scenariosthrough the cross-evaluation of work practices and measurement outputs. The main targetgroup for applying this methodology is research and development (R&D) 3D printingworkspaces, where the development and use of such novel filament materials would beone of the key objectives. However, these findings are not limited to research environments;3D printing workspaces that aim for mass production using conventional materials cangain benefits from following such an approach as well. The experiments that we describecan be performed initially on a small scale, informing the researchers about materialselection and printing condition setups for upscaled production. Considering there are
Sustainability 2022, 14, 3046 23 of 26
quite a few filament material types that have been minimally or not studied at all, andproducing emission data for all commercially available filaments is a highly complicatedtask, this can be informative for a quick selection between safer commercial materials evenif no specialized property or unique filaments are used. The exclusive use of low-emittingmaterials can also reduce the need for the installation and maintenance of costly engineeringcontrols for emission removal, supporting a more cost-effective production setup.
Given that effective feedback channels between 3D printing operators, exposureassessment engineers, and filament producers are established, extensive emission studieson different filament formulations can lead to directions for developing low-emitting, safer-by-design filament materials. Structured occupational exposure studies are invaluable indefining the appropriate controls for emission clearance and safe 3D printing processes,and are a crucial enabler for safe innovations in 3D printing materials.
Author Contributions: Conceptualization, P.K. and E.P.K.; methodology, P.K. and S.S.; investigation,P.K., S.S., S.D. and I.K.; resources, P.K., E.G. and E.P.K.; material preparation, J.G.; writing—originaldraft preparation, P.K., S.S., S.D., E.G. and I.K.; writing—review and editing, C.C. and E.P.K.; visual-ization, P.K., S.S., S.D. and I.K; supervision, E.P.K. and C.C.; project administration E.P.K. and C.C.;funding acquisition, E.P.K. and C.C. All authors have read and agreed to the published version ofthe manuscript.
Funding: This research was partially funded by the European Union’s Horizon 2020 Research andInnovation Program, MEDLOC, a project under grant number 760662.
Institutional Review Board Statement: Not applicable.
Informed Consent Statement: Not applicable.
Data Availability Statement: Not applicable.
Acknowledgments: The authors express their appreciation towards BioG3D, for the FFF systemprovision and technical support in the 3D printing of testing specimens used for experiments.
Conflicts of Interest: The authors declare no conflict of interest.
References1. ISO/ASTM 52900:2015; Additive Manufacturing—General Principles—Terminology. International Organization for Standardiza-
tion: Geneva, Switzerland, 2015.2. Simons, M. Additive manufacturing—A revolution in progress? Insights from a multiple case study. Int. J. Adv. Manuf. Technol.
2018, 96, 735–749. [CrossRef]3. Masters, W.E. Computer Automated Manufacturing Process and System. U.S. Patent 4,665,492, 12 May 1987.4. Tofail, S.A.; Koumoulos, E.P.; Bandyopadhyay, A.; Bose, S.; O’Donoghue, L.; Charitidis, C. Additive manufacturing: Scientific and
technological challenges, market uptake and opportunities. Mater. Today 2018, 21, 22–37. [CrossRef]5. Sreehitha, V. Impact of 3D printing in automotive industry. Int. J. Mech. Prod. Eng. 2017, 5, 91–94.6. Javaid, M.; Haleem, A. Additive manufacturing applications in medical cases: A literature based review. Alex. J. Med. 2018, 54,
411–422. [CrossRef]7. Singamneni, S.; Lv, Y.; Hewitt, A.; Chalk, R.; Thomas, W.; Jordison, D. Additive Manufacturing for the Aircraft Industry: A
Review. J. Aeronaut. Aerosp. Eng. 2019, 8, 1–13. [CrossRef]8. Zhang, Q.; Zhang, F.; Medarametla, S.P.; Li, H.; Zhou, C.; Lin, D. 3D Printing of Graphene Aerogels. Small 2016, 12, 1702–1708.
[CrossRef]9. Noor, N.; Shapira, A.; Edri, R.; Gal, I.; Wertheim, L.; Dvir, T. 3D Printing of Personalized Thick and Perfusable Cardiac Patches
and Hearts. Adv. Sci. 2019, 6, 1900344. [CrossRef]10. Attaran, M. The rise of 3-D printing: The advantages of additive manufacturing over traditional manufacturing. Bus. Horiz. 2017,
60, 677–688. [CrossRef]11. Dombroski, C.E.; Balsdon, M.E.R.; Froats, A. The use of a low cost 3D scanning and printing tool in the manufacture of
custom-made foot orthoses: A preliminary study. BMC Res. Notes 2014, 7, 443. [CrossRef]12. Xu, J.; Ding, L.; Love, P. Digital reproduction of historical building ornamental components: From 3D scanning to 3D printing.
Autom. Constr. 2017, 76, 85–96. [CrossRef]13. Karayannis, P.; Petrakli, F.; Gkika, A.; Koumoulos, E.P. 3D-Printed Lab-on-a-Chip Diagnostic Systems-Developing a Safe-by-
Design Manufacturing Approach. Micromachines 2019, 10, 825. [CrossRef] [PubMed]14. Schraufnagel, D.E. The health effects of ultrafine particles. Exp. Mol. Med. 2020, 52, 311–317. [CrossRef] [PubMed]
Sustainability 2022, 14, 3046 24 of 26
15. Dobrzynska, E.; Kondej, D.; Kowalska, J.; Szewczynska, M. State of the art in additive manufacturing and its possible chemicaland particle hazards—Review. Indoor Air 2021, 31, 1733–1758. [CrossRef] [PubMed]
16. Wojtyła, S.; Klama, P.; Spiewak, K.; Baran, T. 3D printer as a potential source of indoor air pollution. Int. J. Environ. Sci. Technol.2019, 17, 207–218. [CrossRef]
17. Stephens, B.; Azimi, P.; El Orch, Z.; Ramos, T. Ultrafine particle emissions from desktop 3D printers. Atmos. Environ. 2013, 79,334–339. [CrossRef]
18. Zhang, Q.; Pardo, M.; Rudich, Y.; Kaplan-Ashiri, I.; Wong, J.P.S.; Davis, A.Y.; Black, M.S.; Weber, R.J. Chemical Compositionand Toxicity of Particles Emitted from a Consumer-Level 3D Printer Using Various Materials. Environ. Sci. Technol. 2019, 53,12054–12061. [CrossRef]
19. Jeon, H.; Park, J.; Kim, S.; Park, K.; Yoon, C. Effect of nozzle temperature on the emission rate of ultrafine particles during 3Dprinting. Indoor Air 2019, 30, 306–314. [CrossRef]
20. Bernatikova, S.; Dudacek, A.; Prichystalova, R.; Klecka, V.; Kocurkova, L. Characterization of Ultrafine Particles and VOCsEmitted from a 3D Printer. Int. J. Environ. Res. Public Health 2021, 18, 929. [CrossRef]
21. Dunn, K.L.; Hammond, D.; Lo, S. Three-dimensional printer emissions and employee exposures to ultrafine particles during theprinting of thermoplastic filaments containing carbon nanotubes or carbon nanofibers. J. Nanoparticle Res. 2020, 22, 46. [CrossRef]
22. Zhu, Q.; Yao, Q.; Liu, J.; Sun, J.; Wang, Q. Emissions from the fused filament fabrication 3D printing with lignocellulose/polylacticacid filament. BioResources 2020, 15, 7560–7572. [CrossRef]
23. Alberts, E.; Ballentine, M.; Barnes, E.; Kennedy, A. Impact of metal additives on particle emission profiles from a fused filamentfabrication 3D printer. Atmos. Environ. 2021, 244, 117956. [CrossRef]
24. Katz, E.F.; Goetz, J.D.; Wang, C.; Hart, J.L.; Terranova, B.; Taheri, M.L.; Waring, M.S.; Decarlo, P.F. Chemical and PhysicalCharacterization of 3D Printer Aerosol Emissions with and without a Filter Attachment. Environ. Sci. Technol. 2020, 54, 947–954.[CrossRef] [PubMed]
25. Zhang, Q.; Wong, J.P.S.; Davis, A.Y.; Black, M.S.; Weber, R.J. Characterization of particle emissions from consumer fused depositionmodeling 3D printers. Aerosol Sci. Technol. 2017, 51, 1275–1286. [CrossRef]
26. Ding, S.; Ng, B.F.; Shang, X.; Liu, H.; Lu, X.; Wan, M.P. The characteristics and formation mechanisms of emissions from thermaldecomposition of 3D printer polymer filaments. Sci. Total Environ. 2019, 692, 984–994. [CrossRef]
27. Farcas, M.T.; Stefaniak, A.B.; Knepp, A.K.; Bowers, L.; Mandler, W.K.; Kashon, M.; Jackson, S.R.; Stueckle, T.A.; Sisler, J.D.;Friend, S.A.; et al. Acrylonitrile butadiene styrene (ABS) and polycarbonate (PC) filaments three-dimensional (3-D) printeremissions-induced cell toxicity. Toxicol. Lett. 2019, 317, 1–12. [CrossRef]
28. Farcas, M.T.; McKinney, W.; Qi, C.; Mandler, K.W.; Battelli, L.; Friend, S.A.; Stefaniak, A.B.; Jackson, M.; Orandle, M.; Winn, A.;et al. Pulmonary and systemic toxicity in rats following inhalation exposure of 3-D printer emissions from acrylonitrile butadienestyrene (ABS) filament. Inhal. Toxicol. 2020, 32, 403–418. [CrossRef]
29. Stefaniak, A.; LeBouf, R.; Duling, M.; Yi, J.; Abukabda, A.; McBride, C.; Nurkiewicz, T. Inhalation exposure to three-dimensionalprinter emissions stimulates acute hypertension and microvascular dysfunction. Toxicol. Appl. Pharmacol. 2017, 335, 1–5.[CrossRef]
30. Gümperlein, I.; Fischer, E.; Dietrich-Gümperlein, G.; Karrasch, S.; Nowak, D.; Jörres, R.A.; Schierl, R. Acute health effectsof desktop 3D printing (fused deposition modeling) using acrylonitrile butadiene styrene and polylactic acid materials: Anexperimental exposure study in human volunteers. Indoor Air 2018, 28, 611–623. [CrossRef]
31. Umans, J.G.; Levi, R. Nitric Oxide in the Regulation of Blood Flow and Arterial Pressure. Annu. Rev. Physiol. 1995, 57, 771–790.[CrossRef]
32. Furchgott, R.F.; Zawadzki, J.V. The obligatory role of endothelial cells in the relaxation of arterial smooth muscle by acetylcholine.Nature 1980, 288, 373–376. [CrossRef]
33. Chan, F.L.; House, R.; Kudla, I.; Lipszyc, J.C.; Rajaram, N.; Tarlo, S. Health survey of employees regularly using 3D printers.Occup. Med. 2018, 68, 211–214. [CrossRef] [PubMed]
34. House, R.; Rajaram, N.; Tarlo, S. Case report of asthma associated with 3D printing. Occup. Med. 2017, 67, 652–654. [CrossRef][PubMed]
35. Ferreira, I.; Machado, M.; Alves, F.J.L.; Marques, A.T. A review on fibre reinforced composite printing via FFF. Rapid Prototyp. J.2019, 25, 972–988. [CrossRef]
36. Shalom, H.; Kapishnikov, S.; Brumfeld, V.; Naveh, N.; Tenne, R.; Lachman, N. Strong, tough and bio-degradable polymer-based3D-ink for fused filament fabrication (FFF) using WS2 nanotubes. Sci. Rep. 2020, 10, 1–8. [CrossRef]
37. Zhang, D.; Chi, B.; Li, B.; Gao, Z.; Du, Y.; Guo, J.; Wei, J. Fabrication of highly conductive graphene flexible circuits by 3D printing.Synth. Met. 2016, 217, 79–86. [CrossRef]
38. Spinelli, G.; Kotsilkova, R.; Ivanov, E.; Petrova-Doycheva, I.; Menseidov, D.; Georgiev, V.; Di Maio, R.; Silvestre, C. Effects ofFilament Extrusion, 3D Printing and Hot-Pressing on Electrical and Tensile Properties of Poly(Lactic) Acid Composites Filledwith Carbon Nanotubes and Graphene. Nanomaterials 2019, 10, 35. [CrossRef]
39. Love, L.J.; Kunc, V.; Rios, O.; Duty, C.E.; Elliott, A.M.; Post, B.K.; Smith, R.J.; Blue, C.A. The importance of carbon fiber to polymeradditive manufacturing. J. Mater. Res. 2014, 29, 1893–1898. [CrossRef]
40. LW-PLA BLACK. Available online: https://colorfabb.com/lw-pla-black (accessed on 20 July 2021).
Sustainability 2022, 14, 3046 25 of 26
41. Tothill, A.M.; Partridge, M.; James, S.W.; Tatam, R. Fabrication and ptimization of a fused filament 3D-printed microfluidicplatform. J. Micromech. Microeng. 2017, 27, 035018. [CrossRef]
42. Pranzo, D.; Larizza, P.; Filippini, D.; Percoco, G. Extrusion-Based 3D Printing of Microfluidic Devices for Chemical and BiomedicalApplications: A Topical Review. Micromachines 2018, 9, 374. [CrossRef]
43. Kotz, F.; Mader, M.; Dellen, N.; Risch, P.; Kick, A.; Helmer, D.; Rapp, B.E. Fused Deposition Modeling of Microfluidic Chips inPolymethylmethacrylate. Micromachines 2020, 11, 873. [CrossRef]
44. Morgan, A.J.L.; Jose, L.H.S.; Jamieson, W.; Wymant, J.M.; Song, B.; Stephens, P.; Barrow, D.A.; Castell, O. Simple and Versatile 3DPrinted Microfluidics Using Fused Filament Fabrication. PLoS ONE 2016, 11, e0152023. [CrossRef] [PubMed]
45. M3DloC—Additive Manufacturing of 3D Microfluidic MEMS for Lab-on-a-Chip Applications. Available online: https://www.m3dloc.net/ (accessed on 15 June 2021).
46. Gomez, J.; Villaro, E.; Navas, A.; Recio, I. Testing the influence of the temperature, RH and filler type and content on the universalpower law for new reduced graphene oxide TPU composites. Mater. Res. Express 2017, 4, 105020. [CrossRef]
47. Hummers, W.S., Jr.; Offeman, R.E. Preparation of Graphitic Oxide. J. Am. Chem. Soc. 1958, 80, 1339. [CrossRef]48. Maddalena, L.; Gomez, J.; Fina, A.; Carosio, F. Effects of graphite oxide nanoparticle size on the functional properties of
layer-by-layer coated flexible foams Nanomaterials. Nanomaterials 2021, 11, 266. [CrossRef]49. ANSI/CAN/UL 2904; Standard Method for Testing and Assessing Particle and Chemical Emissions from 3D Printers. UL; LLC:
Northbrook, IL, USA, 2019.50. ISO/ASTM CD 52932; Additive Manufacturing—Environmental Health and Safety—Standard Test Method for Determination of
Particle Emission Rates from Desktop 3D Printers Using Material Extrusion. International Organization for Standardization:Geneva, Switzerland, 2015.
51. OECD-ENV/JM/MONO(2015)19; Harmonized Tiered Approach to Measure and Assess the Potential Exposure to Airborne Emis-sions of Engineered Nano-Objects and Their Agglomerates and Aggregates at Workplaces; Series on the Safety of ManufacturedNanomaterials No. 55. OECD Environment Directorate, Environment, Health and Safety Division: Paris, France.
52. Concentration Particle Counter 3007|TSI. Available online: https://www.tsi.com/condensation-particle-counter-3007/ (accessedon 10 June 2021).
53. Aerotrak Handheld Particle Counter|TSI. Available online: https://www.tsi.com/aerotrak-handheld-particle-counter-9306/(accessed on 10 June 2021).
54. DC1700-PM PM2.5/PM10 AQM. Available online: http://www.dylosproducts.com/dcpmaqm.html (accessed on 10 June 2021).55. Handheld VOC Gas Detector. Available online: https://www.ionscience.com/products/tiger-handheld-voc-detector/ (accessed
on 10 June 2021).56. RAE Systems. The PID Handbook Theory and Applications of Direct-Reading Photoionization Detectors (PIDs), 3rd ed.; RAE Systems
Inc.: San Jose, CA, USA, 2013.57. Laboratory Evaluation Dylos-DC1700 PM Sensor, AQ-SPEC Air Quality Sensor Performance Evaluation Center. Available online:
http://www.aqmd.gov/docs/default-source/aq-spec/laboratory-evaluations/dylos---lab-evaluation.pdf?sfvrsn=2 (accessedon 10 June 2021).
58. Park, H.-Y.; Gilbreath, S.; Barakatt, E. Respiratory outcomes of ultrafine particulate matter (UFPM) as a surrogate measure ofnear-roadway exposures among bicyclists. Environ. Health 2017, 16, 6. [CrossRef]
59. Urban Air Quality Monitoring: Number-and Mass-Based Solutions from TSI Application Note ENV-002 (US). Available online:https://tsi.com/getmedia/f1da0f65-4d63-46d6-8caa-5f8a5969b8aa/Application-Note-ENV-002-(US)-Rev-A_Web_2 (accessedon 18 August 2021).
60. Kim, Y.; Yoon, C.; Ham, S.; Park, J.; Kim, S.; Kwon, O.; Tsai, P.-J. Emissions of Nanoparticles and Gaseous Material from 3D PrinterOperation. Environ. Sci. Technol. 2015, 49, 12044–12053. [CrossRef]
61. Large Format 3D Printer Raise3d Pro2 Plus. Available online: https://www.raise3d.com/products/pro2-plus-3d-printer/(accessed on 3 August 2021).
62. Stefaniak, A.B.; Bowers, L.N.; Knepp, A.K.; Virji, M.A.; Birch, E.M.; Ham, J.E.; Wells, J.R.; Qi, C.; Schwegler-Berry, D.; Friend, S.;et al. Three-dimensional printing with nano-enabled filaments releases polymer particles containing carbon nanotubes into air.Indoor Air 2018, 28, 840–851. [CrossRef]
63. Graphene Enhanced PLA Filament. Available online: http://3dfilaprint.com/msds-for-haydale-graphene-enhanced-pla-filament/ (accessed on 1 August 2021).
64. Davis, A.; Black, M.; Zhang, Q.; Wong, J.P.S.; Weber, R. Fine Particulate and Chemical Emissions from Desktop 3D Printers. InNIP & Digital Fabrication Conference; Society for Imaging Science and Technology: Virginia, VA, USA, 2016; pp. 121–123.
65. Steinle, P. Characterization of emissions from a desktop 3D printer and indoor air measurements in office settings. J. Occup.Environ. Hyg. 2016, 13, 121–132. [CrossRef]
66. Zontek, T.L.; Ogle, B.R.; Jankovic, J.T.; Hollenbeck, S.M. An exposure assessment of desktop 3D printing. ACS Chem. Health Saf.2017, 24, 15–25. [CrossRef]
67. Deng, Y.; Cao, S.-J.; Chen, A.; Guo, Y. The impact of manufacturing parameters on submicron particle emissions from a desktop3D printer in the perspective of emission reduction. Build. Environ. 2016, 104, 311–319. [CrossRef]
68. Pal, N.; Banerjee, S.; Roy, P.; Pal, K. Reduced graphene oxide and PEG-grafted TEMPO-oxidized cellulose nanocrystal reinforcedpoly-lactic acid nanocomposite film for biomedical application. Mater. Sci. Eng. C 2019, 104, 109956. [CrossRef] [PubMed]

Sustainability 2022, 14, 3046 26 of 26
69. ICRP. Human Respiratory Tract Model for Radiological Protection; ICRP Publication 66. Ann.; ICRP: Stockholm, Sweden, 1994;Volume 24, pp. 1–3.
70. Mendes, L.; Kangas, A.; Kukko, K.; Mølgaard, B.; Säämänen, A.; Kanerva, T.; Ituarte, I.F.; Huhtiniemi, M.; Stockmann-Juvala, H.;Partanen, J.; et al. Characterization of Emissions from a Desktop 3D Printer. J. Ind. Ecol. 2017, 21, 94–106. [CrossRef]
71. Hendrikx, B.; Van Broekhuizen, P. Nano reference values in the Netherlands. Gefahrst. Reinhalt. Luft. 2013, 73, 407–414.72. Quang, T.N.; He, C.; Morawska, L.; Knibbs, L. Influence of ventilation and filtration on indoor particle concentrations in urban
office buildings. Atmos. Environ. 2013, 79, 41–52. [CrossRef]73. D’Alicandro, A.C.; Mauro, A. Effects of operating room layout and ventilation system on ultrafine particle transport and
deposition. Atmos. Environ. 2021, 270, 118901. [CrossRef]74. MacCuspie, R.I.; Hill, W.C.; Hall, D.R.; Korchevskiy, A.; Strode, C.D.; Kennedy, A.J.; Ballentine, M.L.; Rycroft, T.; Hull, M.S.
Prevention through design: Insights from computational fluid dynamics modeling to predict exposure to ultrafine particles from3D printing. J. Toxicol. Environ. Health Part A 2021, 84, 458–474. [CrossRef]
Related Documents