9/10/2015 1 ESC Region 12 September 15, 2015 Connecting TAIS framework to PBMAS. Being proactive- using data early and in combination with other accountability reports. Creating common language across state – Refocusing on program effectiveness. Addressing all PBMAS concerns in targeted improvement plans. Copyright © Texas Education Agency 2015. All rights reserved. Statewide paradigm shift… ◦ What is our understanding of PBMAS in general? ◦ How do we think about and what do we do with data? DECPAS-DASPBMAS

Welcome message from author
This document is posted to help you gain knowledge. Please leave a comment to let me know what you think about it! Share it to your friends and learn new things together.
Transcript

9/10/2015
1
ESC Region 12
September 15, 2015
Connecting TAIS framework to PBMAS.
Being proactive- using data early and in combination with other accountability reports.
Creating common language across state –Refocusing on program effectiveness.
Addressing all PBMAS concerns in targeted improvement plans.
Copyright © Texas Education Agency 2015. All rights reserved.
Statewide paradigm shift…◦ What is our understanding of PBMAS in general?
◦ How do we think about and what do we do with data?
DECPAS-DASPBMAS
9/10/2015
2
Performance-Based Monitoring
Analysis System (PBMAS)
Implementation began in
2004
SP
ED
CT
E
BE
/ES
L
Stage of Intervention
Stage of Intervention
Stage of Intervention
Stage of Intervention
NC
LB
Required Determination Levels:
Meets Requirement, Needs Assistance, Needs
Intervention, Needs Substantial Intervention
Meets Requirement = LEA Allowable Maintenance of Effort (MOE) Flexibility
Federally Required LEA
DeterminationsImplementation began
in 2005
Federally Defined Elements
1. Compliance SPP Indicators 9,10,11,12,13
2. Valid, reliable, and timely data submission
3. Uncorrected noncompliance
4. Financial audit findings
State Defined Elements
5. PBMAS SPED stage of intervention (2008)
6. Significant Disproportionality (2012)
On-site Reviews
Residential Facility (RF) Monitoring
Implementation began
in 2006
Federally Required LEA
Determinations
Required Determination Levels:
Meets Requirement, Needs Assistance,
Needs Intervention, Needs Substantial
Intervention
Federally Defined Elements
1. Compliance SPP Indicators
9,10,11,12,13
2. Valid, reliable, and timely data
submission
3. Uncorrected noncompliance
4. Financial audit findings
State Defined Elements
5. PBMAS SPED stage of intervention
6. Significant Disproportionality
Meets Requirement =
LEA Allowable MOE Flexibility
Residential Facility (RF) Monitoring
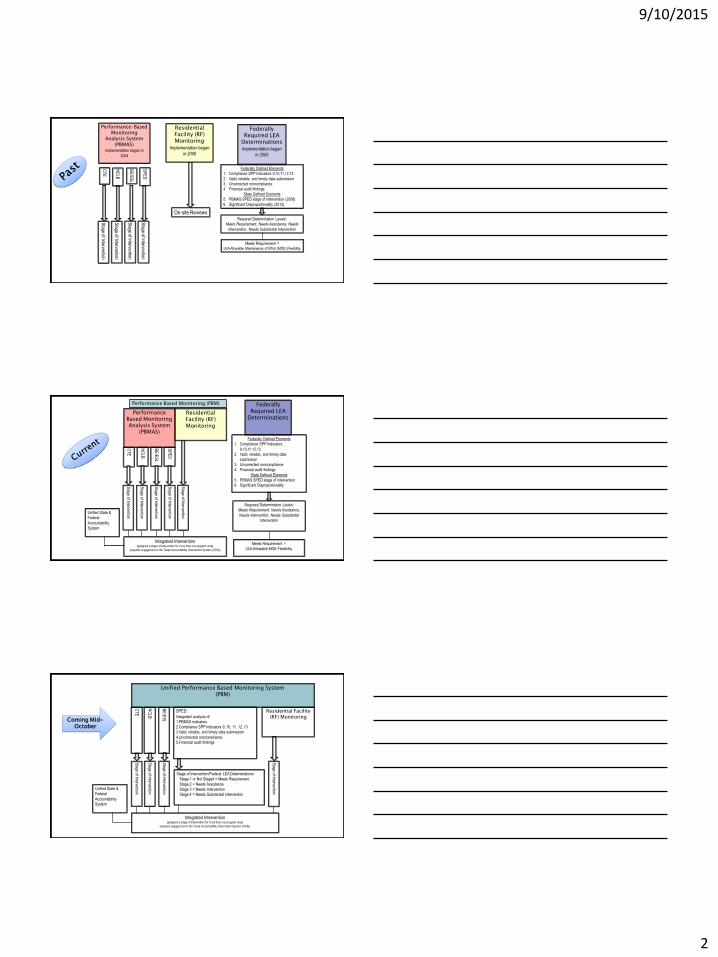
Performance Based Monitoring Analysis System
(PBMAS)
SP
ED
CT
E
BE
/ES
L
NC
LB
Stage of Intervention
Stage of Intervention
Stage of Intervention
Stage of Intervention
Integrated Intervention(assigned a stage of intervention for more than one program area)
(required engagement in the Texas Accountability Intervention System (TAIS))
Stage of Intervention
Unified State &
Federal
Accountability
System
Performance Based Monitoring (PBM)
Unified Performance Based Monitoring System (PBM)
SPED: Integrated analysis of:
1.PBMAS indicators
2.Compliance SPP Indicators 9, 10, 11, 12, 13
3.Valid, reliable, and timely data submission
4.Uncorrected noncompliance
5.Financial audit findings
CT
E
BE
/ES
L
NC
LB
Stage of Intervention
Stage of Intervention
Stage of Intervention
Stage of Intervention/Federal LEA Determinations:
Stage 1 or Not Staged = Meets Requirement
Stage 2 = Needs Assistance
Stage 3 = Needs Intervention
Stage 4 = Needs Substantial Intervention
Integrated Intervention(assigned a stage of intervention for more than one program area)
(required engagement in the Texas Accountability Intervention System (TAIS))
Residential Facility (RF) Monitoring
Stage of Intervention
Unified State &
Federal
Accountability
System
Coming Mid-October

9/10/2015
3
Percentages
Data
Student performance
Connections
Ownership
Support
Disproportionality
Proactive
Common language
Continuous improvement
Processes
Responsibility
Relationships
Interventions
Analysis
TODAY IS TODAY IS NOT
Reframe our thinking
Analyze data
Ask questions
Seek connections
Consider cross-program implications
Filling out templates Technology support with
templates A conversation about what is
out of our control
Consider lessons learned from PBM work over the last few years.
◦ Consider individually (2 min)
◦ Discuss with table group/come to consensus (3 min)
◦ Share with whole group (4 min)

9/10/2015
4
When it is okay or not okay to work in silos?
Who are the right people to bring to the table? (How do you know)?
Why don’t we blame or point fingers? But…at the same time how do we “dig” to find the root cause or “data driver?”
Others?
PBMAS Updates
Changes to Cut Points for BE/ESL Indicator #9 (TELPAS Reading Beginning Proficiency Level Rate) have been implemented
Indicator most missed by districts in our region Grades 3-8 Mathematics & Reading for students served by an ESL program
9/10/2015
5
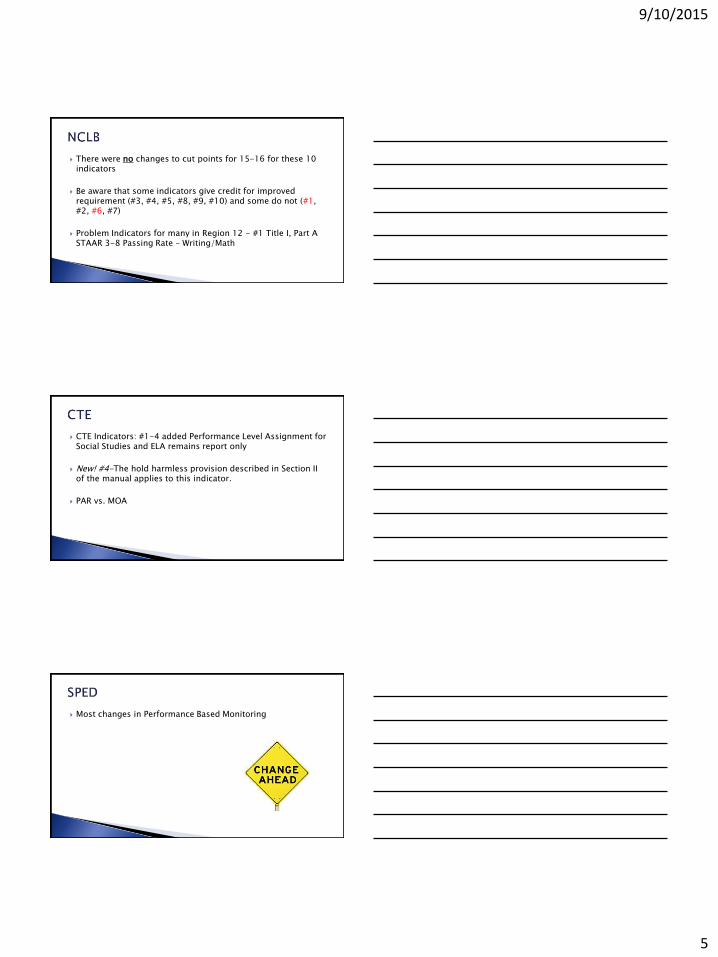
There were no changes to cut points for 15-16 for these 10 indicators
Be aware that some indicators give credit for improved requirement (#3, #4, #5, #8, #9, #10) and some do not (#1, #2, #6, #7)
Problem Indicators for many in Region 12 - #1 Title I, Part A STAAR 3-8 Passing Rate – Writing/Math
CTE Indicators: #1-4 added Performance Level Assignment for Social Studies and ELA remains report only
New! #4-The hold harmless provision described in Section II of the manual applies to this indicator.
PAR vs. MOA
Most changes in Performance Based Monitoring
9/10/2015
6
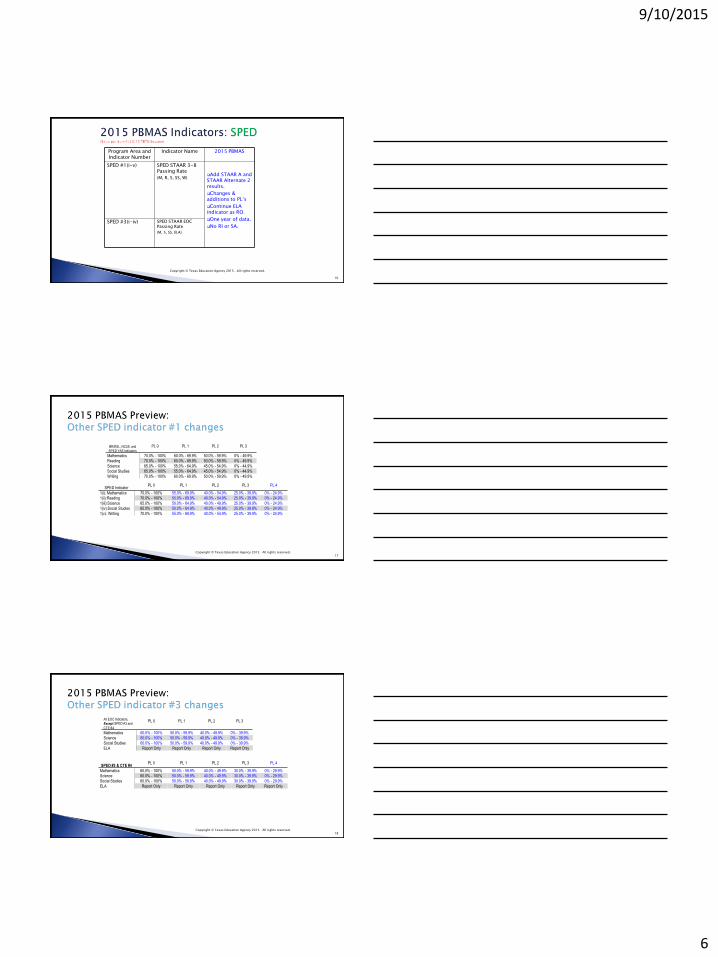
Program Area and Indicator Number
Indicator Name 2015 PBMAS
SPED #1(i-v) SPED STAAR 3-8 Passing Rate
(M, R, S, SS, W)Add STAAR A and STAAR Alternate 2 results.
Changes & additions to PL’s
Continue ELA indicator as RO.
One year of data.
No RI or SA.SPED #3(i-iv) SPED STAAR EOC
Passing Rate
(M, S, SS, ELA)
Copyright © Texas Education Agency 2015. All rights reserved.
16
BE/ESL, NCLB, and
SPED YAE Indicators
PL 0 PL 1 PL 2 PL 3
Mathematics 70.0% - 100% 60.0% - 69.9% 50.0% - 59.9% 0% - 49.9%
Reading 70.0% - 100% 60.0% - 69.9% 50.0% - 59.9% 0% - 49.9%
Science 65.0% - 100% 55.0% - 64.9% 45.0% - 54.9% 0% - 44.9%
Social Studies 65.0% - 100% 55.0% - 64.9% 45.0% - 54.9% 0% - 44.9%
Writing 70.0% - 100% 60.0% - 69.9% 50.0% - 59.9% 0% - 49.9%
Copyright © Texas Education Agency 2015. All rights reserved.17
SPED IndicatorPL 0 PL 1 PL 2 PL 3 PL 4
1(i): Mathematics 70.0% - 100% 55.0% - 69.9% 40.0% - 54.9% 25.0% - 39.9% 0% - 24.9%
1(ii):Reading 70.0% - 100% 55.0% - 69.9% 40.0% - 54.9% 25.0% - 39.9% 0% - 24.9%
1(iii):Science 65.0% - 100% 50.0% - 64.9% 40.0% - 49.9% 25.0% - 39.9% 0% - 24.9%
1(iv):Social Studies 65.0% - 100% 50.0% - 64.9% 40.0% - 49.9% 25.0% - 39.9% 0% - 24.9%
1(v): Writing 70.0% - 100% 55.0% - 69.9% 40.0% - 54.9% 25.0% - 39.9% 0% - 24.9%
All EOC Indicators,
Except SPED #3 and
CTE #4
PL 0 PL 1 PL 2 PL 3
Mathematics 60.0% - 100% 50.0% - 59.9% 40.0% - 49.9% 0% - 39.9%
Science 60.0% - 100% 50.0% - 59.9% 40.0% - 49.9% 0% - 39.9%
Social Studies 60.0% - 100% 50.0% - 59.9% 40.0% - 49.9% 0% - 39.9%
ELA Report Only Report Only Report Only Report Only
Copyright © Texas Education Agency 2015. All rights reserved.18
SPED #3 & CTE #4PL 0 PL 1 PL 2 PL 3 PL 4
Mathematics 60.0% - 100% 50.0% - 59.9% 40.0% - 49.9% 30.0% - 39.9% 0% - 29.9%
Science 60.0% - 100% 50.0% - 59.9% 40.0% - 49.9% 30.0% - 39.9% 0% - 29.9%
Social Studies 60.0% - 100% 50.0% - 59.9% 40.0% - 49.9% 30.0% - 39.9% 0% - 29.9%
ELA Report Only Report Only Report Only Report Only Report Only

9/10/2015
7
For SPED Indicator #1(i-iv), #3(i-iv), and CTE #4• It stipulates that any district that received a PL 0 or 0 RI on the SPED
STAAR Modified Participation Rate indicator in the 2014 PBMAS that would otherwise receive a PL 3 or PL 4 on SPED Indicator #1(i-iv) or #3 (i-iv) in the 2015 PBMAS will receive a PL 3 HH or PL 4 HH, as applicable for that subject area(s).
• For 2015 PBMAS interventions purposes, the count of PL 3 HH or PL 4 HH will not be considered in a district’s total PL 3 or PL 4 count in the program area.
Copyright © Texas Education Agency 2015. All rights reserved.
19
Program Area and Indicator Number
Indicator Name 2015 PBMAS
SPED #17, 18, 19 SPED Discretionary DAEP, ISS, OSS Placements
Begin transition to a new PL structure by reporting disproportionality rates (as Report Only) in addition to percentage point differences.
Copyright © Texas Education Agency 2015. All rights reserved.
20
Why are we transitioning to a new PL structure for the discipline indicators?
◦ The original expectation was that focusing on percentage point differences (DIFF) would encourage districts, regardless of PL assignment, to address issues of disproportionality, but this has not typically been the case. (these indicators’ progress rates have been slower than expected)
◦ Focusing on percentage point differences can mask very high rates of disproportionality and it may have even given some districts the impression they do not have disproportionate discipline placements, when they actually do.
Copyright © Texas Education Agency 2015. All rights reserved.
21
9/10/2015
8
Focusing on districts’ rate of disproportionality is a
more meaningful, reliable way to evaluate
disproportionality and will provide more transparent
information.
Unlike percentage point differences,
disproportionality rates will yield more consistent PL
cut points across all three discipline indicators.
Copyright © Texas Education Agency 2015. All rights reserved.
22
Disproportionality rates are not a significantly different methodology from what’s currently used; they basically take the current calculations one step further and tell us how much higher the special education rate is compared to the all students rate, e.g., 50% higher, 10% higher, 200% higher.
The new PL structure is scheduled to be implemented with the 2017 PBMAS.
Copyright © Texas Education Agency 2015. All rights reserved.
23
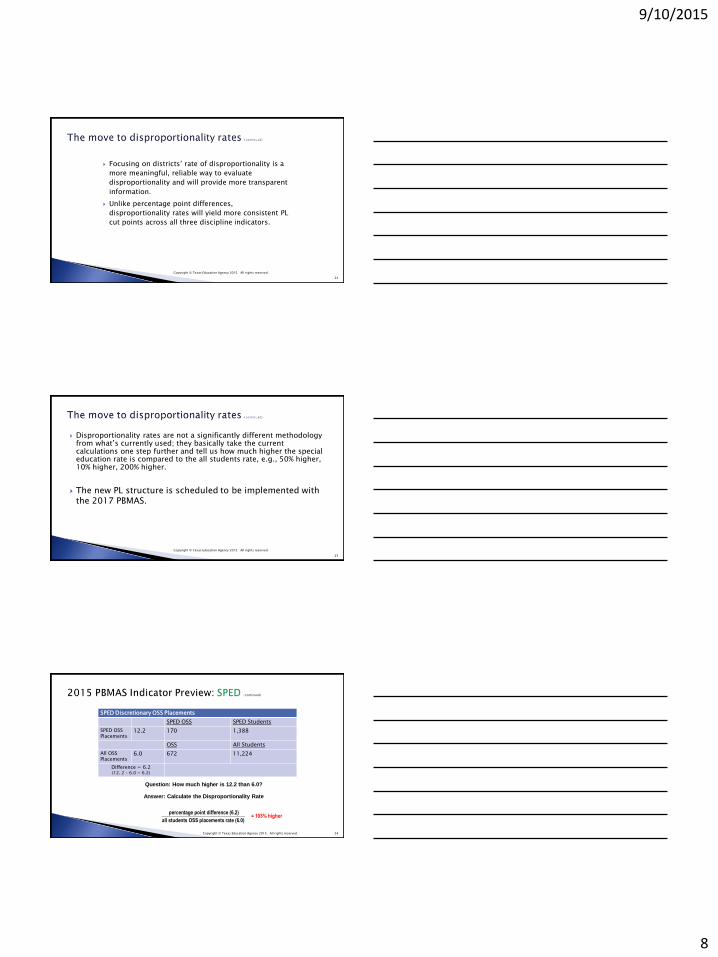
SPED Discretionary OSS Placements
SPED OSS SPED Students
SPED OSSPlacements
12.2 170 1,388
OSS All Students
All OSS Placements
6.0 672 11,224
Difference = 6.2(12. 2 – 6.0 = 6.2)
Copyright © Texas Education Agency 2015. All rights reserved. 24
Question: How much higher is 12.2 than 6.0?
Answer: Calculate the Disproportionality Rate
percentage point difference (6.2)
all students OSS placements rate (6.0)= 103% higher

9/10/2015
9
6.0
0
2
4
6
8
10
12
SPED OSS Rate All Students OSS Rate
SPED OSS Rate Compared to All Students OSS Rate
■ This district’s special education OSS placement rate is 103% higher than its all students OSS placement rate.
Copyright © Texas Education Agency 2015. All rights reserved.
25
■ High disproportionality rates indicate overrepresentation.■ This rate = PL 3 RO.
Each district’s disproportionality rate will be reported based on the percentage ranges below:
Copyright © Texas Education Agency 2015. All rights reserved.
26
Report OnlyPL 0 (RO) PL 1 (RO) PL 2 (RO) PL 3 (RO)
Disproportionality Rate MIN - 10.0% 10.1% - 29.9% 30.0% - 49.9% 50.0% - MAX
2015 Leaver Data Validation district reports will be posted on the TEASE Accountability application on October 30, 2015.
2015 Discipline Data Validation district reports will be posted on the TEASE Accountability application on November 20, 2015.
2015 Student Assessment Data Validation district reports will be posted on the TEASE Accountability application on December 18, 2015.
◦ Indicator preview will be part of the September 24, 2015 TETN.
Copyright © Texas Education Agency 2015. All rights reserved.
27
9/10/2015
10
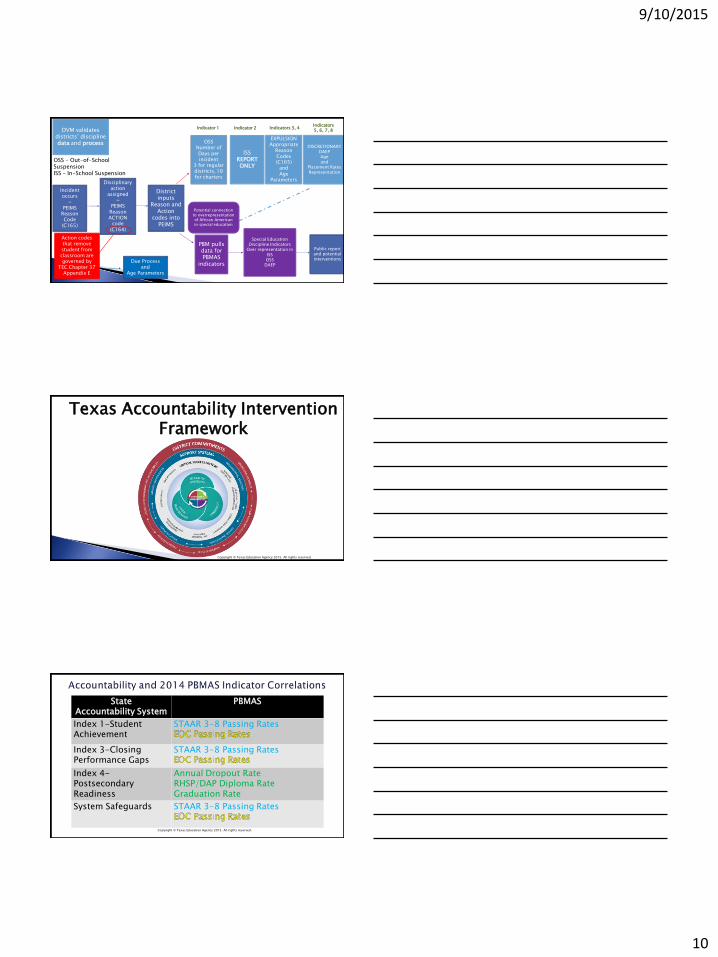
Incident occurs
=PEIMS
Reason Code
(C165)
Disciplinary action
assigned=
PEIMS Reason ACTION
code(C164)
OSSNumber of Days per incident
3 for regular districts, 10 for charters
PBM pulls data for PBMAS
indicators
Special Education Discipline Indicators
Over representation inISSOSS
DAEP
ISSREPORT ONLY
Public report and potential interventions
EXPULSIONAppropriate
Reason Codes (C165)
andAge
Parameters
DVM validates districts’ discipline data and process
Action codes that remove student from classroom are governed by
TEC Chapter 37Appendix E
District inputs
Reason and Action
codes into PEIMS
DISCRETIONARY DAEPAge and
Placement RatesRepresentation
Indicator 1 Indicator 2 Indicators 3, 4Indicators 5, 6, 7, 8
Due Processand
Age Parameters
OSS – Out-of-School SuspensionISS – In-School Suspension
Potential connection to overrepresentation of African American in special education
Texas Accountability Intervention Framework
Copyright © Texas Education Agency 2015. All rights reserved.
Copyright © Texas Education Agency 2015. All rights reserved.
StateAccountability System
PBMAS
Index 1-Student Achievement
STAAR 3-8 Passing Rates
Index 3-Closing Performance Gaps
STAAR 3-8 Passing Rates
Index 4-Postsecondary Readiness
Annual Dropout RateRHSP/DAP Diploma RateGraduation Rate
System Safeguards STAAR 3-8 Passing Rates
9/10/2015
11
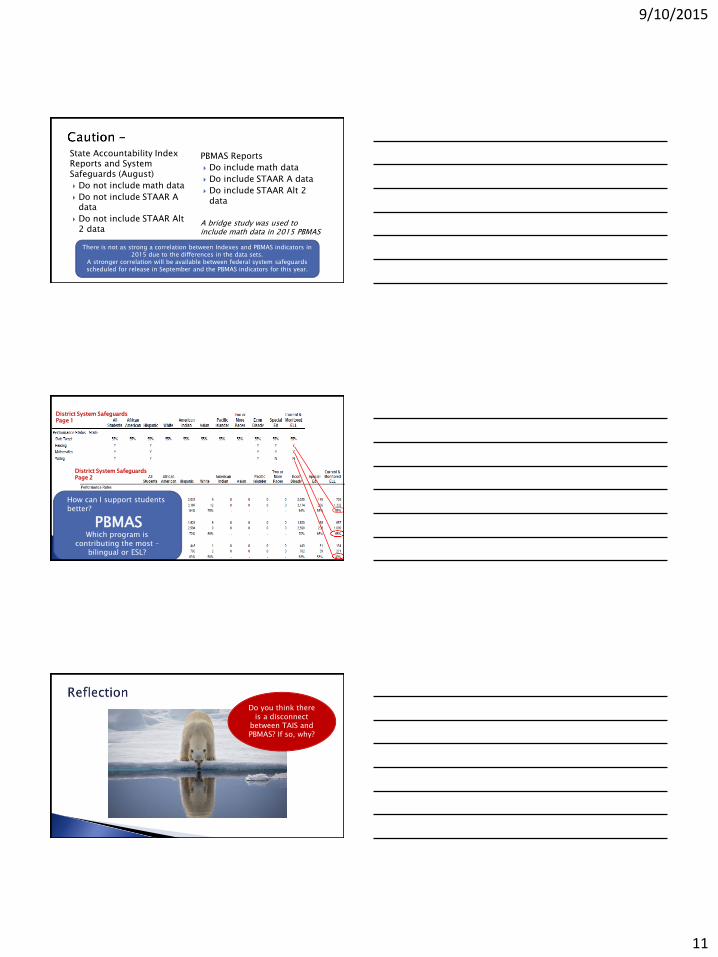
State Accountability Index Reports and System Safeguards (August)
Do not include math data
Do not include STAAR A data
Do not include STAAR Alt 2 data
PBMAS Reports
Do include math data
Do include STAAR A data
Do include STAAR Alt 2 data
A bridge study was used to include math data in 2015 PBMAS
There is not as strong a correlation between Indexes and PBMAS indicators in 2015 due to the differences in the data sets.
A stronger correlation will be available between federal system safeguards scheduled for release in September and the PBMAS indicators for this year.
District System SafeguardsPage 1
District System SafeguardsPage 2
How can I support students better?
Which program is contributing the most –
bilingual or ESL?
PBMAS
Do you think there is a disconnect
between TAIS and PBMAS? If so, why?
9/10/2015
12
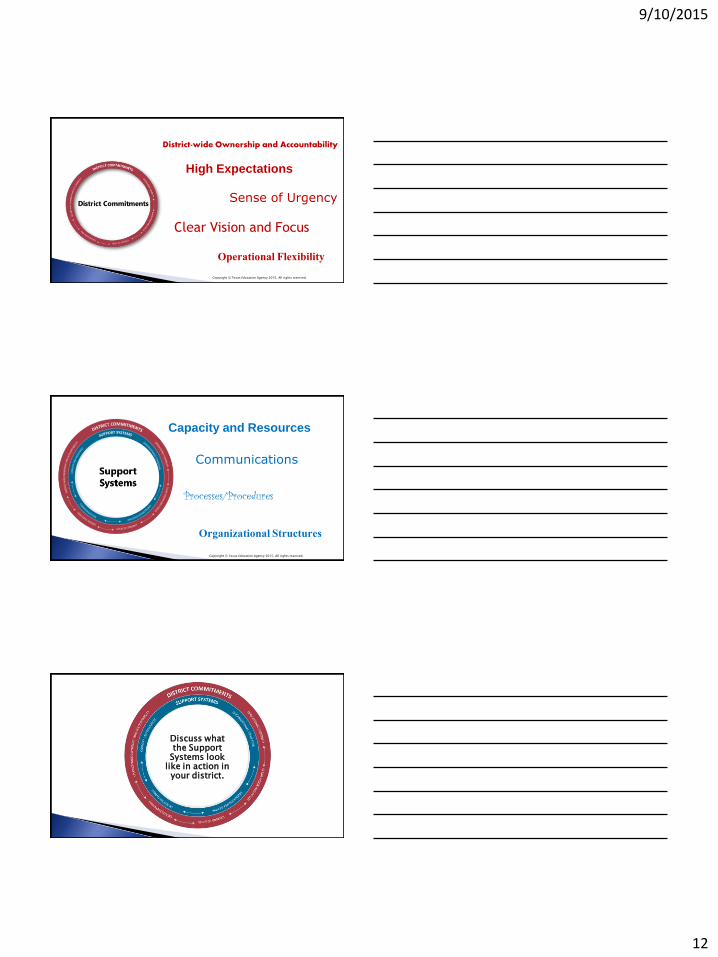
District-wide Ownership and Accountability
High Expectations
Sense of Urgency
Clear Vision and Focus
Operational Flexibility
Copyright © Texas Education Agency 2015. All rights reserved.
Capacity and Resources
Communications
Processes/Procedures
Organizational Structures
Copyright © Texas Education Agency 2015. All rights reserved.
Discuss what the Support
Systems look like in action in your district.
9/10/2015
13
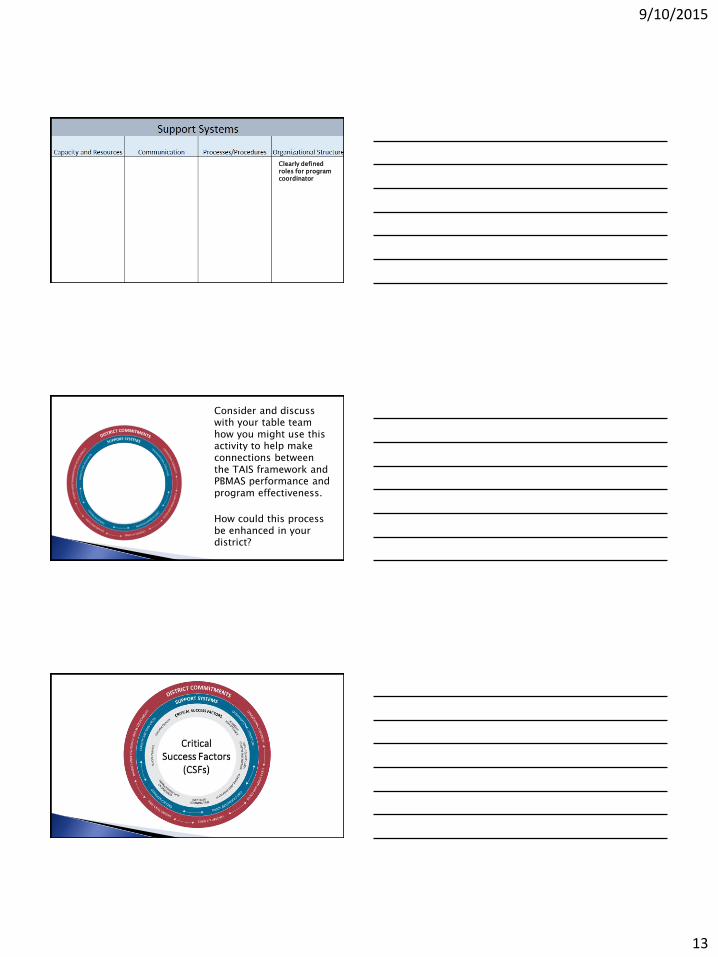
Clearly defined roles for program coordinator
Consider and discuss with your table team how you might use this activity to help make connections between the TAIS framework and PBMAS performance and program effectiveness.
How could this process be enhanced in your district?

9/10/2015
14
A district receives PBMAS data which indicates if programs are effective.
If data reflects that programs are not effective, something must be done to change that.
We need to intervene.
What does it mean to intervene?
the act of becoming involved in something in order to have an influence on what happens
Copyright © Texas Education Agency 2015. All rights reserved.
Data AnalysisNeeds
Assessment
Improvement Plan
Implement & Monitor
Copyright © Texas Education Agency 2015. All rights reserved.

9/10/2015
15
Be thinking about the reasons data meetings fail.
Identify
the
Problem
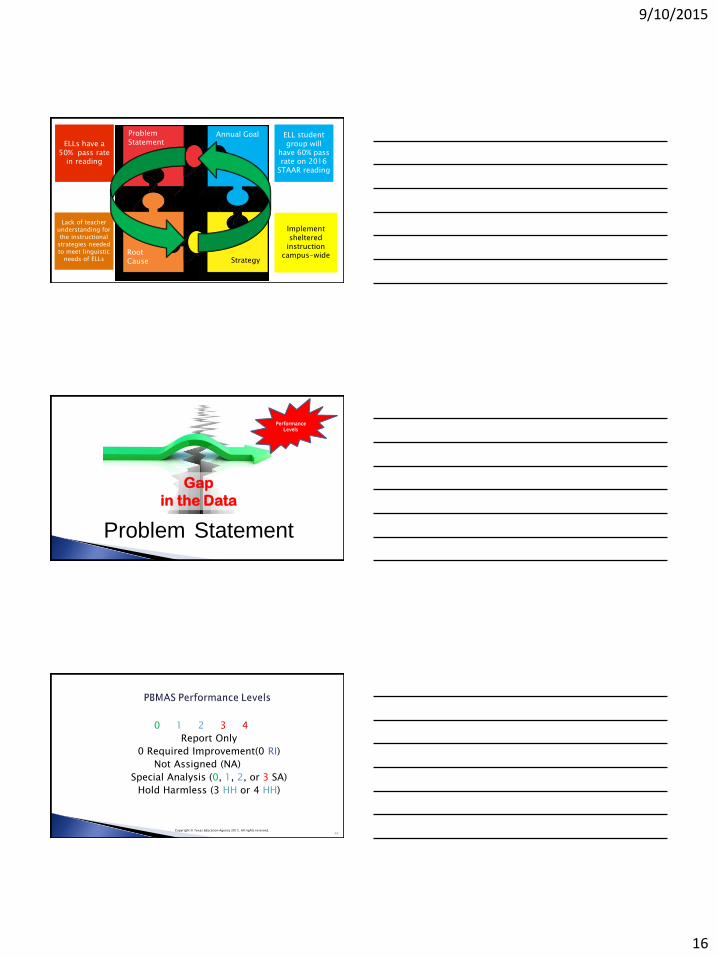
Annual GoalProblem StatementELLs have a
50% pass rate in reading
ELL student group will
have 60% pass rate on 2016
STAAR reading
Root Cause
Strategy
Lack of teacher understanding for the instructional
strategies needed to meet linguistic
needs of ELLs
Implement sheltered
instruction campus-wide
9/10/2015
16
ELLs have a 50% pass rate
in reading
Lack of teacher understanding for the instructional
strategies needed to meet linguistic
needs of ELLs
Annual GoalProblem Statement
Root Cause Strategy
Implement sheltered
instruction campus-wide
ELL student group will
have 60% pass rate on 2016
STAAR reading
Problem Statement
Gap
in the Data
Performance Levels
0 1 2 3 4
Report Only
0 Required Improvement(0 RI)
Not Assigned (NA)
Special Analysis (0, 1, 2, or 3 SA)
Hold Harmless (3 HH or 4 HH)
48Copyright © Texas Education Agency 2015. All rights reserved.

9/10/2015
17
Non-Example Example
Teachers not implementing behavior RtI process has led to a PL3 in overrepresentation of African American students in special education.
Written objectively
Avoids causation
Includes specific details
District has a 12% difference in the representation of African American students in special education (38%) as compared to the representation of African American students within the entire population (26%). Concise Gap in data Verified by data Written objectively Single manageable issue
?
Non-Example Example
Teachers not implementing behavior RtI process has led to a PL3 in overrepresentation of African American students in special education.
Written objectively
Avoids causation
Includes specific details
District has a 12% difference in the representation of African American students in special education (38%) as compared to the representation of African American students within the entire population (26%). Concise Gap in data Verified by data Written objectively Single manageable issue
?This is the rate on
which the PL is based. Page 72 of the 2015
PBMAS Manual.

9/10/2015
18
A district report such as PBMAS is made up of data from campuses.
Districts must understand this relationship.
Mayberry ISD received a performance level 2 in the percent of students with disabilities who are removed to DAEP. They receive a PL3 in the report only indicator that looks at the disproportionality of DAEP placements for students with disabilities.
What’s wrong with that?
What could this be affecting?
What would a district need to focus on in reviewing this situation?
ALL?
Which campuses are contributing to this indicator?

9/10/2015
19
Which campuses are contributing to this indicator?
SOME?
Which campuses are contributing to this indicator?
ONE?
The data from a campus must be analyzed to calculate the PL for this indicator.
The central office can influence what happens, but the campus has to make the change happen because they work with the students!

9/10/2015
20
District
Campus
Department
Grade level
Classrooms
Individual students
Where will I look in the manual? (Who)?
Where do I dig to identify trends with student groups?
How are indicators connected and impacting one another?
How do I look across programs, instructional settings, etc?
We identified an issue with ESL STAAR passing rate.
◦ Who are the ESL STAAR passing students?
◦ Were they SPED?
◦ Was inclusion used effectively?
9/10/2015
21
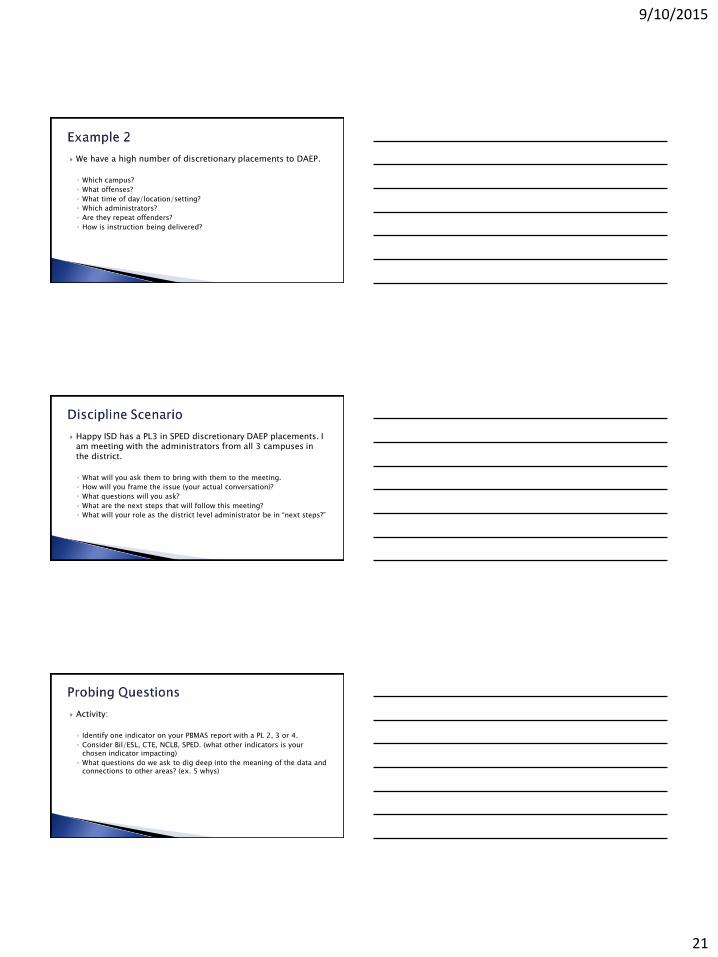
We have a high number of discretionary placements to DAEP.
◦ Which campus?
◦ What offenses?
◦ What time of day/location/setting?
◦ Which administrators?
◦ Are they repeat offenders?
◦ How is instruction being delivered?
Happy ISD has a PL3 in SPED discretionary DAEP placements. I am meeting with the administrators from all 3 campuses in the district.
◦ What will you ask them to bring with them to the meeting.
◦ How will you frame the issue (your actual conversation)?
◦ What questions will you ask?
◦ What are the next steps that will follow this meeting?
◦ What will your role as the district level administrator be in “next steps?”
Activity:
◦ Identify one indicator on your PBMAS report with a PL 2, 3 or 4.
◦ Consider Bil/ESL, CTE, NCLB, SPED. (what other indicators is your chosen indicator impacting)
◦ What questions do we ask to dig deep into the meaning of the data and connections to other areas? (ex. 5 whys)

9/10/2015
22
3 new learnings
2 questions
1 immediate application
Copyright © Texas Education Agency 2009. All rights reserved. 64
Reminder: go into ISAM to view your local determination
Target Date: October 21
Can view PBMAS report as well asdetermination rubric
Not Staged or Stage 1 = Meets Requirements
Stage 2 = Needs Assistance
Stage 3 = Needs Intervention
Stage 4 = Needs Substantial Interventions

9/10/2015
23
Develop a game plan
Bring the right people to the table
Dig, dig, dig into the data
Consider program improvements and plan accordingly
Implement systems for monitoring improvement strategies
Keep the attention away from “filling out templates for TEA”
Maintain momentum of continuous improvement
As you go forth in your work with PBMAS…remember the focus:
• Improving student performance
• Improving the effectiveness of district programs
Related Documents