FIRST HALF 2017 STOCKHOLDER LETTER AND SEMIANNUAL REPORT NYSE SYMBOLS: ECC / ECCA / ECCB / ECCZ

Welcome message from author
This document is posted to help you gain knowledge. Please leave a comment to let me know what you think about it! Share it to your friends and learn new things together.
Transcript

F I R S T H A L F 2 0 1 7
S T O C K H O L D E R L E T T E R A N D
S E M I A N N U A L R E P O R T
NYSE SYMBOLS: ECC / ECCA / ECCB / ECCZ

Page Intentionally Left Blank

Not Part of the Semiannual Report
Dear Stockholders:
We are pleased to provide you with the enclosed report of Eagle Point Credit Company Inc.
(“we,” “us,” “our” or the “Company”) for the six months ended June 30, 2017.
The Company’s primary investment objective is to generate high current income, with a
secondary objective to generate capital appreciation. We seek to achieve these objectives by
investing primarily in equity and junior debt tranches of collateralized loan obligations (“CLOs”)
and may also invest in other securities or instruments that are related investments or that are
consistent with our investment objectives. The Company has a long-term oriented investment
philosophy and invests primarily with a buy-and-hold mentality, though from time to time we
will sell investments in the secondary market.
The first half of 2017 was characterized mostly by stability in US markets. With the Fed, as
widely expected, increasing short-term interest rates twice during the period, it was unsurprising
to see strong demand for floating rate assets (including CLOs) during the first half of the year.
For the six months ended June 30, 2017, the S&P 500 Index, Merrill Lynch High Yield Master
II Index and Credit Suisse Leverage Loan Index (“CSLLI”) generated returns of 9.34%, 4.91%
and 1.96%, respectively.
In addition, we saw relatively stable CLO equity valuations during the first half of the year, and
we built on our positive 2016 performance with the CLO equity in our portfolio continuing to
generate strong and consistent cash flows. For the six months ended June 30, 2017, the Company
generated a net increase in net assets resulting from operations of $16.3 million, or $0.95 per
weighted average common share1 (inclusive of unrealized gains). This represents a non-
annualized return on our common equity of approximately 6% during the first half of 2017.
From December 31, 2016 through June 30, 2017, the Company’s net asset value (“NAV”)
slightly increased by 0.3%, from $17.48 per common share to $17.53 per common share. In
addition to results from operations, a portion of our NAV increase was attributable to our
accretive stock offering during the second quarter. Further, as described below, during the first
six months of the year, the Company paid aggregate distributions totaling $1.00 per share of
common stock with respect to distributions declared in 2017. As of July 31, 2017, management’s
unaudited estimate of the range of the Company’s NAV per common share was between $17.55
and $17.65. The midpoint of this range represents an increase of 0.4% compared to the NAV
per common share as of June 30, 2017.
Early in 2017, we were pleased to announce an increase in the frequency with which we pay
distributions on our common stock from quarterly to monthly. We were able to make this change
Past performance is not indicative of, or a guarantee of, future performance.
1 Weighted average common share based on the average daily number of shares of common stock outstanding over the
period.
August 11, 2017

Not Part of the Semiannual Report
as our portfolio expands and the cash flow it generates is spread out more across the quarter. As
a result, stockholders are now receiving the distributions sooner than they otherwise would have
had we continued with quarterly distributions.
Given the strong demand for CLO debt in the market, we spent a considerable amount of effort
in the first half of 2017 on pursuing “refinancings” (i.e., the ability of a CLO to refinance its debt
securities to lower spreads) and “resets” (i.e., the ability of a CLO to reset its reinvestment and
non-call periods, as well as its maturity, debt spreads and other terms) of certain CLOs in our
portfolio rather than taking a passive approach to our investments. Where applicable, we have
been able to use the deep investing experience of Eagle Point Credit Management LLC, or our
“Adviser,” to achieve attractive pricing and terms on these actions. In our view, the activities
undertaken in this regard should ultimately produce greater cash flows from our CLO equity
investments, thus generating additional value for our portfolio to the benefit of our stockholders.
Despite the stability we observed in the first half of 2017, we believe the CLO market, and CLO
equity and junior debt in particular, remains inefficient. We firmly believe that in less efficient
markets, specialization matters and the Company continues to benefit from the Adviser’s
investment experience. Our Adviser continues to apply its time-tested, private equity style
investment process in a fixed income market in order to create additional long-term value for our
stockholders.
As described below, the Company completed an offering of shares of our common stock during
the first half of 2017. We believe the offering was beneficial to the Company and stockholders
as the stock was issued at a premium to NAV and allowed us to use net proceeds from the
offering to continue to seek vintage period diversification within our investment portfolio.
As we look into the second half of 2017, we expect our investment portfolio to continue to
generate strong cash flows and see attractive long-term opportunities in CLO equity. Further,
refinancings and resets in the first half of 2017 allowed many of our CLO investments to lock in
lower funding costs. These lower costs accrue to the benefit of CLO equity investors such as the
Company and, as such, are expected to boost future cash flows to our CLO equity securities
versus had we not taken action. In addition to strategically reviewing our current investment
portfolio with respect to refinancing and reset prospects (of which we expect to see more over
the rest of the year), we will continue to deploy capital into new investments where we see
opportunities, while selling securities when we see particularly strong demand and pricing.
While we generally pursue a “buy and hold” approach, we also sought to sell securities into
pockets of strength or call CLOs. During the first half, we generated net realized gains of $2.2
million, or $0.13 per weighted average common share.
COMPANY OVERVIEW
Common Stock
The Company’s common stock trades on the New York Stock Exchange (“NYSE”) under the
symbol “ECC.” As of June 30, 2017, the NAV per share of the Company’s common stock was
$17.53. The trading price of our common stock may, and often does, differ from NAV per share.

Not Part of the Semiannual Report
The closing price per share of our common stock was $20.68 on June 30, 2017, representing a
17.97% premium to NAV per share as of such date.2
From our IPO through June 30, 2017, our common stock has traded on average at a 10.40%
premium to NAV. As of August 8, 2017, the closing price per share of common stock was
$21.21, a premium of 21% compared to the midpoint of management’s unaudited and estimated
NAV range of $17.55 to $17.65 as of July 31, 2017.
On May 5, 2017, the Company completed an underwritten public offering of 1,350,000 shares
of its common stock at a public offering price of $19.50 per share, representing a 13.8% gross
premium to the Company’s NAV per share of common stock of $17.13 as of March 31, 2017.
The Company also announced on May 5, 2017 that the underwriters fully exercised their
overallotment option for the offering and purchased an additional 202,500 shares of common
stock. In total, the Company issued 1,552,500 shares of common stock, resulting in net proceeds
to the Company of approximately $28.7 million.
On February 24, 2017, the Company announced its intention to begin paying monthly
distributions and began paying $0.20 per share of common stock each month. This represents a
12.4% annualized distribution rate based on the average daily price of our common stock during
the six-month period ending June 30, 2017 of $19.35 per share.3 During the first six months of
the year, the Company paid aggregate distributions totaling $1.00 per share of common stock
with respect to distributions declared in 2017.4
As previously announced, in June 2017, the Company declared distributions of $0.20 per share
of common stock payable on each of July 31, 2017, August 31, 2017 and September 29, 2017.
The first distribution was paid on July 31, 2017 to common stockholders of record as of July 13,
2017 and the additional distributions will be paid on August 31, 2017 and September 29, 2017
to common stockholders of record as of August 11, 2017 and September 12, 2017, respectively.
For Q1 2017, the Company recorded $0.60 per share of common stock in quarterly net
investment income and realized capital gains, equaling the Company’s distribution run-rate of
$0.60 per share of common stock (based on three separate monthly distributions of $0.20 per
share). In Q2 2017, the Company’s net investment income and realized gains were, in the
aggregate, $0.53 per share of common stock. The lower quarterly total in Q2 2017 was in part
attributable to “cash drag” from capital raised in the common stock offering noted above as there
is typically a lag between capital raises and deployment of the respective proceeds, as well as
the recalibrating of effective yields of certain CLOs as spreads compress in the loan market. The
Company is highly focused on earning its regular common distribution over the long term
through a combination of net investment income plus realized capital gains. We expect that as
2 An investment company trades at a premium when the market price at which its shares trade is more than its net asset
value per share. Alternatively, an investment company trades at a discount when the market price at which its shares
trade is less than its net asset value per share. Past performance is not indicative of, or a guarantee of, future
performance. 3 Based on the payment or declaration of eight separate distributions of $0.20 per share of common stock since February
24, 2017. Since inception, certain of the Company’s distributions were comprised of a return of capital as reflected in
the Company’s financial statements which are available on the EDGAR database on the SEC’s website
(http://www.sec.gov). For the fiscal periods ending June 30, 2017, December 31, 2016, and December 31, 2015,
distributions made by the Company were comprised of a return of capital, as calculated on a per share basis, of 0.0%,
8.3% and 20.4%, respectively. Additionally, for the fiscal periods ending June 30, 2017, December 31, 2016, and
December 31, 2015, distributions made by the Company were comprised of net realized capital gains, as calculated on
a per share basis, of 0.0%, 5.0% and 0.8%, respectively. Distribution amounts not attributable to net realized capital
gains or return of capital were sourced from net investment income. A distribution comprised in whole or in part by a
return of capital does not necessarily reflect the Company’s investment performance and should not be confused with
“yield” or “income”. Future distributions may consist of a return of capital. Not a guarantee of future distributions
or yield. 4 Additionally, in January 2017, the Company paid a distribution of $0.60 per share of common stock to common
stockholders of record as of December 30, 2016.

Not Part of the Semiannual Report
uninvested capital is deployed, our quarterly net investment income per share should, all else
equal, begin to increase over time.
Each quarter since our IPO, quarterly cash flows from the investment portfolio have covered
distributions on our common stock. These cash flows remained strong in the first half of 2017,
totaling $59.7 million, or $3.50 per weighted average common share.
We also want to highlight the Company’s dividend reinvestment plan for common stockholders.
This plan allows common stockholders to have their distributions automatically reinvested into
new shares of common stock. If the prevailing market price of our common stock exceeds our
NAV per share by a certain margin as described in the plan, such reinvestment is at a discount
to the prevailing market price. We encourage all common stockholders to carefully review the
terms of the plan.
Other Securities
In addition to our common stock, the Company has four other securities which trade on the
NYSE, which are summarized below:
Security NYSE
Symbol
Par Amount
Outstanding
Rate Payment
Frequency
Callable Maturity
7.00% Notes due
2020 (“2020 Notes”) ECCZ $60.0 million 7.00% Quarterly
December
2017
December
2020
7.75% Series A Term
Preferred Stock due
2022 (“Series A
Term Preferred
Stock”)
ECCA $45.5 million 7.75% Monthly June
2018
June
2022
7.75% Series B Term
Preferred Stock due
2026 (“Series B Term
Preferred Stock”)
ECCB $46.0 million 7.75% Monthly October
2021
October
2026
6.75% Notes due
2027 (“2027 Notes”) ECCY $27.5 million 6.75% Quarterly
September
2020
September
2027
As of June 30, 2017, we had debt and preferred securities outstanding which totaled
approximately 33% of our total assets (less current liabilities). On a pro forma basis, after giving
effect to the issuance of the 2027 Notes in August 2017, our leverage (including the 2027 Notes,
2020 Notes, Series A Term Preferred Stock and Series B Term Preferred Stock) represented
approximately 37% of the Company’s total assets (less current liabilities) as of June 30, 2017
(after accounting for the distribution of $0.20 per share of common stock paid on July 31, 2017).
Over the long term, management expects the Company to operate under current market
conditions generally with leverage within a range of 25% to 35% of total assets. As market
conditions evolve, or should significant opportunities present themselves, the Company may
incur leverage outside of this range, subject to applicable regulatory limits.
As of June 30, 2017, the 2020 Notes and the two series of preferred stock were all trading at
premiums to their par or liquidation values.

Not Part of the Semiannual Report
Monthly Common Distribution Program
Due to the historical strong and consistent cash flows from the Company’s investment portfolio,
the Company announced in February 2017 that it intended to increase the frequency of
distributions to common stockholders from quarterly to monthly. Accordingly, the Company
has declared several monthly distributions of $0.20 per share of common stock through
September 2017 as described above. In addition, in line with our announcement in February, we
intend to continue declaring monthly distributions on shares of our common stock, although we
note that the actual components and amount of such distributions are subject to variation over
time.
Special Distributions to Common Stock
In order to maintain our tax status as a “regulated investment company” (RIC), the Company is
generally required to pay distributions to holders of its common stock in an amount equal to
substantially all of the Company’s taxable income within one year of the end of its tax year.
In our case, for our tax year ending November 30, 2016, taxable income exceeded the $2.40 per
share of common stock that has been distributed with respect to the 2016 tax year. Therefore, in
order to satisfy tax requirements, we will be making a special distribution to common
stockholders.
PORTFOLIO OVERVIEW
First Half of 2017 Portfolio Update
Our portfolio continues to generate strong and consistent cash flows. During the six month
period ended June 30, 2017, the Company received cash distributions from our portfolio of $59.7
million, or approximately $3.50 per weighted average common share. We seek to reinvest cash
flows in excess of our costs and distributions into new investments in a manner consistent with
our investment objectives and strategy.
During the six months ended June 30, 2017, the Company made 35 new CLO equity and debt
investments with total purchase proceeds of approximately $89.1 million. The Company also
sold 15 investments, generating aggregate sales proceeds of approximately $49.6 million (of this
$49.6 million, $21.9 million were from the monetization of loan accumulation facilities which
were reinvested into CLOs created from those accumulation facilities). While in general the
Company operates with a buy-and-hold approach, many of these sales were focused on
harvesting gains from opportunistic investments that the Company made last year and earlier
this year in the secondary market at discounted prices.
Since August 2016, 24 CLO equity positions in our portfolio were refinanced and 3 were reset.
Many of these transactions occurred in CLOs where the Company, or the Company together
with other clients of our Adviser, hold a majority interest in the equity class. In other cases, a
refinancing or reset transaction was directed by the Company in conjunction with other third
party investors or, as applicable, entirely by third parties. As a result of the refinancings, our
applicable CLO investments saved between 27 bps and 61 bps per annum on financing costs.
Our CLOs incur costs to facilitate refinancings and resets. These costs are typically paid out of
the cash flow from CLOs and may cause a one-period reduction in cash flow to the equity class
of a CLO.

Not Part of the Semiannual Report
In connection with a review and recast of the effective yields on our CLO equity portfolio toward
the end of 2016, we determined going forward to recalibrate an investment’s effective yield at
least once a year, either on the anniversary date of the formation of a CLO investment that we
hold in our portfolio or on a transaction such as a partial sale, add-on purchase, and, as applicable,
refinancing or reset. As a result of our reviews and purchases and sales in our portfolio, the
weighted average effective yield on our CLO equity portfolio had reduced to 15.68% as of June
30, 2017, compared to 17.48% as of December 31, 2016. Importantly, we highlight that the
Company’s effective yields include an allowance for future credit losses. This reduction reflects
a broader market trend of tightening in many credit instruments from which the Company is not
immune. The refinancing or resetting of some of the CLOs in our portfolio, including through
the proactive efforts of our Adviser, mitigated the reduction in our CLO equity portfolio’s
weighted average effective yield as such reduction would have been greater had those steps not
been taken.
Our Adviser continues to seek attractive investment opportunities on our behalf and continues
to evaluate a number of opportunities both in the primary and secondary markets. Maintaining
varied exposure to CLO vintage periods remains a very important part of our investment
approach. As of June 30, 2017, our Adviser has approximately $1.9 billion of assets under
management (inclusive of unfunded capital commitments). We believe the scale and experience
of our Adviser in CLO investing provides the Company with meaningful advantages.
Included within the enclosed report, you will find detailed portfolio information, including
certain look-through information related to the underlying collateral characteristics of the CLO
equity and other unrated investments that we held as of June 30, 2017.
MARKET OVERVIEW
Loan Market
After a strong 2016, the Credit Suisse Leveraged Loan Index (CSLLI) was relatively stable for
the first six months of the year finishing June with an average price of 97.19, flat to the 97.18
price posted at year end. Incorporating interest income, the total return on the CSLLI is 1.96%
year to date. June’s total return of -0.06%, albeit only slightly negative, marked the first negative
total monthly return on the index in 15 months.
The stability of loan prices continues to result in a significant percentage of the loan market
trading above par. As of June 30, 2017, 58.68% of the S&P/LSTA Leveraged Loan Index was
trading at par and above, according to S&P Capital IQ. This compares to 68.31% as of December
31, 2016. Subsequently, as of July 31, 2017, 70.50% of the Index was trading at par and above.
According to Thomson Reuters, total institutional loan issuance increased to a record $496
billion for the first half of 2017 from the $163 billion amount recorded in the first half of 2016.
The increase was driven by refinancings, which have dominated the market thus far in 2017.
Total institutional loans outstanding was $925 billion as of June 30, 2017, providing a large
market for our CLOs in which to continue investing.
Loan market technicals continued to move in the favor of issuers in the first half of 2017, aided
by strong demand for loans, including from CLOs, retail funds and institutional separately
managed accounts. Retail loan funds and ETFs recorded net inflows of $13.6 billion in the first
half of 2017; however, retail fund inflows have moderated in recent months ($2.7 billion in the
second quarter of 2017, down from $10.8 billion in the first quarter).

Not Part of the Semiannual Report
While loan spreads have compressed, it is worth noting that the lagging 12-month default rate
by principal amount on the S&P/LSTA Leveraged Loan Index remains at roughly half the
historical average. As of June, this default rate was 1.54% versus the long-term average of 3.1%.
We expect defaults to remain below the historical average over the near-to-medium term.
However, as we have shared in the past, a low default rate does not mean that the loan market
will not experience loan price volatility. We have sought to position the Company and the
portfolio of investments to be able to take advantage of any such volatility.
CLO Market
Buoyed by stable US markets, CLO issuance remained strong in the first half of 2017 and is
solidly on pace to beat both dealers’ original 2017 projections and our own initial forecasts. For
the first half of 2017, according to S&P Capital IQ, US CLO issuance totaled $52.5 billion
compared to $26.2 billion in the first six months of 2016. The month of June 2017 in particular
was very strong for CLO issuance, with $15.0 billion issued, the highest month of issuance since
March 2015.
We continue to expect CLO issuance for 2017 of between $80 billion and $100 billion, which
would be anywhere between 11% and 38% ahead of the $72.3 billion issued in 2016.
Through the end of June, total U.S. CLO refinancing volume was $77.3 billion which compares
to $22.4 billion in all of 2016. The shorter duration of refinancing AAAs has helped open an
entire new segment of CLO investors – bond portfolios which are benchmarked against the
Bloomberg Barclays US Aggregate Bond Index. Since CLOs are floating rate, they are not
included in the index, but we are finding that an increasing number of core bond fund managers
are adding short-duration floating-rate AAAs to their portfolios in effort to outperform the index.
This demand has helped bring AAA spreads for many CLO refinancings to below 100bps and
we believe this demand is a highly favorable trend for the CLO market.
In addition, reset activity totaling $20.6 billion for the first six months of 2017 also exceeded the
full year 2016 reset volume of $19.3 billion.
The implementation of the risk retention rules has been less of a hindrance to CLO issuance than
many in the market prognosticated. According to Nomura Securities, in 57% of the CLOs issued
this year, CLO collateral managers (or their affiliates) have retained a “horizontal” slice (i.e.
holding interests in the first loss tranche of a CLO), while the other 43% satisfied retention using
the “vertical” approach (i.e. holding interest in each tranche of a CLO).5 This is not a meaningful
change from 2016 (prior to the applicability of U.S. risk retention) when approximately 49%,
based on our Adviser’s analysis, of CLO collateral managers (or their affiliates) purchased the
majority of the equity in their CLOs. The rules continue to have a minimal impact on our
investment strategy.
ADDITIONAL INFORMATION
In addition to the Company’s regulatory requirement to file certain quarterly and semi-annual
portfolio information as described further in the enclosed report, the Company makes a monthly
estimate of NAV and certain additional unaudited financial and portfolio information available
to investors via our website (www.eaglepointcreditcompany.com). This information includes
(1) an estimated range of the Company’s net investment income and realized capital gains or
losses per weighted average share of common stock for each calendar quarter end, generally
5 Nomura Securities International, Inc., CLO Special Topics: Review of 2017 H1 Trends (June 29, 2017).

Not Part of the Semiannual Report
made available within the first fifteen days after the applicable calendar month end, (2) an
estimated range of the Company’s NAV per share of common stock for the prior month end and
certain additional portfolio-level information, generally made available within the first fifteen
days after the applicable calendar month end, and (3) during the latter part of each month, an
updated estimate of NAV, if applicable, and, with respect to each calendar quarter end, an
updated estimate of the Company’s net investment income and realized capital gains or losses
per share for the applicable quarter, if available.
SUBSEQUENT DEVELOPMENTS
On June 28, 2017, the Company established an “at-the-market” program under which the
Company may issue up to $50,000,000 of common stock and up to 1,000,000 shares of 7.75%
Series B Term Preferred Stock due 2026. As of August 8, 2017, the Company issued 50,005
shares of our common stock and 27,584 shares of our Series B Term Preferred Stock pursuant
to the “at-the-market” offering, for total net proceeds to the Company of approximately $1.7
million.
Management’s unaudited estimate of the range of the Company’s NAV per share of common
stock was between $17.55 and $17.65 as of July 31, 2017. The midpoint of this range represents
an increase of 0.4% from the Company’s NAV per share of common stock as of June 30, 2017.
In the period from July 1, 2017 through August 8, 2017, the Company received cash distributions
on its investment portfolio of $20.8 million. During that same period, the Company made gross
new investments totaling $22.1 million. As of August 8, 2017, the Company had $36.5 million
of cash available for investment (which includes proceeds from the recent 2027 Notes offering).
We appreciate the trust and confidence our stockholders have placed in the Company.
Thomas Majewski
Chief Executive Officer
This letter is intended to assist stockholders in understanding the Company’s performance during the six
months ended June 30, 2017. The views and opinions in this letter were current as of August 11, 2017.
Statements other than those of historical facts included herein may constitute forward-looking statements
and are not guarantees of future performance or results and involve a number of risks and uncertainties.
Actual results may differ materially from those in the forward-looking statements as a result of a number
of factors. The Company undertakes no duty to update any forward-looking statement made herein.

Not Part of the Semiannual Report
Page Intentionally Left Blank

1
Eagle Point Credit Company Inc.
Semiannual Report – June 30, 2017
Table of Contents
Important Information ................................................................................................................................................................. 2
Summary of Certain Unaudited Portfolio Characteristics............................................................................................................ 4
Consolidated Financial Statements for the Six Months Ended June 30, 2017 (Unaudited) ......................................................... 6
Dividend Reinvestment Plan ..................................................................................................................................................... 35
Additional Information .............................................................................................................................................................. 37

2
Important Information
This report is transmitted to the stockholders of Eagle Point Credit Company Inc. (“we”, “us”, “our” or the “Company”) and is
furnished pursuant to certain regulatory requirements. This report and the information and views herein do not constitute
investment advice, or a recommendation or an offer to enter into any transaction with the Company or any of its affiliates. This
report is provided for informational purposes only, does not constitute an offer to sell securities of the Company and is not a
prospectus. From time to time, the Company may have a registration statement relating to one or more of its securities on file
with the US Securities and Exchange Commission (“SEC”). Any registration statement that has not yet been declared effective
by the SEC, and any prospectus relating thereto, is not complete and may be changed. Any securities that are the subject of
such a registration statement may not be sold until the registration statement filed with the SEC is effective.
This report is solely for the use of the intended recipient(s). The information and its contents are the property of Eagle Point
Credit Management LLC (the “Adviser”) and/or the Company. Any unauthorized dissemination, copying or use of this
presentation is strictly prohibited and may be in violation of law. This presentation is being provided for informational purposes
only.
Investors should read the Company’s prospectus and SEC filings (which are publicly available on the EDGAR Database
on the SEC website at http://www.sec.gov) carefully and consider their investment goals, time horizons and risk
tolerance before investing in the Company. Investors should also consider the Company’s investment objectives, risks,
charges and expenses carefully before investing in securities of the Company. The Company’s prospectus and other
SEC filings contain this and other important information about the Company. There is no guarantee that any of the goals,
targets or objectives described in this report will be achieved.
An investment in the Company is not appropriate for all investors. The investment program of the Company is speculative,
entails substantial risk and includes investment techniques not employed by traditional mutual funds. An investment in the
Company is not intended to be a complete investment program. Shares of closed-end investment companies, such as the
Company, frequently trade at a discount from their net asset value (“NAV”), which may increase investors’ risk of loss. Past
performance is not indicative of, or a guarantee of, future performance. The performance and certain other portfolio information
quoted herein represents information as of June 30, 2017. Nothing herein should be relied upon as a representation as to the
future performance or portfolio holdings of the Company. Investment return and principal value of an investment will fluctuate,
and shares, when sold, may be worth more or less than their original cost. The Company’s performance is subject to change
since the end of the period noted in this report and may be lower or higher than the performance data shown herein.
Neither Eagle Point Credit Management LLC (the “Adviser”) nor the Company provide legal, accounting or tax advice. Any
statement regarding such matters is explanatory and may not be relied upon as definitive advice. Investors should consult with
their legal, accounting and tax advisors regarding any potential investment. The information presented herein is as of the dates
noted herein and is derived from financial and other information of the Company, and, in certain cases, from third party sources
and reports (including reports of third party custodians, CLO managers and trustees) that have not been independently verified
by the Company. As noted herein, certain of this information is estimated and unaudited, and therefore subject to change. We
do not represent that such information is accurate or complete, and it should not be relied upon as such.
About Eagle Point Credit Company Inc.
The Company is a publicly-traded, non-diversified, closed-end management investment company. The Company’s investment
objectives are to generate high current income and capital appreciation primarily through investment in equity and junior debt
tranches of CLOs. The Company is externally managed and advised by Eagle Point Credit Management LLC. The principals
of Eagle Point Credit Management LLC are Thomas P. Majewski, Daniel W. Ko and Daniel M. Spinner. The Company makes
certain unaudited portfolio information available each month on its website in addition to making certain other unaudited
financial information available on its website (www.eaglepointcreditcompany.com). This information includes (1) an
estimated range of the Company’s net investment income (“NII”) and realized capital gains or losses per weighted average
share of common stock for each calendar quarter end, generally made available within the first fifteen days after the applicable
calendar month end, (2) an estimated range of the Company’s net asset value (“NAV”) per share of common stock for the prior
month end and certain additional portfolio-level information, generally made available within the first fifteen days after the
applicable calendar month end, and (3) during the latter part of each month, an updated estimate of NAV, if applicable, and,

3
with respect to each calendar quarter end, an updated estimate of the Company’s NII and realized capital gains or losses for the
applicable quarter, if available.
Forward-Looking Statements
This report may contain “forward-looking statements” within the meaning of the Private Securities Litigation Reform Act of
1995. Statements other than statements of historical facts included in this report may constitute forward-looking statements and
are not guarantees of future performance or results and involve a number of risks and uncertainties. Actual results may differ
materially from those in the forward-looking statements as a result of a number of factors, including those described in the
Company’s filings with the SEC. The Company undertakes no duty to update any forward-looking statement made herein. All
forward-looking statements speak only as of the date of this report.
Notes
1 The summary of portfolio investments shown is based on the estimated fair value of the underlying positions. 2 Information relating to the market price of underlying collateral is as of month end; however, with respect to other information shown, depending on when such information
was received, the data may reflect a lag in the information reported. As such, while this information was obtained from third party data sources, June 2017 trustee reports and
similar reports, other than market price, it does not reflect actual underlying portfolio characteristics as of June 30, 2017 and this data may not be representative of current or
future holdings. 3 We obtain exposure in underlying senior secured loans indirectly through our investments in CLOs. 4 “LIBOR” refers to the London Interbank Offered Rate. 5 Credit ratings shown are based on those assigned by Standard & Poor’s Rating Group, or “S&P,” or, for comparison and informational purposes, if S&P does not assign a
rating to a particular obligor, the weighted average rating shown reflects the S&P equivalent rating of a rating agency that rated the obligor provided that such other rating is
available with respect to a CLO equity or related investment held by us. In the event multiple ratings are available, the lowest S&P rating, or if there is no S&P rating, the
lowest equivalent rating, is used. The ratings of specific borrowings by an obligor may differ from the rating assigned to the obligor and may differ among rating agencies.
For certain obligors, no rating is available in the reports received by the Company. Such obligors are not shown in the graphs and, accordingly, the sum of the percentages in
the graphs may not equal 100%. Ratings below BBB- are below investment grade. Further information regarding S&P’s rating methodology and definitions may be found on
its website (www.standardandpoors.com). This data includes underlying portfolio characteristics of the Company’s CLO equity and loan accumulation facility portfolio. 6 Industry categories are based on the S&P industry categorization of each obligor as set forth in CLO trustee reports relating to investments held by the Company or, if such
information is not available in CLO trustee reports, the categories are based on equivalent categorizations as reported by a third party data provider. In addition, certain
underlying borrowers may be re‐classified from time to time based on developments in their respective businesses and/or market practices. Accordingly, certain underlying
borrowers that are currently, or were previously, summarized as a single borrower or in a particular industry may in current or future periods be reflected as multiple borrowers
or in a different industry, as applicable.

Please see footnote disclosures on page 3.
4
Summary of Certain Unaudited Portfolio Characteristics
The information presented below is on a look–through basis to the collateralized loan obligation, or “CLO”, equity and related
investments held by the Company as of June 30, 2017 (except as otherwise noted) and reflects the aggregate underlying
exposure of the Company based on the portfolios of those investments. The data is estimated and unaudited and is derived from
CLO trustee reports received by the Company relating to June 2017 and from custody statements and/or other information
received from CLO collateral managers, or other third party sources.
Summary of Portfolio Investments (as of 6/30/2017)1
Summary of Underlying Portfolio Characteristics (as of 6/30/2017)2
Number of Unique Underlying Obligors 1,197
Largest Exposure to an Individual Obligor 0.94%
Average Individual Obligor Exposure 0.08%
Top 10 Obligors Exposure 6.39%
Currency: USD Exposure 100.00%
Aggregate Indirect Exposure to Senior Secured Loans3 97.94%
Weighted Average Junior OC Cushion 4.22%
Weighted Average Market Value of Collateral 98.43%
Weighted Average Stated Spread 3.75%
Weighted Average LIBOR4 Floor 0.96%
Weighted Average % of Floating Rate Loans w/ LIBOR4 Floors 83.21%
Weighted Average Rating5 B+/B
Weighted Average Maturity 5.2 years
CLO Equity 91.8%
(60
Investments)Loan
Accumulation
Facilities
5.3% (4
Investments)
CLO Debt
2.9% (8
Investments)

Please see footnote disclosures on page 3.
5
The top ten underlying obligors on a look-through
basis to the Company’s CLO equity and other unrated
investments as of June 30, 2017 are
provided below:
Obligor % of Total
Dell 0.9%
Asurion 0.8%
American Airlines 0.7%
Bass Pro Group 0.6%
Albertsons 0.6%
First Data 0.6%
CenturyLink 0.6%
Micro Focus 0.5%
Energy Future Holdings 0.5%
WME/IMG Worldwide 0.5%
Total 6.4%
The credit ratings distribution of the underlying
obligors on a look-through basis to the Company’s
June 30, 2017 is provided below:
The top ten industries of the underlying obligors on a
look-through basis to the Company’s CLO equity and
other unrated investments as of June 30, 2017 are
provided below:
Industry % of Total
Health care 8.7%
Business equipment & services 7.1%
Telecommunications 6.7%
Electronics/electrical 6.4%
Financial intermediaries 4.7%
Lodging & casinos 3.9%
Chemicals & plastics 3.9%
Leisure goods/activities/movies 3.8%
Utilities 3.7%
Building & development 3.5%
Total 52.5%
The maturity distribution of the underlying obligors on
a look-through basis to the Company’s CLO equity
and other unrated investments as of June 30, 2017 is
provided below:
0.03% 1.4%
3.3% 4.9%
15.3%
22.8%
37.6%
10.6%
2.3% 0.5% 1.0%
0%
20%
40%
BBB BBB- BB+ BB BB- B+ B B- CCC+ CCC CCC-
and
Below
% o
f F
un
d E
xp
osu
re
S&P Issuer Rating
0.2% 1.1% 3.9%
10.7%
19.3% 18.0%
24.3% 22.5%
0%
20%
40%
2017 2018 2019 2020 2021 2022 2023 2024+
% o
f F
un
d E
xp
osu
re
Maturity
Top 10 Underlying Obligors2
Rating Distribution of Underlying Obligors2,5
Top 10 Industries of Underlying Obligors2,6
Maturity Distribution of Underlying Obligors2

6
Consolidated Financial Statements for the Six Months Ended
June 30, 2017 (Unaudited)
Consolidated Statement of Assets and Liabilities .............................................................................................................. 7
Consolidated Schedule of Investments .............................................................................................................................. 8
Consolidated Statements of Operations ........................................................................................................................... 10
Consolidated Statements of Changes in Net Assets ......................................................................................................... 13
Consolidated Statement of Cash Flows ........................................................................................................................... 14
Notes to Consolidated Financial Statements .................................................................................................................... 15
Financial Highlights ......................................................................................................................................................... 33

Eagle Point Credit Company Inc. & Subsidiaries
Consolidated Statement of Assets and Liabilities
As of June 30, 2017
(expressed in U.S. dollars)
(Unaudited)
See accompanying notes to the consolidated financial statements
7
ASSETS
Investments, at fair value (cost $463,223,053) $ 446,634,518
Interest receivable 13,309,042
Cash 6,343,509
Receivable for securities sold 2,507,761
Prepaid expenses 546,138
Receivable for shares of common stock issued in accordance with the Company's dividend reinvestment plan 318,939
Total Assets 469,659,907
LIABILITIES
7.75% Series A Term Preferred Stock due 2022 (Note 6):
7.75% Series A Term Preferred Stock due 2022 (1,818,000 shares outstanding) 45,450,000
Unamortized deferred debt issuance costs associated with 7.75% Series A Term Preferred Stock due 2022 (1,652,490)
Net 7.75% Series A Term Preferred Stock due 2022 less associated unamortized deferred debt issuance costs 43,797,510
7.75% Series B Term Preferred Stock due 2026 (Note 6):
7.75% Series B Term Preferred Stock due 2026 (1,840,000 shares outstanding) 46,000,000
Unamortized deferred debt issuance costs associated with 7.75% Series B Term Preferred Stock due 2026 (2,358,443)
Net 7.75% Series B Term Preferred Stock due 2026 less associated unamortized deferred debt issuance costs 43,641,557
7.00% Unsecured Notes due 2020 (Note 7):
7.00% Unsecured Notes due 2020 59,998,750
Unamortized deferred debt issuance costs associated with 7.00% Unsecured Notes due 2020 (2,000,054)
Net 7.00% Unsecured Notes due 2020 less associated unamortized deferred debt issuance costs 57,998,696
Payable for securities purchased 2,504,573
Incentive fee payable 2,246,352
Management fee payable 1,765,236
Professional fees payable 321,275
Administration fees payable 196,207
Tax expense payable 34,952
Other expenses payable 17,723
Total Liabilities 152,524,081
COMMITMENTS AND CONTINGENCIES (Note 9)
NET ASSETS applicable to 18,090,708 shares of $0.001 par value common stock outstanding $ 317,135,826
NET ASSETS consist of:
Paid-in capital (Note 5) $ 344,506,114
Accumulated net realized gain (loss) on investments 4,924,071
Net unrealized appreciation (depreciation) on investments (16,588,535)
Aggregate common stock distributions paid in excess of net investment income (15,705,824)
Total Net Assets $ 317,135,826
Net asset value per share of common stock $ 17.53

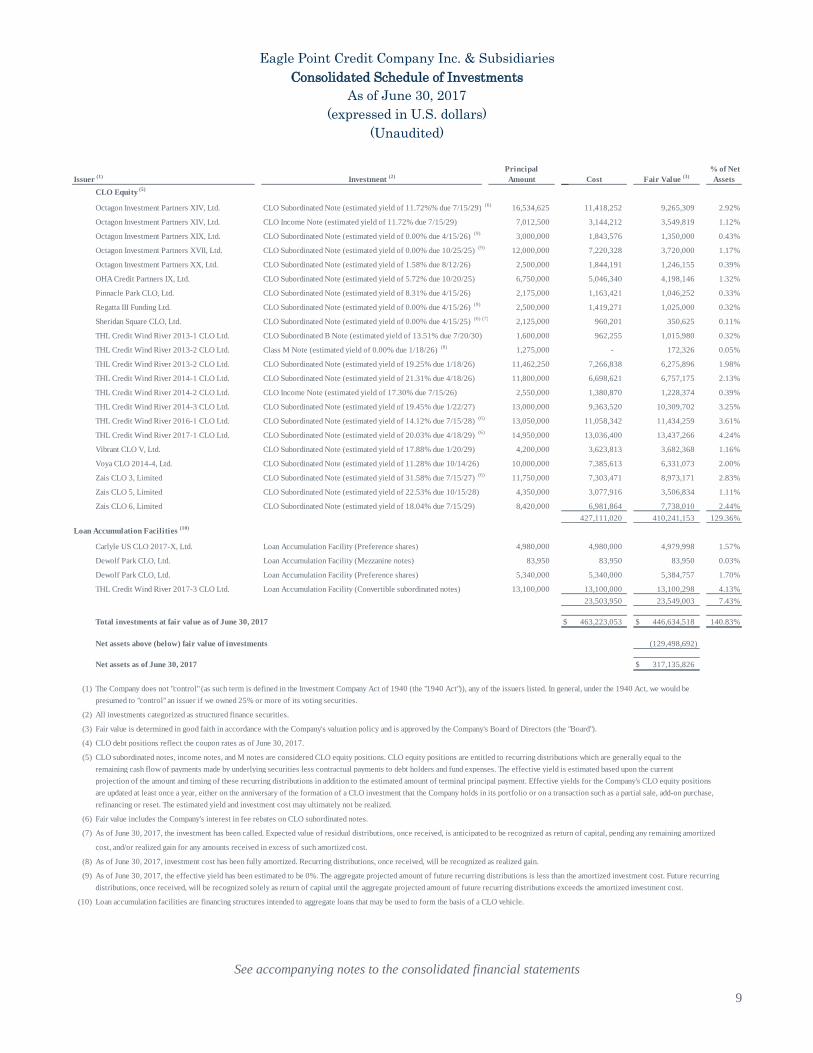
Eagle Point Credit Company Inc. & Subsidiaries
Consolidated Schedule of Investments
As of June 30, 2017
(expressed in U.S. dollars)
(Unaudited)
See accompanying notes to the consolidated financial statements
8
Investment (2)
Cost
% of Net
Assets
Apidos CLO XIV CLO Secured Note - Class E (5.56% due 4/15/25) $ 2,762,500 $ 2,714,751 $ 2,727,969 0.86%
Apidos CLO XIV CLO Secured Note - Class F (6.41% due 4/15/25) 850,000 812,706 812,515 0.26%
CIFC Funding 2013-II, Ltd. CLO Secured Note - Class B2L (5.76% due 4/21/25) 630,000 623,749 623,700 0.20%
CIFC Funding 2013-II, Ltd. CLO Secured Note - Class B3L (6.91% due 4/21/25) 1,191,000 1,145,574 1,145,742 0.36%
CIFC Funding 2014, Ltd. CLO Secured Note - Class F (6.41% due 4/18/25) 1,870,000 1,646,740 1,731,808 0.55%
Marathon CLO VIII Ltd. CLO Secured Note - Class D (7.21% due 7/18/27) 1,500,000 1,427,512 1,432,650 0.45%
Octagon Investment Partners XIV, Ltd. CLO Secured Note - Class E-R (9.51% due 7/15/29) 2,975,000 2,682,769 2,781,328 0.87%
THL Credit Wind River 2013-2 CLO Ltd. CLO Secured Note - Class F (6.41% due 1/18/26) 1,700,000 1,554,282 1,588,650 0.50%
12,608,083 12,844,362 4.05%
ALM VIII, Ltd. CLO Preferred Shares (estimated yield of 14.25% due 1/20/26) (6)
8,725,000 6,122,024 5,749,766 1.81%
ALM XIX, Ltd. CLO Preferred Shares (estimated yield of 11.18% due 7/15/28) 1,300,000 1,288,068 1,206,248 0.38%
Apidos CLO XIV CLO Subordinated Note (estimated yield of 15.11% due 4/15/25) (6)
11,177,500 6,560,740 5,485,887 1.73%
Ares XLI CLO Ltd. CLO Subordinated Note (estimated yield of 17.08% due 1/15/29) 18,995,000 16,217,247 16,941,951 5.34%
Ares XLIII CLO Ltd. CLO Subordinated Note (estimated yield of 15.47% due 10/15/29) (6)
20,100,000 17,763,877 17,634,555 5.56%
Ares XXIX CLO Ltd. CLO Subordinated Note (estimated yield of 14.43% due 4/17/26) 850,000 455,543 437,878 0.14%
Ares XXXIX CLO Ltd. CLO Subordinated Note (estimated yield of 18.80% due 7/18/28) 4,022,535 2,953,120 3,194,647 1.01%
Atlas Senior Loan Fund, Ltd. CLO Subordinated Note (estimated yield of 0.00% due 8/15/24) (6) (7) (8)
6,350,000 - 241,300 0.08%
Atrium IX CLO Subordinated Note (estimated yield of 14.40% due 2/28/24) 9,210,000 5,567,332 7,618,354 2.40%
Atrium XI CLO Subordinated Note (estimated yield of 14.39% due 2/28/47) 5,903,000 4,822,321 4,666,553 1.47%
Avery Point V CLO, Ltd. CLO Income Note (estimated yield of 0.00% due 7/17/26) (9)
10,875,000 6,320,778 2,794,875 0.88%
Babson CLO Ltd. 2013-II CLO Subordinated Note (estimated yield of 25.23% due 1/18/25) (6)
12,939,125 7,148,238 6,891,375 2.17%
Bain Capital Credit CLO 2016-2, Limited CLO Subordinated Note (estimated yield of 16.68% due 1/15/29) (6)
16,700,000 14,175,726 12,780,042 4.03%
Barings CLO Ltd. 2016-III CLO Subordinated Note (estimated yield of 14.42% due 1/15/28) (6)
38,150,000 31,990,635 31,089,573 9.80%
Battalion CLO IX Ltd. CLO Subordinated Note (estimated yield of 15.88% due 7/15/28) (6)
18,250,000 14,655,722 11,569,316 3.65%
Benefit Street Partners CLO V, Ltd. CLO Preferred Shares (estimated yield of 18.39% due 10/20/26) 2,250,000 1,451,638 1,256,913 0.40%
Birchwood Park CLO, Ltd. CLO Income Note (estimated yield of 15.61% due 7/15/26) 1,575,000 852,469 830,683 0.26%
BlueMountain CLO 2013-2, Ltd. CLO Subordinated Note (estimated yield of 18.05% due 1/22/25) 5,000,000 3,506,373 3,038,467 0.96%
Bowman Park CLO Ltd. CLO Subordinated Note (estimated yield of 15.75% due 11/23/25) 8,180,000 5,480,203 5,068,639 1.60%
Bristol Park CLO, Ltd. CLO Subordinated Note (estimated yield of 15.80% due 4/15/29) (6)
34,250,000 27,816,331 28,823,825 9.09%
Carlyle Global Market Strategies CLO 2014-5, Ltd. CLO Subordinated Note (estimated yield of 24.96% due 10/16/25) 8,300,000 4,700,879 5,840,321 1.84%
CIFC Funding 2013-II, Ltd. CLO Subordinated Note (estimated yield of 24.41% due 4/21/25) (6)
12,325,000 5,506,496 5,392,145 1.70%
CIFC Funding 2013-II, Ltd. CLO Income Note (estimated yield of 24.41% due 4/21/25) 4,025,000 1,237,426 1,714,828 0.54%
CIFC Funding 2014, Ltd. CLO Subordinated Note (estimated yield of 23.66% due 4/18/25) (6)
13,387,500 7,587,409 7,354,334 2.32%
CIFC Funding 2014, Ltd. CLO Income Note (estimated yield of 23.66% due 4/18/25) 500,000 297,906 268,600 0.08%
CIFC Funding 2014-III, Ltd. CLO Income Note (estimated yield of 16.05% due 7/22/26) 14,000,000 8,718,087 8,571,872 2.70%
CIFC Funding 2014-IV, Ltd. CLO Income Note (estimated yield of 8.27% due 10/17/26) 7,000,000 4,647,394 3,600,358 1.14%
CIFC Funding 2015-III, Ltd. CLO Subordinated Note (estimated yield of 19.32% due 10/19/27) (6)
11,616,216 8,322,683 7,756,432 2.45%
Cutwater 2015-I, Ltd. CLO Subordinated Note (estimated yield of 26.88% due 7/15/27) (6)
22,300,000 14,928,801 17,210,577 5.43%
Flagship CLO VIII, Ltd. CLO Subordinated Note (estimated yield of 10.16% due 1/16/26) (6)
20,000,000 12,274,364 9,854,493 3.11%
Flagship CLO VIII, Ltd. CLO Income Note (estimated yield of 10.16% due 1/16/26) 7,360,000 4,121,135 3,378,234 1.07%
Galaxy XVIII CLO, Ltd. CLO Subordinated Note (estimated yield of 8.53% due 10/15/26) 5,000,000 2,991,042 2,074,429 0.65%
GoldenTree Loan Opportunities VIII, Limited CLO Subordinated Note (estimated yield of 8.06% due 4/19/26) 16,560,000 11,862,840 10,250,120 3.23%
Halcyon Loan Advisors Funding 2014-3, Ltd. CLO Subordinated Note (estimated yield of 3.32% due 10/22/25) 5,750,000 3,624,401 2,737,329 0.86%
KVK CLO 2013-2 Ltd. CLO Subordinated Note (estimated yield of 19.21% due 1/15/26) 5,924,000 2,421,361 2,269,788 0.72%
KVK CLO 2014-1 Ltd. CLO Subordinated Note (estimated yield of 22.39% due 5/15/26) 3,175,000 1,129,349 859,612 0.27%
Madison Park Funding VIII, Ltd. CLO Subordinated Note (estimated yield of 0.00% due 4/22/22) (7)
9,050,000 784,149 724,000 0.23%
Madison Park Funding XXI, Ltd. CLO Subordinated Note (estimated yield of 16.02% due 7/25/29) 3,000,000 2,481,288 2,744,171 0.87%
Marathon CLO VI Ltd. CLO Subordinated Note (estimated yield of 26.23% due 5/13/25) 2,975,000 1,618,547 1,853,657 0.58%
Marathon CLO VII Ltd. CLO Subordinated Note (estimated yield of 16.51% due 10/28/25) 10,526,000 7,126,198 7,601,680 2.40%
Marathon CLO VIII Ltd. CLO Subordinated Note (estimated yield of 21.37% due 7/18/27) 14,500,000 11,085,441 11,942,077 3.77%
Octagon Investment Partners 26, Ltd. CLO Subordinated Note (estimated yield of 11.34% due 4/15/27) (6)
13,750,000 10,478,455 10,650,347 3.36%
Octagon Investment Partners 27, Ltd. CLO Subordinated Note (estimated yield of 12.94% due 7/15/27) (6)
14,800,000 11,817,669 11,657,162 3.68%
CLO Debt (4)
CLO Equity (5)
Issuer (1)
Principal
Amount Fair Value (3)
Eagle Point Credit Company Inc. & Subsidiaries
Consolidated Schedule of Investments
As of June 30, 2017
(expressed in U.S. dollars)
(Unaudited)
See accompanying notes to the consolidated financial statements
9
Investment (2)
Cost
% of Net
Assets
Octagon Investment Partners XIV, Ltd. CLO Subordinated Note (estimated yield of 11.72%% due 7/15/29) (6)
16,534,625 11,418,252 9,265,309 2.92%
Octagon Investment Partners XIV, Ltd. CLO Income Note (estimated yield of 11.72% due 7/15/29) 7,012,500 3,144,212 3,549,819 1.12%
Octagon Investment Partners XIX, Ltd. CLO Subordinated Note (estimated yield of 0.00% due 4/15/26) (9)
3,000,000 1,843,576 1,350,000 0.43%
Octagon Investment Partners XVII, Ltd. CLO Subordinated Note (estimated yield of 0.00% due 10/25/25) (9)
12,000,000 7,220,328 3,720,000 1.17%
Octagon Investment Partners XX, Ltd. CLO Subordinated Note (estimated yield of 1.58% due 8/12/26) 2,500,000 1,844,191 1,246,155 0.39%
OHA Credit Partners IX, Ltd. CLO Subordinated Note (estimated yield of 5.72% due 10/20/25) 6,750,000 5,046,340 4,198,146 1.32%
Pinnacle Park CLO, Ltd. CLO Subordinated Note (estimated yield of 8.31% due 4/15/26) 2,175,000 1,163,421 1,046,252 0.33%
Regatta III Funding Ltd. CLO Subordinated Note (estimated yield of 0.00% due 4/15/26) (9)
2,500,000 1,419,271 1,025,000 0.32%
Sheridan Square CLO, Ltd. CLO Subordinated Note (estimated yield of 0.00% due 4/15/25) (6) (7)
2,125,000 960,201 350,625 0.11%
THL Credit Wind River 2013-1 CLO Ltd. CLO Subordinated B Note (estimated yield of 13.51% due 7/20/30) 1,600,000 962,255 1,015,980 0.32%
THL Credit Wind River 2013-2 CLO Ltd. Class M Note (estimated yield of 0.00% due 1/18/26) (8)
1,275,000 - 172,326 0.05%
THL Credit Wind River 2013-2 CLO Ltd. CLO Subordinated Note (estimated yield of 19.25% due 1/18/26) 11,462,250 7,266,838 6,275,896 1.98%
THL Credit Wind River 2014-1 CLO Ltd. CLO Subordinated Note (estimated yield of 21.31% due 4/18/26) 11,800,000 6,698,621 6,757,175 2.13%
THL Credit Wind River 2014-2 CLO Ltd. CLO Income Note (estimated yield of 17.30% due 7/15/26) 2,550,000 1,380,870 1,228,374 0.39%
THL Credit Wind River 2014-3 CLO Ltd. CLO Subordinated Note (estimated yield of 19.45% due 1/22/27) 13,000,000 9,363,520 10,309,702 3.25%
THL Credit Wind River 2016-1 CLO Ltd. CLO Subordinated Note (estimated yield of 14.12% due 7/15/28) (6)
13,050,000 11,058,342 11,434,259 3.61%
THL Credit Wind River 2017-1 CLO Ltd. CLO Subordinated Note (estimated yield of 20.03% due 4/18/29) (6)
14,950,000 13,036,400 13,437,266 4.24%
Vibrant CLO V, Ltd. CLO Subordinated Note (estimated yield of 17.88% due 1/20/29) 4,200,000 3,623,813 3,682,368 1.16%
Voya CLO 2014-4, Ltd. CLO Subordinated Note (estimated yield of 11.28% due 10/14/26) 10,000,000 7,385,613 6,331,073 2.00%
Zais CLO 3, Limited CLO Subordinated Note (estimated yield of 31.58% due 7/15/27) (6)
11,750,000 7,303,471 8,973,171 2.83%
Zais CLO 5, Limited CLO Subordinated Note (estimated yield of 22.53% due 10/15/28) 4,350,000 3,077,916 3,506,834 1.11%
Zais CLO 6, Limited CLO Subordinated Note (estimated yield of 18.04% due 7/15/29) 8,420,000 6,981,864 7,738,010 2.44%
427,111,020 410,241,153 129.36%
Carlyle US CLO 2017-X, Ltd. Loan Accumulation Facility (Preference shares) 4,980,000 4,980,000 4,979,998 1.57%
Dewolf Park CLO, Ltd. Loan Accumulation Facility (Mezzanine notes) 83,950 83,950 83,950 0.03%
Dewolf Park CLO, Ltd. Loan Accumulation Facility (Preference shares) 5,340,000 5,340,000 5,384,757 1.70%
THL Credit Wind River 2017-3 CLO Ltd. Loan Accumulation Facility (Convertible subordinated notes) 13,100,000 13,100,000 13,100,298 4.13%
23,503,950 23,549,003 7.43%
Total investments at fair value as of June 30, 2017 $ 463,223,053 $ 446,634,518 140.83%
Net assets above (below) fair value of investments (129,498,692)
Net assets as of June 30, 2017 $ 317,135,826
(1)
(2)
(3)
(4)
(5)
are updated at least once a year, either on the anniversary of the formation of a CLO investment that the Company holds in its portfolio or on a transaction such as a partial sale, add-on purchase,
refinancing or reset. The estimated yield and investment cost may ultimately not be realized.
(6)
(7)
(8)
(9)
(10)
As of June 30, 2017, investment cost has been fully amortized. Recurring distributions, once received, will be recognized as realized gain.
As of June 30, 2017, the effective yield has been estimated to be 0%. The aggregate projected amount of future recurring distributions is less than the amortized investment cost. Future recurring
distributions, once received, will be recognized solely as return of capital until the aggregate projected amount of future recurring distributions exceeds the amortized investment cost.
Loan Accumulation Facilities (10)
As of June 30, 2017, the investment has been called. Expected value of residual distributions, once received, is anticipated to be recognized as return of capital, pending any remaining amortized
cost, and/or realized gain for any amounts received in excess of such amortized cost.
Issuer (1)
remaining cash flow of payments made by underlying securities less contractual payments to debt holders and fund expenses. The effective yield is estimated based upon the current
CLO subordinated notes, income notes, and M notes are considered CLO equity positions. CLO equity positions are entitled to recurring distributions which are generally equal to the
CLO debt positions reflect the coupon rates as of June 30, 2017.
All investments categorized as structured finance securities.
CLO Equity (5)
presumed to "control" an issuer if we owned 25% or more of its voting securities.
Principal
Amount Fair Value (3)
The Company does not "control" (as such term is defined in the Investment Company Act of 1940 (the "1940 Act")), any of the issuers listed. In general, under the 1940 Act, we would be
Fair value is determined in good faith in accordance with the Company's valuation policy and is approved by the Company's Board of Directors (the "Board").
Fair value includes the Company's interest in fee rebates on CLO subordinated notes.
projection of the amount and timing of these recurring distributions in addition to the estimated amount of terminal principal payment. Effective yields for the Company's CLO equity positions
Loan accumulation facilities are financing structures intended to aggregate loans that may be used to form the basis of a CLO vehicle.

Eagle Point Credit Company Inc. & Subsidiaries
Consolidated Statement of Operations
For the six months ended June 30, 2017
(expressed in U.S. dollars)
(Unaudited)
See accompanying notes to the consolidated financial statements
10
INVESTMENT INCOME
Interest income $ 30,155,195
Other income 2,170,923
Total Investment Income 32,326,118
EXPENSES
Interest expense:
Interest expense on 7.75% Series A Term Preferred Stock due 2022 1,781,841
Interest expense on 7.75% Series B Term Preferred Stock due 2026 1,848,400
Interest expense on 7.00% Unsecured Notes due 2020 2,285,601
Total Interest Expense 5,915,842
Incentive fee 4,226,989
Management fee 3,416,365
Administration fees 523,179
Professional fees 372,532
Tax expense 407,927
Directors' fees 181,250
Other expenses 374,080
Total Expenses 15,418,164
NET INVESTMENT INCOME 16,907,954
REALIZED AND UNREALIZED GAIN (LOSS) ON INVESTMENTS
Net realized gain (loss) on investments 2,212,326
Net change in unrealized appreciation (depreciation) on investments (2,802,475)
NET GAIN (LOSS) ON INVESTMENTS (590,149)
NET INCREASE (DECREASE) IN NET ASSETS RESULTING FROM OPERATIONS $ 16,317,805

Eagle Point Credit Company Inc. & Subsidiaries
Consolidated Statements of Operations
(expressed in U.S. dollars)
(Unaudited)
See accompanying notes to the consolidated financial statements
11
INVESTMENT INCOME
Interest income $ 30,155,195 $ 26,571,134
Other income 2,170,923 456,071
Total Investment Income 32,326,118 27,027,205
EXPENSES
Interest expense:
Interest expense on 7.75% Series A Term Preferred Stock due 2022 1,781,841 1,913,168
Interest expense on 7.75% Series B Term Preferred Stock due 2026 1,848,400 -
Interest expense on 7.00% Unsecured Notes due 2020 2,285,601 1,157,694
Total Interest Expense 5,915,842 3,070,862
Incentive fee 4,226,989 4,083,857
Management fee 3,416,365 2,118,230
Administration fees 523,179 393,604
Professional fees 372,532 356,990
Tax expense 407,927 275,335
Directors' fees 181,250 172,750
Other expenses 374,080 220,081
Total Expenses 15,418,164 10,691,709
NET INVESTMENT INCOME 16,907,954 16,335,496
REALIZED AND UNREALIZED GAIN (LOSS) ON INVESTMENTS
Net realized gain (loss) on investments 2,212,326 334,236
Net change in unrealized appreciation (depreciation) on investments (2,802,475) 8,102,293
NET GAIN (LOSS) ON INVESTMENTS (590,149) 8,436,529
NET INCREASE (DECREASE) IN NET ASSETS RESULTING FROM OPERATIONS $ 16,317,805 $ 24,772,025
Note: The above Consolidated Statements of Operations includes the six months ended June 30, 2016 which has been provided as supplemental
information to the consolidated financial statements.
June 30, 2016
six months ended
For the
June 30, 2017
six months ended
For the

Eagle Point Credit Company Inc. & Subsidiaries
Consolidated Statements of Operations
(expressed in U.S. dollars)
(Unaudited)
See accompanying notes to the consolidated financial statements
12
INVESTMENT INCOME
Interest income $ 15,342,100 $ 14,813,095 $ 30,155,195
Other income 891,359 1,279,564 2,170,923
Total Investment Income 16,233,459 16,092,659 32,326,118
EXPENSES
Interest expense:
Interest expense on 7.75% Series A Term Preferred Stock due 2022 945,983 835,858 1,781,841
Interest expense on 7.75% Series B Term Preferred Stock due 2026 932,056 916,344 1,848,400
Interest expense on unsecured notes payable 1,172,228 1,113,373 2,285,601
Interest expense 3,050,267 2,865,575 5,915,842
Incentive fee 2,091,657 2,135,332 4,226,989
Management fee 1,765,237 1,651,128 3,416,365
Administration fees 254,695 268,484 523,179
Professional fees 148,892 223,640 372,532
Tax expense 279,177 128,750 407,927
Directors' fees 89,375 91,875 181,250
Other expenses 187,531 186,549 374,080
Total Expenses 7,866,831 7,551,333 15,418,164
NET INVESTMENT INCOME 8,366,628 8,541,326 16,907,954
REALIZED AND UNREALIZED GAIN (LOSS) ON INVESTMENTS
Net realized gain (loss) on investments 925,342 1,286,984 2,212,326
Net change in unrealized appreciation (depreciation) on investments 6,243,403 (9,045,878) (2,802,475)
NET GAIN (LOSS) ON INVESTMENTS 7,168,745 (7,758,894) (590,149)
NET INCREASE (DECREASE) IN NET ASSETS RESULTING FROM
OPERATIONS $ 15,535,373 $ 782,432 $ 16,317,805
Note: The above Consolidated Statement of Operations represents the three months ended June 30, 2017, the three months ended March 31, 2017, and the six
months ended June 30, 2017, and has been provided as supplemental information to the consolidated financial statements.
For the
three months ended
March 31, 2017
For the
six months ended
June 30, 2017June 30, 2017
For the
three months ended

Eagle Point Credit Company Inc. & Subsidiaries
Consolidated Statements of Changes in Net Assets
(expressed in U.S. dollars, except share amounts)
(Unaudited)
See accompanying notes to the consolidated financial statements
13
Net increase (decrease) in net assets resulting from operations:
Net investment income $ 16,907,954 $ 31,374,840
Net realized gain (loss) on investments 2,212,326 1,915,455
Net change in unrealized appreciation (depreciation) on investments (2,802,475) 57,289,768
Total net increase (decrease) in net assets resulting from operations 16,317,805 90,580,063
Common stock distributions paid to stockholders:
Common stock distributions from net investment income (16,907,954) (31,374,840)
Common stock distributions from net realized gains on investments (206,394) (1,915,455)
Common stock distributions from return of capital - (3,160,204)
Total common stock distributions paid to stockholders (17,114,348) (36,450,499)
Capital share transactions:
Issuance of shares of common stock upon the Company's follow-on public offerings,
net of underwriting discounts, commissions and offering expenses 28,684,431 43,337,451
Reduction in stockholders' capital related to excess common offering expenses paid for
issuance of shares of common stock upon the Company's follow-on public offerings (24,368) -
Issuance of shares of common stock in accordance with the Company's dividend
reinvestment plan 1,224,971 973,235
Total capital share transactions 29,885,034 44,310,686
Total increase (decrease) in net assets 29,088,491 98,440,250
Net assets at beginning of period 288,047,335 189,607,085
Net assets at end of period $ 317,135,826 $ 288,047,335
Capital share activity:
Shares of common stock sold upon the Company's follow-on public offerings 1,552,500 2,597,553
Shares of common stock issued in accordance with the Company's dividend
reinvestment plan 63,329 57,216
Total increase (decrease) in capital share activity 1,615,829 2,654,769
June 30, 2017 December 31, 2016
For the
six months ended
For the
year ended

Eagle Point Credit Company Inc. & Subsidiaries
Consolidated Statement of Cash Flows
For the six months ended June 30, 2017
(expressed in U.S. dollars)
(Unaudited)
See accompanying notes to the consolidated financial statements
14
CASH FLOWS FROM OPERATING ACTIVITIES
Net increase (decrease) in net assets resulting from operations $ 16,317,805
Adjustments to reconcile net increase (decrease) in net assets resulting from operations to net cash
provided by (used in) operating activities:
Purchases of investments (125,175,805)
Proceeds from sales or maturity of investments (1)
88,709,835
Net realized (gain) loss on investments (2,212,326)
Net change in unrealized (appreciation) depreciation on investments 2,802,475
Net amortization (accretion) included in interest expense on 7.75% Series A Term Preferred Stock due 2022 20,646
Net amortization (accretion) included in interest expense on 7.75% Series B Term Preferred Stock due 2026 65,892
Net amortization (accretion) included in interest expense on 7.00% Unsecured Notes due 2020 185,644
Net amortization (accretion) of premiums or discounts on CLO debt securities (20,406)
Changes in assets and liabilities:
Interest receivable (2,382,216)
Receivable for securities sold (2,507,761)
Prepaid expenses (89,606)
Payable for securities purchased 2,380,260
Incentive fee payable (57,325)
Management fee payable 218,828
Administration fees payable 29,900
Professional fees payable 60,181
Tax expense payable (600,998)
Directors' fees payable (43,750)
Other expenses payable (87,558)
Net cash provided by (used in) operating activities (22,386,285)
CASH FLOWS FROM FINANCING ACTIVITIES
Common stock distributions paid to stockholders (26,999,275)
Issuance of shares of common stock upon the Company's follow-on public offerings, net of
underwriting discounts, commissions and offering expenses 28,684,431
Issuance of shares of common stock in accordance with the Company's dividend reinvestment plan 906,032
Reduction in stockholders' capital related to excess common offering expenses paid for issuance of shares of common stock
upon the Company's follow-on public offerings (24,368)
Deferred debt issuance costs associated with 7.75% Series B Term Preferred Stock due 2026 (91,403)
Net cash provided by (used in) financing activities 2,475,417
NET INCREASE (DECREASE) IN CASH (19,910,868)
CASH, BEGINNING OF PERIOD 26,254,377
CASH, END OF PERIOD $ 6,343,509
Supplemental disclosure of non-cash financing activities:
Change in issuance of shares of common stock in accordance with the Company's dividend reinvestment plan, not yet received $ 318,939
Supplemental disclosures:
Cash paid for interest expense on 7.75% Series A Term Preferred Stock due 2022 $ 1,761,195
Cash paid for interest expense on 7.75% Series B Term Preferred Stock due 2026 $ 1,782,507
Cash paid for interest expense on 7.00% Unsecured Notes due 2020 $ 2,099,956
Cash paid for income and excise taxes $ 1,008,925
(1) Proceeds from sales or maturity of investments includes $29,736,776 of recurring cash flows which are considered return of capital on portfolio investments.

Eagle Point Credit Company Inc. & Subsidiaries
Notes to Consolidated Financial Statements
June 30, 2017
(Unaudited)
15
1. ORGANIZATION
Eagle Point Credit Company Inc. (the “Company”) is an externally managed, non-diversified closed-end management
investment company registered under the Investment Company Act of 1940, as amended (the “1940 Act”). The
Company’s common stock is listed on the New York Stock Exchange (the “NYSE”) under the symbol “ECC.”
As of June 30, 2017, the Company had two wholly-owned subsidiaries: Eagle Point Credit Company Sub LLC, a
Delaware limited liability company, and Eagle Point Credit Company Sub (Cayman) Ltd., a Cayman Islands exempted
company.
The Company was initially formed on March 24, 2014 as Eagle Point Credit Company LLC, a Delaware limited liability
company and a wholly-owned subsidiary of Eagle Point Credit Partners Sub Ltd., a Cayman Island exempted company
(the “Sole Member”), which, in turn, is a subsidiary of Eagle Point Credit Partners LP (the “Private Fund”). The Private
Fund is a master fund in a master feeder structure and has three feeder funds which invest substantially all of their assets
in the Private Fund.
The Company commenced operations on June 6, 2014, the date the Sole Member contributed, at fair value, a portfolio
of cash and securities to the Company.
For the period of June 6, 2014 to October 5, 2014, the Company was a wholly-owned subsidiary of the Sole Member,
which in turn was a wholly-owned subsidiary of the Private Fund. As of October 5, 2014, the Company had 2,500,000
units issued and outstanding, all of which were held by the Sole Member.
On October 6, 2014, the Company converted from a Delaware limited liability company into a Delaware corporation
(the “Conversion”). At the time of the Conversion, the Sole Member became a stockholder of Eagle Point Credit
Company Inc. In connection with the Conversion, the Sole Member converted 2,500,000 units of the Delaware limited
liability company into shares of common stock in the Delaware corporation at $20 per share, resulting in 8,656,057
shares and an effective conversion rate of 3.4668 shares per unit. On October 7, 2014, the Company priced its initial
public offering (the “IPO”) and, on October 8, 2014, the Company’s shares began trading on the NYSE.
See Note 5 “Common Stock” for further discussion relating to the Conversion and the IPO.
On July 20, 2016, the Company entered into a custody agreement with Wells Fargo Bank, National Association (“Wells
Fargo”), pursuant to which the Company’s portfolio of securities are held by Wells Fargo. The principal business
address of Wells Fargo is 9062 Old Annapolis Road, Columbia, Maryland 21045.
The Company intends to operate so as to qualify to be taxed as a regulated investment company (“RIC”) under
subchapter M of the Internal Revenue Code of 1986, as amended (the “Code”), for federal income tax purposes.
Eagle Point Credit Management LLC (the “Adviser”) is the investment adviser of the Company and manages the
investments of the Company subject to the supervision of the Company’s Board of Directors (the “Board”). The Adviser
is registered as an investment adviser with the U.S. Securities and Exchange Commission (the “SEC”) under the
Investment Advisers Act of 1940, as amended. Eagle Point Administration LLC, a wholly-owned subsidiary of the
Adviser, is the administrator of the Company (the “Administrator”).
The Company’s primary investment objective is to generate high current income, with a secondary objective to generate
capital appreciation. The Company seeks to achieve its investment objectives by investing primarily in equity and junior
debt tranches of collateralized loan obligations (“CLOs”) that are collateralized by a portfolio consisting primarily of
below investment grade U.S. senior secured loans. The CLO securities in which the Company will primarily seek to
invest are unrated or rated below investment grade and are considered speculative with respect to timely payment of
interest and repayment of principal. The Company may also invest in other securities and instruments related to these
investments or that the Adviser believes are consistent with the Company’s investment objectives, including senior debt
tranches of CLOs and loan accumulation facilities. From time to time, in connection with the acquisition of CLO equity,

Eagle Point Credit Company Inc. & Subsidiaries
Notes to Consolidated Financial Statements
June 30, 2017
(Unaudited)
16
the Company may receive fee rebates from the CLO issuer. The majority of the Company’s interests in fee rebates are
held in the name of Eagle Point Credit Company Sub LLC.
2. SUMMARY OF SIGNIFICANT ACCOUNTING POLICIES
Basis of Accounting
The consolidated financial statements include the accounts of the Company and its wholly-owned subsidiaries. All
intercompany accounts have been eliminated upon consolidation. The Company is considered an investment company
under accounting principles generally accepted in the United States of America (“U.S. GAAP”). The Company follows
the accounting and reporting guidance applicable to investment companies in the Financial Accounting Standards Board
(“FASB”) Accounting Standards Codification (“ASC”) Topic 946 Financial Services – Investment Companies. Items
included in the consolidated financial statements are measured and presented in United States dollars.
Use of Estimates
The preparation of the consolidated financial statements in conformity with U.S. GAAP requires management to make
estimates and assumptions which affect the reported amounts included in the consolidated financial statements and
accompanying notes as of the reporting date. Actual results may differ from those estimated.
Valuation of Investments
The most significant estimate inherent in the preparation of the consolidated financial statements is the valuation of
investments. In the absence of readily determinable fair values, fair value of the Company’s investments is determined
in accordance with the Company’s valuation policy. Due to the uncertainty of valuation, this estimate may differ
significantly from the value that would have been used had a ready market for the investments existed, and the
differences could be material.
There is no single method for determining fair value in good faith. As a result, determining fair value requires judgment
be applied to the specific facts and circumstances of each portfolio investment while employing a consistently applied
valuation process for the types of investments held by the Company.
The Company accounts for its investments in accordance with U.S. GAAP, and fair values its investment portfolio in
accordance with the provisions of the FASB ASC Topic 820 Fair Value Measurements and Disclosures, which defines
fair value, establishes a framework for measuring fair value and requires enhanced disclosures about fair value
measurements. Investments are reflected in the consolidated financial statements at fair value. Fair value is the estimated
amount that would be received to sell an asset, or paid to transfer a liability, in an orderly transaction between market
participants at the measurement date (i.e., the exit price). The Company’s fair valuation process is reviewed and
approved by the Board.
The fair value hierarchy prioritizes and ranks the level of market price observability used in measuring investments at
fair value. Market price observability is impacted by a number of factors, including the type of investment, the
characteristics specific to the investment and the state of the marketplace (including the existence and transparency of
transactions between market participants). Investments with readily available actively quoted prices, or for which fair
value can be measured from actively quoted prices in an orderly market, will generally have a higher degree of market
price observability and a lesser degree of judgment used in measuring fair value.
Investments measured and reported at fair value are classified and disclosed in one of the following categories based
on inputs:
Level I – Observable, quoted prices for identical investments in active markets as of the reporting date.
Level II – Quoted prices for similar investments in active markets or quoted prices for identical investments in
markets that are not active as of the reporting date.

Eagle Point Credit Company Inc. & Subsidiaries
Notes to Consolidated Financial Statements
June 30, 2017
(Unaudited)
17
Level III – Pricing inputs are unobservable for the investment and little, if any, active market exists as of the
reporting date. Fair value inputs require significant judgment or estimation from the Adviser.
In certain cases, inputs used to measure fair value may fall into different levels of the fair value hierarchy. In such cases,
the determination of which category within the fair value hierarchy is appropriate for any given investment is based on
the lowest level of input significant to that fair value measurement. The assessment of the significance of a particular
input to the fair value measurement in its entirety requires judgment and consideration of factors specific to the
investment.
Investments for which observable, quoted prices in active markets do not exist are reported at fair value based on Level
III inputs. The amount determined to be fair value may incorporate the Adviser’s own assumptions (including
assumptions the Adviser believes market participants would use in valuing investments and assumptions relating to
appropriate risk adjustments for nonperformance and lack of marketability), as provided for in the Company’s valuation
policy and accepted by the Board.
An estimate of fair value is made for each investment at least monthly taking into account information available as of
the reporting date. For financial reporting purposes, valuations are accepted by the Board on a quarterly basis.
See Note 3 “Investments” for further discussion relating to the Company’s investments.
In valuing the Company’s investments in CLO debt, CLO equity and loan accumulation facilities, the Adviser considers
a variety of relevant factors as set forth in the Company’s valuation policy, including non-binding indicative mid-point
prices provided by an independent pricing service, recent trading prices for specific investments, recent purchases and
sales known to the Adviser in similar securities and output from a third-party financial model.
The third-party financial model contains detailed information on the characteristics of CLOs, including recent
information about assets and liabilities, and is used to project future cash flows. Key inputs to the model, including
assumptions for future loan default rates, recovery rates, prepayment rates, reinvestment rates and discount rates are
determined by considering both observable and third-party market data and prevailing general market assumptions and
conventions as well as those of the Adviser.
The Company engages a nationally recognized valuation firm as an input to the Company’s evaluation of the fair value
of its investments in CLO equity. The valuation firm’s advice is only one factor considered by the Company in its
evaluation of the fair value of such investments and is not determinative of the Company’s assessment of such fair
value.
Investment Income Recognition
Interest income from investments in CLO debt is recorded using the accrual basis of accounting to the extent such
amounts are expected to be collected. Amortization of premium or accretion of discount is recognized using the
effective interest method.
CLO equity investments and fee rebates recognize investment income for GAAP purposes on the accrual basis utilizing
an effective interest methodology based upon an effective yield to maturity utilizing projected cash flows. ASC Topic
325-40, Beneficial Interests in Securitized Financial Assets, requires investment income from CLO equity investments
and fee rebates to be recognized under the effective interest method, with any difference between the cash distribution
and the amount calculated pursuant to the effective interest method being recorded as an adjustment to the cost basis of
the investment.
Effective yields for the Company’s CLO equity positions are updated at least once a year, either on the anniversary of
the formation of a CLO investment that the Company holds in its portfolio or on a transaction such as a partial sale,
add-on purchase, refinancing or reset.
Interest income from loan accumulation facilities is characterized and recorded based on information provided by the
trustees of each loan accumulation facility.

Eagle Point Credit Company Inc. & Subsidiaries
Notes to Consolidated Financial Statements
June 30, 2017
(Unaudited)
18
Other Income
Other income may include the Company’s share of income under the terms of class M notes and fee rebate agreements.
Interest Expense
Interest expense includes the Company’s distributions associated with its 7.75% Series A Term Preferred Stock due
2022 (the “Series A Term Preferred Stock”) and its 7.75% Series B Term Preferred Stock due 2026 (the “Series B Term
Preferred Stock,” and collectively with the Series A Term Preferred Stock, the “Preferred Stock”), and interest, paid
and accrued, associated with its 7.00% Unsecured Notes due 2020 (the “Series 2020 Notes”).
For the six months ended June 30, 2017, the Company was charged a total of $3,630,241 in interest expense on the
Preferred Stock, of which, $0 was payable as of June 30, 2017. For the six months ended June 30, 2017, the Company
was charged a total of $2,285,601 in interest expense on the Series 2020 Notes, of which $0 was payable as of June 30,
2017.
Interest expense also includes the Company’s amortization of deferred debt issuance costs associated with its Preferred
Stock and its Series 2020 Notes, as well as amortization of original issue discount associated with its Series B Term
Preferred Stock and its Series 2020 Notes.
See Note 6 “Mandatorily Redeemable Preferred Stock” and Note 7 “Unsecured Notes” for further discussion relating
to the Preferred Stock issuances and the Series 2020 Notes issuance, respectively.
Deferred Debt Issuance Costs
Deferred debt issuance costs consist of fees and expenses incurred in connection with the issuances of the Preferred
Stock and Series 2020 Notes, as well as unamortized original issue discount associated with the Series B Term Preferred
Stock and the Series 2020 Notes. Deferred debt issuance costs were capitalized at the time of issuance and are being
amortized using the effective interest method over the respective terms of the Preferred Stock and Series 2020 Notes.
Amortization of deferred debt issuance costs are reflected in the interest expense on mandatorily redeemable preferred
stock and interest expense on unsecured notes balances in the Consolidated Statement of Operations. In the event of an
early termination of the Company’s Preferred Stock or its Series 2020 Notes, the remaining balance of unamortized
deferred debt issuance costs associated with such debt will be accelerated into interest expense.
Securities Transactions
The Company records the purchases and sales of securities on trade date. Realized gains and losses on investments sold
are recorded on the basis of the specific identification method.
Cash and Cash Equivalents
The Company has defined cash and cash equivalents as cash and short-term, highly liquid investments with original
maturities of three months or less from the date of purchase. The Company maintains its cash in bank accounts, which,
at times, may exceed federal insured limits. The Adviser monitors the performance of the financial institution where
the accounts are held in order to manage any risk associated with such accounts. No cash equivalent balances were held
as of June 30, 2017.
Expense Recognition
Expenses are recorded on the accrual basis of accounting.
Prepaid Expenses
Prepaid expenses consist primarily of insurance premiums and shelf registration expenses. Insurance premiums are
amortized over the term of the current policy. Shelf registration expenses represent fees and expenses incurred in
connection with maintaining the Company’s shelf registration that have not been allocated to the Preferred Stock, the
Series 2020 Notes and follow-on common stock offering costs.
Federal and Other Taxes
The Company intends to continue to operate so as to qualify to be taxed as a RIC under subchapter M of the Code and,
as such, to not be subject to federal income tax on the portion of its taxable income and gains distributed to stockholders.

Eagle Point Credit Company Inc. & Subsidiaries
Notes to Consolidated Financial Statements
June 30, 2017
(Unaudited)
19
To qualify for RIC tax treatment, among other requirements, the Company is required to distribute at least 90% of its
investment company taxable income, as defined by the Code.
Because U.S. federal income tax regulations differ from U.S. GAAP, distributions in accordance with tax regulations
may differ from net investment income and realized gains recognized for financial reporting purposes. Differences may
be permanent or temporary. Permanent differences are reclassified among capital accounts in the consolidated financial
statements to reflect their tax character. Temporary differences arise when certain items of income, expense, gain or
loss are recognized at some time in the future. Differences in classification may also result from the treatment of short-
term gains as ordinary income for federal income tax purposes. The tax basis components of distributable earnings
differ from the amounts reflected in the Consolidated Statement of Assets and Liabilities due to temporary book/tax
differences arising primarily from partnerships and passive foreign investment company investments. These amounts
will be finalized before filing the Company’s federal income tax return.
As of June 30, 2017, the federal income tax cost and net unrealized depreciation on securities were as follows:
Eagle Point Credit Company Sub LLC, a wholly-owned subsidiary of the Company, has elected to be treated as a
corporation for federal income tax purposes. For the six months ended June 30, 2017, the Company incurred $90,427
in Delaware franchise tax expense. Additionally, Eagle Point Credit Company Sub LLC incurred $285,000 in federal
income tax expense and $32,500 in state income tax expense.
Distributions
Distributions paid to common stockholders from net investment income and capital gains are determined in accordance
with U.S. federal income tax regulations, which differ from U.S. GAAP. Distributions to common stockholders from
net investment income, if any, are expected to be paid monthly. Distributions paid to common stockholders are recorded
as a liability on record date and are automatically reinvested in full shares of the Company as of the payment date, in
accordance with the Company’s dividend reinvestment plan (the “DRIP”). The Company’s common stockholders who
opt-out of participation in the DRIP (including those common stockholders whose shares are held through a broker who
has opted out of participation in the DRIP) will receive all distributions in cash.
In addition to the regular monthly distributions, and subject to available taxable earnings of the Company, the Company
may make periodic special distributions. A special distribution represents the excess of the Company’s net taxable
income over the Company’s aggregate monthly distributions paid during the year.
On June 1, 2017, the Company declared four separate distributions of $0.20 per share on its common stock, payable on
each of June 30, 2017, July 31, 2017, August 31, 2017 and September 29, 2017 to stockholders of record as of June 12,
2017, July 13, 2017, August 11, 2017 and September 12, 2017, respectively. For the six months ended June 30, 2017,
the Company declared and paid distributions on common stock of $1.00 per share, or $17,114,348.
For the six months ended June 30, 2017, the Company declared and paid dividends on the Series A Term Preferred
Stock of $1,761,195.
For the six months ended June 30, 2017, the Company declared and paid dividends on the Series B Term Preferred
Stock of $1,782,507.
The characterization of distributions paid to stockholders reflect estimates made by the Company for U.S. GAAP
purposes. Such estimates are subject to be characterized differently for federal income tax purposes at year-end.
Cost for federal income tax purposes 565,732,748$
Gross unrealized appreciation 3,253,595
Gross unrealized depreciation (122,828,056)
Net unrealized depreciation (119,574,461)$

Eagle Point Credit Company Inc. & Subsidiaries
Notes to Consolidated Financial Statements
June 30, 2017
(Unaudited)
20
3. INVESTMENTS
Fair Value Measurement
The following tables summarize the valuation of the Company’s investments measured and reported at fair value under
the fair value hierarchy levels described in Note 2 “Summary of Significant Accounting Policies” as of June 30, 2017:
There were no transfers of investments between these levels during the six months ended June 30, 2017.
The changes in investments classified as Level III are as follows for the six months ended June 30, 2017:
The net realized gains (losses) recorded for Level III investments are reported in the net realized gain (loss) on
investments balance in the Consolidated Statement of Operations. Net changes in unrealized appreciation (depreciation)
are reported in the net change in unrealized appreciation (depreciation) on investments balance in the Consolidated
Statement of Operations.
The change in unrealized depreciation on investments still held as of June 30, 2017 was $(8,974,401).
Valuation of CLO Subordinated and Income Notes
The Adviser gathers price indications from dealers, if available, as part of its valuation process as an input to estimate
fair value of each CLO subordinated and income note investment. Dealer price indications are not firm bids and may
not be representative of the actual value where trades can be consummated. In addition, the Adviser utilizes a third-
party financial model as an input to estimate the fair value of CLO subordinated and income note investments. The
model contains detailed information on the characteristics of each CLO, including recent information about assets and
liabilities from data sources such as trustee reports, and is used to project future cash flows to the CLO note tranches,
as well as management fees.
Fair Value Measurement
Level I Level II Level III Total
CLO Debt -$ -$ 12,844,362$ 12,844,362$
CLO Equity - - 410,241,153 410,241,153
Loan Accumulation Facilities - - 23,549,003 23,549,003
Total Investments at Fair Value -$ -$ 446,634,518$ 446,634,518$
Change in Investments Classified as Level III
Loan
Accumulation
CLO Debt CLO Equity Facilities Total
Beginning Balance at January 1, 2017 7,192,748$ 385,595,367$ 17,950,176$ 410,738,291$
Purchases of investments 24,831,707 69,115,148 (1) 31,228,950 125,175,805
Proceeds from sales or maturity of investments (20,306,447) (42,710,257) (25,693,131) (1) (88,709,835)
Net (amortization) accretion of premiums or
discounts on CLO debt securities 20,406 - - 20,406
Net realized gains (losses) and net change
in unrealized appreciation (depreciation) 1,105,948 (1,759,105) 63,008 (590,149)
Balance as of June 30, 2017 12,844,362$ 410,241,153$ 23,549,003$ 446,634,518$
Change in unrealized appreciation (depreciation) on
investments still held as of June 30, 2017 284,787$ (9,304,241)$ 45,053$ (8,974,401)$
(1) Reflects $21,891,998 of proceeds from sales or maturity of investments in loan accumulation facilities transferred to purchases of investments in CLO Equity.

Eagle Point Credit Company Inc. & Subsidiaries
Notes to Consolidated Financial Statements
June 30, 2017
(Unaudited)
21
The following table summarizes the quantitative inputs and assumptions used for investments categorized in Level III
of the fair value hierarchy as of June 30, 2017. In addition to the techniques and inputs noted in the table below,
according to the Company’s valuation policy, the Adviser may use other valuation techniques and methodologies when
determining the Company’s fair value measurements as provided for in the valuation policy and approved by the Board.
The table below is not intended to be all-inclusive, but rather provides information on the significant Level III inputs
as they relate to the Company’s fair value measurements, as of June 30, 2017.
Increases (decreases) in the constant default rate, reinvestment price and discount rate in isolation would result in a
lower (higher) fair value measurement. Increases (decreases) in the reinvestment spread, reinvestment floor and
recovery rate in isolation would result in a higher (lower) fair value measurement. Changes in the constant prepayment
rate may result in a higher (lower) fair value, depending on the circumstances. Generally, a change in the assumption
used for the constant default rate may be accompanied by a directionally opposite change in the assumption used for
the constant prepayment rate and recovery rate.
The Adviser categorizes CLO subordinated and income notes as Level III investments. Certain pricing inputs may be
unobservable. An active market may exist, but not necessarily for investments the Company holds as of the reporting
date. Additionally, unadjusted dealer quotes, when obtained for valuation purposes, are indicative.
Valuation of CLO Debt
The Company’s CLO debt has been valued using non-binding indicative mid-point prices provided by an independent
pricing service. As a result, there were no unobservable inputs that have been internally developed by the Company in
determining the fair values of these investments as of June 30, 2017.
The Adviser categorizes CLO debt as Level III investments. An active market may exist, but not necessarily for
investments the Company holds as of the reporting date. Additionally, unadjusted dealer quotes, when obtained for
valuation purposes, are indicative.
Valuation of Loan Accumulation Facilities
Loan accumulation facilities are typically short- to medium-term in nature and are entered into in contemplation of a
specific CLO investment. Unless the loan accumulation facility documents contemplate transferring the underlying
loans at a price other than original cost plus accrued interest or the Adviser determines the originally contemplated CLO
is unlikely to be consummated, the fair value of the loan accumulation facility is based on the cost of the underlying
loans plus accrued interest and realized gains (losses) reported by the trustee. In all other situations, the fair value of the
loan accumulation facility is based on the market value of the underlying loans plus accrued interest and realized gains
(losses) reported by the trustee.
The Adviser categorizes loan accumulation facilities as Level III investments. There is no active market and prices are
unobservable.
Assets
Fair Value as of
June 30, 2017
Valuation
Techniques/Methodologies Unobservable Inputs Range / Weighted Average
CLO Equity 410,241,153$ Discounted Cash Flows Constant Default Rate 0.00% - 2.00%
Constant Prepayment Rate 25.00%
Reinvestment Spread 3.10% - 3.95% / 3.59%
Reinvestment Price 99.50%
Reinvestment Floor (1)
1.00%
Recovery Rate 69.15% - 70.00% / 69.76%
Discount Rate to Maturity 2.60% - 21.47% / 14.08%
(1) Assumed 1% reinvestment floor for 2 years after purchase of asset and 0% thereafter
Q uantitative Information about Level III Fair Value Measurements

Eagle Point Credit Company Inc. & Subsidiaries
Notes to Consolidated Financial Statements
June 30, 2017
(Unaudited)
22
Investment Risk Factors and Concentration of Investments
Market Risk
Certain events particular to each market in which the Company’s investments conduct operations, as well as general
economic and political conditions, may have a significant negative impact on the operations and profitability of the
Company’s investments and/or on the fair value of the Company’s investments. Such events are beyond the Company’s
control, and the likelihood they may occur and the potential effect on the Company cannot be predicted.
Concentration Risk
The Company is classified as “non-diversified” under the 1940 Act. As a result, the Company can invest a greater
portion of its assets in obligations of a single issuer than a “diversified” fund. The Company may therefore be more
susceptible than a diversified fund to being adversely affected by any single corporate, economic, political or regulatory
occurrence. In particular, because the Company’s portfolio of investments may lack diversification among CLO
securities and related investments, the Company is susceptible to a risk of significant loss if one or more of these CLO
securities and related investments experience a high level of defaults on the collateral they hold.
Liquidity Risk
The securities issued by CLOs generally offer less liquidity than below investment grade or high-yield corporate debt,
and are subject to certain transfer restrictions imposed on certain financial and other eligibility requirements on
prospective transferees. Other investments the Company may purchase through privately negotiated transactions may
also be illiquid or subject to legal restrictions on their transfer. As a result of this illiquidity, the Company’s ability to
sell certain investments quickly, or at all, in response to changes in economic and other conditions and to receive a fair
price when selling such investments may be limited, which could prevent the Company from making sales to mitigate
losses on such investments. In addition, CLOs are subject to the possibility of liquidation upon an event of default,
which could result in full loss of value to the CLO equity and junior debt investors. CLO equity tranches are the most
likely tranche to suffer a loss of all of their value in these circumstances.
Risks of Investing in CLOs
The Company’s investments consist in part of CLO securities and the Company may invest in other related structured
finance securities. CLOs and structured finance securities are generally backed by an asset or a pool of assets (typically
senior secured loans and other credit-related assets in the case of a CLO) which serve as collateral. The Company and
other investors in CLO and structured finance securities ultimately bear the credit risk of the underlying collateral. If
there are defaults or the relevant collateral otherwise underperforms, scheduled payments to senior tranches of such
securities take precedence over those of mezzanine tranches, and scheduled payments to mezzanine tranches take
precedence over those to subordinated/equity tranches. Therefore, CLO and other structured finance securities may
present risks similar to those of the other types of debt obligations and, in fact, such risks may be of greater significance
in the case of CLO and other structured finance securities. In addition to the general risks associated with investing in
debt securities, CLO securities carry additional risks, including, but not limited to: (1) the possibility that distributions
from collateral assets will not be adequate to make interest or other payments; (2) the quality of the collateral may
decline in value or default; (3) the fact that investments in CLO equity and junior debt tranches will likely be subordinate
to other senior classes of CLO debt; and (4) the complex structure of the security may not be fully understood at the
time of investment and may produce disputes with the issuer or unexpected investment results. Additionally, changes
in the collateral held by a CLO may cause payments on the instruments the Company holds to be reduced, either
temporarily or permanently. Structured investments, particularly the subordinated interests in which the Company
invests, are less liquid than many other types of securities and may be more volatile than the assets underlying the CLOs
the Company may target. In addition, CLO and other structured finance securities may be subject to prepayment risk.
Risks of Investing in Loan Accumulation Facilities
The Company invests in loan accumulation facilities, which are short- to medium-term facilities often provided by the
bank that will serve as placement agent or arranger on a CLO transaction and which acquire loans on an interim basis
which are expected to form part of the portfolio of a future CLO. Investments in loan accumulation facilities have risks
similar to those applicable to investments in CLOs. In addition, there typically will be no assurance future CLOs will
be consummated or that loans held in such a facility are eligible for purchase by the CLO. Furthermore, the Company
likely will have no consent rights in respect of the loans to be acquired in such a facility and in the event the Company

Eagle Point Credit Company Inc. & Subsidiaries
Notes to Consolidated Financial Statements
June 30, 2017
(Unaudited)
23
does have any consent rights, they will be limited. In the event a planned CLO is not consummated, or the loans are not
eligible for purchase by the CLO, the Company may be responsible for either holding or disposing of the loans. This
could expose the Company primarily to credit and/or mark-to-market losses, and other risks. Leverage is typically
utilized in such a facility and as such the potential risk of loss will be increased for such facilities employing leverage.
Interest Rate Risk
The fair value of certain investments held by the Company may be significantly affected by changes in interest rates.
Although senior secured loans are generally floating rate instruments, the Company’s investments in senior secured
loans through CLOs are sensitive to interest rate levels and volatility. Although CLOs are generally structured to
mitigate the risk of interest rate mismatch, there may be some difference between the timing of interest rate resets on
the assets and liabilities of a CLO. Such a mismatch could have a negative effect on the amount of funds distributed to
CLO equity investors. In addition, CLOs may not be able to enter into hedge agreements, even if it may otherwise be
in the best interests of the CLO to hedge such interest rate risk. Furthermore, in the event of a significant rising interest
rate environment and/or economic downturn, loan defaults may increase and result in credit losses which may adversely
affect the Company’s cash flow, fair value of its assets and operating results. In the event the Company’s interest
expense was to increase relative to income, or sufficient financing became unavailable, return on investments and cash
available for distribution would be reduced. In addition, future investments in different types of instruments may carry
a greater exposure to interest rate risk.
LIBOR Floor Risk
Because CLOs generally issue debt on a floating rate basis, an increase in LIBOR will increase the financing costs of
CLOs. Many of the senior secured loans held by these CLOs have LIBOR floors such that, when LIBOR is below the
stated LIBOR floor, the stated LIBOR floor (rather than LIBOR itself) is used to determine the interest payable under
the loans. Therefore, if LIBOR increases but stays below the average LIBOR floor rate of the senior secured loans held
by a CLO, there would not be a corresponding increase in the investment income of such CLOs. The combination of
increased financing costs without a corresponding increase in investment income in such a scenario would result in
smaller distributions to equity holders of a CLO. As of the date of the consolidated financial statements, due to recent
increases in interest rates, LIBOR has increased above the LIBOR floor set for many senior secured loans and, as such,
as of the date of the consolidated financial statements, LIBOR is near or above the weighted average floor of the senior
secured loans held by the CLOs in which the Company invests.
LIBOR Risk
The CLOs in which the Company invests typically obtain financing at a floating rate based on LIBOR. Regulators and
law-enforcement agencies from a number of governments, including entities in the United States, Japan, Canada and
the United Kingdom, have conducted or are conducting civil and criminal investigations into potential manipulation of
LIBOR. Several financial institutions have reached settlements with the Commodity Futures Trading Commission, the
U.S. Department of Justice Fraud Section and the United Kingdom Financial Services Authority in connection with
investigations by such authorities into submissions made by such financial institutions to the bodies whom set LIBOR
and other interbank offered rates. Additional investigations remain ongoing with respect to other major banks. There
can be no assurance there will not be additional admissions or findings of rate-setting manipulation or manipulations
of LIBOR or other similar interbank offered rates will not be shown to have occurred. ICE Benchmark Administration
Limited (formerly NYSE Euronext Rate Administration Limited) assumed administration of LIBOR on February 1,
2014. Any new administrator of LIBOR may make methodological changes to the way in which LIBOR is calculated
or may alter, discontinue or suspend calculation or dissemination of LIBOR. Any such actions or other effects from the
ongoing investigations could adversely affect the liquidity and value of the Company’s investments. Further, additional
admissions or findings of manipulation may decrease the confidence of the market in LIBOR and lead market
participants to look for alternative, non-LIBOR based types of financing, such as fixed rate loans or bonds or floating
rate loans based on non-LIBOR indices. An increase in alternative types of financing at the expense of LIBOR-based
CLOs may impair the liquidity of the Company’s investments. Additionally, it may make it more difficult for CLO
issuers to satisfy certain conditions set forth in a CLO’s offering documents.
Low Interest Rate Environment
As of the date of the consolidated financial statements, despite recent increases in interest rates from near historically
low levels, interest rates in the United States remain relatively low, which may increase the Company’s exposure to

Eagle Point Credit Company Inc. & Subsidiaries
Notes to Consolidated Financial Statements
June 30, 2017
(Unaudited)
24
risks associated with rising interest rates.
Leverage Risk
The Company has incurred leverage through the issuances of the Preferred Stock and the Series 2020 Notes, and the
Company may incur additional leverage, directly or indirectly, through one or more special purpose vehicles, including
indebtedness for borrowed money and leverage in the form of derivative transactions, additional shares of preferred
stock and other structures and instruments, in significant amounts and on terms the Adviser and the Board deem
appropriate, subject to applicable limitations under the 1940 Act. Any such leverage does not include embedded or
inherent leverage in CLO structures in which the Company invests or in derivative instruments in which the Company
may invest. Accordingly, there may be a layering of leverage in overall structure. The more leverage is employed, the
more likely a substantial change will occur in the Company’s net asset value (“NAV”). Accordingly, any event
adversely affecting the value of an investment would be magnified to the extent leverage is utilized.
Highly Subordinated and Leveraged Securities Risk The Company’s portfolio includes equity and junior debt investments in CLOs, which involve a number of significant
risks. CLO equity and junior debt securities are typically very highly leveraged (with CLO equity securities typically
being leveraged nine to thirteen times), and therefore the junior debt and equity tranches in which the Company is
currently invested are subject to a higher degree of risk of total loss. In particular, investors in CLO securities indirectly
bear risks of the collateral held by such CLOs. The Company will generally have the right to receive payments only
from the CLOs, and will generally not have direct rights against the underlying borrowers or the entity that sponsored
the CLO. While the CLOs the Company intends to initially target generally enable the investor to acquire interests in a
pool of senior secured loans without the expenses associated with directly holding the same investments, the Company
will generally pay a proportionate share of the CLOs’ administrative, management and other expenses. In addition, the
Company may have the option in certain CLOs to contribute additional amounts to the CLO issuer for purposes of
acquiring additional assets or curing coverage tests, thereby increasing overall exposure and capital at risk to such CLO.
Credit Risk
If a CLO in which the Company invests, an underlying asset of any such CLO or any other type of credit investment in
the Company’s portfolio declines in price or fails to pay interest or principal when due because the issuer or debtor, as
the case may be, experiences a decline in its financial status either or both the Company’s income and NAV may be
adversely impacted. Non-payment would result in a reduction of the Company’s income, a reduction in the value of the
applicable CLO security or other credit investment experiencing non-payment and, potentially, a decrease in the
Company’s NAV. With respect to investments in CLO securities and credit investments that are secured, there can be
no assurance that any liquidation of collateral would satisfy the issuer’s obligation in the event of non-payment for
scheduled dividends, interest or principal. Also, there can be no assurance that any such collateral could be readily
liquidated. In the event of bankruptcy of an issuer, the Company could experience delays or limitations with respect to
its ability to realize the benefits of any collateral securing a CLO security or credit investment. To the extent the credit
rating assigned to a security in the Company’s portfolio is downgraded, the market price and liquidity of such security
may be adversely affected. In addition, if a CLO triggers an event of default as a result of failing to make payments
when due or for other reasons, the CLO would be subject to the possibility of liquidation, which could result in full loss
of value to the CLO equity and junior debt investors. CLO equity tranches are the most likely tranche to suffer a loss
of all of their value in these circumstances.
4. RELATED PARTY TRANSACTIONS
Investment Adviser
On June 6, 2014, the Company entered into an investment advisory agreement (the “Advisory Agreement”) with the
Adviser. Pursuant to the terms of the Advisory Agreement, the Company pays the Adviser a management fee and an
incentive fee for its services.
The management fee is calculated and payable quarterly, in arrears, at an annual rate equal to 1.75% of the Company’s
“total equity base.” “Total equity base” means the net asset value attributable to the common stock and the paid-in, or
stated, capital of the Preferred Stock. The management fee for any partial quarter is pro-rated (based on the number of
days actually elapsed at the end of such partial quarter relative to the total number of days in such calendar quarter).

Eagle Point Credit Company Inc. & Subsidiaries
Notes to Consolidated Financial Statements
June 30, 2017
(Unaudited)
25
The Company was charged management fees of $3,416,365 for the six months ended June 30, 2017, of which
$1,765,236 was payable as of June 30, 2017.
The incentive fee is calculated and payable quarterly, in arrears, based on the pre-incentive fee net investment income
(the “PNII”) of the Company for the immediately preceding calendar quarter. For this purpose, PNII means interest
income, dividend income and any other income (including any other fees, such as commitment, origination, structuring,
diligence and consulting fees or other fees the Company receives from an investment) accrued during the calendar
quarter, minus the Company’s operating expenses for the quarter (including the base management fee, expenses payable
under the Administration Agreement (as defined below) and any interest expense and distributions paid on any issued
and outstanding preferred stock or issued and outstanding unsecured notes payable, but excluding the incentive fee).
PNII includes accrued income the Company has not yet received in cash, including investments with a deferred interest
feature (such as original issue discount, debt instruments with payment in-kind interest and zero coupon securities).
PNII does not include any realized or unrealized capital gains or realized or unrealized capital losses.
PNII, expressed as a rate of return on the value of the Company’s NAV at the end of the immediately preceding calendar
quarter, is compared to a hurdle rate of 2.00% per quarter. The Company pays the Adviser an incentive fee with respect
to the Company’s PNII in each calendar quarter as follows: (1) no incentive fee in any calendar quarter in which the
Company’s PNII does not exceed the hurdle rate of 2.00%; (2) 100% of the Company’s PNII with respect to that portion
of such PNII, if any, exceeding the hurdle rate but equal to or less than 2.50% in any calendar quarter; and (3) 20% of
the amount of the Company’s PNII, if any, exceeding 2.50% in any calendar quarter. The Company incurred incentive
fees of $4,226,989 for the six months ended June 30, 2017, of which $2,246,352 was payable as of June 30, 2017.
Administrator
Effective June 6, 2014, the Company entered into an administration agreement (the “Administration Agreement”) with
the Administrator, a wholly-owned subsidiary of the Adviser. Pursuant to the Administration Agreement, the
Administrator performs, or arranges for the performance of, the Company’s required administrative services, which
include being responsible for the financial records which the Company is required to maintain and preparing reports
which are disseminated to the Company’s stockholders. In addition, the Administrator provides the Company with
accounting services, assists the Company in determining and publishing its net asset value, oversees the preparation
and filing of the Company’s tax returns, monitors the Company’s compliance with tax laws and regulations, and
prepares and assists the Company with any audits by an independent public accounting firm of the consolidated
financial statements. The Administrator is also responsible for printing and disseminating reports to the Company’s
stockholders and maintaining the Company’s website, providing support to investor relations; generally overseeing the
payment of the Company’s expenses and the performance of administrative and professional services rendered to the
Company by others, and providing such other administrative services as the Company may from time to time designate.
Payments under the Administration Agreement are equal to an amount based upon the Company’s allocable portion of
the Administrator’s overhead in performing its obligations under the Administration Agreement, including rent, the
fees and expenses associated with performing compliance functions and the Company’s allocable portion of the
compensation of the Company’s chief financial officer, chief compliance officer and the Company’s allocable portion
of the compensation of any related support staff. To the extent the Administrator outsources any of its functions, the
Company pays the fees on a direct basis, without profit to the Administrator. Certain accounting and other
administrative services have been delegated by the Administrator to SS&C Technologies, Inc. (“SS&C”). The
Administration Agreement may be terminated by the Company without penalty upon not less than sixty days’ written
notice to the Administrator and by the Administrator upon not less than ninety days’ written notice to the Company.
The Administration Agreement is approved by the Board, including by a majority of the Company’s independent
directors, on an annual basis.
For the six months ended June 30, 2017, the Company was charged a total of $523,179 in administration fees consisting
of $431,877 and $91,302, relating to services provided by the Administrator and SS&C, respectively, which are
included in the Consolidated Statement of Operations and, of which $196,207 was payable as of June 30, 2017.

Eagle Point Credit Company Inc. & Subsidiaries
Notes to Consolidated Financial Statements
June 30, 2017
(Unaudited)
26
Affiliated Ownership
Certain directors, officers and other related parties, including members of the Company’s management, hold 49.0% of
the Company’s common stock and 1.1% of the Series A Term Preferred Stock. This represents 40.8% of the total
outstanding voting stock of the Company as of June 30, 2017. Additionally, certain officers of the Company hold 0.1%
of the Series 2020 Notes as of June 30, 2017.
Exemptive Relief
On March 17, 2015, the SEC issued an order granting the Company exemptive relief to co-invest in certain negotiated
investments with affiliated investment funds managed by the Adviser, subject to certain conditions.
5. COMMON STOCK
In 2014, the Company converted from a Delaware limited liability company into a Delaware corporation, at which time
the Sole Member of Eagle Point Credit Company LLC became a stockholder of Eagle Point Credit Company Inc. and
was issued an aggregate of 8,656,057 shares of common stock, par value $0.001 per share. Additionally, the Company
priced its IPO and sold an additional 5,155,301 shares of its common stock at a public offering price of $20 per share.
On May 18, 2016, the Company closed a follow-on, underwritten, public offering of 1,250,000 shares of its common
stock at $17.65 per share, resulting in net proceeds to the Company of $20.8 million after payment of underwriting
discounts, commissions and offering expenses.
On September 26, 2016, the Company closed the sale of 201,000 shares of its common stock in a direct placement to a
single institutional investor at a price of $17.45 per share, resulting in net proceeds to the Company of $3.4 million after
payment of offering expenses.
On December 13, 2016, the Company closed a follow-on, underwritten, public offering of 1,000,000 shares of its
common stock at $17.35 per share, resulting in net proceeds to the Company of $16.6 million after payment of
underwriting discounts, commissions and offering expenses. In addition, the underwriters partially exercised the
overallotment option granted to them in connection with the offering, and purchased an additional 146,553 shares of
the Company’s common stock, resulting in additional net proceeds to the Company of $2.5 million after payment of
underwriting discounts, commissions and offering expenses.
On April 25, 2017, the Company closed a follow-on, underwritten, public offering of 1,350,000 shares of its common
stock at $19.50 per share, resulting in net proceeds to the Company of approximately $24.9 million after payment of
underwriting discounts and commissions, structuring fees and offering expenses. In addition, the underwriters fully
exercised the overallotment option granted to them in connection with the offering, and purchased an additional 202,500
shares of the Company’s common stock, resulting in additional net proceeds to the Company of approximately $3.8
million after payment of underwriting discounts and commissions, and structuring fees.
Underwriting discounts and commissions, structuring fees and offering expenses associated with the Company’s
issuances of its common stock were borne by all common stockholders of the Company as a charge to stockholders’
equity.
On February 24, 2017, the Company announced its intention to begin paying distributions on its common stock on a
monthly basis, rather than a quarterly basis, on shares of its common stock of $0.20 per share.
For the six months ended June 30, 2017, 63,329 shares of common stock were issued in connection with the DRIP. For
the years ended December 31, 2016 and December 31, 2015, 57,216 and 8,752 shares of common stock were issued in
connection with the DRIP, respectively.
As of June 30, 2017, there were 100,000,000 shares of common stock authorized, of which 18,090,708 shares were
issued and outstanding.

Eagle Point Credit Company Inc. & Subsidiaries
Notes to Consolidated Financial Statements
June 30, 2017
(Unaudited)
27
6. MANDATORILY REDEEMABLE PREFERRED STOCK
In 2015, the Company closed an underwritten, public offering of 1,818,000 shares, of its Series A Term Preferred Stock,
at a public offering price of $25 per share, resulting in net proceeds to the Company of $43.3 million after payment of
underwriting discounts, commissions and offering expenses.
On October 11, 2016, the Company closed an underwritten, public offering of 1,200,000 shares of its Series B Term
Preferred Stock at a public offering price of $25 per share, resulting in net proceeds to the Company of $28.5 million,
after payment of underwriting discounts, commissions and offering expenses.
Subsequently, the underwriters fully exercised the overallotment option granted to them in connection with the offering
on October 11, 2016, and purchased an additional 180,000 shares of the Series B Term Preferred Stock, resulting in
additional net proceeds to the Company of $4.3 million, after payment of underwriting discounts and commissions.
On December 15, 2016, the Company closed a follow-on, underwritten, public offering of 400,000 shares of its Series
B Term Preferred Stock at a public offering price of $25 per share, resulting in net proceeds to the Company of
approximately $9.4 million, after payment of underwriting discounts, commissions and estimated offering expenses.
Subsequently, the underwriters fully exercised the overallotment option granted to them in connection with the offering,
and purchased an additional 60,000 shares of the Series B Term Preferred Stock, resulting in additional net proceeds to
the Company of approximately $1.4 million, after payment of underwriting discounts and commissions.
The Company is required to redeem all outstanding shares of the Series A Term Preferred Stock on June 30, 2022, at a
redemption price of $25 per share (the “Series A Liquidation Preference”), plus accumulated but unpaid dividends, if
any. At any time on or after June 29, 2018, the Company may, at its sole option, redeem the outstanding shares of the
Series A Term Preferred Stock, respectively, at a redemption price per share equal to the Series A Liquidation
Preference, plus accumulated but unpaid dividends, if any.
The Company is required to redeem all outstanding shares of the Series B Term Preferred Stock on October 30, 2026,
at a redemption price of $25 per share (the “Series B Liquidation Preference”), plus accumulated but unpaid dividends,
if any. At any time on or after October 29, 2021, the Company may, at its sole option, redeem the outstanding shares
of the Series B Term Preferred Stock, respectively, at a redemption price per share equal to the Series B Liquidation
Preference, plus accumulated but unpaid dividends, if any.
Except where otherwise stated in 1940 Act or the Company’s certification of incorporation, each holder of Preferred
Stock will be entitled to one vote for each share of preferred stock held on each matter submitted to a vote of the
Company’s stockholders. The Company’s preferred stockholders and common stockholders will vote together as a
single class on all matters submitted to the Company’s stockholders. Additionally, the Company’s preferred
stockholders will have the right to elect two Preferred Directors at all times, while the Company’s preferred stockholders
and common stockholders, voting together as a single class, will elect the remaining members of the Board.
As of June 30, 2017, there were 20,000,000 shares of preferred stock authorized, par value $0.001 per share, of which
1,818,000 shares of Series A Term Preferred Stock were issued and outstanding, and 1,840,000 shares of Series B Term
Preferred Stock were issued and outstanding.
See Note 8 “Asset Coverage” for further discussion on the Company’s calculation of asset coverage with respect to its
Preferred Stock.
7. UNSECURED NOTES
In 2015, the Company closed an underwritten, public offering of $25.0 million aggregate principal amount of its Series
2020 Notes, resulting in net proceeds to the Company of $23.8 million, after payment of underwriting discounts,
commissions and offering expenses.

Eagle Point Credit Company Inc. & Subsidiaries
Notes to Consolidated Financial Statements
June 30, 2017
(Unaudited)
28
On June 1, 2016, the Company closed a follow-on, underwritten, public offering of $25.0 million aggregate principal
amount of its Series 2020 Notes, resulting in net proceeds to the Company of approximately $24.0 million, after
payment of underwriting discounts, commissions and offering expenses.
On August 10, 2016, the Company closed another follow-on offering of $10.0 million in aggregate principal amount
of its Series 2020 Notes, resulting in net proceeds to the Company of $9.9 million, after payment of offering expenses.
The Series 2020 Notes were placed directly to certain investors, and issued under the same indenture and first
supplemental indenture dated as of December 4, 2015, under which the previous offerings were issued.
The Series 2020 Notes were issued in minimum denominations of $25 and integral multiples of $25 in excess thereof.
The Series 2020 Notes will mature on December 31, 2020 and 100% of the aggregate principal amount will be paid at
maturity. The Company may redeem the Series 2020 Notes in whole or in part at any time or from time to time at the
Company’s option, on or after December 31, 2017.
As of June 30, 2017, there were 2,399,950 unsecured Series 2020 Notes issued and outstanding.
See Note 8 “Asset Coverage” for further discussion on the Company’s calculation of asset coverage with respect to its
Series 2020 Notes.
8. ASSET COVERAGE
Under the provisions of the 1940 Act, the Company is permitted to issue senior securities, including debt securities and
preferred stock, and borrow from banks or other financial institutions, provided that the Company satisfies certain asset
coverage requirements.
With respect to senior securities that are stocks, such as the Preferred Stock, the Company is required to have asset
coverage of at least 200%, as measured at the time of the issuance of any such shares of preferred stock and calculated
as the ratio of the Company’s total consolidated assets, less all liabilities and indebtedness not represented by senior
securities, over the aggregate amount of the Company’s outstanding senior securities representing indebtedness plus
the aggregate liquidation preference of any outstanding shares of preferred stock.
With respect to senior securities representing indebtedness, such as the Series 2020 Notes or any bank borrowings
(other than temporary borrowings as defined under the 1940 Act), the Company is required to have asset coverage of
at least 300%, as measured at the time of borrowing and calculated as the ratio of the Company’s total consolidated
assets, less all liabilities and indebtedness not represented by senior securities, over the aggregate amount of the
Company’s outstanding senior securities representing indebtedness.
If the Company’s asset coverage declines below 300% (or 200%, as applicable), the Company would be prohibited
under the 1940 Act from incurring additional debt or issuing additional preferred stock and from making certain
distributions to its stockholders. In addition, the terms of the Preferred Stock and the Series 2020 Notes require the
Company to redeem shares of the Preferred Stock and/or a certain principal amount of the Series 2020 Notes, if such
failure to maintain the applicable asset coverage is not cured by a certain date.

Eagle Point Credit Company Inc. & Subsidiaries
Notes to Consolidated Financial Statements
June 30, 2017
(Unaudited)
29
The following table summarizes the Company’s asset coverage with respect to its Preferred Stock and Series 2020
Notes, as of June 30, 2017, and as of December 31, 2016:
Information about the Company’s senior securities shown in the following table has been derived from the Company’s
consolidated financial statements as of and for the dates noted. The Company had no senior securities outstanding as
of December 31, 2014.
Asset Coverage of Preferred Stock and Debt Securities
As of As of
June 30, 2017 December 31, 2016
Total assets 469,659,907$ 448,376,026$
Less liabilities and indebtedness not represented by senior securities (7,086,318) (15,071,707)
Net total assets and liabilities 462,573,589 433,304,319
Preferred Stock 91,450,000 91,450,000
Series 2020 Notes 59,998,750 59,998,750
151,448,750 151,448,750
Asset coverage of preferred stock (1)
305% 286%
Asset coverage of debt securities (2)
771% 722%
(1) The asset coverage of preferred stock, which includes the Preferred Stock, is calculated in accordance with section 18(h) of the 1940 Act, as
generally described above.
(2) The asset coverage ratio of debt securities, which includes the Series 2020 Notes, is calculated in accordance with section 18(h) of the 1940
Act, as generally described above.
Class
Total Amount
O utstanding Exclusive
of Treasury Securities
Asset Coverage
Per Unit (1)
Involuntary Liquidating
Preference Per Unit (2)
Average Market
Value Per Unit (3)
For the six months ended June 30, 2017
Preferred Stock $91,450,000 $76.36 $25 $25.86
Series 2020 Notes $59,998,750 $7,709.72 N/A $25.85
For the year ended December 31, 2016
Preferred Stock $91,450,000 $71.53 $25 $25.41
Series 2020 Notes $59,998,750 $7,221.89 N/A $25.29
For the year ended December 31, 2015
Preferred Stock $45,450,000 $91.16 $25 $25.43
Series 2020 Notes $25,000,000 $10,275.46 N/A $24.52
(1) The asset coverage per unit figure is the ratio of the Company's total consolidated assets, less all liabilities and indebtedness not represented by senior securities,
to the aggregate dollar amount of outstanding applicable senior securities, as calculated separately for each of the Preferred Stock and the Series 2020 Notes in
accordance with section 18(h) of the 1940 Act. With respect to the Preferred Stock, the asset coverage per unit figure is expressed in terms of dollar amounts per
share of outstanding preferred stock (based on a per share liquidation preference of $25). With respect to the Series 2020 Notes, the asset coverage per unit figure
is expressed in terms of dollar amounts per $1,000 principal amount of such notes.
(2) The involuntary liquidating preference per unit is the amount to which a share of Preferred Stock would be entitled in preference to any security junior to it upon
our involuntary liquidation.
(3) The average market value per unit is calculated by taking the average of the closing price of each of (a) a share of the Preferred Stock (NYSE: ECCA, ECCB) and
(b) $25 principal amount of the Series 2020 Notes (NYSE: ECCZ) for each day during the six months ended June 30, 2017 and for the years ended December
31, 2016 and December 31, 2015, for which the applicable security was listed on the NYSE.
Eagle Point Credit Company Inc. & Subsidiaries
Notes to Consolidated Financial Statements
June 30, 2017
(Unaudited)
30
9. COMMITMENTS AND CONTINGENCIES
The Company is not currently subject to any material legal proceedings. From time to time, the Company may be a
party to certain legal proceedings in the ordinary course of business, including proceedings relating to the enforcement
of the Company’s rights under contracts. While the outcome of these legal proceedings cannot be predicted with
certainty, the Company does not expect these proceedings will have a material effect upon its financial condition or
results of operations.
As of June 30, 2017, the Company had no unfunded commitments.
10. INDEMNIFICATIONS
Under the Company’s organizational documents, its officers and directors are indemnified against certain liabilities
arising out of the performance of their duties to the Company. In addition, during the normal course of business, the
Company enters into contracts containing a variety of representations which provide general indemnifications. The
Company’s maximum exposure under these agreements cannot be known; however, the Company expects any risk of
loss to be remote.
11. RECENT ACCOUNTING AND TAX PRONOUNCEMENTS
As of the date of these consolidated financial statements, there were no accounting standards applicable to the Company
that had been issued but not yet adopted by the Company.
In August 2016, FASB issued Accounting Standards Update No. 2016-15 (“ASU 2016-15”), “Statement of Cash Flows
(Topic 230), a consensus of the FASB’s Emerging Issues Task Force,” which is intended to reduce diversity in practice
in how certain transactions are classified in the statement of cash flows. The issues addressed in ASU 2016-15 are debt
prepayment or debt extinguished costs, settlement of zero-coupon debt instruments, contingent consideration payments
made after a business combination, proceeds from the settlement of insurance claims, proceeds from the settlement of
corporate-owned life insurance policies, including bank-owned life insurance policies, distributions received from
equity method investments, beneficial interests in securitization transactions; and, separately identifiable cash flows
and application of the predominance principle. ASU 2016-15 is effective for interim and annual reporting periods
beginning after December 15, 2017. The Company is currently evaluating the impact, if any, of applying this provision.
On September 27, 2016, the U.S. Internal Revenue Service issued proposed regulations that, if finalized, may result in
the Company being subject to federal income tax on a portion of any excess distribution or gain from the disposition of
shares held in passive foreign investment companies (“PFICs”), even if the Company distributes such income as a
taxable dividend to its stockholders. These regulations will generally require the Company to recognize its share of the
PFIC’s income for each year, regardless of whether the Company receives any distributions from such PFIC, and
subsequently distribute such income to the Company’s stockholders, in order to maintain its status as a RIC.
Furthermore, certain income derived by the Company from a PFIC with respect to which the Company has made a
qualifying electing fund (“QEF”) election, would generally constitute as qualifying income for purposes of determining
the Company’s ability to be subject to tax as a RIC, only to the extent that the PFIC makes distributions of that income
to the Company.
Additionally, if the Company holds more than 10% of the interest treated as equity for U.S. federal income tax purposes
in a foreign corporation that is treated as a controlled foreign corporation (“CFC”) (including equity tranche investments
and certain debt tranche investments in a CLO treated as a CFC), the Company may be treated as receiving a deemed
distribution (taxable as ordinary income) each year from such foreign corporation in an amount equal to our pro rata
share of the corporation’s income for the tax year (including both ordinary earnings and capital gains). If the Company
is required to include such deemed distributions from a CFC in its income, the Company will be required to distribute
such income to maintain its RIC status regardless of whether or not the CFC makes an actual distribution during such
year. Furthermore, certain income derived by the Company from a CFC would generally constitute qualifying income
for purposes of determining the Company’s ability to be subject to tax as a RIC, only to the extent that the CFC makes

Eagle Point Credit Company Inc. & Subsidiaries
Notes to Consolidated Financial Statements
June 30, 2017
(Unaudited)
31
distributions of that income to the Company.
Accordingly, the Company may be restricted in its ability to make QEF elections with respect to its holdings in issuers
that could be treated as PFICs, and the Company may limit and/or manage its holdings in issuers that could be treated
as CFCs, in order to limit its tax liability or to maximize its after-tax return from such investments.
It is unclear whether or in what form these regulations will be adopted or, if adopted, whether such regulations would
have a significant impact on the income that could be generated by the Company. If adopted, the proposed regulations
would apply to taxable years of the Company beginning on or after 90 days after the regulations are published as final.
The Company is monitoring the status of the proposed regulations and is assessing the potential impact of the proposed
tax regulation on its operations.
In October 2016, the SEC adopted new rules and amended existing rules (together, “final rules”) intended to modernize
the reporting and disclosure of information by registered investment companies. In part, the final rules amend
Regulation S-X and require standardized, enhanced disclosure about derivatives in investment company financial
statements, as well as other amendments. The compliance date for the amendments to Regulation S-X is August 1,
2017. The Company is currently evaluating the impact that the adoption of the amendments to Regulation S-X will
have on the Company’s consolidated financial statements and related disclosures.
In November 2016, FASB issued Accounting Standards Update No. 2016-18 (“ASU 2016-18”), “Statement of Cash
Flows (Topic 230), a consensus of the FASB’s Emerging Issues Task Force,” which requires that a statement of cash
flows explain the change during the period in the total of cash, cash equivalents, and amounts generally described as
restricted cash or restricted cash equivalents. Therefore, amounts generally described as restricted cash and restricted
cash equivalents should be included with cash and cash equivalents when reconciling the beginning-of-period and end-
of-period total amounts shown on the statement of cash flows. The amendments in ASU 2016-18 do not provide a
definition of restricted cash or restricted cash equivalents. ASU 2016-18 if effective for interim and annual reporting
periods beginning after December 15, 2017. The Company is currently evaluating the impact, if any, of applying this
provision.
As of the date of these consolidated financial statements, there were no additional accounting standards applicable to
the Company that had been issued but not yet adopted by the Company.
12. SUBSEQUENT EVENTS
In July 2017, the Company formed a new subsidiary, Eagle Point Credit Company Sub II (Cayman) Ltd.
On July 31, 2017, the Company paid a distribution of $3,618,142 or $0.20 per share on its common stock to holders of
record as of July 13, 2017.
On July 3, 2017, the Company declared three separate distributions of $293,532 or $0.161459 per share on its Series A
Term Preferred Stock. The first distribution was paid on July 31, 2017 to holders of record on July 13, 2017. The
additional distributions are payable on each of August 31, 2017 and September 29, 2017 to holders of record on August
11, 2017 and September 12, 2017, respectively.
On July 3, 2017, the Company declared three separate distributions of $297,085 or $0.161459 per share on its Series B
Term Preferred Stock. The first distribution was paid on July 31, 2017 to holders of record on July 13, 2017. The
additional distributions are payable on each of August 31, 2017 and September 29, 2017 to holders of record on August
11, 2017 and September 12, 2017, respectively.
On July 14, 2017, the Company launched an “at-the-market” offering to sell up to $50,000,000 aggregate amount of its
common stock and up to 1,000,000 shares of our Series B Term Preferred Stock with an aggregate liquidation preference
of $25,000,000, pursuant to a prospectus supplement filed with the SEC on June 29, 2017. As of July 28, 2017, the
Company sold 50,005 shares of its common stock and 27,584 shares of its Series B Term Preferred Stock, pursuant to
the “at-the-market” offering for total net proceeds to the Company of approximately $1.7 million.

Eagle Point Credit Company Inc. & Subsidiaries
Notes to Consolidated Financial Statements
June 30, 2017
(Unaudited)
32
On July 27, 2017, the head of the Financial Conduct Authority announced the desire to phase out the use of LIBOR by
the end of 2021. Because the statements made by the head of the Financial Conduct Authority are recent in nature, there
is no definitive information regarding the future utilization of LIBOR or of any particular replacement rate. As such,
the potential effect of any such event on our net investment income cannot yet be determined. The CLOs the Company
is invested in generally contemplate a scenario where LIBOR is no longer available by requiring the CLO administrator
to calculate a replacement rate primarily through dealer polling on the applicable measurement date. However, there is
uncertainty regarding the effectiveness of the dealer polling processes, including the willingness of banks to provide
such quotations, which could adversely impact the Company’s net investment income. In addition, the effect of a phase
out of LIBOR on U.S. senior secured loans, the underlying assets of the CLOs in which the Company invests, is
currently unclear. To the extent that any replacement rate utilized for senior secured loans differs from that utilized for
a CLO that holds those loans, the CLO would experience an interest rate mismatch between its assets and liabilities
which could have an adverse impact on the Company’s net investment income and portfolio returns.
On August 8, 2017, the Company closed an underwritten public offering of $27.5 million in aggregate principal amount
of its Series 2027 Notes, resulting in net proceeds to the Company of approximately $26.4 million, after payment of
underwriting discounts, commissions and estimated offering expenses. The Series 2027 Notes were issued in minimum
denominations of $25 and integral multiples of $25 in excess thereof. The Series 2027 Notes will mature on September
30, 2027 and 100% of the aggregate principal amount will be paid at maturity. The Company may redeem the Series
2027 Notes in whole or in part at any time or from time to time at the Company’s option, on or after September 30,
2020. As of August 8, 2017, there were 1,100,000 unsecured Series 2027 Notes issued and outstanding.
Management of the Company has evaluated the need for disclosures and/or adjustments resulting from subsequent
events through the date of release of this report. Management has determined there are no events in addition to those
described above which would require adjustment to or disclosure in the consolidated financial statements and related
notes through the date of release of this report.

Eagle Point Credit Company Inc. & Subsidiaries
Financial Highlights
(Unaudited)
33
(1) Per share distributions paid to preferred stockholders and the aggregate amount of amortized deferred debt issuance costs associated with the Preferred Stock
are reflected in net investment income, and totaled ($0.21) and ($0.03) per share of common stock, respectively, for the six months ended June 30, 2017,
($0.28) and ($0.02) per share of common stock, respectively, for the year ended December 31, 2016 and ($0.16) and ($0.01) per share of common stock,
respectively, for the year ended December 31, 2015.
(2) Per share amounts are based on a monthly weighted average of shares of common stock outstanding for the period.
(3) Per share amounts are based on shares of common stock outstanding as of ex-dividend date.
(4) Represents the net effect per share of the Company’s April 2017 and May, September, and December 2016 follow-on offerings, reflecting the excess of
offering price over management’s estimated NAV per share at the time of each respective offering.
(5) Total return based on market value is calculated assuming shares of the Company’s common stock were purchased at the market price as of the beginning of
the period, and distributions paid to common stockholders during the period were reinvested at prices obtained by the Company’s dividend reinvestment plan,
and the total number of shares were sold at the closing market price per share on the last day of the period. Total return does not reflect any sales load. Total
returns for the six months ended June 30, 2017 and for the period from October 6, 2014 to December 31, 2014 are not annualized.
(6) Ratios for the six months ended June 30, 2017 and for the period from October 6, 2014 to December 31, 2014 are annualized. Ratios include distributions
paid to preferred stockholders.
(7) Ratios for the six months ended June 30, 2017 include interest expense on the Preferred Stock and the Series 2020 Notes of 1.95% of average net assets.
Ratios for the year ended December 31, 2016 include interest expense on the Preferred Stock and the Series 2020 Notes of 3.47% of average net assets, as
well as excise taxes of 0.26% of average net assets. Ratios for the year ended December 31, 2015 include interest expense on the Series A Term Preferred
Stock and the Series 2020 Notes of 1.04% of average net assets.
(8) The portfolio turnover rate is calculated as the total of investment sales executed during the period, divided by the average fair value of investments for the
same period.
For the For the For the For the period from
six months ended year ended year ended October 6, 2014
Per Share Data June 30, 2017 December 31, 2016 December 31, 2015 to December 31, 2014
Net asset value at beginning of period 17.48$ 13.72$ 19.08$ 20.00$
Offering costs associated with the Company's initial public offering - - - (0.07)
Net asset value at beginning of period net of offering costs 17.48 13.72 19.08 19.93
Net investment income (1)(2)
0.99 2.14 1.89 0.32
Net realized gain (loss) and change in unrealized
appreciation (depreciation) on investments (2)
(0.04) 3.88 (4.85) (0.62)
Net income (loss) and net increase (decrease) in net assets
resulting from operations (2)
0.95 6.02 (2.96) (0.30)
Common stock distributions from net investment income (3)
(1.00) (2.08) (1.89) (0.31)
Common stock distributions from net realized gains on investments (3)
- (0.12) (0.02) -
Common stock distributions from return of capital (3)
- (0.20) (0.49) (0.24)
Total common stock distributions declared to stockholders (3)
(1.00) (2.40) (2.40) (0.55)
Effect of shares issued, net of underwriting expense (4)
0.19 0.18 - -
Effect of offering costs associated with shares issued (4)
(0.10) (0.04) - -
Effect of shares issued in accordance with the Company's dividend
reinvestment plan 0.01 - - -
Net effect of shares issued (4)
0.10 0.14 - -
Net asset value at end of period 17.53$ 17.48$ 13.72$ 19.08$
Per share market value at beginning of period 16.71$ 16.43$ 20.10$ 19.93$
Per share market value at end of period 20.68$ 16.71$ 16.43$ 20.10$
Total return (5)
30.42% 17.42% -8.12% 0.85%
Shares of common stock outstanding at end of period 18,090,708 16,474,879 13,820,110 13,811,358
Ratios and Supplemental Data:
Net asset value at end of period 317,135,826$ 288,047,335$ 189,607,085$ 263,560,460$
Ratio of expenses to average net assets (6)(7) 10.17% 10.69% 6.73% 2.13%
Ratio of net investment income to average net assets (6)(7) 11.18% 13.72% 10.78% 6.84%
Portfolio turnover rate (8) 20.55% 55.32% 39.07% 37.11%
Asset coverage of preferred stock 305% 286% 365% N/A
Asset coverage of debt securities 771% 722% 1028% N/A

Eagle Point Credit Company Inc. & Subsidiaries
Financial Highlights
(Unaudited)
34
Financial highlights for the period from June 6, 2014 (Commencement of Operations) to October 5, 2014 for the Sole
Member are as follows:
(1) Total return and ratios for the period from June 6, 2014 (Commencement of Operations) to October 5, 2014 are not annualized.
(2) The portfolio turnover rate is calculated as the total of investment sales executed during the period from June 6, 2014
(Commencement of Operations) to October 5, 2014, divided by the average fair value of investments for the same period.
Note: The above Financial Highlights for the period from June 6, 2014 (Commencement of Operations) to October 5,
2014 for the Sole Member represents the period when the Company was initially organized as a Delaware limited
liability company and a wholly-owned subsidiary of Eagle Point Credit Partners Sub Ltd.
For the period from
June 6, 2014
(Commencement of Operations)
Per Unit Data to October 5, 2014
Net asset value at beginning of period 62.12$
Net investment income 3.10
Net realized and unrealized capital gain (loss) on investments 0.56
Total from investment operations 3.66
Adjustment for additional cash contributions 3.56
Net asset value at end of period 69.34$
Total return (1)
5.89%
Ratios and Supplemental Data:
Net asset value at end of period 173,338,066$
Ratio of total expenses to average net assets (1) 0.00%
Ratio of net investment income to average net assets (1)
4.74%
Portfolio turnover rate (2) 52.07%

35
Dividend Reinvestment Plan
The Company has established an automatic dividend reinvestment plan (“DRIP”). Each holder of at least one full share of our
common stock will be automatically enrolled in the DRIP. Under the DRIP, distributions on shares of the Company’s common
stock are automatically reinvested in additional shares of the Company’s common stock by American Stock Transfer and Trust
Company, LLC (the “DRIP Agent”) unless a stockholder “opts-out” of the DRIP. Holders of the Company’s common stock
who receive distributions in the form of additional shares of the Company’s common stock are nonetheless required to pay
applicable federal, state or local taxes on the reinvested distribution but will not receive a corresponding cash distribution with
which to pay any applicable tax. Holders of shares of the Company’s common stock who opt-out of participation in the DRIP
(including those holders whose shares are held through a broker or other nominee who has opted out of participation in the
DRIP) will receive all distributions in cash. Reinvested distributions increase the Company’s stockholders’ equity on which a
management fee is payable to the Adviser.
If the Company declares a distribution payable in cash, the Company will issue shares of common stock to participants at a
value equal to 95% of the market price per share of common stock at the close of regular trading on the payment date for such
distribution unless the DRIP Agent otherwise purchases shares in the open market, as described below. The number of newly
issued shares of common stock to be credited to each participant’s account will be determined by dividing the dollar amount
of the distribution by 95% of the market price. Notwithstanding the foregoing, the Company reserves the right to purchase
shares in the open market in connection with its implementation of the DRIP. The DRIP Agent may be instructed not to credit
accounts with newly issued shares and instead to buy shares in the open market if (i) the price at which newly issued shares are
to be credited does not exceed 110% of the last determined NAV of the shares; or (ii) the Company has advised the DRIP
Agent that since such NAV was last determined, the Company has become aware of events that indicate the possibility of a
material change in per share NAV as a result of which the NAV of the shares on the payment date might be higher than the
price at which the DRIP Agent would credit newly issued shares to stockholders.
In the event that the DRIP Agent is instructed to buy shares of our common stock in the open market, the DRIP Agent (or the
DRIP Agent’s broker) will have until the last business day before the next date on which the shares trade on an “ex-dividend”
basis or 30 days after the payment date for the applicable distribution, whichever is sooner (the “Last Purchase Date”), to invest
the distribution amount in shares acquired in the open market. Open market purchases may be made on any securities exchange
where shares of our common stock are traded, in the over-the-counter market or in negotiated transactions, and may be on such
terms as to price, delivery and otherwise as the DRIP Agent shall determine. If, before the DRIP Agent has completed its open
market purchases, the market price per share of our common stock exceeds the NAV per share, the average per share purchase
price paid by the DRIP Agent may exceed the NAV of the shares, resulting in the acquisition of fewer shares than if the
distribution had been paid in newly issued shares of common stock on the applicable payment date. Because of the foregoing
difficulty with respect to open market purchases, the DRIP provides that if the DRIP Agent is unable to invest the full
distribution amount in open market purchases during the purchase period or if the market discount shifts to a market premium
of 10% or more of NAV during the purchase period, the DRIP Agent may cease making open market purchases and may invest
the uninvested portion of the distribution amount in newly issued shares of common stock at the NAV per share at the close of
business on the Last Purchase Date provided that, if the NAV is less than or equal to 95% of the then current market price per
share, the dollar amount of the distribution will be divided by 95% of the market price on the payment date.
There are no brokerage charges with respect to shares of common stock issued directly by the Company. However, whenever
shares are purchased or sold on the NYSE or otherwise on the open market, each participant will pay a pro rata portion of
brokerage trading fees, currently $0.10 per share purchased or sold. Brokerage trading fees will be deducted from amounts to
be invested.
Holders of the Company’s common stock can also sell shares held in the DRIP account at any time by contacting the DRIP
Agent in writing at American Stock Transfer and Trust Company, LLC, P.O. Box 922, Wall Street Station, New York, NY
10269-0560. The DRIP Agent will mail a check to such holder (less applicable brokerage trading fees) on the settlement date,

36
which is three business days after the shares have been sold. If a stockholder chooses to sell its shares through a broker, the
holder will need to request that the DRIP Agent electronically transfer their shares to the broker through the Direct Registration
System.
Stockholders participating in the DRIP may withdraw from the DRIP at any time by contacting the DRIP Agent in writing at
American Stock Transfer and Trust Company, LLC, P.O. Box 922, Wall Street Station, New York, NY 10269-0560. Such
termination will be effective immediately if the notice is received by the DRIP Agent prior to any dividend or distribution
record date; otherwise, such termination will be effective on the first trading day after the payment date for such dividend or
distribution, with respect to any subsequent dividend or distribution. If a holder of the Company’s common stock withdraws,
full shares will be credited to their account, and the stockholder will be sent a check for the cash adjustment of any fractional
share at the market value per share of the Company’s common stock as of the close of business on the day the termination is
effective, less any applicable fees. Alternatively, if the stockholder wishes, the DRIP Agent will sell their full and fractional
shares and send them the proceeds, less a transaction fee of $15.00 and less brokerage trading fees of $0.10 per share. If a
stockholder does not maintain at least one whole share of common stock in the DRIP account, the DRIP Agent may terminate
such stockholder’s participation in the DRIP Plan after written notice. Upon termination, stockholders will be sent a check for
the cash value of any fractional share in the DRIP account, less any applicable broker commissions and taxes.
Stockholders who are not participants in the DRIP, but hold at least one full share of our common stock, may join the DRIP by
notifying the DRIP Agent in writing at American Stock Transfer and Trust Company, LLC, P.O. Box 922, Wall Street Station,
New York, NY 10269-0560. If received in proper form by the DRIP Agent before the record date of a dividend, the election
will be effective with respect to all dividends paid after such record date. If a stockholders wishes to participate in the DRIP
and their shares are held in the name of a brokerage firm, bank or other nominee, the stockholder should contact their nominee
to see if it will participate in the DRIP. If a stockholder wishes to participate in the DRIP Plan, but the brokerage firm, bank or
other nominee is unable to participate on their behalf, the stockholder will need to request that their shares be re-registered in
their own name, or the stockholder will not be able to participate. The DRIP Agent will administer the DRIP on the basis of
the number of shares certified from time to time by the stockholder as representing the total amount registered in their name
and held for their account by their nominee.
Experience under the DRIP Plan may indicate that changes are desirable. Accordingly, the Company and the DRIP Agent
reserve the right to amend or terminate the DRIP upon written notice to each participant at least 30 days before the record date
for the payment of any dividend or distribution by the Company.
All correspondence or additional information about the DRIP should be directed to American Stock Transfer and Trust
Company, LLC, 6201 15th Avenue, Brooklyn, NY 11219.
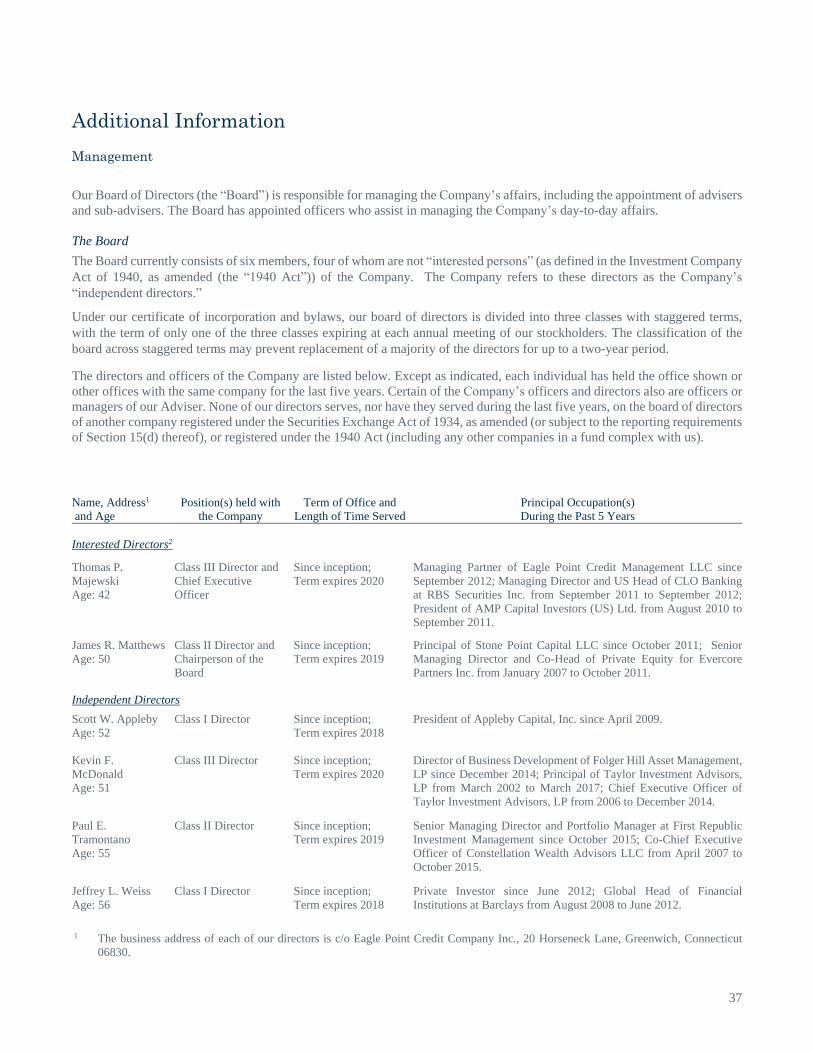
37
Additional Information
Management
Our Board of Directors (the “Board”) is responsible for managing the Company’s affairs, including the appointment of advisers
and sub-advisers. The Board has appointed officers who assist in managing the Company’s day-to-day affairs.
The Board
The Board currently consists of six members, four of whom are not “interested persons” (as defined in the Investment Company
Act of 1940, as amended (the “1940 Act”)) of the Company. The Company refers to these directors as the Company’s
“independent directors.”
Under our certificate of incorporation and bylaws, our board of directors is divided into three classes with staggered terms,
with the term of only one of the three classes expiring at each annual meeting of our stockholders. The classification of the
board across staggered terms may prevent replacement of a majority of the directors for up to a two-year period.
The directors and officers of the Company are listed below. Except as indicated, each individual has held the office shown or
other offices with the same company for the last five years. Certain of the Company’s officers and directors also are officers or
managers of our Adviser. None of our directors serves, nor have they served during the last five years, on the board of directors
of another company registered under the Securities Exchange Act of 1934, as amended (or subject to the reporting requirements
of Section 15(d) thereof), or registered under the 1940 Act (including any other companies in a fund complex with us).
Name, Address1
and Age
Position(s) held with
the Company
Term of Office and
Length of Time Served
Principal Occupation(s)
During the Past 5 Years
Interested Directors2
Thomas P.
Majewski
Age: 42
Class III Director and
Chief Executive
Officer
Since inception;
Term expires 2020
Managing Partner of Eagle Point Credit Management LLC since
September 2012; Managing Director and US Head of CLO Banking
at RBS Securities Inc. from September 2011 to September 2012;
President of AMP Capital Investors (US) Ltd. from August 2010 to
September 2011.
James R. Matthews
Age: 50
Class II Director and
Chairperson of the
Board
Since inception;
Term expires 2019
Principal of Stone Point Capital LLC since October 2011; Senior
Managing Director and Co-Head of Private Equity for Evercore
Partners Inc. from January 2007 to October 2011.
Independent Directors
Scott W. Appleby
Age: 52
Class I Director
Since inception;
Term expires 2018
President of Appleby Capital, Inc. since April 2009.
Kevin F.
McDonald
Age: 51
Class III Director
Since inception;
Term expires 2020
Director of Business Development of Folger Hill Asset Management,
LP since December 2014; Principal of Taylor Investment Advisors,
LP from March 2002 to March 2017; Chief Executive Officer of
Taylor Investment Advisors, LP from 2006 to December 2014.
Paul E.
Tramontano
Age: 55
Class II Director
Since inception;
Term expires 2019
Senior Managing Director and Portfolio Manager at First Republic
Investment Management since October 2015; Co-Chief Executive
Officer of Constellation Wealth Advisors LLC from April 2007 to
October 2015.
Jeffrey L. Weiss
Age: 56
Class I Director
Since inception;
Term expires 2018
Private Investor since June 2012; Global Head of Financial
Institutions at Barclays from August 2008 to June 2012.
1 The business address of each of our directors is c/o Eagle Point Credit Company Inc., 20 Horseneck Lane, Greenwich, Connecticut
06830.

38
2 Mr. Majewski is an interested director due to his position with the Adviser. Mr. Matthews is an interested director due to his position
with Stone Point Capital LLC, the investment manager to the Trident V Funds, which are the primary owners of the Adviser.
The Company’s registration statement, prospectus and annual proxy statement include additional information about our
directors. A copy of the prospectus and proxy statement is available free of charge at www.eaglepointcreditcompany.com or
upon request by calling (844) 810-6501.
Officers
Information regarding our officers who are not directors is as follows:
Name,
Address1
and Age
Positions Held with the
Company
Term of Office and
Length of Time
Served2
Principal Occupation(s)
During the Last Five Years
Kenneth P. Onorio
Age: 49
Chief Financial Officer
and Chief Operating
Officer
Since July 2014
Chief Financial Officer of Eagle Point Credit Management LLC since
July 2014; Chief Operating Officer of Eagle Point Credit
Management LLC since August 2014; Executive Director of Private
Equity and Hedge Fund Administration at JPMorgan Alternative
Investment Services from September 2008 to July 2014.
Nauman S. Malik
Age: 37
Chief Compliance
Officer
Since September 2015
General Counsel of the Adviser since June 2015; Chief Compliance
Officer of the Adviser since September 2015; Associate, Dechert
LLP, a law firm, from September 2012 to May 2015; General
Counsel, Monsoon Capital LLC, an investment management firm,
from September 2008 to August 2012.
Courtney B.
Fandrick
Age: 35
Secretary
Since August 2015
Deputy Chief Compliance Officer of Eagle Point Credit Management
LLC since December 2014; Senior Compliance Associate,
Bridgewater Associates, LP from August 2007 to December 2014.
1 The business address of each of our officers is c/o Eagle Point Credit Company Inc., 20 Horseneck Lane, Greenwich, Connecticut 06830.
All of our officers are officers or employees of the Adviser or affiliated companies. 2 Each officer holds office until his or her successor is chosen and qualifies, or until his or her earlier resignation or removal.
Director and Officer Compensation
Our directors received compensation from the Company in the amounts set forth in the following table during the six months
ended June 30, 2017.
Name Aggregate Compensation from the Company1, 2
Scott W. Appleby
$44,500
Kevin F. McDonald $41,500
Paul E. Tramontano $41,500
Jeffrey L. Weiss $97,500*
TOTAL
$222,000*
* Reflects $49,250 relating to the year ended December 31, 2016 that was payable to Mr. Weiss as of December 31, 2016 and paid during
the period ended June 30, 2017. 1 For a discussion of the independent directors’ compensation, see below. 2 The Company does not maintain a pension plan or retirement plan for any of our directors.
As compensation for serving on the Board, each independent director receives an annual fee of $75,000. The chairman of the
audit committee receives an additional annual fee of $12,500 and the chairman of the nominating committee receives an
additional annual fee of $5,000 for their additional services in these capacities. In addition, each independent director receives
$1,750 for each regularly scheduled Board meeting attended, $500 for each other Board meeting attended at which action is

39
taken, and $500 for each committee meeting attended at which action is taken (except that separate compensation for committee
meetings is not received if such meeting is held on the same day as a meeting of the Board), as well as reasonable out-of-pocket
expenses incurred in attending such meetings.
No compensation is, or is expected to be, paid by us to our directors who are “interested persons” of us, as such term is defined
in the 1940 Act, or to our officers. Our officers are compensated by the Adviser or one of its affiliates, as applicable.
We have entered into an Administration Agreement pursuant to which Eagle Point Administration LLC, our administrator
(“Eagle Point Administration”), performs, or arranges for the performance of, our required administrative services, among
other things. Payments under the Administration Agreement are equal to an amount based upon our allocable portion of Eagle
Point Administration’s overhead in performing its obligations under the Administration Agreement, including rent, the fees
and expenses associated with performing compliance functions and our allocable portion of the compensation of our chief
financial officer and chief compliance officer and our allocable portion of the compensation of any administrative support staff.
Our allocable portion of such total compensation is based on an allocation of the time spent on us relative to other matters. The
Administration Agreement will remain in effect if approved by the Board, including by a majority of our independent directors,
on an annual basis. The Administration Agreement was most recently reapproved by the Board in May 2017.
Stockholder Meeting Information
At the annual meeting of stockholders of the Company (the “Annual Meeting”) held on May 16, 2017, the stockholders of the
Company were asked to approve two proposals. The final voting results from the Annual Meeting are as follows:
Proposal 1: To re-elect two Class III directors to serve until the Company’s 2020 annual meeting or until his successor is duly
elected and qualified.
Nominee Shares Voted “For” Shares “Withheld” Broker Non-Votes
Kevin F. McDonald1 14,223,095 261,075 0
Thomas P. Majewski2 1,182,917 11,149 0
1 Mr. McDonald was elected by the holders of the Company’s outstanding common stock
and preferred stock, voting together as a single class. 2 Mr. Majewski was elected by the holders of the Company’s outstanding preferred stock,
voting separately as a single class.
The following persons’ terms of office as directors also continued after the annual meeting given that each person is either a
Class I or Class II director and not up for re-election at the Annual Meeting: Scott W. Appleby, James R. Matthews, Paul E.
Tramontano and Jeffrey L. Weiss.
Proposal 2: To approve a new investment advisory agreement by and between the Company and the Adviser.
Resolution Shares Voted “For” Shares Voted “Against” Shares “Abstained”
Amended and Restated
Investment Advisory
Agreement
10,770,587 30,634 25,967
The Company received 3,656,982 “broker non-votes” in relation to Proposal 2 (i.e., shares of common stock held of record by
brokers or nominees present at the meeting but as to which instructions had not been received from the beneficial owners or
the persons entitled to vote and the broker or nominee had not voted, or had no discretionary power to vote, on the matter).
Investment Advisory Agreement
At in person meetings held on February 14, 2017 and May 16, 2017, the Board, including all of the directors that are not
interested persons of the Company (voting separately), unanimously voted to approve the continuation of the investment

40
advisory agreement (the “Investment Advisory Agreement”) by and between the Company and the Adviser for an additional
one-year period.
At the meeting held on May 16, 2017, the Board noted that, at its meeting held on February 14, 2017, the Board, including all
of the directors that are not interested persons of the Company (voting separately), unanimously voted to approve the Investment
Advisory Agreement for an initial one-year period in connection with certain changes to the previous investment advisory
agreement. At that time, the Board had determined that it would conduct an annual review of the Investment Advisory
Agreement at its May 16, 2017 meeting and again consider the factors and comparative information provided that it had
considered in connection with its annual review of the previous investment advisory agreement at a meeting held on May 10,
2016. The Board noted that the Investment Advisory Agreement had also been approved by stockholders of the Company.
In reaching a decision to approve the Investment Advisory Agreement and subsequently to continue the Investment Advisory
Agreement, the Board, assisted by the advice of fund counsel, requested and received a significant amount of information and
considered all the factors the Board believed relevant, including, among other things, the following: (1) the nature, extent and
quality of services to be performed by the Adviser; (2) the investment performance of the Company and the Adviser; (3) the
costs of providing services to the Company; (4) the profitability of the relationship between the Company and the Adviser; (5)
comparative information on fees and expenses borne by other comparable registered investment companies or business
development companies and, as applicable, other advised accounts; (6) comparative registered investment companies’ or
business development companies’ performance and other competitive factors and, as applicable, those of other advised
accounts; (7) the extent to which economies of scale would be realized as the Company grows; (8) whether fee levels reflect
these economies of scale for the benefit of the Company’s investors; and (9) various other factors.
The Board’s decision to renew the Investment Advisory Agreement was not based on any single factor, but rather was based
on a comprehensive consideration of all the information provided to the Board at its meetings throughout the year. The Board
did not assign relative weights to the factors considered by it as the Board conducted an overall analysis of these factors.
Individual members of the Board may have given different weights to different factors.
Among other factors, the Board requested, considered and evaluated information regarding:
Nature, Extent and Quality of Services and Performance
The Board reviewed and considered the nature, extent and quality of the services provided by the Adviser under the Investment
Advisory Agreement and by its affiliate under a separate administration agreement. The Board reviewed the most recent Form
ADV for the Adviser, information about the background and experience of the staff and personnel of the Adviser primarily
responsible for the day-to-day portfolio management of the Company, including their experience in managing portfolios of
collateralized loan obligation (“CLO”) securities and the CLO industry knowledge of the Adviser’s senior investment team.
The Board also evaluated the ability of the Adviser to attract and retain high-caliber professional employees. In this regard, the
Board considered information regarding the Adviser’s compensation program, which is designed to align the employees’
interests with the long-term success of the Adviser’s clients, including the Company. In addition, the Board reviewed the
financial stability, investment and risk management programs and legal and compliance programs of the Adviser.
The Board then reviewed and considered the Company’s performance results in terms of both (1) changes in the net asset value
of the Company and (2) total returns to stockholders, each during (a) the 2015 calendar year, (b) the 2016 calendar year and
(c) the period from the Company’s initial public offering through the end of the 2016 calendar year, and considered such
performance in light of the Company’s investment objective, strategies and risks. The Board also considered and discussed at
length these results in comparison to the performance results for various relevant periods of (1) a comparable account managed
by the Adviser (“Comparable Account”), (2) one publicly listed registered investment company that has an investment strategy
that is directly comparable to the Company (“Peer Fund”), and (3) other registered investment companies and business
development companies that either invest a portion of their assets in CLO equity or junior debt securities or have similar
underlying assets to the underlying assets of the CLO securities held by the Company (“Other Peer Companies”).
The Board noted the Adviser’s explanation that the relative performance of the Company and the Comparable Account was
affected by the Company’s higher use of leverage, which magnified the effects of unrealized gains and losses (as applicable)
incurred during the relevant periods. With respect to the Company’s performance as compared to the Peer Fund on both a net
asset value basis and total return basis, the Board considered the Adviser’s explanation that more recent relative performance

41
was affected by the Company’s higher relative distribution rate and higher levels of leverage of the Peer Fund compared to the
Company as well as movements in market prices for CLO equity securities during the period.
While the Company’s relative performance with respect to the Other Peer Companies was mixed, the Board noted that such
comparisons were not as meaningful, as the investment strategies and portfolios of the Other Peer Companies are materially
different than those of the Company.
Based on a review of the above information, together with the factors referenced below, the Board concluded that it was
generally satisfied with, and that the Company should continue to benefit from, the nature, extent and quality of services
provided to the Company by the Adviser.
Investment Advisory Fee Rates and Total Expense Ratio
The Board then reviewed and considered the advisory fee rates, including the base management fee and incentive fee, payable
by the Company to the Adviser under the Investment Advisory Agreement and the total expense ratio of the Company as of
the most recent quarter. Additionally, the Board received and considered information comparing the advisory fee rates and total
expense ratio of the Company with those of the Peer Fund and the Other Peer Companies for the most recent quarter (on an
annualized basis).
The Board noted that the Company’s base management fee rate was lower than, the Company’s incentive fee rate was the same
as, and the Company’s incentive fee hurdle was higher than, those of the Peer Fund, and that the Company’s total expense ratio
was lower than that of the Peer Fund. The Board also noted that, while there were certain differences among the fee structures
of the Company and each of the Other Peer Companies, the Company’s advisory fee rates generally were comparable to those
paid by each of the Other Peer Companies with (1) both management and incentive fee components to their investment adviser’s
compensation and (2) a portion of their assets invested in CLO equity or junior debt securities. In reviewing such information,
the Board noted that the Company’s investment strategy is notably different from that pursued by the Other Peer Companies
and requires a different set of skills to implement. The Board also noted that the Company’s total expense ratio (as a percentage
of the total investments) was higher than all but two of the Other Peer Companies. The Board further took into consideration
the fact that, of the Other Peer Companies with lower total expense ratios, each was either internally managed or otherwise did
not pay incentive compensation under its investment advisory agreement. The Board additionally considered that the
comparisons of the advisory fee rates and total expense ratios to the Other Peer Companies were not as meaningful, as the
investment strategies and portfolios are materially different than those of the Company.
The Board also compared the advisory fee rates paid by each of the Company and the Comparable Account managed by the
Adviser. The Board noted the differences in the fee structures and that the differences could cause the Company to pay a higher
effective advisory fee rate than the Comparable Account in certain circumstances. The Board considered that the different rate
structures are driven by investor expectations for the different types of investment vehicles, the additional complexity of the
Adviser’s investment strategy in the regulatory and tax environment applicable to the Company’s portfolio and the costs
associated with operating as an investment adviser for a registered investment company.
In considering the advisory fee rates, the Board also discussed the Company’s use of leverage, including the issuance of
preferred stock and debt securities. The Board noted that while the Adviser believes that the prudent use of leverage is in the
best interests of the Company and its stockholders, the use of leverage has the potential to increase the Adviser’s incentive fee
and therefore may create a conflict of interest with the Company’s stockholders.
Based on its review, the Board concluded that each of the Company’s advisory fee rates and total expense ratio is fair and
reasonable in light of the services provided to the Company and other factors considered.
Profitability
The Board also considered a profitability analysis of the Adviser and its affiliates with respect to the Company. The Board
concluded that, in light of the costs of providing investment advisory services to the Company, the Adviser’s profitability was
not excessive.

42
Economies of Scale
The Board considered information regarding whether the Investment Advisory Agreement adequately addresses economies of
scale with respect to providing advisory services to the Company. The Board considered that (1) based on the complexity and
time required to manage the types of CLO securities in which the Company invests, the costs associated with managing a larger
portfolio of CLO securities would be expected to require and had required additional investment resources, including personnel,
and (2) such securities are generally acquired and disposed of in transactions which require considerable resources, particularly
when acquired in the primary market. Based on the foregoing, the Board concluded that the opportunity of the Company to
realize significant economies of scale is limited and that the lack of breakpoints in the fee structure was appropriate given the
Company’s investment objectives and strategies.
Other Benefits
The Board considered other benefits to the Adviser and its affiliates derived from their relationship with the Company. Based
on information provided by the Adviser, the Board concluded that these benefits were not material.
Based on the information reviewed and the discussions detailed above, the Board reached a determination, through the exercise
of its business judgment, that the compensation payable to the Adviser pursuant to the Advisory Agreement was fair and
reasonable in light of the services to be provided to the Company by the Adviser and other factors considered.
Portfolio Information
The Company files its complete schedule of portfolio holdings with the SEC for the first and third quarters of each fiscal year
on Form N-Q. The Company’s Forms N-Q are available on the SEC’s website at http://www.sec.gov. The SEC’s Forms N-Q
may be reviewed and copied at the SEC’s Public Reference Room in Washington, DC, and information on the operation of the
Public Reference Room may be obtained by calling 1-800-SEC-0330. The Company also makes its Form N-Q filings available
on its website at www.eaglepointcreditcompany.com.
Proxy Information
The Company has delegated its proxy voting responsibility to Eagle Point. A description of these policies and procedures is
available (1) without charge, upon request, by calling toll free (844) 810-6501; and (2) on the SEC’s website at
http://www.sec.gov.
Information regarding how the Company voted proxies relating to portfolio securities for the 12-month period ending June 30,
2017 is available: (1) without charge, upon request, by calling toll free (844) 810-6501; and (2) on the SEC’s website at
http://www.sec.gov. The Company also makes this information available on its website at www.eaglepointcreditcompany.com.
Tax Information
For the six-month period ended May 30, 2017, the Company recorded distributions on our common stock equal to $1.40 per
share or $23.4 million.
Privacy Information
The Company is committed to protecting your privacy. This privacy notice explains privacy policies of Eagle Point Credit
Company Inc. and its affiliated companies. The terms of this notice apply to both current and former stockholders.
The Company will safeguard, according to strict standards of security and confidentiality, all information it receives about you.
With regard to this information, the Company maintains procedural safeguards that comply with federal standards.

43
The Company’s goal is to limit the collection and use of information about you. When you purchase shares of the Company’s
common stock, the transfer agent collects personal information about you, such as your name, address, social security number
or tax identification number.
This information is used only so that the Company can send you annual and semiannual reports, proxy statements and other
information required by law, and to send you information it believes may be of interest to you. The Company does not share
such information with any non-affiliated third party except as described below:
It is the Company’s policy that only authorized employees of its investment adviser, Eagle Point Credit Management
LLC, and its affiliates who need to know your personal information will have access to it.
The Company may disclose stockholder-related information to unaffiliated third party financial service providers
(which may include a custodian, transfer agent, accountant or financial printer) who need to know that information in
order to provide services to you or to the Company. These companies are required to protect your information and use
it solely for the purpose for which they received it.
If required by law, the Company may disclose stockholder-related information in accordance with a court order or at the request
of government regulators. Only that information required by law, subpoena, or court order will be disclosed.
* * *

[End of Semiannual Report. Back Cover Follows.]

Please see footnote disclosures on page 3.
1
Eagle Point Credit Company Inc. 20 Horseneck Lane
Greenwich, CT 06830
(203) 340 8500
Investment Adviser
Eagle Point Credit Management LLC
20 Horseneck Lane
Greenwich, CT 06830
Transfer Agent, Registrar, Dividend
Disbursement and Stockholder Servicing Agent
American Stock Transfer and Trust Company, LLC
6201 15th Avenue
Brooklyn, NY 11219
(800) 937 5449
www.eaglepointcreditcompany.com
© Eagle Point Credit Company Inc. All rights reserved.
Related Documents