ORIGINAL RESEARCH Eye gaze patterns in emotional pictures Antonio Lanata ` • Gaetano Valenza • Enzo Pasquale Scilingo Received: 30 September 2011 / Accepted: 29 February 2012 / Published online: 19 July 2012 Ó Springer-Verlag 2012 Abstract This paper reports on a preliminary study aiming at investigating the eye gaze pattern and pupil size variation to discriminate emotional states induced by looking at pictures having different arousal content. A wearable and wireless eye gaze tracking system, herein- after called HATCAM, which was able to robustly detect eye tracking and pupil area was used. A group of ten volunteers was presented with a set of neutral and arousal pictures extracted from the International Affective Picture System according to an ad-hoc experimental protocol. A set of features was extracted from eye gaze patterns and pupil size variations and used to classify the two classes of pictures. Although preliminary, results are very promising for affective computing applications. Keywords Eye gaze tracking Wearable systems Affective computing Emotions Pattern recognition 1 Introduction Emotions are psychological conditions that affect several human behaviors, relations, process and results of actions. They are present in all mental processes, and any human activity manifestation is accompanied by emotional expe- riences. Many works have shown that emotional processing can have primacy over cognition (Zajonc 1984). The famous naturalist Darwin stated that emotions emerged during the course of evolution as the means by which living creatures determine the significance of certain conditions to meet their urgent needs (Darwin et al. 2002). Other works have shown how emotion regulation is an essential feature of the mental health. In particular, they highlighted how emotion and its regulation have an important role in vari- ous aspects of normal functioning. For example, emotions become dysregulated in major depressive episodes, and some theoretical views of depression are based on emotion changes which have implications in assessment, treatment, and prevention of the pathology (Gross and Mun ˜oz 1995). Moreover, it has been shown that there exists strong rela- tionship between emotion and anxiety (Lazarus and Averill 1972) as well as brain damages of emotional processing areas and decision-making process (Damasio 2000). In this viewpoint, the importance of having an automatic emotion recognition system becomes clear, which could be profit- ably used in several domains such as human behavior understanding, mental health investigation or social rela- tions interpretation. Latest works on emotion recognition are based on the study of physiological correlates of the autonomic nervous system (ANS), e.g., heart rate vari- ability, electrodermal activity (Picard 2000). The associa- tions of emotions and physiological reactions controlled by the ANS are complex, but anger, for example, has been associated to a higher heart rate than happiness, and on the other hand, anger has been associated to higher finger temperature than fear (Ekman et al. 1983; Levenson 1992). In this work we aim at investigating the relationship between emotions and information coming from the eyes, i.e. pupil size variation and eye gaze pattern. It is known that pupil dilations and constrictions are governed by the ANS (Andreassi 2006). This work is a preliminary study on how eye tracking pattern and pupil area variation relate to emotional stimulation using images form the International Affective Picture System (IAPS). In other words, we want A. Lanata `(&) G. Valenza E. P. Scilingo Department of Information Engineering, Faculty of Engineering, Interdepartimental Research Centre ‘‘E.Piaggio’’, University of Pisa, Pisa, Italy e-mail: [email protected] 123 J Ambient Intell Human Comput (2013) 4:705–715 DOI 10.1007/s12652-012-0147-6

Welcome message from author
This document is posted to help you gain knowledge. Please leave a comment to let me know what you think about it! Share it to your friends and learn new things together.
Transcript
ORIGINAL RESEARCH
Eye gaze patterns in emotional pictures
Antonio Lanata • Gaetano Valenza •
Enzo Pasquale Scilingo
Received: 30 September 2011 / Accepted: 29 February 2012 / Published online: 19 July 2012
� Springer-Verlag 2012
Abstract This paper reports on a preliminary study
aiming at investigating the eye gaze pattern and pupil size
variation to discriminate emotional states induced by
looking at pictures having different arousal content. A
wearable and wireless eye gaze tracking system, herein-
after called HATCAM, which was able to robustly detect
eye tracking and pupil area was used. A group of ten
volunteers was presented with a set of neutral and arousal
pictures extracted from the International Affective Picture
System according to an ad-hoc experimental protocol. A
set of features was extracted from eye gaze patterns and
pupil size variations and used to classify the two classes of
pictures. Although preliminary, results are very promising
for affective computing applications.
Keywords Eye gaze tracking � Wearable systems �Affective computing � Emotions � Pattern recognition
1 Introduction
Emotions are psychological conditions that affect several
human behaviors, relations, process and results of actions.
They are present in all mental processes, and any human
activity manifestation is accompanied by emotional expe-
riences. Many works have shown that emotional processing
can have primacy over cognition (Zajonc 1984). The
famous naturalist Darwin stated that emotions emerged
during the course of evolution as the means by which living
creatures determine the significance of certain conditions to
meet their urgent needs (Darwin et al. 2002). Other works
have shown how emotion regulation is an essential feature
of the mental health. In particular, they highlighted how
emotion and its regulation have an important role in vari-
ous aspects of normal functioning. For example, emotions
become dysregulated in major depressive episodes, and
some theoretical views of depression are based on emotion
changes which have implications in assessment, treatment,
and prevention of the pathology (Gross and Munoz 1995).
Moreover, it has been shown that there exists strong rela-
tionship between emotion and anxiety (Lazarus and Averill
1972) as well as brain damages of emotional processing
areas and decision-making process (Damasio 2000). In this
viewpoint, the importance of having an automatic emotion
recognition system becomes clear, which could be profit-
ably used in several domains such as human behavior
understanding, mental health investigation or social rela-
tions interpretation. Latest works on emotion recognition
are based on the study of physiological correlates of the
autonomic nervous system (ANS), e.g., heart rate vari-
ability, electrodermal activity (Picard 2000). The associa-
tions of emotions and physiological reactions controlled by
the ANS are complex, but anger, for example, has been
associated to a higher heart rate than happiness, and on the
other hand, anger has been associated to higher finger
temperature than fear (Ekman et al. 1983; Levenson 1992).
In this work we aim at investigating the relationship
between emotions and information coming from the eyes,
i.e. pupil size variation and eye gaze pattern. It is known
that pupil dilations and constrictions are governed by the
ANS (Andreassi 2006). This work is a preliminary study on
how eye tracking pattern and pupil area variation relate to
emotional stimulation using images form the International
Affective Picture System (IAPS). In other words, we want
A. Lanata (&) � G. Valenza � E. P. Scilingo
Department of Information Engineering,
Faculty of Engineering, Interdepartimental Research Centre
‘‘E.Piaggio’’, University of Pisa, Pisa, Italy
e-mail: [email protected]
123
J Ambient Intell Human Comput (2013) 4:705–715
DOI 10.1007/s12652-012-0147-6

to explore the relationship between eye information and
emotional image categories. More specifically, by using a
head-mounted eye tracking system (named HATCAM) we
acquired pupil variation together with eye gaze trajectory
and time of fixation as well during the exposition of sub-
jects to affective images having different levels of arousal.
No familiar pictures were used and luminance was nor-
malized in order to keep it constant. A specific set of
features extracted from pupil size variation, eye gaze pat-
tern and time of fixation was used as input to different
classifiers in order to distinguish the neutral from arousal
levels.
2 Background
In the literature several works can be found reporting
emotional studies relating visual stimuli to eye gaze pat-
terns. Some of them argued that when experiencing emo-
tional events most of the attention is devoted to the
emotional information rather than to detail information
(Christianson et al. 1991; Bradley et al. 2003). Recently,
some works reported on how eye tracking information can
be related to selective attention to emotional pictorial
stimuli (Calvo and Lang 2004). They found out that pref-
erential attention depends on the affective valence of visual
stimuli, i.e. pleasant and unpleasant pictures. Nevertheless,
attention can be influenced by other emotional character-
istics of pictorial stimuli, such as arousal, as well as by
nonemotional characteristics, such as picture luminance,
complexity, familiarity, and filled area with details. Con-
cerning information provided by the pupil, previous studies
have suggested that pupil size variation is related to both
cognitive and affective information processing (Partala and
Surakka 2003). More specifically, Beatty and Lucero-
Wagoner (2000) pointed out that during cognitive tasks
such as recalling something from memory, paying close
attention, parsing a complicated sentence, or thinking hard,
the pupils dilate and return to previous size within a few
seconds of completing the mental work. Commonly, it is
referred to as Task-Evoked Pupillary Response (TEPR),
and even tough the dilation was small, it resulted an
involuntary act and reliably associated to a set of cognitive
processes defined as cognitive load. As a matter of fact,
previous works on affective elicitation and pupil size var-
iation have been somewhat controversial. Dated research
activity of Loewenfeld (1966) studied the effects of various
sensory and psychological stimuli to pupil size variation
and argued that none of them caused pupil constriction
except for increased light intensity. On the contrary, Hess
(1972) found out that there would be a continuum ranging
from extreme dilation due to interesting or pleasing stimuli
to extreme constriction due to unpleasant or distasteful
content. Almost in the same years, Janisse (1974) con-
tradicted this bi-directional view arguing that there is no
pupil constriction in response to negative stimuli, or it can
be limited to a few individuals and a small range of stimuli.
He proposed that pupil size should be linearly related to the
stimulation intensity. From this point of view, pupil size
variation seems to be sensitive to the valence scale,
resulting largest at the negative and positive ends of the
continuum and smallest at the center, that would represent
neutral affect. The latest work of Partala and Surakka
(2003) reported a study concerning on pupil size variation
during and after auditory emotional stimulation. Their
results showed that pupil size was significantly larger after
both negative and positive than neutral stimulation. These
results suggested that the autonomic nervous system is
sensitive to systematically chosen highly arousing emo-
tional stimulation. It is reasonable that the above contra-
dictory results and theories may be due to the variety of
stimuli used. Mostly, they have been limited sets of pic-
tures varying in content, and they have suffered from
methodological problems with color, luminance, and con-
trast (Hess and Petrovich 1987). Clearly, controlled stim-
ulus set is a fundamental precondition requirement for a
systematic study of the effects of emotions to pupil size
variation. Nowadays, eye-tracking technology develop-
ment (e.g. ease of use, improved accuracy, and enhanced
sampling rate), offers the possibility for an unobtrusive
monitoring of emotion-related reactions because no sensors
need to be attached to the user. In order to be able to
evaluate the possibilities of using pupil size measurement
as well as pupil tracking for detecting emotional responses,
we need to understand how emotions and eye features
relate to each other. Eye movements can provide detailed
estimates of what information an individual is considering
rather quickly (in less than 200 ms). Eye tracking is
becoming an increasing popular measure of cognitive and
affective information processing (Lohse and Johnson
2002). By gathering data on the location and duration of
eye fixations, many inferences about the cognition structure
could be done. The use of eye tracking in estimating
cognitive or affective states can be focused on two
assumptions: the immediacy (people process information
as it is seen) and the eye-mind (the eye remains fixated on
an object while the object is being processed). A variety of
eye-tracking methods exist. In terms of the data collected
from the eye, two popular methods are mostly used. The
first implies shining a light on the eye and detecting corneal
reflection, the latter implies simply taking visual images of
the eye and then locating the dark pupil area. Generally, the
choice of the best method depends upon the external
lighting conditions. To compute where a person is fixating,
there are three popular methods. The first method simplifies
the calculations by having fixed geometries by forcing the
706 A. Lanata et al.
123

person to hold still by biting on a bar or putting the head in
a restraint, commonly these systems are referred to as
remote eye trackers they have the advantage of using high
sampling frequency camera to acquire the movements of
the eye. The most used systems based on this methodology
are EyeLink 1000 Ltd. (2010), ASL Model 504 L. (2009),
Tobii 1750 Technology (2011) and SMI RED I. (2011). In
the second method the person wears a head sensor that
tracks the head orientation and location in three dimensions
and then combines this information with eye-direction, this
technique is the less used. The third method, used in our
experiments, places the eye-tracking apparatus on the
person head along with a camera so that a visual image is
captured showing what the person is currently looking at,
commonly these system are referred to as head mounted
eye trackers, examples of systems using this technique are:
EyeLink II, ASL H6, Tobii Glasses system, Open-Eyes Li
et al. (2006), ISCAN Inc. (2007) and iVIEW HED, and our
HATCAM. The advantage in using a head mounted eye
tracker is of making the user free to move during the
stimulation. The HATCAM used in our experiments is
cheap, lightweight, wireless therefore based on a real-time
detection of the eye gaze point and pupil size; it exploits
brightness normalization algorithms and does not use
infrared illuminators. Brightness normalization allows us to
use the system in different light conditions, e.g. darkness or
sunlight. The absence of infrared illuminators offers sev-
eral advantages. Indeed, even though low-power infrared
LEDs are, generally, employed to avoid injuries, the use of
infrared illuminator systems, especially for high-sensitive
subjects (e.g. children), can produce reddening and lach-
rymation. Furthermore, in subjects with eye glasses the
lens disturb the infrared light thus showing very weak
pupils. Finally, a large variation of bright light sources can
produce a diminished image of the pupil or even its dis-
appearance. These limitations in eye tracking methods
using infrared illuminators impose stable lighting condi-
tions, and therefore a restriction of the fields of application.
A crucial issue is the methodology for eliciting different
emotional states. In this view, several works, e.g. Lang
et al. (1997), report a set of systematically studied affective
image stimuli belonging to the International Affective
Picture System (IAPS). These stimuli have been studied
using the Self-Assessment Manikin, which is a method to
study differences in affective experiences using nine-point
bipolar rating scales. In these works, subjects look at the
stimuli and ranked them on three bipolar dimensions:
emotional valence, arousal, and dominance. However,
valence and arousal are the most frequently used dimen-
sions to capture the nature of emotional information. The
valence dimension varies from negative to positive emo-
tional experience, and the arousal dimension varies from
calm to highly excited. This kind of elicitation is used in
our experiments.
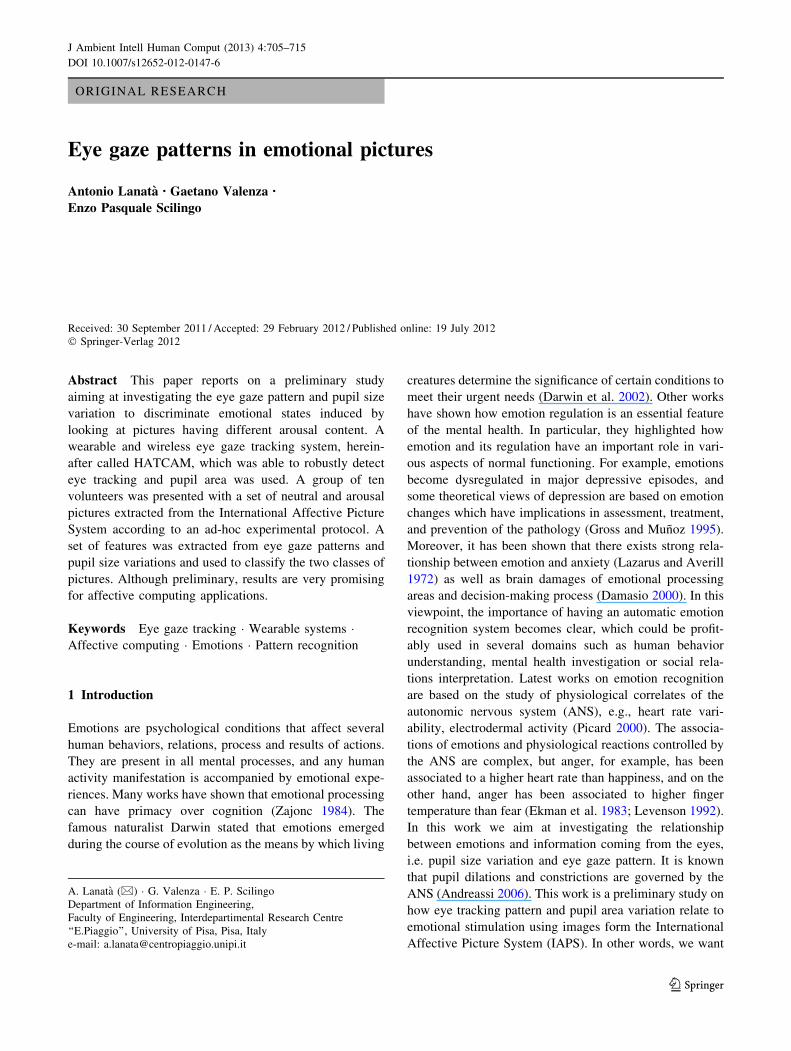
3 HATCAM: wearable EGT system
The system used in this experiment, HATCAM, is a
wearable and wireless eye tracking system which can be
tailored to both adults and children. It is comprised of only
one lightweight camera which is able to capture, by means
of a mirror, the eyes of the subject and the scene in front of
him, simultaneously. The system configuration is shown in
Fig. 1. The system is comprised of a wireless CMOS
camera (CP294) having low weight (20 g), low size (2 9 2
9 2 cm), and an A/V transmitter. The camera has a reso-
lution of 628 9 586 pixels with F2.0, D45� optic, and 25
frames per second (f.p.s.). The original lens of the camera
was removed and substituted with a wide-angle-lens
without IR filter. This operation allows enlarging the view
angle and acquiring infrared components, which emphasize
the contrast between pupil and iris. This system is able to
capture simultaneously, without latency, the visual scene in
front of the subject and the position of his eyes. This is
achieved using a mirror (4 9 0.6 cm) placed on a shaft
linked to the head (see Fig. 1). Tilt and shaft of the mirror
and the camera orientation can be tailored to user forehead
profile (see Fig. 1).
4 Experimental protocol
Ten subjects, nine males and one female, volunteered to
participate in the experiment. All subjects did not suffer
from mental pathologies. Six subjects had dark eyes and
four had bright eyes. The average age was of 26.8 with a
standard deviation of 1.5. The experiment was performed
in a room with controlled illumination condition achieved
by white neon lighting equally distributed over the room
Fig. 1 HATCAM configuration
Eye gaze patterns in emotional pictures 707
123

with a power of 50 lumens. The HATCAM can work
allowing the subjects wearing it to move freely their head,
but in this specific experiment, in order to have a reliable
and accurate measurement of the pupil size variation
(which is more critical than eye gaze tracking) we decided
to use a chin-support. Subjects were asked to sit on a
comfortable chair 70 cm far from a screen. They were
presented with a sequence of images, gathered from the
IAPS database, while wearing headsets for acoustical
insulation. The slideshow was comprised of 5 sessions of
images N, A, N, A, N, where N was a session of 5 neutral
images, and A were sets of 5 images having maximum
level of arousal and the lowest valence, i.e. high negative
affective impact. During the experiments all the subjects
were asked to look at the picture which appeared on the
screen for 10 s. Each trial lasted about 25 min. Each image
was remapped in grey scale with constant histogram in
order to provide images with a similar level of luminance.
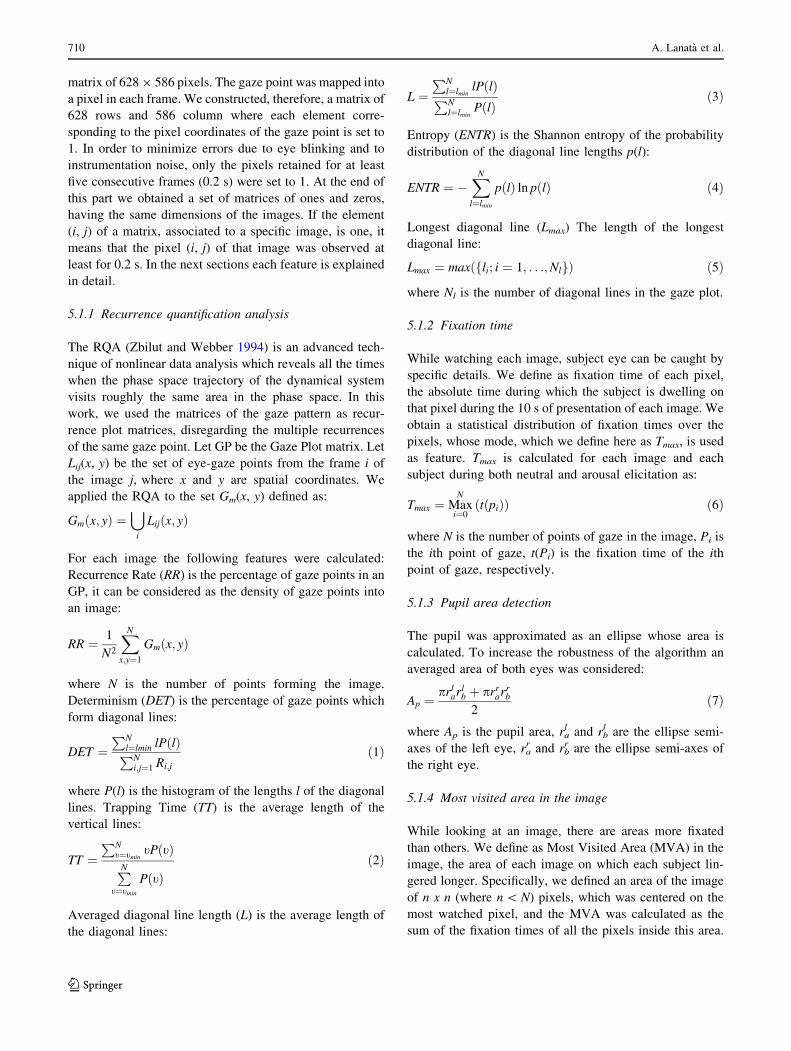
5 Pupillometry and gaze point
This section deals with the processing techniques used to
detect the center of the eye and how its movements were
mapped into the image plane, i.e. the plane corresponding
to image acquired by the camera. This technique is often
referred to as Video OculoGraphy (VOG) and involves
visible spectrum imaging. It is a passive approach that
captures ambient light reflected by the eye. The lens inside
the mounted camera was modified to acquire also the IR
components from the natural light. Since the natural light
spectrum comprises also the near-infrared region of the
electromagnetic spectrum, the system kept the advantages
of IR illumination of increasing the contrast between pupil
and iris, and at same time preventing any possible injuries
due to artificial IR illuminators, as no illuminators towards
the eyes were used. Figure 2 shows the block diagram of
the algorithmic process used to classify visual stimuli
having different affective arousal content. The upper block
implements the pupillometry and gaze point identification.
The output was then processed to extract a specific set of
features used for the classification. Specifically, the pupil-
lometry and gaze point block was comprised of a sub-chain
of blocks implementing the eye extraction algorithm,
photometric normalization algorithm of illumination, pupil
contour and mapping of the eye center into the image
scene. Hereinafter we will describe briefly how eye and
pictures were processed, but further details can be found in
Armato et al. (2011). Figure 3 shows how the HATCAM is
able to acquire simultaneously the eyes of the user and the
scene in front of him using the mirror. Eye extraction
procedure was constituted of visual inspection of the first
video frame, in which a rectangular area including the eye
was manually selected. This region is called Region Of
Interest (ROI). Since the system mounted on the head, the
ROI did not change throughout the experiment. In addition,
only the red-image-component was converted in grey scale
and used as input to the other processing blocks, as this
component was specifically helpful in enhancing the con-
trast between pupil and background. as shown in grey scale
and modified in terms of illumination normalization in
order to reduce or eliminate some variations in the captured
eyes due to different light conditions. In this work, we used
the Discrete Cosine Transform (DCT) already proposed
by Chen et al. (2006). This algorithm was already shown to
be the suitable illumination normalization technique for
Fig. 2 Block diagram showing all the algorithmic stages of the
processing of eyes and outside scene
Fig. 3 Example of a single frame captured by the camera. The
rectangular area marked up in red represents the ROI (color figure
online)
708 A. Lanata et al.
123

realtime eye tracking processing in our previous work
(Armato et al. 2011). This approach is based on the Retinex
theory (from the words ‘‘retina’’ and ‘‘cortex’’, suggesting
that both eye and brain are involved in the processing)
developed by Land and McCann (1971). This theory is based
on the color constancy assumption which ensures that the
perceived color of objects remains relatively constant under
varying illumination conditions. Land and his colleagues
assume that the stimulus is not the result of the light source
and surface reflectivity only, but that the visual system pro-
cesses the stimulus, integrating the spectral radiance and
generating a ratio of integrated radiance of any region of the
scene with that of the brightest region.
A specific pupil tracking algorithm was applied to extract
the contour of the pupil exploiting the higher contrast of the
pupil than the background due to the IR components of the
natural light. Figure 4 shows the algorithm block diagram.
The first block binarized the image by means of a threshold.
After binarization, two sheafs of lines starting from the
middle points of the vertical sides of the image, with an
angular aperture of 30�, were drawn. As result of the bina-
rization process, the image borders were expected to belong
to the background, therefore the starting point of each line has
a value of 255 in terms of grey level. Analogously, the pupil
was expected to be placed roughly in the middle of the image
(this is assured by an accurate manual selection of the ROI).
When each line encounters, along its path, a dark pixel, this
latter can be thought to belong to the contour of the pupil.
Afterwards, the centroid of these points was calculated. After
removing all the outliers, being these points very far from the
centroid with respect to the large point density (pupil edge), a
large-grain approximation of the contour was obtained. Next,
a sheaf of lines started from the centroid with an angular
aperture of 360�, and detected all discontinuities, but this
time from black to white. Finally, outliers were again
removed. The result of this algorithm was a set of points
constituting the pupil edge (see Fig. 5). Afterwards, in order
to construct the pupil contour and detect the center of the eye a
specific ellipse fitting algorithm was implemented. Ellipse is
considered as the best geometrical figure approximating the
eye contour. In the literature, several ellipse fitting algorithms
can be found and usually they can be divided into two broad
techniques: the clustering/vot-ing (CV) and the least square
(LS) techniques. The first one uses two main approaches such
as RANSAC and Hough Transform which are extremely
robust but they are time-demanding or excessively resource
consuming for real time machine vision (Forsyth and Ponce
2002; Bennett et al. 2002). In this work, we used the LS
technique, i.e. a custom algorithm based on the algebraic
distance with a quadratic constraint (Fitzgibbon et al. 2002),
where a gaussian noise is added for the algorithm stabiliza-
tion, (Maini 2005), to calculate the center of the pupil (that
coincides with the ellipse center), the axes as well as the
eccentricity of the ellipse. After the eye center was identified,
a dedicated mapping procedure associated it to the image
plane of the scene, providing as result the gaze point.
5.1 Post-processing and feature extraction
Post-processing phase was applied to a set of features
extracted from the analysis of the eye gaze pattern matrix as
well as to features extracted from Recurrence Quantifica-
tion Analysis (RQA). This technique is usually used for
nonlinear data analysis applied to dynamical systems. More
specifically, it quantifies the number and duration of
recurrences of a dynamical system presented by its phase
space trajectory. The idea of using the latter technique,
which is completely new to this field, arose from the anal-
ogy between the recurrence matrix plots of RQA and the
matrices of eye gaze patterns. The features extracted from
eye gaze analysis provided information about pupil dilation,
max fixation time, length of eye gaze path, and most visited
area in the image. In addition we extracted a set of features
typical of the Recurrence Quantification Analysis (RQA).
More specifically, as described in the experimental proto-
col, each image of the sequence was watched by the sub-
jects for a time interval of 10 s. As the camera acquired with
25 frames per second, we obtained a grand total of 250
frames for each image. Each image can be represented as a
Fig. 4 Block diagram of the pupil tracking algorithm
Fig. 5 Pupil tracking algorithm. Sheafs of lines are in blue; black
points identify the eye including the outliers; yellow points highlight
the pupil contour which is interpolated by the ellipse marked up in red
(color figure online)
Eye gaze patterns in emotional pictures 709
123
matrix of 628 9 586 pixels. The gaze point was mapped into
a pixel in each frame. We constructed, therefore, a matrix of
628 rows and 586 column where each element corre-
sponding to the pixel coordinates of the gaze point is set to
1. In order to minimize errors due to eye blinking and to
instrumentation noise, only the pixels retained for at least
five consecutive frames (0.2 s) were set to 1. At the end of
this part we obtained a set of matrices of ones and zeros,
having the same dimensions of the images. If the element
(i, j) of a matrix, associated to a specific image, is one, it
means that the pixel (i, j) of that image was observed at
least for 0.2 s. In the next sections each feature is explained
in detail.
5.1.1 Recurrence quantification analysis
The RQA (Zbilut and Webber 1994) is an advanced tech-
nique of nonlinear data analysis which reveals all the times
when the phase space trajectory of the dynamical system
visits roughly the same area in the phase space. In this
work, we used the matrices of the gaze pattern as recur-
rence plot matrices, disregarding the multiple recurrences
of the same gaze point. Let GP be the Gaze Plot matrix. Let
Lij(x, y) be the set of eye-gaze points from the frame i of
the image j, where x and y are spatial coordinates. We
applied the RQA to the set Gm(x, y) defined as:
Gmðx; yÞ ¼[
i
Lijðx; yÞ
For each image the following features were calculated:
Recurrence Rate (RR) is the percentage of gaze points in an
GP, it can be considered as the density of gaze points into
an image:
RR ¼ 1
N2
XN
x;y¼1
Gmðx; yÞ
where N is the number of points forming the image.
Determinism (DET) is the percentage of gaze points which
form diagonal lines:
DET ¼PN
l¼lmin lPðlÞPN
i;j¼1 Ri;j
ð1Þ
where P(l) is the histogram of the lengths l of the diagonal
lines. Trapping Time (TT) is the average length of the
vertical lines:
TT ¼PN
t¼tmintPðtÞ
PN
t¼tmin
PðtÞð2Þ
Averaged diagonal line length (L) is the average length of
the diagonal lines:
L ¼PN
l¼lminlPðlÞ
PNl¼lmin
PðlÞð3Þ
Entropy (ENTR) is the Shannon entropy of the probability
distribution of the diagonal line lengths p(l):
ENTR ¼ �XN
l¼lmin
pðlÞ ln pðlÞ ð4Þ
Longest diagonal line (Lmax) The length of the longest
diagonal line:
Lmax ¼ max li; i ¼ 1; . . .;Nlf gð Þ ð5Þ
where Nl is the number of diagonal lines in the gaze plot.
5.1.2 Fixation time
While watching each image, subject eye can be caught by
specific details. We define as fixation time of each pixel,
the absolute time during which the subject is dwelling on
that pixel during the 10 s of presentation of each image. We
obtain a statistical distribution of fixation times over the
pixels, whose mode, which we define here as Tmax, is used
as feature. Tmax is calculated for each image and each
subject during both neutral and arousal elicitation as:
Tmax ¼ MaxN
i¼0ðtðpiÞÞ ð6Þ
where N is the number of points of gaze in the image, Pi is
the ith point of gaze, t(Pi) is the fixation time of the ith
point of gaze, respectively.
5.1.3 Pupil area detection
The pupil was approximated as an ellipse whose area is
calculated. To increase the robustness of the algorithm an
averaged area of both eyes was considered:
Ap ¼prl
arlb þ prr
arrb
2ð7Þ
where Ap is the pupil area, ral and rb
l are the ellipse semi-
axes of the left eye, rar and rb
r are the ellipse semi-axes of
the right eye.
5.1.4 Most visited area in the image
While looking at an image, there are areas more fixated
than others. We define as Most Visited Area (MVA) in the
image, the area of each image on which each subject lin-
gered longer. Specifically, we defined an area of the image
of n x n (where n \ N) pixels, which was centered on the
most watched pixel, and the MVA was calculated as the
sum of the fixation times of all the pixels inside this area.
710 A. Lanata et al.
123

This feature was calculated for all images. Let T(x, y) be
the time of fixation of the pixel whose coordinates are
x, y. Since Tmax(xc, yc) is the maximum time of fixation of
the image and (xc, yc) are the coordinates of the most
watched pixel. We calculated the MVA as:
MVA ¼Xxcþn
2;ycþn
2
x;y¼xc�n2;yc�n
2;
Tðx; yÞ
where n is taken as forty pixels.
5.1.5 Length of the gaze path
The Length of the Gaze Path (LGP) of each image was
calculated as the total length of the gaze path while the
image was presented. We approximated the path between
two consecutive points of gaze as a straight line, as two
consecutive gaze points were obtained from two consecu-
tive frames, i.e. in a time interval of 1/25 s. The distance
between two points was calculated as Euclidean distance.
LGP ¼XN
x;y¼1
ffiffiffiffiffiffiffiffiffiffiffiffiffiffiffiffiffiffiffiffiffiffiffiffiffiffiffiffiffiffiffiffiffiffiffiffiffiffiffiffiffiffiffiffiffiffiffiffiffiffiffiðxi � xiþ1Þ2 þ ðyi � yiþ1Þ2
qð8Þ
5.2 Classification
The aim of this work was to classify two classes of images,
labeled as neutral and arousal. Generally, the choice of one
classifier rather than another depends on many factors,
among which the type of particular distribution of the
features considered into the analysis. The distribution can
be gaussian or non-gaussian thus suggesting to use a
parametric or non-parametric classifier, respectively. In
this work the sets of extracted features exhibited non-
parametric distributions, therefore non-parametric classifi-
ers (Duda et al. 2001), i.e. Linear Discriminant Classifier
(LDC), Quadratic Discriminant Classifier (QDC), Mixture
Of Gaussian (MOG), k-Nearest Neighbor (k-NN), Koho-
nen Self Organizing Map (KSOM), Multilayer Perceptron
(MLP), and Probabilistic Neural Network (PNN), were
used. Best results have been achieved by the MultiLayer
Perceptron (MLP) classifier (Vapnik 1998; Schlesinger and
Hlavac 2002; Heijden et al. 2004; Duda et al. 2001; Webb
2002; Friedman et al. 2000; Jain et al. 2000). It allowed us
to recognize arousal from neutral sessions of the experi-
mental protocol. More specifically, results were calculated
after twenty steps of cross validation, in particular the
training set was composed of 80 % of the whole dataset
randomly picked out.
5.2.1 The multi-layer perceptron (MLP)
The Multi-Layer Perceptron (MLP) (KinneBrock 1992) is
an artificial neural network model consisting of multiple
layers of nodes mapping sets of input data onto a set of
appropriate outputs. Except for the input nodes, each node
is a neuron with a nonlinear activation function. This type
of network was trained with the help of a supervised
learning method, i.e. input and output values were specified
and the relations between them learnt. The neural network
approximated every non-linear mapping of the form
y = f(x). Every data record consisted of input data and the
corresponding output data. The multilayer perceptron
learnt the input/output behavior of the system examined via
a training data set. In the training phase, for each data
record, each activation function of the artificial neurons
was calculated. The weight wij of a generic neuron i at the
time T, for the input vector f kn ¼ f k
n1; . . .; f knF was modified
on the basis of a well established technique, the propaga-
tion of the resulting error between the input and the output
values. The response of the MLP is a boolean vector; each
element represents the activation function of an output
neuron. After the training process, the performance of the
classification task was evaluated using the confusion
matrix. The generic element rij of the confusion matrix
indicates how many times in percentage a pattern belong-
ing to the class i was classified as belonging to the class
j. A more diagonal confusion matrix corresponds to a
higher degree of classification. As each pattern may be
confused with more than one pattern, the sum on each row
and column may differ from the value of 100 %. In order to
check the generalization capability of the neural network, a
cross-validation process is carried out.
6 Experimental results
The International Affective Picture System includes a set
of static images based on a dimensional model of emotion.
Here we have chosen two classes of images. The first
image set included neutral images, such as rolling pin,
spoon, mug, trashcan, while the second one contained
various pictures depicting mutilations, attack scenes,
accidents, i.e. high arousal and negative valence. By way of
illustration we report in Fig. 6 an example of neutral image
also showing the eye gaze pattern. We do not report
intentionally any negatively valenced images because of
high visual impact. In Fig. 7 a 3D representation of the eye
gaze points over a neutral image is reported. The z-axis
represents how many times each pixel was fixated during
the presentation time of 10 s. On each image we reported
the gaze points. Already at glance, most of neutral images
showed a more sparse spatial distribution of the gaze points
than the images with arousal, in which gaze points were
mainly concentrated into confined areas. A more quanti-
tative analysis was done extracting the above described
features from the distribution of eye gaze patterns and
Eye gaze patterns in emotional pictures 711
123

using them as input of the MLP classifier. All the extracted
features were not normally distributed, as confirmed by the
Lilliefors test, (Lilliefors 1967), which returns a p-value
(p \ 0.05) rejecting the null hypothesis of normality.
Accordingly, we used the Kruskal-Wallis test, (Kruskal and
Wallis 1952), which is a non parametric one-way analysis
of variance by ranks for testing equality of population
medians. Kruskal-Wallis was performed on ranked data, so
the measurement observations were converted to their
ranks in the overall data set. This test did assume an
identically-shaped and scaled distribution for each group,
except for any difference in medians. The null hypothesis
was stated as the probability that the samples come from
identical populations, regardless their distributions. In
place of the mean of distributions we considered the
Fig. 6 Example of the points of
gaze detected during a neutral
elicitation. Gaze points are
marked up in red (color figure
online)
Fig. 7 3D Representation of
the gaze points over the image
across the recurrence times each
pixel was fixated
Table 1 Median and deviation of all the extracted features during the
visualization of neutral and arousal pictures
Features Neutral Arousal
RR* 0.0018 ± 0.0002 0.0019 ± 0.0002
DET** 0.7311 ± 0.0782 0.6373 ± 0.0798
TT** 2.5862 ± 0.9024 2.0345 ± 0.4368
L** 2.9184 ± 0.4564 2.6513 ± 0.3181
ENTR** 1.2592 ± 0.2306 1.0501 ± 0.2041
Lmax** 5.0000 ± 1.2800 5.0000 ± 1.0583
Tmax** 1.9600 ± 0.3509 1.5600 ± 0.3501
Pupil 195.39 ± 19.689 197.27 ± 17.106
LGP** 480.0000 ± 208.5236 331.5000 ± 174.1567
MVA** 33.0000 ± 8.8630 27.0000 ± 7.8800
712 A. Lanata et al.
123
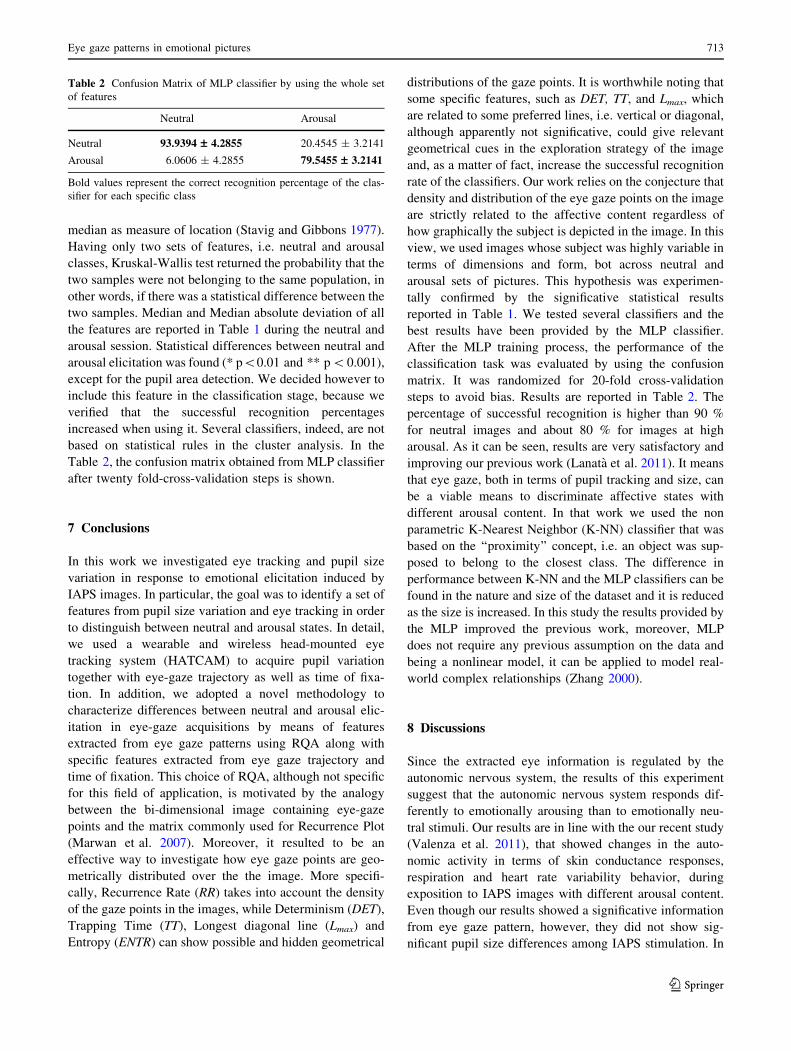
median as measure of location (Stavig and Gibbons 1977).
Having only two sets of features, i.e. neutral and arousal
classes, Kruskal-Wallis test returned the probability that the
two samples were not belonging to the same population, in
other words, if there was a statistical difference between the
two samples. Median and Median absolute deviation of all
the features are reported in Table 1 during the neutral and
arousal session. Statistical differences between neutral and
arousal elicitation was found (* p\0.01 and ** p\0.001),
except for the pupil area detection. We decided however to
include this feature in the classification stage, because we
verified that the successful recognition percentages
increased when using it. Several classifiers, indeed, are not
based on statistical rules in the cluster analysis. In the
Table 2, the confusion matrix obtained from MLP classifier
after twenty fold-cross-validation steps is shown.
7 Conclusions
In this work we investigated eye tracking and pupil size
variation in response to emotional elicitation induced by
IAPS images. In particular, the goal was to identify a set of
features from pupil size variation and eye tracking in order
to distinguish between neutral and arousal states. In detail,
we used a wearable and wireless head-mounted eye
tracking system (HATCAM) to acquire pupil variation
together with eye-gaze trajectory as well as time of fixa-
tion. In addition, we adopted a novel methodology to
characterize differences between neutral and arousal elic-
itation in eye-gaze acquisitions by means of features
extracted from eye gaze patterns using RQA along with
specific features extracted from eye gaze trajectory and
time of fixation. This choice of RQA, although not specific
for this field of application, is motivated by the analogy
between the bi-dimensional image containing eye-gaze
points and the matrix commonly used for Recurrence Plot
(Marwan et al. 2007). Moreover, it resulted to be an
effective way to investigate how eye gaze points are geo-
metrically distributed over the the image. More specifi-
cally, Recurrence Rate (RR) takes into account the density
of the gaze points in the images, while Determinism (DET),
Trapping Time (TT), Longest diagonal line (Lmax) and
Entropy (ENTR) can show possible and hidden geometrical
distributions of the gaze points. It is worthwhile noting that
some specific features, such as DET, TT, and Lmax, which
are related to some preferred lines, i.e. vertical or diagonal,
although apparently not significative, could give relevant
geometrical cues in the exploration strategy of the image
and, as a matter of fact, increase the successful recognition
rate of the classifiers. Our work relies on the conjecture that
density and distribution of the eye gaze points on the image
are strictly related to the affective content regardless of
how graphically the subject is depicted in the image. In this
view, we used images whose subject was highly variable in
terms of dimensions and form, bot across neutral and
arousal sets of pictures. This hypothesis was experimen-
tally confirmed by the significative statistical results
reported in Table 1. We tested several classifiers and the
best results have been provided by the MLP classifier.
After the MLP training process, the performance of the
classification task was evaluated by using the confusion
matrix. It was randomized for 20-fold cross-validation
steps to avoid bias. Results are reported in Table 2. The
percentage of successful recognition is higher than 90 %
for neutral images and about 80 % for images at high
arousal. As it can be seen, results are very satisfactory and
improving our previous work (Lanata et al. 2011). It means
that eye gaze, both in terms of pupil tracking and size, can
be a viable means to discriminate affective states with
different arousal content. In that work we used the non
parametric K-Nearest Neighbor (K-NN) classifier that was
based on the ‘‘proximity’’ concept, i.e. an object was sup-
posed to belong to the closest class. The difference in
performance between K-NN and the MLP classifiers can be
found in the nature and size of the dataset and it is reduced
as the size is increased. In this study the results provided by
the MLP improved the previous work, moreover, MLP
does not require any previous assumption on the data and
being a nonlinear model, it can be applied to model real-
world complex relationships (Zhang 2000).
8 Discussions
Since the extracted eye information is regulated by the
autonomic nervous system, the results of this experiment
suggest that the autonomic nervous system responds dif-
ferently to emotionally arousing than to emotionally neu-
tral stimuli. Our results are in line with the our recent study
(Valenza et al. 2011), that showed changes in the auto-
nomic activity in terms of skin conductance responses,
respiration and heart rate variability behavior, during
exposition to IAPS images with different arousal content.
Even though our results showed a significative information
from eye gaze pattern, however, they did not show sig-
nificant pupil size differences among IAPS stimulation. In
Table 2 Confusion Matrix of MLP classifier by using the whole set
of features
Neutral Arousal
Neutral 93.9394 – 4.2855 20.4545 ± 3.2141
Arousal 6.0606 ± 4.2855 79.5455 – 3.2141
Bold values represent the correct recognition percentage of the clas-
sifier for each specific class
Eye gaze patterns in emotional pictures 713
123

the literature there are discordant works about the pupil
size variation upon affective stimuli. In the study of Loe-
wenfeld (1966) it is reported that pupil size may not be
sensitive enough to discriminate emotional responses, while
Hess (1972) and Partala and Surakka (2003) showed
experimental evidence about this affective-dependence
variation. In our study, pupil size does not seem to have a
relevant role, but it could also be explained in terms of low
resolution of the camera used in the HATCAM system,
which did not detect the fine pupil responses, or of a pos-
sible failure in providing right controlled stimuli, consid-
ering also that there are several factors affecting the
variation of pupil size. Hess and Petrovich (1987) listed
several different sources of pupil size variation, including,
for example, the light reflex, different stimulus parameters
(e.g. visual and chemical), and information-processing load.
However, besides the role of pupil size, our results are very
satisfactory and very promising for the use of eye infor-
mation pattern in the context of pervasive monitoring. This
would extend the perceptually intelligent abilities of an
engine to perceive and analyze human behavior. In human
behavior positive emotions have been argued to increase
creativity, to help in creating richer associations for mem-
orized material, and to realize more efficient decision-
making machines (Isen and Means 1983; Zhou 1998). In
addition, by using suitable emotion-related cues, it could be
also possible to modulate the user emotional reactions that
could be used also as possible therapy in mental disease
management. Future work will progress to exploit eye gaze
together with peripheral physiological signals in the field of
human behavior understanding and mental care.
Acknowledgments This research is partially supported by the EU
Commission under contract FP7-ICT-247777 Psyche, and partially
supported by the EU Commission under contract FP7-ICT-258749
CEEDs.
References
Andreassi JL (2006) Psychophysiology Human behavior and phys-
iological response. Lawrence Erlbaum Assoc Inc., ISBN:
0805849513
Armato A, Lanata A, Scilingo EP (2011) Comparitive study on
photometric normalization algorithms for an innovative, robust
and real-time eye gaze tracker. J Real-Time Image Process 1–13.
doi:10.1007/s11554-011-0217-6
ASL (2009) Applied science laboratories:mobile eye and eye tracking
services. http://www.asleyetracking.com
Beatty J, Lucero-Wagoner B (2000) The pupillary system. Cambridge
University Press, Cambridge
Bennett N, Burridge R, Saito N (2002) A method to detect and
characterize ellipses using the Hough transform. IEEE Trans
Pattern Anal Mach Intell 21(7):652–657
Bradley MM, Sabatinelli D, Lang PJ, Fitzsimmons JR, King W, Desai
P (2003) Activation of the visual cortex in motivated attention.
Behav Neurosci 117(2):369
Calvo MG, Lang PJ (2004) Gaze patterns when looking at emotional
pictures: motivationally biased attention. Motiv Emot
28(3):221–243
Chen W, Er MJ, Wu S (2006) Illumination compensation and
normalization for robust face recognition using discrete cosine
transform in logarithm domain. IEEE Trans Syst Man Cybernet
Part B Cybernet 36(2):458–466
Christianson SA, Loftus EF, Hoffman H, Loftus GR (1991) Eye
fixations and memory for emotional events. J Exp Psychol Learn
Memory Cognit 17(4):693
Damasio AR (2000) Descartes’ error: emotion, reason, and the human
brain. Quill, New York, ISBN: 0380726475
Darwin C, Ekman P, Prodger P (2002) The expression of the emotions
in man and animals. Oxford University Press, Oxford, ISBN:
0195158067
Duda R, Hart P, Stork D (2001) Pattern classification, 2nd edn. Wiley,
New York
Ekman P, Levenson RW, Friesen WV (1983) Autonomic nervous
system activity distinguishes among emotions. Science, ISSN:
0036-8075
Fitzgibbon A, Pilu M, Fisher RB (2002) Direct least square fitting of
ellipses. IEEE Trans Pattern Anal Mach Intell 21(5):476–480
Forsyth DA, Ponce J (2002) Computer vision: a modern approach,
Professional Technical Reference. Prentice Hall, Upper Saddle
River
Friedman J, Hastie T, Tibshirani R (2000) Additive logistic regres-
sion: A statistical view of boosting. Annals Stat 38(2):337–374
Gross JJ, Munoz RF (1995) Emotion regulation and mental health.
Clin Psychol Sci Pract 2(2):151–164
Heijden F, Duin R, Ridder D, Tax D (2004) Classification, parameter
estimation and state estimation. Wiley, New York
Hess EH (1972) Pupillometrics: a method of studying mental,
emotional and sensory processes, handbook of psychophysiol-
ogy. Holt, Rinehart & Winston, New York, pp 91–531
Hess EH, Petrovich SB (1987) Pupillary behavior in communication:
nonverbal behaviour and communication. Erlbaum, Hillsdale,
pp 327–348
ISCAN (2007) Inc. Eye and target tracking solutions.
http://www.iscaninc.com/
Isen AM, Means B (1983) The influence of positive affect on
decision-making strategy. Soc Cognit 2(1):18–31
Jain AK, Duin RPW, Mao J (2000) Statistical pattern recognition: a
review. IEEE Trans Pattern Anal Mach Intell 22(1):4–37
Janisse MP (1974) Pupil size, affect and exposure frequency. Soc
Behav Pers 2(2):125–146
KinneBrock W (1992) Neural networks. Oldenburg Verlag, Munchen
Kruskal WH, Wallis WA (1952) Use of ranks in one-criterion
variance analysis. J Am Stat Assoc 47(260):583–621
LanataA, Armato A, Valenza G, Scilingo EP (2011) Eye tracking and
pupil size variation as response to affective stimuli: a
preliminary study. In: 2011 5th international conference on
pervasive computing technologies for healthcare (pervasive
health), IEEE, pp 78–84
Land EH, McCann JJ (1971) Lightness and retinex theory. J Opt Soc
Am 61(1):1–11
Lang PJ, Bradley MM, Cuthbert BN (1997) International affective
picture system (IAPS): Technical manual and affective ratings.
NIMH Center for the Study of Emotion and Attention
Lazarus RS, Averill JR (1972) Emotion and cognition: With special
reference to anxiety. Anxiety Curr Trends Theory Res
2:242–284
Levenson RW (1992) Autonomic nervous system differences among
emotions. Psychol Sci 3(1):23
Li D, Babcock J, Parkhurst DJ (2006) openeyes: a low-cost head-
mounted eye-tracking solution. In: Proceedings of the 2006
714 A. Lanata et al.
123

symposium on Eye tracking research and applications, ACM,
pp 95–100
Lilliefors HW (1967) On the Kolmogorov-Smirnov test for normality
with mean and variance unknown. J Am Stat Assoc
62(318):399–402
Loewenfeld IE (1966) Comment on hess’ findings. Surv Ophthalmol
11:293–294
Lohse GL, Johnson EJ (2002) A comparison of two process tracing
methods for choice tasks. In: Proceedings of the Twenty-Ninth
Hawaii International Conference on System sciences, 1996, vol
4, pp 86–97. IEEE, ISBN 0818673249
Maini E (2005) Robust ellipse-specific fitting for real-time machine
vision. In: Brain, vision, and artificial intelligence. Springer,
Berlin, pp 318–327
Marwan N, Carmen Romano M, Thiel M, Kurths J (2007) Recurrence
plots for the analysis of complex systems. Phys Reports
438(5–6):237–329
Partala T, Surakka V (2003) Pupil size variation as an indication of
affective processing. Int J Human-Comput Stud 59(1):185–198
Picard RW (2000) Affective computing. The MIT Press, Cambridge,
ISBN 0262661152
Schlesinger M, Hlavac V (2002) Ten lectures on statistical and
structural pattern recognition. Kluwer Academic Publishers,
Dordtrecht
SMI (2011) Sensomotoric instruments: gaze and eye tracking
systems. http://www.smivision.com/
S R Research Ltd. (2010) S R research:complete eye tracking
solutions. http://www.sr-research.com/
Stavig GR, Gibbons JD (1977) Comparing the mean and the median
as measures of centrality. Int Stat Rev/Revue Internationale de
Statistique 45(1):63–70
TOBII Technology (2011) Tobii eye tracking innovator.
http://www.tobii.com/
Valenza G, LanataA, Scilingo E (2011) The role of nonlinear
dynamics in affective valence and arousal recognition. EEE
Trans Affect Comput. doi:10.1109/T-AFFC.2011.30
Vapnik V (1998) Statistical learning theory. Wiley, New York
Webb A (2002) Statistical pattern recognition. Wiley, New York
Zajonc RB (1984) On the primacy of affect. Am Psychol
39(2):117–123
Zbilut JP, Webber Jr CL (1994) Recurrence quantification analysis.
Wiley Online Library
Zhang GP (2000) Neural networks for classification: a survey. IEEE
Trans Syst Man Cybernet Part C Appl Rev 30(4):451–462
Zhou J (1998) Feedback svalence, feedback style, task autonomy, and
achievement orientation: interactive effects on creative perfor-
mance. J Appl Psychol 83(2):261
Eye gaze patterns in emotional pictures 715
123
Related Documents