External Vulnerability Indicators: The Case of Indonesia by Ayi Supriyadi Statistics Department Bank Indonesia Version of June 30, 2014 1 Paper Submitted for the Seventh IFC Biennial Conference on 4 – 5 September 2014 1 Helpful comments by Riza Tyas U. H., Bayu Dwi Atmanto, and Pujiastuti on a draft version are gratefully acknowledged.

Welcome message from author
This document is posted to help you gain knowledge. Please leave a comment to let me know what you think about it! Share it to your friends and learn new things together.
Transcript
External Vulnerability Indicators: The Case of Indonesia
by
Ayi Supriyadi
Statistics Department
Bank Indonesia
Version of June 30, 20141
Paper Submitted for the Seventh IFC Biennial Conference on 4 – 5 September 2014
1 Helpful comments by Riza Tyas U. H., Bayu Dwi Atmanto, and Pujiastuti on a draft version are gratefully acknowledged.
Abstract
This paper aims to find indicators that can be used to monitor Indonesia's external
vulnerability as well as an early warning system of crisis. The study is conducted by
evaluating a number of indicators deployed in the previous studies by using signaling
method. An analysis of external vulnerability is facilitated by separating the pressure of
vulnerabilities into four zones, namely normal, alert, cautious, and suspected crisis. The study
obtains 12 external indicators that are then aggregated to produce a composite index of
external vulnerability. The selected indicators and the composite index are well able to
capture the external vulnerability.
Page 1
External Vulnerability Indicators: The Case of Indonesia
Ayi Supriyadi
1. INTRODUCTION
1.1 BACKGROUND
The economic crisis that swept over Asian countries in 1997-1998 was the worse
experience for Indonesia. In the period before the crisis, Indonesian economy grew fairly
high with stable inflation, but the impact of Bath depreciation spread to many countries in
Asia including Indonesia and as a result, Indonesia fell in a very deep crisis. During the crisis,
Indonesia’s economy contracted the highest, reaching 13.1% in 1998. Meanwhile, economic
growth of Thailand, Malaysia, South Korea, and Philippine in the same year contracted by
10.5%, 7.4%, 6.9%, and 0.6%, respectively (Simorangkir, 2012).
The Asian crisis was not able to be predicted by various models developed prior to
1997-1998. The first generation model of crisis developed by Krugman (1979) explains that
the crisis could occur if the government did not implement appropriate macroeconomic
policies through money creation to cover the fiscal deficit. While the second generation
developed by Eichengreen & Wyplosz (1993) and Obstfelt (1994) are also not suitable to
explain the onset of the Asian crisis. According to this model, the crisis is caused by investor
behaviour who expects there will be a devaluation so that they tend to invest their funds in
foreign currency. This action ultimately depletes official reserve assets and makes the country
unable to maintain fixed exchange rate regimes. Krugman (1999) ultimately developed a
third generation model to explain the Asian crisis in which the role of the financial system
became a central point of crisis.

Page 2
In the three models mentioned above, basically the economic crisis in a country
depends on two main things, namely the vulnerable conditions and the triggers. The
difference between those crisis models lies in the indicators used as reference to describe the
vulnerability of economy. If the indicators increase then the level of vulnerability rise and
the probability of crisis would increase.
In 1990s, Indonesian economy was already vulnerable. Dabrowski (2001) describes that
short term external debt position was swollen, current account was always deficit, and ratio of
exports to external debt was very low. The condition was also accompanied by a low foreign
exchange reserves rising a doubt about Indonesia's ability to meet its external obligations. In
such conditions, when the first outbreak occurred in Thailand, the investors rushed to attract
their fund from Indonesia. Even worse, the ratio of money supply to foreign reserves was
rising so that causing panic in the market and encourage irrational actions such as the sale of
domestic assets. As a result, the exchange rate depreciated very deep that triggered high
inflation. Foreign reserves depletion and very high rise in interest rates caused economic
contraction. Indonesia then fell into deep economic crisis since that time.
Learning from the crisis, the efforts to identify and to measure vulnerability indicators
becomes indispensable. By using these indicators, then we can develop a mechanism to
detect an early symptom of the economic crisis, so potential crisis can be detected and
anticipated. In this case, the early warning system is one method that can be used to identify
and to anticipate economic crisis in the future.
This study aimed to identify which indicators can be used as an early warning system
for economic vulnerability in Indonesia, especially if the vulnerability pressure comes from
external sector. Thus, the evaluation of indicators are limited to the indicators related to
external sector only. It is based on the experience of the crisis in 1997 -1998 which shows
that the world economy is becoming more integrated and inter-state dependence is becoming

Page 3
stronger. If the shock occurs in one country then it will quickly spread to other countries. The
shock transmission from one country to another is reflected from various external indicators.
The problem then is which external indicators are the most appropriate to use. Furthermore,
in order to facilitate monitoring of the external sector vulnerabilities, the selected external
vulnerability indicators will be used to construct composite index that would able to reflect
the vulnerability of the external sector as a whole.
1.2. THEORETICAL BACKGROUND
1.2.1. Definition of Crisis
One of the important things when identifying indicators that can capture the level of
vulnerability is the definition of the crisis itself. Crisis is defined differently by each
researcher, as well as the methods used to quantify crisis definition. Chui (2002) sums up the
crisis definition used by various researchers such as Goldman Sachs, JP Morgan, Frankel &
Rose, and Kumar, Moorthy & Perraudin. In general, the similarity of the researchers in
defining crisis is significant depreciation of the exchange rate.
Other researchers, such as Eichengreen (1996) and Kaminsky (1998) used an index
called the Exchange Market Pressure (EMP) as a basis for determining the crisis.
Eichengreen used three variables to measure the EMP namely changes in exchange rates,
interest rates, and official reserve assets position, while Kaminsky used only two variables,
namely changes in exchange rate and reserves position.
Several researchers also used the three variables when calculate the EMP, but the
weights used by researchers differ from one another. Herrera-Garcia (1999) used these three
variables when calculated the Index of Speculative Pressure (ISP) which is used to determine
crisis periods and give equal weight to each variables. While Eichengreen (1996) gives the
weights based on the standard deviation of each variable, Sachs (1996) used the weights

Page 4
based on the standard deviation of each variable relative to the standard deviation of all
variables. Kaminsky (1998) also did a weighting based on the standard deviation of each
variable but relative to the standard deviation of exchange rate depreciation.
Herrera-Garcia (1999):
ISP = Standardize(Δe) + Standardize(Δi) – Standardize(Δr)
Eichengreen (1996):
(
)
( )
Sachs (1996):
(
⁄
(( ⁄ ) (
⁄ ) ( ⁄ ))
)
(
⁄
(( ⁄ ) (
⁄ ) ( ⁄ ))
)
(
⁄
(( ⁄ ) (
⁄ ) ( ⁄ ))
)
Kaminsky (1998):
Where: ISP = Index of Speculative Pressure
EMP = Exchange Market Pressure
e = Nominal exchange rate
i = Interest rate
r = Foreign reserves position
Page 5
1.2.2. Selection of Indicators
Researches on indicators that are leading to the crisis have been conducted by various
researchers. Among these are Eichengreen (1996) who conducted a study of 20 industrialized
countries in order to capture the contagious effect of crisis and Kaminsky (1998) who did the
research with the signaling approach.
Chui (2002) summarised the research into three different methods. The first method is
signaling approach. Signaling method analyzes the behavior of an indicator with a certain
threshold level. If the indicator passes the threshold, then the signal of crisis is given. The
chosen threshold is the threshold most able to identify the signal of crisis.
The second method is discrete method which can analyze probability of crisis.
Basically, the discrete method uses probability distribution function of the crisis periods and
tranquil periods. Meanwhile, the third method is more concerned with the relationship
between certain variables and the crisis.
Other researchers, Babecký, Havránek, Matějů, Rusnak, Šmídková, and Vašíček (2011)
use both discrete and continuous models. The discrete model uses dynamic panel logit
models, whereas the continuous model uses panel VAR models.
In general, the most widely used methods are signaling and discrete models. In
signaling method, non-parametric approach is used to determine the threshold . Threshold is
determined based on a certain percentille. An indicator will give a signal of crisis whenever it
moves beyond a given threshold level. A signal that is followed by a crisis within specific
time, Kaminsky (1998) used the next 24 months, is called a good signal, while a signal not
followed by a crisis within that interval of time is called a false signal.

Page 6
Table 1 Signaling Methods
Crisis (within 24 months) No Crisis (within 24 months)
Signal was Issued A B
No signal was issued C D
Where:
A = The number of periods in which the indicator issued a good signal
B = The number of periods in which the indicator issued a bad signal
C = The number of periods in which the indicator failed to issue a signal
D = The number of periods in which the indicator refrained from issuing a signal
In signaling method, measuring standard of the effectiveness of indicators assigned as
early warning indicator is determined by the indicators’ ability to issue good signals and to
avoid false signals. The common parameters which can capture this ability is Type I and
Type II of statistical error and noise to signal ratio. The noise to signal ratio is obtained by
dividing false signals measured as a proportion of periods in which false signals could have
been issued, by good signals measured as a proportion of periods in which good signals could
have been issued (Kaminsky, 1998). As a guideline, the lower the noise to signal ratio then
the better the indicator.
Type I error = α = P(reject H0|H0 is true) = C/(A+C)
Type II error = β = P(not reject H0|H0 is false) = B/(B+D)
Noise to signal ratio = ( )
( )
An indicator is defined to be a leading indicator of crisis if it has a noise to signal ratio
not greater than 1 (Chui, 2002). Meanwhile, the threshold of crisis is determined by
minimizing α and β or, in other words, has the smallest noise to signal ratio.
On the other hand, discrete method (a parametric approach) evaluates the conditional
probability of a crisis. If y is defined as a variable of crisis (1 if the crisis occurred and 0
Page 7
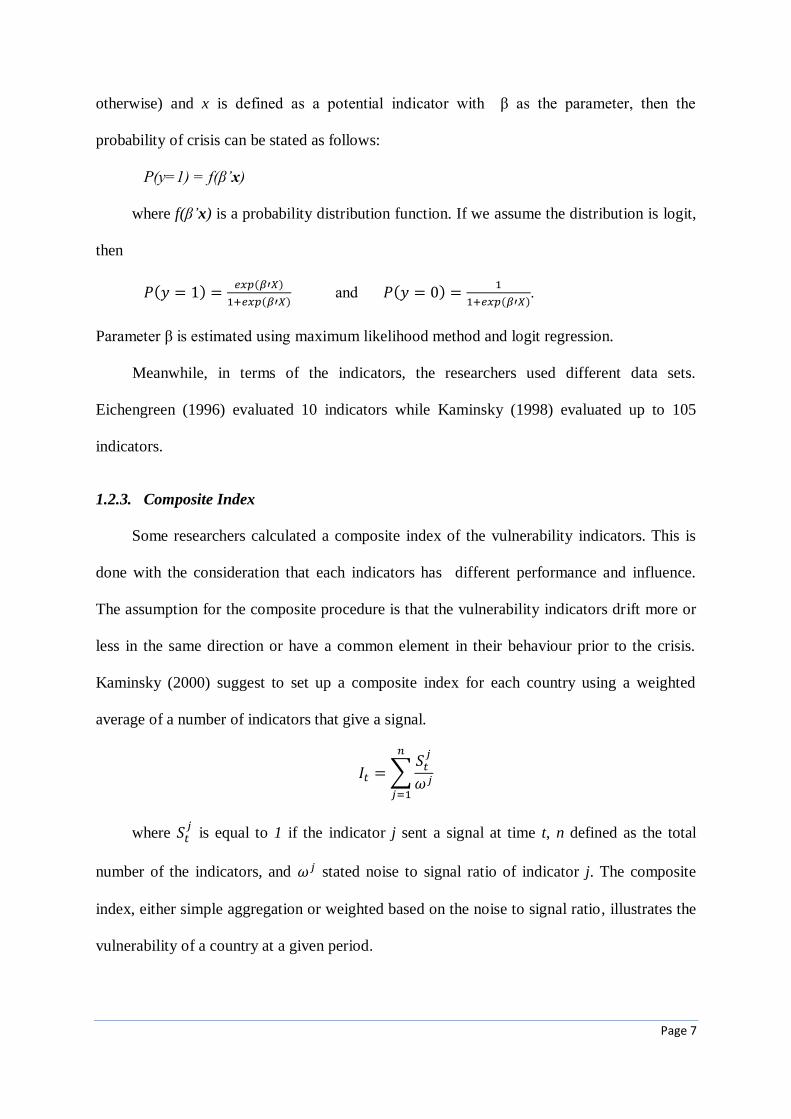
otherwise) and x is defined as a potential indicator with β as the parameter, then the
probability of crisis can be stated as follows:
P(y=1) = f(β’x)
where f(β’x) is a probability distribution function. If we assume the distribution is logit,
then
( ) ( )
( ) and ( )
( ).
Parameter β is estimated using maximum likelihood method and logit regression.
Meanwhile, in terms of the indicators, the researchers used different data sets.
Eichengreen (1996) evaluated 10 indicators while Kaminsky (1998) evaluated up to 105
indicators.
1.2.3. Composite Index
Some researchers calculated a composite index of the vulnerability indicators. This is
done with the consideration that each indicators has different performance and influence.
The assumption for the composite procedure is that the vulnerability indicators drift more or
less in the same direction or have a common element in their behaviour prior to the crisis.
Kaminsky (2000) suggest to set up a composite index for each country using a weighted
average of a number of indicators that give a signal.
∑
where is equal to 1 if the indicator j sent a signal at time t, n defined as the total
number of the indicators, and stated noise to signal ratio of indicator j. The composite
index, either simple aggregation or weighted based on the noise to signal ratio, illustrates the
vulnerability of a country at a given period.

Page 8
The OECD also developed a composite indexing methodologies in order to construct a
composite leading indicators. Since each indicator has different scale of measurement, then
the indicators should be normalized before aggregated into one composite index.
Normalization is done by reducing each observation with their average and dividing by the
mean absolute deviation for each indicators. Then the result added with 100 for each data.
Finally, each indicators multiplied by their respective weights to obtain aggregate value and
created the index.
2. METHODOLOGY
Earlier research on Indonesia’s external vulnerability indicators was conducted by
Majardi (2009). The vulnerability indicators were selected by using panel data of 151
developing countries members of the IMF. However, it is considered that the use of 151
countries as samples is less vigorous because not all those countries have a significant
economic relationship with Indonesia. Therefore, this study only used 31 countries (including
Indonesia) as a sample.
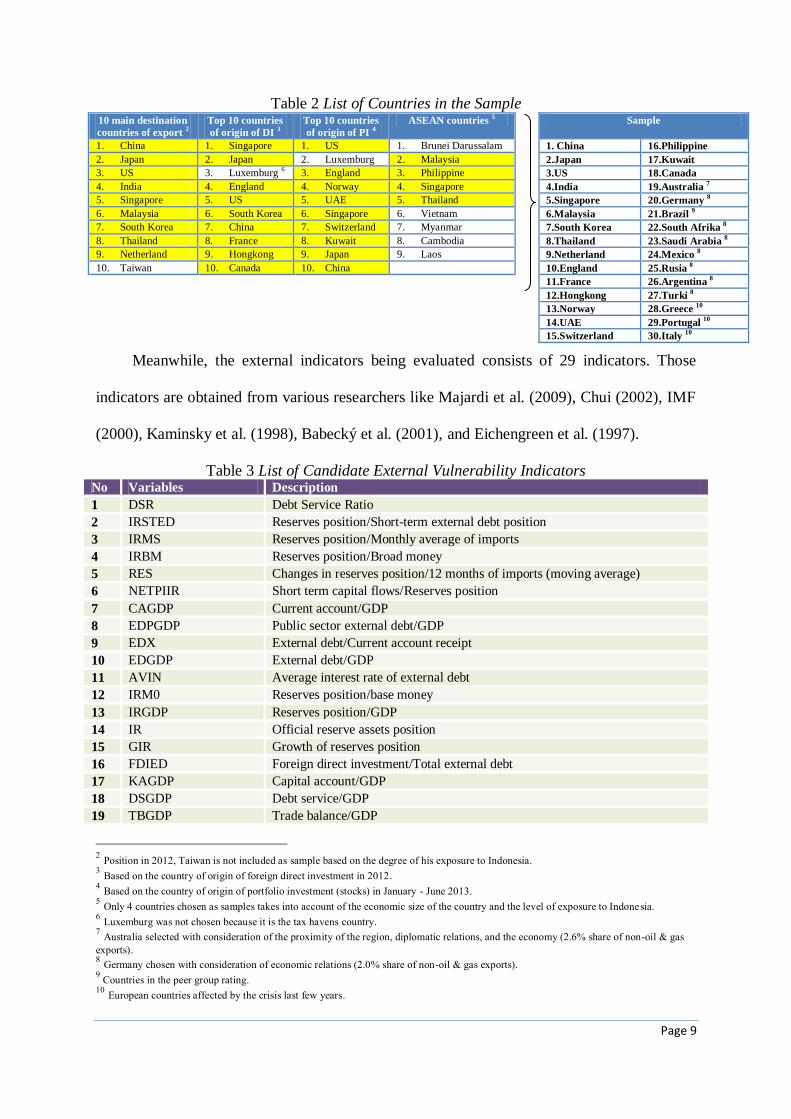
Reduction in number of countries in the sample is conducted by considering that
contagious effect will have significant impact if the crisis comes from close ties countries,
both in terms of exports and investment transactions. Other reasons behind the reduction are
to give more focus on the countries in the region and the availability of data. Country sample
is selected based on main destination countries of Indonesia's exports, countries of origin of
the foreign direct investment and portfolio investment, countries in the ASEAN region,
emerging countries in the same peer group rating, and the European countries affected by the
recent crisis.
Page 9
Table 2 List of Countries in the Sample 10 main destination
countries of export 2
Top 10 countries
of origin of DI 3
Top 10 countries
of origin of PI 4
ASEAN countries 5 Sample
1. China 1. Singapore 1. US 1. Brunei Darussalam 1. China 16.Philippine
2. Japan 2. Japan 2. Luxemburg 2. Malaysia 2.Japan 17.Kuwait
3. US 3. Luxemburg 6 3. England 3. Philippine 3.US 18.Canada
4. India 4. England 4. Norway 4. Singapore 4.India 19.Australia 7
5. Singapore 5. US 5. UAE 5. Thailand 5.Singapore 20.Germany 8
6. Malaysia 6. South Korea 6. Singapore 6. Vietnam 6.Malaysia 21.Brazil 9
7. South Korea 7. China 7. Switzerland 7. Myanmar 7.South Korea 22.South Afrika 8
8. Thailand 8. France 8. Kuwait 8. Cambodia 8.Thailand 23.Saudi Arabia 8
9. Netherland 9. Hongkong 9. Japan 9. Laos 9.Netherland 24.Mexico 8
10. Taiwan 10. Canada 10. China 10.England 25.Rusia 8
11.France 26.Argentina 8
12.Hongkong 27.Turki 8
13.Norway 28.Greece 10
14.UAE 29.Portugal 10
15.Switzerland 30.Italy 10
Meanwhile, the external indicators being evaluated consists of 29 indicators. Those
indicators are obtained from various researchers like Majardi et al. (2009), Chui (2002), IMF
(2000), Kaminsky et al. (1998), Babecký et al. (2001), and Eichengreen et al. (1997).
Table 3 List of Candidate External Vulnerability Indicators No Variables Description
1 DSR Debt Service Ratio
2 IRSTED Reserves position/Short-term external debt position
3 IRMS Reserves position/Monthly average of imports
4 IRBM Reserves position/Broad money
5 RES Changes in reserves position/12 months of imports (moving average)
6 NETPIIR Short term capital flows/Reserves position
7 CAGDP Current account/GDP
8 EDPGDP Public sector external debt/GDP
9 EDX External debt/Current account receipt
10 EDGDP External debt/GDP
11 AVIN Average interest rate of external debt
12 IRM0 Reserves position/base money
13 IRGDP Reserves position/GDP
14 IR Official reserve assets position
15 GIR Growth of reserves position
16 FDIED Foreign direct investment/Total external debt
17 KAGDP Capital account/GDP
18 DSGDP Debt service/GDP
19 TBGDP Trade balance/GDP
2 Position in 2012, Taiwan is not included as sample based on the degree of his exposure to Indonesia. 3 Based on the country of origin of foreign direct investment in 2012. 4 Based on the country of origin of portfolio investment (stocks) in January - June 2013. 5 Only 4 countries chosen as samples takes into account of the economic size of the country and the level of exposure to Indonesia. 6 Luxemburg was not chosen because it is the tax havens country. 7 Australia selected with consideration of the proximity of the region, diplomatic relations, and the economy (2.6% share of non-oil & gas
exports). 8 Germany chosen with consideration of economic relations (2.0% share of non-oil & gas exports). 9 Countries in the peer group rating.
10 European countries affected by the crisis last few years.
Page 10
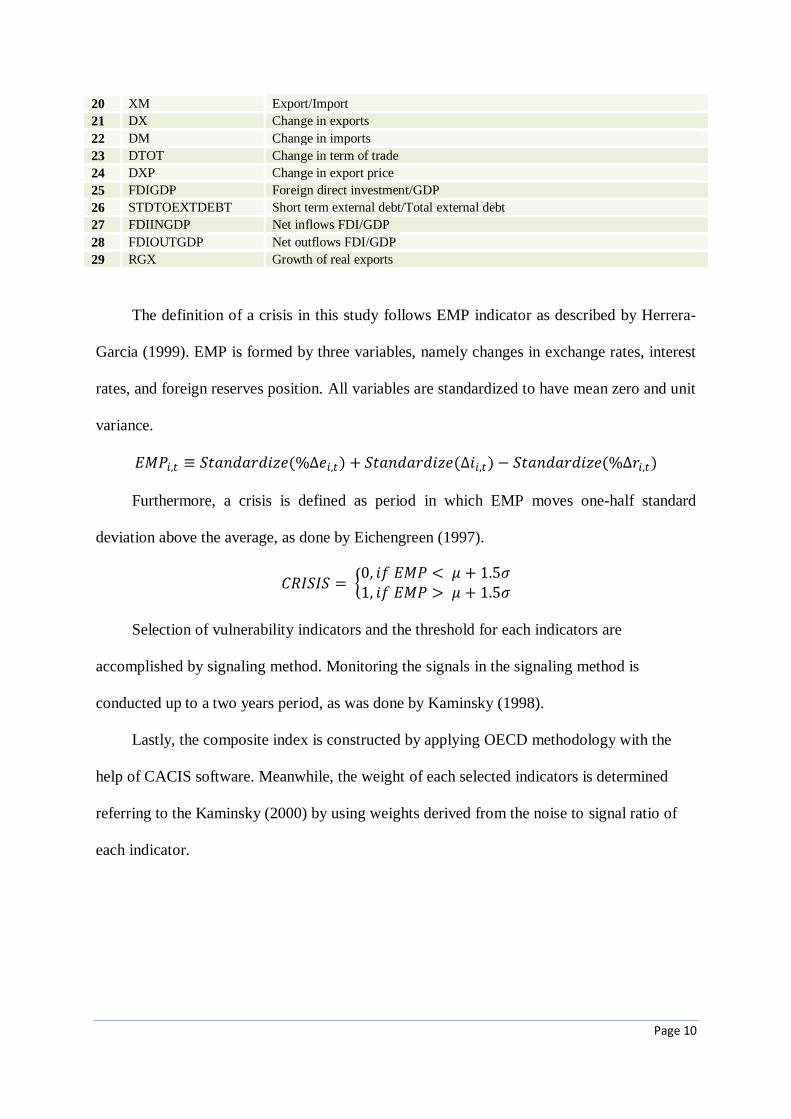
20 XM Export/Import
21 DX Change in exports
22 DM Change in imports
23 DTOT Change in term of trade
24 DXP Change in export price
25 FDIGDP Foreign direct investment/GDP
26 STDTOEXTDEBT Short term external debt/Total external debt
27 FDIINGDP Net inflows FDI/GDP
28 FDIOUTGDP Net outflows FDI/GDP
29 RGX Growth of real exports
The definition of a crisis in this study follows EMP indicator as described by Herrera-
Garcia (1999). EMP is formed by three variables, namely changes in exchange rates, interest
rates, and foreign reserves position. All variables are standardized to have mean zero and unit
variance.
( ) ( ) ( )
Furthermore, a crisis is defined as period in which EMP moves one-half standard
deviation above the average, as done by Eichengreen (1997).
{
Selection of vulnerability indicators and the threshold for each indicators are
accomplished by signaling method. Monitoring the signals in the signaling method is
conducted up to a two years period, as was done by Kaminsky (1998).
Lastly, the composite index is constructed by applying OECD methodology with the
help of CACIS software. Meanwhile, the weight of each selected indicators is determined
referring to the Kaminsky (2000) by using weights derived from the noise to signal ratio of
each indicator.

Page 11
Diagram 1 Construction of Indonesia's External Vulnerability Indicators
3. EMPIRICAL RESULTS
3.1. DEFINITION OF CRISIS
The data are collected from 31 countries, including Indonesia, on a quarterly basis. The
sample period is 1980Q1 to 2013Q2. The first step of this research is determining the crisis
periods by using EMP. The EMP is calculated to capture the high pressure periods on the
exchange rates. In other words, the EMP is used to capture the level of vulnerability in each
Using the OECD
methodology
Determining the Leading Period
Selected Indicators Using the noise to
signal ratio as weights for each
selected indicator Determining the
Threshold Constructing the Composite Index
Threshold is
determined based on
the smallest noise to
signal ratio
Selecting Vulnerability
Indicators
The selection of indicators is done by the
signaling method, the indicator with a good
signal of crisis will be selected
The threshold for crisis
using 1.5 SD + Mean
(Eichengreen, 1997) Determining Crisis
Period for 31 Countries
Collecting the Potential
Indicators
Calculating EMP for 31
Countries
Based on Literatures
Using the formula
EMP = f(exchange rate, interest
rate, foreign reserve position)
Data Collection
Signaling Method
Threshold for Each Selected Indicators
Page 12
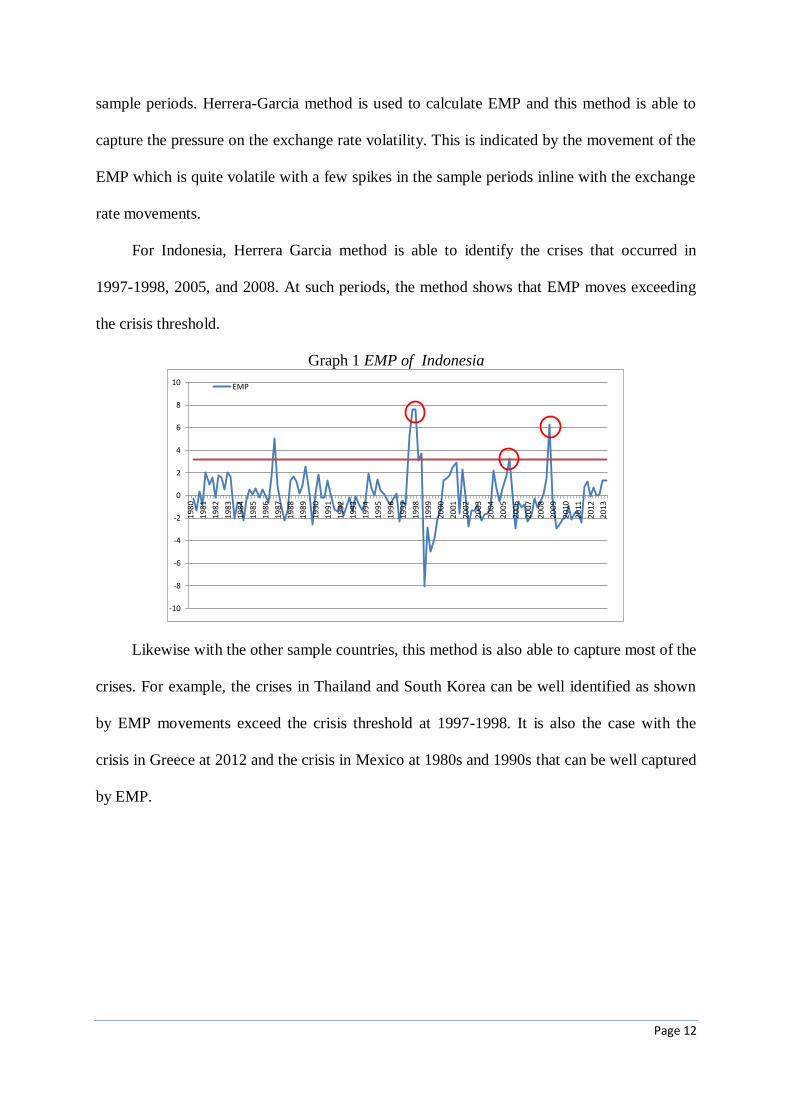
sample periods. Herrera-Garcia method is used to calculate EMP and this method is able to
capture the pressure on the exchange rate volatility. This is indicated by the movement of the
EMP which is quite volatile with a few spikes in the sample periods inline with the exchange
rate movements.
For Indonesia, Herrera Garcia method is able to identify the crises that occurred in
1997-1998, 2005, and 2008. At such periods, the method shows that EMP moves exceeding
the crisis threshold.
Graph 1 EMP of Indonesia
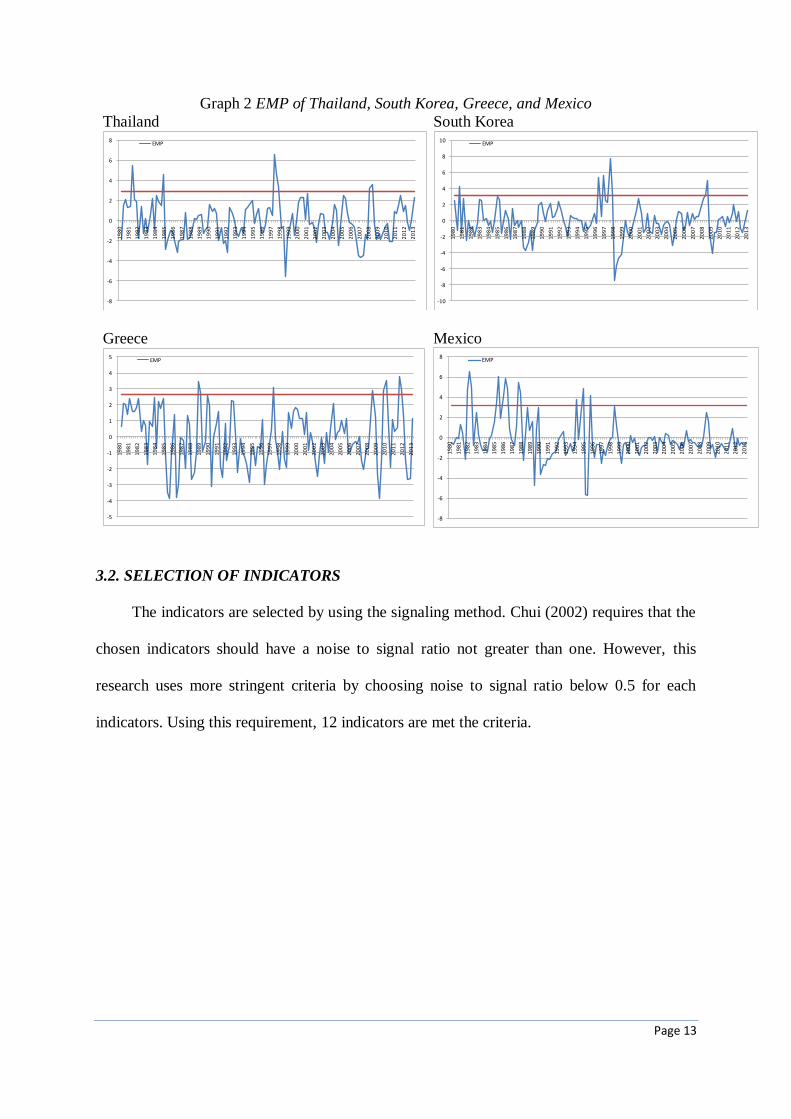
Likewise with the other sample countries, this method is also able to capture most of the
crises. For example, the crises in Thailand and South Korea can be well identified as shown
by EMP movements exceed the crisis threshold at 1997-1998. It is also the case with the
crisis in Greece at 2012 and the crisis in Mexico at 1980s and 1990s that can be well captured
by EMP.
-10
-8
-6
-4
-2
0
2
4
6
8
10
19
80
19
81
19
82
19
83
19
84
19
85
19
86
19
87
19
88
19
89
19
90
19
91
19
92
19
93
19
94
19
95
19
96
19
97
19
98
19
99
20
00
20
01
20
02
20
03
20
04
20
05
20
06
20
07
20
08
20
09
20
10
20
11
20
12
20
13
EMP
Page 13
Graph 2 EMP of Thailand, South Korea, Greece, and Mexico
Thailand
South Korea
Greece
Mexico
3.2. SELECTION OF INDICATORS
The indicators are selected by using the signaling method. Chui (2002) requires that the
chosen indicators should have a noise to signal ratio not greater than one. However, this
research uses more stringent criteria by choosing noise to signal ratio below 0.5 for each
indicators. Using this requirement, 12 indicators are met the criteria.
-8
-6
-4
-2
0
2
4
6
8
19
80
19
81
19
82
19
83
19
84
19
85
19
86
19
87
19
88
19
89
19
90
19
91
19
92
19
93
19
94
19
95
19
96
19
97
19
98
19
99
20
00
20
01
20
02
20
03
20
04
20
05
20
06
20
07
20
08
20
09
20
10
20
11
20
12
20
13
EMP
-10
-8
-6
-4
-2
0
2
4
6
8
10
19
80
19
81
19
82
19
83
19
84
19
85
19
86
19
87
19
88
19
89
19
90
19
91
19
92
19
93
19
94
19
95
19
96
19
97
19
98
19
99
20
00
20
01
20
02
20
03
20
04
20
05
20
06
20
07
20
08
20
09
20
10
20
11
20
12
20
13
EMP
-5
-4
-3
-2
-1
0
1
2
3
4
5
19
80
19
81
19
82
19
83
19
84
19
85
19
86
19
87
19
88
19
89
19
90
19
91
19
92
19
93
19
94
19
95
19
96
19
97
19
98
19
99
20
00
20
01
20
02
20
03
20
04
20
05
20
06
20
07
20
08
20
09
20
10
20
11
20
12
20
13
EMP
-8
-6
-4
-2
0
2
4
6
8
19
80
19
81
19
82
19
83
19
84
19
85
19
86
19
87
19
88
19
89
19
90
19
91
19
92
19
93
19
94
19
95
19
96
19
97
19
98
19
99
20
00
20
01
20
02
20
03
20
04
20
05
20
06
20
07
20
08
20
09
20
10
20
11
20
12
20
13
EMP

Page 14
Table 4 The Smallest Noise to Signal Ratio for Each Potential Indicators
No Indicators The Smallest Noise
to Signal Ratio No Indicators
The Smallest Noise
to Signal Ratio
1 DSR 0.30 16 FDIED 0.70
2 IRSTED 0.46 17 KAGDP 0.60
3 IRMS 0.38 18 DSGDP 0.78
4 IRBM 0.42 19 TBGDP 0.38
5 RES 0.35 20 XM 0.61
6 NETPIIR 0.13 21 DX 0.52
7 CAGDP 0.09 22 DM 0.52
8 EDPGDP 0.98 23 DTOT 0.70
9 EDX 0.47 24 DXP 0.55
10 EDGDP 0.48 25 FDIGDP 0.19
11 AVIN 0.78 26 STDTOEXTDEBT 0.04
12 IRM0 0.61 27 FDIINGDP 1.58
13 IRGDP 0.87 28 FDIOUTGDP 2.28
14 IR 0.70 29 RGX 0.97
15 GIR 0.56
From the result above, in order to complete the monitoring analysis , threshold for each
indicator is determined. Each indicator is divided into four stages of pressure, namely normal,
alert, cautious, and suspected to crisis. The suspected crisis area is determined from the
standard deviation which gives the smallest noise to signal ratio.
Table 5 Threshold for Selected External Vulnerability Indicators
No Variables Threshold
Alert Cautious Suspected Crisis
1 DSR 31.62 38.26 44.90
2 STDTOEXTDEBT 18.91 19.83 20.76
3 EDX 170.68 214.86 259.03
4 EDGDP 51.10 60.42 79.07
5 IRMS 4.39 3.82 3.25
6 IRBM 27.69 24.69 21.68
7 IRSTED 149.97 128.37 106.78
8 RES -37.56 -50.60 -63.63
9 CAGDP -1.42 -2.26 -3.10
10 TBGDP -0.16 -1.17 -2.18
11 FDIGDP -0.16 -0.37 -0.58
12 NETPIIR -2.15 -3.41 -4.66

Page 15
Furthermore, the thresholds of alert and cautious area are determined arbitrarily by a
margin of 0.25 standard deviations from the threshold of suspected to crisis. For example, if
the threshold for IRMS is obtained from the average plus one standard deviation, then the
alert threshold is obtained from the average plus 1.25 standard deviation and the cautious
threshold is derived from the average plus 1.5 standard deviations. The normal area is
marked with green colour, alert area is in yellow, cautious area is in pink, and suspected to
crisis area is in red. Graph for each selected indicators and their threshold can be found in the
Appendix. The threshold resulted by this research are not too different when compared with
the results obtained by other researchers.
Table 6 Threshold for Selected Indicators by Other Researchers EDGDP EDX DSR CAGDP
Alert Cautios Crisis Alert Cautios Crisis Alert Cautios Crisis Alert Cautios Crisis
Present Research 51.1 60.4 79.1 170.7 214.9 259.0 31.6 38.3 44.9 -1.4 -2.3 -3.1
Majardi (2009) 50.2 55.6 86.3 150.5 189.4 215.4 27.8 36.4 43.5 -1.5 -2.4 -3.1
IMF (2000) 50.0 200.0
Chang (2007) 66.6
Kappagoda 30.0 40.0 50.0 100.0 150.0 200.0
Reinhart (2010) 60.0 90.0
Greene (2010) 50.0 80.0 120-150 200-250
Reinhart (2003) 60.0 150.0
Maastricht Criteria
UN-ESCAP 48.0 48-80 80.0 132.0 132-220 220.0 18.0 18-30 30.0
CAA 70.0 150.0 20.0
Deutsche Bank -3.0
IRSTED IRMS IRBM STDTOEXTDEBT
Alert Cautios Crisis Alert Cautios Crisis Alert Cautios Crisis Alert Cautios Crisis
Present Research 150.0 128.4 106.8 4.4 3.8 3.2 27.7 24.7 21.7 18.9 19.8 20.8
Majardi (2009) 180.7 110.0 68.0 4.3 3.8 3.5 28.1 20.0 15.7
Calafell (2003) 100.0
Mishev (2010) 100.0 3.0 20.0
RES TBGDP FDIGDP NETPIIR
Alert Cautios Crisis Alert Cautios Crisis Alert Cautios Crisis Alert Cautios Crisis
Present Research -37.6 -50.6 -63.6 -0.2 -1.2 -2.2 -0.2 -0.4 -0.6 -2.2 -3.4 -4.7
Majardi (2009) -43.0 -66.0 -88.0

Page 16
Next, to answer the question whether the selected external vulnerability indicators are
capable to providing an early warning to the crisis, the performance of these indicators is
evaluated at some period of crisis, i.e. 1997-1998 crisis, 2005 crisis, and the global crisis of
2008.
In the 1997-1998 crisis, external vulnerability indicators have shown abnormality
condition. This is reflected by four liquidity indicators, namely DSR, IRSTED, IRMS, and
IRBM, that lie outside the normal area, even up to several periods before the crisis.
Furthermore, the other liquidity indicators (RES, FDIGDP, and NETPIIR) moved beyond the
suspected crisis threshold in 1997Q4. This problem was mainly driven by the low foreign
exchange reserves and high external debt position.
In the other side, Indonesia also faced a solvency problem as reflected by four solvency
indicators (CAGDP, EDX, EDGDP, and STDTOEXTDEBT) that lie outside the normal area
for several periods. Current account deficit and the external debt position which higher than
the ability to pay were the cause of this solvency problems.
Thus, it can be concluded that Indonesia’s external sector in the period, even starting
from some previous period, is already vulnerable. In such circumstances, it is only waiting
for a trigger factor for a crisis to occur. The trigger then came from the depreciation of Bath
which later affected the Indonesian economy.
Table 7 Heat Map for external vulnerability indicators during the crisis period 1997-1998 INDICATORS 1996Q3 1996Q4 1997Q1 1997Q2 1997Q3 1997Q4 1998Q1 1998Q2 1998Q3 1998Q4
DSR 10.81 10.56 37.39 35.02 34.93 64.18 56.20 47.22 56.86 58.75
IRSTED 48.16 55.94 57.35 61.34 61.08 51.46 50.52 58.81 66.44 77.69
IRMS 3.42 3.90 3.90 4.13 4.04 3.32 3.41 4.15 4.98 6.41
IRBM 14.87 15.62 16.20 16.57 17.68 19.33 33.92 33.95 45.80 32.53
RES -1.98 56.11 13.70 25.09 -1.70 -72.40 -16.06 47.66 41.53 82.90
FDIGDP 2.80 2.50 3.84 2.07 2.34 -0.76 -2.18 1.69 -0.67 0.12
NETPIIR 3.81 11.04 5.05 5.18 3.05 -30.98 -21.36 9.80 0.52 -1.18
CAGDP -3.60 -1.55 -3.59 -1.80 -2.34 -0.47 4.34 3.08 7.84 2.31
TBGDP 2.29 4.10 2.36 5.68 3.66 6.96 20.92 22.84 23.76 10.99
EDX 314.12 307.61 300.19 289.72 282.01 272.83 270.46 280.24 281.76 297.09
EDGDP 82.11 79.26 77.47 75.74 75.72 80.30 94.88 120.80 160.20 175.68
STDTOEXTDEBT 19.08 19.01 19.00 18.87 18.81 18.74 18.57 17.96 17.63 17.50
Page 17
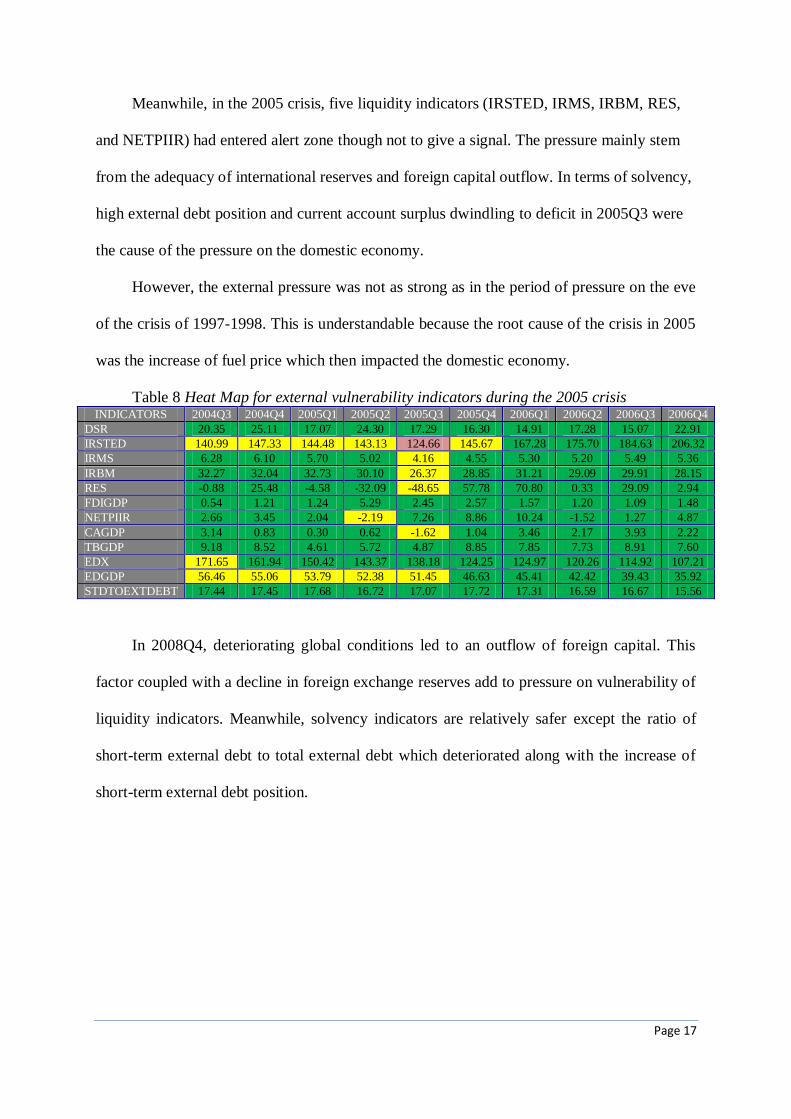
Meanwhile, in the 2005 crisis, five liquidity indicators (IRSTED, IRMS, IRBM, RES,
and NETPIIR) had entered alert zone though not to give a signal. The pressure mainly stem
from the adequacy of international reserves and foreign capital outflow. In terms of solvency,
high external debt position and current account surplus dwindling to deficit in 2005Q3 were
the cause of the pressure on the domestic economy.
However, the external pressure was not as strong as in the period of pressure on the eve
of the crisis of 1997-1998. This is understandable because the root cause of the crisis in 2005
was the increase of fuel price which then impacted the domestic economy.
Table 8 Heat Map for external vulnerability indicators during the 2005 crisis INDICATORS 2004Q3 2004Q4 2005Q1 2005Q2 2005Q3 2005Q4 2006Q1 2006Q2 2006Q3 2006Q4
DSR 20.35 25.11 17.07 24.30 17.29 16.30 14.91 17.28 15.07 22.91
IRSTED 140.99 147.33 144.48 143.13 124.66 145.67 167.28 175.70 184.63 206.32
IRMS 6.28 6.10 5.70 5.02 4.16 4.55 5.30 5.20 5.49 5.36
IRBM 32.27 32.04 32.73 30.10 26.37 28.85 31.21 29.09 29.91 28.15
RES -0.88 25.48 -4.58 -32.09 -48.65 57.78 70.80 0.33 29.09 2.94
FDIGDP 0.54 1.21 1.24 5.29 2.45 2.57 1.57 1.20 1.09 1.48
NETPIIR 2.66 3.45 2.04 -2.19 7.26 8.86 10.24 -1.52 1.27 4.87
CAGDP 3.14 0.83 0.30 0.62 -1.62 1.04 3.46 2.17 3.93 2.22
TBGDP 9.18 8.52 4.61 5.72 4.87 8.85 7.85 7.73 8.91 7.60
EDX 171.65 161.94 150.42 143.37 138.18 124.25 124.97 120.26 114.92 107.21
EDGDP 56.46 55.06 53.79 52.38 51.45 46.63 45.41 42.42 39.43 35.92
STDTOEXTDEBT 17.44 17.45 17.68 16.72 17.07 17.72 17.31 16.59 16.67 15.56
In 2008Q4, deteriorating global conditions led to an outflow of foreign capital. This
factor coupled with a decline in foreign exchange reserves add to pressure on vulnerability of
liquidity indicators. Meanwhile, solvency indicators are relatively safer except the ratio of
short-term external debt to total external debt which deteriorated along with the increase of
short-term external debt position.

Page 18
Table 9 Heat Map for external vulnerability indicators during the 2008 crisis INDICATORS 2007Q3 2007Q4 2008Q1 2008Q2 2008Q3 2008Q4 2009Q1 2009Q2 2009Q3 2009Q4
DSR 13.99 20.19 15.09 16.74 13.60 24.56 20.98 23.42 17.40 22.59
IRSTED 225.44 207.03 206.20 207.70 203.61 174.98 202.52 203.95 198.65 208.71
IRMS 5.97 6.23 5.99 5.48 4.85 4.28 4.92 5.71 6.70 7.11
IRBM 32.32 31.99 34.25 32.34 29.61 30.04 33.28 30.66 30.86 29.24
RES 22.03 44.29 20.97 4.29 -19.90 -45.28 28.71 27.15 50.66 41.05
FDIGDP 1.94 2.34 1.96 1.23 2.34 1.65 1.68 1.10 0.68 0.35
NETPIIR 3.26 -0.77 4.76 6.94 0.22 -7.75 3.31 2.66 5.30 5.79
CAGDP 1.90 3.02 2.28 -0.76 -0.67 -0.54 2.37 1.80 1.22 2.47
TBGDP 6.62 8.29 6.26 4.10 3.98 3.55 5.34 5.69 4.75 6.82
EDX 102.17 100.29 99.83 94.87 90.41 93.54 98.07 107.08 123.44 121.77
EDGDP 32.70 32.21 32.82 31.40 29.68 30.08 29.69 30.29 33.03 31.76
STDTOEXTDEBT 17.02 19.47 19.11 18.98 18.46 19.03 17.94 18.36 18.67 18.32
The analysis of external vulnerability indicators during crisis periods in Indonesia has
shown that the resulting vulnerability indicator may give a warning or signal before the crisis
occurred. Thus, the twelve selected indicators have been able to describe the level of
vulnerability of external sector and can be used as a monitoring and early warning system to
predict the crisis.
3.3. COMPOSITE INDEX
The composite index is calculated using weights based on the noise to signal ratio for
each selected indicator. This research used the OECD methodology to obtain external
vulnerability index (EVI). The index is aggregated from external vulnerability index, so it can
be used to show the vulnerability of the external sector in general.
Graph 3 External Vulnerability Index vs EMP
-10
-8
-6
-4
-2
0
2
4
6
8
10
90
92
94
96
98
100
102
104
106
108
110
112
19
81
19
82
19
83
19
84
19
85
19
86
19
87
19
88
19
89
19
90
19
91
19
92
19
93
19
94
19
95
19
96
19
97
19
98
19
99
20
00
20
01
20
02
20
03
20
04
20
05
20
06
20
07
20
08
20
09
20
10
20
11
20
12
20
13
EVI
EVI EMP

Page 19
The result of EVI is shown in Graph 3. In general, EVI movements cointegrated with
EMP. This graph also supported by low noise to signal ratio, amounting to 0.1. Thus, EVI is
able to send a good signal to detect the occurance of crisis in the next two years and can be
used as leading indicator for EMP.
Furthermore, the noise to signal ratio also provides information about suspected crisis
threshold. In this case, the smallest noise to signal ratio is obtained by using the threshold of
1.25 standard deviations above the average. The other thresholds will be determined using the
difference of 0.25 standard deviations from suspected crisis threshold. Because EVI
movements and crisis are unidirectional, then the higher EVI means external vulnerability
increases. So the level of cautious and alert must be placed below the suspected crisis
threshold. Thus, the cautious threshold is determined by 1 standard deviation above the
average and the alert threshold is determined by 0.75 standard deviation above the average.
Table 10 Threshold and Noise to Signal Ratio for External Vulnerability Index
No Variables Threshold
Noise to signal ratio Alert Cautious Suspected Crisis
1 EVI 100.39 101.18 101.96 0.1
From the results, it appears that EVI is able to identify the pressure in 1997-1998, 2005,
and 2008. In 1997-1998, EVI send a signal before the crisis occured. It can be seen from the
EVI movement through the suspected crisis area. EVI movements also indicated the pressure
from external sector when the crisis occured in 2005, although not to exceed the suspected
crisis threshold.

Page 20
Graph 4 External Vulnerability Index
4. CONCLUSION
This study evaluates a number of external indicators with the aim to establish an early
warning system of crisis from external side. The data used in this study are obtained from the
30 countries that have close ties with Indonesia, both from an economic standpoint or in
terms of regionality and peer group ratings.
By using the signaling method, this research finds 12 indicators that need to be
monitored on a regular basis in order to identify the pressures of the external sector. With
these twelve indicators then a composite index of external vulnerability (EVI) is constructed
in order to capture the level of pressure in the external sector as a whole. The threshold for
composite index has been tested for its ability to provide a signal through the events prior to
crises (1998, 2005, and 2008).
The twelve indicators coupled with the composite index are also feasible to predict the
crisis. The signal issued by one of the external vulnerability indicators is a sign of increased
external vulnerability for two years ahead.
96
98
100
102
104
106
108
110
1990 1991 1992 1993 1994 1995 1996 1997 1998 1999 2000 2001 2002 2003 2004 2005 2006 2007 2008 2009 2010 2011 2012 2013
indeks EVI

Page 21
References
Adiningsih, Sri, Dini N. Setiawati, and Solihah (2002). “Macroeconomic Vulnerability in
Indonesia”. East Asian Development Network, EADN RP 2-3.
Babecký, Jan, Tomáš Havránek, Jakub Matějů, Marek Rusnák, Kateřina Šmídková, and
Bořek Vašíček (2011). “Early Warning Indicators of Economic Crises: Evidence from a
Panel of 40 Developed Countries”. Working Paper Series, Czech National Bank.
Calafell, J. G. and R. P. Bosque (2003). “The Ratio of International Reserves to Short Term
External Debt as an Indicator of External Vulnerability: Some Lessons from the
Experience of Mexico and Other Eemerging Economies”. G4 Occasional Paper Series,
No. G-24.
Chang, Tsangyao and Chiang Gengnam (2007). “Threshold of Debt to GDP Ratio on GDP
per Capita with Panel Threshold Regression Model – The Case of OECD Countries”.
Chui, Michael (2002). “Leading Indicator of Balance of Payments Crises: a Partial Review”.
Working Paper no. 171, Bank of England.
Dabrowski, Merek (2001) “The Episodes of Currency Crisis in Latin American and Asian
Economies”. Censter for Social and Economic Research, Case Reports, No. 39,
Warsaw, 2001.
Deutsche Bank Report (2011). “Macroeconomic Coordination”. EU Monitor 78.
Eichengreen, Barry, Andrew Rose, Charles Wyplosz (1993).”The Unstable EMS”. Brooking
Papers on Economic Activity, Vol. 1.
Eichengreen, Barry, Andrew Rose, Charles Wyplosz (1996).”Contagious Currency Crises”.
NBER. Working Paper, No. 5681.
European Monetary Institute (1996). “Progress Towards Convergence 1996”.
Greene, Joshua (2010). “Fiscal and External Sustainability: Concepts & Examples”.

Page 22
Herrera, Santiago and Conrado Garcia (1999). “User’s Guide to an Early Warning System for
Macroeconomic Vulnerability in Latin American Countries”. World Bank Working
Paper, November.
IMF (2000). “Debt- and Reserve- Related Indicators of External Vulnerability”. Prepared by
the Policy Development and Review Deaprtment in conculation with other
Departments.
Kappagoda, Nihal (2007). “Debt Sustainability Framework for Low Income Countries”.
Paper presented at the Workshop on Debt, Finance and Emerging Issues in Financial
Integration, London, March 6-7, 2007.
Kaminsky, Graciela (2000). “Currency and Banking Crises: The Early Warnings of Distress”.
George Washington University, Washintong, D.C.
Kaminsky, Graciela, Saul Lizondo, Carmen M. Reinhart (1998). “Leading Indicators of
Currency Crises”. IMF Staff Papers, Vol. 45, No. 1 (March 1998).
Krugman, Paul (1979). “A Model of Balance of Payments Crises”. Journal of Money, Credit
and Banking 11, 311–25.
Krugman, Paul (1999). “Balance Sheets, the Transfer Problem, and Financial Crises”.
International tax and Public Finance, 6, 459-472.
Majardi, Fadjar, Ayi Supriyadi, Doddy Zulverdi, and Pujiastuti (2009). “Research and
Management of External Vulnerability Indicators”. Balance of Payment Bureau,
Directorate of Economic and Monetary statistics, Bank Indonesia.
Mishev, Risto Hadzi (2010). “Information of the Exchange rate Stability in 2010”.
Obstfelt, Maurice (1994). “The Logic of Currency Crisis”. Cahiers economiques et
monetaires no.43, Banque de Frence.
OECD (2008). “Handbook on Constructing Composite Indicators: METHODOLOGY AND
USER GUIDE”.

Page 23
OECD (2010). “OECD Cyclical Analysis and Composite Indicators System (CACIS) User’s
Guide”.
OECD (2012). “OECD System of Composite Leading Indicators”.
Reinhart, Carmen M, Keneth S. Rogoff, Miguel A. Savastano (2003). “Debt Intolerance”.
Sachs, Jeffrey D., Aaron Tornell, Andres Velasco (1996). “Financial Crises in Emerging
Markets: The Lessons from 1995”. Brookings Paper on Economic Activity, 1:1996.
Simorangkir, Iskandar (2012). “An Assessment of Early Warning Indicators of Bank Runs in
Indonesia: a Markov-Switching Approach”. Working Paper Bank Indonesia No.
WP/01/2012.
Supriyadi, Ayi (2011). “Development of External Vulnerability Indicators”. Balance of
Payments Bureau, Directorate of Economic and Monetary Statistics, Bank Indonesia.
The Autonomous Sinking Fund of Cameroon (CAA), “Evolution of the Public Debt Service
Ration”, http://www.caa.cm/EN/Debt_service_ratio.html.
United Nations-Economic and Social Comission for Asia and Pacific (UN-ESCAP) (2006).
“Manual on Effective Debt Management”.
Related Documents