Can Leading Indicators Assess Country Vulnerability? Evidence from the 2008-09 Global Financial Crisis (Article begins on next page) The Harvard community has made this article openly available. Please share how this access benefits you. Your story matters. Citation Frankel, Jeffrey A., and George Saravelos. 2011. Can Leading Indicators Assess Country Vulnerability? Evidence from the 2008- 09 Global Financial Crisis. HKS Faculty Research Working Paper Series RWP11-024,John F. Kennedy School of Government, Harvard University Published Version http://web.hks.harvard.edu/publications/workingpapers/citation.asp x?PubId=7865 Accessed April 11, 2016 12:12:27 AM EDT Citable Link http://nrs.harvard.edu/urn-3:HUL.InstRepos:5027952 Terms of Use This article was downloaded from Harvard University's DASH repository, and is made available under the terms and conditions applicable to Other Posted Material, as set forth at http://nrs.harvard.edu/urn-3:HUL.InstRepos:dash.current.terms-of- use#LAA

Welcome message from author
This document is posted to help you gain knowledge. Please leave a comment to let me know what you think about it! Share it to your friends and learn new things together.
Transcript

Can Leading Indicators Assess Country Vulnerability? Evidencefrom the 2008-09 Global Financial Crisis
(Article begins on next page)
The Harvard community has made this article openly available.Please share how this access benefits you. Your story matters.
Citation Frankel, Jeffrey A., and George Saravelos. 2011. Can LeadingIndicators Assess Country Vulnerability? Evidence from the 2008-09 Global Financial Crisis. HKS Faculty Research Working PaperSeries RWP11-024,John F. Kennedy School of Government,Harvard University
Published Version http://web.hks.harvard.edu/publications/workingpapers/citation.aspx?PubId=7865
Accessed April 11, 2016 12:12:27 AM EDT
Citable Link http://nrs.harvard.edu/urn-3:HUL.InstRepos:5027952
Terms of Use This article was downloaded from Harvard University's DASHrepository, and is made available under the terms and conditionsapplicable to Other Posted Material, as set forth athttp://nrs.harvard.edu/urn-3:HUL.InstRepos:dash.current.terms-of-use#LAA
Can Leading Indicators Assess Country Vulnerability? Evidence from the 2008-09 Global Financial Crisis Faculty Research Working Paper Series
Jeffrey Frankel Harvard Kennedy School
George Saravelos Harvard Kennedy School
June 2011 RWP11-024
The views expressed in the HKS Faculty Research Working Paper Series are those of the author(s) and do not necessarily reflect those of the John F. Kennedy School of Government or of Harvard University. Faculty Research Working Papers have not undergone formal review and approval. Such papers are included in this series to elicit feedback and to encourage debate on important public policy challenges. Copyright belongs to the author(s). Papers may be downloaded for personal use only.
www.hks.harvard.edu

Can Leading Indicators Assess Country Vulnerability? Evidence from the 2008-09 Global Financial Crisis
Jeff Frankel and George Saravelos
Harvard Kennedy School
May 24, 2010; revised June 14, 2011
Abstract
This paper investigates whether leading indicators can help explain the cross-country incidence
of the 2008-09 financial crisis. Rather than looking for indicators with specific relevance to the
current crisis, the selection of variables is driven by an extensive review of more than eighty
papers from the previous literature on early warning indicators. The review suggests that central
bank reserves and past movements in the real exchange rate were the two leading indicators that
had proven the most useful in explaining crisis incidence across different countries and crises in
the past. For the 2008-09 crisis, we use six different variables to measure crisis incidence: drops
in GDP and industrial production, currency depreciation, stock market performance, reserve
losses, and participation in an IMF program. We find that the level of reserves in 2007 appears as
a consistent and statistically significant leading indicator of who got hit by the 2008-09 crisis, in
line with the conclusions of the pre-2008 literature. In addition to reserves, recent real
appreciation is a statistically significant predictor of devaluation and of a measure of exchange
market pressure during the current crisis. So is the exchange rate regime. We define the period
of the global financial crisis as running from late 2008 to early 2009, which probably explains
why we find stronger results than earlier papers such as Obstfeld, Shambaugh and Taylor (2009,
2010) and Rose and Spiegel (2009a,b) which use annual data.
We would like to thank Cynthia Balloch and Jesse Shreger for comments and the MacArthur
Foundation for support. This is a revised version of NBER Working Paper No. 16047, June
2010; some material has been cut to fit smaller screens.
Key words: crisis, early warning, emerging markets, financial crisis, leading indicators, reserves,
2008.
JEL classification number: F3
1. Introduction
This paper sits in the long line of studies of early warning indicators, by attempting to
identify variables that could have helped predict which countries were badly impacted by the
global financial crisis of 2008-09. The crisis has renewed interest in such indicators. At its
height in November 2008, the G20 group of nations asked the International Monetary Fund
(IMF) to conduct new early warning exercises, followed by a call at the April 2009 London
summit for the Fund “to provide early warning of macroeconomic and financial risks and the
actions needed to address them.” Readers of the Early Warning Indicators literature have often
gotten the impression that each generation of models is only able to explain the preceding wave
of crises and has to be jettisoned when the next crisis comes. An assessment of whether any
variables from the past can explain incidence of the 2008-09 crisis is highly relevant to
evaluating the usefulness of such exercises.
The 2008-09 crisis is particularly well suited for undertaking an assessment of the
potential usefulness of leading indicators. First, the very large magnitude of the crisis makes it a
good candidate against which the predictive power of various variables can be tested. Second,
the crisis was uniquely broad and relatively synchronized across the global economy. Thus, in
contrast to the international debt crisis that began in Latin America in 1982 and the East Asia
crisis that began in Thailand in 1997, issues related to the timing of crisis incidence and the
modeling of staggered spillover effects can be largely finessed.
It is important to be clear that our paper is not a study of the origins of the global
financial crisis. Others have pondered how and why a crisis originated in US financial markets
in 2007-08, sharply reducing international investors’ appetite for risk. Precisely because the
2
crisis came largely as an exogenous, external and simultaneous shock to most emerging markets
and other countries, we wish to take advantage of the episode to test the usefulness of previously
proposed indicators of country vulnerability to crises. We are here looking at the victims of
contagion, not the originators. In the language of global “push factors” versus local “pull
factors,” we are here looking only at the role of the latter.1
The next section of the paper conducts an extensive review of more than eighty papers
from the pre-2008 early warning indicators literature. We ask whether any variables had
consistently proven successful as leading indicators of crisis incidence in the past. This review
determines the selection of variables for the empirical analysis of the effects of the 2008-09
crisis.
The third section of the paper investigates which countries proved most vulnerable during
the 2008-09 crisis. We see whether any of the economic or financial variables were able to
predict successfully the incidence of the financial crisis. The focus is on the variables identified
in the literature review, rather than indicators specifically selected for the 2008-09 crisis. A
country is considered to have been more vulnerable if it experienced larger output drops, bigger
stock market falls, greater currency weakness, larger losses in reserves, or the need for access to
IMF funds. The fourth section of the paper evaluates the economic significance of the results and
draws policy implications.
2.1 The Challenges of the Early Warning Indicators Literature
Empirical research on early warning indicators is extensive. However, identifying broad
lessons is fraught with difficulties. First, the definitions of a financial crisis and the severity of
1 See Fratzscher (2011) and the references therein.
3

incidence vary widely, as highlighted by both Kaminsky, Lizondo and Reinhart (1996) –
henceforth KLR -- and Abiad (2003). The literature investigates different types of crisis, in
different countries and over different time periods. Second, the variables examined as indicators
are selected with the benefit of hindsight, albeit usually based on some underlying economic
reasoning. Even if these are found statistically significant, the generalizability of the results is
questionable if they have been identified after the crisis has occurred.
To overcome these limitations, the approach taken here is to identify the causes and
symptoms of financial crises that have been most consistent over time, country and crisis. We
conduct a broad review of the literature and attempt to categorize systematically the empirical
findings into a ranking of the indicators that most often have been found to be statistically
significant. We then examine the success of the indicators identified in the earlier literature in
predicting which countries were hit in the 2008-09 financial crisis.
2.2 Definitions of “crisis” and “crisis incidence”
As noted, definitions of a crisis vary. The literature uses both discrete and continuous
measures to define a crisis. Discrete measures are usually in the form of binary variables, which
define a crisis as occurring once a particular threshold value of some economic or financial
variable has been breached. The vast majority of studies include some measure of changes in the
exchange rate. Frankel and Rose (1996) define a “currency crash” as a depreciation of the
nominal exchange rate of more than 25% that is also at least a 10% increase in the rate of
nominal depreciation from the previous year. Exchange rate changes have often been combined
with movements in reserves to create indices of exchange market pressure that measure crisis
4

intensity regardless of exchange rate regime.2 Eichengreen, Rose and Wyplosz (1995)
popularized another criterion: they created an index of speculative pressure which adds interest
rate increases alongside reserve loss and depreciation3 and defined an “exchange market crisis”
as occurring when the index moves at least two standard deviations above its mean.
Continuous measures of crisis incidence overcome the problem of defining particular
thresholds by measuring crisis intensity on a continuous scale. These include nominal exchange
rates and real exchange rates4 and speculative pressure indices. Some measures of crisis have
included the drop in GDP and the drop in the equity market.5 Some authors use regime-
switching approaches that define a crisis endogenously by simultaneously identifying speculative
attacks and the determinants of switching to speculative regimes.6
2.3 Model Specifications
The different modeling approaches employed in the leading indicators literature can be
broadly grouped into four categories.7 The first and most popular category uses linear regression
or limited dependent variable probit/logit techniques. These are used to test the statistical
significance of various indicators in determining the incidence or probability of occurrence of a
2 In other words, an abrupt fall in demand for a country’s currency can show up in either its value or its quantity. Sachs, Tornell and Velasco (1996); Corsetti, et al, (1998); Fratzcher 1998); KLR (1998); Berg and Pattillo (1999); Tornell (1999); Bussiere and Mulder (1999, 2000); Collins (2003); and Frankel and Wei (2005). 3 This approach to accounting comprehensively for central bank defense against speculative attacks has also been used by Herrera and Garcia (1999); Hawkins and Klau (2000); Krkoska (2001). 4 Examples are, respectively: Edwards (1989), Frankel and Rose (1996), Bruggemann and Linne (1999), and Osband and Rijckeghem (2000); and Goldfajn and Valdes (1998), Esquivel and Larrain (1998), Apoteker and Barthelemy (2000), and Rose and Spiegel (2009a, 2009b). 5 Examples include Ghosh and Ghosh (2003) and Grier and Grier (2001), respectively. 6 Cerra and Saxena (2000) and Martinez Peria (2002). 7 Abiad (2003), Hawkins and Klaw (2000) and Collins (2003) offer similar categorizations.
5
financial crisis across a cross-section of countries. Some of the first studies to use these
techniques included Eichengreen, Rose and Wypslosz (1995), Frankel and Rose (1996) and
Sachs, Tornell and Velasco (1996).
The second category, known as the non-parametric, indicators, or signals approach was
first popularized by KLR (1998) and further developed by Bruggemann and Linne (2000),
Edison (2003) and others. The approach selects a number of variables as leading indicators of a
crisis and determines threshold values beyond which a crisis signal is considered to have been
given. Although the statistical significance of the indicators cannot be determined directly
because the thresholds are determined within-sample, the out-of-sample performance of these
indicators can be tested. Out-of-sample significance of the KLR and other signal-based models
has been tested by Berg and Patillo (1999), Bussiere and Mulder (1999) and Berg, Borenzstein
and Patillo (2004), among others, who have shown these models to be moderately successful in
predicting financial crises.
The third category employs a qualitative and quantitative analysis of the behavior of
various variables around crisis occurrence by splitting countries into a crisis group and non-crisis
control group.8 These are panel studies, where the object included trying to predict the date at
which a crisis occurs, rather than on the purely cross-sectional incidence of an international
shock at one point in time.
The fourth, and most recent, category encompasses the use of innovative techniques to
identify and explain crisis incidence, including the use of binary recursive trees to determine
leading indicator crisis thresholds (Ghosh and Ghosh, 2003; Frankel and Wei, 2004), artificial
neural networks and genetic algorithms to select the most appropriate indicators (Nag and Mitra
8 Kamin (1988), Edwards (1989), Edwards and Montiel (1989), Edwards and Santaella (1993) early on applied the approach to some of the largest samples.
6
1999; Apoteker and Barthelemy, 2001) and Markov switching models (Cerra and Saxen, 2001;
Peria, 2002).
2.4 What We Know from the Literature
The wide range of estimation techniques notwithstanding, the literature has converged on
a number of independent variables which are most frequently examined as leading indicators of
crisis incidence. A useful starting point for an overview of previous work are the three extensive
reviews conducted by KLR (1998) for studies up to 1997, Hawkins and Klau (2000) for studies
up to 2000 and Abiad (2003) for studies up to 2001. These three reviews survey more than eighty
papers conducted over a period covering crisis episodes from the 1950s up to 2002. Abiad (2003)
does not however provide a systematic ranking of which indicators were found to be statistically
significant across the various studies investigated. Furthermore, neither Abiad (2003) nor
Hawkins and Klau (2000) include all of each other’s studies in their reviews. This section
integrates the findings of all three reviews, and provides a more systematic analysis of the
indicators in the studies cited by Abiad (2003). We also evaluate the results of seven new papers
published between 2002 and 2009.
Table 1 below summarizes the number of times a particular indicator was found to be
statistically significant across the reviews and additional studies cited above. The indicator
listing is based on Hawkins and Klau (2000) with some modifications, and the footnotes to the
table indicate which variables have been included in each indicator category. An appendix
includes a detailed breakdown of the criteria used to identify significant variables in the papers
7
cited by Abiad (2003) and the most recent literature.9 We deliberately include a number of
studies that were never published.
Those results suggest that foreign exchange reserves, the real exchange rate, the growth
rate of credit, GDP and the current account are the most frequent statistically significant
indicators. Measures of reserves and of the real exchange rate in particular stand out as easily
the top two most important leading indicators, showing up as statistically significant
determinants of crisis incidence in more than half of the 83 papers reviewed.
This meta-analysis of the literature has many limitations. First, some indicators have
been tested more frequently than others, usually because some variables have a stronger
theoretical or intuitive underpinning as crisis indicators or else because of differences in data
availability. The small number of statistically significant variables for some indicators does not
necessarily mean that they have been tested and found to be non-significant; in some cases they
may not have been investigated as extensively. Examples include political and legal variables,
measures of financial openness, and indicators of the exchange rate regime. In contrast, the
current account stands out as a variable which, while frequently included as an independent
variable, has not always exhibited statistical significance.
The second limitation is that the criteria used to determine which indicators are
significant differ among KLR (1998), Hawkins and Klau (2000) and our last two columns. KLR
(1998) include variables that have been found to be significant in at least one of the tests
conducted in each paper, Hawkins and Klau (2000) use varying criteria, and we identify those
variables that are statistically significant in the absolute majority of the different regressions or
other estimation techniques used.
9 Appendix 1 in NBER Working Paper 16047. Available online as Appendix I.
8

These limitations notwithstanding, it is encouraging that a broadly similar ranking of
statistical significance is generated across all three reviews considered and also in the 2002-08
literature. Reserves and the real exchange rate are the two most significant indicators in each of
the review groupings considered, while credit, GDP and the current account also rank highly.
Consistency of statistical significance of an indicator across different periods and using different
estimation techniques and crisis definitions makes for a more reliable indicator.
2.5 Recent Research on the 2008-09 Global Crisis
The earliest studies of the international effects of the global financial crisis used data
from 2008 alone, presumably because those were the data that were available at the time.
Obstfeld, Shambaugh and Taylor (2009, 2010) were among the first. They measured crisis
incidence as the percentage depreciation of local currencies against the US dollar over 2008, and
found that the excess of reserves (as a proportion of M2) over the values predicted by their
model of reserve demand was a statistically significant predictor of currency depreciation over
2008. These results notwithstanding, the simple unadjusted level of reserves/M2 was not found
to be a statistically significant predictor of crisis incidence. The overall size of the sample was
limited and their results lacked statistical robustness across different country samples.
9
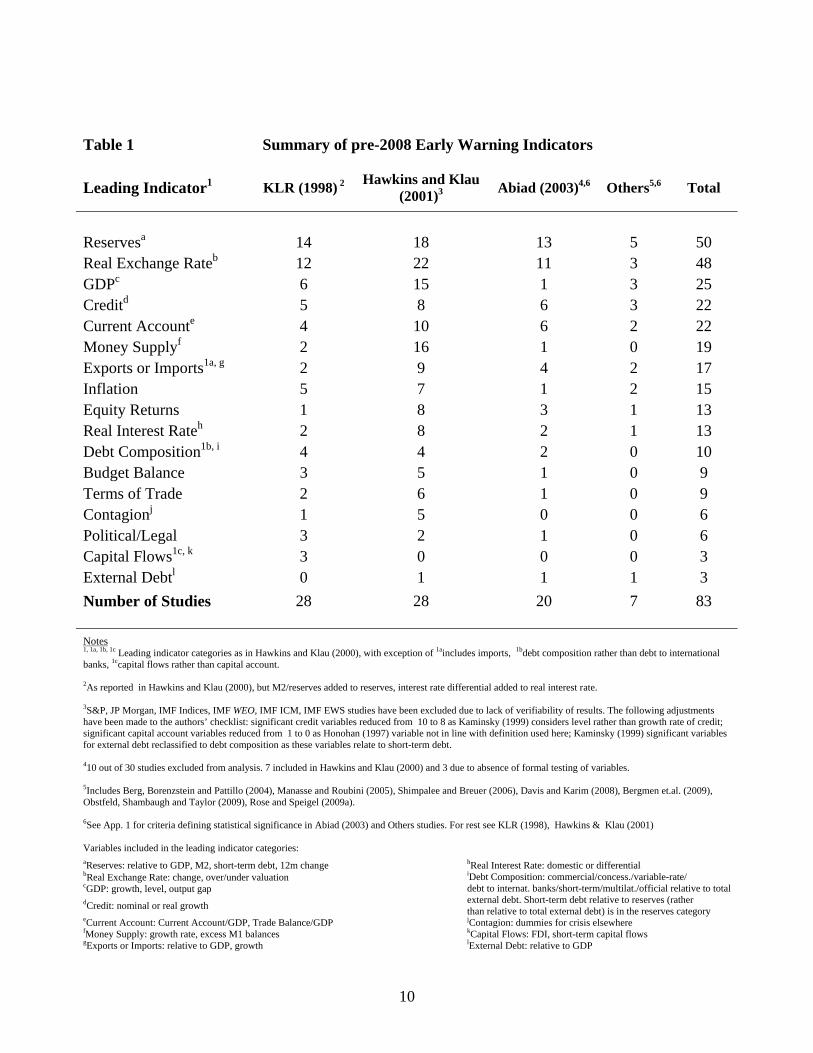
Table 1 Summary of pre-2008 Early Warning Indicators
Leading Indicator1 KLR (1998) 2 Hawkins and Klau (2001)3 Abiad (2003)4,6 Others5,6 Total
Reservesa 14 18 13 5 50 Real Exchange Rateb 12 22 11 3 48 GDPc 6 15 1 3 25 Creditd 5 8 6 3 22 Current Accounte 4 10 6 2 22 Money Supplyf 2 16 1 0 19 Exports or Imports1a, g 2 9 4 2 17 Inflation 5 7 1 2 15 Equity Returns 1 8 3 1 13 Real Interest Rateh 2 8 2 1 13 Debt Composition1b, i 4 4 2 0 10 Budget Balance 3 5 1 0 9 Terms of Trade 2 6 1 0 9 Contagionj 1 5 0 0 6 Political/Legal 3 2 1 0 6 Capital Flows1c, k 3 0 0 0 3 External Debtl 0 1 1 1 3 Number of Studies 28 28 20 7 83 Notes
1, 1a, 1b, 1c Leading indicator categories as in Hawkins and Klau (2000), with exception of 1aincludes imports, 1bdebt composition rather than debt to international banks, 1ccapital flows rather than capital account.
2As reported in Hawkins and Klau (2000), but M2/reserves added to reserves, interest rate differential added to real interest rate.
3S&P, JP Morgan, IMF Indices, IMF WEO, IMF ICM, IMF EWS studies have been excluded due to lack of verifiability of results. The following adjustments have been made to the authors’ checklist: significant credit variables reduced from 10 to 8 as Kaminsky (1999) considers level rather than growth rate of credit; significant capital account variables reduced from 1 to 0 as Honohan (1997) variable not in line with definition used here; Kaminsky (1999) significant variables for external debt reclassified to debt composition as these variables relate to short-term debt.
410 out of 30 studies excluded from analysis. 7 included in Hawkins and Klau (2000) and 3 due to absence of formal testing of variables.
5Includes Berg, Borenzstein and Pattillo (2004), Manasse and Roubini (2005), Shimpalee and Breuer (2006), Davis and Karim (2008), Bergmen et.al. (2009), Obstfeld, Shambaugh and Taylor (2009), Rose and Speigel (2009a).
6See App. 1 for criteria defining statistical significance in Abiad (2003) and Others studies. For rest see KLR (1998), Hawkins & Klau (2001)
Variables included in the leading indicator categories: aReserves: relative to GDP, M2, short-term debt, 12m change hReal Interest Rate: domestic or differential bReal Exchange Rate: change, over/under valuation cGDP: growth, level, output gap dCredit: nominal or real growth
iDebt Composition: commercial/concess./variable-rate/ debt to internat. banks/short-term/multilat./official relative to total external debt. Short-term debt relative to reserves (rather than relative to total external debt) is in the reserves category
eCurrent Account: Current Account/GDP, Trade Balance/GDP jContagion: dummies for crisis elsewhere fMoney Supply: growth rate, excess M1 balances kCapital Flows: FDI, short-term capital flows gExports or Imports: relative to GDP, growth lExternal Debt: relative to GDP
10
A second contribution came from the papers by Rose and Spiegel (2009a; 2009b). They
modeled crisis incidence as a combination of 2008 changes in real GDP, the stock market,
country credit ratings and the exchange rate. The authors performed an extensive investigation
into over sixty potential variables that could help explain cross-country crisis incidence (2009a)
as well as country-specific contagion effects (2009b). The authors did not find consistently
statistically significant variables. Though the sample was broader than that used by Obstfeld,
Shambaugh and Taylor (2009), the 2008 calendar year period over which the authors measured
crisis incidence seems somewhat imprecise. The global crisis did not become severe until
September 2008. Furthermore, global output and financial markets continued to contract sharply
in early 2009.
In a follow-up paper, Rose and Spiegel (2011) subsequently updated the data sample to
include 2009. The most likely reason why the results they obtain are still much less sharp than
ours is that we define the crisis as starting in the second half of 2008 (or, more precisely,
September) and ending in the first half of 2009 (or, more precisely, March), while they use
annual data. When one is considering real currency appreciation, stock market rises, and rapid
GDP growth as possible indicators (among others) of vulnerability to a coming crisis, and crisis
effects are then measured by declines in currency values, stock markets, and GDP (among other
things), it obviously makes a great deal of difference what date one selects to define the starting
point of the crisis period.10
Berkmen et al. (2009) measured crisis incidence differently, as the change in 2009
growth forecasts by professional economists before and after the crisis hit. They found that
countries with more leveraged domestic financial systems and more rapid credit growth tended
10 There are other differences as well, in econometric technique and measurement of crisis effects. For example, we include recourse to the IMF among our measures of what countries suffered a crisis.
11
to suffer larger downward revisions to their growth outlooks, while exchange-rate flexibility
helped reduce the impact of the shock. As in Rose and Spiegel (2009a) and Blanchard et al
(2009), the authors found little evidence that international reserves played a significant role in
explaining crisis incidence. Their measure of crisis incidence has its limitations, however,
focusing on revisions to growth forecasts by professional economists rather than actual growth
outturns. Data on actual economic performance were not available at the time.
Subsequently, Lane and Milesi-Ferretti (2011) measure the country effects of the crisis by the
change in GDP growth and in its demand-side components. They too view growth rates
annually. They find that the countries that suffered most in 2008-09 were those that had
previously shown higher pre-crisis growth relative to trend, current account deficits, trade
openness and share of manufacturing. They, as other authors, also find that high-income
countries were hit more than low-income countries, the reverse of the usual pattern in previous
global shocks. Llaudes, Salman and Chivakul (2011) and Dominguez, Hashimoto and Ito
(2011, p. 24-26) find that emerging market countries that had accumulated reserves by 2007
suffered lower output declines in the global recession.11
3.1 Predicting the Incidence of the 2008-09 Financial Crisis
A consistent theme of the 2009 research on the global financial crisis is that the leading
indicators that most frequently appeared in earlier reviews were not statistically significant
indicators this time. Our findings are different.
We offer three innovations. First, crisis incidence is measured using five different
variables. Second, greater attention is given to the leading indicators that have been identified as
11 Thus their results confirm our conclusion more than that of the earlier studies, and perhaps for the same reason: they argue that the crisis period that is relevant for most countries started in late 2008 and ended in early 2009.
12
useful by the literature prior to 2008, rather than focusing on variables that may be uniquely
chosen for the current crisis. The main aim of this empirical exercise is to examine the
consistency of these indicators in predicting crisis vulnerability over time, country and crisis.
Finally, data encompassing financial market and economic developments up to the second
quarter of 2009 are included in the financial crisis incidence measures. Many equity markets and
real output indicators continued to decline up to the first and second quarters of 2009
respectively, suggesting that the crisis continued beyond the end of 2008. As such, a more
accurate measurement of crisis incidence requires the inclusion of this period in the analysis.
3.2 The Dataset
Our warning indicators consist of 50 annual macroeconomic and financial variables. All
the independent variables are dated from 2007 or earlier, minimizing endogeneity issues. Most
of the data come from the World Bank World Development Indicators database. This source is
augmented by monthly real effective and nominal exchange rate data from the IMF International
Financial Statistics database, the Klein-Shambaugh (2006) measure of exchange rate regime as
of 2004 and the Chinn-Ito (2007) measure of financial openness updated to 2007. Data
availability differs by country, with the most data points available for the level and growth rate
of GDP (122 countries) and the least data available for various measures of short-term debt (67
countries). High frequency data for exchange rates (156 countries), stock market indices (77
countries), industrial production (58 countries) and GDP (63 countries) up to the second half of
2009 are sourced from Bloomberg and Datastream for the financial and real data respectively.12
12 Some industrial production and GDP data have been taken from national statistical sources. For industrial production, data for China, New Zealand and Ukraine were taken from national statistics. For GDP, the data for Poland are from national sources.
13

The high frequency data are used to define crisis incidence from the second half of 2008
onwards, as explained in more detail below.
3.3 Defining the 2008-09 Crisis
There are many possible criteria for identifying what is a crisis. We define crises broadly,
in terms of both financial and real symptoms. As noted, the consequential difference from the
earlier empirical work is that probably the dating of the crisis period. We consider it to have
continued into 2009, rather than having ended in 2008. Many real output indicators and asset
prices continued to decline after December 2008, while measures of market risk such as the VIX
and sovereign bond spreads remained elevated.
Our crisis measures are as follows:
(a) Nominal local currency percentage change versus the US dollar from 15th September 2008 to
9th March 2009. The starting date is picked as the day of the Lehman Brothers bankruptcy.
Though asset prices peaked and many measures of financial market risk started to rise prior
to this date, financial market dislocations became particularly synchronized and abrupt after
this date. (Figures 1 and 2 show the VIX, EMBI and stock market indicators.) Identifying the
end date is less straightforward, with different financial market variables beginning to
recover on different dates. In this paper, the end date is identified as the bottom in the MSCI
world equity index. The US dollar (as measured by the Federal Reserve broad trade-weighted
dollar index) also peaked a few days earlier, perhaps signaling a peak in global risk-aversion
and flight to quality.13
13 Aït-Sahalia, et al (2010) also date the global phase of the financial crisis as beginning with collapse of Lehman Brothers on September 14, 2008, and ending March 31, 2009. As additional justification for the end-date, they
14
(b) Equity market returns in domestic stock market benchmark indices over the same period as
above, adjusted for the volatility of returns.14 This method is preferred to simple percent
returns, to account for the differing risk-return characteristics of each local stock market.
(c) Percentage change in the level of real GDP between Q2 2008 and Q2 2009. Though the
NBER declared December 2007 as the start of the US recession, the global economy
continued growing up to the second quarter of 2008 according to a number of high frequency
variables such as industrial production and the Institute of Supply Management’s global
purchasing manager index (PMI). Based on these same indicators, output began to recover in
the second quarter of 2009. It thus seems appropriate to measure the change in GDP over this
period. Measuring over four quarters also avoids any seasonality problems.
(d) Percentage change in industrial production from end-June 2008 to end-June 2009.
Industrial production may be a more consistent measure of the impact of the crisis because
the composition of GDP varies across economies.
(e) Recourse to IMF financing This summary variable includes all countries that requested
funds from the IMF under Stand-by Arrangements, the Poverty Reduction and Growth
Facility and Exogenous Shock Facility from July 2008 to November 2009.15 Countries with
an established Flexible Credit Line are not included, as no funds were drawn under this
arrangement. The variable is a binary crisis indicator, taking the value 1 if a country
participated in an IMF program and 0 otherwise.
point out that the G20 Leaders Summit on Financial Markets and the World Economy, which tackled the crisis, was held in London, April 1-2, 2009. 14 Returns are calculated as the annualized percentage daily returns over the period divided by annualized volatility. 15 A list of countries is given in Appendix II, available online, which is Appendix 3 of NBER WP 16047.
15
Our baseline crisis indicators do not include reserves, even though the literature has
frequently combined exchange rate moves with losses in international reserves as a crisis
measure. There are two reasons. First, measured foreign exchange reserves go up when central
banks draw credit under IMF programs. For this reason, many countries show large jumps in
reserves at the peak of the crisis. Second, movements in exchange rates cause severe valuation
distortions in reserves. If one chooses to value reserves in US dollars for instance, the data
indicate large drops in reserves for many Eastern European countries. This reflects not only a
volume loss in reserves, but also a paper loss on their value: the appreciation in the US dollar
during the crisis reduced the dollar value of reserves of European countries due to the large
proportion of euros in their portfolios.
These two drawbacks notwithstanding, the inclusion of reserves as a measure of crisis
incidence allows one to observe an increase in market pressure that may not otherwise be
captured through exchange rate moves. This is particularly relevant for countries with fixed
exchange rate regimes, where capital flight and crisis incidence are manifest through larger drops
in reserves rather than exchange rate weakness.16 Section 3.6 extends the analysis with an
exchange market pressure index which does include reserves and it attempts to correct for both
of the problems highlighted above.
3.4 Independent Variables
16 The Baltic countries stand out in this regard, due to exchange rates rigidly fixed to the euro: They suffered from capital outflows, large reserve losses and severe recessions during the 2008-09 crisis, with no depreciation of the currency. (Poland, by contrast, experienced a big currency depreciation, with superior output performance.)
16
The independent variables selected are based on the indicators identified in the literature
review. The explanatory variables all refer to the 2007 calendar year, unless noted otherwise.
They are grouped into the following categories:
Reserves
Reserves appeared as the most frequent statistically significant warning indicator in the
literature. The measures included in this study are the country’s reserves as a percentage of GDP,
reserves as a percentage of total external debt, reserves in months of imports, the ratio of M2 to
total reserves, and short term debt as percentage of total reserves.
Real Effective Exchange Rate
“Overvaluation” is captured by the percentage change in the REER over the preceding five
years, and the percentage deviation of the REER in December 2007 from its ten year average. (A
rise in the REER index represents a stronger local currency.) The source is the IMF’s real
effective exchange rate database.
Gross Domestic Product
In the pre-2008 literature, strong recent growth reduces the likelihood of crisis. We include
GDP growth in 2007, as well as the average GDP growth rates over 2003-07 (5 year average)
and 1998-2007 (10 year average). Separately, we include the level of GDP per capita to reflect
stages of economic development (expressed in 2000 constant US dollars).
Credit
We include the five- and ten-year expansion in domestic credit as a percentage of GDP.
Sachs, Tornell and Velasco (1996), who were among the first to popularize this measure, argue
that it is a good proxy for banking system vulnerability, as rapid credit growth is likely
associated with a decline in lending standards. We also try a credit depth of information index as
17
well as the bank liquid reserves to bank assets ratio, as alternative measures of banking system
vulnerability.
Current Account
Under this category are the current account balance as a percentage of GDP in 2007 and the
average balance in the five and ten years up to 2007. Net national savings as a percentage of GNI
and gross national savings as a percentage of GDP are also included in this category.
Money Supply
Money measures are the ten- and five-year growth rates of liquid liabilities (M3) and money
plus quasi-money (M2).
Exports and Imports
Trade measures include exports, imports, and the trade balance as a percentage of GDP.
Inflation
The average CPI inflation rate is observed over the preceding five and ten years.
Equity Returns
Equity market returns are measured as the five year percentage change in benchmark stock
market indices expressed in local currencies, as well as the five year volatility-adjusted return.
The source of these data is Bloomberg.
Interest Rate
The real interest rate and deposit rate are both included.
Debt Composition
Research suggests that the composition of capital inflows may matter more than the total
magnitude. The variables included are short-term debt as a percentage of exports and as a
percentage of total external debt, public and publicly guaranteed debt service as a percentage of
18
exports and of GNI, multilateral debt service as a percentage of public and publicly guaranteed
debt service, aid as a percentage of GNI and gross financing via international capital markets as a
percentage of GDP. Earlier research has mostly focused on the effects of short-term debt, finding
a positive relationship with crisis incidence.17 The relationship between crisis incidence and
public debt or aid/debt owed to multilaterals has been examined less frequently. Some studies
suggest a positive effect of public debt and a negative effect of multilateral debt, respectively.18
Legal/Business Variables
An index for the strength of legal rights and an index for business disclosure from the World
Development Indicators database are intended to capture the quality of countries’ institutions.
Capital Flows
The variables measured are net foreign direct investment inflows, outflows and total FDI
flows, as well as portfolio flows (debt and equity), all expressed as a percentage of GDP. The
first two variables refer to net FDI by foreign companies into the domestic economy and by
domestic companies to foreign markets, respectively. Total FDI flows are calculated as the sum
of inflows and outflows. A larger amount of total FDI flows into the economy, considered a
more stable source of balance of payments financing, is thought to have a negative relationship
with crisis incidence. Larger portfolio flows, considered more easily reversible, are expected to
be associated with higher crisis incidence.
External Debt
External debt is represented by total debt service as a percentage of GNI, and by the net
present value expressed as a percentage of exports and GNI.
Peg/Financial Openness
17 Frankel and Rose (1996) and Kaminsky (1999), among others. 18 Frankel and Rose (1996) and Milesi-Ferretti and Razin (1998). Multilateral lenders do not pull out in crises, as private lenders tend to do.
19
The Chinn-Ito (2007) measure of financial openness updated to 2007 and the Klein-
Shambaugh (2007) measure of exchange rate regime as of 2004 represent regime choices. The
former is transformed into a binary variable, with a country considered financially closed if the
index value belongs to the bottom 30th percentile. Twenty-three additional countries were
included in the latter dataset, based on the authors’ own calculations.
Regional/Income Dummy Variables
Dummy variables account for three different income groups -- lower, middle and upper --
based on the World Bank definition. Regional dummy variables included South Asia, Europe
and Central Asia, Middle East and North Africa, East Asia and the Pacific, Sub-Saharan Africa,
Latin America and the Caribbean and North America.
3.5 Empirical Results
3.5.1 Dependent Variables
We start the empirical analysis with a quantitative description of the dependent variables
used to define crisis incidence. Figure 3 presents the top and bottom ten performing countries on
each of the continuous variables used. Many Eastern European countries show up as suffering
the most from the crisis. China suffered much less: strikingly, it is the only country to appear on
the list of best-performers across all four measures.
The Baltic countries suffered some of the largest drops in industrial production and GDP,
but the tenacity of their exchange rate pegs to the euro meant that their currencies did not
depreciate versus the dollar as much as did other emerging market currencies. Despite the large
drops in Japan’s GDP and industrial production, the Japanese yen was one of the top performing
currencies during the crisis, largely due to the unwinding of the yen carry trade, as Rose and
20
Spiegel (2009a) point out. The differences in the measurement of crisis incidence reinforces the
need to use multiple definitions against which the predictive power of various leading indicators
can be tested.
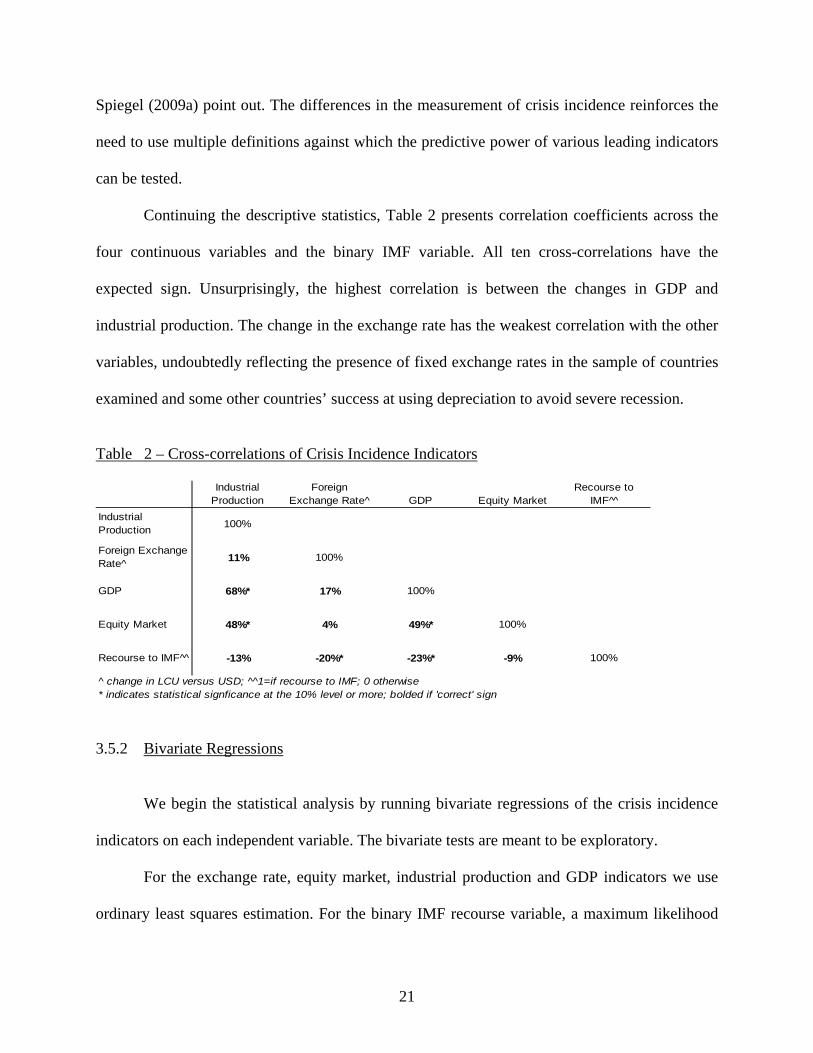
Continuing the descriptive statistics, Table 2 presents correlation coefficients across the
four continuous variables and the binary IMF variable. All ten cross-correlations have the
expected sign. Unsurprisingly, the highest correlation is between the changes in GDP and
industrial production. The change in the exchange rate has the weakest correlation with the other
variables, undoubtedly reflecting the presence of fixed exchange rates in the sample of countries
examined and some other countries’ success at using depreciation to avoid severe recession.
Table 2 – Cross-correlations of Crisis Incidence Indicators
Industrial Production
Foreign Exchange Rate^ GDP Equity Market
Recourse to IMF^̂
Industrial Production 100%
Foreign Exchange Rate^ 11% 100%
GDP 68%* 17% 100%
Equity Market 48%* 4% 49%* 100%
Recourse to IMF^̂ -13% -20%* -23%* -9% 100%
^ change in LCU versus USD; ^^1=if recourse to IMF; 0 otherwise* indicates statistical signficance at the 10% level or more; bolded if 'correct' sign 3.5.2 Bivariate Regressions
We begin the statistical analysis by running bivariate regressions of the crisis incidence
indicators on each independent variable. The bivariate tests are meant to be exploratory.
For the exchange rate, equity market, industrial production and GDP indicators we use
ordinary least squares estimation. For the binary IMF recourse variable, a maximum likelihood
21
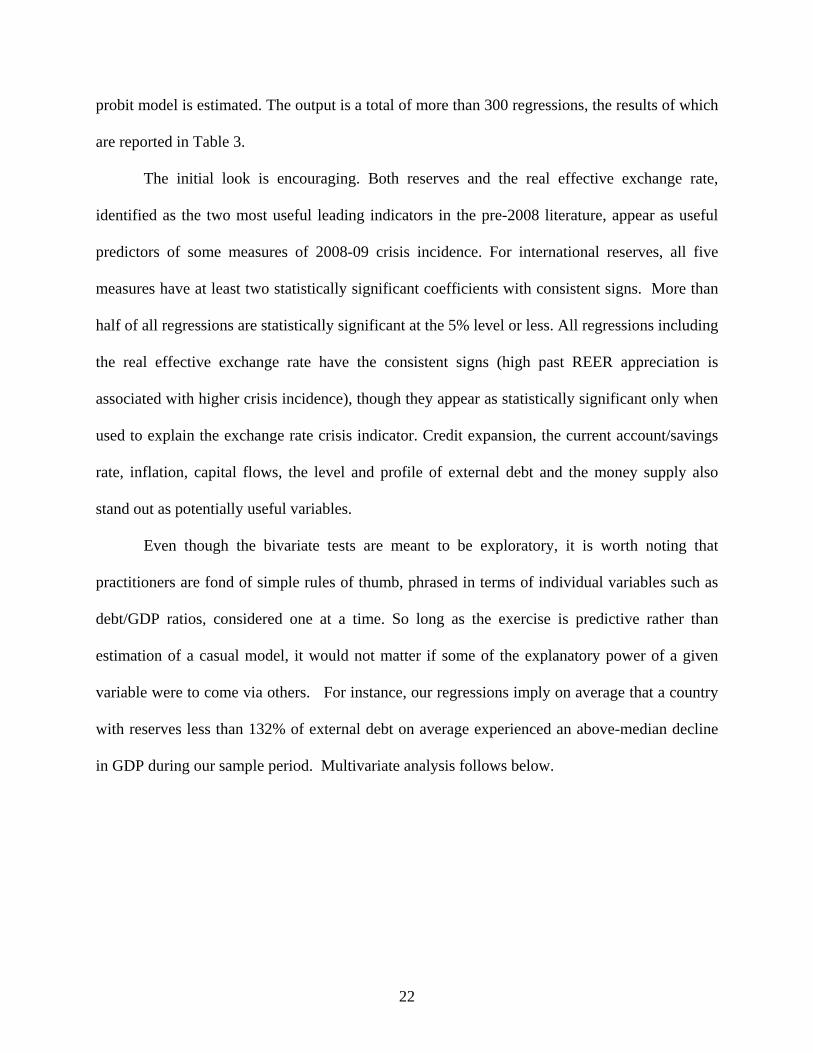
probit model is estimated. The output is a total of more than 300 regressions, the results of which
are reported in Table 3.
The initial look is encouraging. Both reserves and the real effective exchange rate,
identified as the two most useful leading indicators in the pre-2008 literature, appear as useful
predictors of some measures of 2008-09 crisis incidence. For international reserves, all five
measures have at least two statistically significant coefficients with consistent signs. More than
half of all regressions are statistically significant at the 5% level or less. All regressions including
the real effective exchange rate have the consistent signs (high past REER appreciation is
associated with higher crisis incidence), though they appear as statistically significant only when
used to explain the exchange rate crisis indicator. Credit expansion, the current account/savings
rate, inflation, capital flows, the level and profile of external debt and the money supply also
stand out as potentially useful variables.
Even though the bivariate tests are meant to be exploratory, it is worth noting that
practitioners are fond of simple rules of thumb, phrased in terms of individual variables such as
debt/GDP ratios, considered one at a time. So long as the exercise is predictive rather than
estimation of a casual model, it would not matter if some of the explanatory power of a given
variable were to come via others. For instance, our regressions imply on average that a country
with reserves less than 132% of external debt on average experienced an above-median decline
in GDP during our sample period. Multivariate analysis follows below.
22
Table 3: Effect of Predictors on Five Different Measures of Country Performance in 2008-09 Crisis
Coefficients of Bivariate Regressions of Crisis Indicators on Each Independent Variable* (t-stat in parentheses)bolded number indicates statistical signficance at 10% level or lower, darker color shading equivalent to higher statistical significance
Currency Market
Equity Market
Recourse to IMF
Industrial Production
GDPSignif icant and
C o nsistent Sign?^
Independent Variable
Reserves (% GDP) 0.082 (2.52)
0.850 (1.6)
-1.020 (-1.92)
0.155 (2.22)
0.008 (0.27)
Yes
Reserves (% external debt) -0.000 (-1.42)
0.000 (2.11)
-0.010 (-3.42)
0.000 (3.62)
0.000 (3.07)
Yes
Reserves (in months of imports) 0.002 (1.58)
0.103 (4.71)
-0.089 (-3.31)
0.006 (1.48)
0.001 (0.75)
Yes
M2 to Reserves 0.000 (0.14)
-0.026 (-3.81)
-0.067 (-1)
-0.001 (-2.46)
0.000 (1.44)
Yes
Short-term Debt (% of reserves) -0.000 (-2.6)
-0.007 (-4.45)
0.000 (1.18)
-0.000 (-1.7)
-0.000 (-2.93)
Yes
REER (5-yr % appreciation of local currency) -0.293 (-5.4)
-0.303 (-0.32)
0.889 (0.99)
-0.000 (-0.01)
-0.029 (-0.85)
REER (Deviation from 10-yr av) -0.292 (-2.93)
-0.920 (-0.81)
0.671 (0.58)
-0.000 (-0.01)
-0.041 (-0.91)
GDP growth (2007, %) 0.003 (1.7)
0.078 (1.58)
0.039 (1.63)
0.010 (2.59)
-0.002 (-1.21)
Yes
GDP Growth (last 5 yrs) 0.002 (1.08)
0.118 (2.14)
0.052 (1.68)
0.009 (2.14)
-0.003 (-1.21)
GDP Growth (last 10 yrs) 0.005 (1.59)
0.087 (1.06)
0.042 (1.2)
0.016 (2.63)
-0.004 (-0.76)
GDP per capita (2007, constant 2000$) -0.003 (-0.7)
-0.296 (-4.69)
-0.221 (-3.23)
-0.027 (-2.48)
-0.010 (-1.74)
Change in Credit (5-yr rise, % GDP) -0.029 (-0.83)
-1.979 (-5.42)
0.139 (0.37)
-0.092 (-1.67)
-0.065 (-2.34)
Yes
Change in Credit (10-yr rise, % GDP) -0.024 (-2.84)
-0.904 (-3.9)
-0.011 (-0.08)
-0.046 (-1.58)
-0.019 (-1.13)
Yes
Credit Depth of Information Index (higher=more) -0.005 (-1.34)
-0.115 (-1.72)
0.009 (0.19)
0.006 (0.57)
-0.003 (-0.47)
Bank liquid reserves to bank assets ratio (%) 0.000 (1.52)
0.022 (1.51)
-0.000 (-13.97)
0.002 (2.34)
0.001 (2.58)
Yes
Current Account (% GDP) 0.001 (1.57)
0.032 (2.18)
-0.032 (-3.46)
0.000 (0.42)
0.000 (0.78)
Yes
Current Account, 5-yr Average (% GDP) 0.001 (1.31)
0.030 (1.66)
-0.032 (-2.76)
0.000 (0.53)
0.000 (0.42)
Current Account, 10-yr Average (% GDP) 0.000 (0.72)
0.034 (1.46)
-0.038 (-2.63)
0.000 (0.15)
0.001 (1.59)
Net National Savings (% GNI) 0.000 (0.9)
0.048 (4.5)
-0.020 (-1.88)
0.003 (2.42)
0.002 (2.92)
Yes
Gross National Savings (% GDP) 0.000 (0.76)
0.047 (3.9)
-0.028 (-2.51)
0.003 (1.99)
0.002 (2.52)
Yes
Change in M3 (5-yr rise, % GDP) 0.000 (0.16)
-0.018 (-1.41)
-0.001 (-0.14)
-0.002 (-1.49)
-0.001 (-1.05)
Change in M2 (5-yr rise, % GDP) 0.000 (0.09)
-0.023 (-1.5)
0.007 (0.63)
-0.002 (-1.14)
-0.001 (-0.91)
RESERVES
REER
GDP
CURRENT
ACCOUNT
CREDIT
MONEY
23
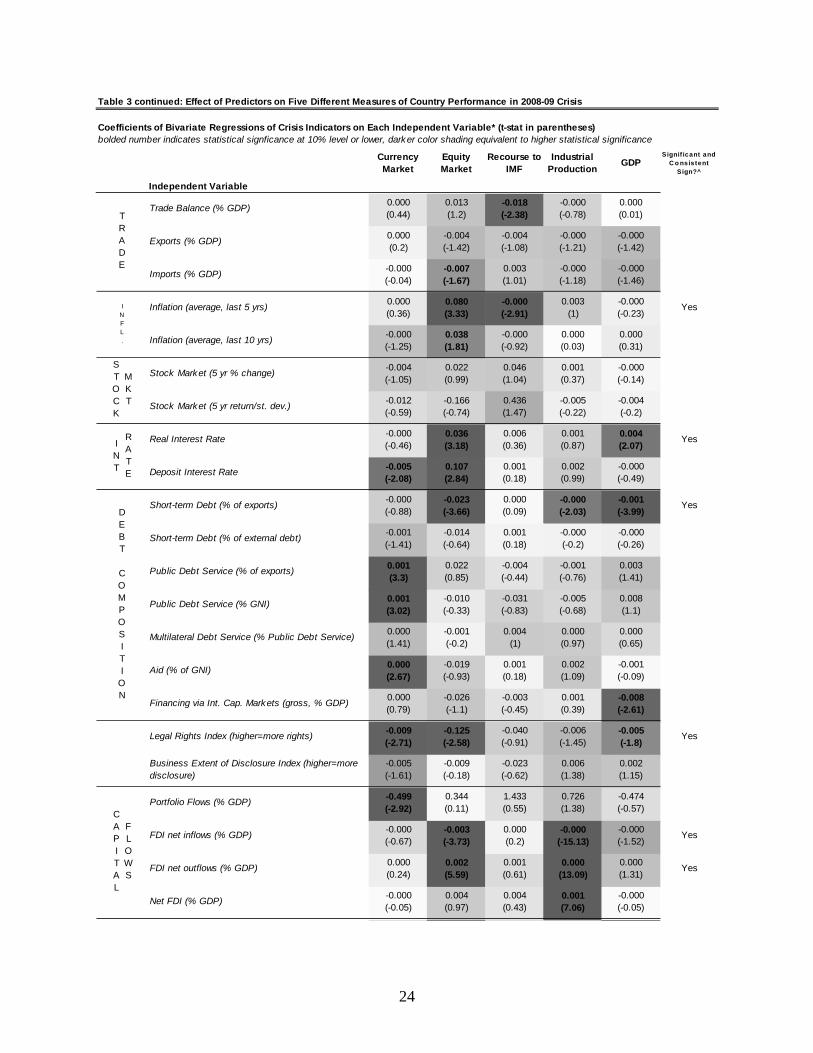
Table 3 continued: Effect of Predictors on Five Different Measures of Country Performance in 2008-09 Crisis
Coefficients of Bivariate Regressions of Crisis Indicators on Each Independent Variable* (t-stat in parentheses)bolded number indicates statistical signficance at 10% level or lower, darker color shading equivalent to higher statistical significance
Currency Market
Equity Market
Recourse to IMF
Industrial Production
GDPSignif icant and
C o nsistent Sign?^
Independent Variable
Trade Balance (% GDP) 0.000 (0.44)
0.013 (1.2)
-0.018 (-2.38)
-0.000 (-0.78)
0.000 (0.01)
Exports (% GDP) 0.000 (0.2)
-0.004 (-1.42)
-0.004 (-1.08)
-0.000 (-1.21)
-0.000 (-1.42)
Imports (% GDP) -0.000 (-0.04)
-0.007 (-1.67)
0.003 (1.01)
-0.000 (-1.18)
-0.000 (-1.46)
Inflation (average, last 5 yrs) 0.000 (0.36)
0.080 (3.33)
-0.000 (-2.91)
0.003 (1)
-0.000 (-0.23)
Yes
Inflation (average, last 10 yrs) -0.000 (-1.25)
0.038 (1.81)
-0.000 (-0.92)
0.000 (0.03)
0.000 (0.31)
Stock Market (5 yr % change) -0.004 (-1.05)
0.022 (0.99)
0.046 (1.04)
0.001 (0.37)
-0.000 (-0.14)
Stock Market (5 yr return/st. dev.) -0.012 (-0.59)
-0.166 (-0.74)
0.436 (1.47)
-0.005 (-0.22)
-0.004 (-0.2)
Real Interest Rate -0.000 (-0.46)
0.036 (3.18)
0.006 (0.36)
0.001 (0.87)
0.004 (2.07)
Yes
Deposit Interest Rate -0.005 (-2.08)
0.107 (2.84)
0.001 (0.18)
0.002 (0.99)
-0.000 (-0.49)
Short-term Debt (% of exports) -0.000 (-0.88)
-0.023 (-3.66)
0.000 (0.09)
-0.000 (-2.03)
-0.001 (-3.99)
Yes
Short-term Debt (% of external debt) -0.001 (-1.41)
-0.014 (-0.64)
0.001 (0.18)
-0.000 (-0.2)
-0.000 (-0.26)
Public Debt Service (% of exports) 0.001 (3.3)
0.022 (0.85)
-0.004 (-0.44)
-0.001 (-0.76)
0.003 (1.41)
Public Debt Service (% GNI) 0.001 (3.02)
-0.010 (-0.33)
-0.031 (-0.83)
-0.005 (-0.68)
0.008 (1.1)
Multilateral Debt Service (% Public Debt Service) 0.000 (1.41)
-0.001 (-0.2)
0.004 (1)
0.000 (0.97)
0.000 (0.65)
Aid (% of GNI) 0.000 (2.67)
-0.019 (-0.93)
0.001 (0.18)
0.002 (1.09)
-0.001 (-0.09)
Financing via Int. Cap. Markets (gross, % GDP) 0.000 (0.79)
-0.026 (-1.1)
-0.003 (-0.45)
0.001 (0.39)
-0.008 (-2.61)
Legal Rights Index (higher=more rights) -0.009 (-2.71)
-0.125 (-2.58)
-0.040 (-0.91)
-0.006 (-1.45)
-0.005 (-1.8)
Yes
Business Extent of Disclosure Index (higher=more disclosure)
-0.005 (-1.61)
-0.009 (-0.18)
-0.023 (-0.62)
0.006 (1.38)
0.002 (1.15)
Portfolio Flows (% GDP) -0.499 (-2.92)
0.344 (0.11)
1.433 (0.55)
0.726 (1.38)
-0.474 (-0.57)
FDI net inflows (% GDP) -0.000 (-0.67)
-0.003 (-3.73)
0.000 (0.2)
-0.000 (-15.13)
-0.000 (-1.52)
Yes
FDI net outflows (% GDP) 0.000 (0.24)
0.002 (5.59)
0.001 (0.61)
0.000 (13.09)
0.000 (1.31)
Yes
Net FDI (% GDP) -0.000 (-0.05)
0.004 (0.97)
0.004 (0.43)
0.001 (7.06)
-0.000 (-0.05)
CAPITAL
FLOWS
E
TRADE
INFL.
DEBT COMPOSITI
ON
INT
RATE
STOCK
MKT
24

Table 3 concluded: Effect of Predictors on Five Different Measures of Country Performance in 2008-09 Crisis
Coefficients of Bivariate Regressions of Crisis Indicators on Each Independent Variable* (t-stat in parentheses)bolded number indicates statistical signficance at 10% level or lower, darker color shading equivalent to higher statistical significance
Currency Market
Equity Market
Recourse to IMF
Industrial Production GDP
Signif icant and C o nsistent
Sign?^
Independent Variable
External Debt Service (% GNI) 0.000 (0.76)
-0.058 (-2.39)
-0.007 (-0.65)
-0.001 (-0.74)
-0.005 (-6.32)
Yes
Present Value of External Debt (% exports) 0.000 (0.31)
-0.007 (-3.99)
-0.000 (-0.08)
-0.000 (-1.67)
-0.000 (-2.77)
Yes
Present Value of External Debt (% GNI) 0.000 (0.11)
-0.014 (-3.7)
-0.000 (-0.61)
-0.000 (-1.29)
-0.000 (-4.77)
Yes
Peg (1 = peg) 0.057 (3.41)
-0.577 (-2.47)
-0.363 (-1.48)
-0.053 (-2.17)
-0.021 (-1.55)
Financial Openness (0=open) 0.023 (1.34)
0.899 (4.56)
0.230 (1.03)
0.085 (1.6)
0.020 (0.63)
EXT DEBT
Euro Area -0.009
(-1.06)-0.901 (-4.9)
- -0.055 (-2.29)
-0.006 (-0.68)
Yes
Low Income Country 0.021 (1.16)
0.729 (2.45)
0.376 (1.54)
- -
Middle Income -0.025 (-1.58)
0.821 (3.7)
0.398 (1.85)
0.067 (3.19)
0.017 (1.17)
Upper Income 0.013 (0.86)
-0.982 (-4.83)
-1.079 (-3.27)
-0.067 (-3.19)
-0.017 (-1.17)
OECD -0.042 (-2.29)
-0.709 (-3.69)
-0.478 (-1.27)
-0.051 (-2.39)
-0.005 (-0.47)
Yes
South Asia 0.063 (3.63)
0.799 (2.71)
0.185 (0.4)
0.195 (17.65)
0.015 (0.37)
Yes
Europe & Central Asia -0.078 (-4.9)
-1.038 (-5.13)
0.306 (1.34)
-0.071 (-3.45)
-0.052 (-4.29)
Yes
Middle East & North Africa 0.074 (4.18)
0.092 (0.31)
-0.673 (-1.39)
0.058 (2.03)
0.074 (5.63)
Yes
East Asia & Pacific 0.017 (0.8)
0.494 (1.75)
-0.953 (-2.12)
0.056 (1.55)
0.038 (2.64)
Yes
Sub-Saharan Africa -0.049 (-2.12)
0.549 (2.79)
0.513 (2.17)
0.068 (5.93)
0.017 (2.47)
Latin America & Carribean 0.024 (0.94)
-0.634 (-1.53)
-0.320 (-0.81)
-0.018 (-0.73)
-0.046 (-1.82)
North America 0.016 (0.26)
-1.003 (-5.2)
- -0.027 (-2.25)
0.006 (0.91)
Yes
*OLS with heteroscedasticity robust standard errors performed for four continuous variables; probit for IMF recourse variable^At least two statistically signficant coefficients, of which all must have consistent sign (consistent = same sign, with exception of coefficient on IMF recourse variable, which should have opposite sign)
INCOME
REGI
ON
3.5.3 Bivariate Regressions with Income Level as Control Variable
GDP per capita appears highly statistically significant across most measures of the impact
of the 2008-09 crisis. Though rich countries had a smaller probability of seeking IMF funds, the
25

relationship is negative across all the other indicators: richer countries suffered more from the
crisis than poorer ones. This is a departure from historical patterns, but confirms the Rose and
Spiegel results (2009a). Following the aforementioned authors, we use the log of income per
capita as a conditioning variable and re-run the regressions above. The results of these bivariate
regressions are reported in Table 4.
The coefficients on reserves remain statistically significant at the 5% level across more
than half of the regressions performed, with reserves expressed relative to external debt, GDP,
or short-term debt standing out as the most consistently significant indicators. The coefficients
on reserves expressed in months of imports are also statistically significant in two out of the five
crisis measures. Thus the variable that has shown up most frequently in the preceding literature
(recall Table 1) performs moderately well in predicting vulnerability in 2008-09, contrary to
Blanchard et al (2009), Rose and Spiegel (2009a,b) and others.
Past appreciation as measured by the real effective exchange rate also appears as a
significant leading predictor of currency weakness during the 2008-09 crisis, and has a correct
and consistent sign in all other regressions.
Turning to the next indicators on the list, the credit expansion variables have the
anticipated signs across all measures, and at both the five and ten year horizon: higher credit
growth is associated with higher crisis incidence. Only three out of the ten regressions
considered are statistically significant however. Credit expansion is particularly associated with
greater subsequent stock market weakness.
Three other indicators from the analysis are worth mentioning. First, higher past GDP
growth is associated with larger output drops during the current crisis, as well as a higher
probability of recourse to the IMF. This is the opposite sign from the pre-2008 crisis literature, in
26
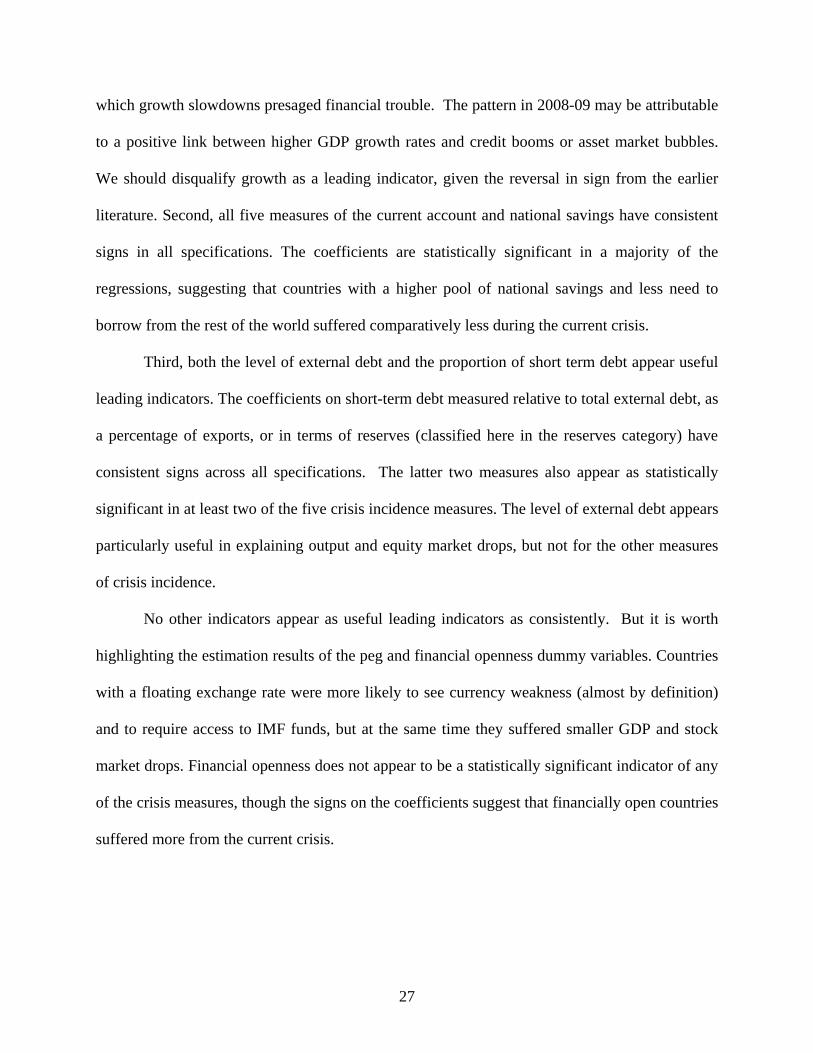
which growth slowdowns presaged financial trouble. The pattern in 2008-09 may be attributable
to a positive link between higher GDP growth rates and credit booms or asset market bubbles.
We should disqualify growth as a leading indicator, given the reversal in sign from the earlier
literature. Second, all five measures of the current account and national savings have consistent
signs in all specifications. The coefficients are statistically significant in a majority of the
regressions, suggesting that countries with a higher pool of national savings and less need to
borrow from the rest of the world suffered comparatively less during the current crisis.
Third, both the level of external debt and the proportion of short term debt appear useful
leading indicators. The coefficients on short-term debt measured relative to total external debt, as
a percentage of exports, or in terms of reserves (classified here in the reserves category) have
consistent signs across all specifications. The latter two measures also appear as statistically
significant in at least two of the five crisis incidence measures. The level of external debt appears
particularly useful in explaining output and equity market drops, but not for the other measures
of crisis incidence.
No other indicators appear as useful leading indicators as consistently. But it is worth
highlighting the estimation results of the peg and financial openness dummy variables. Countries
with a floating exchange rate were more likely to see currency weakness (almost by definition)
and to require access to IMF funds, but at the same time they suffered smaller GDP and stock
market drops. Financial openness does not appear to be a statistically significant indicator of any
of the crisis measures, though the signs on the coefficients suggest that financially open countries
suffered more from the current crisis.
27
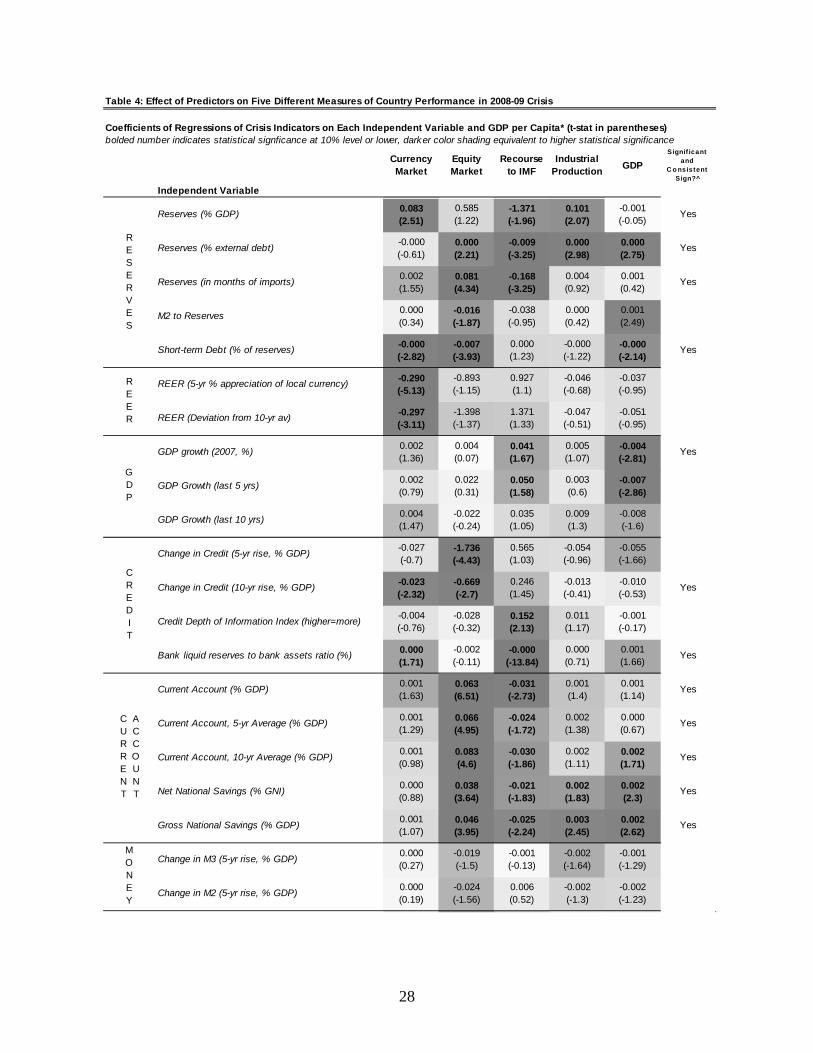
Table 4: Effect of Predictors on Five Different Measures of Country Performance in 2008-09 Crisis
Coefficients of Regressions of Crisis Indicators on Each Independent Variable and GDP per Capita* (t-stat in parentheses)bolded number indicates statistical signficance at 10% level or lower, darker color shading equivalent to higher statistical significance
Currency Market
Equity Market
Recourse to IMF
Industrial Production GDP
Signif icant and
C o nsistent Sign?^
Independent Variable
Reserves (% GDP) 0.083 (2.51)
0.585 (1.22)
-1.371 (-1.96)
0.101 (2.07)
-0.001 (-0.05)
Yes
Reserves (% external debt) -0.000 (-0.61)
0.000 (2.21)
-0.009 (-3.25)
0.000 (2.98)
0.000 (2.75)
Yes
Reserves (in months of imports) 0.002 (1.55)
0.081 (4.34)
-0.168 (-3.25)
0.004 (0.92)
0.001 (0.42)
Yes
M2 to Reserves 0.000 (0.34)
-0.016 (-1.87)
-0.038 (-0.95)
0.000 (0.42)
0.001 (2.49)
Short-term Debt (% of reserves) -0.000 (-2.82)
-0.007 (-3.93)
0.000 (1.23)
-0.000 (-1.22)
-0.000 (-2.14)
Yes
REER (5-yr % appreciation of local currency) -0.290 (-5.13)
-0.893 (-1.15)
0.927 (1.1)
-0.046 (-0.68)
-0.037 (-0.95)
REER (Deviation from 10-yr av) -0.297 (-3.11)
-1.398 (-1.37)
1.371 (1.33)
-0.047 (-0.51)
-0.051 (-0.95)
GDP growth (2007, %) 0.002 (1.36)
0.004 (0.07)
0.041 (1.67)
0.005 (1.07)
-0.004 (-2.81)
Yes
GDP Growth (last 5 yrs) 0.002 (0.79)
0.022 (0.31)
0.050 (1.58)
0.003 (0.6)
-0.007 (-2.86)
GDP Growth (last 10 yrs) 0.004 (1.47)
-0.022 (-0.24)
0.035 (1.05)
0.009 (1.3)
-0.008 (-1.6)
Change in Credit (5-yr rise, % GDP) -0.027 (-0.7)
-1.736 (-4.43)
0.565 (1.03)
-0.054 (-0.96)
-0.055 (-1.66)
Change in Credit (10-yr rise, % GDP) -0.023 (-2.32)
-0.669 (-2.7)
0.246 (1.45)
-0.013 (-0.41)
-0.010 (-0.53)
Yes
Credit Depth of Information Index (higher=more) -0.004 (-0.76)
-0.028 (-0.32)
0.152 (2.13)
0.011 (1.17)
-0.001 (-0.17)
Bank liquid reserves to bank assets ratio (%) 0.000 (1.71)
-0.002 (-0.11)
-0.000 (-13.84)
0.000 (0.71)
0.001 (1.66)
Yes
Current Account (% GDP) 0.001 (1.63)
0.063 (6.51)
-0.031 (-2.73)
0.001 (1.4)
0.001 (1.14)
Yes
Current Account, 5-yr Average (% GDP) 0.001 (1.29)
0.066 (4.95)
-0.024 (-1.72)
0.002 (1.38)
0.000 (0.67)
Yes
Current Account, 10-yr Average (% GDP) 0.001 (0.98)
0.083 (4.6)
-0.030 (-1.86)
0.002 (1.11)
0.002 (1.71)
Yes
Net National Savings (% GNI) 0.000 (0.88)
0.038 (3.64)
-0.021 (-1.83)
0.002 (1.83)
0.002 (2.3)
Yes
Gross National Savings (% GDP) 0.001 (1.07)
0.046 (3.95)
-0.025 (-2.24)
0.003 (2.45)
0.002 (2.62)
Yes
Change in M3 (5-yr rise, % GDP) 0.000 (0.27)
-0.019 (-1.5)
-0.001 (-0.13)
-0.002 (-1.64)
-0.001 (-1.29)
Change in M2 (5-yr rise, % GDP) 0.000 (0.19)
-0.024 (-1.56)
0.006 (0.52)
-0.002 (-1.3)
-0.002 (-1.23)
RESERVES
REER
GDP
CURRENT
ACCOUNT
CREDIT
MONEY
28
Table 4 continued: Effect of Predictors on Five Different Measures of Country Performance in 2008-09 Crisis
Coefficients of Regressions of Crisis Indicators on Each Independent Variable and GDP per Capita* (t-stat in parentheses)bolded number indicates statistical signficance at 10% level or lower, darker color shading equivalent to higher statistical significance
Currency Market
Equity Market
Recourse to IMF
Industrial Production GDP
Signif icant and
C o nsistent Sign?^
Independent Variable
Trade Balance (% GDP) 0.000 (1.26)
0.043 (3.43)
-0.015 (-1.77)
0.000 (0.6)
0.000 (0.73)
Yes
Exports (% GDP) 0.000 (1.02)
-0.001 (-0.34)
-0.000 (-0.11)
-0.000 (-0.62)
-0.000 (-0.53)
Imports (% GDP) 0.000 (0.15)
-0.005 (-1.17)
0.005 (1.62)
-0.000 (-0.82)
-0.000 (-0.83)
Inflation (average, last 5 yrs) 0.000 (0.11)
0.012 (0.26)
0.071 (2.86)
-0.004 (-1.25)
-0.004 (-1.67)
Inflation (average, last 10 yrs) -0.001 (-1.32)
0.009 (0.4)
0.010 (1.21)
-0.001 (-2.15)
-0.000 (-0.67)
Stock Market (5 yr % change) -0.005 (-1.21)
-0.017 (-0.71)
0.005 (0.12)
-0.005 (-1.08)
-0.002 (-0.68)
Stock Market (5 yr return/st.dev.) -0.038 (-1.51)
-0.540 (-2.14)
0.026 (0.08)
-0.071 (-2.6)
-0.021 (-1.02)
Yes
Real Interest Rate -0.000 (-0.68)
0.025 (1.91)
-0.005 (-0.29)
0.001 (0.77)
0.004 (2.05)
Yes
Deposit Interest Rate -0.006 (-2.44)
0.076 (2.21)
0.032 (1.03)
0.001 (0.77)
-0.002 (-1.56)
Short-term Debt (% of exports) -0.000 (-0.91)
-0.024 (-3.41)
0.000 (0.01)
-0.000 (-1.61)
-0.001 (-2.87)
Yes
Short-term Debt (% of external debt) -0.001 (-1.14)
-0.012 (-0.55)
0.006 (0.83)
-0.000 (-0.13)
-0.000 (-0.02)
Public Debt Service (% of exports) 0.001 (2.01)
0.026 (0.95)
-0.012 (-1.19)
-0.001 (-0.75)
0.002 (1.33)
Public Debt Service (% GNI) 0.001 (2)
-0.003 (-0.11)
-0.031 (-0.73)
-0.005 (-0.74)
0.007 (1.18)
Multilateral Debt Service (% Public Debt Service) 0.000 (1.19)
-0.003 (-0.41)
0.001 (0.18)
0.000 (0.2)
0.000 (0.64)
Aid (% of GNI) 0.000 (2.45)
-0.035 (-1.11)
-0.012 (-1.16)
-0.000 (-0.12)
-0.007 (-0.48)
Financing via Int. Cap. Markets (gross, % GDP) 0.000 (0.69)
-0.022 (-0.94)
-0.003 (-0.51)
0.001 (0.66)
-0.007 (-2.05)
Legal Rights Index (higher=more rights) -0.008 (-1.99)
-0.112 (-2.15)
0.009 (0.18)
-0.001 (-0.3)
-0.003 (-0.98)
Yes
Business Extent of Disclosure Index (higher=more disclosure)
-0.005 (-1.54)
0.033 (0.65)
0.010 (0.24)
0.007 (1.39)
0.003 (1.31)
Portfolio Flows (% GDP) -0.478 (-3.57)
0.213 (0.07)
2.059 (0.68)
0.602 (1.23)
-0.733 (-0.96)
FDI net inflows (% GDP) -0.000 (-0.09)
-0.001 (-1.94)
0.002 (1.02)
-0.000 (-7.42)
-0.000 (-0.24)
Yes
FDI net outflows (% GDP) -0.000 (-0.27)
0.000 (2.3)
-0.002 (-1.24)
0.000 (7.66)
-0.000 (-0.19)
Yes
Net FDI (% GDP) -0.000 (-0.2)
-0.002 (-0.47)
-0.009 (-0.98)
0.001 (5.91)
-0.000 (-0.9)
CAPITAL
FLOWS
TRADE
INFL.
DEBT COMPOSITI
ON
INT
RATE
STOCK
MKT
29
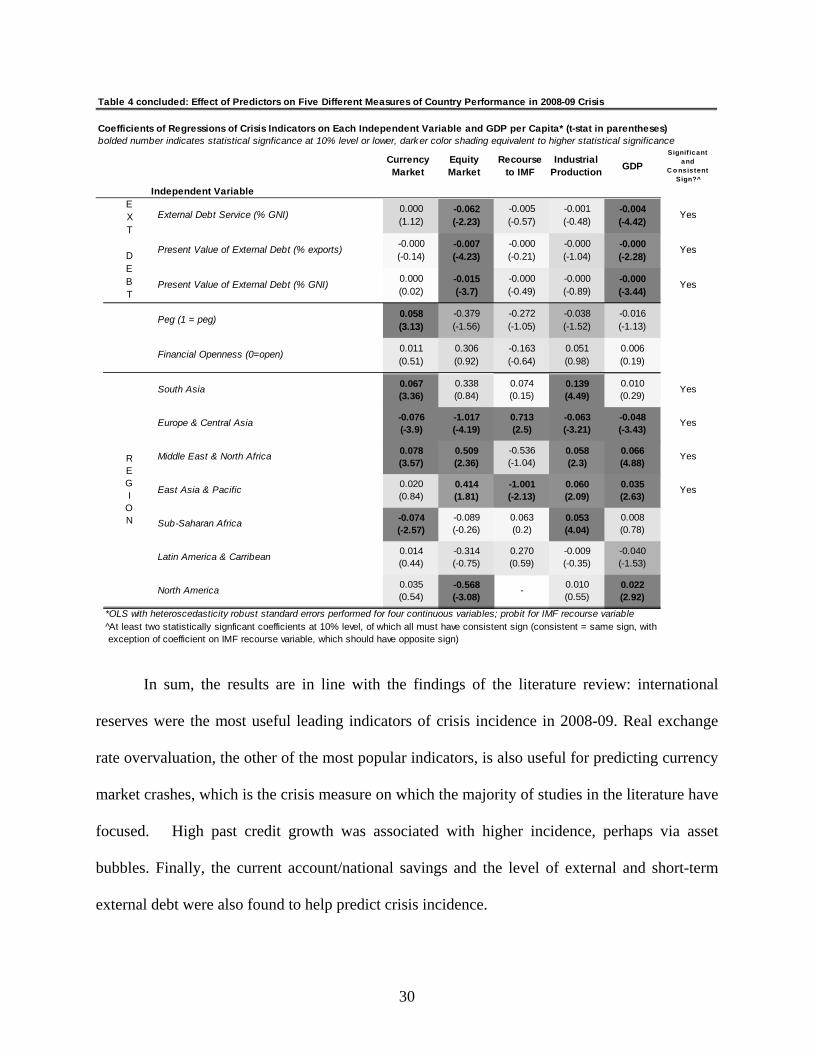
Table 4 concluded: Effect of Predictors on Five Different Measures of Country Performance in 2008-09 Crisis
Coefficients of Regressions of Crisis Indicators on Each Independent Variable and GDP per Capita* (t-stat in parentheses)bolded number indicates statistical signficance at 10% level or lower, darker color shading equivalent to higher statistical significance
Currency Market
Equity Market
Recourse to IMF
Industrial Production GDP
Signif icant and
C o nsistent Sign?^
Independent Variable
External Debt Service (% GNI) 0.000 (1.12)
-0.062 (-2.23)
-0.005 (-0.57)
-0.001 (-0.48)
-0.004 (-4.42)
Yes
Present Value of External Debt (% exports) -0.000 (-0.14)
-0.007 (-4.23)
-0.000 (-0.21)
-0.000 (-1.04)
-0.000 (-2.28)
Yes
Present Value of External Debt (% GNI) 0.000 (0.02)
-0.015 (-3.7)
-0.000 (-0.49)
-0.000 (-0.89)
-0.000 (-3.44)
Yes
Peg (1 = peg) 0.058 (3.13)
-0.379 (-1.56)
-0.272 (-1.05)
-0.038 (-1.52)
-0.016 (-1.13)
Financial Openness (0=open) 0.011 (0.51)
0.306 (0.92)
-0.163 (-0.64)
0.051 (0.98)
0.006 (0.19)
EXT DEBT
South Asia 0.067 (3.36)
0.338 (0.84)
0.074 (0.15)
0.139 (4.49)
0.010 (0.29)
Yes
Europe & Central Asia -0.076 (-3.9)
-1.017 (-4.19)
0.713 (2.5)
-0.063 (-3.21)
-0.048 (-3.43)
Yes
Middle East & North Africa 0.078 (3.57)
0.509 (2.36)
-0.536 (-1.04)
0.058 (2.3)
0.066 (4.88)
Yes
East Asia & Pacific 0.020 (0.84)
0.414 (1.81)
-1.001 (-2.13)
0.060 (2.09)
0.035 (2.63)
Yes
Sub-Saharan Africa -0.074 (-2.57)
-0.089 (-0.26)
0.063 (0.2)
0.053 (4.04)
0.008 (0.78)
Latin America & Carribean 0.014 (0.44)
-0.314 (-0.75)
0.270 (0.59)
-0.009 (-0.35)
-0.040 (-1.53)
North America 0.035 (0.54)
-0.568 (-3.08)
- 0.010 (0.55)
0.022 (2.92)
*OLS with heteroscedasticity robust standard errors performed for four continuous variables; probit for IMF recourse variable^At least two statistically signficant coefficients at 10% level, of which all must have consistent sign (consistent = same sign, with exception of coefficient on IMF recourse variable, which should have opposite sign)
REGI
ON
In sum, the results are in line with the findings of the literature review: international
reserves were the most useful leading indicators of crisis incidence in 2008-09. Real exchange
rate overvaluation, the other of the most popular indicators, is also useful for predicting currency
market crashes, which is the crisis measure on which the majority of studies in the literature have
focused. High past credit growth was associated with higher incidence, perhaps via asset
bubbles. Finally, the current account/national savings and the level of external and short-term
external debt were also found to help predict crisis incidence.
30

3.6 Multivariate Regression for an Exchange Market Pressure Index
The literature has often measured crisis incidence by exchange market pressure indices,
which combine changes in exchange rates and international reserves. Following a similar
methodology to Eichengreen, Rose and Wyplosz (1995), we create an exchange market pressure
index measured as a weighted average of exchange rate and reserve changes. The weights are
determined by the inverse of the relative standard deviation of each series to compensate for the
different volatilities of each series. The changes in the variables are measured from end-August
2008 to end-March 2009, to cover the most severe period of the financial crisis as identified in
Section 3.3. The source of the data is the IMF International Financial Statistics database.
As mentioned earlier, the inclusion of reserves in such an index would bias the estimate
of severity downwards due to the presence of IMF programs that added to reserves during the
crisis. At the same time, valuation distortions due to large exchange rate movements are also
likely to misstate the true pressure on different countries’ reserve holdings depending on their
composition. We attempt to correct for these measurement problems in two ways. First, for those
countries that received IMF funding during the August-March period, reserves are treated as if
they dropped to zero by the end of the period. In the absence of an IMF program, it is
stylistically presumed that these countries would have suffered from a complete depletion of
reserves. Second, to overcome the valuation problem, we make assumptions about their currency
composition. First, we group countries by exchange rate arrangement following the IMF Annual
Report on Exchange Arrangements 2008 categorization (IMF 2008). Currency and reserve
changes in countries with exchange rate anchors to the USD, EUR and a composite basket are
measured in terms of US dollars, euros and SDRs, respectively. Changes in the value of
31
currencies and reserves for all other countries following alternative arrangements are measured
in terms of US dollars.19
Table 5 - Multivariate SpecificationsCoefficient Estimates of Regressions of Exchange Market Pressure Index¹ on Leading Indicatorst-stat in parentheses
1 2 3 4
Independent Variables, as of 2007
Real GDP per capita 0.0014 0.0043 0.0083(0.17) (0.33) (0.58)
Reserves (% GDP) 0.1642 0.1310 0.1247 0.0950(3.63)** (2.03)** (2.00)** (1.56)
Rise in REER² (%, 2003-07) -0.3647 -0.3574 -0.4387(-3.57)** (-3.45)** (-4.61)**
Peg Dummy (1=peg; else 0) 0.1013 0.1009 0.0547(2.95)** (2.95)** (1.59)*
Net FDI (% GDP) 0.0020(1.65)*
Number of Observations 151 65 66 54
R-squared 4% 31% 30% 37%
Heteroscedasticity robust standard errors calculated; OLS for all specifications* if significant at 10% level; ** if significant at 5% level¹A higher index is associated with lower crisis incidence ²a higher REER is associated with local currency appreciation
Regression Specification
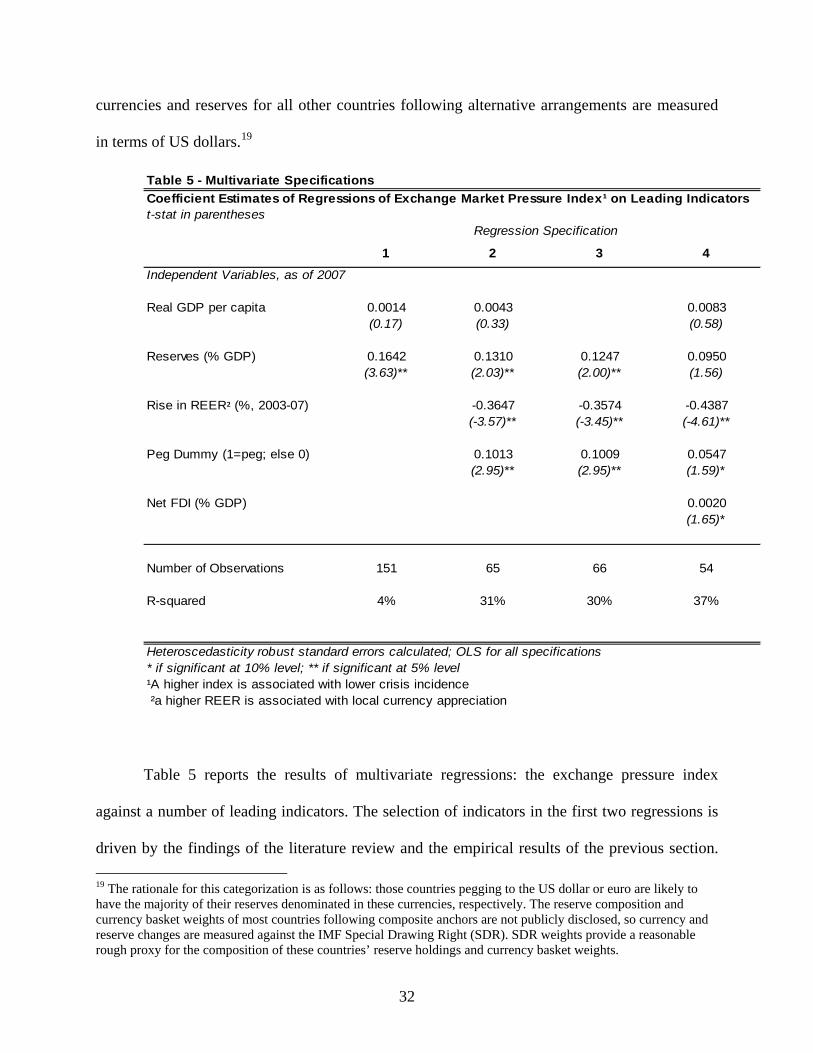
Table 5 reports the results of multivariate regressions: the exchange pressure index
against a number of leading indicators. The selection of indicators in the first two regressions is
driven by the findings of the literature review and the empirical results of the previous section. 19 The rationale for this categorization is as follows: those countries pegging to the US dollar or euro are likely to have the majority of their reserves denominated in these currencies, respectively. The reserve composition and currency basket weights of most countries following composite anchors are not publicly disclosed, so currency and reserve changes are measured against the IMF Special Drawing Right (SDR). SDR weights provide a reasonable rough proxy for the composition of these countries’ reserve holdings and currency basket weights.
32
The second regression combining GDP per capita, reserves, past exchange rate appreciation and
a peg dummy is the baseline specification. We sequentially add variables belonging to each of
the categories of leading indicators.
The coefficients on reserves and the real effective exchange rate retain their significance
for almost all the multivariate specifications considered. The coefficient on reserves relative to
GDP maintains its statistical significance across regressions 1-3 when replaced with reserves
measured in months of imports, but loses significance when reserves are measured in terms of
short-term or external debt and M2.20 Of the additional variables added to the baseline regression
2, only net foreign direct investment appears statistically significant at the 10% significance
level. The results of this augmented specification are reported in the last column of Table 5. The
coefficient on real exchange rate appreciation retains its significance, but reserves lose their
significance. As in the earlier analysis, reserves and the real effective exchange rate stand out as
two of the most important leading indicators.
3.7 Robustness Analysis
This section examines alternative crisis incidence measures to assess the robustness of the
earlier analysis. In addition to the exchange market pressure index analyzed above, we introduce
the following alternative crisis incidence measures: Nominal local currency changes versus the
US dollar are measured from end-June 2008 to the end of June 2009 rather than over the
September 15th – March 9th 2009 period. Equity market returns are measured in terms of
percentage returns over September 15th – March 9th 2009, rather than in terms of risk-adjusted
20 The number of data points falls significantly when reserves are measured in terms of short-term or external debt, perhaps explaining the loss in significance.
33
returns. The recourse to IMF variable is modified to include only access to Standby
Arrangement programs, which are aimed at addressing immediate balance of payment financing
shortfalls.
We have repeated the bivariate analysis of Section 3.5.3 by regressing the exchange
market pressure index and the modified crisis incidence measures on all independent variables
while controlling for GDP per capita.21 Comparing the four modified crisis incidence variables
to those used in the earlier analysis, international reserves again stand out as a useful leading
indicator. All measures of reserves with the exception of the reserves/M2 ratio remain
statistically significant in at least two of the four modified measures. Past real effective exchange
rate appreciation is still a significant variable in explaining currency weakness and is also now
significant in determining the probability of recourse to an IMF Standby Arrangement. The
coefficients on the current account/national savings, credit growth, GDP, and total and short-
term external debt all exhibit similar patterns of statistical significance to the main analysis,
indicating that the results are robust to the methodology used to calculate crisis incidence. 22
4 Economic Significance and Policy Implications
The econometric analysis above confirmed that the top two indicators identified in the
literature review, the level of international reserves and real exchange rate overvaluation, were
also useful leading indicators of the 2008-09 crisis. Reserves appear consistently useful across
the majority of the crisis measures used, while past real exchange rate appreciation – together
21 The results are reported in Appendix III, available online, which is Appendix 7 of NBER WP no. 16047. 22 The most notable differences are that the current account, national savings and the trade balance now appear as statistically significant when used as leading indicators of currency market weakness and the financial openness and peg dummies are significant as leading indicators of recourse to IMF Standby arrangements.
34
with the exchange rate regime - play a significant role in explaining currency weakness as well
as the broader measure of exchange market pressure.
Turning to the economic interpretation of these results, the estimates from the
multivariate specifications in Table 5 help give a sense of the relative impact of reserves and past
currency appreciation in explaining crisis incidence. A level of reserves equivalent to
approximately 100% of GDP is associated with a one standard deviation fall in crisis intensity as
measured through the exchange market pressure index. This is slightly more than half the
difference in 2008-09 crisis intensity experienced between Russia and China. Similarly, a 45%
appreciation in the real exchange rate over the five years prior to 2008 was also associated with
approximately a one standard deviation change in crisis intensity.
Figure 4 compares actual to predicted crisis incidence for selected countries in our
sample according to regression specification 3 of Table 5. The position of each country on the x-
axis and y-axis reflects the relative magnitude of the realized and predicted exchange market
pressure index respectively. Each axis is centered on the median value of the realized and
predicted exchange market pressure index values within the sample. The prediction is the most
accurate where countries lie closer to the dashed line, and least accurate where countries lie on
the north-west and south-east quadrants. The figure gives a useful insight into where our model
goes right and wrong. The predicted incidence for Russia, Colombia, South Africa, Belgium,
Saudi Arabia and China is close to the realized value, for instance. Iceland and Hungary are the
most notable misses in the negative direction, while Australia and Canada are notable misses in
the other direction. The large regression residuals associated with these observations are
presumably to be explained by variables specific to the 2008-09 crisis, and hence not included in
our list of indicators based on the pre-2008 literature.
35

We turn to the probit specification in Table 3 to obtain a better understanding of the
capacity of reserves to forecast recourse to an IMF program in the 2008-09 crisis. Figure 5
presents estimated type I and type II errors derived from a probit model using recourse to the
IMF as a crisis incidence indicator and reserves as % of external debt and income as independent
variables. For any given probability threshold, we identify the relevant type I and type II errors.
No country generates a predicted probability above 50%, with the maximum being 46%. A one
third (33%) probability threshold of recourse to the IMF correctly identifies approximately three
out of every ten countries requiring access to IMF funds, but for every ten countries not going to
the IMF, the specification generates two incorrect signals (type II error). Pre-2008 leading
indicators are useful, but cannot be expected to predict crises with high probability. (Indeed, if
such a thing were possible, the private sector would probably have beat us to it.)
Two key policy implications can be derived from this paper. First, the level of reserves
stands out as a key leading indicator of crisis incidence as measured through a variety of
variables. To the extent that a low level of reserves is a cause, rather than just an indicator of
country vulnerability to external shocks, this would suggest that the large accumulation of
reserves by many developing countries prior to 2008 may have played an important role in
reducing their vulnerability during the latest crisis. It also comes in contrast with some of the
recent research that did not find any role for reserves in shielding countries from the crisis
(Blanchard et al 2009; Rose and Spiegel 2009a).
Second, this paper strikes a more positive note than other recent papers on the usefulness
of leading indicators in predicting crisis incidence. In spite of the differences in financial crisis
characteristics across time and geography, the review of the previous literature identified a
36
number of indicators that had proven useful in explaining crisis incidence. These findings were
confirmed by the empirical investigation of the subsequent 2008-09 crisis.
Nevertheless, the findings require some qualifications. Few of the variables identified
were consistently significant across every one of the crisis measures. Furthermore, we should
recall that the exercise was one of prediction; causality has not been demonstrated. Even so, we
have only looked at what countries are more likely to be impacted, conditional on a global crisis
occurring. A more ambitious early warning system might aspire to predict the timing of crises.
Predictions issued in real time would be especially impressive, but also especially difficult.
It is worth repeating that our paper is in no respect a study of the origins of the global
financial crisis. For example, such a study would want to look at measures of housing prices
and financial deregulation in the US and other countries leading up to 2007.23 But the origin of
the 2007-08 financial crisis in the US subprime housing market is a separate question from
vulnerability among smaller countries to transmission of such a crisis. In any case, housing
prices and financial regulation were not among the early warning indicators that existed in the
international crisis literature. Thus we did not include them.
5 Conclusion
Our extensive review of the early warning indicators literature found a number of
variables to be consistently useful in predicting financial crisis incidence across time, country
and crisis in earlier work. We used these indicators to analyze empirically the effects of the
subsequent 2008-09 crisis. International reserves and real exchange rate overvaluation, the top
two indicators identified in the review, stood out as useful leading indicators of the more recent
23 Claessens, Dell’Ariccia, Igan, and Laeven (2010) and Giannone, Lenza and Reichlin (2011) found predictive success with housing prices and financial regulatory liberalization, respectively.
37
crisis. Reserves were robust to a number of crisis incidence definitions as well as the inclusion of
additional independent variables in multivariate specifications using an exchange market
pressure index as a measure of crisis severity. Past exchange rate overvaluation proved useful,
but only for measures that defined a crisis in terms of the currency.
A number of other variables appear as potentially useful leading indicators during the
current crisis, though their robustness across different crisis incidence measures and
specifications was not as compelling. Lower past credit growth, larger current accounts/saving
rates, and lower external and short-term debt were associated with lower crisis incidence.
Ample room remains for further research into the effectiveness of early warning systems.
REFERENCES Abiad, Abdul, 2003. "Early Warning Systems: A Survey and a Regime-Switching Approach," IMF Working Papers 03/32, International Monetary Fund. Aït-Sahalia, Yacine, Jochen Andritzky, Andreas Jobst, Sylwia Nowak, and Natalia Tamirisia, 2010, “Market Response to Policy Initiatives During the Global Financial Crisis,” NBER Working Paper No. 15809, March. Apoteker, Thierry, and Sylvain Barthelemy, 2000. "Genetic Algorithms and Financial Crises in Emerging Markets", AFFI International Conference in Finance Processing, 2000. Bebczuk, Ricardo, Ugo Panizza and Arturo Galindo, 2006. "An Evaluation of the Contractionary Devaluation Hypothesis," RES Working Papers 4486, Inter-American Development Bank. Berg, Andrew, and Catherine Pattillo, 1999, "Are Currency Crises Predictable? A Test," IMF Staff Papers, vol. 46 (2). Berg, Andrew, and Catherine Pattillo, 1999b, "Predicting Currency Crises: The Indicators Approach and an Alternative," Journal of International Money and Finance, vol. 18(4), pages 561-586, August. Berkmen, Pelin, Gasaton Gelos, Robert Rennhack and James Walsh, 2009, "The Global Financial Crisis: Explaining Cross-Country Differences in the Output Impact," IMF Working Papers 09/280, International Monetary Fund.
38
Blanchard, Olivier, Hamid Faruqee, and Vladimir Klyuev, 2009. "Did Foreign Reserves Help Weather the Crisis," IMF Survey Magazine, IMF, Oct. 8th. http://www.imf.org/external/pubs/ft/survey/so/2009/num100809a.htm Borensztein, Eduardo, Catherine Pattillo and Andrew Berg, 2004, "Assessing Early Warning Systems: How Have They Worked in Practice?" IMF Working Papers 04/52. Brüggemann, Axel, and Thomas Linne, 1999. "How Good are Leading Indicators for Currency and Banking Crises in Central and Eastern Europe? An Empirical Test," IWH Discussion Papers 95, Halle Institute for Economic Research. Bussiere, Matthieu, and Christian Mulder, 1999. "External Vulnerability in Emerging Market Economies - How High Liquidity Can Offset Weak Fundamentals and the Effects of Contagion," IMF Working Papers 99/88, International Monetary Fund. Bussiere, Matthieu, and Christian Mulder, 2000. "Political Instability and Economic Vulnerability," International Journal of Finance & Economics, vol. 5(4), pages 309-30, October. Chinn, Menzie, and Hiro Ito, 2008. "A New Measure of Financial Openness," Journal of Comparative Policy Analysis 10(3): 309–22. Data for Chinn-Ito financial openness measure extending to 2007, updated February 2009 downloaded from: http://www.ssc.wisc.edu/~mchinn/research.html Collins, Susan, 2003. Probabilities, Probits and the Timing of Currency Crises, Georgetown University, The Brookings Institution and NBER. Corsetti, Giancarlo, Paolo Pesenti, and Nouriel Roubini, 1998. "Paper Tigers? A Model of the Asian Crisis," Research Paper 9822, Federal Reserve Bank of New York. Davis, Philip, and Dilruba Karim, 2008. "Comparing Early Warning Systems for Banking Crises," Journal of Financial Stability, Elsevier, vol. 4(2), pages 89-120, June. Demirguc-Kunt, Asli, and Enrica Detragiache, 2005. "Cross-country Empirical Studies of Systemic Bank Distress : A Survey," Policy Research Working Paper Series 3719, World Bank. Dominguez, Kathryn, Yukio Hashimoto and Takatoshi Ito, 2011, “International Reserves and the Global Financial Crisis,” NBER conference on the Global Financial Crisis, Bretton Woods, June. Edison, Hali, 2003."Do Indicators of Financial Crises Work? An Evaluation of an Early Warning System," International Journal of Finance and Economics, vol. 8(1), pages 11-53. Edwards, Sebastian, 1989, Real Exchange Rates, Devaluation, and Adjustment: Exchange Rate Policy in Developing Countries (MIT Press Cambridge, MA). Edwards, Sebastian, and Julio Santaella, 1993, "Devaluation Controversies in the Developing Countries: Lessons from the Bretton Woods Era," in: A Retrospective on the Bretton Woods System: Lessons for International Monetary Reform, pages 405-460, NBER.
39

Eichengreen, Barry, et. al., 1995. "Exchange Market Mayhem: The Antecedents and Aftermath of Speculative Attacks", Economic Policy, Vol. 10, No. 21, pp. 249-312, October. Frankel, Jeffrey, and Andrew Rose, 1996, “Currency Crashes in Emerging Markets: An Empirical Treatment,” Journal of International Economics 41, no. 3/4, 351-366. Frankel, Jeffrey, and Shang-Jin Wei, 2005. "Managing Macroeconomic Crises," in Managing Economic Volatility and Crises: A Practitioner’s Guide, edited by Joshua Aizenman and Brian Pinto (Cambridge University Press; paperback 2010). Fratzscher, Marcel, 1998, "Why Are Currency Crises Contagious? A Comparison of the Latin American Crisis of 1994–1995 and the Asian Crisis of 1997–1998," Weltwirtschaftliches Archiv, Vol. 134, No. 4, pp. 664–91. Fratzscher, Marcel, 2011, “Capital Flows, Global Shocks and the 2007-08 Financial Crisis,” NBER conference on the Global Financial Crisis, Bretton Woods NH, June. Furman, Jason, and Joseph Stiglitz, 1998. "Economic Crises: Evidence and Insights from East Asia," Brookings Papers on Economic Activity, No. 2, pp. 1-135. Ghosh, Swati R., and Atish R. Ghosh, 2003. "Structural Vulnerabilities and Currency Crises," IMF Staff Papers, Palgrave Macmillan Journals, vol. 50(3), page 7. Giannone, Domenico, Michele Lenza and Lucrezia Reichlin, 2011. "Market Freedom and the Global Recession," IMF Economic Review, vol. 59(1), pp. 111-135, April. Goldfajn, Ilan and Rodrigo O. Valdes, 1998, "Are Currency Crises Predictable?," European Economic Review, Elsevier, vol. 42(3-5), pp. 873-885, May. Grier, Kevin and Robin Grier, 2001. “Exchange Rate Regimes and the Cross-Country Distribution of the 1997 Financial Crisis,” Economic Inquiry, vol. 39(1), pages 139-48, January. Hawkins, John and Marc Klau, 2000. "Measuring potential vulnerabilities in emerging market economies," BIS Working Papers 91, Bank for International Settlements. Herrera, Santiago, and Conrado Garcia ,1999. "User's Guide to an Early Warning System for Macroeconomic Vulnerability in Latin American Countries," Policy Research Working Paper Series 2233, The World Bank. Honohan, Patrick, 1997. "Banking system failures in developing and transition countries: Diagnosis and predictions," BIS Working Papers 39, Bank for International Settlements. International Monetary Fund, 2008, Annual Report on Exchange Arrangements and Exchange Restrictions 2008, International Monetary Fund, Washington, DC. JP Morgan, 2010, JPMorgan Global Manufacturing and Services PMI News Release, January 6.
40
Kamin, Steven, 1988. "Devaluation, External Balance, And Macroeconomic Performance: A Look At The Numbers," Princeton Studies in International Economics 62, International Economics Section, Department of Economics Princeton University. Kamin, Steven, John Schindler, and Shawna Samuel, 2001, "The Contribution of Domestic and External Factors to Emerging Market Devaluation Crises: An Early Warning Systems Approach," International Finance Discussion Papers 711, Federal Reserve Board. Kaminsky, Graciela, 1999, "Currency and Banking Crises - The Early Warnings of Distress," IMF Working Papers 99/178, International Monetary Fund. Kaminsky, Graciela, and Leonardo Leiderman, 1996, "High Real Interest Rates in the Aftermath of Disinflation: Is it a Lack of Credibility?" International Finance Discussion Papers 543, Board of Governors of the Federal Reserve System. Kaminsky, Graciela, Saul Lizondo and Carmen Reinhart, 1998. "Leading Indicators of Currency Crisis," IMF Staff Papers, Palgrave Macmillan Journals, vol. 45(1). Kaminsky, Graciela, and Carmen M. Reinhart, 1999. "The twin crises: the causes of banking and balance-of-payments problems," American Economic Review, vol. 89(3). Kaufmann, Daniel, Gil Mehrez and Sergio Schmukler, 2005, "Predicting Currency Fluctuations and Crises - Do Resident Firms Have an Informational Advantage?" Journal of International Money and Finance, vol.24 (6). Klein, Michael, and Nancy Marion, 1997, "Explaining the Duration of Exchange-Rate Pegs," Journal of Development Economics, vol. 54 (2). Klein, Michael, and Jay Shambaugh, 2006, "The Nature of Exchange Rate Regimes," NBER Working Papers 12729. Data for exchange rate regime downloaded from http://www.dartmouth.edu/~jshambau/
Lane, Philip, and Gian Maria Milesi-Ferretti, 2011, "The Cross-Country Incidence of the Global Crisis," IMF Economic Review 59, 77–110. IMF Working Papers 10/171. Llaudes, Ricardo, Ferhan Salman and Mali Chivakul, 2011, “The Impact of the Great Recession on Emerging Markets,” IMF Research Bulletin, 12, no. 2, June. Summary of IMF WP 10/237. Manasse, Paolo, and Nouriel Roubini, 2009. "Rules of thumb for sovereign debt crises," Journal of International Economics, Elsevier, vol. 78(2), pages 192-205, July. Milesi-Ferretti, Gian Maria, and Assaf Razin, 1998. "Current Account Reversals and Currency Crises: Empirical Regularities," CEPR Discussion Papers 1921.
41

Moreno, Ramon, 1995. "Macroeconomic Behavior During Periods of Speculative Pressure or Realignment: Evidence from Pacific Basin economies," Economic Review, pp 3-16, Federal Reserve Bank of San Francisco. Nag, Ashok, and Amit Mitra, 1999. "Neural Networks and Early Warning Indicators of Currency Crisis," Reserve Bank of India Occasional Papers, 20 (2), pp. 183-222. Obstfeld, Maurice, Jay Shambaugh and Alan Taylor, 2009, “Financial Instability, Reserves, and Central Bank Swap Lines in the Panic of 2008,” American Economic Review 99, 2, May, 480-86. Obstfeld, Maurice, Jay Shambaugh, and Alan Taylor, 2010, “Financial Stability, the Trilemma, and International Reserves.” American Economic Journal: Macroeconomics. Osband, Kent, and Caroline Rijckeghem, 2000, "Safety from Currency Crashes," IMF Staff Papers, vol. 47(2). Perrelli, Roberto, Manuel Rocha and Christian Mulder, 2002, “The Role of Corporate, Legal and Macroeconomic Balance Sheet Indicators in Crisis Detection and Prevention,” IMF Working Papers 02/59, International Monetary Fund. Peria, M. Soledad Martinez, 2002, "A Regime-switching Approach to the Study of Speculative Attacks: A Focus on EMS Crises," Empirical Economics, vol. 27(2), pages 299-334. Rose, Andrew, and Mark Spiegel, 2009. “The Causes and Consequences of the 2008 Crisis: Early Warning,” Global Journal of Economics, forthcoming. NBER Working Papers 15357. Rose, Andrew, and Mark Spiegel, 2010, “The Causes and Consequences of the 2008 Crisis: International Linkages and American Exposure,” Pacific Economic Review. Rose, Andrew, and Mark Spiegel, 2011, “Cross-country Causes and Consequences of the Crisis: An Update,” Special Issue: Advances in International Macroeconomics: Lessons from the Crisis European Economic Review, Volume 55, Issue 3, April 2011, Pages 309-324. Sachs, Jeffrey, Aaron Tornell, and Andres Velasco, 1996. "Financial Crises in Emerging Markets: The Lessons from 1995," Brookings Papers on Economic Activity, 27, No.1: 147-199. Shimpalee, Pattama, and Janice Boucher Breuer, 2006. "Currency crises and institutions," Journal of International Money and Finance, Elsevier, vol. 25(1), pages 125-145, February. Tornell, Aaron, 1999. "Common Fundamentals in the Tequila and Asian Crises," Harvard Institute of Economic Research Working Papers 1868. Vlaar, P.J.G. , 2000. "Currency Crises Models for Emerging Markets," WO Research Memoranda (discontinued) 595, Netherlands Central Bank, Research Department.
42

Figure 1: Equity Market Volatility and Bond Spreads
0102030405060708090
Jan-08 Apr-08 Jul-08 Oct-08 Jan-09 Apr-09 Jul-09 Oct-09012345678910VIX (lhs)
JPM EMBI+ (rhs)
Sep 15th, 2008 Mar 5th, 2009
Figure 2: Equity Markets and US Trade Weighted Dollar
0
200
400
600
800
1000
1200
1400
1600
1800
Jan-08 Apr-08 Jul-08 Oct-08 Jan-09 Apr-09 Jul-09 Oct-09
80
85
90
95
100
105
110
115
120
MSCI EM (lhs)MSCI World (lhs)Fed Broad Trade Weighted Dollar (rhs, inverted)
Sep 15th, 2008 Mar 5th, 2009
Figure 3: Best and Worst Performing Countries by Crisis Incidence Indicator
-25% -20% -15% -10% -5% 0% 5% 10%
China
India
Morocco
Egypt, Arab Rep.
Indonesia
Jordan
Sri Lanka
Argentina
Poland
Australia
Turkey
Finland
Mexico
Georgia
Russian Federation
Macao, China
Estonia
Ukraine
Latvia
Lithuania
GDP Change, Q2 2008 to Q2 2009
Top 10
Bottom 10
64 countries in sample
Industrial Production Change, Q2 2008 to Q2 2009
-40% -30% -20% -10% 0% 10% 20%
China
India
Jordan
Kazakhstan
Ireland
Indonesia
Switzerland
Korea, Rep.
Nicaragua
M aurit ius
Hungary
Slovak Republic
Finland
Slovenia
Italy
Sweden
Japan
Ukraine
Estonia
Luxembourg
Top 10
Bottom 10
58 countries in sample
43
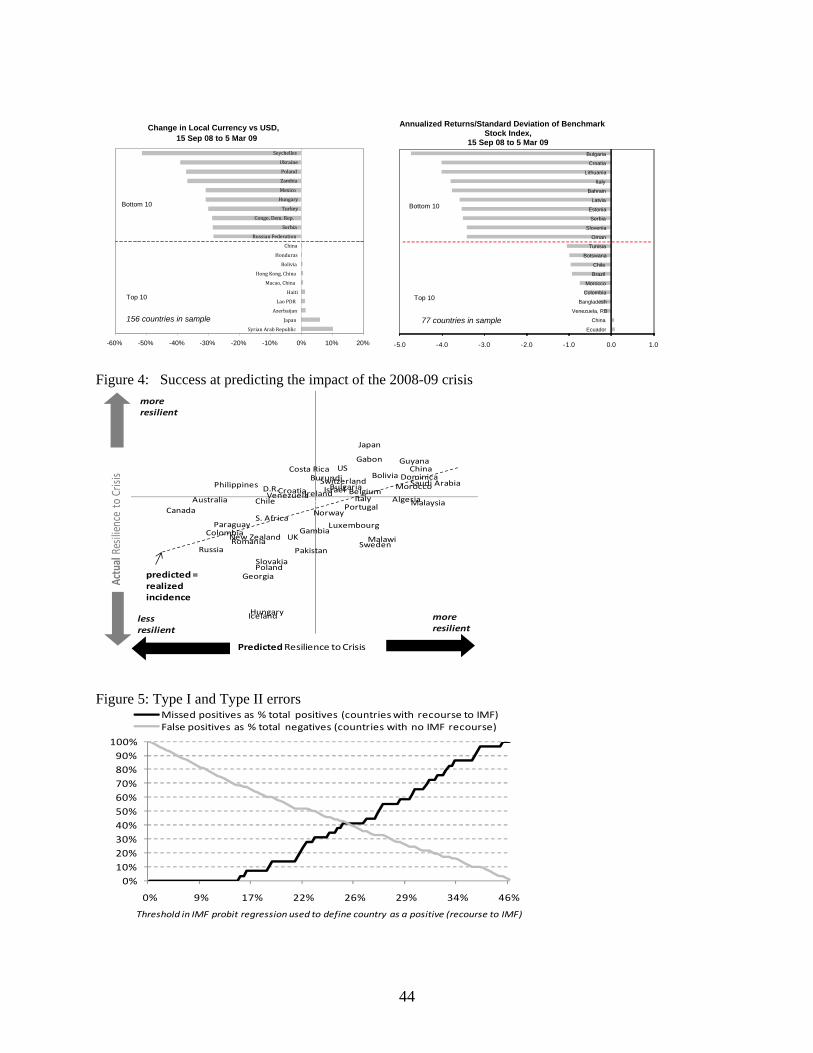
Error! Reference source not found. Figure 4: Success at predicting the impact of the 2008-09 crisis
AlgeriaAustraliaBelgium
BoliviaBulgaria
Burundi
CanadaChile
China
Colombia
Costa Rica
Croatia
Denmark
Dominica
D.R.
Gabon
Gambia
Georgia
Greece
Guyana
HungaryIceland
IrelandIsraelItaly
Japan
Luxembourg
Malawi
Malaysia
Morocco
New Zealand
Norway
Pakistan
Paraguay
Philippines
Poland
Portugal
RomaniaRussia
Saudi Arabia
Slovakia
S. Africa
Sweden
Switzerland
UK
US
Venezuela
PredictedResilience to Crisis
Actual Resilience to Crisis
lessresilient
more resilient
more resilient
predicted= realized incidence
Figure 5: Type I and Type II errors
0%10%20%30%40%50%60%70%80%90%100%
0% 9% 17% 22% 26% 29% 34% 46%
Missed positives as % total positives (countries with recourse to IMF)False positives as % total negatives (countries with no IMF recourse)
Threshold in IMF probit regression used to define country as a positive (recourse to IMF)
Change in Local Currency vs SD, A U15 Sep 08 to 5 Mar 09
-60% -50% -40% -30% -20% -10% 0% 10% 20%
Syrian Arab Republic Japan Azerbaijan Lao PDR Haiti Macao, China Hong Kong, China Bolivia Honduras China Russian Federation Serbia Congo, Dem. Rep. Turkey Hungary Mexico Zambia Poland Ukraine Seychelles
-4.0 -3.0 -2.0 -1.0 0.0 1.0
Ecuador China Venezuela, RB Bangladesh Colombia Morocco Brazil Chile Botswana Tunisia Oman Slovenia Serbia Estonia Latvia Bahrain Italy Lithuania Croatia Bulgaria
nnualized Returns/Standard Deviation of Benchmark Stock Index,
15 Sep 08 to 5 Mar 09
Top 10
Bottom 10
156 countries in sample Top 10
Bottom 10
77 countries in sample
-5.0
44
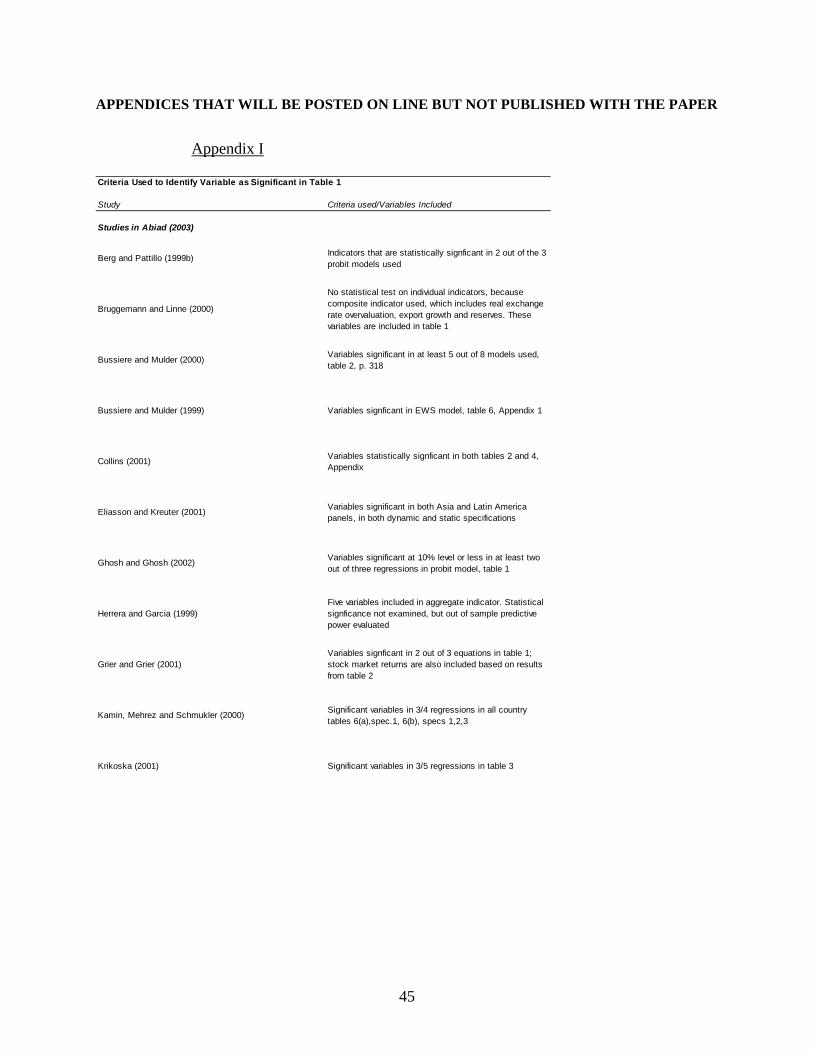
APPENDICES THAT WILL BE POSTED ON LINE BUT NOT PUBLISHED WITH THE PAPER
Appendix I
Criteria Used to Identify Variable as Significant in Table 1
Study Criteria used/Variables Included
Studies in Abiad (2003)
Berg and Pattillo (1999b) Indicators that are statistically signficant in 2 out of the 3 probit models used
Bruggemann and Linne (2000)
No statistical test on individual indicators, because composite indicator used, which includes real exchange rate overvaluation, export growth and reserves. These variables are included in table 1
Bussiere and Mulder (2000) Variables significant in at least 5 out of 8 models used, table 2, p. 318
Bussiere and Mulder (1999) Variables signficant in EWS model, table 6, Appendix 1
Collins (2001) Variables statistically signficant in both tables 2 and 4, Appendix
Eliasson and Kreuter (2001) Variables significant in both Asia and Latin America panels, in both dynamic and static specifications
Ghosh and Ghosh (2002) Variables significant at 10% level or less in at least two out of three regressions in probit model, table 1
Herrera and Garcia (1999)Five variables included in aggregate indicator. Statistical signficance not examined, but out of sample predictive power evaluated
Grier and Grier (2001)Variables signficant in 2 out of 3 equations in table 1; stock market returns are also included based on results from table 2
Kamin, Mehrez and Schmukler (2000) Significant variables in 3/4 regressions in all country tables 6(a),spec.1, 6(b), specs 1,2,3
Krikoska (2001) Significant variables in 3/5 regressions in table 3
45
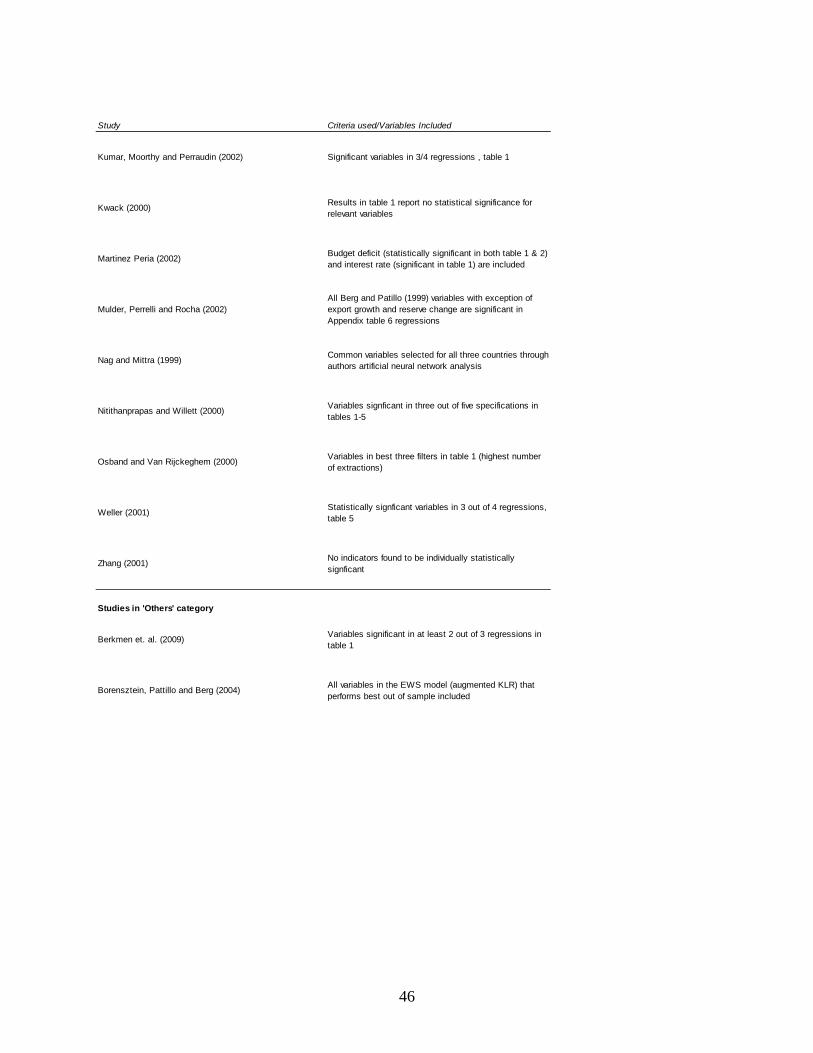
Study Criteria used/Variables Included
Kumar, Moorthy and Perraudin (2002) Significant variables in 3/4 regressions , table 1
Kwack (2000) Results in table 1 report no statistical significance for relevant variables
Martinez Peria (2002) Budget deficit (statistically significant in both table 1 & 2) and interest rate (significant in table 1) are included
Mulder, Perrelli and Rocha (2002)All Berg and Patillo (1999) variables with exception of export growth and reserve change are significant in Appendix table 6 regressions
Nag and Mittra (1999) Common variables selected for all three countries through authors artificial neural network analysis
Nitithanprapas and Willett (2000) Variables signficant in three out of five specifications in tables 1-5
Osband and Van Rijckeghem (2000) Variables in best three filters in table 1 (highest number of extractions)
Weller (2001) Statistically signficant variables in 3 out of 4 regressions, table 5
Zhang (2001) No indicators found to be individually statistically signficant
Studies in 'Others' category
Berkmen et. al. (2009) Variables significant in at least 2 out of 3 regressions in table 1
Borensztein, Pattillo and Berg (2004) All variables in the EWS model (augmented KLR) that performs best out of sample included
46
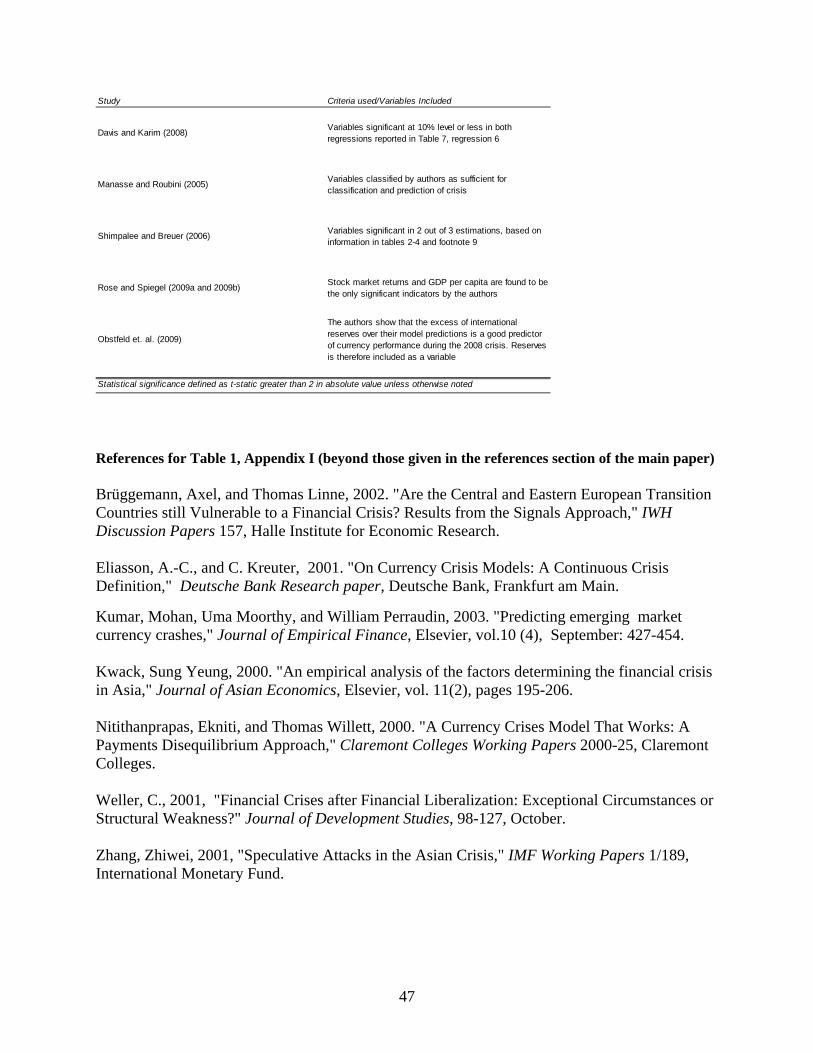
Study Criteria used/Variables Included
Davis and Karim (2008) Variables significant at 10% level or less in both regressions reported in Table 7, regression 6
Manasse and Roubini (2005) Variables classified by authors as sufficient for classification and prediction of crisis
Shimpalee and Breuer (2006) Variables significant in 2 out of 3 estimations, based on information in tables 2-4 and footnote 9
Rose and Spiegel (2009a and 2009b) Stock market returns and GDP per capita are found to be the only significant indicators by the authors
Obstfeld et. al. (2009)
The authors show that the excess of international reserves over their model predictions is a good predictor of currency performance during the 2008 crisis. Reserves is therefore included as a variable
Statistical significance defined as t-static greater than 2 in absolute value unless otherwise noted References for Table 1, Appendix I (beyond those given in the references section of the main paper) Brüggemann, Axel, and Thomas Linne, 2002. "Are the Central and Eastern European Transition Countries still Vulnerable to a Financial Crisis? Results from the Signals Approach," IWH Discussion Papers 157, Halle Institute for Economic Research. Eliasson, A.-C., and C. Kreuter, 2001. "On Currency Crisis Models: A Continuous Crisis Definition," Deutsche Bank Research paper, Deutsche Bank, Frankfurt am Main. Kumar, Mohan, Uma Moorthy, and William Perraudin, 2003. "Predicting emerging market currency crashes," Journal of Empirical Finance, Elsevier, vol.10 (4), September: 427-454. Kwack, Sung Yeung, 2000. "An empirical analysis of the factors determining the financial crisis in Asia," Journal of Asian Economics, Elsevier, vol. 11(2), pages 195-206. Nitithanprapas, Ekniti, and Thomas Willett, 2000. "A Currency Crises Model That Works: A Payments Disequilibrium Approach," Claremont Colleges Working Papers 2000-25, Claremont Colleges. Weller, C., 2001, "Financial Crises after Financial Liberalization: Exceptional Circumstances or Structural Weakness?" Journal of Development Studies, 98-127, October. Zhang, Zhiwei, 2001, "Speculative Attacks in the Asian Crisis," IMF Working Papers 1/189, International Monetary Fund.
47
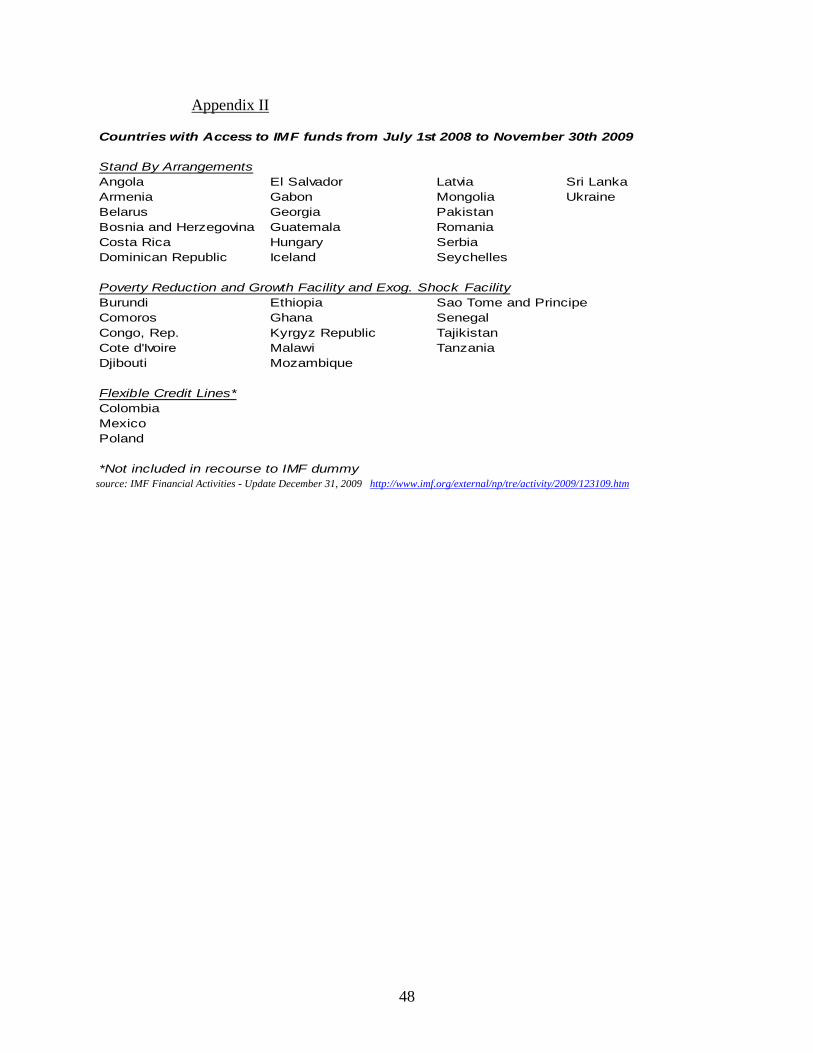
Appendix II
Countries with Access to IMF funds from July 1st 2008 to November 30th 2009
Stand By ArrangementsAngola El Salvador Latvia Sri LankaArmenia Gabon Mongolia UkraineBelarus Georgia PakistanBosnia and Herzegovina Guatemala RomaniaCosta Rica Hungary SerbiaDominican Republic Iceland Seychelles
Poverty Reduction and Growth Facility and Exog. Shock FacilityBurundi Ethiopia Sao Tome and PrincipeComoros Ghana SenegalCongo, Rep. Kyrgyz Republic TajikistanCote d'Ivoire Malawi TanzaniaDjibouti Mozambique
Flexible Credit Lines*ColombiaMexicoPoland
*Not included in recourse to IMF dummy source: IMF Financial Activities - Update December 31, 2009 http://www.imf.org/external/np/tre/activity/2009/123109.htm
48
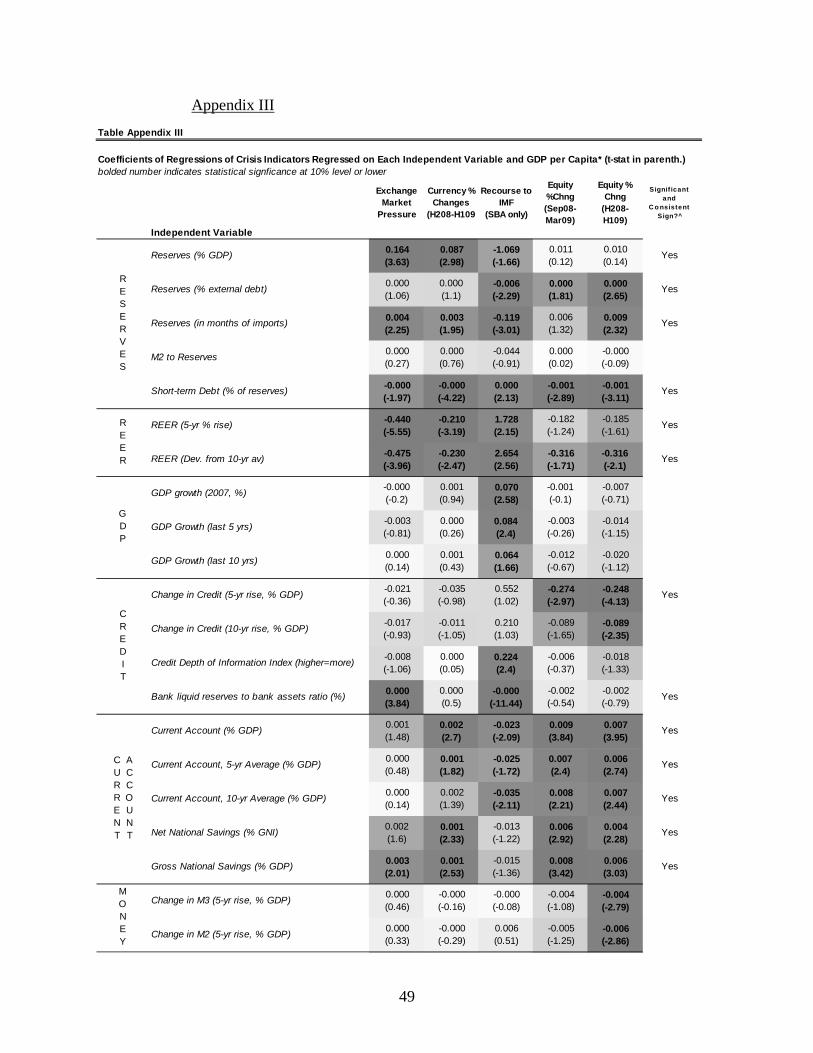
Appendix III
Table Appendix III
Coefficients of Regressions of Crisis Indicators Regressed on Each Independent Variable and GDP per Capita* (t-stat in parenth.)bolded number indicates statistical signficance at 10% level or lower
Exchange Market
Pressure
Currency % Changes
(H208-H109
Recourse to IMF
(SBA only)
Equity %Chng (Sep08-Mar09)
Equity % Chng
(H208-H109)
Signif icant and
C o nsistent Sign?^
Independent Variable
Reserves (% GDP) 0.164 (3.63)
0.087 (2.98)
-1.069 (-1.66)
0.011 (0.12)
0.010 (0.14)
Yes
Reserves (% external debt) 0.000 (1.06)
0.000 (1.1)
-0.006 (-2.29)
0.000 (1.81)
0.000 (2.65)
Yes
Reserves (in months of imports) 0.004 (2.25)
0.003 (1.95)
-0.119 (-3.01)
0.006 (1.32)
0.009 (2.32)
Yes
M2 to Reserves 0.000 (0.27)
0.000 (0.76)
-0.044 (-0.91)
0.000 (0.02)
-0.000 (-0.09)
Short-term Debt (% of reserves) -0.000 (-1.97)
-0.000 (-4.22)
0.000 (2.13)
-0.001 (-2.89)
-0.001 (-3.11)
Yes
REER (5-yr % rise) -0.440 (-5.55)
-0.210 (-3.19)
1.728 (2.15)
-0.182 (-1.24)
-0.185 (-1.61)
Yes
REER (Dev. from 10-yr av) -0.475 (-3.96)
-0.230 (-2.47)
2.654 (2.56)
-0.316 (-1.71)
-0.316 (-2.1)
Yes
GDP growth (2007, %) -0.000 (-0.2)
0.001 (0.94)
0.070 (2.58)
-0.001 (-0.1)
-0.007 (-0.71)
GDP Growth (last 5 yrs) -0.003 (-0.81)
0.000 (0.26)
0.084 (2.4)
-0.003 (-0.26)
-0.014 (-1.15)
GDP Growth (last 10 yrs) 0.000 (0.14)
0.001 (0.43)
0.064 (1.66)
-0.012 (-0.67)
-0.020 (-1.12)
Change in Credit (5-yr rise, % GDP) -0.021 (-0.36)
-0.035 (-0.98)
0.552 (1.02)
-0.274 (-2.97)
-0.248 (-4.13)
Yes
Change in Credit (10-yr rise, % GDP) -0.017 (-0.93)
-0.011 (-1.05)
0.210 (1.03)
-0.089 (-1.65)
-0.089 (-2.35)
Credit Depth of Information Index (higher=more) -0.008 (-1.06)
0.000 (0.05)
0.224 (2.4)
-0.006 (-0.37)
-0.018 (-1.33)
Bank liquid reserves to bank assets ratio (%) 0.000 (3.84)
0.000 (0.5)
-0.000 (-11.44)
-0.002 (-0.54)
-0.002 (-0.79)
Yes
Current Account (% GDP) 0.001 (1.48)
0.002 (2.7)
-0.023 (-2.09)
0.009 (3.84)
0.007 (3.95)
Yes
Current Account, 5-yr Average (% GDP) 0.000 (0.48)
0.001 (1.82)
-0.025 (-1.72)
0.007 (2.4)
0.006 (2.74)
Yes
Current Account, 10-yr Average (% GDP) 0.000 (0.14)
0.002 (1.39)
-0.035 (-2.11)
0.008 (2.21)
0.007 (2.44)
Yes
Net National Savings (% GNI) 0.002 (1.6)
0.001 (2.33)
-0.013 (-1.22)
0.006 (2.92)
0.004 (2.28)
Yes
Gross National Savings (% GDP) 0.003 (2.01)
0.001 (2.53)
-0.015 (-1.36)
0.008 (3.42)
0.006 (3.03)
Yes
Change in M3 (5-yr rise, % GDP) 0.000 (0.46)
-0.000 (-0.16)
-0.000 (-0.08)
-0.004 (-1.08)
-0.004 (-2.79)
Change in M2 (5-yr rise, % GDP) 0.000 (0.33)
-0.000 (-0.29)
0.006 (0.51)
-0.005 (-1.25)
-0.006 (-2.86)
RESERVES
REER
GDP
CURRENT
ACCOUNT
CREDIT
MONEY
49
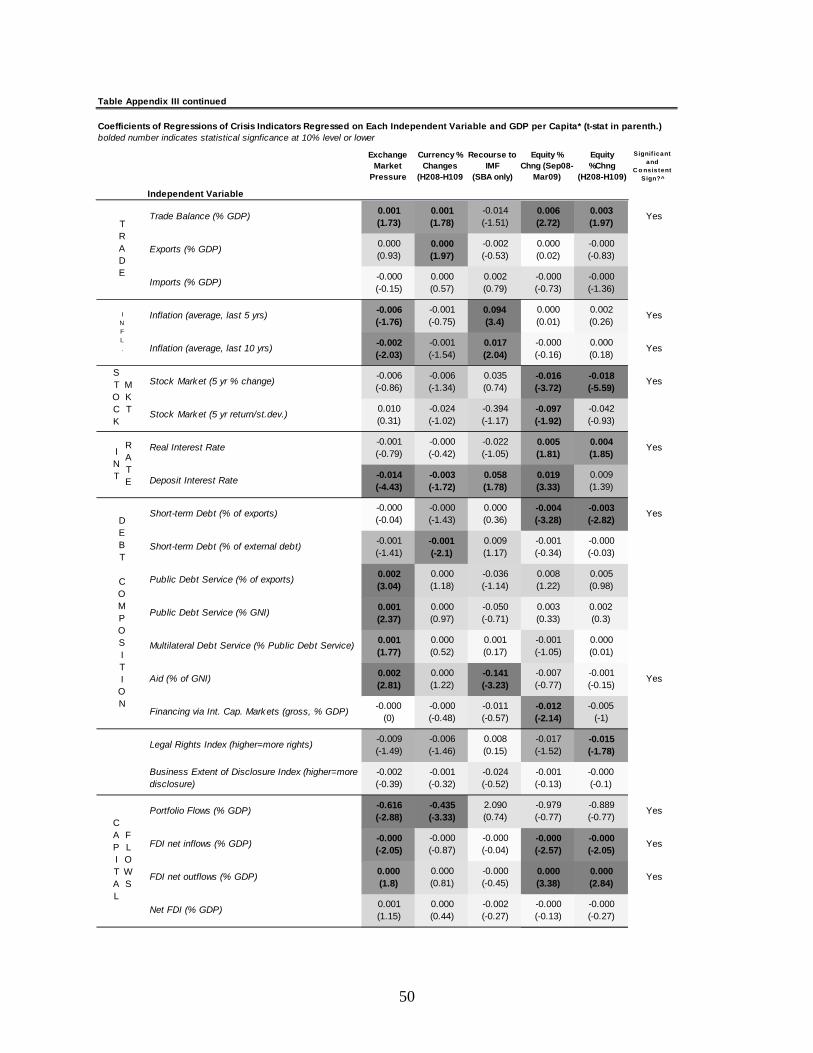
Table Appendix III continued
Coefficients of Regressions of Crisis Indicators Regressed on Each Independent Variable and GDP per Capita* (t-stat in parenth.)bolded number indicates statistical signficance at 10% level or lower
Exchange Market
Pressure
Currency % Changes
(H208-H109
Recourse to IMF
(SBA only)
Equity % Chng (Sep08-
Mar09)
Equity %Chng
(H208-H109)
Signif icant and
C o nsistent Sign?^
Independent Variable
Trade Balance (% GDP) 0.001 (1.73)
0.001 (1.78)
-0.014 (-1.51)
0.006 (2.72)
0.003 (1.97)
Yes
Exports (% GDP) 0.000 (0.93)
0.000 (1.97)
-0.002 (-0.53)
0.000 (0.02)
-0.000 (-0.83)
Imports (% GDP) -0.000 (-0.15)
0.000 (0.57)
0.002 (0.79)
-0.000 (-0.73)
-0.000 (-1.36)
Inflation (average, last 5 yrs) -0.006 (-1.76)
-0.001 (-0.75)
0.094 (3.4)
0.000 (0.01)
0.002 (0.26)
Yes
Inflation (average, last 10 yrs) -0.002 (-2.03)
-0.001 (-1.54)
0.017 (2.04)
-0.000 (-0.16)
0.000 (0.18)
Yes
Stock Market (5 yr % change) -0.006 (-0.86)
-0.006 (-1.34)
0.035 (0.74)
-0.016 (-3.72)
-0.018 (-5.59)
Yes
Stock Market (5 yr return/st.dev.) 0.010 (0.31)
-0.024 (-1.02)
-0.394 (-1.17)
-0.097 (-1.92)
-0.042 (-0.93)
Real Interest Rate -0.001 (-0.79)
-0.000 (-0.42)
-0.022 (-1.05)
0.005 (1.81)
0.004 (1.85)
Yes
Deposit Interest Rate -0.014 (-4.43)
-0.003 (-1.72)
0.058 (1.78)
0.019 (3.33)
0.009 (1.39)
Short-term Debt (% of exports) -0.000 (-0.04)
-0.000 (-1.43)
0.000 (0.36)
-0.004 (-3.28)
-0.003 (-2.82)
Yes
Short-term Debt (% of external debt) -0.001 (-1.41)
-0.001 (-2.1)
0.009 (1.17)
-0.001 (-0.34)
-0.000 (-0.03)
Public Debt Service (% of exports) 0.002 (3.04)
0.000 (1.18)
-0.036 (-1.14)
0.008 (1.22)
0.005 (0.98)
Public Debt Service (% GNI) 0.001 (2.37)
0.000 (0.97)
-0.050 (-0.71)
0.003 (0.33)
0.002 (0.3)
Multilateral Debt Service (% Public Debt Service) 0.001 (1.77)
0.000 (0.52)
0.001 (0.17)
-0.001 (-1.05)
0.000 (0.01)
Aid (% of GNI) 0.002 (2.81)
0.000 (1.22)
-0.141 (-3.23)
-0.007 (-0.77)
-0.001 (-0.15)
Yes
Financing via Int. Cap. Markets (gross, % GDP) -0.000 (0)
-0.000 (-0.48)
-0.011 (-0.57)
-0.012 (-2.14)
-0.005 (-1)
Legal Rights Index (higher=more rights) -0.009 (-1.49)
-0.006 (-1.46)
0.008 (0.15)
-0.017 (-1.52)
-0.015 (-1.78)
Business Extent of Disclosure Index (higher=more disclosure)
-0.002 (-0.39)
-0.001 (-0.32)
-0.024 (-0.52)
-0.001 (-0.13)
-0.000 (-0.1)
Portfolio Flows (% GDP) -0.616 (-2.88)
-0.435 (-3.33)
2.090 (0.74)
-0.979 (-0.77)
-0.889 (-0.77)
Yes
FDI net inflows (% GDP) -0.000 (-2.05)
-0.000 (-0.87)
-0.000 (-0.04)
-0.000 (-2.57)
-0.000 (-2.05)
Yes
FDI net outflows (% GDP) 0.000 (1.8)
0.000 (0.81)
-0.000 (-0.45)
0.000 (3.38)
0.000 (2.84)
Yes
Net FDI (% GDP) 0.001 (1.15)
0.000 (0.44)
-0.002 (-0.27)
-0.000 (-0.13)
-0.000 (-0.27)
STOCK
MKT
TRADE
INFL.
DEBT COMPOSITI
ON
INT
RATE
CAPITAL
FLOWS
50
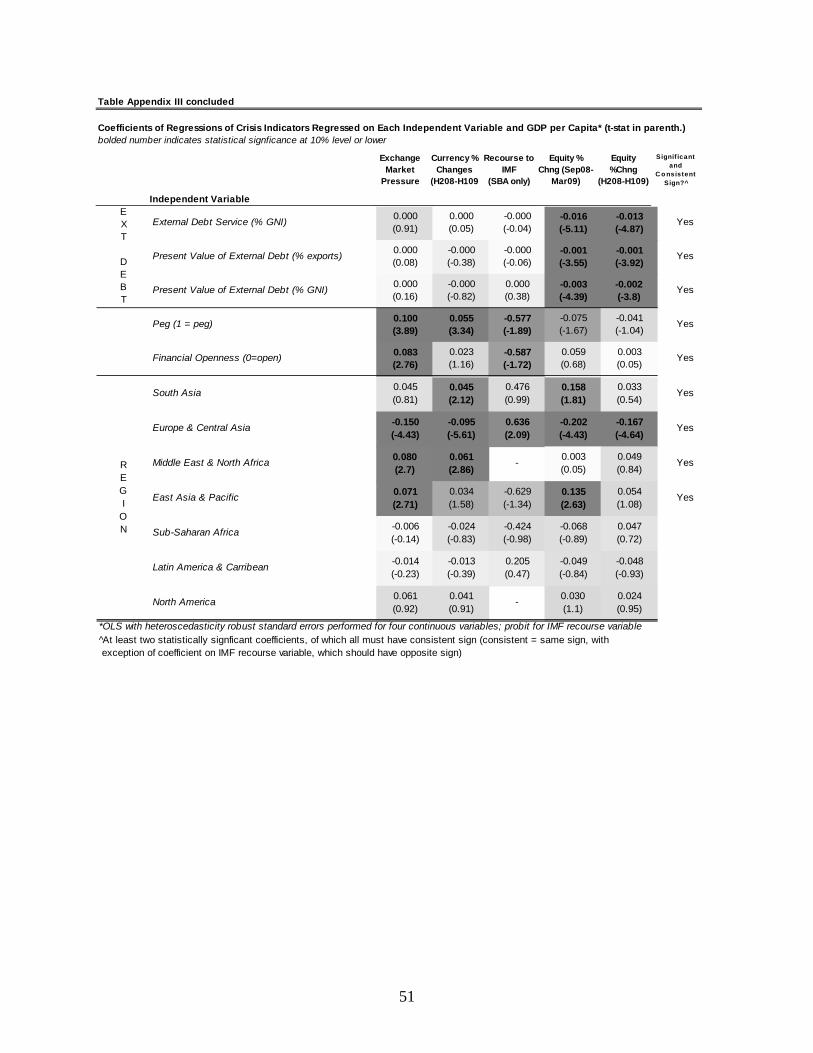
Table Appendix III concluded
Coefficients of Regressions of Crisis Indicators Regressed on Each Independent Variable and GDP per Capita* (t-stat in parenth.)bolded number indicates statistical signficance at 10% level or lower
Exchange Market
Pressure
Currency % Changes
(H208-H109
Recourse to IMF
(SBA only)
Equity % Chng (Sep08-
Mar09)
Equity %Chng
(H208-H109)
Signif icant and
C o nsistent Sign?^
Independent Variable External Debt Service (% GNI) 0.000
(0.91)0.000 (0.05)
-0.000 (-0.04)
-0.016 (-5.11)
-0.013 (-4.87)
Yes
Present Value of External Debt (% exports) 0.000 (0.08)
-0.000 (-0.38)
-0.000 (-0.06)
-0.001 (-3.55)
-0.001 (-3.92)
Yes
Present Value of External Debt (% GNI) 0.000 (0.16)
-0.000 (-0.82)
0.000 (0.38)
-0.003 (-4.39)
-0.002 (-3.8)
Yes
Peg (1 = peg) 0.100 (3.89)
0.055 (3.34)
-0.577 (-1.89)
-0.075 (-1.67)
-0.041 (-1.04)
Yes
Financial Openness (0=open) 0.083 (2.76)
0.023 (1.16)
-0.587 (-1.72)
0.059 (0.68)
0.003 (0.05)
Yes
EXT DEBT
South Asia 0.045
(0.81)0.045 (2.12)
0.476 (0.99)
0.158 (1.81)
0.033 (0.54)
Yes
Europe & Central Asia -0.150 (-4.43)
-0.095 (-5.61)
0.636 (2.09)
-0.202 (-4.43)
-0.167 (-4.64)
Yes
Middle East & North Africa 0.080 (2.7)
0.061 (2.86)
- 0.003 (0.05)
0.049 (0.84)
Yes
East Asia & Pacific 0.071 (2.71)
0.034 (1.58)
-0.629 (-1.34)
0.135 (2.63)
0.054 (1.08)
Yes
Sub-Saharan Africa -0.006 (-0.14)
-0.024 (-0.83)
-0.424 (-0.98)
-0.068 (-0.89)
0.047 (0.72)
Latin America & Carribean -0.014 (-0.23)
-0.013 (-0.39)
0.205 (0.47)
-0.049 (-0.84)
-0.048 (-0.93)
North America 0.061 (0.92)
0.041 (0.91)
- 0.030 (1.1)
0.024 (0.95)
*OLS with heteroscedasticity robust standard errors performed for four continuous variables; probit for IMF recourse variable^At least two statistically signficant coefficients, of which all must have consistent sign (consistent = same sign, with exception of coefficient on IMF recourse variable, which should have opposite sign)
REGI
ON
51

Appendix IV – The Effect of Financial Market Development on Crisis Incidence
Though not figuring prominently in the earlier literature, variables relating to financial
market development may be particularly relevant given the origins of the 2008-09 crisis. This
appendix examines the relationship between financial market development and crisis incidence.
We measure levels of financial sector development by domestic credit, M2 and M3 expressed as
a percentage of GDP. Market capitalization as a percentage of GDP is also included as an
indicator of domestic financial market size. A more developed financial system may increase its
resilience to external shocks, therefore suggesting a negative relationship between these variables
and crisis incidence. At the same time, countries with more developed financial markets may
have been more exposed to the current crisis given that it originated among developed-world
financial institutions. The effect of financial market development on 2008-09 crisis incidence at
first sight therefore seems ambiguous.
The table below reports the results of regressing measures of financial market
development on our five crisis incidence variables. The results show a strong negative
relationship between measures of financial market development and crisis incidence, suggesting
that countries with larger or more developed financial markets suffered less from the crisis. All
three level of credit variables appear to be statistically significant leading indicators of crisis
incidence measured either in terms of GDP drops or recourse to the IMF. The level of broad
money measured in terms of M2 or M3 also appears as a highly statistically significant predictor
of crisis incidence measured either in terms of GDP drops or recourse to the IMF, as well as
exchange rate drops. The measure of equity market capitalization provides similar results.
52
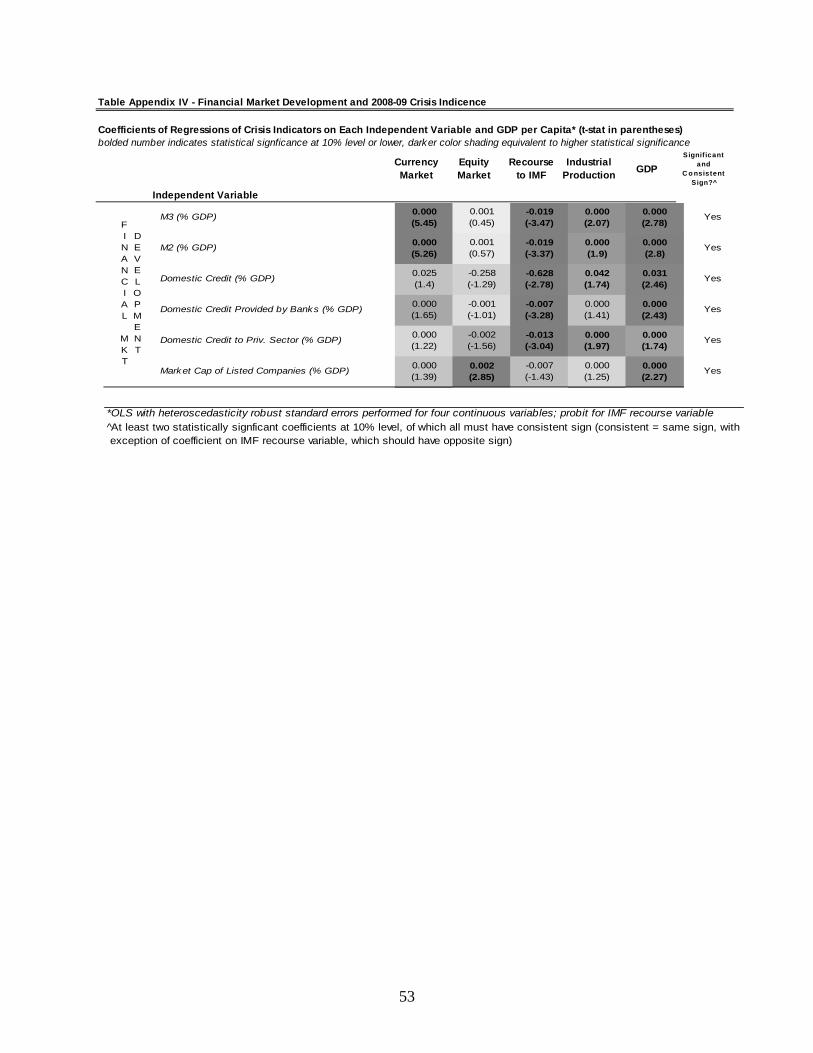
Table Appendix IV - Financial Market Development and 2008-09 Crisis Indicence
Coefficients of Regressions of Crisis Indicators on Each Independent Variable and GDP per Capita* (t-stat in parentheses)bolded number indicates statistical signficance at 10% level or lower, darker color shading equivalent to higher statistical significance
Currency Market
Equity Market
Recourse to IMF
Industrial Production GDP
Signif icant and
C o nsistent Sign?^
Independent Variable
M3 (% GDP) 0.000 (5.45)
0.001 (0.45)
-0.019 (-3.47)
0.000 (2.07)
0.000 (2.78)
Yes
M2 (% GDP) 0.000 (5.26)
0.001 (0.57)
-0.019 (-3.37)
0.000 (1.9)
0.000 (2.8)
Yes
Domestic Credit (% GDP) 0.025 (1.4)
-0.258 (-1.29)
-0.628 (-2.78)
0.042 (1.74)
0.031 (2.46)
Yes
Domestic Credit Provided by Banks (% GDP) 0.000 (1.65)
-0.001 (-1.01)
-0.007 (-3.28)
0.000 (1.41)
0.000 (2.43)
Yes
Domestic Credit to Priv. Sector (% GDP) 0.000 (1.22)
-0.002 (-1.56)
-0.013 (-3.04)
0.000 (1.97)
0.000 (1.74)
Yes
Market Cap of Listed Companies (% GDP) 0.000 (1.39)
0.002 (2.85)
-0.007 (-1.43)
0.000 (1.25)
0.000 (2.27)
Yes
FINANCIAL MKT
DEVELOPMENT
*OLS with heteroscedasticity robust standard errors performed for four continuous variables; probit for IMF recourse variable^At least two statistically signficant coefficients at 10% level, of which all must have consistent sign (consistent = same sign, with exception of coefficient on IMF recourse variable, which should have opposite sign)
53
Related Documents