Research Article Expression Profiling Using a cDNA Array and Immunohistochemistry for the Extracellular Matrix Genes FN-1, ITGA-3, ITGB-5, MMP-2, and MMP-9 in Colorectal Carcinoma Progression and Dissemination Suzana Angelica Silva Lustosa, 1,2 Luciano de Souza Viana, 1,3 Renato José Affonso Jr., 1,3 Sandra Regina Morini Silva, 1,3 Marcos Vinicius Araujo Denadai, 1,3 Silvia Regina Caminada de Toledo, 4 Indhira Dias Oliveira, 4 and Delcio Matos 1 1 Postgraduate Program in Interdisciplinary Surgery Science, UNIFESP-Escola Paulista de Medicina, S˜ ao Paulo, SP 04023-062, Brazil 2 Research and Teaching Unit of Hospital Municipal Dr. Munir Rafful, Volta Redonda, RJ 27277-130, Brazil 3 Hospital de Cancer de Barretos-Fundac ¸˜ ao Pio XII, Barretos, SP 14784-400, Brazil 4 Genetics Laboratory-GRAAAC, UNIFESP-Escola Paulista de Medicina, S˜ ao Paulo, SP 04023-062, Brazil Correspondence should be addressed to Delcio Matos; [email protected] Received 20 November 2013; Accepted 13 January 2014; Published 4 March 2014 Academic Editors: D. Morris and E. Tagliabue Copyright © 2014 Suzana Angelica Silva Lustosa et al. is is an open access article distributed under the Creative Commons Attribution License, which permits unrestricted use, distribution, and reproduction in any medium, provided the original work is properly cited. Colorectal cancer dissemination depends on extracellular matrix genes related to remodeling and degradation of the matrix structure. is investigation intended to evaluate the association between FN-1, ITGA-3, ITGB-5, MMP-2, and MMP-9 gene and protein expression levels in tumor tissue with clinical and histopathological neoplastic parameters of cancer dissemination. e expression associations between ECM molecules and selected epithelial markers EGFR, VEGF, Bcl2, P53, and KI-67 have also been examined in 114 patients with colorectal cancer who underwent primary tumor resection. Quantitative real-time PCR and immunohistochemistry tissue microarray methods were performed in samples from the primary tumors. e gene expression results showed that the ITGA-3 and ITGB-5 genes were overexpressed in tumors with lymph node and distant metastasis (III/IV- stage tumors compared with I/II tumors). e MMP-2 gene showed significant overexpression in mucinous type tumors, and MMP-9 was overexpressed in villous adenocarcinoma histologic type tumors. e ECM genes MMP9 and ITGA-3 have shown a significant expression correlation with EGFR epithelial marker. e overexpression of the matrix extracellular genes ITGA-3 and ITGB-5 is associated with advanced stage tumors, and the genes MMP-2 and MMP-9 are overexpressed in mucinous and villous adenocarcinoma type tumors, respectively. e epithelial marker EGFR overactivity has been shown to be associated with the ECM genes MMP-9 and ITGA-3 expression. 1. Introduction Studies have shown that alterations in genes that regulate basic cell functions such as cell-cell adhesion and ECM-cell adhesion are followed by penetration of the basal membrane, destroying the physical structure of the tissue [1]. Alterations in the expression of adhesion molecules can influence tumor aggression resulting in local infiltrative growth and metasta- sis. us, the basal membrane and the ECM jointly represent two important physical barriers to malignant invasion, and their degradation by metalloproteinase enzymes may have an important role in tumor progression and metastatic dissemi- nation [2–4]. Other researchers, however, have reported that, in general, the expression levels of integrins alpha 3 and alpha 5 are reduced in many colorectal carcinomas (CRCs) [5, 6]. Some authors have recently demonstrated that integrin inhibition, at any point of action, may lead to tumor progres- sion inhibition. erefore, integrin inhibition may represent Hindawi Publishing Corporation e Scientific World Journal Volume 2014, Article ID 102541, 27 pages http://dx.doi.org/10.1155/2014/102541

Welcome message from author
This document is posted to help you gain knowledge. Please leave a comment to let me know what you think about it! Share it to your friends and learn new things together.
Transcript

Research ArticleExpression Profiling Using a cDNA Array andImmunohistochemistry for the Extracellular Matrix Genes FN-1ITGA-3 ITGB-5 MMP-2 and MMP-9 in Colorectal CarcinomaProgression and Dissemination
Suzana Angelica Silva Lustosa12 Luciano de Souza Viana13 Renato Joseacute Affonso Jr13
Sandra Regina Morini Silva13 Marcos Vinicius Araujo Denadai13
Silvia Regina Caminada de Toledo4 Indhira Dias Oliveira4 and Delcio Matos1
1 Postgraduate Program in Interdisciplinary Surgery Science UNIFESP-Escola Paulista de Medicina Sao Paulo SP 04023-062 Brazil2 Research and Teaching Unit of Hospital Municipal Dr Munir Rafful Volta Redonda RJ 27277-130 Brazil3 Hospital de Cancer de Barretos-Fundacao Pio XII Barretos SP 14784-400 Brazil4Genetics Laboratory-GRAAAC UNIFESP-Escola Paulista de Medicina Sao Paulo SP 04023-062 Brazil
Correspondence should be addressed to Delcio Matos dmatosdcirbolcombr
Received 20 November 2013 Accepted 13 January 2014 Published 4 March 2014
Academic Editors D Morris and E Tagliabue
Copyright copy 2014 Suzana Angelica Silva Lustosa et al This is an open access article distributed under the Creative CommonsAttribution License which permits unrestricted use distribution and reproduction in any medium provided the original work isproperly cited
Colorectal cancer dissemination depends on extracellular matrix genes related to remodeling and degradation of the matrixstructure This investigation intended to evaluate the association between FN-1 ITGA-3 ITGB-5 MMP-2 and MMP-9 gene andprotein expression levels in tumor tissue with clinical and histopathological neoplastic parameters of cancer dissemination Theexpression associations between ECM molecules and selected epithelial markers EGFR VEGF Bcl2 P53 and KI-67 have alsobeen examined in 114 patients with colorectal cancer who underwent primary tumor resection Quantitative real-time PCR andimmunohistochemistry tissue microarray methods were performed in samples from the primary tumors The gene expressionresults showed that the ITGA-3 and ITGB-5 genes were overexpressed in tumors with lymph node and distant metastasis (IIIIV-stage tumors compared with III tumors) The MMP-2 gene showed significant overexpression in mucinous type tumors andMMP-9 was overexpressed in villous adenocarcinoma histologic type tumors The ECM genes MMP9 and ITGA-3 have shown asignificant expression correlation with EGFR epithelial marker The overexpression of the matrix extracellular genes ITGA-3 andITGB-5 is associated with advanced stage tumors and the genes MMP-2 and MMP-9 are overexpressed in mucinous and villousadenocarcinoma type tumors respectivelyThe epithelial marker EGFR overactivity has been shown to be associated with the ECMgenes MMP-9 and ITGA-3 expression
1 Introduction
Studies have shown that alterations in genes that regulatebasic cell functions such as cell-cell adhesion and ECM-celladhesion are followed by penetration of the basal membranedestroying the physical structure of the tissue [1] Alterationsin the expression of adhesion molecules can influence tumoraggression resulting in local infiltrative growth and metasta-sis Thus the basal membrane and the ECM jointly represent
two important physical barriers to malignant invasion andtheir degradation bymetalloproteinase enzymesmay have animportant role in tumor progression and metastatic dissemi-nation [2ndash4] Other researchers however have reported thatin general the expression levels of integrins alpha 3 and alpha5 are reduced in many colorectal carcinomas (CRCs) [5 6]
Some authors have recently demonstrated that integrininhibition at any point of action may lead to tumor progres-sion inhibition Therefore integrin inhibition may represent
Hindawi Publishing Corporatione Scientific World JournalVolume 2014 Article ID 102541 27 pageshttpdxdoiorg1011552014102541
2 The Scientific World Journal
Table 1 Characteristics of the 114 patients included in the study
Variables 119899 Agelt60 yearsgt60 years
5658
491509
GenderFemaleMale
5163
447553
Primary tumor siteRight colonLeft colonRectum
414132
360360280
Synchronous tumorNoYes
1122
98218
Histological classificationAdenocarcinoma SOEAdenocarcinoma mucinousAdenocarcinoma villous
811815
710158132
Grading cell differentiationWell differentiatedModeratePoorUndifferentiated
991140
797981230
Venous invasionAbsentPresent
9321
816184
Lymphatic vessels invasionAbsentPresent
9123
798202
Perineural invasionAbsentPresent
1068
93070
Peritumoural lymphocyte infiltrationAbsentPresent
2193
184816
Resection margin statusPositiveNegative
0114
01000
Lymph nodes dissectedMedianRange 17lowast 3ndash67
Tumor stage TNMT1T2T3T4
5277111
4423762396
Nodal stageN0N1N2
672522
588219193
Distant metastasisAbsentPresent
9816
859141
Table 1 Continued
Variables 119899 Site of distant metastasis
AbsentLiverPeritoneumLungsOvary
989322
85979261818
Clinical stageIIIIIIIV
25393416
219342298140
lowast28 patients had lt12 lymph nodes dissected or analyzed
a pharmacological target for cancer treatment and preventionthrough the suppression of cell migration and invasion andfollowing apoptosis induction also through blocking tumorangiogenesis and metastases [7]
Inmost human cancers themetalloproteinase expressionand activity levels are high compared with normal tissueand this has also been demonstrated in colorectal adenocar-cinomas [8 9] From these results several researchers haveanalyzed the possibility that metalloproteinase expressionand activity levels can be used as tumor markers aiming toprevent tumor growth invasion and metastasis [10 11]
Studies have explored the hypothesis that the MMP-9functions as a key regulator of the malignant phenotypein patients with colorectal tumors presenting with overex-pression of this protease relative to the adjacent normaltissues In this context MMP-9 is the main agent of cancercell invasion and metastasis in the epithelial and stromalcells of the primary colorectal tumor In addition humancolorectal cancer cells have the ability to synthesize andsecrete MMP-9 This effect associated with the inductionof proteolytic functions in the pericellular space causesmetastasis development Hence theMMP-9 present in tumorepithelial cells can represent a specific target for the diagnosisand treatment of metastatic CRC
Recently Viana et al reported that the expression of thegenes SPARC SPP1 FN-1 ITGA-5 and ITGAV correlateswith common parameters of progression and disseminationin CRC and overexpression of the ITGAV gene and proteincorrelates with an increased risk of perineural invasionMoreover according to these authors the strong correlationof IHC expression between ITGAV and EGFR suggestsan interaction between these two signaling pathways [12]Denadai et al in 2013 also showed that increased expressionlevels of ITGA-6 and ITGAV are related to venous invasionand neural infiltration respectively while overexpressionof ITGB5 and ITGA3 is associated with stage III (TNM)and overexpression of ITGA-5 correlates with the presenceof mucinous-type malignant neoplasias [13] The authorsconcluded that follow-up studies preferably with a controlledprospective design are necessary to establish the roles of suchgenes as potential biomarkers to predict disease extent or
The Scientific World Journal 3
Table 2 Distribution of expression levels of FN-1 ITGA-3 ITGB-5 MMP-2 and MMP-9 ECM genes with significance levels of 119875 lt 005fold change gt20 and clinicopathological variables associated with genetic tracing by RT-PCR
Gene 119875 value Fold change Clinicopathological parameter ComparisonFN-1 0022 minus307 Age (years) lt60 times ge60ITGA-3 0016 258 TNM TNM III times TNM I
ITGB-5 004 minus211 Degree of cell differentiation GII times GI0029 133 TNM TNM III times TNM I
MMP-20015 217 Histological type Mucinous times tubular004 minus12 Peritumoral lymphocyte infiltration With times without0039 minus211 Age gt60 times le60
MMP-9 0014 113 Histological type Villous times tubular
outcome and possibly contribute to the management of CRCpatients
According to Nowell in 2002 tumors become moreclinically and biologically aggressive over time and thishas been termed ldquotumor progressionrdquo and includes amongother properties invasion and metastasis as well as moreefficient escape from host immune regulation Moleculartechniques have shown that tumors expand as a clone froma single altered cell and sequential somatic genetic changesgenerating increasingly aggressive subpopulations within theexpanding clone So far multiple types of genes have beenidentified and they differ in different tumors but theyprovide potential specific targets for important new therapies[14]
This study aimed to evaluate the relationship of theexpression levels of select ECM genes and proteins FN-1ITGA-3 ITGB-5 MMP-2 and MMP-9 with CRC progres-sion and dissemination and with that of P53 Bcl-2 KI-67EGFR andVEGF as it has been shownby several authors thatproliferation apoptosis and cell migration are regulated bycell-cell interaction and extracellularmatrix cell componentsIt is also worth noting that the growth factors EGF and VEGFare usually stored in the ECM and can be activated andreleased after ECMmodulation [15ndash17]
2 Methods
21 Patients andTumor Samples We studied 114 patients withstage IndashIV CRC who underwent primary tumor resectionat the Fundacao Pio XII Barretos Cancer Hospital betweenAugust 2006 and July 2009 All patients were eligible for theanalysis of the expression of the genes of interest through real-time PCR and immunohistochemistry (IHC) assays using thetissue microarray (TMA) technique The median followupwas 30 months at the time of this report
The ethical use of human tissue for researchwas approvedby the institutional review board and the design of this studyfollowed the principles of the Declaration of Helsinki andalso complied with the principles of good clinical practiceThis study was also approved by the Ethics Committee of theBarretos Cancer Hospital and UNIFESP-Escola Paulista deMedicina Sao Paulo Brazil
In this study we included patients of both genders whoseagewasgt18 yearsThe patients who had received neoadjuvant
treatment (chemotherapy or radiotherapy) were excluded Inall patients tumor tissue was sampled during surgery andcryopreserved and paraffin blocks were available for furtherhistopathological analysisThepatientswithout primaryCRCsite resectionwere excluded aswell as patients with a previousor current diagnosis of another primary malignancy in anylocation of the body other than nonmelanoma skin cancer orin situ carcinoma of the cervix The patients with a knownhistory of familial CRCwere also excludedThe chromosomaland microsatellite instability statuses were not assessed
Sixty-three patients were male (553) and 51 werefemale (447)Themedian patient age was 60 years (24ndash83)58 patients (509) were over 60 years of age Concerning thelocation of the primary tumor the right colon was affected in41 cases (360) and the left colon in 41 cases (360) andthe rectum was the primary tumor site in 32 cases (280)Twenty-five (219) patients were considered as TNM stageI 39 (342) as TNM stage II 34 (298) as TNM stageIII and 16 (140) as TNM stage IV The most frequentsite for metastasis was the liver (9 patients) followed by theperitoneum (3 patients) lungs (2 patients) and ovary (2patients) Table 1 shows the distribution of patients accordingto the covariable categorization
22 Outcome Measures The patients were classified accord-ing to the following clinical and pathological characteristicsage group (lt60 or gt60 years) gender (male versus female)site of the primary tumor (right colon versus left colonversus rectum) histological classification (adenocarcinomanot otherwise specified versus mucinous adenocarcinoma)tumor grade (low (grades I and II) versus high (grades IIIand IV)) and peritumoral lymphocyte infiltration (presenceversus absence)
Histological characteristics commonly associated withtumor dissemination and progression have been categorizedas follows venous invasion (presence versus absence) lym-phatic vessel invasion (presence versus absence) perineuralinvasion (presence versus absence) degree of tumor invasioninto the organ wall (T 1-2 versus T 3-4 AJCC 2002 6thedition) lymph node metastasis (presence versus absence)distant metastases (presence versus absence) and TNMstaging (I-II versus III-IV AJCC 2002 6th edition)
We hypothesized that ECM molecules may be associ-ated with CRC progression and dissemination therefore
4 The Scientific World Journal
Table 3 Distribution of the expression levels PER IHC of proteins corresponding to ITGB-5 ITGA-3MMP-2MMP-9 and FN-1 ECMgenesand EGFR VEGF KI-67 P53 and Bcl-2 molecules as per the degree of cell differentiation of CRC (119899 = 114)
Grading tumor cell differentiation EGFR Total 119875 valueHigh Low
I + II
0159
119873 63 37 100 630 370 1000
III119873 6 8 14 429 571 1000
Total119873 69 45 114 605 395 1000
Grading tumor cell differentiation VEGF Total P valueHigh Low
I + II
0778
119873 49 51 100 490 510 1000
III119873 6 8 14 429 571 1000
Total119873 55 59 114 482 518 1000
Grading tumor cell differentiation KI-67 Total P valueHigh Low
I + II
0093
119873 46 54 100 460 540 1000
III119873 3 11 14 214 786 1000
Total119873 49 65 114 430 570 1000
Grading tumor cell differentiation P53 Total P valueHigh Low
I + II
0778
119873 41 59 100 410 590 1000
III119873 5 9 14 357 643 1000
Total119873 46 68 114 404 596 1000
The Scientific World Journal 5
Table 3 Continued
Grading tumor cell differentiation Bcl-2 Total P valueHigh Low
I + II
1000
119873 50 50 100 500 500 1000
III119873 7 7 14 500 500 1000
Grading tumor cell differentiation ITGB-5 Total P valueHigh Low
I + II
0394
119873 57 43 100 570 430 1000
III119873 6 8 14 429 571 1000
Total119873 63 51 114 553 447 1000
Grading tumor cell differentiation ITGA-3 Total P valueHigh Low
I + II
0397
119873 50 50 100 500 500 1000
III119873 5 9 14 357 643 1000
Total119873 55 59 114 482 518 1000
Grading tumor cell differentiation MMP-2 Total P valueHigh Low
I + II
0568
119873 48 52 100 480 520 1000
III119873 5 9 14 357 643 1000
Total119873 53 61 114 465 535 1000
Grading tumor cell differentiation MMP-9 Total P valueHigh Low
I + II
0572119873 53 47 100 530 470 1000
III119873 6 8 14 429 571 1000
6 The Scientific World Journal
Table 3 Continued
Total119873 59 55 114 518 482 1000
Grading tumor cell differentiation FN-1 Total P valueHigh Low
I + II
0225
119873 73 27 100 730 270 1000
III119873 8 6 14 571 429 1000
Total119873 81 33 114 711 289 1000
differences in ECM marker expression with respect to thecategorization of one of the histological covariatesmentionedabove were analyzed using both reverse transcription- (RT-)PCR and TMA
23 RNA Extraction and cDNA Synthesis by RT-PCR Cry-opreserved samples were embedded in medium for frozentissue specimens (Tissue-TekOCT Sakura Finetek TorranceCA USA) and fitted into a cryostat (CM1850 UV LeicaMicrosystems Nussloch Germany) for histological analysisThe slides mounted with sections of 4 120583m thickness weresubjected to hematoxylin-eosin staining (Merck DarmstadtGermany) and analyzed by a pathologist to ensure that theselected samples represented the general tumor histology andwere free of necrosis or calcifications
The areas of interest were identified microscopicallyand marked for macrodissection These slides were usedas guides to select and cut tissues in the cryostat Foreach sample sterile individual scalpel blades were usedAfter discarding areas inappropriate for RNA extractionthe tissue was mechanically macerated with liquid nitrogenand transferred to 15mL RNase- and DNase-free micro-tubes containing 1000 120583L TRIzol (Invitrogen Carlsbad CAUSA) RNA was extracted according to the manufacturerrsquosinstructions and RNA quantification was performed usinga spectrophotometer (Thermo Scientific NanoDrop 2000)The quality and integrity of the RNA were verified by thepresence of 28S and 18S bands in an agarose gel and stainedwith 1 ethidium bromide RNA was purified using theRNeasy mini kit (Qiagen Valencia CA USA) followingthe manufacturerrsquos recommendations diluted with 30mL ofwater free of RNase and DNase (Qiagen) quantified spec-trophotometrically at a wavelength of 260 nm (NanoVue GEHealthcare Chicago IL USA) and stored at ndash80∘C until useRT-PCR was performed using the Super-Script TM III first-strand synthesis SuperMix (Invitrogen) as recommended bythemanufacturerThe reactionwas performed in a 20120583Lfinalvolume containing 2 120583g of total RNA with oligo (dT)
20as a
primer The transcription phase was performed in a thermalcycler (Mastercycler ep Gradient S Eppendorf HamburgGermany) and the cDNA was stored at ndash20∘C for futurereactions
24 Analysis of the Genes of Interest For each samplean ECM and adhesion molecule PCR array (PAHS-013SABiosciences Qiagen) plate was used A mixture wasprepared containing 1275120583L of buffer with SYBR Green(2x Master Mix SABiosciences RT2 qPCR) 1173 120583L RNase-free H
2O and 102 120583L of the cDNA sample Next 25 120583L
aliquots were added to each well of the 96-well plate Thereactions were performed in a thermal cycler (ABI 7500Applied Biosystems Foster City CA USA) according tothe following protocol 95∘C for 10min and 40 cycles at95∘C for 15 s and 60∘C for 1min Data analysis was per-formed using method from the website httppcrdataanal-ysissabiosciencescompcrarrayanalysisphp
Gene expression was classified as ldquohighrdquo or ldquolowrdquo consid-ering the level of expression obtained after grouping patientsby the covariates of interest that is after categorizing patientsinto the control or interest groups according to the covariatesstudied gene expression was determined in both groups
25 TMA Block Construction Original paraffin blocks weresectioned at a 4 120583m thickness and stained with hematoxylin-eosin All sections were reviewed to confirm the CRCdiagnosis and the histopathologic findings were reevaluated
A map was prepared using a spreadsheet containingthe locations and identification of tissue samples for theconstruction of the TMA blockThe map also guided furtherreadings of the IHC reactions With the aid of BeecherTM equipment (Beecher Instruments Silver Spring MDUSA) the TMA blocks were prepared according to themanufacturerrsquos specifications in the following steps markingof the selected area in the respective paraffin block use ofthe equipment to create a hollow space in the recipient block
The Scientific World Journal 7
Table 4The distribution of expression levels per IHC of proteins corresponding to ITGB-5 ITGA-3 MMP-2 MMP-9 and FN-1 ECM genesand EGFR VEGF KI-67 P53 and Bcl-2 molecules as per the degree of TNM staging of CRC (119899 = 114)
TNM tumor stage EGFR Total 119875 valueHigh Low
I + II
0000
119873 64 0 64 1000 00 1000
III + IV119873 5 45 50 100 900 1000
Total119873 69 45 114 605 395 1000
TNM tumor stage VEGF Total P valueHigh Low
I + II
0186
119873 27 37 64 422 578 1000
III + IV119873 28 22 50 560 440 1000
Total119873 55 59 114 482 518 1000
TNM tumor stage KI-67 Total P valueHigh Low
I + II
0000
119873 38 26 64 594 406 1000
III + IV119873 11 39 50 220 780 1000
Total119873 49 65 114 430 570 1000
Estadiamento P53 Total P valueHigh Low
I + II
0000
119873 35 29 64 547 453 1000
III + IV119873 11 39 50 220 780 1000
Total119873 46 68 114 404 596 1000
TNM tumor stage Bcl-2 Total P valueHigh Low
I + II
0345
119873 29 35 64 453 547 1000
III + IV119873 28 22 50 560 440 1000
8 The Scientific World Journal
Table 4 Continued
Total119873 57 57 114 500 500 1000
TNM tumor stage ITGB-5 Total P valueHigh Low
I + II
0000
119873 49 15 64 766 234 1000
III + IV119873 14 36 50 280 720 1000
Total119873 63 51 114 553 447 1000
TNM tumor stage ITGA-3 Total P valueHigh Low
I + II
0000
119873 53 11 64 828 172 1000
III + IV119873 2 48 50 40 960 1000
Total119873 55 59 114 482 518 1000
TNM tumor stage MMP-2 Total P valueHigh Low
I + II
0572
119873 28 36 64 438 563 1000
III + IV119873 25 25 50 500 500 1000
Total119873 53 61 114 465 535 1000
TNM tumor stage MMP-9 Total P valueHigh Low
I + II
0000119873 56 8 64 875 125 1000
III + IV119873 3 47 50 60 940 1000
Total119873 59 55 114 518 482 1000
The Scientific World Journal 9
Table 4 Continued
TNM tumor stage FN-1 Total P valuehigh low
I + II
0677
119873 44 20 64 688 313 1000
III + IV119873 37 13 50 740 260 1000
Total119873 81 33 114 711 289 1000
extraction of a cylindrical tissue of the donor block measur-ing 1mm in diameter of the previously selected respectivearea of interest transfer of the cylindrical tissue obtainedfrom the donor block to the hollow space previously createdin the recipient block progression in fractions ofmillimetersto new positions within the recipient block thereby creating acollection of tissue samples following a matrix arrangementand assessment of the final quality of the block for storage
For adhesion of the TMAblock section onto the slides anadhesive tape system was used (Instrumedics HackensackNJ USA) The samples were cut to a thickness of 4 120583mand a small roll was used to press the section on the tapeThe tape with the attached histological section was thenplaced on a resin-coated slide (part of the adhesive systemkit) and pressed with the same roll for better adherenceAfterwards the slides were placed under UV light for 20minand were posteriorly exposed to a solvent solution (TPC)for 20 additional minutes The slides were dried and thetapes were removed Afterwards the slides were paraffin-embedded and sent for storage in ideal cooling conditions
26 IHC Technique The TMA block sections weremounted onto glass slides coated with silane (3-amino-propyltriethoxysilane) and dried for 30min at 37∘C Theparaffin was removed with xylene and rehydrated througha series of graded alcohols Endogenous peroxidase activitywas blocked by incubating the sections in a methanol bathcontaining 3 hydrogen peroxide for 20min followedby washing in distilled water The sections were initiallysubmitted to heat-induced epitope retrieval using citratebuffer (pH 90) in an uncovered pressure cooker (EternaNigro Araraquara Brazil) The slides were immersed in thebuffer solution and the pressure cooker was closed with thesafety valve open Once the saturated steam was releasedthe safety valve was lowered until full pressurization wasachieved After 4min under full pressurization the closedpressure cooker was placed under running water for coolingAfter removing the lid the slides were washed in distilledrunning water
Blocking of the endogenous peroxidasewas obtainedwith3 H
2O2(10 vol) with 3 washes of 10min duration each
The slides were again washed in distilled running water andthen in phosphate-buffered saline (10mM pH 74) for 5min
Afterwards the primary antibody was applied and the slideswere incubated overnight at 8∘C
27 Primary Antibodies The primary monoclonal antibodiesused were obtained from ABCAM Inc (Cambridge MAUSA) and were as follows anti-integrin alpha 3 that reactswith human (IHC-FoFr or Fr) and mouse IgG1 isotypes(clone F35 177-1 100 120583g ab 20140) anti-integrin beta 5 thatreacts with human (IHC-P or Fr) and mouse IgG2a isotypes(ab 93943) anti-MMP-2 rabbit IgG isotype (ab52756) andanti-MMP-9 (ab76003 clone EP1254) All antibodies wereused at a 1 400 dilution
In addition the following non-ECM primary antibodieswere used in this study anti-p53 (IgG2b class clone DO-7 1 300 M7001 DAKOCytomation Glostrup Denmark)anti-Bcl-2 (mouse isotype IgG1 clone 124 1 600 M0887DAKOCytomation) anti-VEGF (mouse IgG1 isotype cloneVG 1 1 100 M7273 DAKOCytomation) anti-KI-67 (mouseisotype IgG1 clone MIB-1 1 500 M7240 DAKOCytoma-tion) and anti-EGFR (mouse IgG1 isotype clone EGFR-25NCLEGFR-384 Novocastra Newcastle UK) The positivecontrols used for IHC analysis were normal human kidneytissue for FN-1 human tonsils for ITGA-3 ITGB-5 VEGFKI-67 P53 and Bcl-2 and placenta for EGFR
28 Immunostaining Analysis A preliminary test was per-formed to identify the optimal antibody concentration andto select positive and negative controls using the dilutiondata supplied by themanufacturer Afterwashing the primaryantibody with phosphate-buffered saline the slides wereincubated with biotin-free polymer in the Advance TMvisualization system (DAKO) for 30min A freshly preparedsolution containing 1 drop of 331015840-diaminobenzidine tetrahy-drochloride (DAB Sigma St Louis MO USA) with 1mL ofsubstrate (DAKO) was applied for 5min on each slide TheDAB solution was removed by washing with distilled waterThe slides were counterstained with hematoxylin dehydratedin ethanol cleared in xylene andmounted using Entelan TM[18ndash20]
Tissue expression of FN-1 ITGA-3 ITGB-5 MMP-1 andMMP-9 was categorized dichotomously as ldquohigh expressionrdquoor ldquolow expressionrdquo according to the ldquoquick scorerdquo method
10 The Scientific World Journal
Table 5The distribution of expression levels per IHC of proteins corresponding to ITGB-5 ITGA-3 MMP-2 MMP-9 and FN-1 ECM genesand EGFR VEGF KI-67 P53 and Bcl-2 molecules as per the peritumoral lymphocyte infiltrate in CRC (119899 = 114)
Peritumoral lymphocyte infiltrate EGFR Total 119875 valueHigh Low
Absence119873 13 8 21
1000 619 381 1000
Presence119873 56 37 93 602 398 1000
Total119873 69 45 114 605 395 1000
Peritumoral lymphocyte infiltrate VEGF Total P valueHigh Low
Absence
0635
119873 9 12 21 429 571 1000
Presence119873 46 47 93 495 505 1000
Total119873 55 59 114 482 518 1000
Peritumoral lymphocyte infiltrate KI-67 Total P valueHigh Low
Absence119873 11 10 21
0343 524 476 1000
Presence119873 38 55 93 409 591 1000
Total119873 49 65 114 430 570 1000
Peritumoral lymphocyte infiltrate P53 Total P valueHigh Low
Absence
1000
119873 8 13 21 381 619 1000
Presence119873 38 55 93 409 591 1000
Total119873 46 68 114 404 596 1000
Peritumoral lymphocyte infiltrate Bcl-2 Total P valueHigh Low
Absence
0629
119873 9 12 21 429 571 1000
Presence119873 48 45 93 516 484 1000
The Scientific World Journal 11
Table 5 Continued
Total119873 57 57 114 500 500 1000
Peritumoral lymphocyte infiltrate ITGB-5 Total P valueHigh Low
Absence
1000
119873 12 9 21 571 429 1000
Presence119873 51 42 93 548 452 1000
Total119873 63 51 114 553 447 1000
Peritumoral lymphocyte infiltrate ITGA-3 Total P valueHigh Low
Absence
0227
119873 13 8 21 619 381 1000
Presence119873 42 51 93 452 548 1000
Total119873 55 59 114 482 518 1000
Peritumoral lymphocyte infiltrate MMP-2 Total P valueHigh Low
Absence
1000
119873 10 11 21 476 524 1000
Presence119873 43 50 93 462 538 1000
Total119873 53 61 114 465 535 1000
Peritumoral lymphocyte infiltrate MMP-9 Total P valueHigh Low
Absence
1000119873 11 10 21 524 476 1000
Presence119873 48 45 93 516 484 1000
Total119873 59 55 114 518 482 1000
12 The Scientific World Journal
Table 5 Continued
Peritumoral lymphocyte infiltrate FN-1 Total P valueHigh Low
Absence
0180
119873 12 9 21 571 429 1000
Presence119873 69 24 93 742 258 1000
Total119873 81 33 114 711 289 1000
[21 22] This score system uses a combination of the per-centage of stained cells (119875) and staining intensity (119868) and theldquoquick scorerdquo was calculated by multiplying both values
The scores used for the percentage of stained tumor cellswere as follows 0 points (absence of stained cells) 1 point(gt25 of stained cells) 2 points (26ndash50 of stained cells)and 3 points (gt50 of stained cells) The scores used for thestaining intensity were as follows 1 point (mild intensity) 2points (moderate intensity) and 3 points (intense staining)As a result expression of a gene product in tumor cells wasconsidered to be high (overexpressed) when the final scorewas gt4 (119875times 1 gt4) and the markers that presented a finalscore lt4 were considered to have low expressionThe stromaand the tumor cells were not treated separately during IHCanalysis and only the level of expression ofmarkers on tumorcells was considered for scoring
The validation of different expression levels of the genesdetected by real-time PCR analysis was performed by theverification of the protein expression related to each geneby IHC Thus for each gene (fibronectin integrins andmetalloproteases) with increased or reduced expression byarray tracing the corresponding protein was analyzed by theantigen-antibody reaction (IHC) in TMA slides The confir-mation of the protein expression increase by IH validates themolecular finding of the tracing by RT-PCR
29 Statistical Analyses Statistical associations between geneand protein expression levels of FN-1 ITGA-3 ITGB-5MMP-2 andMMP-9 and the clinicopathological factors weredetermined using a nonparametric Mann-Whitney119880 test forquantitative variables and a chi-square test for qualitativevariables that is frequencies and proportionsWhen the chi-square test assumptions were not met Fisherrsquos exact test wasused To measure the association between the ECM markersFN-1 ITGA-3 ITGB-5 MMP-2 and MMP-9 and the non-ECM markers EGFR VEGF P53 Bcl-2 and KI-67 (ordinalvariables) the Spearman correlation coefficient was used[23]
The significance level was set at 5 (119875 lt 005) andthe data were analyzed using Statistical Package for SocialSciences (SPSS) software (Chicago IL USA) version 150
The Shapiro-Wilk test was used to verify that the data had anormal distribution
3 Results
31 FN-1 ITGA-3 ITGB-5 MMP-2 and MMP-9 ECM GeneExpression Levels The expression levels of the genes ofinterest according to the covariates studied through real-timePCR showed low expression of the FN-1 gene in patients lt60years of age compared with those ge60 years of age (119875 =0022)
The ITGA-3 and ITGB-5 gene expression levels in thetumor tissue as determined using RT-PCR were not consid-ered significant when analyzed with regard to the differentmeasures of tumor dissemination outcome except for thoserelated to TNM staging and cell differentiation degree
ITGA-3 gene expression showed a significance level of119875 = 0016 and a fold regulation of 258 comparing TNM IIIIV versus TNM I II stages With regard to the ITGB-5 genea reduction in the group expression of III cell differentiationdegree was observed when compared with the GI and GIIgroup (119875 = 004 and a fold change of ndash211) and an increaseof this gene expression in the tumors of TNM III IV versusTNM I II stages (119875 = 0029 and a fold change of 133) Table 2shows the distribution of the significant results of the RTPCRexpression of the genes of interest
The expression levels of MMP2 and MMP9 genes inthe tumor tissue as determined using RT-PCR were consid-ered significant when analyzed with regard to the differentmeasures of tumor dissemination outcome except for thoserelated to mucinous and villous histological types and inthe parameter of venous invasion dissemination ThereforeMMP2 gene expression was significantly different betweenmucinous and nonmucinous carcinomas (119875 = 0001) andin patients aged over 60 years (119875 lt 00001) With regard tothe tumor expression of the MMP9 gene an increase of thisgene expression was noted in tumors with TNM III and IVstaging compared with TNM I and II staging (119875 = 00001) invenous invasion tumors comparedwith those without venousinvasion (119875 lt 0001) and in carcinoma tumors with a villouscomponent compared with carcinomas without a villouscomponent (119875 lt 00001) Tables 3 4 5 6 7 8 and 9 show
The Scientific World Journal 13
Table 6 The distribution of expression levels per IHC of proteins corresponding to ITGB-5 ITGA-3 MMP-2 and MMP9 ECM genes andFN-1 and EGFR VEGF KI-67 P53 and Bcl-2 molecules as per the presence of venous invasion in CRC (119899 = 114)
Venous invasion EGFR Total 119875 valueHigh Low
Absence
0000
119873 65 28 93 699 301 1000
Presence119873 4 17 21 190 810 1000
Total119873 69 45 114 605 395 1000
Venous invasion VEGF Total P valueHigh Low
Absence
0810
119873 44 49 93 473 527 1000
Presence119873 11 10 21 524 476 1000
Total119873 55 59 114 482 518 1000
Venous invasion KI-67 Total P valueHigh Low
Absence
0055
119873 44 49 93 473 527 1000
Presence119873 5 16 21 238 762 1000
Total119873 49 65 114 430 570 1000
Venous invasion P53 Total P valueHigh Low
Absence
0029
119873 42 51 93 452 548 1000
Presence119873 4 17 21 190 810 1000
Total119873 46 68 114 404 596 1000
Venous invasion Bcl-2 Total P valueHigh Low
Absence
1000
119873 46 47 93 495 505 1000
Presence119873 11 10 21 524 476 1000
14 The Scientific World Journal
Table 6 Continued
Total119873 57 57 114 500 500 1000
Venous invasion ITGB-5 Total P valueHigh Low
Absence
0231
119873 54 39 93 581 419 1000
Presence119873 9 12 21 429 571 1000
Total119873 63 51 114 553 447 1000
Venous invasion ITGA-3 Total P valueHigh Low
Absence
0000
119873 52 41 93 559 441 1000
Presence119873 3 18 21 143 857 1000
Total119873 55 59 114 482 518 1000
Venous invasion MMP-2 Total P valueHigh Low
Absence
0631
119873 42 51 93 452 548 1000
Presence119873 11 10 21 524 476 1000
Total119873 53 61 114 465 535 1000
Venous invasion MMP-9 Total P valueHigh Low
Absence
0001119873 55 38 93 591 409 1000
Presence119873 4 17 21 190 810 1000
Total119873 59 55 114 518 482 1000
The Scientific World Journal 15
Table 6 Continued
Venous invasion FN-1 Total P valueHigh Low
Absence
0006
119873 61 32 93 656 344 1000
Presence119873 20 1 21 952 48 1000
Total119873 81 33 114 711 289 1000
the results of immunohistochemical expression of the EMCgenes and the non-ECMmolecular markers according to theoutcomemeasures degree of tumor cell differentiation tumorTNM classification peritumoral lymphocytic infiltrationvenous invasion perineural invasion and type of tumor(tubular mucinous and villous)
Table 10 shows the distribution in absolute numbers andpercentages by IHC of proteins corresponding to the ITGB-5 ITGA-3 MMP-2 MMP-9 and FN-1 ECM genes and theEGFR VEGF KI-67 P53 and Bcl-2 molecules according tothe expression degrees rated as low and high of the colorectaladenocarcinoma (119899 = 114)
With regard to the correlation of ECM genes IHC expres-sion levels with the non-ECM molecules P53 Bcl-2 VEGFKI-67 and EGFR this study showed that FN-1 expression didnot correlate with any ECM marker or non-ECM moleculestudied Expression of ITGA-3 showed a weak correlationwith EGFR (119903 = 074 119875 = 0000) and ITGB-5 expressiondisplayed a regular correlation (119903 = 042 119875 = 0000)with EGFR MMP-2 expression did not correlate with thenon-EMC molecules studied MMP-9 was shown to havea strong expression correlation (119903 = 076 119875 = 0000)Table 11 shows the results of the distribution of the correlationSpearman coefficients between the ECM genes and the non-ECMmolecules markers studied
The results of RT-PCR and IHC methods in 114 patientswith colorectal adenocarcinoma are shown in the Table 12where differentially expressed extracellular matrix genesand the respective proteins are correlated The findings ofimmunohistochemistry technique validated the correlationbetween transcript and protein While RT-PCR is regardedas a tool which provides a genic screening the immuno-histochemical technique allows the identification of thecorrespondent protein of the genes differentially expressed
4 Discussion
41 The Possible Role of the ECM in CRC DisseminationCarcinogenesis and tumor progression represent complexprocesses that involve a series of events traditionally char-acterized as a cascade of phenomena that require moreinvestigation to be fully elucidated It has been assumed that
as a result of the cascade of carcinogenesis progressionand dissemination the initial transformation requires thetumor cell to be able to invade the surrounding tissues whichwould characterize its malignant nature Thus it is necessarythat these cells detach from their adhesive interactions inthe epithelium penetrate the basal membrane degrade theECM and migrate to the subjacent interstitial stroma Atthis point the tumor cell enters the blood and lymphaticstream acquiring systemic dissemination In the intestineparticularly the basal membrane separates the epithelialtissue from the conjunctive tissue and a histopathologicalcharacteristic of intestinal tumors is the loss of the basalmembrane integrity [24]
The ECM is composed of a large variety of structuralmolecules such as collagen noncollagen glycoproteins andproteoglycans that play a complex role in the regulation ofcell behavior influencing its development growth survivalmigration signal transduction structure and function [2526]
Thus the degradation of elements constituting thebasal membrane and ECM mediated by certain proteolyticenzymes usually metalloproteinases can represent a funda-mental step in tumor progression and metastasis [4]
In recent decades research in the field of cancer biologyhas focused extensively on the role of the ECM constituentsduring tumor progression Some proteins located in specificdomains of the ECM play a critical role in keeping thecells linked to matrix elements and the basal membranealso participating in the matrix-cell signaling cascades Thisinformation from the ECM is transmitted to the cellsmainly by means of integrin molecules to activate forexample cytokines growth factors and intracellular adaptormolecules Thus it can significantly affect many differentprocesses such as cell cycle progression and cell migrationand differentiation The interaction between the biophysicalproperties of the cell and the ECM establishes a dynamicreciprocity generating a sequence of reactionswith a complexnetwork of proteases sulfatases and possibly other enzymesto release and activate several signaling pathways in a veryspecific and localizedmanner ECMhomeostasis is thereforea delicate balance between the biosynthesis of proteins itsstructural organization biosignaling and the degradation ofits elements [7]
16 The Scientific World Journal
Table 7The distribution of expression levels per IHC of proteins corresponding to ITGB-5 ITGA-3 MMP-2 MMP-9 and FN-1 ECM genesand EGFR VEGF Ki-67 P53 and Bcl-2 molecules as per the presence of perineural invasion in CRC (119899 = 114)
Perineural invasion EGFR Total 119875 valueHigh Low
Absence
0260
119873 66 40 106 623 377 1000
Presence119873 3 5 8 375 625 1000
Total119873 69 45 114 605 395 1000
Perineural invasion VEGF Total P valueHigh Low
Absence
0027
119873 48 58 106 453 547 1000
Presence119873 7 1 8 875 125 1000
Total119873 55 59 114 482 518 1000
Perineural invasion KI-67 Total P valueHigh Low
Absence
0462
119873 47 59 106 443 557 1000
Presence119873 2 6 8 250 750 1000
Total119873 49 65 114 430 570 1000
Perineural invasion P53 Total P valueHigh Low
Absence
0470
119873 44 62 106 415 585 1000
Presence119873 2 6 8 250 750 1000
Total119873 46 68 114 404 596 1000
Perineural invasion Bcl-2 Total P valueHigh Low
Absence
0716
119873 52 54 106 491 509 1000
Presence119873 5 3 8 625 375 1000
The Scientific World Journal 17
Table 7 Continued
Total119873 57 57 114 500 500 1000
Perineural invasion ITGB-5 Total P valueHigh Low
Absence
0463
119873 60 46 106 566 434 1000
Presence119873 3 5 8 375 625 1000
Total119873 63 51 114 553 447 1000
Perineural invasion ITGA-3 Total P valueHigh Low
Absence
0717
119873 52 54 106 491 509 1000
Presence119873 3 5 8 375 625 1000
Total119873 55 59 114 482 518 1000
Perineural invasion MMP-2 Total P valueHigh Low
Absence
0999
119873 49 57 106 462 538 1000
Presence119873 4 4 8 500 500 1000
Total119873 53 61 114 465 535 1000
Perineural invasion MMP-9 Total P valueHigh Low
Absence
0479
119873 56 50 106 528 472 1000
Presence119873 3 5 8 375 625 1000
Total119873 59 55 114 518 482 1000
18 The Scientific World Journal
Table 7 Continued
Perineural invasion FN-1 Total P valueHigh Low
Absence
0102
119873 73 33 106 689 311 1000
Presence119873 8 0 8 1000 00 1000
Total119873 81 33 114 711 289 1000
42 The Methods Used for Tracking and Identifying ECMGenes The simplicity of PCR array allows it to be used forroutine research as it is a reliable tool to analyze the expres-sion of a panel of genes specific to a particular pathologyoffering high sensitivity and broad dynamic range The useof the SuperArray Kit (PAHs-031A-24 Ambriex) for ECMand cell adhesion molecules allowed for the analysis of theexpression of 84 genes important for cell-cell and cell-matrixinteractions This array contains ECM proteins includingbasal membrane collagen and gene constituents
Using RT-PCR it was possible to analyze in a quicksimple and reliable manner the expression of a group of genetranscripts involved in the progression and dissemination ofcolorectal adenocarcinoma in several staging phases Variousstudies have used this method in different types of malignantneoplastic diseases [18 27] with regard to angiogenesis [19]apoptosis [20] and the cell cycle [28]
The TMA a technique described by Kononen et al in1998 is widely accepted in the literature This extremelysimple concept consists of grouping a large number of tissuesamples in a single paraffin block and allows for the study ofthe expression of molecular markers in a large scale with theuse of storedmaterial TMAshave advantages over traditionalcuts such as a reduction in reagents and time required toperform the reactions The standardization of the reactionshas facilitated comparative interpretation of research cases[29 30]
The use of monoclonal antibodies with IHC examinationin the TMA and in situ hybridization techniques allowsfor the detection of differential tissue protein expressioncorresponding to the gene (validation process of tracingtechniques) in a simplified manner as well as more elaboratetechnical standardization hence minimizing the possibilityof measurement biases
43 The Results In this study an increase of the expressionof integrins alpha 3 and beta 5 genes can be observed inadvanced tumors locally or remotely in stages III and IVrelative to stages I and II which represent nonmetastatictumors to lymph nodes andor other sites a fact confirmedby protein expression using the TMA technique Othercorrelations such as histologic type and venous and neural
invasion were also found to be significant further reinforcingthe possible role of integrins in tumor progression anddissemination in colorectal adenocarcinoma
Integrin alpha 3 is usually expressed in normal tissuesand in various tumors Studies evaluating the expression ofintegrin alpha 3 in primary colon cancer and its respec-tive metastases in the liver have shown that almost 275of primary tumors presented with increased expression ofintegrin alpha 3 relative to the metastatic tumor In thepresent study while evaluating gene expression there wasa significant difference in the expression of integrin alpha3 a result validated by the analysis of protein expression bythe immunohistochemical method and a greater expressionwas observed in the TNM III and IV groups than in theTNM I and II groups thus suggesting a possible relation ofintegrin 3 with more advanced stages of colorectal cancerSignificant differences were also found in the ITGA-3 proteinlevels between the presence and absence of venous invasionhowever this fact was not supported by the gene expressionlevels using RT-PCR
In 1999 Haler et al studied the expression levels ofintegrins alpha 2 3 5 and 6 using IHC in lineages of livermetastatic colorectal carcinoma cells an increased expressionof integrins alpha 2 and alpha 3 was observed particularlywith regard to the potential dissemination of CRC [31] Jinkaet al in a recent study observed the same results includinghowever a higher number of malignant tumors [7] In thepresent study the ITGB-5 gene showed significantly higherexpression levels in the TNM III and IV stage groupscompared with the TNM I and II groups these data wereconfirmed by the results of the protein expression analysisusing immunohistochemistry
When comparing ITGB-5 gene expression with thedegree of cell differentiation a significant difference wasobserved in the grade III group compared with the gradesI and II groups however when evaluating the proteinexpression of the ITGB-5 gene there were no significantdifferences between the degrees of cell differentiation in theanalyses
A recent study using cell cultures of human breast cancerand normal epithelial tissue demonstrated a role of integrinbeta 5 in tumor progression and invasion by changes inadhesion the cell structure and differentiation when the
The Scientific World Journal 19
Table 8The distribution of expression levels per IHC of proteins corresponding to ITGB-5 ITGA-3 MMP-2 MMP-9 and FN-1 ECM genesand EGFR VEGF KI-67 P53 and Bcl-2 molecules as per the villous and tubular types of CRC (119899 = 114)
Tumor histologic typetubular times villous
EGFR Total 119875 valueHigh Low
Tubular
0579
119873 52 29 81 642 358 1000
Villous119873 9 7 16 563 438 1000
Total119873 61 36 97 629 371 1000
Tumor histologic typetubular times villous
VEGF Total P valueHigh Low
Tubular
1000
119873 41 40 81 506 494 1000
Villous119873 8 8 16 500 500 1000
Total119873 49 48 97 505 495 1000
Tumor histologic typetubular times villous
KI-67 Total P valueHigh Low
Tubular
0783
119873 36 45 81 444 556 1000
Villous119873 6 10 16 375 625 1000
Total119873 42 55 97 433 567 1000
Tumor histologic typetubular times villous
P53 Total P valueHigh Low
Tubular
1000
119873 32 49 81 395 605 1000
Villous119873 6 10 16 375 625 1000
Total119873 38 59 97 392 608 1000
20 The Scientific World Journal
Table 8 Continued
Tumor histologic typetubular times villous
Bcl-2 Total P valueHigh Low
Tubular
0277
119873 37 44 81
457 543 1000
Villous119873 10 6 16
625 375 1000
Total119873 47 50 97
485 515 1000
Tumor histologic typetubular times villous
ITGB-5 Total P valueHigh Low
Tubular
1000
119873 44 37 81
543 457 1000
Villous119873 9 7 16
563 438 1000
Total119873 53 44 97
546 454 1000
Tumor histologic typetubular times villous
ITGA-3 Total P valueHigh Low
Tubular
1000
119873 40 41 81
494 506 1000
Villous119873 8 8 16
500 500 1000
Total119873 48 49 97
495 505 1000
Tumor histologic typetubular times villous
MMP-2 Total P valueHigh Low
Tubular
0585
119873 44 37 81
543 457 1000
Villous119873 7 9 16
438 563 1000
Total119873 51 46 97
526 474 1000
The Scientific World Journal 21
Table 8 Continued
Tumor histologic typetubular times villous
MMP-9 Total P valueHigh Low
Tubular
0000
119873 49 32 81 605 395 1000
Villous119873 1 15 16 63 938 1000
Total119873 50 47 97 515 485 1000
Tumor histologic typetubular times villous
FN-1 Total P valueHigh Low
Tubular
1000
119873 57 24 81 704 296 1000
Villous119873 11 5 16 688 313 1000
Total119873 68 29 97 701 299 1000
inhibition of this integrin was found to significantly reducebreast carcinoma cell invasion [32] It has also been reportedthat integrin expression levelsmay vary considerably betweenthe normal and tumor tissue In a certain way integrins alphav beta 5 and alpha v beta 6 are generally expressed in lowlevels or are nondetectable in normal human adult epitheliumand are highly expressed in some tumors correlating to moreadvanced stages of the disease [33]
It is possible that the increased expression of integrinsalpha v beta 3 and alpha v beta 5 promotes the linkingof tumor cells in the temporary matrix proteins such asvitronectin fibrinogen von Willebrand factor osteopontinand fibronectin that are deposited in the tumor microenvi-ronment facilitating the process of endothelial angiogenesis[34]
Among the studied genes the overexpression of thefollowing metalloproteinases in the tumor tissue can becorrelated to at least one clinicopathological variableMMP-1MMP-2 MMP-9 MMP-11 and MMP-16
MMP-2 and MMP-9 metalloproteinases our researchsubjects have been reported as essential in the tumor dis-semination and progression process by many authors Theseproteins degrade the main component of the basal mem-brane which is type IV collagen In several studies comparingMMP-2 expression levels in CRC and clinicopathologicalvariables a significance was observed regarding the strongexpression of this enzyme in stages III and IV (TNM) [3536] tumor size and venous invasion lymph node metastasis[35 37] and distant metastasis [35 36 38]
MMP-2 called gelatinase A in addition to type IVcollagen degrades other types of this protein such as V VIIand X and also fibronectin laminin and elastin which arecomponents of the ECM [35] Thus MMP-2 expression has
been investigated in several cancer types including colorectaladenocarcinoma as MMP is significantly increased in thetumor tissue compared with the nontumor tissue [39]
In our study there was a correlation of MMP-2 geneand protein expression levels with the clinicopathologicalvariables such as mucinous histological type with signetring cells and SOE adenocarcinoma our results show thatthe MMP2 has potential as a prognostic CRC marker inagreement with other published studies
MMP9 known as gelatinase B promotes the degradationof an important component of the basal membrane typeIV collagen which is crucial for the invasion of malignanttumors from the proteolysis of ECM with CRC progressionand metastasis [40] Thus there is substantial interest inthe study of the MMP-9 expression in CRC as a prognosticmarker
Several studies in the literature have shown increasedexpression of MMP-9 in CRC with significance with regardto clinicopathological variables such as stages III and IV(TNMDukes C and D) [38ndash41] lymph node metastasis [4042] remote metastasis [37ndash40] peritumoral inflammatoryinfiltrate [43] and degree of cell differentiation II and III[38 40 41 44 45]
In this study MMP-9 expression appeared significantlymore frequently in the villous histological type that accord-ing to the literature studies shows a better prognosis thanSOE adenocarcinomas [46]
44 Correlation of IHC Expression of the EMC Genes ofInterest FN-1 ITGA-3 ITGB-5 MMP-2 and MMP-9 withthe Non-ECM Molecules EGFR VEGF P53 Bcl-2 and KI-67 According to Viana et al in 2013 ECM componentsinteract with non-ECM molecules in CRC carcinogenesis
22 The Scientific World Journal
Table 9The distribution of expression levels per IHC of proteins corresponding to ITGB-5 ITGA-3 MMP-2 MMP-9 and FN-1 ECM genesand EGFR VEGF KI-67 P53 and Bcl-2 molecules as per mucinous and tubular tumor types of CRC (119899 = 114)
Tumor histologic typemucinous times tubular
EGFR Total 119875 valueHigh Low
Mucinous
0273
119873 8 9 17 471 529 1000
Tubular119873 52 29 81 642 358 1000
Total119873 60 38 98 612 388 1000
Tumor histologic typemucinous times tubular
VEGF Total P valueHigh Low
Mucinous
0294
119873 6 11 17 353 647 1000
Tubular119873 41 40 81 506 494 1000
Total119873 47 51 98 480 520 1000
Tumor histologic typemucinous times tubular
KI-67 Total P valueHigh Low
Mucinous
1000
119873 7 10 17 412 588 1000
Tubular119873 36 45 81 444 556 1000
Total119873 43 55 98 439 561 1000
Tumor histologic typemucinous times tubular
P53 Total P valueHigh Low
Mucinous
0596
119873 8 9 17 471 529 1000
Tubular119873 32 49 81 395 605 1000
Total119873 40 58 98 408 592 1000
The Scientific World Journal 23
Table 9 Continued
Tumor histologic typemucinous times tubular
Bcl-2 Total P valueHigh Low
Mucinous
0425
119873 10 7 17
588 412 1000
Tubular119873 37 44 81
457 543 1000
Total119873 47 51 98
480 520 1000
Tumor histologic typemucinous times tubular
ITGB-5 Total P valueHigh Low
Mucinous
0793
119873 10 7 17
588 412 1000
Tubular119873 44 37 81
543 457 1000
Total119873 54 44 98
551 449 1000
Tumor histologic typemucinous times tubular
ITGA-3 Total P valueHigh Low
Mucinous
0600
119873 7 10 17
412 588 1000
Tubular119873 40 41 81
494 506 1000
Total119873 47 51 98
480 520 1000
Tumor histologic typemucinous times tubular
MMP-2 Total P valueHigh Low
Mucinous
0001
119873 2 15 17
118 882 1000
Tubular119873 44 37 81
543 457 1000
Total119873 46 52 98
469 531 1000
24 The Scientific World Journal
Table 9 Continued
Tumor histologic typemucinous times tubular
MMP-9 Total P valueHigh Low
Mucinous
0596
119873 9 8 17 529 471 1000
Tubular119873 49 32 81 605 395 1000
Total119873 58 40 98 592 408 1000
Tumor histologic typemucinous times tubular
FN-1 Total P valueHigh Low
Mucinous
0771
119873 13 4 17 765 235 1000
Tubular119873 57 24 81 704 296 1000
Total119873 70 28 98 714 286 1000
Table 10The distribution of expression levels per IHC of proteins corresponding to ITGB-5 ITGA-3 MMP-2 MMP9 and FN-1 ECM genesand EGFR VEGF KI-67 P53 and Bcl-2 molecules as per the degrees of high and low expression of CRC (119899 = 114)
Markers Low expression High expression119899 () 119899 ()
FN-1 81 (711) 33 (289)ITGA-3 55 (482) 59 (518)ITGB-5 63 (553) 51 (447)MMP-2 53 (465) 61 (535)MMP-9 59 (518) 55 (482)P53 46 (404) 68 (596)Bcl-2 57 (500) 57 (500)KI-67 49 (430) 65 (570)EGFR 69 (605) 45 (395)VEGF 55 (482) 59 (518)
Table 11 The distribution of Spearman (119903) correlation coefficients two-tailed model for significant associations (119875 lt 005) between theimmunohistochemical expressions of ECM genes FN-1 ITGA-3 ITGB-5 MMP-2 and MMP-9 and epithelial markers EGFR VEGF KI-67P53 and Bcl-2 in CRC (119899 = 114)
FN-1 ITGA-3 ITGB-5 MMP-2 MMP-9 EGFR VEGF KI-67 P53 Bcl-2FN1 1 mdash mdash mdash mdash mdash mdash mdash mdash mdashITGA-3 mdash 1 048 mdash 065 074 mdash mdash mdash mdashITGB-5 mdash 048 1 mdash 043 042 mdash mdash mdash mdashMMP-2 mdash mdash mdash 1 mdash minus020 minus001 mdashMMP-9 mdash 065 043 mdash 1 076 mdash 030 022 mdashEGFR mdash 074 042 mdash 076 1 mdash 037 033 mdashVEGF mdash mdash mdash mdash 1 mdash mdash 033KI-67 mdash mdash mdash mdash 030 037 mdash 1 087 mdashP53 mdash mdash mdash minus019 022 033 mdash 087 1 mdashBcl-2 mdash mdash mdash mdash 033 mdash 10 = no correlation 0ndash025 = weak 025ndash050 = regular 050ndash075 = moderate gt075 = strong 1 = perfect correlation
The Scientific World Journal 25
Table 12 Real-time PCR and immunohistochemistry correlation of differentially expressed extracellular matrix genes in 114 patients withcolorectal adenocarcinoma 119875 lt 005
Genes Classification RT-PCR RT-PCR Parameters analysed IHC IHCFold change 119875 value Validation 119875 value
MMP-2 ECM proteases217 001 Mucinous times tubular No 0001
minus12 004 Peritumoral lymphocyteinfiltrate +minus No 1000
minus211 003 Age (gt60 yr times lt60 yr) No 0000
FN-1Other adhesionmoleculescollagens andECM structuralconstituents
minus307 002 AGE No 1000
ITGB-5Transmembranemoleculescell-matrixadhesion
211 004 Grade cell differentiation(I II times III IV) No 0394
133 002 TNM (I II times III IV) Yes 0000ITGA-3 Transmembrane molecules 258 001 TNM (I II times III IV) Yes 0000MMP-9 ECM proteases 113 001 Villous times tubular Yes 0000IHC immunohistochemistry RT-PCR reverse transcription polymerase
progression and dissemination One of the goals of our studywas to evaluate the correlation of the expression of ECMcomponents with that of P53 Bcl-2 KI-67 EGFR and VEGFbecause it is known that proliferation apoptosis and cellmigration are regulated by cell-cell interactions and ECM cellcomponents It is also worth noting that growth factors (egEGF and VEGF) are usually stored in the ECM and can beactivated and released after ECMmodulation [12 15] In thisstudy we found that the correlation between MMP-9 andITGA-3 genes with epithelial marker EGFR has been strongwhereas no relationship between the tumor expression ofMMP-2 FN-1 and ITGB-5 with non-ECMmolecules VEGFKI-67 P53 and Bcl-2 could be demonstrated
5 Conclusions
In CRCs the overexpression of ITGA-3 and ITGB-5 genesand of their proteins was associated with lymph nodal dis-semination stages and remotemetastasis whereas the overex-pression of MMP-2 andMMP-9 genes and their proteins wasassociated with the mucinous and villous histological typesrespectively The epithelial marker EGFR (epidermal growthfactor receptor) overactivity has been shown to be associatedwith the ECM genes MMP-9 and ITGA-3 expression
Conflict of Interests
The authors declare that there is no conflict of interestsregarding the publication of this paper
References
[1] B M Rossi W T Nakagawa F O Ferreira S A Junior and ALopes Colon Rectal and Anal Cancer Lemar e Tecmedd SaoPaulo Brazil 2004
[2] Y-X Chen YWang C-C Fu et al ldquoDexamethasone enhancescell resistance to chemotherapy by increasing adhesion to
extracellular matrix in human ovarian cancer cellsrdquo Endocrine-Related Cancer vol 17 no 1 pp 39ndash50 2010
[3] G Murphy P Koklitis and A F Carne ldquoDissociation oftissue inhibitor of metalloproteinases (TIMP) from enzymecomplexes yields fully active inhibitorrdquoBiochemical Journal vol261 no 3 pp 1031ndash1034 1989
[4] G Ghilardi M L Biondi J Mangoni et al ldquoMatrix metallo-proteinase-1 promoter polymorphism 1 g2 g is correlated withcolorectal cancer invasivenessrdquo Clinical Cancer Research vol 7no 8 pp 2344ndash2346 2001
[5] B von Lampe A Stallmach and E O Riecken ldquoAltered gly-cosylation of integrin adhesion molecules in colorectal cancercells and decreased adhesion to the extracellular matrixrdquo Gutvol 34 no 6 pp 829ndash836 1993
[6] M Streit R Schmidt R U Hilgenfeld E Thiel and E-DKreuser ldquoAdhesion receptors in malignant transformation anddissemination of gastrointestinal tumorsrdquo Journal of MolecularMedicine vol 74 no 5 pp 253ndash268 1996
[7] R Jinka R Kapoor P G Sistla T A Raj and G PandeldquoAlterations in cell-extracellular matrix interactions duringprogression of cancersrdquo International Journal of Cell Biologyvol 2012 Article ID 219196 8 pages 2012
[8] M F P van der Jagt T Wobbes L J A Strobbe F C G JSweep and P N Span ldquoMetalloproteinases and their regulatorsin colorectal cancerrdquo Journal of Surgical Oncology vol 101 no3 pp 259ndash269 2010
[9] V Surlin M Ioana and I E Plesea ldquoGenetic patterns of metal-loproteinases and their tissue inhibitorsmdashclinicopathologic andprognostic significance in colorectal cancerrdquo Romanian Journalof Morphology and Embryology vol 52 no 1 supplement pp231ndash236 2011
[10] V P Navarro P Nelson-Filho L A B Silva and A C FreitasldquoMatrix metalloproteinases participation in physiological andpathologic oral processesrdquo Revista de Odontologia da UNESPvol 35 no 4 pp 233ndash238 2006
[11] M Juca B L B B P Nunes H LMenezes E G A Gomes andD Matos ldquoMetalloproteinases 1 and 7 and colorectal cancerrdquoRevista Brasileira de Coloproctologia vol 28 no 3 pp 353ndash3622008
26 The Scientific World Journal
[12] L S Viana R J Afonso Jr S R Morini et al ldquoRelationshipbetween the expression of the extracellular matrix genes sparcsppp1 fn1 itga5 and itgav and clinicopathological parametersof tumor progression and colorectal cancer disseminationrdquoOncology vol 84 pp 81ndash91 2013
[13] M V A Denadai L S Viana R J Afonso Jr et al ldquoExpressionof integrin genes and proteins in progression and disseminationof colorectal adenocarcinomardquo BMC Clinical Pathology vol 13article 16 2013
[14] P CNowell ldquoTumor progression a brief historical perspectiverdquoSeminars in Cancer Biology vol 12 no 4 pp 261ndash266 2002
[15] M A Arnaout S L Goodman and J-P Xiong ldquoStructure andmechanics of integrin-based cell adhesionrdquo Current Opinion inCell Biology vol 19 no 5 pp 495ndash507 2007
[16] C J Avraamides B Garmy-Susini and J A Varner ldquoIntegrinsin angiogenesis and lymphangiogenesisrdquo Nature Reviews Can-cer vol 8 no 8 pp 604ndash617 2008
[17] P Pinon and B Wehrle-Haller ldquoIntegrins versatile receptorscontrolling melanocyte adhesion migration and proliferationrdquoPigment Cell and Melanoma Research vol 24 no 2 pp 282ndash294 2011
[18] M S Nicoloso R Spizzo M Shimizu S Rossi and G A CalinldquoMicroRNAsmdashthemicro steering wheel of tumour metastasesrdquoNature Reviews Cancer vol 9 no 4 pp 293ndash302 2009
[19] M K McElroy S Kaushal H S T Cao et al ldquoUpregulationof thrombospondin-1 and angiogenesis in an aggressive humanpancreatic cancer cell line selected for high metastasisrdquoMolec-ular Cancer Therapeutics vol 8 no 7 pp 1779ndash1786 2009
[20] S Raeder T P Utheim Oslash A Utheim et al ldquoEffects oforgan culture and optisol-GS storage on structural integrityphenotypes and apoptosis in cultured corneal epitheliumrdquoInvestigative Ophthalmology and Visual Science vol 48 no 12pp 5484ndash5493 2007
[21] F Bertucci S Salas S Eysteries et al ldquoGene expression profilingof colon cancer by DNA microarrays and correlation withhistoclinical parametersrdquoOncogene vol 23 no 7 pp 1377ndash13912004
[22] A Hoos and C Cordon-Cardo ldquoTissue microarray profiling ofcancer specimens and cell lines opportunities and limitationsrdquoLaboratory Investigation vol 81 no 10 pp 1331ndash1338 2001
[23] C Spearman ldquoThe proof and measurement of associationbetween two thingsrdquo International Journal of Epidemiology vol39 no 5 pp 1137ndash1150 2010
[24] A Stallmach B von Lampe H Matthes G Bornhoft andE O Riecken ldquoDiminished expression of integrin adhesionmolecules on human colonic epithelial cells during the benignto malign tumour transformationrdquo Gut vol 33 no 3 pp 342ndash346 1992
[25] S M Pupa S Menard S Forti and E Tagliabue ldquoNew insightsinto the role of extracellular matrix during tumor onset andprogressionrdquo Journal of Cellular Physiology vol 192 no 3 pp259ndash267 2002
[26] T K Borg ldquoItrsquos the matrix ECM proteases and cancerrdquo TheAmerican Journal of Pathology vol 164 no 4 pp 1141ndash11422004
[27] T Ueda S Volinia H Okumura et al ldquoRelation betweenmicroRNA expression and progression and prognosis of gastriccancer a microRNA expression analysisrdquoThe Lancet Oncologyvol 11 no 2 pp 136ndash146 2010
[28] N Chen X-C Ye K Chu et al ldquoA secreted isoform of ErbB3promotes osteonectin expression in bone and enhances the
invasiveness of prostate cancer cellsrdquo Cancer Research vol 67no 14 pp 6544ndash6548 2007
[29] J Kononen L Bubendorf A Kallioniemi et al ldquoTissuemicroarrays for high-throughput molecular profiling of tumorspecimensrdquo Nature Medicine vol 4 no 7 pp 844ndash847 1998
[30] V P Andrade I W Cunha E M Silva et al ldquoTissue microar-rays high throughput and low cost avaiable for pathologistsrdquoJornal Brasileiro de Patologia e Medicina Laboratorial vol 43no 1 pp 55ndash60 2007
[31] J Haler M Nasralla and G L Nicolson ldquoDifferent adhe-sion properties of highly and poorly metastatic HT-29 coloncarcinoma cells with extracellular matrix components roleof integrin expression and cytoskeletal componentsrdquo BritishJournal of Cancer vol 80 no 12 pp 1867ndash1874 1999
[32] A Bianchi M E Gervasi and A V Bakin ldquoRole of 1205735-integrinin epithelial-mesenchymal transition in response to TGF120573rdquoCellCycle vol 9 no 8 pp 1647ndash1659 2010
[33] A Kren V Baeriswyl F Lehembre et al ldquoIncreased tumorcell dissemination and cellular senescence in the absence of 120573
1-
integrin functionrdquoThe EMBO Journal vol 26 no 12 pp 2832ndash2842 2007
[34] J S Desgrosellier and D A Cheresh ldquoIntegrins in cancerbiological implications and therapeutic opportunitiesrdquo NatureReviews Cancer vol 10 no 1 pp 9ndash22 2010
[35] M Pesta O Topolcan L Holubec Jr et al ldquoClinicopathologicalassessment and quantitative estimation of the matrix metal-loproteinases MMP-2 and MMP-7 and the inhibitors TIMP-1and TIMP-2 in colorectal carcinoma tissue samplesrdquoAnticancerResearch vol 27 no 4 pp 1863ndash1867 2007
[36] TOshimaCKunisaki K Yoshihara et al ldquoClinicopathologicalsignificance of the gene expression ofmatrixmetalloproteinasesand reversion-inducing cysteine-rich protein with Kazal motifsin patients with colorectal cancer MMP-2 gene expression isa useful predictor of liver metastasis from colorectal cancerrdquoOncology Reports vol 19 no 5 pp 1285ndash1291 2008
[37] Z Cavdar A E Canda C Terzi S Sarioglu M Fuzunand G Oktay ldquoRole of gelatinases (matrix metalloproteinases2 and 9) vascular endothelial growth factor and endostatinon clinicopathological behaviour of rectal cancerrdquo ColorectalDisease vol 13 no 2 pp 154ndash160 2011
[38] V V Delektorskaya and N E Kushlinskii ldquoClinical significanceof the content of biomolecularmarkers in invasive front of coloncarcinomasrdquo Bulletin of Experimental Biology andMedicine vol150 no 3 pp 368ndash371 2011
[39] M J Murnane J Cai S Shuja D McAneny V Klepeis and JB Willett ldquoActive MMP-2 effectively identifies the presence ofcolorectal cancerrdquo International Journal of Cancer vol 125 no12 pp 2893ndash2902 2009
[40] R Bendardaf A Buhmeida M Hilska et al ldquoMMP-9 (gelati-nase B) expression is associated with disease-free survival anddisease-specific survival in colorectal cancer patientsrdquo CancerInvestigation vol 28 no 1 pp 38ndash43 2010
[41] D Unsal N Akyurek A Uner et al ldquoGelatinase B expression asa prognostic factor in patients with stage IIIII rectal carcinomatreated by postoperative adjuvant therapyrdquo American Journal ofClinical Oncology vol 31 no 1 pp 55ndash63 2008
[42] S Zucker and J Vacirca ldquoRole of matrix metalloproteinases(MMPs) in colorectal cancerrdquo Cancer and Metastasis Reviewsvol 23 no 1-2 pp 101ndash117 2004
[43] D Chu Z Zhao Y Zhou et al ldquoMatrix metalloproteinase-9 isassociatedwith relapse and prognosis of patients with colorectal
The Scientific World Journal 27
cancerrdquo Annals of Surgical Oncology vol 19 no 1 pp 318ndash3252012
[44] L Herszenyi F Sipos O Galamb et al ldquoMatrix metallo-proteinase-9 expression in the normal mucosa-adenoma-dysplasia-adenocarcinoma sequence of the colonrdquo Pathologyand Oncology Research vol 14 no 1 pp 31ndash37 2008
[45] A Buhmeida R Bendardaf M Hilska et al ldquoPrognosticsignificance of matrix metalloproteinase-9 (MMP-9) in stageII colorectal carcinomardquo Journal of Gastrointestinal Cancer vol40 no 3-4 pp 91ndash97 2009
[46] T S Loy and P A Kaplan ldquoVillous adenocarcinoma of thecolon and rectum a clinicopothologic study of 36 casesrdquo TheAmerican Journal of Surgical Pathology vol 28 no 11 pp 1460ndash1465 2004
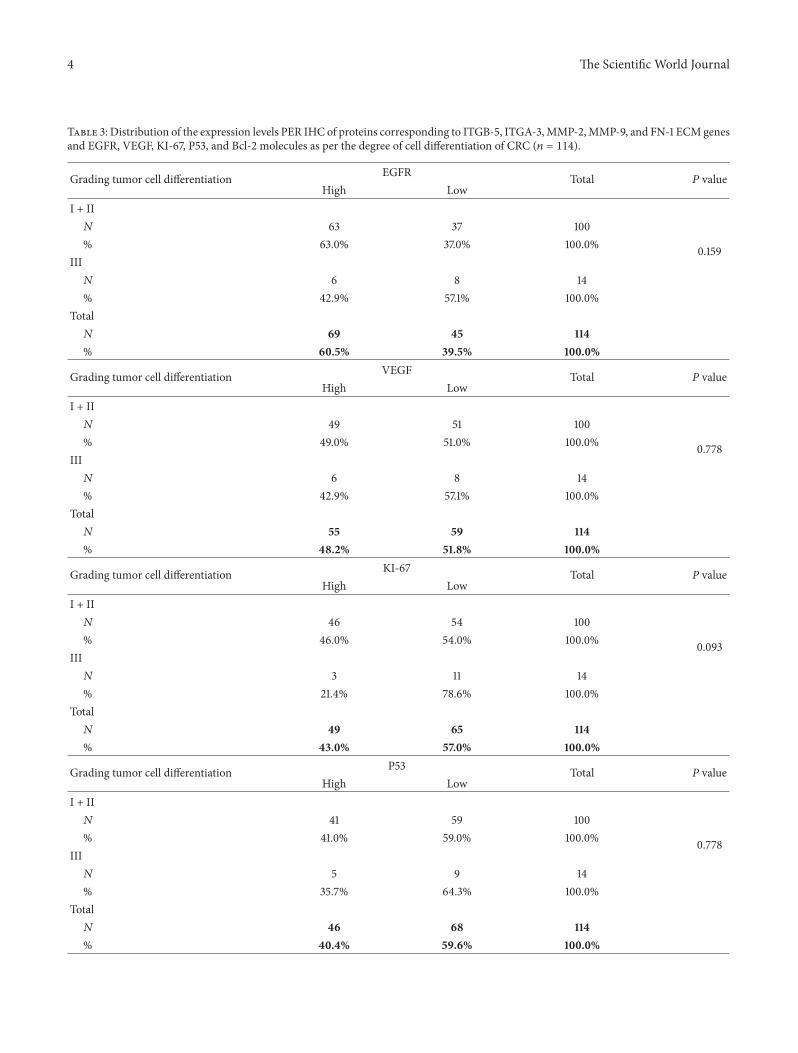
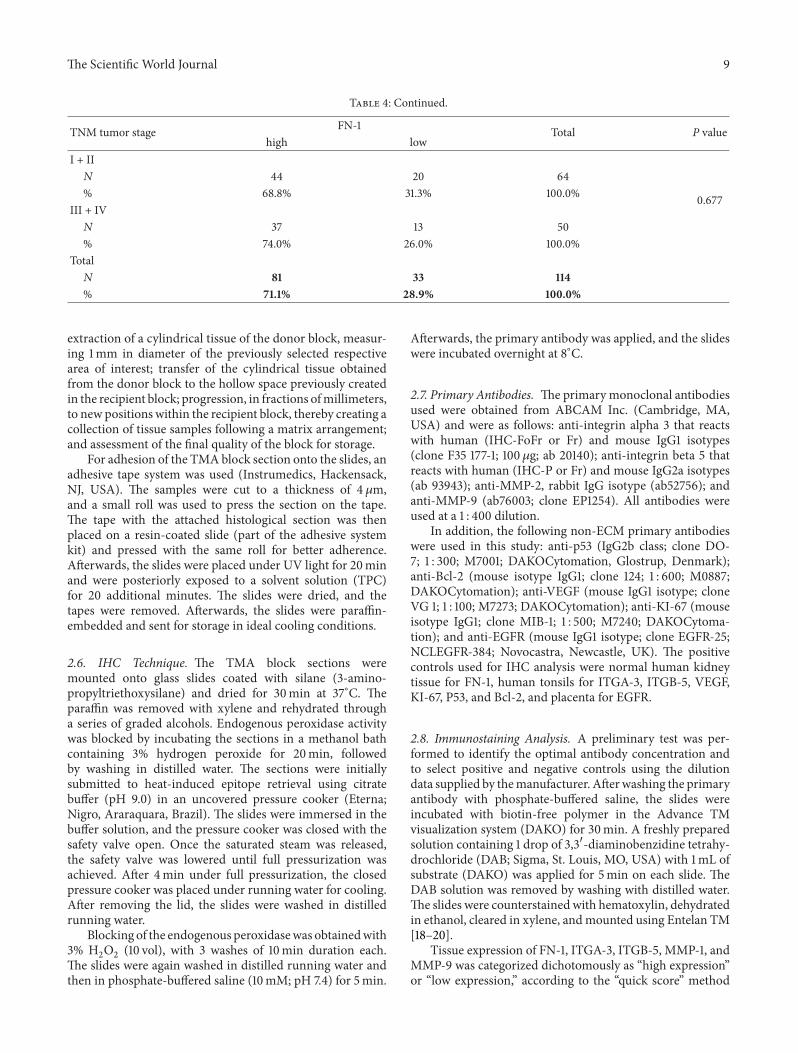
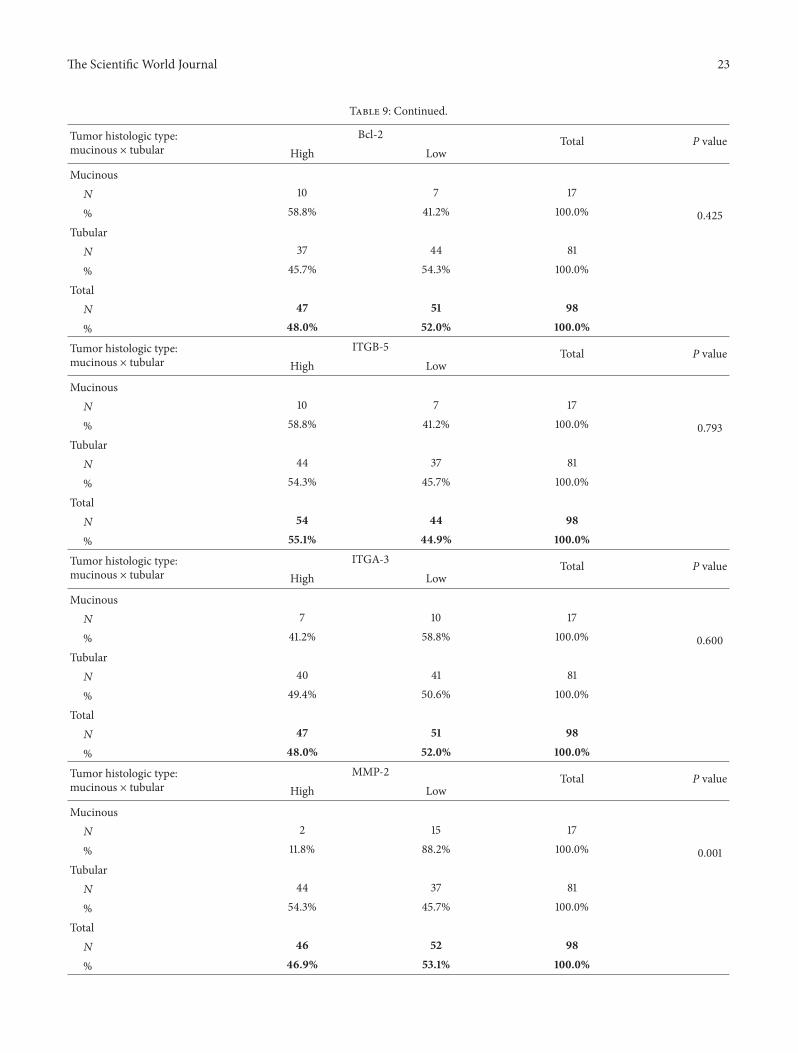
Related Documents