CHAPTER 1.1 Exports, FDI, and Competitiveness in Africa JENNIFER BLANKE, World Economic Forum ZUZANA BRIXIOVA, African Development Bank URI DADUSH, Carnegie Endowment TUGBA GURCANLAR, World Bank GIUSEPPE IAROSSI, World Bank The aim of this Report is to highlight the prospects for strong, sustained, and shared growth in Africa and, more importantly, the obstacles to the continent’s com- petitiveness and economic development. Such an assess- ment of Africa’s economies comes at an important time. A consensus among policymakers and researchers has emerged that African countries have weathered the global economic crisis well. Yet questions remain as to how sustainable this growth will be over the longer term. The recent economic downturn underscores the importance of developing a competitiveness-supporting economic environment that is based on productivity enhancements in order to better enable national econ- omies to weather unexpected shocks and to ensure solid, long-term economic performance. This chapter assesses the competitiveness landscape in Africa through a variety of lenses. We look at the factors driving pro- ductivity in general, as well as the export performance and ability of African countries to attract growth- enhancing foreign direct investment (FDI). Being for the most part small, open economies, African countries are well aware that a strong export performance is typically a prerequisite for reaching robust, sustained, and shared growth. In Africa, strong export performance does not mean only high export growth, but also increased diversification from low- value-added activities (such as the export of unprocessed commodities) to higher-value-added ones. 1 Such diver- sification lowers the volatility of growth through a reduced vulnerability of exports to external shocks. Exports of services can play an important role in this regard. According to Newfarmer et al., exports of services raises export growth, competitiveness, and diversification through lowering transaction costs in other export sectors, expanding existing activities, and creating new ones. 2 For example, tourism (discussed in Chapter 2.3) can have a positive impact on exports in the host country by creating foreign demand, enabling deeper understanding of foreign preferences and spill- overs that raise quality standards, and thus making the existing export activities more competitive. Mauritius provides an example of a successful experience with tourism helping to diversify exports. 3 African policymakers have recognized that FDI can also play a positive role in promoting growth, pro- ductivity, and development in their economies. FDI can be particularly beneficial for export sectors, as foreign companies help integrate developing countries into the global economy by easing access to foreign markets and including local enterprises in global production chains. Experiences from other world regions also suggest that FDI can help facilitate export diversification. 4 Recently, the literature on FDI has found it to be beneficial for the host countries’ growth when an enabling business environment—one that includes trade and investment openness—is in place. Especially when 3 1.1: Exports, FDI, and Competitiveness in Africa The Africa Competitiveness Report 2011 © 2011 World Economic Forum, the World Bank and the African Development Bank

Welcome message from author
This document is posted to help you gain knowledge. Please leave a comment to let me know what you think about it! Share it to your friends and learn new things together.
Transcript
CHAPTER 1.1
Exports, FDI, andCompetitiveness in AfricaJENNIFER BLANKE, World Economic Forum
ZUZANA BRIXIOVA, African Development Bank
URI DADUSH, Carnegie Endowment
TUGBA GURCANLAR, World Bank
GIUSEPPE IAROSSI, World Bank
The aim of this Report is to highlight the prospects forstrong, sustained, and shared growth in Africa and,more importantly, the obstacles to the continent’s com-petitiveness and economic development. Such an assess-ment of Africa’s economies comes at an important time.A consensus among policymakers and researchers hasemerged that African countries have weathered theglobal economic crisis well. Yet questions remain as tohow sustainable this growth will be over the longerterm.
The recent economic downturn underscores theimportance of developing a competitiveness-supportingeconomic environment that is based on productivityenhancements in order to better enable national econ-omies to weather unexpected shocks and to ensuresolid, long-term economic performance. This chapterassesses the competitiveness landscape in Africa througha variety of lenses. We look at the factors driving pro-ductivity in general, as well as the export performanceand ability of African countries to attract growth-enhancing foreign direct investment (FDI).
Being for the most part small, open economies,African countries are well aware that a strong exportperformance is typically a prerequisite for reachingrobust, sustained, and shared growth. In Africa, strongexport performance does not mean only high exportgrowth, but also increased diversification from low-value-added activities (such as the export of unprocessedcommodities) to higher-value-added ones.1 Such diver-sification lowers the volatility of growth through areduced vulnerability of exports to external shocks.Exports of services can play an important role in thisregard. According to Newfarmer et al., exports of services raises export growth, competitiveness, anddiversification through lowering transaction costs inother export sectors, expanding existing activities, andcreating new ones.2 For example, tourism (discussed inChapter 2.3) can have a positive impact on exports inthe host country by creating foreign demand, enablingdeeper understanding of foreign preferences and spill -overs that raise quality standards, and thus making theexisting export activities more competitive. Mauritiusprovides an example of a successful experience withtourism helping to diversify exports.3
African policymakers have recognized that FDI can also play a positive role in promoting growth, pro-ductivity, and development in their economies. FDI canbe particularly beneficial for export sectors, as foreigncompanies help integrate developing countries into theglobal economy by easing access to foreign markets andincluding local enterprises in global production chains.Experiences from other world regions also suggest thatFDI can help facilitate export diversification.4
Recently, the literature on FDI has found it to be beneficial for the host countries’ growth when anenabling business environment—one that includes tradeand investment openness—is in place. Especially when
3
1.1:
Exp
orts
, FDI
, and
Com
petit
iven
ess
in A
fric
a
The Africa Competitiveness Report 2011 © 2011 World Economic Forum, the World Bank and the African Development Bank

FDI is accompanied by increased and diversified trade,host countries tend to accelerate their growth rates.5
Since the impact of FDI on growth and productivity istypically higher in manufacturing and services than inmining, FDI flows into the service sectors (e.g., tele-communications, banking) can support countries intheir efforts to diversify production and exports. Byslashing transaction costs, they also raise export compet-itiveness.
In this context, this chapter examines recent trendsand the main impediments for integrating Africaneconomies into global export markets, attracting growth-enhancing FDI, and raising overall competitiveness.
Trade and FDI in Africa: Recent trendsOver the last two decades, world trade (measured incurrent US dollars) has tripled. Many factors have con-tributed to this extraordinary advance. Among them arethe liberalization of trade, the falling costs of communi-cations and transportation, the slicing up of global pro-duction chains, an increased need for natural resourcesin fast-growing developing countries, and an increasedappetite for diversity as incomes rose across the globe.International trade in services has particularly taken off because of the reduction in communication costsand the digitization of services.
However, not all developing regions benefitedfrom this trend. East Asia’s share of world exports grewspectacularly from 3.3 percent in 1980 to 8 percent in
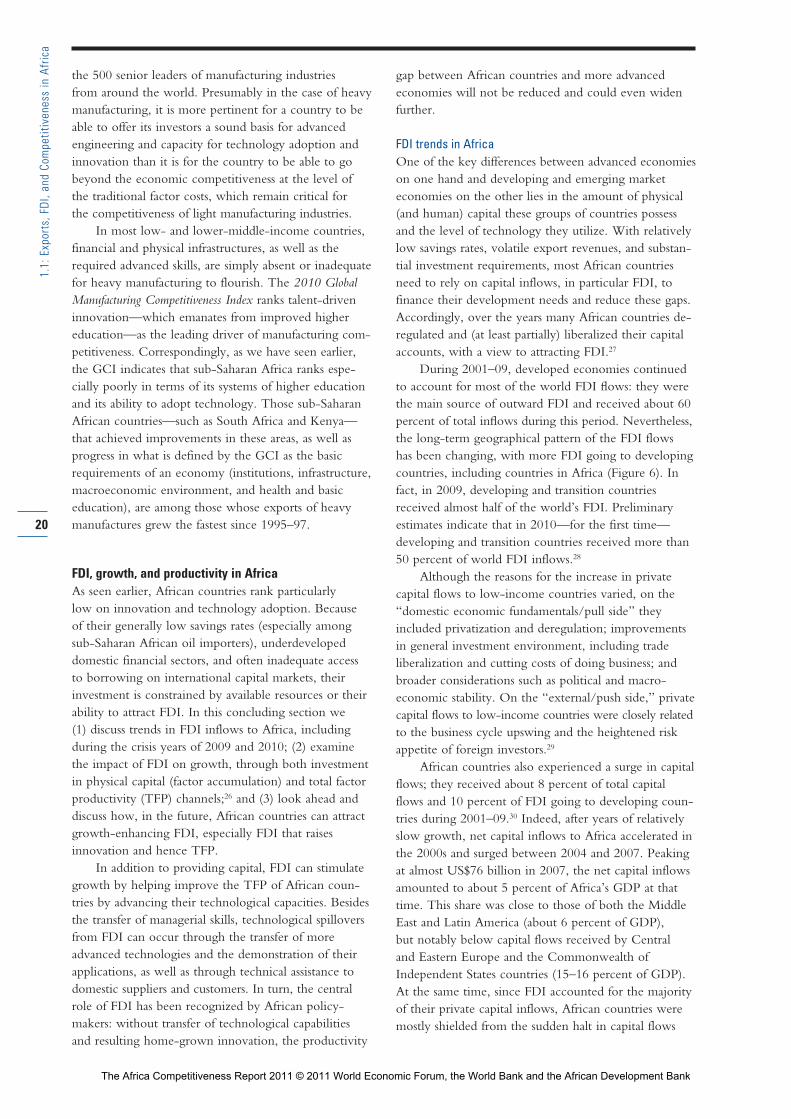
1995, and then to 14 percent in 2008. Europe andCentral Asia, as well as Latin America and the Caribbean,lagged behind, going from 1.2 and 6.5 percent in 1980to 7 and 6 percent of world exports, respectively, in2008. Meanwhile, sub-Saharan Africa’s share of worldexports showed little advance over this same period,and varied within a range of 1.3 and 1.6 percent. By2008, sub-Saharan Africa captured the smallest share of world exports of any region, exporting just US$200billion worth of goods for international markets, orUS$100 per capita (Figure 1).
Although the growth of African economies as awhole accelerated in the past decade, their exportgrowth rates continued to lag behind that of other devel-oping regions, thus further widening the gap betweenAfrica and the rest. Moreover, growth in exports inAfrica has been mostly driven by mining, which repre-sented 73 percent of export growth between 1995 and2008, the highest of all regions. The lack of productionand export diversification—in terms of both goods andpartners—made many African countries vulnerable toexternal shocks. Indeed, more diversified countries andregions such as East Africa weathered the crisis better (as discussed in Box 3).6 Reversing Africa’s marginaliza-tion in global trade, diversifying its exports, and movingthem up on the technology ladder are, therefore, keypolicy priorities.
Because of the dual linkages between FDI andtrade, FDI inflows have exhibited similar trends as trade,rising rapidly during 2000s. While developed countries
4
1.1:
Exp
orts
, FDI
, and
Com
petit
iven
ess
in A
fric
a
Figure 1: World export shares, by region
Source: UN Comtrade database, authors’ calculations.
0
3
6
9
12
15
East Asia Pacific Europe and Central Asia Latin Americaand the Caribbean
Sub-Saharan Africa
n Mid 1990sn Mid 2000s
Perc
ent o
f tot
al w
orld
exp
orts
The Africa Competitiveness Report 2011 © 2011 World Economic Forum, the World Bank and the African Development Bank

continued to receive the majority of FDI inflows until2009, the long-term geographical pattern has been grad-ually changing, with more inflows going to developingcountries, especially in Asia. Africa was no exception tothe general rise in FDI—in fact, FDI inflows to thecontinent more than tripled between 2001 and 2009.7
Looking ahead, a large body of literature hasunderscored how important it is for African countries tobe integrated in the world economy and have a strong,sophisticated, and well-diversified export sector in orderto maintain and achieve sustained growth. Moreover, the importance of creating enabling environment toattract FDI into high-growth potential sectors, beyondmining, cannot be overstated. Achieving these objec-tives will help Africa to improve competitiveness of itseconomies and raise productivity in order to achieverobust, sustained, and shared growth.8
Examining Africa’s competitivenessIn order to identify the priority areas requiring urgentand sustained policy attention to improve compet -itiveness in Africa, in this section we provide a bird’s eye view of the competitive landscape in Africa and an overview of where the continent stands vis-à-vis international benchmarks. We base this analysis on the World Economic Forum’s Global CompetitivenessIndex (GCI).9
Within the GCI, competitiveness is defined as the setof institutions, policies, and factors that determine the level ofproductivity of a country.10 The current and future levels of productivity, in turn, set the sustainable levels ofprosperity that can be earned by an economy. In otherwords, more competitive economies tend to be able toproduce higher levels of income for their citizens. Themeasurement of competitiveness is a complex undertak-ing. To this end, the GCI captures the idea that manydifferent elements matter for competitiveness by lookingat 12 distinct pillars:11 institutions (public and private),infrastructure, the macroeconomic environment, health and primary education, higher education and training,goods market efficiency, labor market efficiency, finan-cial market development, technological readiness, market size, business sophistication, and innovation.
Another important characteristic of the GCI is thatit explicitly takes into account the fact that countriesaround the world are at different stages of economicdevelopment. Accordingly, the GCI distinguishes threestages of development. In its first stage, economies arefactor-driven and countries compete based on their factorendowments—primarily unskilled labor and naturalresources. As wages rise with advancing development,countries move into the efficiency-driven stage of devel-opment (the second stage), when they must begin todevelop more efficient production processes and increaseproduct quality in order to continue to be competitive.Finally, as countries move into the innovation-driven
stage, they are able to sustain higher wages and the asso-ciated standard of living only if their businesses are ableto compete with new and unique products. At this thirdstage, companies must compete by producing new anddifferent goods and services using the most sophisticatedproduction processes.12 The full description of the GCIis shown in Appendix A.
This next section will assess the overall competi-tiveness of North Africa and sub-Saharan Africa as wellas the performance of individual countries comparedwith international standards. To put the analysis into aglobal context, we also include a number of comparatoreconomies and regions (Latin America and the
5
1.1:
Exp
orts
, FDI
, and
Com
petit
iven
ess
in A
fric
a
Table 1: Global Competitiveness Index 2010–2011 and2009–2010 comparisons
GCI 2010–2011 GCI 2009–2010Country/Region Rank* Score Rank†
China 27 4.8 29Tunisia 32 4.7 40Southeast Asian average 4.3India 51 4.3 49South Africa 54 4.3 45Mauritius 55 4.3 57Brazil 58 4.3 56Russian Federation 63 4.2 63Namibia 74 4.1 74North African average 4.1Morocco 75 4.1 73Botswana 76 4.1 66Latin American & Caribbean average 4.0Rwanda 80 4.0 n/aEgypt 81 4.0 70Algeria 86 4.0 83Gambia, The 90 3.9 81Libya 100 3.7 88Benin 103 3.7 103Senegal 104 3.7 92Kenya 106 3.6 98Cameroon 111 3.6 111Tanzania 113 3.6 100Ghana 114 3.6 114Zambia 115 3.5 112Sub-Saharan African average 3.5Cape Verde 117 3.5 n/aUganda 118 3.5 108Ethiopia 119 3.5 118Madagascar 124 3.5 121Malawi 125 3.4 119Swaziland 126 3.4 n/aNigeria 127 3.4 99Lesotho 128 3.4 107Côte d’Ivoire 129 3.3 116Mozambique 131 3.3 129Mali 132 3.3 130Burkina Faso 134 3.2 128Mauritania 135 3.1 127Zimbabwe 136 3.0 132Burundi 137 3.0 133Angola 138 2.9 n/aChad 139 2.7 131
Source: World Economic Forum, 2009, 2010.* Out of 139 economies.† Out of 133 economies.
The Africa Competitiveness Report 2011 © 2011 World Economic Forum, the World Bank and the African Development Bank

Caribbean,13 Southeast Asia,14 and the BRIC countries—Brazil, Russia, India, and China).
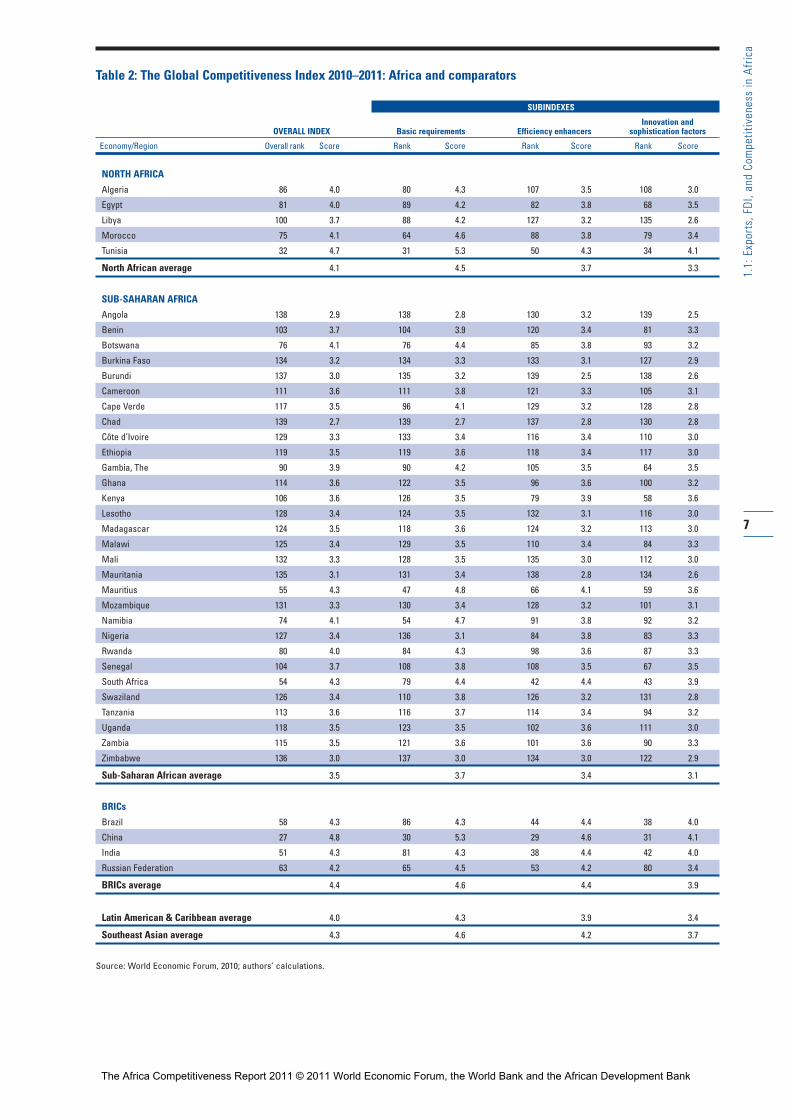
Africa’s competitiveness in an international contextOn average, both North Africa and sub-Saharan Africaare outperformed by Southeast Asia and by all of theBRIC economies. North Africa is ahead of LatinAmerica, however, and also scores significantly higherthan sub-Saharan Africa. Recent events in North Africaare discussed in Box 1. Only three countries from theAfrican continent figure in the top half of the overallrankings: Tunisia (32nd), South Africa (54th), andMauritius (55th) (Table 2). Tunisia is outperformed byChina, the most competitive of the BRIC countries,but is more competitive than all other comparators inthe table. South Africa and Mauritius are also behindChina, as well as behind Southeast Asia and India, butahead of Brazil, Russia, and the other regional averages.
Table 1 shows that there is a second group of countries that cluster together at approximately the same competitiveness level as the North African aver-age, namely Namibia, Morocco, and Botswana, ranked 74th, 75th, and 76th, respectively. All countries that rank below these three perform worse than the LatinAmerican and the Caribbean average, with Algeria and Libya outperformed by a number of sub-SaharanAfrican countries. The remaining sub-Saharan Africancountries that do better than the regional average areRwanda, Gambia, Benin, Senegal, Kenya, Cameroon,Tanzania, Ghana, and Zambia (Table 4).
On average, as we have seen in past years, per-formances vary greatly between the countries in thenorth and the south of the continent (Table 2). NorthAfrica outperforms sub-Saharan Africa in 10 of the 12pillars, namely institutions, infrastructure, macroeco-nomic stability, health and primary education (by a largemargin), higher education and training, goods marketefficiency, technological readiness, market size, businesssophistication, and innovation. Sub-Saharan Africa out-performs North Africa on average in only two pillars:labor market efficiency and financial market sophistica-tion. Nevertheless, vast differences in the sophisticationof financial sectors exist even within sub-Saharan Africa,with financial sectors in low-income countries in thatregion being among the world’s least developed. In contrast, financial sectors in several sub-Saharan Africanmiddle-income countries/emerging markets (e.g.,Mauritius and South Africa) and a few frontier markets(e.g., Kenya) show much greater sophistication than therest of the continent. Sub-Saharan Africa’s middle-income countries also fare well relative to those in otherregions of the world.
A comparison with other regions and countrieshighlights Africa’s relative strengths and weaknesses. Inparticular, North Africa’s performance is very close tothe Southeast Asian average in the quality of institu-tions, infrastructure, and health and primary education
6
1.1:
Exp
orts
, FDI
, and
Com
petit
iven
ess
in A
fric
a
Box 1: Political unrest and competitiveness inNorth Africa
As discussed in the main text of this chapter, North Africa onaverage outperforms most sub-Saharan African countries,and Tunisia in particular receives a very strong assessment.The political unrest that the region has witnessed in recentmonths might make this assessment seem counterintuitive.However, it is very important to note that the GCI aims togauge the extent to which countries have put in place the factors ensuring sustainable growth through produc -tivity enhancements. It is not a measure of political risk.Nevertheless, it needs to be acknowledged that the recentpolitical changes are likely to have a negative impact on theeconomy in the near term. The ongoing political transitionwill need to be accompanied by structural changes thatcould accelerate employment-intensive growth.
The recent events do not detract from the fact thatTunisia has been successful over recent decades. Its solidgrowth rates, averaging more than 4.7 percent between 1990and 2010, have been widely attributed to the country’s abilityto put in place many factors favoring productivity, includingbetter education, a more favorable environment for doingbusiness, and the adoption of new technologies for produc-tivity enhancements. Still, growth was not broad-based.Higher growth rates—according to Abed and Iradian, in therange of 6–8 percent a year1—and also more job-rich growthare needed in order for the benefits to spread to the middleand lower classes (see Box 1, Chapter 2.1).
The recent political change can be attributed in part to Tunisia’s success across some areas and its less stellarperformance in others: the country now has a more highlyeducated and well-informed population, which is demandingbetter job opportunities for the future than currently exist. Itwould benefit from enhancing the sophistication and knowl-edge intensity of its production processes, thus moving theeconomy from low-cost, low-value-added to a higher-value-added that would bring about job opportunities for the edu-cated unemployed. At the same, adjustments to the educa-tional system—including higher education—will be neededto reduce the mismatch between the existing skills anddemand arising from these new job opportunities (seeChapter 2.1 on education).
In sum, we remain cautiously optimistic for Tunisia andthe region as a whole, as long as the countries continue toput into place the reforms necessary for ensuring strongcompetitiveness and resilient economies.
Source: Abed and Iradian, 2011.
Note
1 Abed and Iradian 2011.
The Africa Competitiveness Report 2011 © 2011 World Economic Forum, the World Bank and the African Development Bank
7
1.1:
Exp
orts
, FDI
, and
Com
petit
iven
ess
in A
fric
a
Table 2: The Global Competitiveness Index 2010–2011: Africa and comparators
SUBINDEXES
Innovation and OVERALL INDEX Basic requirements Efficiency enhancers sophistication factors
Economy/Region Overall rank Score Rank Score Rank Score Rank Score
NORTH AFRICA
Algeria 86 4.0 80 4.3 107 3.5 108 3.0
Egypt 81 4.0 89 4.2 82 3.8 68 3.5
Libya 100 3.7 88 4.2 127 3.2 135 2.6
Morocco 75 4.1 64 4.6 88 3.8 79 3.4
Tunisia 32 4.7 31 5.3 50 4.3 34 4.1
North African average 4.1 4.5 3.7 3.3
SUB-SAHARAN AFRICA
Angola 138 2.9 138 2.8 130 3.2 139 2.5
Benin 103 3.7 104 3.9 120 3.4 81 3.3
Botswana 76 4.1 76 4.4 85 3.8 93 3.2
Burkina Faso 134 3.2 134 3.3 133 3.1 127 2.9
Burundi 137 3.0 135 3.2 139 2.5 138 2.6
Cameroon 111 3.6 111 3.8 121 3.3 105 3.1
Cape Verde 117 3.5 96 4.1 129 3.2 128 2.8
Chad 139 2.7 139 2.7 137 2.8 130 2.8
Côte d’Ivoire 129 3.3 133 3.4 116 3.4 110 3.0
Ethiopia 119 3.5 119 3.6 118 3.4 117 3.0
Gambia, The 90 3.9 90 4.2 105 3.5 64 3.5
Ghana 114 3.6 122 3.5 96 3.6 100 3.2
Kenya 106 3.6 126 3.5 79 3.9 58 3.6
Lesotho 128 3.4 124 3.5 132 3.1 116 3.0
Madagascar 124 3.5 118 3.6 124 3.2 113 3.0
Malawi 125 3.4 129 3.5 110 3.4 84 3.3
Mali 132 3.3 128 3.5 135 3.0 112 3.0
Mauritania 135 3.1 131 3.4 138 2.8 134 2.6
Mauritius 55 4.3 47 4.8 66 4.1 59 3.6
Mozambique 131 3.3 130 3.4 128 3.2 101 3.1
Namibia 74 4.1 54 4.7 91 3.8 92 3.2
Nigeria 127 3.4 136 3.1 84 3.8 83 3.3
Rwanda 80 4.0 84 4.3 98 3.6 87 3.3
Senegal 104 3.7 108 3.8 108 3.5 67 3.5
South Africa 54 4.3 79 4.4 42 4.4 43 3.9
Swaziland 126 3.4 110 3.8 126 3.2 131 2.8
Tanzania 113 3.6 116 3.7 114 3.4 94 3.2
Uganda 118 3.5 123 3.5 102 3.6 111 3.0
Zambia 115 3.5 121 3.6 101 3.6 90 3.3
Zimbabwe 136 3.0 137 3.0 134 3.0 122 2.9
Sub-Saharan African average 3.5 3.7 3.4 3.1
BRICs
Brazil 58 4.3 86 4.3 44 4.4 38 4.0
China 27 4.8 30 5.3 29 4.6 31 4.1
India 51 4.3 81 4.3 38 4.4 42 4.0
Russian Federation 63 4.2 65 4.5 53 4.2 80 3.4
BRICs average 4.4 4.6 4.4 3.9
Latin American & Caribbean average 4.0 4.3 3.9 3.4
Southeast Asian average 4.3 4.6 4.2 3.7
Source: World Economic Forum, 2010; authors’ calculations.
The Africa Competitiveness Report 2011 © 2011 World Economic Forum, the World Bank and the African Development Bank
pillars. Yet it is weaker than the Latin America andCaribbean average in half of the pillars, namely healthand primary education, higher education and training,labor market efficiency, financial market development,technological readiness, and business sophistication.Sub-Saharan Africa’s institutions are better assessed thanthose of the Latin America and Caribbean region,Russia, and Brazil. Further, sub-Saharan Africa’s labormarkets are on average more efficient than those ofLatin America and the Caribbean on average, as well asthose of both India and Brazil.
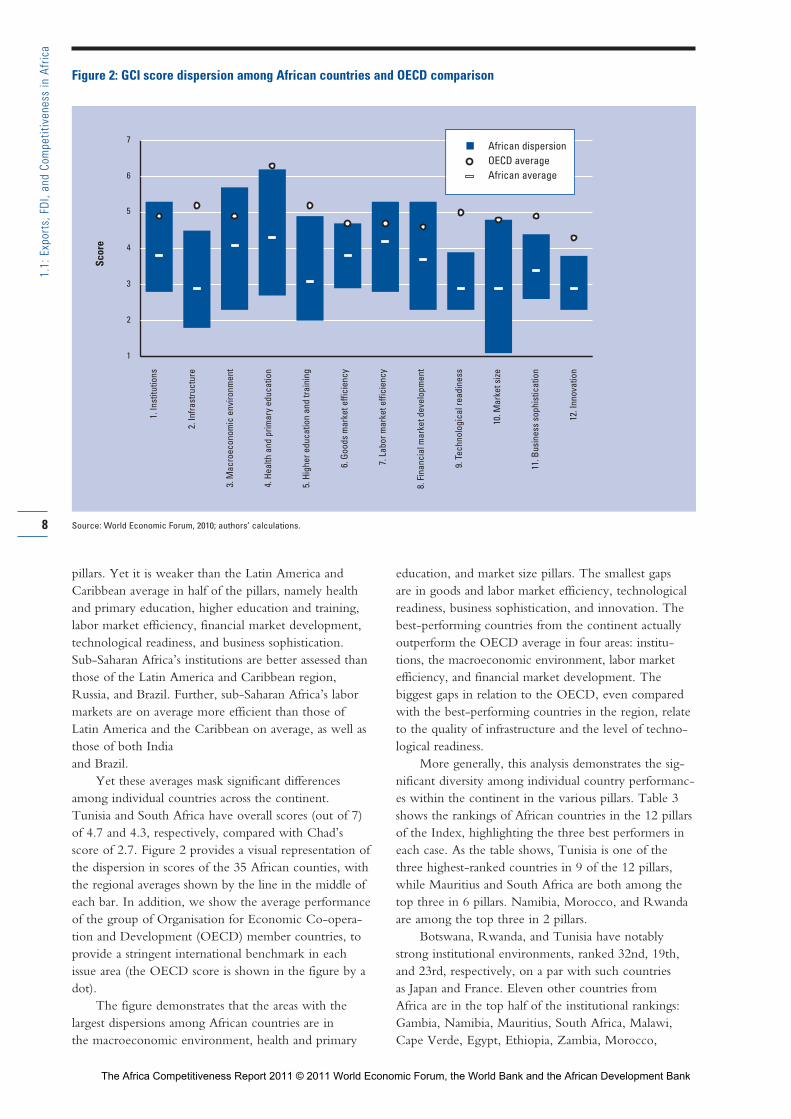
Yet these averages mask significant differencesamong individual countries across the continent.Tunisia and South Africa have overall scores (out of 7)of 4.7 and 4.3, respectively, compared with Chad’sscore of 2.7. Figure 2 provides a visual representation ofthe dispersion in scores of the 35 African counties, withthe regional averages shown by the line in the middle ofeach bar. In addition, we show the average performanceof the group of Organisation for Economic Co-opera-tion and Development (OECD) member countries, toprovide a stringent international benchmark in eachissue area (the OECD score is shown in the figure by adot).
The figure demonstrates that the areas with thelargest dispersions among African countries are in the macroeconomic environment, health and primary
education, and market size pillars. The smallest gaps are in goods and labor market efficiency, technologicalreadiness, business sophistication, and innovation. Thebest-performing countries from the continent actuallyoutperform the OECD average in four areas: institu-tions, the macroeconomic environment, labor marketefficiency, and financial market development. Thebiggest gaps in relation to the OECD, even comparedwith the best-performing countries in the region, relateto the quality of infrastructure and the level of techno-logical readiness.
More generally, this analysis demonstrates the sig-nificant diversity among individual country performanc-es within the continent in the various pillars. Table 3 shows the rankings of African countries in the 12 pillarsof the Index, highlighting the three best performers ineach case. As the table shows, Tunisia is one of thethree highest-ranked countries in 9 of the 12 pillars,while Mauritius and South Africa are both among thetop three in 6 pillars. Namibia, Morocco, and Rwandaare among the top three in 2 pillars.
Botswana, Rwanda, and Tunisia have notablystrong institutional environments, ranked 32nd, 19th,and 23rd, respectively, on a par with such countries as Japan and France. Eleven other countries from Africa are in the top half of the institutional rankings:Gambia, Namibia, Mauritius, South Africa, Malawi,Cape Verde, Egypt, Ethiopia, Zambia, Morocco,
8
1.1:
Exp
orts
, FDI
, and
Com
petit
iven
ess
in A
fric
a
Figure 2: GCI score dispersion among African countries and OECD comparison
&&&
1
2
3
4
5
6
71.
Inst
itutio
ns
2. In
frast
ruct
ure
3. M
acro
econ
omic
env
ironm
ent
4. H
ealth
and
prim
ary
educ
atio
n
5. H
ighe
r edu
catio
n an
d tra
inin
g
6. G
oods
mar
ket e
ffici
ency
7. L
abor
mar
ket e
ffici
ency
8. F
inan
cial
mar
ket d
evel
opm
ent
9. T
echn
olog
ical
read
ines
s
10. M
arke
t size
11. B
usin
ess
soph
istic
atio
n
12. I
nnov
atio
n
Scor
e
n African dispersionOECD averageAfrican average
Source: World Economic Forum, 2010; authors’ calculations.
The Africa Competitiveness Report 2011 © 2011 World Economic Forum, the World Bank and the African Development Bank

9
1.1:
Exp
orts
, FDI
, and
Com
petit
iven
ess
in A
fric
a
Table 3: Top three African performers in each pillar of the GCI
Country Rank Rank Rank Rank Rank Rank Rank Rank Rank Rank Rank Rank
Algeria 98 87 57 77 98 126 123 135 106 50 108 107
Angola 119 136 122 139 138 133 87 134 130 64 139 133
Benin 87 113 82 108 112 100 85 95 122 124 99 60
Botswana 32 84 74 114 94 58 61 47 99 102 104 74
Burkina Faso 90 134 98 135 135 120 91 128 124 119 137 90
Burundi 138 132 121 120 139 137 81 139 137 137 138 134
Cameroon 107 126 53 116 117 119 99 123 118 91 116 95
Cape Verde 56 109 102 88 109 111 122 104 79 139 131 117
Chad 135 137 134 138 136 138 95 137 138 120 133 115
Côte d’Ivoire 133 99 94 136 116 118 105 112 102 94 112 109
Egypt 57 64 129 91 97 90 133 82 87 26 63 83
Ethiopia 59 115 127 119 129 92 72 121 133 79 123 105
Gambia, The 37 69 117 124 103 66 16 76 97 138 65 62
Ghana 67 106 136 122 108 75 93 60 117 83 97 99
Kenya 123 102 128 121 96 88 46 27 101 74 62 56
Lesotho 100 120 77 131 124 84 86 114 129 135 114 113
Libya 111 95 7 115 95 134 139 130 114 69 136 131
Madagascar 129 130 112 103 128 107 67 131 123 110 124 102
Malawi 52 131 135 125 120 85 50 64 121 127 89 72
Mali 109 121 65 134 132 124 121 133 128 117 128 91
Mauritania 116 122 118 127 137 131 114 138 132 130 134 132
Mauritius 43 58 62 59 70 31 59 29 61 112 47 82
Morocco 66 71 31 94 102 77 130 74 75 57 78 81
Mozambique 99 119 104 133 134 112 116 116 113 113 110 84
Namibia 38 54 40 112 111 56 55 24 88 114 88 96
Nigeria 121 135 97 137 118 87 74 84 104 30 76 98
Rwanda 19 101 106 111 121 70 9 69 100 128 94 71
Senegal 76 112 89 118 110 79 109 107 93 105 84 55South Africa 47 63 43 129 75 40 97 9 76 25 38 44Swaziland 70 94 92 130 125 106 90 80 136 132 121 135
Tanzania 83 128 115 113 133 108 77 90 131 81 98 86
Tunisia 23 46 38 31 30 33 79 58 55 67 42 31Uganda 104 127 114 117 127 117 27 72 112 92 120 104
Zambia 65 118 120 128 114 65 107 49 110 111 90 80
Zimbabwe 105 129 139 126 115 130 129 105 135 134 119 122
Global leader SGP HKG BRN BEL FIN SGP SGP HKG SWE USA JPN USA
Source: World Economic Forum, 2010.Notes: Ranks of the best three performers are highlighted in blue. BEL = Belgium, BRN = Brunei Darussalam, FIN = Finland, HKG = Hong Kong SAR, JPN = Japan,
SGP = Singapore, SWE = Sweden, and USA = the United States.
1. Institutions2. Infra-structure
3. Macro-economic
environment
4. Health and primary education
5. Higher education
and training
6. Goodsmarket
efficiency
7. Labor market
efficiency
8. Financialmarket
development
9. Techno-logical
readiness
10.Market
size
11. Business
sophistication12.
Innovation
The Africa Competitiveness Report 2011 © 2011 World Economic Forum, the World Bank and the African Development Bank

and Ghana. Having built up strong institutional environments by international standards, these countriesprovide examples to follow for other countries inAfrica. The large number of African countries at thebottom of the rankings in this area demonstrates theextent to which positive examples are critical for theregion.
Mauritius, Namibia, and Tunisia are the top-rankedAfrican countries for infrastructure, placing at 58th,54th, and 46th, respectively. These countries have builtgood transportation infrastructures by regional standards,particularly their roads and ports. They are joined in thetop half of the rankings by South Africa (63rd), Egypt(64th), and Gambia (69th). Yet even the ranks of thesebest regional performers remain middling, and the sheerunderdevelopment of infrastructure in most of the con-tinent is reflected by the much lower ranks of mostAfrican countries in this pillar.
The top three performers in the macroeconomicenvironment pillar include one oil-exporting country,Libya (ranked 7th), as well as two other North Africancountries, Morocco and Tunisia (ranked 31st and 38th,respectively). Six other countries are in the top half of the rankings (Namibia, South Africa, Cameroon,Algeria, Mauritius, and Mali). However, Table 3 showsthat most African countries receive a poor assessment,which is often related to the management of the gov-ernment finances. Although this is clearly a problemthat is not specific to Africa, even better fiscal and mon-etary management are needed in most countries, theimprovements achieved in the run-up to the globalfinancial crisis notwithstanding.
Health and primary education remains among thegreatest concerns for Africa, given that among the topthree regional performers—Algeria, Mauritius, andTunisia—only two of them, Tunisia and Mauritius, areranked in the top half of countries in this pillar. In fact,all but five countries are in the bottom third of the rank-ings, with many rounding out the very bottom group(indeed, all but one of the bottom-10 ranked countrieshail from Africa). Poor health indicators related in largepart to high rates of communicable diseases, low pri-mary education enrollment, and poor assessments ofmost national primary educational systems explain thispoor result. This is arguably the area requiring the mosturgent attention for improving Africa’s competitivenessin the aggregate.
In terms of higher education and training, althoughthe spread between the most and least successful coun-tries in this area is smaller than it is for some of the otherpillars, the overall performances are relatively weak. Thetop three ranked countries are Mauritius, South Africa,and Tunisia. However, of these three, only Tunisiaplaces in the top half of all countries, illustrating thequite low rankings for countries from the region overallin this pillar. It is perhaps not surprising that secondaryeducation and university enrollment rates and the assess-
ment of the quality of higher education remain weak inthe region, given that the primary educational base onwhich to build has not yet been put into place in mostcountries. This will be a critical area for attention ascountries move up the value chain toward more complexproduction.
The situation is somewhat more positive whenturning to the functioning of markets in Africa. The topthree countries in the goods market efficiency pillar—Mauritius, South Africa, and Tunisia—have goods markets that are similar to those of countries such asChile and Korea in their efficiency, although all remainbelow the average of OECD countries shown in Figure2. South Africa, in particular, is characterized by strongcompetition in the market, a taxation system that is notdistortive to business decisions, and an agricultural sec-tor that is not very costly to the economy (unlike inmany industrialized countries). Yet it is clear that mostcountries in Africa remain hobbled by regulations andother obstacles that diminish the efficiency with whichgoods and services are traded in their economies. Onlyfour other countries are in the top half of the rankingsin this pillar: Namibia, Botswana, Zambia, and Gambia.Eighteen African countries are in the bottom third ofthe rankings. Much can be done in the region to injectmore competition into markets and make starting abusiness in the region less difficult.
Labor markets constitute another area where a few countries stand out for their comparatively goodperformance while most lag behind, and where we seesome strong differences between North African andsub-Saharan African countries. Rwanda, Gambia, andUganda receive the highest assessments, ranked 9th,16th, and 27th, respectively, in this pillar. They arejoined at the top half of the rankings by six otherAfrican countries: Kenya, Malawi, Namibia, Mauritius,Botswana, and Madagascar. These countries, to varyingdegrees, can count on flexible hiring and firing practicesand relatively low non-wage labor costs. However,despite these relatively good performers, the table alsoshows that the labor markets in most African countriesare among the least flexible and least efficient in theworld, as also evidenced by high levels of unemploymentin middle-income countries such as South Africa,Tunisia, and Botswana, as well as very high “workingpoverty” levels in many of the poorest countries in theregion. Such labor market inefficiencies have beenamong the key factors setting off the political unrestthroughout North Africa in recent months. Much mustbe done on the continent to free Africa’s labor marketsand unleash the potential of the region’s workforce.
Financial markets provide a somewhat more positivepicture, although significant disparities in terms offinancial development remain. South Africa, ranked 1stin the region and an impressive 9th overall, has highlydeveloped financial markets on a par with Switzerlandand Canada, with relatively easy access to capital from
10
1.1:
Exp
orts
, FDI
, and
Com
petit
iven
ess
in A
fric
a
The Africa Competitiveness Report 2011 © 2011 World Economic Forum, the World Bank and the African Development Bank

various sources, sound banks, and a well-regulated securities market. Although their financial markets areless developed than that of South Africa, Namibia,Kenya, and Mauritius also are ranked in the top third inthis pillar, well ahead of most other countries in theregion. Six other countries have financial markets thatare placed in the top half of the rankings: Botswana,Zambia, Tunisia, Ghana, Malawi, and Rwanda. Yet,particularly given the turbulence seen in recent years inglobal financial markets, efforts to further develop anddeepen Africa’s financial markets, including additionalstrengthening of regulatory and supervisory frameworks,are necessary to ensure that financial resources in thesecountries are both available and allocated to their bestuse. It is notable that eight of the bottom-ten rankedcountries in this pillar are from Africa, including coun-tries from both North Africa and sub-Saharan Africa.
As Figure 2 shows, technological readiness is an area where African countries do overall quite poorly as a group and where they are well behind the OECDaverage. As shown in Table 3, the highest-ranked country in this area is Tunisia, at a relatively low 55th,and it is joined in the top half of the rankings only byMauritius (61st). In fact, 28 of the 35 African countriesare in the bottom third, and occupy eight of the bottomten places overall. This is a reflection of the very lowpenetration rates of most ICT tools on the continent,related in part to the low prioritization given by manygovernments to encouraging information communica-tion technologies (ICT) and other new technologyadoption, as well as to low educational attainment.Other bottlenecks, such as the vast gap in energy supplyand hence its relatively high cost, impede more wide-spread use of the Internet. Nevertheless, there are areaswhere Africa can be proud of its achievements—such as the innovative applications of m-banking (Kenya); m-agriculture (Niger, Senegal); and, in general, therapid adoption of the mobile technology. In fact, several African frontier markets (e.g., Ghana, Kenya,and Senegal) are ahead of major emerging marketeconomies such as India in the usage of mobile phones,demonstrating that in an enabling environment Africacan rapidly adopt modern technology.15 Moreover, inrecent years Africa has been the fastest-growing marketfor mobile phones in the world,16 albeit from a lowbase. Despite the recent significant uptake of sometechnologies, however, ICT overall is an area where, in many cases, countries in other regions are simplymoving faster. Given the significant potential of newtechnologies for information exchange and productivityenhancement, this is another clear area requiring urgentand sustained attention.
The size of markets also varies greatly amongAfrican countries. Table 3 highlights the three largestmarkets: those of South Africa, Egypt, and Nigeria.These three countries benefit from economies of scaleafforded by significant domestic and foreign (trade) markets. While many African countries clearly cannot
simply enlarge their domestic market size, they could do more to open their markets to trade and thus benefitfrom an enlarged foreign market size. There are manyoverlapping regional trade arrangements currently inplace on the continent, most of which have met withmixed success at best. Trade barriers remain endemic in the region despite the great benefits that could bereaped by greater regional integration. Africa’s exportperformance will be discussed in a later part of thischapter.
Turning to the most complex areas measured bythe GCI, business sophistication is not yet an area ofcritical concern for most African countries, since theycan still greatly enhance their productivity and competi-tiveness by improving on the more basic areas discussedabove. However, for the few African countries that arenearing the transition to the most advanced stage ofdevelopment, this area will become increasingly impor-tant. As luck would have it, the top three countries inthis pillar—Mauritius, South Africa, and Tunisia—areclassified in the efficiency-driven stage and therefore arenearing the stage when these more complex factors willbecome very important.
Finally, Kenya, Senegal, South Africa, and Tunisia are the top regional performers with respect to innova-tion, on a par with such innovative countries as Indiaand Italy. These countries have high-quality scientificresearch institutions, invest strongly in research anddevelopment, and are characterized by a significant levelof collaboration between business and universities inresearch. The low rankings of the other countries fromthe region should not be of significant concern at thisstage, given the importance of focusing on the morebasic areas for improvement first.
The overall picture is that strong area-specific performances are concentrated among a relatively smallgroup of African countries, although pockets of excel-lence exist in a number of others. This demonstrates that Africa is home to a number of countries that pro-vide strong best practice examples in various areas forthe other African countries struggling to improve theircompetitiveness.
The most problematic factors for doing business in AfricaThe results of the GCI thus provide a good sense of the many factors that are holding back Africa’s competi-tiveness. To complement this analysis, each year theWorld Economic Forum collects the perspective ofCEOs and top executives from around the world on themain bottlenecks to doing business in their countries.Specifically, they are asked to rank the most problematicfactors that they face in doing business in their countryout of 15 possible factors. Figures 3 and 4 show theaggregated results of these responses for North Africaand sub-Saharan Africa on average, respectively.
Figures 3 and 4 show that the top two factors forboth regions are the same, and in the same order: insuf-ficient access to financing and corruption. Although
11
1.1:
Exp
orts
, FDI
, and
Com
petit
iven
ess
in A
fric
a
The Africa Competitiveness Report 2011 © 2011 World Economic Forum, the World Bank and the African Development Bank

12
1.1:
Exp
orts
, FDI
, and
Com
petit
iven
ess
in A
fric
a
Figure 3: Most problematic factors for doing business in North Africa (percent of respondents)
Source: World Economic Forum Executive Opinion Survey, 2010.
0 3 6 9 12 15
Access to financing
Corruption
Inefficient government bureaucracy
Inadequately educated workforce
Inadequate supply of infrastructure
Tax regulations
Restrictive labor regulations
Tax rates
Inflation
Poor work ethic in national labor force
Foreign currency regulations
Policy instability
Crime and theft
Poor public health
Government instability/coups
Percent
Figure 4: Most problematic factors for doing business in sub-Saharan Africa (percent of respondents)
Source: World Economic Forum Executive Opinion Survey, 2010.
0 5 10 15 20
Access to financing
Corruption
Inadequate supply of infrastructure
Inefficient government bureaucracy
Tax regulations
Tax rates
Inadequately educated workforce
Poor work ethic in national labor force
Inflation
Policy instability
Foreign currency regulations
Crime and theft
Restrictive labor regulations
Government instability/coups
Poor public health
Percent
The Africa Competitiveness Report 2011 © 2011 World Economic Forum, the World Bank and the African Development Bank

these receive a relatively even weight in North Africa,in sub-Saharan Africa the lack of financing is the measurably more onerous impediment. Both regionsalso highlight inefficient government bureaucracy aswell as an inadequate supply of infrastructure as majorchallenges.
It is interesting to note that, while business leadersin both regions also point to an inadequately educatedworkforce as a serious obstacle to doing business, poorpublic health is placed far down the list in both cases.This is curious given the major health challenges inmany African countries, particularly in sub-SaharanAfrica, and seems to indicate that business leaders inAfrican countries do not consider that it significantlyaffects their ability to do business, at least not in comparison with other possible impediments. Onceagain, vast differences exist across countries. For example, according to the 2007 UNDP’s SwazilandHuman Development Report: HIV and AIDS and Culture, the widespread prevalence of HIV/AIDS inSwaziland—which, at about 26 percent of the 15–49age group is the highest in the world—threatens notonly competitiveness, but the very existence of thenation.17
However, despite this mystery about the healthissues, the results of the Survey support the generalfindings discussed in the section above, reinforcing what has been known for some time. African countriesmust continue to develop their public institutions andfinancial markets, build up their infrastructure, andupgrade their educational systems. Indeed, given itsimportance, Chapter 2.1 of this Report, contributed by the African Development Bank, explores how toimprove the higher educational system in Africa.
Africa’s export composition and challengesThe major cross-cutting policy areas that constrainAfrica’s export competitiveness discussed above includethose that increase indirect costs—trade logistics andinfrastructure—and those that relate to a poor businessenvironment, such as the availability of skills and theability to absorb technology. These are also the areas inwhich sub-Saharan Africa in particular scores relativelypoorly in comparison with other regions according tothe Global Competitiveness Index. To achieve industri-alization, export competitiveness, and subsequently sus-tained and more broad-based growth, the subcontinentneeds to put special emphasis on making progress inthese areas. Factors viewed as necessary for diversifyingproduction and exports through export of services aresimilar: (1) human capital; (2) infrastructure, especiallypertaining to telecommunications; and (3) adequateinstitutions, in particular in the area of regulations andcontract enforcement.18
Given the daunting list of constraints that depressAfrican productivity and export growth, African gov-ernments will need to (1) prioritize and sequencereforms and investments in the business environmentand infrastructure in order to unleash the potential for growth in their industries, and (2) bring togetherpolicies to promote competitiveness within a coherentstrategy rather than as a series of ad hoc interventions.Experience shows that, in isolation, these interventionstend to be ineffective.
There is new hope for Africa, grounded in improvedmacroeconomic frameworks and policies, the rise of anAfrican middle class, and the opportunity presented bytighter links with fast-growing emerging markets. In thelong term, as wages rise in these countries, Africa’scomparative advantage could shift toward manufactures
13
1.1:
Exp
orts
, FDI
, and
Com
petit
iven
ess
in A
fric
a
Table 4: The evolution of key sectors and sub-Saharan Africa's performance: World market shares, by industry andregion (1995–97 and 2006–08)
Light Heavy Agriculturalmanufacturing manufacturing commodities Agribusiness Mining
1995–97 2006–08 1995–97 2006–08 1995–97 2006–08 1995–97 2006–08 1995–97 2006–08
East Asia and Pacific 14.9 25.1 5.3 13.8 10.2 9.6 10.0 12.2 6.1 7.6
Europe and Central Asia 3.3 5.6 1.5 3.3 11.9 12.0 3.5 5.3 9.8 13.0
Latin and Central America 3.6 3.4 3.4 4.0 12.9 10.8 10.9 12.6 8.1 8.2
Middle East and North Africa 0.7 0.9 0.2 0.3 3.0 6.7 1.3 1.8 4.2 5.1
NON-OECD 12.3 7.3 10.8 11.3 1.7 9.9 5.6 3.5 15.4 19.1
OECD 61.6 53.2 78.1 66.3 52.4 45.6 65.5 60.8 52.1 41.3
South Asia 2.7 3.6 0.3 0.6 2.5 2.7 1.7 2.2 1.0 1.9
Sub-Saharan Africa 0.9 0.9 0.3 0.4 5.4 2.7 1.5 1.7 3.4 3.8
Total 100.0 100.0 100.0 100.0 100.0 100.0 100.0 100.0 100.0 100.0
Source: UN Comtrade database, World Bank calculations.
The Africa Competitiveness Report 2011 © 2011 World Economic Forum, the World Bank and the African Development Bank

14
1.1:
Exp
orts
, FDI
, and
Com
petit
iven
ess
in A
fric
a
t
0
20
40
60
80
19951980 2008
0
20
40
60
80
19951980 2008
5b: Sub-Saharan Africa
Source: UN Comtrade database, World Bank calculations.
Figure 5: Composition of world export of light manufacturing, heavy manufacturing, and mining, 1980–2008
5a: East Asia Pacific
MiningLight manufacturingHeavy manufacturing
Wor
ld e
xpor
t sha
reW
orld
exp
ort s
hare
The Africa Competitiveness Report 2011 © 2011 World Economic Forum, the World Bank and the African Development Bank
and new export growth opportunities may open up.This new opportunity is important given how littleprogress has been made to date: sub-Saharan Africa’sinternational competitiveness in individual industries,especially in manufacturing and agro-processing, hasseen little improvement over the last two decades. Itsexports remained undiversified and their growth wasoverwhelmingly accounted for by natural resources.Sub-Saharan Africa’s world market share in processingindustries is not only low but has remained virtuallyunchanged. The region exports just 0.9 and 0.3 percentof world light and heavy manufacturing exports, respec-tively, while developing countries in the aggregate sawtheir share of world exports increase dramatically, from19 percent in 1995 to 33 percent in 2008 (Table 4).19
Of the US$140 billion growth in sub-SaharanAfrican exports between 1995 and 2008, 73 percentwere mining-related commodities. By comparison, theexport growth that spurred the Asian economies hasincreasingly relied on an expanding list of manufactures.By the 2000s, East Asia Pacific was already going throughits second wave of export diversification, moving fromrelying mainly on light manufacturing into higher-value-added heavy manufactures. In 2006–08, about 80percent of East Asian exports came from manufacturingindustries (Figure 5).20
The evolution of key industries and Africa’s performanceConstraints that depress countries’ productivity and ability to compete in the global markets tend to havevarying degrees of relevance for different industries.Hence prioritizing reforms depends on the specificindustries in which countries compete. Manufactures and agribusiness represent about 70 percent of worldexport in goods and provide many opportunities forlearning, absorbing technology, and job creation.Therefore we focus our analysis on these industries—light manufacturing, agricultural commodities, agribusi-ness, and heavy manufacturing—in the next sections.Exports of mining products are discussed in Box 2. The recent experience in trade diversification in EastAfrica is discussed in Box 3.
Light manufacturingIn value terms, exports of light manufacturing from sub-Saharan Africa grew at a fair pace between 1995–97and 2006–08, slightly more than doubling to US$19.8billion. However, sub-Saharan Africa’s overall share oflight manufacturing world exports has remained low,even declining from 1.2 percent in 1980 to less than 0.9 percent in 2008. Top exporters in sub-Saharan Africa are South Africa, Botswana, Namibia, Mauritius,and Kenya, which together accounted for close to 75percent of exports of light manufactures in 2008. Thesewere followed by emerging manufacturers such as
15
1.1:
Exp
orts
, FDI
, and
Com
petit
iven
ess
in A
fric
a
Box 2: Mining in sub-Saharan Africa
The mining sector is where sub-Saharan Africa captures the highest share of world exports. Its exports of miningcommodities, primarily oil and metals, grew from US$9 billionin 1995–97 to about US$130 billion in 2006–08, rising from 3.4percent of world exports to 3.8 percent. This increase is inpart attributable to rising prices of major commodities suchas crude petroleum and copper, where volumes doubled andprices have increased more than five- and threefold, respec-tively, since early 1999. While oil and metals comprised equalshares of African exports in 1995, fuel exports made upthree-quarters of all mining exports from the region by 2008.
Studies reveal both the benefits and problems associ -ated with resource extraction. Alexeev and Conrad find that,in the long run, resource-rich countries have significantlyhigher levels of income than others.1 However, Collier andGoderis show that, while commodity exports initially increaseoutput, they cannot sustain growth.2 They suggest that, after two decades, output for the typical African commodityexporter may be around 25 percent lower than it would havebeen without the resource boom.
Although these findings have important policy implica-tions in terms of the potential effects of the “Dutch Disease,”geology does not have to be destiny. Countries such as Chile and Botswana—which have been among the fastest-growing economies of the world in the past two decades—have relied almost entirely on mining exports to spur theirgrowth. Others, such as Malaysia and Indonesia, were able to derive a significant share of their export revenuesfrom mining, while at the same time growing competitivemanufacturing industries. Sub-Saharan African countriesrich in mining and commodities could offset the effects of the “resource curse” by using the revenues for investmentinstead of consumption, thus moderating the increase indemand for consumer goods and services that could other-wise fuel a Dutch Disease. With strategic investments, suchas those in trade infrastructure along main trade corridors,mining revenues could help improve the overall competitive-ness of these economies and support growth and job creation.
Notes
1 Alexeev and Conrad 2009.
2 Collier and Goderis 2007, 2008.
The Africa Competitiveness Report 2011 © 2011 World Economic Forum, the World Bank and the African Development Bank

16
1.1:
Exp
orts
, FDI
, and
Com
petit
iven
ess
in A
fric
a
Background: East Africa’s resilience during the crisisAt an annual growth rate of about 7 percent, the East AfricanCommunity (EAC)—consisting of Burundi, Kenya, Rwanda,Tanzania, and Uganda—was among the fastest-growing groupsworldwide during 2005–08. In 2009, its median growth rate of 4.7 percent continued to place the EAC among the fastest-growing subregions. This box highlights the factors behind thisresilience, with a focus on trade and especially export diversifi-cation. Besides building resilience to shocks such as the globaleconomic crisis, export diversification is a key for the long-termdevelopment of African countries because it reflects and rein-forces the shift in production from low- to higher-value-addedgoods. Moreover, recent research found that, in Africa, policiesthat enhance export diversification accelerate countries’growth by raising total factor productivity.1
Because of its limited integration into global financial mar-kets, East Africa was mostly shielded from the direct impact ofthe crisis through the financial channel. The trade transmissionchannel was not particularly harmful because of the region’sweaker trade ties with Europe and its greater regional ties.Similarly, FDI inflows into EAC countries increased marginally in2009, while they declined substantially in many other developingregions.
Several other factors have contributed to the EAC’s strongperformance, including the accumulation of policy buffers priorto the crisis, effective countercyclical responses during the crisis, and timely financial assistance from multilateral organi-zations. A greater export diversification in the EAC than in other African subregions, both in terms of products and trading
partners, helped East Africa weather the severe external shockthat the crisis presented. More broadly, export diversificationboosts countries’ export competitiveness by reducing theirpolitical and economic risks. This was shown also by the per-formance of many developing countries, including in NorthAfrica, which saw marked drops in exports and outputs duringthe crisis as a result of their dependence on a few commoditiesand/or on markets in advanced economies.
The role of trade diversificationIn terms of the product diversification of exports from Kenya,Uganda, and Tanzania, in 2009 the top three products accountedfor less than 40 percent of total exports. Such shares are wellbelow levels observed in resource-rich countries such asNigeria and Botswana (where they account for 80 and 90 percent, respectively) or other frontier markets (e.g., countriesthat have recently accessed or are just about to access inter-national capital markets) such as Ghana (where they accountfor about 70 percent). These differences in product market con-centration are reflected in Figure 1. Necessities, especiallybasic food, accounted for the majority of the region’s exports—both total exports and exports to the rest of Africa, making theregion less vulnerable to the global slump because of its lowerincome elasticity of demand. Most of the manufacturing goods,which were more vulnerable to declining demand during thecrisis than foodstuffs, are exported to the rest of East Africa.While currently a large share of the regional trade is in agricul-tural products, over the medium term, regional strategies need to develop complementarity in more sophisticated and
Box 3: Trade diversification in East Africa during the global recession
0.0
0.2
0.4
0.6
0.8
1.0
BotswanaZambiaGhanaSenegalNamibiaTanzaniaUganda NIgeriaKenya
Figure 1: Concentration index, 2008
Source: Authors’ calculations, based on the UNCTADstat Foreign Merchandise database, http://unctadstat.unctad.org/TableViewer/tableView.aspx?ReportId=120.
Note: Herfindahl-Hirschmann Index, ranging from 0 to 1 (maximum concentration).
n East African Selected emerging and other frontier markets
Conc
entr
atio
n in
dex
of e
xpor
ts
The Africa Competitiveness Report 2011 © 2011 World Economic Forum, the World Bank and the African Development Bank
17
1.1:
Exp
orts
, FDI
, and
Com
petit
iven
ess
in A
fric
a
higher-value-added products to raise East African countries’capacity to trade.
East Africa is also characterized by greater regional integration and reliance on intra-regional and intra-Africantrade than other regional economic blocs. Vast differences existeven among the five EAC countries, with the highest share ofintra-regional trade recorded by Kenya (above 20 percent) and the lowest by Rwanda (about 2 percent) during 2005–08.Nevertheless, in the run-up to the crisis, about 20 percent ofEast African exports were within EAC countries, a share notablyabove those in other regions. The continued healthy growthrates in the subregion protected the individual countries fromthe major drop in demand that proved so damaging to devel-oped and emerging economies elsewhere. The crisis has onlyreinforced the East African countries’ drive to integrate; thecommon market introduced in 2010 is also likely to boost tradefurther.
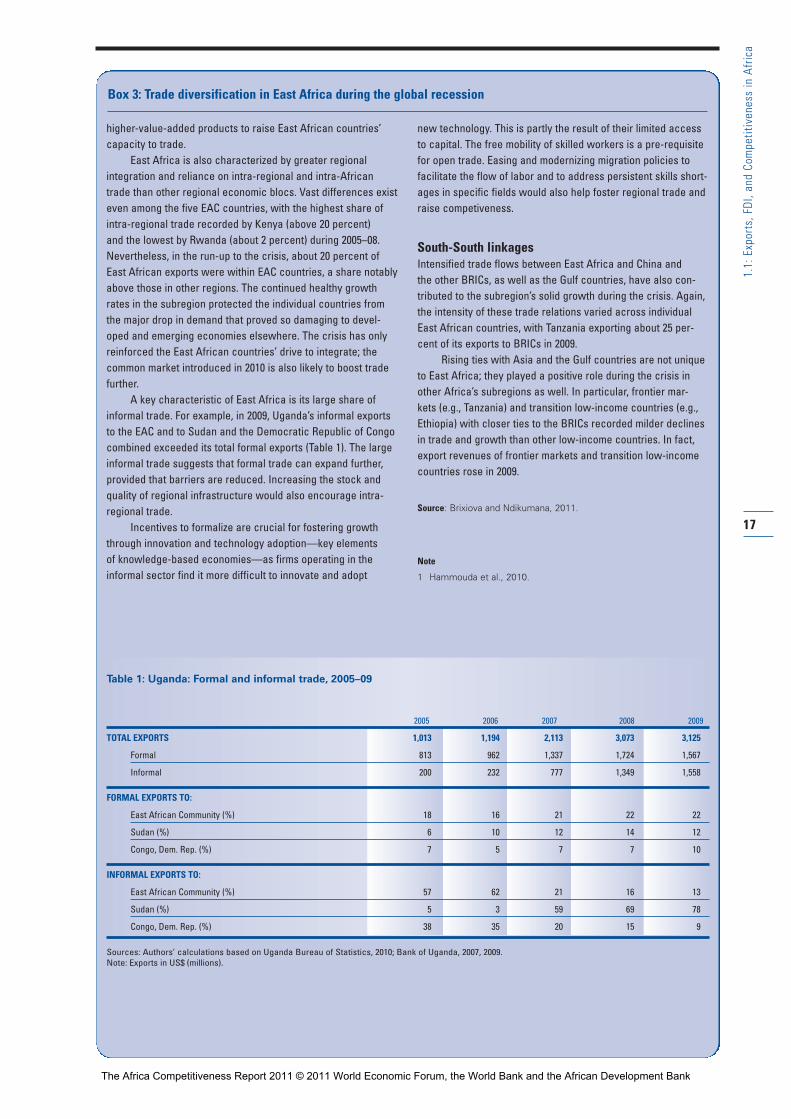
A key characteristic of East Africa is its large share ofinformal trade. For example, in 2009, Uganda’s informal exportsto the EAC and to Sudan and the Democratic Republic of Congocombined exceeded its total formal exports (Table 1). The largeinformal trade suggests that formal trade can expand further,provided that barriers are reduced. Increasing the stock andquality of regional infrastructure would also encourage intra-regional trade.
Incentives to formalize are crucial for fostering growththrough innovation and technology adoption—key elements of knowledge-based economies—as firms operating in theinformal sector find it more difficult to innovate and adopt
new technology. This is partly the result of their limited accessto capital. The free mobility of skilled workers is a pre-requisitefor open trade. Easing and modernizing migration policies tofacilitate the flow of labor and to address persistent skills short-ages in specific fields would also help foster regional trade andraise competiveness.
South-South linkagesIntensified trade flows between East Africa and China and the other BRICs, as well as the Gulf countries, have also con-tributed to the subregion’s solid growth during the crisis. Again,the intensity of these trade relations varied across individualEast African countries, with Tanzania exporting about 25 per-cent of its exports to BRICs in 2009.
Rising ties with Asia and the Gulf countries are not uniqueto East Africa; they played a positive role during the crisis inother Africa’s subregions as well. In particular, frontier mar-kets (e.g., Tanzania) and transition low-income countries (e.g.,Ethiopia) with closer ties to the BRICs recorded milder declinesin trade and growth than other low-income countries. In fact,export revenues of frontier markets and transition low-incomecountries rose in 2009.
Source: Brixiova and Ndikumana, 2011.
Note
1 Hammouda et al., 2010.
Box 3: Trade diversification in East Africa during the global recession
Table 1: Uganda: Formal and informal trade, 2005–09
2005 2006 2007 2008 2009
TOTAL EXPORTS 1,013 1,194 2,113 3,073 3,125
Formal 813 962 1,337 1,724 1,567
Informal 200 232 777 1,349 1,558
FORMAL EXPORTS TO:
East African Community (%) 18 16 21 22 22
Sudan (%) 6 10 12 14 12
Congo, Dem. Rep. (%) 7 5 7 7 10
INFORMAL EXPORTS TO:
East African Community (%) 57 62 21 16 13
Sudan (%) 5 3 59 69 78
Congo, Dem. Rep. (%) 38 35 20 15 9
Sources: Authors’ calculations based on Uganda Bureau of Statistics, 2010; Bank of Uganda, 2007, 2009.Note: Exports in US$ (millions).
The Africa Competitiveness Report 2011 © 2011 World Economic Forum, the World Bank and the African Development Bank

Nigeria, Madagascar, and Lesotho, whose increasedexports of leather and apparel lead their success in this sector.21
The most significant boost to sub-Saharan Africalight manufacturing was perhaps the preferential treatments that were granted by the United States and the European Union under the Africa Growth andOpportunities Act (AGOA), the Everything but Arms(EBA) initiative, the Cotonou Agreement, and theLome Convention. These initiatives granted virtuallyduty- and quota-free access to nearly all countries inAfrica. For example, trade preferences under AGOAprovided sub-Saharan African countries with a priceadvantage of 10 to 20 percent relative to exporters incountries for which tariffs were levied. It is partiallythanks to AGOA that sub-Saharan Africa’s exports ofclothing grew threefold since 1995 to US$2.5 billion,on average, between 2006 and 2008, making up morethan 12 percent of all light manufacturing exports fromthe region. By 2008, for example, apparel made up the largest share of Madagascar’s exports, outgrowing its exports from rich mining resources and employing107,530 people. The recent decimation of Madagascar’sapparel production with the removal of AGOA eligibil-ity underlines the importance that such preferences have had on the competitiveness of African garmentproducers that were able to break into the export markets. The apparel industry across the subcontinentwas, for the most part, dominated by foreign investorsoriginating in Asia and occasionally in Europe and theUnited States, who aimed to exploit the advantagesconveyed by a combination of trade preferences andcheap labor.
While these preferential trade arrangements supported light manufacturing in select cases, on thewhole, sub-Saharan African exporters were unable tomatch the drop in prices by East Asian competitors,especially after the elimination of quotas in 2004. Theunit value of Chinese apparel exports was 28 percentlower in 2008 than in 2004, for example. By 2008,Vietnam alone exported more light manufacturingproducts than all sub-Saharan African countries combined.
Today, East Asia Pacific is the biggest exporter of light manufactures in the developing world, pro -ducing more than 25 percent of world exports in these industries. It has been the leader in this sectorsince 1995, and its share of world exports grew from 15 percent in 1995–97 to 25 percent in 2006–08.
East Asia Pacific’s success is driven not only by the high productivity of its workers and firms, but also by the enabling business environment that supportsseamless transport networks and reliable supplies ofinputs and energy. A number of studies on sub-SaharanAfrica’s business environments, including the previousedition of this Report, emphasized the importance ofhigh indirect costs in depressing the productivity of
African firms relative to other countries.22 Indeed, whilefactory-floor productivity is relatively low in manyAfrican countries, it is not so low—relative to wages—as to explain the continent’s weak manufacturing competitiveness.
Assessments on global manufacturing competitive-ness show that basic requirements of an enabling invest-ment climate—namely, the cost of labor and materials;energy cost; trade, finance, and tax systems; and thequality of physical infrastructure—are critical in deter-mining a country’s competitiveness in the global exportmarkets for simple manufacturers. A forthcoming studyon sub-Saharan African light manufacturing competi-tiveness suggests that many of the root causes of theproductivity and cost issues in African light manufactur-ing can be traced to policy problems relating to poortrade logistics and infrastructure, as well as to a lack ofcompetition and input industries.
Recent studies have showed that high indirect costs(infrastructure, logistics, and transport), combined withbusiness environment–related losses depress productivityin sub-Saharan Africa.23 Trade infrastructure and logis-tics become especially relevant for light manufacturingindustries because of the low margins and seasonalitythat characterize this industry. It is therefore telling thatthe countries that rank the highest in terms of infra-structure in the GCI are also the top exporters of lightmanufactures in sub-Saharan Africa. On the whole,Southeast Asian countries, whose market share of lightmanufacturing exports are exponentially higher thanthose in sub-Saharan Africa, score 24 percent higher in terms of the competitiveness of their economy inbasic requirement as measured by the GCI.
Agricultural commoditiesSub-Saharan Africa has been losing market share inglobal agriculture exports in terms of unprocessed commodities. Its share of world exports in agriculturalcommodities was slashed in half, from 5.4 percent in1995–97 to 2.7 percent in 2006–08. The decline wasmainly the result of lagging agricultural productivity in the region. Its number one export product, cocoa,accounted for more than 30 percent of the continent’sexports; cocoa was followed by coffee, tea, and tobacco.Top exporters of agricultural commodities were Côted’Ivoire, Ghana, Kenya, South Africa, Ethiopia, andNigeria, all of which (except Nigeria) lost market sharedespite increasing their exports in absolute terms.
Given its endowments of land, climate, and labor,sub-Saharan Africa should have a strong comparativeadvantage in agriculture. On the face of it, the sub -continent has the resources to both feed its growingpopulation and meet the world’s burgeoning demandfor food and other agricultural products. In sub-SaharanAfrica, demand for food is expected to reach US$100billion by 2015, double the levels in 2000. There areencouraging success stories, such as the production of
18
1.1:
Exp
orts
, FDI
, and
Com
petit
iven
ess
in A
fric
a
The Africa Competitiveness Report 2011 © 2011 World Economic Forum, the World Bank and the African Development Bank
cassava chips in Ghana, organic coffee in Tanzania, cutflowers in Kenya, and aquaculture in Malawi. However,these remain few and far between, and they have notbeen sufficient to improve the subcontinent’s overallexport performance in terms of both agribusiness and agricultural commodities. Although Africa has thehighest rate of people living in rural areas in the world,the continent still imports 45 percent of its rice and 85percent of its wheat.
AgribusinessAgribusiness accounts for a large and rising share ofgross domestic product (GDP) in developing countries.Though the share of agriculture typically decreases asper capita income increases, the share of agribusinesstends to increase, reaching 30 percent of GDP in someinstances.
There is immense potential to scale-up agribusinessin sub-Saharan Africa, as demonstrated by emerging successes in Kenya, Tanzania, and Ghana. However,this potential remains largely untapped. Sub-SaharanAfrica’s share of world exports in agribusiness is thelowest of all developing regions, followed closely by theMiddle East and North Africa. Its share, however, hasseen a modest rise—from 1.5 to 1.7 percent between1995–97 and 2006–08. The region’s exports grew at afair rate, more than doubling since 1995–97, which isslightly above world averages.
The top sub-Saharan African exporters of agri -business include South Africa, Kenya, Côte d’Ivoire,Namibia, Zimbabwe, Nigeria, Mauritius, Tanzania, andSenegal. Among these, the fastest growth was experi-enced by Nigeria and Senegal, which increased theirexports exponentially twenty- and sevenfold, respective-ly, although from a very low base. Fruits and vegetablesare the major agribusiness exports of the subcontinent,closely followed by fish and fish preparations, togetheraccounting for about 50 percent of sub-Saharan Africa’sagribusiness exports.
Africa’s poor performance in export markets foragribusiness is in part explained by its slow productivitygrowth. Value-chain studies focusing on sub-SaharanAfrica show that, while agricultural productivity improvedin parts of the region, it lagged behind vis-à-vis otherregions. Although farm-level unit production costs inAfrica are comparable with those found in Brazil andThailand, these farms suffer from low levels of produc-tivity, which in turn make agriculture economicallyimpoverishing and technically unsustainable. The inter-national and domestic logistics costs that provide naturalprotection for local producers pose a significant barrierto their competitiveness when it comes to exporting.For example, Mozambican cassava producers that arecompetitive in domestic markets would need to cuttheir logistics and production costs by more than 80percent to become competitive in European markets.Overall, the studies identified a lack of political com-
mitment, prejudice against small-holder agriculture,high transaction costs that are driven by weak physicalinfrastructure, widespread information asymmetries, low levels of marketed surplus, and high export taxes as the main constraints to agricultural productivity in sub-Saharan Africa.
The agricultural commercialization experiencesfrom these regions offer some interesting lessons for the future of agriculture in Africa. For example, studiesfrom Brazil and Thailand show that competitiveness inthese originally “backward” areas was reached in twostages, first in lower-value commodities and later inhigher-value and processed agricultural goods. Otherfactors contributing to their success included improvedagricultural technology developed by government supported agencies such as Empresa Brasileira dePesquisa Agropequária (Brazilian Agricultural ResearchCorporation, or EMBRAPA), permissive land policies,improved public infrastructure and business develop-ment services, a supportive policy environment, andliberalized markets that allowed international signals totransmit. As a result of these policies, Brazil andThailand became the leading global suppliers of soy-beans and cassava, among other agricultural exports.
Heavy manufacturingAt an aggregate level, the trends in exports of heavymanufactures in sub-Saharan Africa are similar to thoseof light manufacturing. Africa’s exports are tiny and captured only 0.4 percent of world markets, a slightincrease from 1995–97, when it produced 0.3 percent of world exports. Unlike light manufacturing, however,sources of origin for heavy manufacturing are less diversified. The overwhelming majority of exports, more than 75 percent, come from South Africa.Nigeria, Côte D’Ivoire, Swaziland, and Kenya are othermajor exporters of heavy manufactures.24
Despite beginning from a low base, heavy manu-facturing performed better in terms of export growthrates than both agribusiness and light manufacturingindustries in sub-Saharan Africa. Most of the growthcame from South Africa, Nigeria, Côte d’Ivoire, andKenya. In 2008, Nigeria primarily exported transportequipment, Côte d’Ivoire cleansing products, andKenya chemical elements and compounds. These werethe top exports for these countries also in 1995, exceptfor Kenya, which primarily exported iron and steel dur-ing this time.
Unlike light manufacturing, heavy manufacturingexports of developing regions are dominated by a hand-ful of emerging economies from each region such asChina, Mexico, Malaysia, Brazil, Turkey, and SouthAfrica. According to the 2010 Global ManufacturingCompetitiveness Index,25 the availability of skilled laborand capacity for innovation, the cost of labor and mate-rials, and energy cost and policies are the three maindrivers of manufacturing competitiveness reported by
19
1.1:
Exp
orts
, FDI
, and
Com
petit
iven
ess
in A
fric
a
The Africa Competitiveness Report 2011 © 2011 World Economic Forum, the World Bank and the African Development Bank
the 500 senior leaders of manufacturing industries from around the world. Presumably in the case of heavymanufacturing, it is more pertinent for a country to beable to offer its investors a sound basis for advancedengineering and capacity for technology adoption andinnovation than it is for the country to be able to gobeyond the economic competitiveness at the level of the traditional factor costs, which remain critical for the competitiveness of light manufacturing industries.
In most low- and lower-middle-income countries,financial and physical infrastructures, as well as therequired advanced skills, are simply absent or inadequatefor heavy manufacturing to flourish. The 2010 GlobalManufacturing Competitiveness Index ranks talent-driveninnovation—which emanates from improved highereducation—as the leading driver of manufacturing com-petitiveness. Correspondingly, as we have seen earlier,the GCI indicates that sub-Saharan Africa ranks espe-cially poorly in terms of its systems of higher educationand its ability to adopt technology. Those sub-SaharanAfrican countries—such as South Africa and Kenya—that achieved improvements in these areas, as well asprogress in what is defined by the GCI as the basicrequirements of an economy (institutions, infrastructure,macroeconomic environment, and health and basic education), are among those whose exports of heavymanufactures grew the fastest since 1995–97.
FDI, growth, and productivity in AfricaAs seen earlier, African countries rank particularly low on innovation and technology adoption. Because of their generally low savings rates (especially amongsub-Saharan African oil importers), underdevelopeddomestic financial sectors, and often inadequate accessto borrowing on international capital markets, theirinvestment is constrained by available resources or theirability to attract FDI. In this concluding section we (1) discuss trends in FDI inflows to Africa, includingduring the crisis years of 2009 and 2010; (2) examinethe impact of FDI on growth, through both investmentin physical capital (factor accumulation) and total factorproductivity (TFP) channels;26 and (3) look ahead anddiscuss how, in the future, African countries can attractgrowth-enhancing FDI, especially FDI that raises innovation and hence TFP.
In addition to providing capital, FDI can stimulategrowth by helping improve the TFP of African coun-tries by advancing their technological capacities. Besidesthe transfer of managerial skills, technological spilloversfrom FDI can occur through the transfer of moreadvanced technologies and the demonstration of theirapplications, as well as through technical assistance todomestic suppliers and customers. In turn, the centralrole of FDI has been recognized by African policy -makers: without transfer of technological capabilities and resulting home-grown innovation, the productivity
gap between African countries and more advancedeconomies will not be reduced and could even widenfurther.
FDI trends in AfricaOne of the key differences between advanced economieson one hand and developing and emerging marketeconomies on the other lies in the amount of physical(and human) capital these groups of countries possessand the level of technology they utilize. With relativelylow savings rates, volatile export revenues, and substan-tial investment requirements, most African countriesneed to rely on capital inflows, in particular FDI, tofinance their development needs and reduce these gaps.Accordingly, over the years many African countries de -regulated and (at least partially) liberalized their capitalaccounts, with a view to attracting FDI.27
During 2001–09, developed economies continuedto account for most of the world FDI flows: they werethe main source of outward FDI and received about 60percent of total inflows during this period. Nevertheless,the long-term geographical pattern of the FDI flows has been changing, with more FDI going to developingcountries, including countries in Africa (Figure 6). Infact, in 2009, developing and transition countriesreceived almost half of the world’s FDI. Preliminary estimates indicate that in 2010—for the first time—developing and transition countries received more than50 percent of world FDI inflows.28
Although the reasons for the increase in privatecapital flows to low-income countries varied, on the“domestic economic fundamentals/pull side” theyincluded privatization and deregulation; improvementsin general investment environment, including trade liberalization and cutting costs of doing business; andbroader considerations such as political and macro -economic stability. On the “external/push side,” privatecapital flows to low-income countries were closely relatedto the business cycle upswing and the heightened riskappetite of foreign investors.29
African countries also experienced a surge in capitalflows; they received about 8 percent of total capitalflows and 10 percent of FDI going to developing coun-tries during 2001–09.30 Indeed, after years of relativelyslow growth, net capital inflows to Africa accelerated inthe 2000s and surged between 2004 and 2007. Peakingat almost US$76 billion in 2007, the net capital inflowsamounted to about 5 percent of Africa’s GDP at thattime. This share was close to those of both the MiddleEast and Latin America (about 6 percent of GDP), but notably below capital flows received by Central and Eastern Europe and the Commonwealth ofIndependent States countries (15–16 percent of GDP).At the same time, since FDI accounted for the majorityof their private capital inflows, African countries weremostly shielded from the sudden halt in capital flows
20
1.1:
Exp
orts
, FDI
, and
Com
petit
iven
ess
in A
fric
a
The Africa Competitiveness Report 2011 © 2011 World Economic Forum, the World Bank and the African Development Bank

21
1.1:
Exp
orts
, FDI
, and
Com
petit
iven
ess
in A
fric
a
Figure 6: FDI inflows into Africa, Asia, and Latin America, 1996–2009 (US$, millions)
Source: UNCTAD FDI Statistics database.
0
50,000
100,000
150,000
200,000
250,000
300,000
350,000
400,000
2008200720062005200420032002200120001999199919971996 2009
FDI i
nflo
ws
(US$
mill
ions
)
Figure 7: FDI to Nigeria, Egypt, and South Africa, 2000–09 (US$, millions)
Source: UNCTAD FDI Statistics database.
–3,000
0
3,000
6,000
9,000
12,000
15,000
2000 20082007200620052004200320022001 2009
n Nigerian Egyptn South Africa
AfricaLatin AmericaAsia
FDI i
nflo
ws
(US$
mill
ions
)
The Africa Competitiveness Report 2011 © 2011 World Economic Forum, the World Bank and the African Development Bank

that af fected other regions during the recent global economic crisis.
FDI has been distributed unevenly even withinAfrica, with the top five recipient countries receivingthe bulk of FDI inflows to Africa prior to the crisis,between 2001 and 2008. Still, results vary according toperspective. In absolute terms, three largest countries—Egypt, Nigeria, and South Africa—received similar,large amounts of FDI, but in per capita terms Nigeriawas notably below Egypt and South Africa and close to the African average prior to the crisis (Figure 7).Resource-rich countries and the minerals sectors attracted a large share of these flows, but more recentlyinvestors have discovered countries other than Nigeriaand South Africa, their long-standing investment destinations. Since the mid 2000s, “frontier market”low-income countries, such as Ghana, Uganda, andZambia, have gained increased attention of foreigninvestors.31 Beyond mining, the services sector—especially telecommunications and banking—has been receiving a disproportionate share of FDI inAfrica, contributing to diversification of production and stimulating the export of services and other sectors.
Among various subregions, Southern Africa receivedthe largest share of total FDI (36 percent) going toAfrica in 2009.32 Countries in North and West Africaalso fared well and received about 30 and 20 percent ofAfrica’s FDI inflows in 2009, respectively.33 In WestAfrica, oil exporters (e.g., Nigeria and Guinea) andemerging and frontier markets (e.g., Cape Verde, Côted’Ivoire, Ghana, and Senegal) attracted the lion’s shareof this subregion’s FDI, with Nigeria predominating.Given that West Africa (and particularly some of theabove-mentioned countries) experienced the highestreal GDP growth among Africa’s subregions during2001–08, the impact of FDI on growth and produc -tivity in these countries is examined below.
FDI resilience during the global financial crisisBefore the crisis, FDI flows to Africa and other devel -oping regions were less volatile than portfolio flows(Figure 8), since FDI decisions are mostly based onlonger-term factors and less affected by short-termshocks. While the motivating factors of FDI are com-plex and vary across sectors and firms, the driving forcestypically include political stability, prudent macroeco-nomic policies, trade openness, liberal investment poli-cies, high-quality institutions (including the financialsector), the stock of human and physical capital, andnatural resources.
Overall FDI to Africa remained resilient during theglobal financial crisis in 2009, both relative to otherfinancial flows to Africa and relative to FDI flows toother world regions (Figure 9). Despite the decline ofabout 20 percent, in 2009 FDI flows to Africa were lessvolatile than other financial flows that year. Moreover,Africa’s share of global FDI inflows rose from 3 percentin 2007 to 5.1 percent in 2009.34 This relative resilienceis partly the result of policies that African countriesintroduced in the 1990s and 2000s. In addition to liber-alizing investment regimes, a number of countries shiftedfrom targeting FDI for specific sectors to establishing abroad enabling investment climate. Besides incentives to foreign investors, the increased interest in attractingFDI has been evidenced by the formation of the NewPartnership for Africa’s Development (NEPAD) in2001.
Throughout the world, the primary sectors (e.g.,agriculture, mining) and services such as telecommuni-cations, transport, and consumer services (e.g., healthservices) were less sensitive to the business cycle andthus less affected by the crisis than manufacturing. Thelow share of FDI in manufacturing has made Africamore immune to a decline in overall FDI flows thanother world regions, where manufacturing plays aprominent role (e.g., emerging Europe). Accordingly, anumber of oil exporters such as Egypt, Nigeria, Angola,and Sudan received the highest absolute FDI inflows(above US$3 billion) in 2009, while Ghana’s FDIincreased markedly since 2007, reflecting developmentsof the emerging oil sector. Cross-border mergers andacquisitions in Africa reflected these sector trends, withM&A sales rising in mining and transport in 2009, butmarkedly declining in manufacturing.35
Moreover, vast differences emerged among Africa’ssubgroups. When dividing the continent into analyticalsubgroups such as emerging markets, frontier markets,and so on, two observations stand out. First, FDI tofrontier markets actually increased between 2008 and2009, driven by continued high growth and stronggrowth prospects as well as depreciating exchange rates that made some of the factors of production (e.g.,labor) cheaper (Table 5). Second, FDI to pre-transitioncountries that are yet to develop robust institutions andfinancial sectors markedly declined, underscoring the
22
1.1:
Exp
orts
, FDI
, and
Com
petit
iven
ess
in A
fric
a
Table 5: Output, exchange rates, and FDI flows duringfinancial crises
GDP growth US$ exchange rate FDI flows (average, %) (change, %)* (change, %)
1997 2008 1997 2008 1997 2008–98 –09 –98 –09 –98 –09
Africa total (median) 4.4 4.0 3.0 5.4 –17.2 –20.7Emerging markets 5.3 1.8 13.9 4.9 –64.3 –38.3Frontier markets 4.5 5.2 8.6 11.1 13.9 16.0Transition countries 3.6 6.3 6.2 3.1 –8.9 –25.3Pre-transition countries 3.9 3.3 1.1 5.4 –44.1 –66.0Oil exporters 7.9 4.0 1.1 5.4 50.1 –17.2Fragile states 8.9 3.2 1.1 4.6 –9.6 –19.9
Source: Authors’ calculations, based on the African Economic Outlook andUNCTAD databases.
Notes: The two crises considered here are (1) the Asian crisis and (2) theGreat Recession.
* A positive number reflects depreciation of local currency relative to US dollars.
The Africa Competitiveness Report 2011 © 2011 World Economic Forum, the World Bank and the African Development Bank

23
1.1:
Exp
orts
, FDI
, and
Com
petit
iven
ess
in A
fric
a
Figure 8: Volatility of capital flows, 1996–2008 (relative coefficient of variation)
Source: Authors’ calculations, based on the IMF’s World Economic Outlook database online.
0
2
4
6
8
10
12
Africa Central and Eastern Europe
Commonwealth ofIndependent States
DevelopingAsia
Latin AmericaMiddle East
Ratio
of s
tand
ard
devi
atio
n ov
er m
ean
Figure 9: Change in FDI inflows during financial crises, percent (1997–98 and 2008–09)
Source: Authors’ calculations based, on UNCTAD’s FDI Statistics database.Note: 1997–98 denotes changes in FDI inflows between 1997 and 1998 (the Asian financial crisis) and 2008–09 denotes change in FDI inflows between 2008 and
2009 (the global financial and economic crisis).
–60
–40
–20
0
20
40
60
80
Africa Asia Latin America Developingeconomies
n Foreign direct investmentn Portfolio investment
n 1997–98n 2008–09
Perc
ent
The Africa Competitiveness Report 2011 © 2011 World Economic Forum, the World Bank and the African Development Bank

role of economic fundamentals in offsetting short-termshocks.
When analyzing changes in FDI flows according toregional trading blocs, the performance of the Monetaryand Economic Community of Central Africa(CEMAC) improved from 2008, as the regional tradearrangement benefited from substantial flows toEquatorial Guinea (about US$2.5 billion more than in2008).36 FDI continued to flow to the East AfricanCommunity (EAC) at an unchanged rate because of thesubstantial resilience this subregion exhibited during thecrisis (Figure 10).37
Beyond the crisis: The impact of FDI on longer-termgrowthThis section takes a rearview look at the impact of FDIon growth and productivity prior to the crisis, with aview to drawing policy conclusions for the post-crisissetting. While the impact of FDI inflows has createdsubstantial controversy in the development debate,African policymakers have increasingly viewed FDI as a potential source of growth and development for theireconomies. FDI can stimulate growth not only throughincreasing capital stock, but also through its positivespillovers on technology and management, thus raisingTFP and competitiveness.38
At the same time, policymakers have recognizedthat the benefits of FDI are markedly reduced whensuch investments use outdated technology; lack connec-tion with local communities; avoid paying taxes; and,
last but not least, create a culture of dependency. Otherconcerns relate to unequal distribution of the benefits ofFDI and/or taking advantage of market concentration.Some policymakers fear the loss of political independ-ence as a possible negative effect of FDI.
Evidence on the FDI-growth nexus from West Africanemerging and frontier marketsThe section below re-examines the FDI-productivitynexus in selected West African countries, using thegrowth accounting framework. In this framework, FDIraises growth and productivity through its positive effecton (1) capital accumulation and (2) TFP, which wouldresult from technology transfer and knowledge diffusion,the increased efficiency in management, competition,and better production techniques. While substantial literature on FDI, growth, and productivity exists, theissue of identifying the channels through which FDIimpacts growth has received less attention.39 In this context, the growth accounting approach is helpful forunderstanding which channels—productivity or capitalaccumulation or both—are affected by FDI.40
To provide country-level evidence of the impact of FDI on growth and development, this section usesannual data for emerging and frontier markets in WestAfrica (Cape Verde, Ghana, Nigeria, and Senegal) and a fragile West African country (Sierra Leone) from 1987to 2008. It compares the results with those for Egypt,which was particularly successful in attracting FDI following structural reforms undertaken in mid 2000s,
24
1.1:
Exp
orts
, FDI
, and
Com
petit
iven
ess
in A
fric
a
Figure 10: Change in FDI inflows between 2008 and 2009, by Africa’s regional trade arrangements (percent)
Source: Authors’ calculations, based on UNCTAD’s FDI Statistics database.
–50
–25
0
25
50
75
100
Southern African Development Community
Arab MaghrebUnion
West African Economic and Monetary Union
East AfricanCommunity
Monetary and Economic Community of Central Africa
Perc
ent
The Africa Competitiveness Report 2011 © 2011 World Economic Forum, the World Bank and the African Development Bank

until 2010. As discussed above, West African countrieshave been receiving increased amounts of FDI in recentyears, including from South Africa. Sierra Leone’s case is relevant because of the rapid growth the country hasachieved after the war ended and the special tax incen-tives it has provided for FDI.41
Table B1 in Appendix B presents several usefulinsights about the impact of FDI on growth and channelsof transmission in West African countries and Egypt.42
First, in Senegal and Ghana, positive impact on FDIoccurs through the increased marginal product of capital rather than TFP, and hence is driven more byfactor accumulation than by productivity increases.43
This is consistent with the GCI methodology: boththese countries belong to the group of factor-driveneconomies, where technological adoption and innova-tion are less important and countries compete more on the basis of factor accumulation, in this case capital.Regarding the impact of FDI on growth through posi-tive spillovers and TFP, among the five West Africancountries studied (Cape Verde, Ghana, Senegal,Nigeria, and Sierra Leone), the marginal product ofTFP with respect to FDI is positive (and statistically significant) only for Cape Verde. In concrete terms, this implies that a 1 percent increase in FDI investmentincreases Cape Verde’s growth rate by about 0.31 percent, through increasing TFP. Again, this result isconsistent with the GCI methodology: since CapeVerde is in the efficiency-driven stage of development,technology adoption and innovation are becomingmore important. In Nigeria, FDI does not seem to haveany significant impact on growth at the aggregate level.
These observations are also consistent with the literature on the need to establish necessary thresholdconditions for FDI to have a positive impact ongrowth.44 A related strand of literature has focused onlinking FDI with trade openness.45 A sufficiently open(and competitive) environment needs to be in place inthe host country for foreign investors to contribute toraising the efficiency of existing activities and for thehost country to adopt technology, thus generating posi-tive spillovers for the rest of the society and increasingproductivity. Accordingly, the government of CapeVerde has pursued market-oriented economic reformssince the early 1990s, including a widespread privati -zation program and an opening up of the economy toFDI. The main recipient sectors included tourism, light manufacturing, and transport and communicationservices.
The impact of FDI on TFP is positive but not significant in Senegal, and it is even negative (albeit not significantly so) in Ghana and Nigeria. WhileSenegal and Ghana are ranked above the sub-SaharanAfrican average on the GCI described above, they arestill in the factor-driven stage. Their investment climates have demonstrable weaknesses, especially ininfrastructure. More specifically, while Senegal has a
relatively flexible labor and product markets, it is setback by a small market size and an overall weak infra-structure, especially in the power sector.46 In Ghana, thelack of spillovers so far can be in part explained by thelow share of FDI going to the manufacturing sector,where positive technology spillovers are likely to occur.The performance of Ghana’s FDI is also constrained bythe limited access to land, difficulties with registeringproperty, the rigid labor market regulations, and thelack of skilled workers.47 On the positive side, theimpact of FDI on growth through capital accumulationis positive (and significant) for Ghana and Senegal, suggesting that FDI helps overcome shortages of capital,which are caused, in part, by the limited access tofinance.48
Among the countries studied, Nigeria was the onlyone where FDI does not seem to have a positive impactthrough either of the two channels—the increased TFPor higher marginal product of capital.49 This indicatesthat Nigeria’s advantage stemming from a sizeable market and relatively sophisticated financial sector hasbeen eroded by the country’s weak and deterioratinginstitutions and its low degree of ICT penetration,among other impediments. Moreover, FDI has been disproportionately concentrated in the extractive indus-tries, even though their share in total FDI has beendeclining. Ayanwale argues that when broken into subsectors, some components of FDI already exhibitpositive impact on growth. Specifically, FDI in thetelecommunications sector has the most positive effecton the economy, while FDI in the manufacturing sector affects the economy negatively because of theoverall poor business environment and the low level of human capital.50 The evidence of the positive growthimpact of FDI in Nigeria’s telecommunications sector is consistent with the export performance section abovethat posits that FDI inflows into services can enhanceproduction and export diversification as well as growth.51
In Egypt, FDI has a positive and significant impacton TFP. According to the GCI methodology, Egypt isalready in transition to the efficiency-driven stage.Moreover, in 2004, Egypt implemented structuralreforms—such as revamping the banking sector and liberalizing labor markets—aiming to raise the role ofthe private sector in the economy and diversify its pro-duction base. On the FDI side, the reforms includedestablishing one-stop shops, opening up manufacturing toFDI, and abolishing limits on foreign equity participa-tion in services, including telecommunications andfinancial services. The reforms were successful inencouraging FDI inflows and paid off, especially duringthe global financial crisis, when the country continuedto generate over 4 percent of its GDP through FDI,even during the most severe part of the crisis (June2008–09). In 2009, Egypt was the second largest recipi-ent of FDI inflows in Africa (after Angola) and, accord-ing to UNCTAD, was poised to lead the post-crisis
25
1.1:
Exp
orts
, FDI
, and
Com
petit
iven
ess
in A
fric
a
The Africa Competitiveness Report 2011 © 2011 World Economic Forum, the World Bank and the African Development Bank
FDI recovery.52 Clearly the recent events in Egypt andthe surrounding political instability will negativelyimpact FDI. However, the data discussed here cover the1987–2008 period, so these recent events have not beentaken into account in the reported results.
Policy implications for attracting growth-enhancing FDIafter the crisisAs discussed in the above section, FDI can be a catalystfor growth in African emerging and frontier marketsthrough two main channels: (1) increased TFP and (2) increased capital stock. The analysis shows that, even though FDI’s contribution to growth throughinvestment has been positive in most West Africanfrontier markets studied, the positive spillovers of FDIon TFP have so far taken place only in Cape Verde and the benchmark case, Egypt—the only two countriesthat have moved beyond the factor-driven stage ofdevelopment. This, together with the low domesticinvestment rates, suggests that further removal of barriers to competition and trade (along the lines ofreforms seen in Egypt in the mid 2000s) is paramount.Adequate human capital stock and technological andphysical infrastructure, as well as removing barriers tothe access to credit, could also go a long way in thisregard.
For example, as the case of Sierra Leone and alsothose of Ghana and Senegal illustrate, the empiricalanalysis undertaken seems consistent with the GCImethodology as well as with the empirical literature.This suggests that some minimal threshold of develop-ment (e.g., in the financial sector, human capital, andinfrastructure) is needed for the host countries to benefitfrom FDI through technology transfer and increasedproductivity.53 In other words, if the institutional, technological, and human capital gap with the investor’scountry is too wide, the host country would find it difficult to absorb the technological and know-howtransfer. Thus efforts to raise human capital and techno-logical capacity, as well as to develop infrastructure andfinancial sectors, are crucial for attracting development-friendly FDI and reaping its maximum benefits.
Since some minimal level of domestic resources is needed to co-finance FDI projects, strengtheningdomestic financial systems and capital markets to facili-tate savings and credit in the host countries would help attract FDI. Given that exports and FDI reinforceeach other and some FDI is even contingent onexports, further trade liberalization could be FDI-enhancing. In turn, FDI inflows into services (e.g.,telecommunications, banking) cuts transaction costs andcan promote diversification and growth. The Africancountries aim ing to encourage intra-African FDI andmaximize its benefits may want to adopt measuresencouraging regional integration and trade. A positiveside effect of such steps could be attracting additionalmarket-seeking FDI from developed economies.
ConclusionsThis chapter has analyzed the competitiveness of African countries, based on the results of the GlobalCompetitiveness Index (GCI), the region’s trade performance, and its related ability to attract growth-enhancing FDI. The results show that there is a signif -icant variety in the quality of performances across thecontinent. Some countries have been quite successful in putting into place many of the factors for sustainedeconomic success, yet many obstacles to competitive-ness remain across the majority of African countries.
Overall, the major cross-cutting policy areas thatconstrain Africa’s competitiveness across all main industrygroups include those that increase indirect costs—tradelogistics and infrastructure; and those that relate to poorbusiness environments—access to land, the availabilityof skills, and the ability to absorb technology. The GCI shows that many of these are areas in which sub-Saharan Africa scores relatively poorly in comparisonwith other regions. To achieve industrialization, export competitiveness, and strong, sustained, andshared growth, Africa needs to put special emphasis onmaking progress in these areas. Given the dual linkagesbetween trade and FDI, structural reforms—especiallythose that would remove barriers to competition andencourage trade as well as attract FDI—have a particularpotential to ensure sustained growth. In turn, FDI flowsto high-skill service sectors such as telecommunicationsor banking can help African countries diversify theirproduction and exports and accelerate export growth.
Given the daunting list of obstacles that constrainAfrican productivity, export growth, and the ability to attract growth-enhancing FDI, sub-Saharan Africangovernments will need to prioritize and sequencereforms and investments in their business environmentsand infrastructures in order to unleash the potential for growth in their industries. In doing so, it is impor-tant that the policies to promote competitiveness arebrought together within a coherent strategy rather thanbeing implemented as a series of ad hoc interventions.Experience shows that measures adopted in isolationtend to be much less effective.
Notes1 Clearly, causality runs also from growth to diversification, espe-
cially at lower levels of income. Newfarmer et al. (2009) discuss
these issues in detail and posit that diversification has an inverted
U relationship with income.
2 Newfarmer et al. 2009.
3 A number of developing countries have tried to use tourism for
diversifying their exports, with mixed results.
4 Based on research on FDI in India, Banga (2006) found that FDI
may help export diversification in the host country if it raises the
export intensity of industries that have a low share in world
exports. Indirectly, FDI may encourage export diversification by
increasing the export intensity of domestic firms. Buckley et al.
(2002) examined the impact of FDI in the Chinese manufacturing
and found that FDI helped develop high-tech and new products.
5 Moran et al. 2005.
26
1.1:
Exp
orts
, FDI
, and
Com
petit
iven
ess
in A
fric
a
The Africa Competitiveness Report 2011 © 2011 World Economic Forum, the World Bank and the African Development Bank

6 Trade diversification here refers to the broader sense and encom-
passes not only new products but also higher-quality existing
products and expansion into new markets.
7 FDI inflows to Africa peaked in 2008 at US$72.2 billion, before
falling to US$58.6 billion and further to US$51.1 billion during the
crisis years—that is, in 2009 and 2010. In 2010, for the first time
developing countries accounted for more than half of the world’s
FDI (UNCTAD 2010, 2011).
8 See, for example, Commission on Growth and Development
2008; Hausmann et al. 2006, 2007; Johnson et al. 2006, 2007;
Berg et al. 2008.
9 The Global Competitiveness Index was developed for the World
Economic Forum by Xavier Sala-i-Martin and Elsa V. Artadi, in
collaboration with the World Economic Forum’s Competitiveness
team, and was first introduced in The Global Competitiveness
Report 2004– 2005.
10 Clearly, these institutions, policies, and factors also influence the
future level of productivity that the country is likely to achieve.
11 The 12 pillars are measured using both quantitative data from
public sources (such as inflation, Internet penetration, life
expectancy, and school enrollment rates) as well as data from the
World Economic Forum’s Executive Opinion Survey (the Survey),
conducted annually among top executives in all of the countries
assessed. The Survey provides crucial data on a number of quali-
tative issues (e.g., corruption, confidence in the public sector, and
the quality of schools) for which no quantitative data exist.
12 The concept of stages of development is integrated into the Index
by attributing higher relative weights to those pillars that are more
relevant for a country given its particular stage of development.
Countries are allocated to stages of development based on two
criteria: (1) the level of GDP per capita at market exchange rates,
and (2) the extent to which countries are factor driven. See
Appendix A for more details on the GCI methodology.
13 The Latin American and Caribbean average includes data for the
following countries: Argentina, Barbados, Bolivia, Brazil, Chile,
Colombia, Costa Rica, the Dominican Republic, Ecuador, El
Salvador, Guatemala, Guyana, Honduras, Jamaica, Mexico,
Nicaragua, Panama, Paraguay, Peru, Puerto Rico, Suriname,
Trinidad and Tobago, Uruguay, and Venezuela.
14 The Southeast Asian average includes Brunei Darussalam,
Cambodia, Indonesia, Malaysia, the Philippines, Singapore,
Thailand, Timor-Leste, and Vietnam.
15 Africa was the first continent in the world to implement free
roaming, allowing any user in a foreign country to receive and
send calls and messages at local rates (AfDB and OECD 2009).
16 AfDB and OECD 2010.
17 UNDP 2007.
18 Mattoo 2009.
19 UN Comtrade, World Bank calculations.
20 UN Comtrade, World Bank calculations.
21 UN Comtrade, World Bank calculations.
22 Gelb 2005.
23 Eifert et al. 2008; World Economic Forum, International Bank
for Reconstruction and Development/World Bank, and African
Development Bank 2009.
24 UN Comtrade, World Bank calculations.
25 Deloitte and the US Council on Competitiveness 2010.
26 Total factor productivity measures the efficiency with which
inputs such as labor and capital are utilized.
27 FDI is defined as investment made to acquire a lasting manage-
ment interest (usually at least 10 percent of the voting stock)
in an enterprise operating in a country other than that of the
investor. It is the sum of equity capital, reinvestment of earnings,
other long-term capital, and short-term capital as shown in the
balance of payments.
28 Preliminary estimates indicate that the overall FDI to developing
countries increased by 10 percent in 2010. However, the overall
increase to developing countries occurred in the context of declin-
ing FDI to Africa (UNCTAD 2011).
29 Dorsey et al. 2008.
30 According to the UNCTAD data, FDI to Africa accounted for 9.6
percent of FDI to developing countries in 2001 and 12.2 percent
in 2009.
31 In this section, African countries are grouped into (1) emerging
markets, (2) frontier markets, (3) transition countries, and (4) pre-
transition countries. The classification depends on how far the
countries are from emerging market status. Oil exporters and
fragile states form separate groups. Frontier markets and transi-
tion (taking-off) economies exhibited at least several of the follow-
ing criteria prior to the crisis: (1) growth acceleration; (2) macro-
economic stability, increasing role of the private sector in the
economy; (3) export diversification; and (4) development of finan-
cial markets and increased interest of international institutional
investors. Emerging market economies already reached middle-
income status and, in some cases, had markedly more developed
financial markets (e.g., South Africa, Kenya). In contrast, pre-tran-
sition economies are yet to adopt policies and institutions to facili-
tate growth take-off, a sufficient presence of the private sector,
and the interest of investors. See Brixiova et al. 2011.
32 Among these FDI flows, intra-African investment was an important
source of funds in several Southern African countries, especially
in Mauritius, Mozambique, Malawi, with South Africa being the
main investor.
33 UNCTAD 2010.
34 UNCTAD 2010, 2011. Preliminary estimates indicate that FDI
fell by 14 percent in 2010, with flows to South Africa and Nigeria
taking a heavy hit. FDI to Africa accounted for 12.2 percent of FDI
to developing countries in 2009 and 9.6 percent in 2010.
35 UNCTAD 2010.
36 Members of the Monetary and Economic Community of Central
Africa (CEMAC) are Cameroon, the Central African Republic,
Chad, the Republic of the Congo, Equatorial Guinea, and Gabon.
37 The East African Community (EAC) is the regional intergovern-
mental organization of Burundi, Kenya, Rwanda, Tanzania, and
Uganda.
38 TFP is defined as that part of output not explained by inputs.
39 Moreover, because of limited data, fewer studies have examined
the impact of FDI on growth in Africa, especially sub-Saharan
Africa, than in other regions (e.g., Latin America, Asia, and the
Middle East).
40 The framework is detailed in Appendix B.
41 The data for FDI, GDP (in 2000 constant prices), and investment
(in 2000 constant prices) in these five countries were obtained
from the African Development Bank database. The employment
data are taken from the International Labour Organization (ILO)
database. The ordinary least squares (OLS) method is used to
estimate the relationship between FDI and economic growth in
these countries (Table 3). Minitab (version 16) and Stata (version
10) were used to regress the growth of GDP over a constant
term, share of investment to GDP, growth rate of labor force, and
share of FDI in GDP.
42 The growth accounting equation has a particularly limited explana-
tory power for variations of growth rates in Nigeria and Cape
Verde. In Nigeria, the economic performance is largely driven by
fluctuations in oil prices, while Cape Verde is heavily dependent
on remittances, which accounted for about 20 percent of GDP
in the 2000s. These effects outweigh the impact of changes in
FDI, domestic capital, and labor on growth rates.
43 As in other African countries, Ghana has numerous incentives
in place to attract foreign investment, based on its Investment
Promotion Act of 1994. These include customs duty import
exemptions, tax holidays, rebates (based on regional locations),
and capital allowances. However, as the low inflows in the 1990s
indicated, incentives without an enabling environment are unlikely
to attract significant FDI; flows increased in the 2000s after the
environment was improved.
27
1.1:
Exp
orts
, FDI
, and
Com
petit
iven
ess
in A
fric
a
The Africa Competitiveness Report 2011 © 2011 World Economic Forum, the World Bank and the African Development Bank
44 See Borensztein et al. 1998; Alfaro et al. 2004, and others.
Borensztein et al. 1998 showed that FDI positively impacts growth
only when the host country reaches a threshold level of human
capital, measured by years of schooling. Alfaro et al. 2004 found
that FDI raises growth when the host country has a developed
financial system. Applying the growth accounting framework to
69 countries in 1970–89, Wang and Wong 2009 clarified the chan-
nels through which the threshold conditions operate: FDI raises
productivity growth when the host country reaches a threshold
level of human capital; it promotes capital growth when a well-
functioning financial system is in place.
45 Kandiero and Chitiga 2003; Moran et al. 2005.
46 Senegal has been developing a special economic zone (SEZ) in
the Diamniadio-Bargny region with a view to attracting FDI as well
as domestic investors. The area will comprise an industrial and
commercial free zone with extensive, up-to-date infrastructure to
accommodate about 400 companies (Oxford Business Group
2010).
47 Aryeetey et al. 2010.
48 Ndikumana and Verick 2008 investigated the bilateral relationship
between domestic investment and FDI and found (1) that domes-
tic private investment with strong performance also crowds in
FDI and (2), in turn, that one way in which FDI can have a positive
impact on growth is through enhancing domestic capital accumu-
lation.
49 In 2006, Nigeria undertook reforms to encourage FDI. A “one-
stop-shop” investment center was created, cutting steps neces-
sary to obtain a business permit. In addition to free export pro-
cessing zones where firms are free from paying taxes, including
income and VAT taxes, the country offers fiscal incentives to
foreign investors. Nevertheless, unclear land property rights
remain a key hindrance to attracting FDI, alongside relatively
weak governance.
50 Ayanwale 2007. These findings are consistent with Alfaro’s 2003
empirical analysis. Using cross-country data for 1981–99, she
showed that the effect of FDI on growth depends on the
sector involved. FDI in the primary sector tends to have a nega-
tive effect, while investment in manufacturing a positive one.
51 For all five West African countries studied, taken together, FDI
had a positive impact on growth through factor accumulation
(at a 5 percent significance level) but not through technology
spillovers. For every 1 percent increase in investment, growth
would be higher by 0.55 percentage points. This is consistent
with the observation that, according to the GCI methodology,
all countries but Cape Verde are in the factor-driven stage of
their development.
52 UNCTAD 2010.
53 Hermes and Lensink 2003 showed that a more developed
financial system positively influences technological diffusion (and
growth) associated with FDI. Similarly, Borenzstein et al. 1998
found that FDI positively impacts productivity when a country has
sufficient human capital stock.
ReferencesAbed, G. and G. Iradian, 2011. “Tunisia: Short-Term Challenges, Long-
Term Opportunities.” IIF Research Note, February 10.
Washington DC: Institute for International Finance.
AfDB and OECD (African Development Bank and Organisation for
Economic Co-operation and Development). 2009. African
Economic Outlook 2009. Tunis and Paris: AfDB and OECD.
———. 2010. African Economic Outlook 2010. Tunis and Paris: AfDB
and OECD.
Alexeev, M. and R. Conrad. 2009. “The Elusive Curse of Oil.” The
Review of Economics and Statistics 91 (3): 586–93.
Alfaro, L., A. Chanda, S. Kalemli-Ozcan, and S. Sayek. 2004. “FDI and
Economic Growth: The Role of Local Financial Markets.” Journal
of International Economics 64 (1): 89–112.
Al-Mawali, N. 2004. “Revisiting the Trade-Growth Nexus: Further
Evidence from Egypt.” Review of Middle East Economics and
Finance 2 (3): 211–18.
Ayanwale, A. B. 2007. “FDI and Economic Growth: Evidence from
Nigeria.” AERC Research Paper No. 165. Nairobi: The African
Research Consortium.
Ayreetey, C., F. Barthel, M. Busse, C. Loehr, and R. Osei. 2010.
“Empirical Study on the Determinants and Pro-Development
Impacts of Foreign Direct Investment in Ghana.” GTZ Working
Paper. Available at http://www.hwwi.org/fileadmin/hwwi/
Leistungen/Gutachten/Report-FDI-Ghana-final.pdf.
Banga, R. 2006. “The Export-Diversifying Impact of Japanese and US
Foreign Investments in the Indian Manufacturing Sector.” Journal
of International Business Studies 37 (4): 558–68.
Bank of Uganda. 2007. The Informal Cross-Border Trade Survey
Report 2006. Kampala: Bank of Uganda. Available at
http://www.bou.or.ug/bouwebsite/export/sites/default/bou/
bou-downloads/publications/TradeStatistics/ICBTReports/
INFORMAL_CROSS_BORDER_TRADE_SURVEY_2006.pdf.
———. 2009. The Informal Cross Border Survey Trade Report 2008.
Kampala: Bank of Uganda. Available at http://www.bou.or.ug/
bouwebsite/export/sites/default/bou/bou-downloads/publications/
TradeStatistics/ICBTReports/Informal_Cross_Border_Trade_Report
_2008.pdf.
Berg, A., J. D. Ostry, and J. Zettelmeyer. 2008. “What Makes Growth
Sustained?” IMF Working Paper WP/08/59. Washington DC: IMF.
Borensztein, E., J. De Gregorio, and J.-W. Lee. 1998. “How Does
Foreign Direct Investment Affect Economic Growth?” Journal of
International Economics 45 (1): 115–35.
Brixiova, Z. and L. Ndikumana. 2011. “East Africa’s Resilience during
the Global Recession: Lessons and Policies.” Paper presented at
the 2011 ASSA Annual Meeting, Denver, January 6–9.
Brixiova, Z., L. Ndikumana, and K. Abderrahim. 2011.”Characterizing
Africa’s Dynamism.” African Development Bank Policy Brief,
forthcoming.
Buckley P. T., J. Clegg, and C. Wang. 2002. “The Impact of Inward FDI
on the Performance of Chinese Manufacturing Firms.” Journal of
International Business Studies 33 (4): 637–55.
Collier, P. 2007. The Bottom Billion. Oxford: Oxford University Press.
Collier, P. and B. Goderis. 2008. “Structural Policies for Shock-Prone
Commodity Exporters.” Oxford: Centre for the Study of African
Economies, Oxford University.
Commission on Growth and Development. 2008. The Growth Report:
Strategies for Growth and Inclusive Development. Washington
DC: World Bank on behalf of the Commission on Growth and
Development. Available at http://www.growthcommission.org/
index.php?Itemid=169&id=96&option=com_content&task=view.
Deloitte and the US Council on Competitiveness. 2010. 2010 Global
Manufacturing Competitiveness Index. Deloitte Touche and
Tohmatsu, June. Available at http://www.deloitte.com/view/
en_GX/global/industries/manufacturing/a1a52c646d069210VgnVC
M200000bb42f00aRCRD.htm.
Dorsey, T., H. Tadesse, S. Singh, and Z. Brixiova. 2008. “The
Landscape of Capital Flows to Low-Income Countries.” IMF
Working Paper WP/08/51. Washington DC: IMF.
Eifert, B., A. Gelb, and V. Ramachandran. 2005. “Business Environment
and Comparative Advantage in Africa: Evidence from the
Investment Climate Data.” Working Paper No. 56. Washington
DC: Center for Global Development. Available at
http://www.cgdev.org/content/publications/detail/2732/.
———. 2008. “The Cost of Doing Business in Africa: Evidence from
Enterprise Survey Data.” World Development 36 (9): 1531–46.
Hammouda, H. B., S. N. Karingi, A. E. Njuguna, and M. S. Jallab. 2010.
“Growth, Productivity and Diversification in Africa.” Journal of
Productivity Analysis 33 (2): 125–46.
Hausmann, R. J. Hwang, and D. Rodrik. 2007. “What You Export
Matters.” Journal of Economic Growth 12 (1): 1–25.
Hausmann, R., R. Rodriguez, and R. Wagner, 2006. “Growth Collapses.”
CID Working Paper No. 136. Cambridge, MA: Center for
International Development at Harvard University.
28
1.1:
Exp
orts
, FDI
, and
Com
petit
iven
ess
in A
fric
a
The Africa Competitiveness Report 2011 © 2011 World Economic Forum, the World Bank and the African Development Bank

Hermes, N. and R. Lensink. 2003. “Foreign Direct Investment, Financial
Development and Economic Growth.” Journal of Development
Studies 40 (1): 142–63.
Johnson, S., J. D. Ostry, and A. Subramanian. 2006. “Levers for Growth.”
Finance and Development 43 (1). Available at http://www.imf.org/
external/pubs/ft/fandd/2006/03/johnson.htm.
———. 2007. “Prospects for Sustained Growth in Africa: Benchmarking
the Constraints.” IMF Working Paper WP/07/52. Washington DC:
IMF.
Kandiero, T. and M. Chitiga. 2003. “Trade Openness and Foreign Direct
Investment in Africa.” Paper prepared for the Economic Society
of Southern Africa 2003 Annual Conference, Cape Town, South
Africa, October.
Mattoo, A. 2009. “Exporting Services.” In Breaking into New Markets:
Emerging Lessons for Export Diversification, ed. R. Newfarmer,
W. Shaw, and P. Walkenhorst. Washington DC: World Bank.
161–82.
Moran, T., E. Graham, and M. Blomsröm. 2005. Does Foreign
Investment Promote Development? Washington DC: Institute for
International Economics and Center for Global Development.
Ndikumana, L. and S. Verick. 2008. “The Linkages Between FDI and
Domestic Investment: Unraveling the Developmental Impact of
Foreign Investment in Sub-Saharan Africa.” Development Policy
Review 26 (6): 713–26.
Newfarmer, R., W. Shaw, and P. Walkenhorst, eds. 2009. Breaking into
New Markets: Emerging Lessons for Export Diversification.
Washington DC: World Bank.
Oxford Business Group. 2010. Senegal 2009: The Report. London:
Oxford Business Group.
Sadik, A. T. and A. A. Bolbol. 2001. “Capital Flows, FDI and Technology
Spillovers: Evidence from Arab Countries.” World Development
29 (12): 2111–25.
Uganda Bureau of Statistics. 2010. Statistical Abstract 2010. Kampala:
Uganda Bureau of Statistics. Available at http://www.ubos.org/
onlinefiles/uploads/ubos/pdf%20documents/2010StatAbstract.pdf.
UN Comtrade database. Available at http://comtrade.un.org/.
UNCTAD (United Nations Conference on Trade and Development).
UNCTADstat. Foreign merchandise database available at
http://unctadstat.unctad.org/TableViewer/tableView.aspx?
ReportId=120.
———. FDI Statistics database. Available at
http://www.unctad.org/Templates/Page.asp?intItemID=4979&
lang=1.
———. 2010. World Investment Report 2010. Geneva: UNCTAD.
———. 2011. “Global and Regional FDI Trends in 2010.” UNCTAD
Global Investment Trends Monitor No. 5 (January 11). Geneva:
UNCTAD.
UNDP (United Nations Development Programme). 2007. Swaziland
Human Development Report: HIV and AIDS and Culture, March.
Report commissioned by UNDP Swaziland. Available at http://
planipolis.iiep.unesco.org/upload/Swaziland/Swaziland_NHDR_200
8.pdf.
Wang, M. and M. C. S. Wong. 2009. “Foreign Direct Investment and
Economic Growth: The Growth Accounting Perspective.”
Economic Inquiry 47 (4): 701–10.
World Economic Forum. 2004. The Global Competitiveness Report
2004– 2005. Houndmills, Basingstoke, Hampshire and New York:
Palgrave MacMillan.
———. 2009. The Global Competitiveness Report 2009– 2010. Geneva:
World Economic Forum.
———. 2010. The Global Competitiveness Report 2010– 2011. Geneva:
World Economic Forum.
World Economic Forum, International Bank for Reconstruction and
Development/World Bank, and African Development Bank. 2009.
The Africa Competitiveness Report 2009. Geneva: World
Economic Forum.
29
1.1:
Exp
orts
, FDI
, and
Com
petit
iven
ess
in A
fric
a
The Africa Competitiveness Report 2011 © 2011 World Economic Forum, the World Bank and the African Development Bank

The Africa Competitiveness Report 2011 © 2011 World Economic Forum, the World Bank and the African Development Bank

31
This appendix presents the structure of the GlobalCompetitiveness Index 2010–2011 (GCI). The num-bering of the variables matches the numbering of thedata tables that appear in The Global CompetitivenessReport 2010–2011. The number preceding the periodindicates to which pillar the variable belongs (e.g., vari-able 1.01 belongs to the 1st pillar, and variable 12.04belongs to the 12th pillar).
The computation of the GCI is based on successiveaggregations of scores from the indicator level (i.e., themost disaggregated level) all the way up to the overallGCI score. Unless mentioned otherwise, we use anarithmetic mean to aggregate individual variables withina category.a For the higher aggregation levels, we usethe percentage shown next to each category. This per-centage represents the category’s weight within itsimmediate parent category. Reported percentages arerounded to the nearest integer, but exact figures areused in the calculation of the GCI. For example, thescore a country achieves in the 9th pillar accounts for17 percent of this country’s score in the efficiencyenhancers subindex, irrespective of the country’s stage ofdevelopment. Similarly, the score achieved on the sub-pillar transport infrastructure accounts for 50 percent of thescore of the infrastructure pillar.
Unlike the case for the lower levels of aggregation,the weight placed on each of the three subindexes (basic requirements, efficiency enhancers, and innovation andsophistication factors) is not fixed. Instead, it depends oneach country’s stage of development.b For instance, inthe case of Benin—a country in the first stage of devel-opment—the score in the basic requirements subindexaccounts for 60 percent of its overall GCI score, whileit represents just 20 percent of the overall GCI score ofAustralia, a country in the third stage of development.
Variables that are not derived from the ExecutiveOpinion Survey (Survey) are identified by an asterisk(*) in the following pages. All of the variables aredescribed in more detail in the "How to Read theCompetitiveness Profiles" section of this Report. Tomake the aggregation possible, these variables are trans-formed onto a 1-to-7 scale in order to align them withthe Survey results. We apply a min-max transformation,which preserves the order of, and the relative distancebetween, country scores.c
Variables that are followed by the designation“1/2” enter the GCI in two different pillars. In order toavoid double counting, we assign a half-weight to eachinstance.d
Weight (%) within immediate parent category
BASIC REQUIREMENTS
1st pillar: Institutions.................................................25%A. Public institutions....................................................75%
1. Property rights .........................................................................20%1.01 Property rights1.02 Intellectual property protection 1/2
2. Ethics and corruption..............................................................20%1.03 Diversion of public funds1.04 Public trust of politicians1.05 Irregular payments and bribes
3. Undue influence.......................................................................20%1.06 Judicial independence1.07 Favoritism in decisions of government officials
4. Government inefficiency ........................................................20%1.08 Wastefulness of government spending1.09 Burden of government regulation1.10 Efficiency of legal framework in settling disputes1.11 Efficiency of legal framework in challenging
regulations1.12 Transparency of government policymaking
5. Security .....................................................................................20%1.13 Business costs of terrorism1.14 Business costs of crime and violence1.15 Organized crime1.16 Reliability of police services
B. Private institutions...................................................25%
1. Corporate ethics ......................................................................50%1.17 Ethical behavior of firms
2. Accountability ..........................................................................50%1.18 Strength of auditing and reporting standards1.19 Efficacy of corporate boards1.20 Protection of minority shareholders’ interests1.21 Strength of investor protection*
2nd pillar: Infrastructure...........................................25%A. Transport infrastructure ...........................................50%
2.01 Quality of overall infrastructure2.02 Quality of roads2.03 Quality of railroad infrastructure2.04 Quality of port infrastructure2.05 Quality of air transport infrastructure2.06 Available seat kilometers*
B. Energy and telephony infrastructure......................50%2.07 Quality of electricity supply2.08 Fixed telephone lines* 1/2
2.09 Mobile telephone subscriptions* 1/2
3rd pillar: Macroeconomic environment...............25%3.01 Government budget balance*3.02 National savings rate*3.03 Inflation* e
3.04 Interest rate spread*3.05 Government debt*3.06 Country credit rating*
Appendix A: Structure of the Global Competitiveness Index
1.1
Appe
ndix
A: S
truc
ture
of
the
Glob
al C
ompe
titiv
enes
s In
dex
(Cont’d.)
The Africa Competitiveness Report 2011 © 2011 World Economic Forum, the World Bank and the African Development Bank

32
1.1
Appe
ndix
A: S
truc
ture
of
the
Glob
al C
ompe
titiv
enes
s In
dex
4th pillar: Health and primary education ..............25%A. Health........................................................................50%
4.01 Business impact of malaria f
4.02 Malaria incidence* f
4.03 Business impact of tuberculosis f
4.04 Tuberculosis incidence* f
4.05 Business impact of HIV/AIDS f
4.06 HIV prevalence* f
4.07 Infant mortality*4.08 Life expectancy*
B. Primary education....................................................50%4.09 Quality of primary education4.10 Primary education enrollment rate* g
EFFICIENCY ENHANCERS
5th pillar: Higher education and training ..............17%A. Quantity of education .............................................33%
5.01 Secondary education enrollment rate*5.02 Tertiary education enrollment rate*
B. Quality of education ................................................33%5.03 Quality of the educational system5.04 Quality of math and science education5.05 Quality of management schools5.06 Internet access in schools
C. On-the-job training ..................................................33%5.07 Local availability of specialized research
and training services5.08 Extent of staff training
6th pillar: Goods market efficiency ........................17%A. Competition .............................................................67%
1. Domestic competition ...................................................variable h
6.01 Intensity of local competition6.02 Extent of market dominance6.03 Effectiveness of anti-monopoly policy6.04 Extent and effect of taxation6.05 Total tax rate*6.06 Number of procedures required to
start a business* i
6.07 Time required to start a business* i
6.08 Agricultural policy costs
2. Foreign competition.......................................................variable h
6.09 Prevalence of trade barriers6.10 Trade tariffs*6.11 Prevalence of foreign ownership6.12 Business impact of rules on FDI6.13 Burden of customs procedures
10.04 Imports as a percentage of GDP* g
B. Quality of demand conditions ................................33%6.14 Degree of customer orientation6.15 Buyer sophistication
7th pillar: Labor market efficiency .........................17%A. Flexibility ..................................................................50%
7.01 Cooperation in labor-employer relations7.02 Flexibility of wage determination
7.03 Rigidity of employment*7.04 Hiring and firing practices7.05 Redundancy costs*6.04 Extent and effect of taxation 1/2
B. Efficient use of talent...............................................50%7.06 Pay and productivity7.07 Reliance on professional management 1/2
7.08 Brain drain7.09 Female participation in labor force*
8th pillar: Financial market development .............17%A. Efficiency...................................................................50%
8.01 Availability of financial services8.02 Affordability of financial services8.03 Financing through local equity market8.04 Ease of access to loans8.05 Venture capital availability8.06 Restriction on capital flows
B. Trustworthiness and confidence .............................50%8.07 Soundness of banks8.08 Regulation of securities exchanges8.09 Legal rights index*
9th pillar: Technological readiness........................17%A. Technological adoption............................................50%
9.01 Availability of latest technologies9.02 Firm-level technology absorption9.03 FDI and technology transfer
B. ICT use ......................................................................50%9.04 Internet users*9.05 Broadband Internet subscriptions*9.06 Internet bandwidth*2.08 Fixed telephone lines* 1/2
2.09 Mobile telephone subscriptions* 1/2
10th pillar: Market size .............................................17%A. Domestic market size ..............................................75%
10.01 Domestic market size index* j
B. Foreign market size..................................................25%10.02 Foreign market size index* k
INNOVATION AND SOPHISTICATION FACTORS
11th pillar: Business sophistication.......................50%11.01 Local supplier quantity11.02 Local supplier quality11.03 State of cluster development11.04 Nature of competitive advantage11.05 Value chain breadth11.06 Control of international distribution11.07 Production process sophistication11.08 Extent of marketing11.09 Willingness to delegate authority7.07 Reliance on professional management 1/2
(Cont’d.)
Appendix A: Structure of the Global Competitiveness Index (cont’d.)
The Africa Competitiveness Report 2011 © 2011 World Economic Forum, the World Bank and the African Development Bank

12th pillar: Innovation................................................50%12.01 Capacity for innovation12.02 Quality of scientific research institutions12.03 Company spending on R&D12.04 University-industry collaboration in R&D12.05 Government procurement of advanced technology
products12.06 Availability of scientists and engineers12.07 Utility patents*1.02 Intellectual property protection 1/2
Notesa Formally, for a category i composed of K indicators, we have:
b The weights are the following:
Factor- Efficiency- Innovation-driven driven driven
Weights stage (%) stage (%) stage (%)
Basic requirements 60 40 20
Efficiency enhancers 35 50 50
Innovation and sophistication factors 5 10 30
For further information, see Chapter 1.1 of The Global
Competitiveness Report 2010– 2011.
c Formally, we have:
6 x(country score – sample minimum)
+ 1 (sample maximum – sample minimum)
The sample minimum and sample maximum are, respectively, the
lowest and highest country scores in the sample of economies
covered by the GCI. In some instances, adjustments were made
to account for extreme outliers. For those indicators for which a
higher value indicates a worse outcome (e.g., disease incidence,
government debt), the transformation formula takes the following
form, thus ensuring that 1 and 7 still corresponds to the worst
and best possible outcomes, respectively:
–6 x(country score – sample minimum)
+ 7 (sample maximum – sample minimum)
d For those categories that contain one or several half-weight vari-
ables, country scores for those groups are computed as follows:
(sum of scores on full-weight variables) + × (sum of scores on half-weight variables)
(count of full-weight variables) + × (count of half-weight variables)
e In order to capture the idea that both high inflation and deflation
are detrimental, inflation enters the model in a U-shaped manner
as follows: for values of inflation between 0.5 and 2.9 percent, a
country receives the highest possible score of 7. Outside this
range, scores decrease linearly as they move away from these
values.
f The impact of malaria, tuberculosis, and HIV/AIDS on competitive-
ness depends not only on their respective incidence rates but
also on how costly they are for business. Therefore, in order to
estimate the impact of each of the three diseases, we combine
its incidence rate with the Survey question on its perceived cost
to businesses. To combine these data we first take the ratio of
each country’s disease incidence rate relative to the highest inci-
dence rate in the whole sample. The inverse of this ratio is then
multiplied by each country’s score on the related Survey question.
This product is then normalized to a 1-to-7 scale. Note that coun-
tries with zero reported incidence receive a 7, regardless their
scores on the related Survey question.
g For this variable we first apply a log-transformation and then a
min-max transformation.
h The competition subpillar is the weighted average of two compo-
nents: domestic competition and foreign competition. In both
components, the included variables provide an indication of the
extent to which competition is distorted. The relative importance
of these distortions depends on the relative size of domestic ver-
sus foreign competition. This interaction between the domestic
market and the foreign market is captured by the way we deter-
mine the weights of the two components. Domestic competition
is the sum of consumption (C), investment (I), government spend-
ing (G), and exports (X), while foreign competition is equal to
imports (M). Thus we assign a weight of (C + I + G + X)/
(C + I + G + X + M) to domestic competition and a weight of
M/(C + I + G + X + M) to foreign competition.
i Variables 6.06 and 6.07 combine to form one single variable.
j The size of the domestic market is constructed by taking the
natural log of the sum of the gross domestic product valued
at purchasing power parity (PPP) plus the total value (PPP esti-
mates) of imports of goods and services, minus the total value
(PPP estimates) of exports of goods and services. Data are
then normalized on a 1-to-7 scale. PPP estimates of imports
and exports are obtained by taking the product of exports as
a percentage of GDP and GDP valued at PPP. The underlying
data are reported in the data tables section of The Global
Competitiveness Report 2010– 2011 (see Tables 10.03, 10.04,
and 10.05 of that Report).
k The size of the foreign market is estimated as the natural log of
the total value (PPP estimates) of exports of goods and services,
normalized on a 1-to-7 scale. PPP estimates of exports are
obtained by taking the product of exports as a percentage of GDP
and GDP valued at PPP. The underlying data are reported in the
data tables.
Appendix A: Structure of the Global Competitiveness Index (cont’d.)
33
1.1
Appe
ndix
A: S
truc
ture
of
the
Glob
al C
ompe
titiv
enes
s In
dex
The Africa Competitiveness Report 2011 © 2011 World Economic Forum, the World Bank and the African Development Bank
Related Documents