The Internationalization Process of Firms: from Exports to FDI * Paola Conconi Universit´ e Libre de Bruxelles (ECARES) and CEPR Andr´ e Sapir Universit´ e Libre de Bruxelles (ECARES) and CEPR Maurizio Zanardi Universit´ e Libre de Bruxelles (ECARES) Preliminary version: December 2011 Abstract We examine how uncertainty affects the dynamics of firms’ internationaliza- tion choices. We describe a model in which firms decide whether to serve a foreign market, and whether to do so through exports or foreign direct investment (FDI). Firms are uncertain about their ability to earn profits in the foreign market, which they can only discover by operating there. We derive conditions under which firms will follow a gradual internationalization process, “testing” the foreign market via exports before investing in local production facilities. To assess the model’s predic- tions, we use detailed firm-level information about exports and FDI in individual destinations markets, for all companies registered in Belgium since the early 1990s. We find that a firm’s export experience in a foreign country plays a crucial role in its decision to start investing there, and the effect is stronger in the face of higher uncertainty. Our analysis suggests that exports and FDI, although substitutes from a static perspective, may be complements over time, since the knowledge acquired through export experience can lead firms to invest abroad. Trade liber- alization may thus foster FDI, by lowering the costs of export experimentation. JEL classifications : F10, D21, F13. Keywords : Exports, FDI, Uncertainty, Experimentation. * We are grateful to Andrew Bernard, Holger Breinlich, Juan Carluccio, Emmanuel Dhyne, Jonathan Eaton, Peter Egger, Stefania Garetto, Catherine Fuss, Nuno Lim˜ ao, Jim Markusen, Marc Melitz, Harald Fadinger, Emanuel Ornelas, Francesca Randaccio, Michael Ryan, Rub´ en Segura-Cayuela, and partic- ipants to the NBB Conference on “International Trade: Threats and Opportunities in a Globalised Word”, the CEPR GIST conference at the University of Stockholm, the ETSG conference in Copen- hagen, and the Midwest International Economics Group meeting at Vanderbilt University for their useful comments and suggestions. We also wish to thank Christophe Piette and Marc Mollet for their help and support with data processing, and Elena Mattevi and Li Chen for excellent research assistance. Fund- ing from the National Bank of Belgium and the European Commission’s under the PEGGED project (Grant Agreement No. 217559) is gratefully acknowledged. Correspondence should be addressed to Paola Conconi, ECARES, Universit´ e Libre de Bruxelles, CP 114, Avenue F. D. Roosevelt 50, 1050 Brussels, Belgium. E-mail: [email protected].

Welcome message from author
This document is posted to help you gain knowledge. Please leave a comment to let me know what you think about it! Share it to your friends and learn new things together.
Transcript
The Internationalization Process of Firms:from Exports to FDI!
Paola ConconiUniversite Libre de Bruxelles (ECARES) and CEPR
Andre SapirUniversite Libre de Bruxelles (ECARES) and CEPR
Maurizio ZanardiUniversite Libre de Bruxelles (ECARES)
Preliminary version: December 2011
Abstract
We examine how uncertainty a!ects the dynamics of firms’ internationaliza-tion choices. We describe a model in which firms decide whether to serve a foreignmarket, and whether to do so through exports or foreign direct investment (FDI).Firms are uncertain about their ability to earn profits in the foreign market, whichthey can only discover by operating there. We derive conditions under which firmswill follow a gradual internationalization process, “testing” the foreign market viaexports before investing in local production facilities. To assess the model’s predic-tions, we use detailed firm-level information about exports and FDI in individualdestinations markets, for all companies registered in Belgium since the early 1990s.We find that a firm’s export experience in a foreign country plays a crucial role inits decision to start investing there, and the e!ect is stronger in the face of higheruncertainty. Our analysis suggests that exports and FDI, although substitutesfrom a static perspective, may be complements over time, since the knowledgeacquired through export experience can lead firms to invest abroad. Trade liber-alization may thus foster FDI, by lowering the costs of export experimentation.
JEL classifications: F10, D21, F13.
Keywords: Exports, FDI, Uncertainty, Experimentation.
!We are grateful to Andrew Bernard, Holger Breinlich, Juan Carluccio, Emmanuel Dhyne, JonathanEaton, Peter Egger, Stefania Garetto, Catherine Fuss, Nuno Limao, Jim Markusen, Marc Melitz, HaraldFadinger, Emanuel Ornelas, Francesca Randaccio, Michael Ryan, Ruben Segura-Cayuela, and partic-ipants to the NBB Conference on “International Trade: Threats and Opportunities in a GlobalisedWord”, the CEPR GIST conference at the University of Stockholm, the ETSG conference in Copen-hagen, and the Midwest International Economics Group meeting at Vanderbilt University for their usefulcomments and suggestions. We also wish to thank Christophe Piette and Marc Mollet for their help andsupport with data processing, and Elena Mattevi and Li Chen for excellent research assistance. Fund-ing from the National Bank of Belgium and the European Commission’s under the PEGGED project(Grant Agreement No. 217559) is gratefully acknowledged. Correspondence should be addressed toPaola Conconi, ECARES, Universite Libre de Bruxelles, CP 114, Avenue F. D. Roosevelt 50, 1050Brussels, Belgium. E-mail: [email protected].
1 Introduction
In recent decades, more and more companies have started to operate internationally,
selling their goods and services to foreign customers through exports or local subsidiary
sales. When deciding whether and how to serve new markets, firms are often faced
with high levels of uncertainty: on the supply side, they may not be aware of the legal
requirements and local regulations for selling their goods in particular markets; on the
demand side, they may be uncertain about preferences of foreign consumers and the
adequacy of their products to local tastes.
In this paper, we examine how uncertainty about foreign market conditions a!ects
firms dynamic choices over exports and foreign direct investment (FDI). We focus on
“horizontal” FDI, which refers to the establishment of foreign production facilities with
the purpose of serving the local market.1 To this end, we develop a tractable model
of firms’ internationalization decisions under uncertainty, derive empirical predictions
from it, and take them to the data. Our analysis shows that the need to acquire market-
specific knowledge can lead firms to follow a gradual internationalization process, serving
a market via exports before establishing foreign production facilities.
Our analysis builds on the vast literature on the “proximity-concentration” trade-
o!, which examines firms’ decisions on whether to serve a foreign market, and whether
to do so through exports or local subsidiary sales (e.g., Markusen, 1984; Brainard,
1997; Helpman et al., 2004). The key novelty of our paper is the emphasis on market
uncertainty and experimentation. In the spirit of Jovanovich (1982), we describe a simple
model in which firms are uncertain about their ability to earn profits in a foreign market,
and can only discover it by actually serving it. In this setting, we derive conditions under
which firms will first “test” the foreign market by exporting small amounts; following
this initial trial phase, they will either exit, expand export volumes, or engage in FDI.
The intuition for this result is simple: in the face of market uncertainty, firms prefer to
“experiment” through exports, which involve lower fixed costs and thus less commitment
to a market than FDI.2
1Since our goal is to examine firms’ choices on how to serve customers in a foreign market, we donot consider “vertical” FDI, which involves the fragmentation of the production process across di!erentcountries to reduce costs, and “export-platform” FDI, whereby firms establish foreign a"liates in onecountry to serve neighboring countries. See Hanson et al. (2005) and Ekholm et al. (2007) for studieson vertical and export-platform FDI. In their review of the empirical literature on FDI, Markusen andMaskus (2003) and Blonigen (2005) conclude that most FDI is horizontal in nature. Indeed, foreigna"liates worldwide sell most of of their products locally. For example, over the period 2005-2010, lessthan 19 percent of a"liate sales were sold outside of the country of production (UNCTAD, 2011).
2Our theoretical analysis formalizes the ideas of a vast literature in international business studies,which argues that the need to acquire market specific knowledge leads firms to follow a process ofgradual involvement in foreign markets. As stressed by one of the seminal papers in this literature,
1

To evaluate the predictions of our model, we employ firm-level data from the National
Bank of Belgium (NBB), which provides detailed information on exports and FDI in
individual countries for all companies registered in Belgium since the early 1990’s. We
investigate the dynamics of firms’ internationalization choices, focusing on destinations
outside the European Single Market, in which Belgian firms are more likely to face
uncertain supply and demand conditions.
The results of our empirical analysis support the model’s predictions, providing sys-
tematic evidence for firms’ gradual involvement in foreign markets. First, we show that
the overwhelming majority of firms that start investing in a foreign country have pre-
viously been exporting to it. This suggests that firms start serving foreign markets via
exports. Second, most new exporters sell small amounts and disappear from export
markets in the following period; export volumes and survival probability increase sig-
nificantly in the following years. These findings suggest a process of “trials and errors”,
in which firms initially test foreign markets to find out whether they can make profits
serving them. Finally, we show that a firm’s export experience in a foreign country cru-
cially a!ects its decision to start investing there, and the e!ect is stronger when supply
and demand conditions are more uncertain.
Our analysis shows that firms’ export and FDI decisions must be understood as part
of an a broader dynamic strategy to serve foreign markets in the face of uncertainty. We
show that, even when exports and FDI represent alternative ways of serving a foreign
market – and are thus substitutes from a static perspective – they may be complements
over time – since the knowledge acquired through export experience can lead firms to
invest abroad.
In standard models of the proximity-concentration trade-o! that abstract from mar-
ket uncertainty, FDI is “tari!-jumping” and a fall in trade costs leads firms to substitute
a"liate production for exports. Trade liberalization should thus decrease firms’ incen-
tives to establish production facilities in foreign countries. Contrary to this prediction,
our analysis suggests that trade liberalization may actually foster FDI, by lowering the
costs of export experimentation. This may partly explain why many studies of FDI de-
terminants fail to find evidence for a positive e!ect of trade protection (e.g., Bloningen,
1997).
The remainder of this paper is organized as follows. Section 2 reviews di!erent
strands of literature related to our analysis. Section 3 presents the theoretical model of
firms are often uncertain about “characteristics of the specific national market – its business climate,cultural patterns, structure of the market system, and, most importantly characteristics of the individualcustomer” (Johanson and Vahlne, 1977).
2
firms’ dynamic internationalization choices under uncertainty. Section 4 describes the
datasets used in our empirical analysis. Section 5 provides descriptive statistics about
the foreign activities of Belgian firms. Section 6 presents our empirical methodology and
results. Section 7 concludes.
2 Related literature
Our paper contributes to the vast literature on the “proximity-concentration” tradeo!,
which examines firms’ decision on whether to serve a foreign market, and whether to
do so through exports or horizontal FDI. These modes of market access have di!erent
relative costs: exporting involves lower fixed costs, while FDI involves lower variable
costs. The key prediction of traditional models of the proximity-concentration tradeo!
is that firms will invest abroad when the gains from avoiding trade costs outweigh the
costs of maintaining capacity in multiple markets (e.g., Markusen, 1984; Horstmann and
Markusen, 1992; Brainard, 1997; Markusen and Venables, 2000). Our paper shows that,
when uncertain about their profitability in a foreign market, firms may experiment by
serving the market via exports – the mode characterized by lower fixed costs – before
switching to FDI.3
Helpman et al. (2004) introduce firm heterogeneity as in Melitz (2003) into a simple
model of the proximity-concentration tradeo! and show that the higher fixed costs of
FDI give rise to selection e!ects: the most productive firms engage in FDI, the less
productive ones will export, and the least productive ones serve only the home market.
Using data on exports and FDI sales of US firms in 38 countries and 52 industries, they
provide cross-sectional evidence supporting this prediction. The paper by Helpman et al.
(2004) emphasizes the importance of productivity di!erences in explaining static exports
and FDI choices of di!erent firms within sectors. Our paper focuses instead on the
dynamic choices of individual firms, highlighting the importance of market uncertainty
and learning.4
One of the only papers to study the dynamics of firms’ internationalization choices is
Rob and Vettas (2003). They describe an infinite horizon model in which a multinational
3Horstmann and Markusen (1996) develop a theoretical model of multinationals’ decisions whenforeign market conditions are uncertain. Rather than on the choice between exports and FDI, theiranalysis focuses on the choice between serving a foreign market via FDI or through a contractualarrangement with a local agent who has superior information about the market characteristics.
4A recent paper by Ramondo et al. (2010) introduces country-specific productivity shocks in astatic model of the proximity-concentration tradeo! with heterogeneous firms. Their analysis doesnot examine firms’ dynamics and experimentation, focusing instead on the relationship between cross-country di!erences in output fluctuations and cross-country patterns of exports and a"liate sales.
3
firm can serve a foreign market by exporting its product, creating productive capacity via
horizontal FDI, or a combination of the two. For every unit sold abroad through FDI, the
firm has to install capacity and investment in capacity is irreversible. Foreign demand
grows stochastically over time: in each period, it either continues to grow or stops
growing forever. In this setting, they show that uncertainty can give rise to a process of
gradual involvement in foreign markets, in which firms export before setting up foreign
subsidiaries.5 Our paper di!ers from Rob and Vettas (2003) in two dimensions. First,
our simple theoretical model allows to capture both demand and supply uncertainty in
foreign markets, while they only focus on the role of demand uncertainty. Second, we
bring the predictions of our model to the data, while their analysis is only theoretical in
nature.
The idea that uncertainty can lead firms to delay investment is central to real options
theory. This suggests that, if investments are irreversible and market conditions are
uncertain, firms may prefer to minimize current investments but secure an option to
invest at a later time (e.g., McDonald and Siegel, 1986; Dixit and Pindyck,1994, Guiso
and Parigi, 1999). Our paper shows that, when faced with the choice on how to serve
foreign markets, firms may optimally choose to export first, waiting to invest until they
learn about foreign demand and supply conditions.
The di"culty for firms to acquire information about foreign markets has long been
emphasized by the international business literature. Starting from Johanson and Vahlne
(1977), many studies argue that market-specific knowledge can only be gained by oper-
ating abroad, is often tacit in nature, highly dependent on individuals, and thus di"cult
to transfer to other individuals or other contexts. To acquire such knowledge, firms serve
foreign markets via exports first and eventually, in some cases, establish foreign produc-
tion subsidiaries.6 Our paper develops a simple dynamic model to formalize these ideas
and provides systematic evidence for firms’ gradual involvement in foreign markets.7
5The multinational chooses at each point in time an optimal combination of exports and FDI. Thelatter entails the risk of creating under-utilized capacity in the case that the market turns out to besmall, so the firm always starts with exports and switches to FDI if demand is large enough. Undercertain conditions, it may use a combination of exports (to explore uncertain demand) and FDI (tosatisfy proven demand).
6This literature also suggests that firms may first engage in joint ventures with local firms, whichprovide the right (but not the obligation) for future investment (e.g., Chi, 2000) and can help to obtainknowledge about local market conditions (Chi and McGuire, 1996). Once uncertainties have beenreduced, firms involved in joint ventures may choose to purchase more equity in the venture, sell theirequity share, or dissolve the venture (e.g., Kumar, 2005).
7The international business literature has relied on case studies or surveys to examine firms’ inter-nationalization choices. For example, the seminal contribution by Johanson and Vahlne (1977) is basedon case studies of few Swedish firms, while the more recent paper by Brouthers et al. (2008) relies ona survey of Dutch and Greek firms.
4

Finally, our paper is related to the recent literature on firms’ export dynamics (e.g.,
Eaton et al. (2008); Albornoz et al. (2010), and Morales et al. (2011), among many
others). This identifies new “stylized facts” about exporting firms: many new exporters
do not survive into the next year; they begin by exporting small amounts but – condi-
tional on survival – they grow rapidly and account for a substantial proportion of export
growth.8 Theoretical models seeking to account for firms’ export dynamics emphasize
learning about foreign markets and trade relationships. 9 Most related to our analysis
is the recent paper by Albornoz et al. (2010). They develop a simple model in which
firms discover their profitability in foreign markets by exporting to them, examining
firms’ export dynamics across di!erent destinations (“sequential exporting”). Our fo-
cus is instead on how learning and experimentation within a given destination can lead
firms to switch from exports to FDI (“internationalization process”). To the best of our
knowledge, none of the recent studies on export dynamics has examined the relationship
between firms’ exports and FDI choices, and whether export experience leads firms to
establish foreign subsidiaries.
3 The model
3.1 Setup
We describe a simple model in which a representative risk-neutral firm producing good
k in its domestic market must decide whether or not to serve foreign market i, and
whether to do that via exports or horizontal FDI.10
Variable costs comprise a unit cost of production, which for simplicity is normalized to
zero, and a unit cost cik for selling to consumers in country i (e.g., capturing distribution
8See, for example, Eaton et al. (2008) for Columbian firms, Aeberhardt et al. (2009) for Frenchfirms, Lawless (2009) for Irish firms, and Albornoz et al. (2010) for Argentinian firms.
9One of the earlier papers on trade dynamics and incomplete information is Rauch and Watson(2003). They describe a model with costly search in which a buyer from a developed country is uncertainabout whether exporters from developing countries are able to fill a large scale order. In this setting,trade relations start small because importers “test” exporters by placing small orders that reveal theirtype. Eaton et al. (2010) develop a model where producers learn about the appeal of their products bydevoting resources to finding consumers and by observing the experiences of competitors. Freund andPierola (2010) focus on the incentives of firms to develop new export products in the face of uncertaintyabout export costs. Their analysis of the frequency of entry and exit from foreign markets for Peruvianfirms in the non-traditional agricultural sector in Peru shows a process of “trial and errors”. Arkolakis(2010) builds a model in which firms face convex costs of advertising and are thus forced to slowly buildmarket share in export markets.
10In our theoretical analysis, we abstract from firm heterogeneity, to focus on the role of uncertaintyand knowledge acquisition in foreign markets. In our empirical analysis, we will control for productivitydi!erences across firms, in line with Helpman et al. (2004) and Head and Ries (2003), among others.
5
costs in the foreign market). If the firm serves the foreign marker via exports, it bears
a unit trade cost equal to !ik (reflecting both transport costs and barriers to trade)
and incurs a one-time fixed cost equal to FEik (e.g., capturing the costs of dealing with
customs procedures). If instead the firm engages in FDI, setting up a foreign production
subsidiary, it avoids trade costs, but incurs a one-time fixed cost F Iik > FE
ik . Both fixed
costs are assumed to be irreversible.11
The firm faces a linear demand in the foreign market:
qik(pik) = aik " pik, (1)
where qik and pik denote the output sold in the foreign market and the corresponding
price. The main feature of our model is that firms face uncertainty about foreign supply
and demand conditions, so they do not know how profitable it will be for them to
serve the foreign market. We allow for uncertainty in both foreign demand and supply
conditions: firms do not initially know the willingness of foreign consumers to pay for
their product (captured by the parameter aik), nor their unit cost of selling abroad
(captured by cik). We denote profitability in the foreign market by
µik # aik " cik. (2)
Before serving the foreign market, domestic firms know the distribution of prof-
itability in a foreign market. However, individual firms do not know what their true
profitability is and can only learn this as they operate in the foreign market. We assume
that µik is a random variable with a continuous cumulative distribution function G(.)
on the support [µik, µik]. µik is realized with the highest possible demand intercept (aik)
and the lowest possible unit cost (cik); µikis realized instead under the opposite extreme
scenario, i.e., with aik and cik. We denote with Eµik the expected value of profitability
in market i for a domestic firm selling good k.
To simplify notation, in what follows, we drop country and sector subscripts, with
the understanding that country variables refer to foreign market i and sectoral variables
refer to industry k. The minimum level of profitability that guarantees that a firm earns
11In what follows, we will assume that the fixed cost of setting up a foreign subsidiary in a givenmarket is independent of whether a firm has already exported to that market. At the end of the section,we discuss the implications of relaxing this assumption.
6

positive profits by entering the foreign market via exports is12
µE # (FE)1/2 +!
2. (3)
We assume the following:
Assumption 1 µ < ! and µ > µE.
The restriction µ < ! ensures that, even if there are no fixed costs associated with
exports (FE = 0), exporting is not always profitable; µ > µE guarantees that exporting
can be profitable under some realizations of µ.
Opening a foreign subsidiary yields positive profits only if µ exceeds the following
threshold:13
µI # (F I)1/2. (4)
To make sure that FDI is profitable for some realizations of µ, we impose the following
restriction:
Assumption 2 µ < µI < µ.
Finally, for the choice between export and horizontal FDI to be interesting, firms must
face a proximity-concentration tradeo!. We thus assume the following:
Assumption 3 µE < µI.
This guarantees that the fixed costs of setting up a foreign subsidiary are large enough
that FDI does not always dominate exports.
12To verify this, notice that profits from entering the foreign market via exports can be written as#E = (µ" qE " !)qE "FE . Maximizing #E with respect to qE yields optimal export sales, qE = µ"!
2,
which are positive for µ > ! . Export profits can then be rewritten as
#E =!µ" !
2
"2
" FE .
It is straightforward to verify that this expression is positive µ > (FE)1/2 + !2.
13Profits from FDI entry can be written as #I = (µ " qI)qI " F I . Maximizing this function withrespect to qI yields optimal foreign a"liate sales, qI = µ
2. Profits from establishing a foreign a"liate
can then be written as
#I =!µ
2
"2
" F I ,
which is positive for µ > (F I)1/2.
7

3.2 Timing and entry strategies
For simplicity, and without loss of generality, we assume that the firm does not discount
the future. The timing of decisions is as follows:
t = 1: the firm chooses between exporting to the foreign market, setting up a
foreign subsidiary, or not entering the market at all. If the firm decides to enter
via exports (FDI), it pays the per-destination fixed cost FE (F I) and chooses how
much to sell in that period. At the end of this period, if the firm has sold a positive
amount, it infers µ from its profit.
t = 2: If the firm has not entered the foreign market at t = 1, it decides whether
or not to do so. If the firm has entered at t = 1, it decides whether to exit the
foreign market, serve it under the same mode, or switch mode.
The setup is similar to Jovanovic (1982)’s model of firm dynamics, in which individuals
are uncertain about their entrepreneurial ability and can only discover it through the
process of starting a new firm. In our model, firms can only find out their profitability in
a foreign market if they actually operate there, either through exports or through FDI.
Firms choose between three possible entry strategies:
a) No entry in the foreign market at t = 1.
b) Entry via exports at t = 1: in the first period, the firm pays the fixed cost FE,
exports to the foreign market and discovers its profitability; in the second period,
it decides whether to continue serving the foreign market through exports, switch
to FDI, or exit;
c) Entry via FDI at t = 1: in the first period, the firm pays the fixed cost F I and
serves the foreign market through its foreign subsidiary; in the second period, the
firm decides whether to continue serving the foreign market through FDI, switch
to exports, or exit;
In what follows, we solve for the firm’s optimal decisions by backward induction.
3.3 Period t = 2
a) No entry at t = 1
In this case, the firm does not enter the foreign market in the second period, earning
zero profits.
8
b) Entry via exports at t = 1
Consider a firm that has exported to the foreign market in the first period and discovered
its profitability µ. In the second period, it must decide whether to continue exporting,
open a foreign subsidiary, or exit the foreign market. If the firm continues to export, its
second-period profits are given by
"EE(!) # (µ" ! " qEE)qEE. (5)
The firm will choose qEE so as to maximize (5), which yields second-period export sales
equal to
qEE(!) = K{µ>!}µ" !
2, (6)
where K{.} is an indicator variable, here denoting whether µ > ! . Notice that for lower
levels of realized profitability (i.e., µ $ !), export sales will be equal to zero. Plugging
(6) into (5), we can rewrite second-period export profits as
"EE(!) = K{µ>!}
!µ" !
2
"2
. (7)
Alternatively, after discovering its profitability in the foreign market, the firm can decide
to switch to FDI. In this case, its second-period profit will be given by
"EI(F I) # (µ" qEI)qEI" F I . (8)
Notice that second-period FDI profits are positive only if µ exceeds the threshold µI
defined in equation (4). Maximization of (8) yields the optimal quantity decision
qEI = K{µ>µI}µ
2. (9)
The profits obtained from establishing a production facility at t = 2 are thus equal to
"EI(F I) = K{µ>µI}
!µ2
4" F I
"
. (10)
Comparing (10) with (7), we can derive the profitability threshold above which a
firm that has exported to the foreign market in the first period will switch to FDI in the
9
second period:
µEI #2F I
!+
!
2. (11)
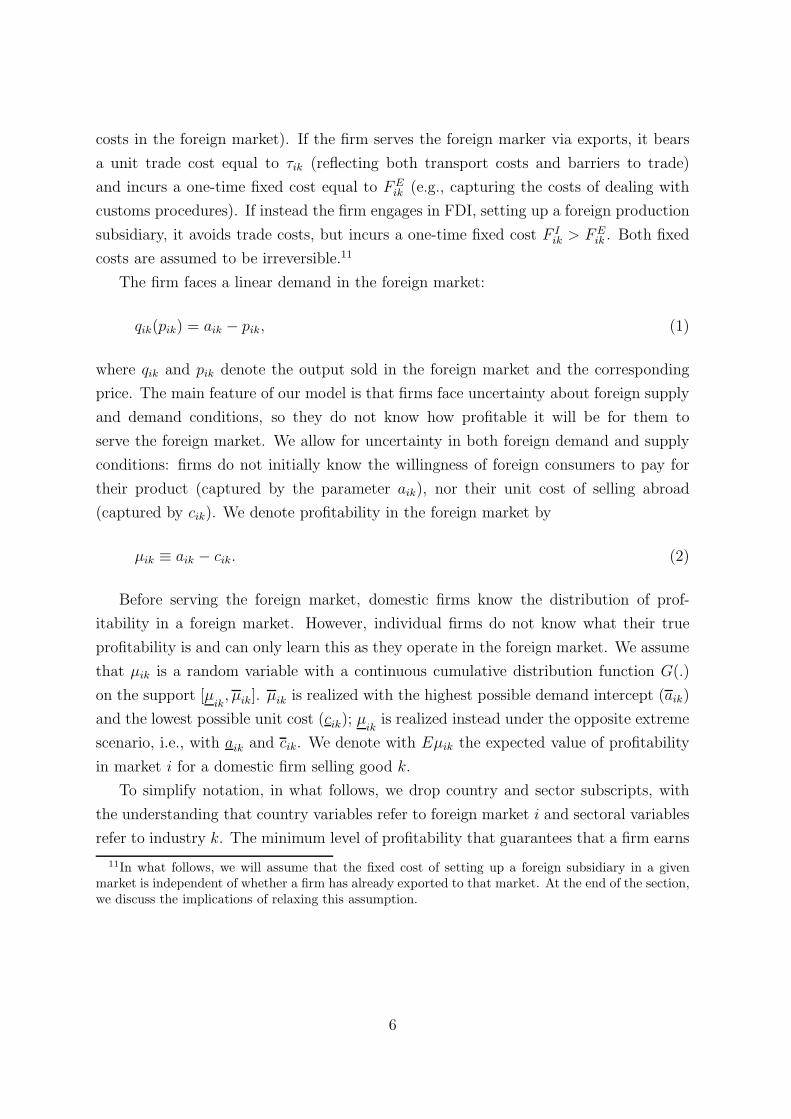
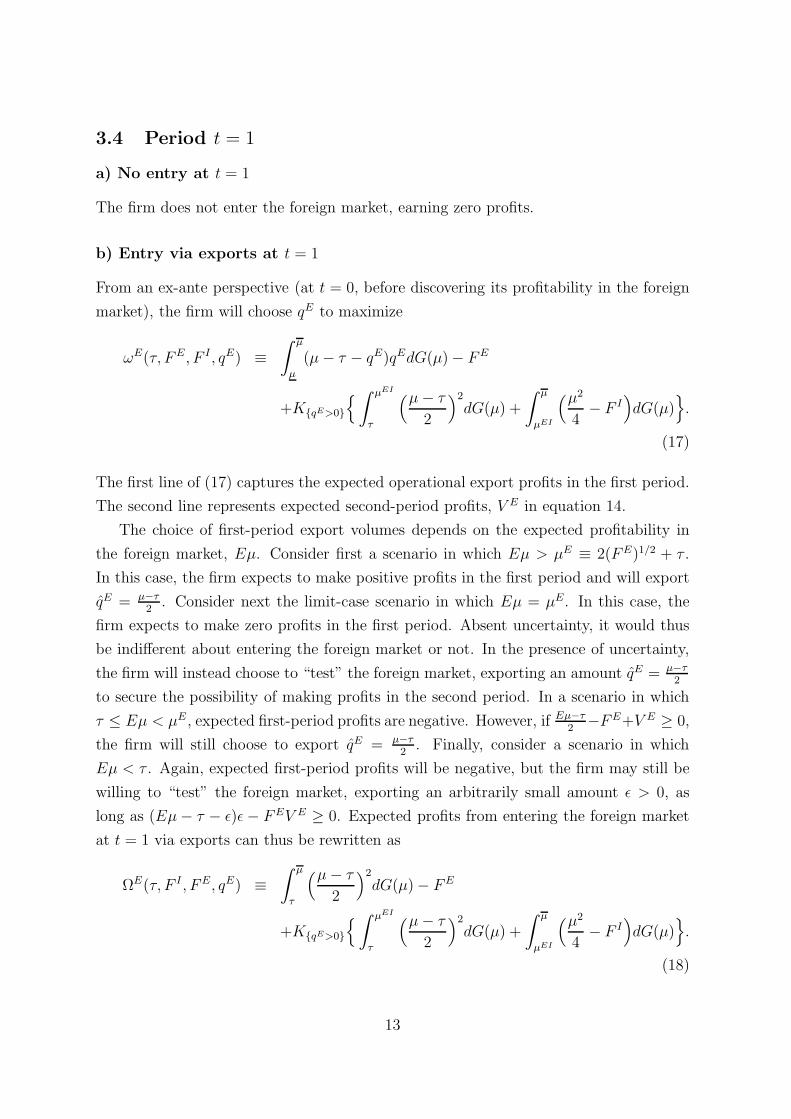
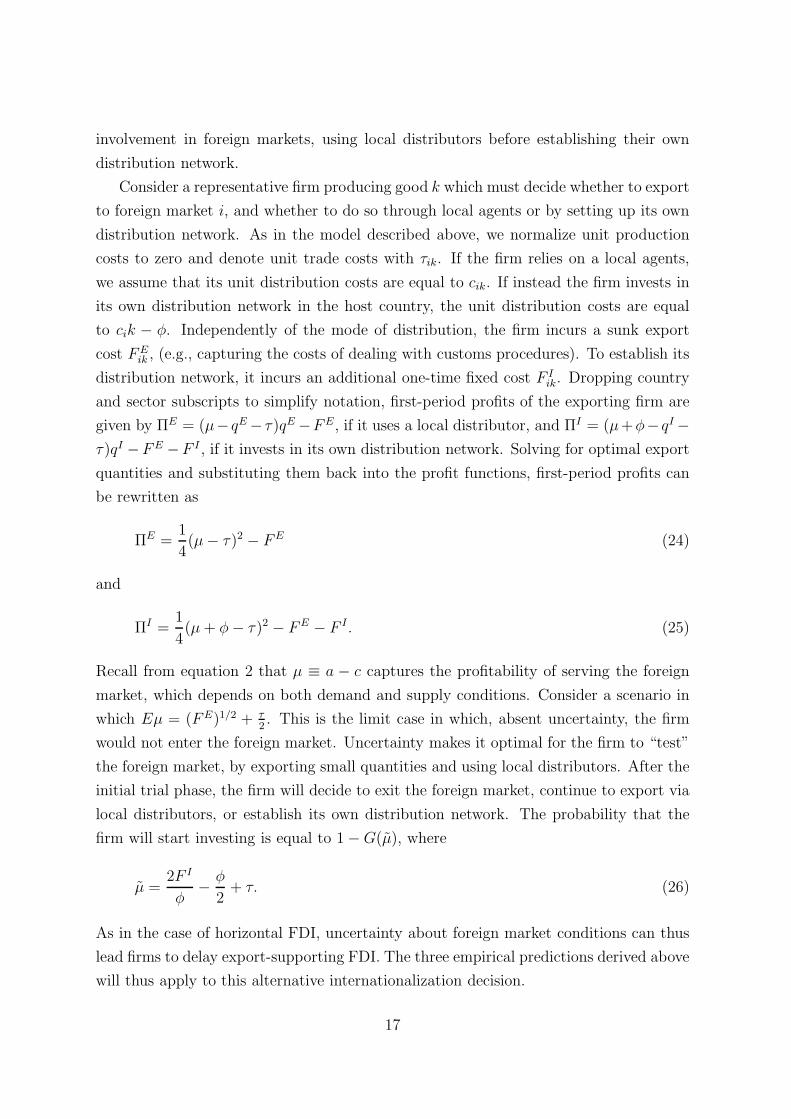
Figure 1 illustrates second-period profits for a firm that has exported to the foreign
market in the first period. The firm’s decision on whether to switch from export to FDI
in the second period depends on its profitability in the foreign market, discovered at the
end of the first period. If µ is below the trade cost ! , serving the foreign market is not
profitable and the firm will exit. If profitability lies in the range between ! and µEI , the
firm will continue to serve the foreign market via exports. If instead µ is higher than
µEI , the firm will open a foreign production subsidiary.
Figure 1: Export and FDI profits at t = 2 following entry via exports at t = 1
Ex ante, the firm anticipates that, after exporting a positive amount in the first
period, it may be forced to exit the foreign market in the second period, if it discovers
that its profitability µ is below ! . If instead ! < µ < µEI , the firms will continue to
export. Finally, if the firm discovers that its profitability exceeds µEI , it will establish a
foreign production subsidiary . We can thus state the following:
Proposition 1 A firm entering the foreign market via exports at t = 1, will exit the
market at t = 2 with probability G(!), will continue to export with probability G(µEI)"
10

G(!), or switch to FDI with probability 1"G(µEI).
A decrease in the fixed costs of establishing a foreign production plant and an increase
in trade costs make a switch from exports to FDI more appealing. To verify this, notice
that the threshold µEI increases with the fixed costs of setting up a foreign subsidiary
#µEI
#F I=
2
!> 0 (12)
and decreases with the extend of the trade costs14
#µEI
#!=
1
2"
2F I
! 2< 0. (13)
From an ex-ante perspective (i.e., evaluated at t = 0), second-period profits of a firm
exporting to the foreign market in the first period can be written as
V E(!, F I) =
# µEI
!
!µ" !
2
"2
dG(µ) +
# µ
µEI
!µ2
4" F I
"
dG(µ). (14)
Equation (14) captures the option value of serving the foreign market in the second
period, once the firm has discovered its profitability. The term$ µEI
!
!
µ!!2
"2
dG(µ) reflects
the option value of continuing to export, while the term$ µµEI
!
µ2
4" F I
"
dG(µ) captures
the option value of switching to FDI.
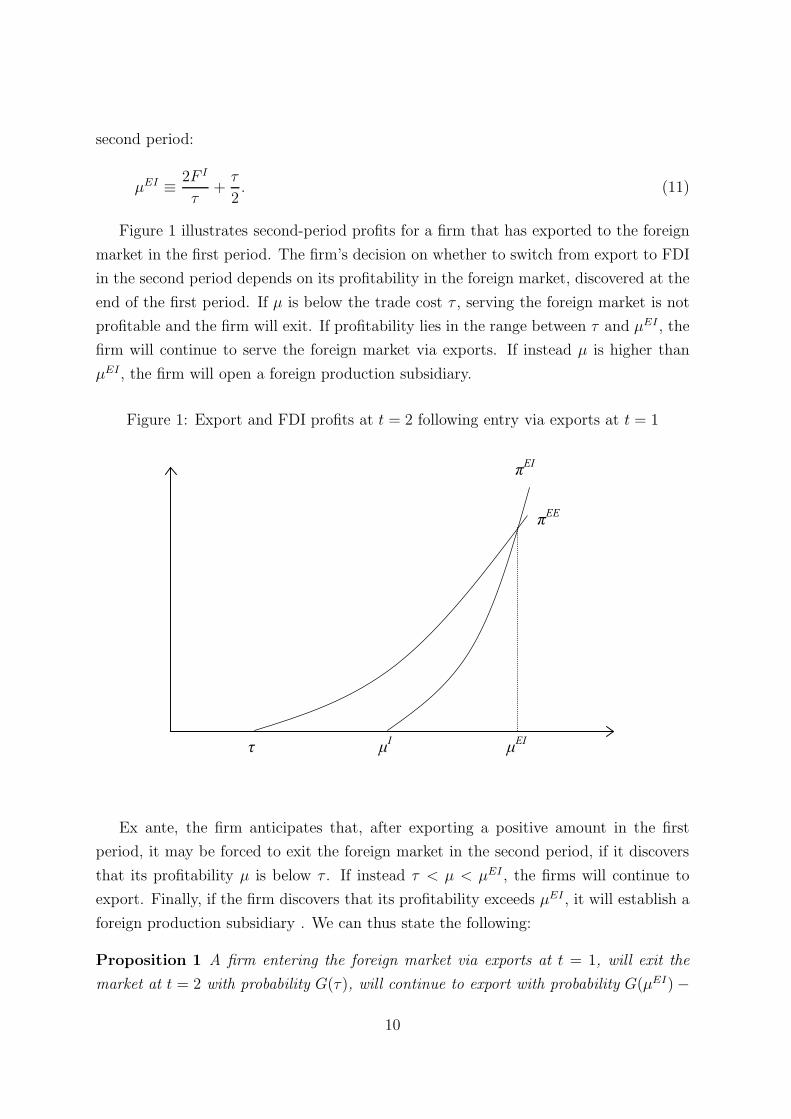
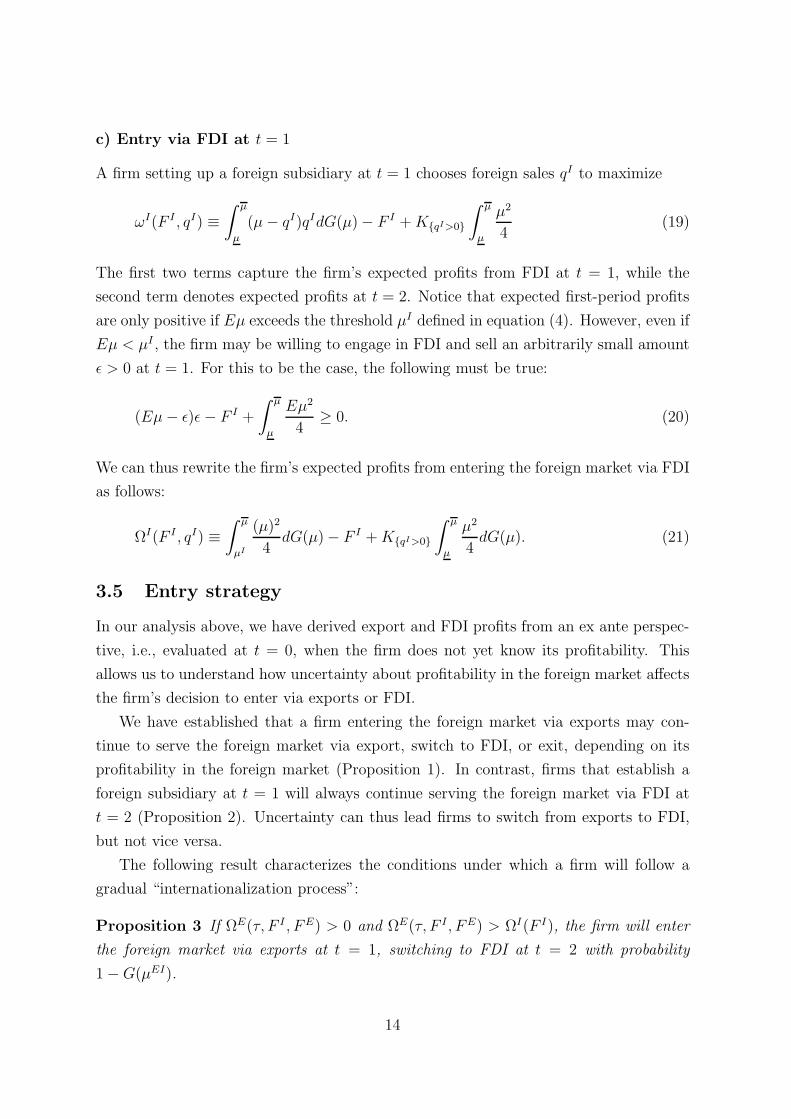
c) Entry via FDI at t = 1
Finally, consider the case in which the firm establishes a production facility in the foreign
market at t = 1 , paying the fixed costs F I . In this case, second-period FDI profits are
equal to "II = (µ" qII)qII . Plugging in optimal subsidiary sales, this expression can be
rewritten as
"II =µ2
4. (15)
Notice that second-period FDI profits can never be negative, implying that exiting the
foreign market at t = 2 is a dominated strategy.
Exporting in the second period, after having opened a subsidiary in the first, is also
a dominated strategy. To verify this, notice that a firm switching to exports at t = 2
14To verify this, notice that F I > 1
4(2(FE)1/2 + !)2 by Assumption 3. This implies that 2F I
!2 > 1
2
and thus "µEI
"! < 0.
11
Figure 2: Export and FDI profits at t = 2 following entry via FDI at t = 1
will earn profits equal to
"IE(!, FE) = K{µ>µE}
!!µ" !
2
"2
" FE"
. (16)
Comparing (16) with (15), it is straightforward to verify that, for any level of profitability
µ, #II > #IE(!, FE). Thus continuing to serve the foreign market through foreign
subsidiary sales is always preferable to the option of switching to exports. The intuition
for this result is simple: once a firm has paid the fixed costs F I , starting to serve the
foreign market via exports would imply paying additional fixed costs FE and trade costs
! . We can thus state the following:
Proposition 2 A firm entering the foreign market via FDI at t = 1 will never exit or
switch to exports at t = 2.
Having derived the firm’s expected profits in the second period, we can now move to
the analysis of its entry strategies in the first period.
12
3.4 Period t = 1
a) No entry at t = 1
The firm does not enter the foreign market, earning zero profits.
b) Entry via exports at t = 1
From an ex-ante perspective (at t = 0, before discovering its profitability in the foreign
market), the firm will choose qE to maximize
$E(!, FE, F I , qE) #
# µ
µ
(µ" ! " qE)qEdG(µ)" FE
+K{qE>0}
%
# µEI
!
!µ" !
2
"2
dG(µ) +
# µ
µEI
!µ2
4" F I
"
dG(µ)&
.
(17)
The first line of (17) captures the expected operational export profits in the first period.
The second line represents expected second-period profits, V E in equation 14.
The choice of first-period export volumes depends on the expected profitability in
the foreign market, Eµ. Consider first a scenario in which Eµ > µE # 2(FE)1/2 + ! .
In this case, the firm expects to make positive profits in the first period and will export
qE = µ!!2. Consider next the limit-case scenario in which Eµ = µE. In this case, the
firm expects to make zero profits in the first period. Absent uncertainty, it would thus
be indi!erent about entering the foreign market or not. In the presence of uncertainty,
the firm will instead choose to “test” the foreign market, exporting an amount qE = µ!!2
to secure the possibility of making profits in the second period. In a scenario in which
! $ Eµ < µE , expected first-period profits are negative. However, if Eµ!!2
"FE+V E % 0,
the firm will still choose to export qE = µ!!2. Finally, consider a scenario in which
Eµ < ! . Again, expected first-period profits will be negative, but the firm may still be
willing to “test” the foreign market, exporting an arbitrarily small amount % > 0, as
long as (Eµ" ! " %)%" FEV E % 0. Expected profits from entering the foreign market
at t = 1 via exports can thus be rewritten as
$E(!, F I , FE, qE) #
# µ
!
!µ" !
2
"2
dG(µ)" FE
+K{qE>0}
%
# µEI
!
!µ" !
2
"2
dG(µ) +
# µ
µEI
!µ2
4" F I
"
dG(µ)&
.
(18)
13
c) Entry via FDI at t = 1
A firm setting up a foreign subsidiary at t = 1 chooses foreign sales qI to maximize
$I(F I , qI) #
# µ
µ
(µ" qI)qIdG(µ)" F I +K{qI>0}
# µ
µ
µ2
4(19)
The first two terms capture the firm’s expected profits from FDI at t = 1, while the
second term denotes expected profits at t = 2. Notice that expected first-period profits
are only positive if Eµ exceeds the threshold µI defined in equation (4). However, even if
Eµ < µI , the firm may be willing to engage in FDI and sell an arbitrarily small amount
% > 0 at t = 1. For this to be the case, the following must be true:
(Eµ" %)%" F I +
# µ
µ
Eµ2
4% 0. (20)
We can thus rewrite the firm’s expected profits from entering the foreign market via FDI
as follows:
$I(F I , qI) #
# µ
µI
(µ)2
4dG(µ)" F I +K{qI>0}
# µ
µ
µ2
4dG(µ). (21)
3.5 Entry strategy
In our analysis above, we have derived export and FDI profits from an ex ante perspec-
tive, i.e., evaluated at t = 0, when the firm does not yet know its profitability. This
allows us to understand how uncertainty about profitability in the foreign market a!ects
the firm’s decision to enter via exports or FDI.
We have established that a firm entering the foreign market via exports may con-
tinue to serve the foreign market via export, switch to FDI, or exit, depending on its
profitability in the foreign market (Proposition 1). In contrast, firms that establish a
foreign subsidiary at t = 1 will always continue serving the foreign market via FDI at
t = 2 (Proposition 2). Uncertainty can thus lead firms to switch from exports to FDI,
but not vice versa.
The following result characterizes the conditions under which a firm will follow a
gradual “internationalization process”:
Proposition 3 If $E(!, F I , FE) > 0 and $E(!, F I , FE) > $I(F I), the firm will enter
the foreign market via exports at t = 1, switching to FDI at t = 2 with probability
1"G(µEI).
14
We can show that, when “experimentation” matters, the firm will always follow this
process of gradual involvement in the foreign market. To verify this, consider again
a scenario in which Eµ = µE . In this case, the firm anticipates that, if it enters via
exports, it will make zero profits in the first period, but positive profits in the second:
$E(!, F I , FE) =
# µEI
!
!µ" !
2
"2
dG(µ)
# µ
µEI
!µ2
4" F I
"
dG(µ) > 0. (22)
In contrast, when Eµ = µE, expected profits from FDI entry are negative:15
$I(F I) =Eµ2
4=
((FE)1/2 + !2)2
4" F I < 0. (23)
Thus, uncertainty about foreign demand and supply conditions can lead a firm to “ex-
periment” by exporting small amounts first. Following this “trial” phase, the firm will
either exit, expand its export volumes, or switch to FDI.
In our model, exports and horizontal FDI are substitutes from a static perspective,
since they represent alternative ways through which firms serve foreign markets, but may
be dynamic complements, since the market-specific knowledge acquired through exports
experience can lead firms to set up foreign production plants.
Contrary to the predictions of standard models of the proximity concentration trade-
o! that abstract from uncertainty, our analysis also implies that trade liberalization may
foster FDI, by lowering the cost of export experimentation. To verify this, consider a
scenario in which trade costs are initially such that Eµ > ! > Eµ " 2(FE)1/2. In
this case, first-period expected profits from entering the foreign market via exports are
negative. If the first-period loss exceeds the option value of serving the foreign market
in the second period, captured by V E in equation (14), the firm will choose not serve the
foreign market. Now assume that trade costs are reduced to ! = Eµ" 2(FE)1/2. In this
case, the firm will expect to make zero profits by entering the foreign market at t = 1,
but will be willing to export a small amount equal to Eµ!!2
to secure the possibility of
positive profits in the future. In turn, export experimentation will lead firms to switch
to FDI in at t = 2 with a probability 1"G(µEI). We can thus state the following:
Proposition 4 In the presence of uncertainty, trade liberalization can foster FDI, by
lowering the cost of experimenting in foreign markets.
In our analysis above, we have assumed that the fixed cost of establishing a pro-
duction facility in a foreign market is independent of whether the firm has previously
15This follows from Assumption 3.
15
exported to that market. This will be the case if FE includes only costs that are specific
to exporting (e.g., dealing with customs procedures) and F I captures only FDI costs
(e.g., building a plant in the foreign country). However, serving a foreign market may
also involve fixed costs that are common to both exports and FDI (e.g., establishing dis-
tribution channels, designing a marketing strategy, dealing with foreign bureaucracies).
In this case, the fixed costs of exports and FDI could be rewritten as FE = K + fE and
F I = K + f I , respectively, with f I > fE. Notice that the main results of our analysis
(Propositions 4- 3) would continue to hold under this alternative formulation of the fixed
costs. However, a switch from exports to FDI would be more likely.16
To summarize, our theoretical model gives rise to the following empirical predictions:
1. Uncertainty can lead firms to “test” foreign markets via exports.
2. Following an initial “trial phase”, firms will either exit, expand export volumes, or
engage in FDI.
3. A firm’s export experience in a foreign market should a!ect its decision to start
investing there, particularly in the face of more uncertain demand and supply
conditions.
3.6 Export-supporting FDI
In line with standard models of the proximity concentration tradeo! (e.g., Markusen,
1984; Brainard, 1997; Helpman et al., 2004), our paper focuses on firms’ choice between
serving a foreign market via exports and establishing foreign production facilities.
Recent studies (e.g., Krautheim, 2007; Arkolakis, 2010; Aeberhardt et al., 2009)
have emphasized the importance of “export-supporting FDI”, i.e., investments in foreign
subsidiaries established to set up distribution centers and sales o"ces to penetrate export
markets. In the remaining of this section, we show that the logic of our theoretical model
can be applied to a setting in which exporting firms decide between distributing their
exports through a local agent and establishing their own distribution network.
In this case, firms face a tradeo! between the higher variable costs of using local
distributors and the higher fixed costs of setting up foreign distribution centers and
sales o"ces. We can derive conditions under which firms will follow a process of gradual
16Under this alternative formulation, the profitability threshold above a firm exporting at t = 1 will
find it optimal to set up a foreign subsidiary at t = 2 is equal to µEI# = 2fI
! + !2< µEI . The probability
of a switch from export to FDI will thus be 1"G(µEI#) > 1"G(µEI).
16
involvement in foreign markets, using local distributors before establishing their own
distribution network.
Consider a representative firm producing good k which must decide whether to export
to foreign market i, and whether to do so through local agents or by setting up its own
distribution network. As in the model described above, we normalize unit production
costs to zero and denote unit trade costs with !ik. If the firm relies on a local agents,
we assume that its unit distribution costs are equal to cik. If instead the firm invests in
its own distribution network in the host country, the unit distribution costs are equal
to cik " &. Independently of the mode of distribution, the firm incurs a sunk export
cost FEik , (e.g., capturing the costs of dealing with customs procedures). To establish its
distribution network, it incurs an additional one-time fixed cost F Iik. Dropping country
and sector subscripts to simplify notation, first-period profits of the exporting firm are
given by #E = (µ" qE" !)qE "FE, if it uses a local distributor, and #I = (µ+&" qI "
!)qI "FE "F I , if it invests in its own distribution network. Solving for optimal export
quantities and substituting them back into the profit functions, first-period profits can
be rewritten as
#E =1
4(µ" !)2 " FE (24)
and
#I =1
4(µ+ &" !)2 " FE " F I . (25)
Recall from equation 2 that µ # a " c captures the profitability of serving the foreign
market, which depends on both demand and supply conditions. Consider a scenario in
which Eµ = (FE)1/2 + !2. This is the limit case in which, absent uncertainty, the firm
would not enter the foreign market. Uncertainty makes it optimal for the firm to “test”
the foreign market, by exporting small quantities and using local distributors. After the
initial trial phase, the firm will decide to exit the foreign market, continue to export via
local distributors, or establish its own distribution network. The probability that the
firm will start investing is equal to 1"G(µ), where
µ =2F I
&"
&
2+ !. (26)
As in the case of horizontal FDI, uncertainty about foreign market conditions can thus
lead firms to delay export-supporting FDI. The three empirical predictions derived above
will thus apply to this alternative internationalization decision.
17
Notice, however, that investments aimed at facilitating export activities di!er from
horizontal FDI in two important ways. First, exports should increase (rather than
decrease) following FDI. Second, higher trade barriers should decrease (rather than
increase) the likelihood that an exporting firm starts engaging in FDI. To verify this,
notice that the threshold identified by equation (26) is increasing in the extent of trade
costs. The intuition for this result is simple: trade costs reduce the volume of exports
over which the firm can amortize the fixed costs F I .
4 Datasets and variables
The goal of our empirical analysis is to assess the validity of the predictions of our model
on firms’ decisions on how to serve foreign markets over time. For this purpose, we use
di!erent datasets from the National Bank of Belgium (NBB), which provide detailed
information on firms’ operations in individual foreign markets, covering the whole pop-
ulation of companies registered in Belgium since the early 1990’s. This information can
be linked to firm-level accounts through the value added tax (VAT) number, a unique
code identifying each firm.
In general, firms can serve foreign buyers through three main channels: they can
export their products to foreign customers, serve them through foreign subsidiaries, or
license foreign firms to produce their products. In line with our theoretical model, and
given the very limited role played by licensing,17 we focus on the first two channels.
In this section, we first describe all the variables used in our empirical analysis (see
Table A-1 in the Appendix). We then provide some descriptive statistics for the main
variables of interests.
4.1 Export data
Annual data on exports since 1993 come from the NBB Foreign Trade dataset, which
allows us to identify the countries to which a firm is exporting in a given year. Trade
data on individual transactions concerning exports or imports are collected separately
at company level for intra-EU (Intrastat) and extra-EU (Extrastat) trade. For each
transaction, this data gives the product code, the type of transaction, and the destination
or origin of the goods, the value, the net mass and units.
In our analysis, we use information from Extrastat, since we examine foreign activities
of Belgian firms outside the EU Single Market, in which Belgian firms are likely to face
17Only a tiny minority of Belgian firms (i.e., less than 0.4%) engage in foreign markets via licensing.
18

more uncertain market conditions.18 Extrastat contains exact information on trade flows
with countries outside the European Union. The data is collected by customs agents
and centralized at the NBB. It covers a larger share of the total trade transactions than
Intrastat data, since all flows are recorded (unless their value is smaller than 1,000 euro
or their weight is less than 1,000 Kg).19
4.2 FDI data
Data on FDI comes from the yearly Survey on Foreign Direct Investment of National
Bank of Belgium. Conducted on a yearly basis since 1997,the survey provides informa-
tion on firms involved in foreign direct investment relations. FDI is defined as inter-
national investments through which a resident entity in one economy acquires or has
acquired a lasting interest in a resident entity of another economy than that of the in-
vestor. The Survey on Foreign Direct Investment includes all companies holding at least
10 percent of the social capital of foreign firms and those of which at least 10 percent
of the shares are owned by foreign investors. All these firms are required to report their
FDI stocks and flows in individual foreign countries as of the 31st December of the
previous year.
Data in the Survey on Foreign Direct Investment is organized into investment “projects”.
In line with our theoretical model, we are interested in the determinants of a firm’s de-
cision to start investing in a foreign country, rather than on the timing of di!erent
investment projects. We thus focus on the first FDI entry (i.e., the first time a Belgian
firm opens a subsidiary in given foreign market), aggregating all FDI projects that a
firm has in a foreign country in a given year.20
As stressed in the introduction, Markusen and Maskus (2003) and Blonigen (2005)
argue that most FDI is horizontal in nature. Indeed, UNCTAD (2011) reports that over
the period 1990-2010 less than 20 percent of foreign a"liate sales worldwide is exported
outside the host country, suggesting that most FDI is mostly driven by market-access
considerations.
Unfortunately, the Survey on Foreign Direct Investment does not contain information
18The EU Single Market comprises the 27 EU Member States plus Iceland, Liechtenstein and Norwaythrough the European Economic Area. Switzerland is also considered part of it because it has a seriesof bilateral treaties with the EU.
19By focusing on destinations outside the EU Single Market and relying on customs data, we alsoavoid problems of time inconsistency of firms’ export status. These arise when using the Intrastatdataset, due to changes in the threshold used to define which firms have to report exports. See Muulsand Pisu (2007) for a detailed discussion of the NBB trade datasets.
20See Ra! and Ryan (2008) for an analysis of the timing of FDI projects in a given country usingJapanese manufacturing data.
19
on sales of foreign a"liates, which would help us to directly identify foreign investments
aimed at serving customers in the host country. However, other kinds of data from the
NBB can be used to indirectly distinguish di!erent types of FDI. For example, we can
use information on the evolution of a firm’s exports to a foreign country before and after
it starts investing in that country. In some instances, firm’s exports dramatically fall
after FDI entry, suggesting horizontal FDI. This is the case, for example, of a Belgian
pharmaceutical company that started exporting to the United States in 1999 and opened
its first foreign a"liate there in 2002: in the three years between export and FDI entry,
the firm’s exports grew by 189 percent, while in the three subsequent years they de-
creased by 88 percent. In other cases, a firm’s export exhibit a strong increase following
FDI entry, suggesting export-supporting FDI. This is the case, for example, of a Belgian
company producing industrial process control equipment which started investing in the
United States in 2000, after three years of export experience: in the three years before
FDI entry, the firm’s exports grew by 51 percent, while in the following three years they
grew by 404 percent. As stressed in Section 3.6, the logic of our theoretical model applies
not only to horizontal FDI – investments in foreign subsidiaries established to serve the
host country – but also to export-supporting FDI – investments in foreign distribution
centers and sales o"ces to penetrate export markets.
In some robustness checks, we use information on intra-firm trade from the Survey
on Foreign Direct Investment (i.e., data on trade between Belgian firms and their for-
eign a"liates) to rule out some FDI entries as being potentially vertical in nature. In
particular, we can exclude from our empirical analysis FDI entries that give rise to “sub-
stantial” imports from foreign a"liates (exceeding a given share of the a"liate’s value
added).
4.3 Firm-level controls
The Central Balance Sheet O"ce of the NBB collects the annual accounts of all com-
panies registered in Belgium. They provide measures for firms’ value added, turnover,
intermediate consumption, employment, and capital stock. Using this data, we con-
trol for firm heterogeneity: the variable Employmentf,t measures the number of full-time
equivalent employees and is used as a proxy for firm size; and the variable Productivityf,t
measures the firm’s value added per employee.
We also exploit information concerning foreign ownership and multinational status
from the Survey on Foreign Direct Investment described above. In this way, we define
the dummy (MNEf,t) when a Belgian firm is a multinational enterprise (i.e., it is the
20

recipient of foreign FDI) following the IMF’s Balance of Payments Manual.21
Our theoretical model shows that, when faced by uncertain market conditions in
foreign markets, a firm may find it optimal to “test” a foreign markets via exports,
before possibly switching to FDI. In particular, our model suggests that a firm’s decision
to establish foreign a"liates in a foreign market may depend on its export experience in
that market. To examine the role of export experience in explaining FDI entry decisions,
we use data from the NBB Foreign Trade dataset to define the variable Export entryf,i,t,
which is coded as 1 when firm f starts exporting to country i in year t, not having
exported to that country for at least the previous four consecutive years. Notice that
this definition is more stringent than the one used in recent empirical studies of export
dynamics (e.g., Eaton et al., 2008; Ruhl and Willis, 2008). In these studies, any firm that
exports to a given market in a particular year, after at least one year of no exporting, is
classified as a “new exporter”. We use a more stringent definition for two reasons. First,
since we are interested in verifying whether uncertainty about foreign market conditions
a!ects the dynamics of firms’ internationalization choices, we do not want to classify as
“new exporters” firms that may have simply interrupted exports for one year and may
have already acquired a lot of experience in a foreign market. Second, since we have
export data from 1993 and can observe FDI entries as of 1997, our definition of export
entry avoids the problem of left censoring when defining the export experience of firms
that start investing in a foreign market.
The variable Experiencef,i,t measures the number of years a firm f has been exporting
to country i since it started serving it. In our analysis, we control for other sources of
learning and experience, which might also a!ect a firm’s decision to start investing in a
given country. To capture possible learning spillovers across markets, we construct the
variables Exports in regionf,r,t!1 and FDI in regionf,r,t!1, which measure respectively the
number of countries in continent r in which firm f is exporting to and in which it has
foreign a"liates at t" 1.22
Finally, when comparing the internationalization choices of individual firms in dif-
ferent markets, we can include firm fixed e!ects, which allow us to control for the role
of unobserved time-invariant firm characteristics.21According to this definition, a multinational enterprise is one in which a foreign investor owns,
either directly or indirectly, 10 percent or more of its capital or voting power. All companies operatingin Belgium which fall into this category are obliged to fill in the questionnaire by law. This appliesto firms resident in Belgium in which a foreign investor holds a stake, i.e., foreign-owned firms, and toBelgian companies having a stake in enterprises operating abroad, i.e. Belgian multinationals.
22It may also be the case that a Belgian firm learns through spillover e!ects from other Belgian firmsserving the same market with exports or FDI. These are sectoral variables which are discussed in therelevant subsection.
21
4.4 Country-level controls
We have collected standard macro variables that can a!ect firms’ decision to serve a
foreign market, such as GDPi,t and GDP per capitai,t, which proxy for the size of the
destination market and its level of development.
We also include in our analysis information on countries’ regulatory environment from
Kaufmann et al. (2009). The index Regulationi,t captures perceptions of the ability of
the government of country i to formulate and implement sound policies and regulations
aimed at promoting private sector development (with higher values indicating better
regulatory environments), which should clearly a!ect firms’ decision to engage in FDI
in a country.23 To proxy for uncertainty in a country’s regulations, we compute the
variable Variance Regulationi (over the period 1997-2008).
We also use dummy variables from CEPII to control for cultural similarities (Common
Languagei and Colonyi) and we use data from the International Centre for Settlement
of Investment Disputes (ICSID) to construct a dummy variable on whether a foreign
country has a bilateral investment treaty with Belgium (BITi,t).
Finally, when comparing the internationalization choices of di!erent firms in indi-
vidual foreign markets, we can include country fixed e!ects to control for the role of
time-invariant country characteristics.
4.5 Sectoral controls
Our theoretical model suggests that the dynamics of firms’ internationalization choices
should depend, among other things, on uncertainty in foreign demand. We would ex-
pect firms that are more uncertain about preferences of foreign consumers or about the
adequacy of their products to local tastes to follow a more gradual internationalization
process. To verify this prediction, we construct the variable Di!erentiatedk, which mea-
sures the degree of product di!erentiation of the industry in which a given firm operates.
To construct this measure, we rely on the well-known index devised by Rauch (1999),
who classifies products according to three di!erent types: homogeneous goods, which
are traded in organized exchanges; goods that are are not traded in organized exchanges,
but for which a published reference price can be found; and di!erentiated goods, which
fall under neither of the two previous categories.
To apply Rauch (1999)’s measure to our analysis, we had to match the sector classi-
fication used in his analysis (SITC Rev.2 at 4 digits) with the NACE classification used
23We have also tried including the variable Rule of lawi,t from Kaufmann et al. (2009), obtainingsimilar results.
22
in the Belgian data. To do so, we proceeded in two steps. First, we used the conversion
tables by A!endy et al. (2010) to map SITC Rev.2 4-digit sectors into ISIC Rev.2 4-digit
sectors. For each ISIC code, we computed the fraction of subsectors that are classified
as being di!erentiated according to Rauch. Second, using correspondences from Euro-
stat, we mapped ISIC Rev.2 4-digit sectors into NACE Rev.1 3-digit sectors.24 For each
3-digit NACE manufacturing industry, we then constructed the variable Di!erentiatedk,
which measures the share of subsectors of industry k that are classified by Rauch (1999)
as being di!erentiated.25
Our theoretical model focuses on the acquisition of market-specific knowledge by
individual firms. In our empirical analysis, we also try to account for possible learning
spillovers between Belgian firms by constructing the variables Exports by other firmsi,t!1,k
and FDI by other firmsi,t!1,k. These regressors measure, respectively, the number of
Belgian firms in sector k (at the 2-digit NACE) exporting or having foreign a"liates in
country i at t" 1.
When comparing the internationalization choices of di!erent firms, we can also in-
clude sector fixed e!ects, which allow us to control for the role of any time-invariant
sectoral characteristics.26
4.6 Trade costs
Trade costs include both transport costs and trade barriers. To control for transport
costs, we use the variable Distancei, which measures the distance between the capital of
Belgium and the capital of country i.
To control for trade barriers, we constructed time-varying measures of applied tari!s
by sector and destination, starting from the disaggregate tari! line data available in the
World Integrated Trade Solution (WITS). The procedure to construct average tari!s is
rather cumbersome and involves di!erent steps. The original tari! data are reported
at the 6-digit level of the Harmonized System (HS6), while the activity of a firm, as
identified in the Belgian annual accounts, is defined by a 5-digit code from the NACE
classification. We thus aggregated HS data into NACE codes, taking into account that
24This level of aggregation minimizes the number of multiple matches, since NACE activities at the3-digit level are comparable to ISIC activities at the 4-digit level.
25For example, NACE sector 156 (Manufacture of grain mill products, starches and starch products)matches into 2 ISIC codes, 1531 and 1532, which themselves are matched to various SITC codes. ForISIC sector 1531, 4 out of 9 SITC goods are classified by Rauch as being di!erentiated. For ISIC sector1532, 3 out of 8 SITCS subsectors are classified as di!erentiated. This implies that, for NACE sector156, 7 out of 17 subsectors are di!erentiated, so the variable Di!erentiatedk takes the value of 0.4118.
26Sector fixed e!ects cannot be included when comparing the internationalization choices of individualfirms in di!erent markets, since most firms do not change sector over time.
23
the HS classification changed various times during our sample period. In order to min-
imize the subjectivity of such procedure, we relied on the fact that WITS also reports
average tari!s aggregated at the 3 digits of the ISIC (revision 3) classification. We found
a one-to-one mapping between 3-digit ISIC and 4-digit NACE classification for about
30 percent of the NACE codes. When an ISIC code could map into more than one
NACE code, we recovered the HS6 tari! lines underlying the ISIC code and manually
assigned them to NACE codes. This procedure was straightforward for about 33 percent
of NACE codes. In the remaining cases, some discretion had to applied. For about 14
percent of the NACE codes, it was impossible to assign only one NACE code to each
given HS6. In this case, we used a higher level of aggregation by imputing the average
tari! of a given ISIC code to the NACE codes assigned to it.27 Obviously, whenever
working directly with HS6 tari! data, we tracked the changes in the HS classifications
that occurred over time to ensure consistency. Using this procedures, we have been able
to construct the variable Tari!i,t,k, which measures the average tari! applied by country
i over the previous three years vis-a-vis imports from Belgium in sector k (at the 4-digit
NACE).
5 Descriptive statistics
In this section, we provide descriptive statics for the main variables of interests in our
analysis. All the tables reporting these statistics can be found in the Appendix.
We restrict our attention to manufacturing firms (i.e., four-digit codes belonging
to sectors between 15 and 37 of NACE revision 1) and impose a threshold in terms
of employment (i.e., more than 5 employees). In terms of countries, we only consider
destinations outside the EU Single Market, in which Belgian firms are likely to face more
uncertain market conditions. We further restrict our attention to members of the WTO
(as of 2010).
5.1 Export and FDI activities
As discussed above, our interest is on export and FDI activities of Belgian firms outside
the European Single Market (SM). In Table A-2 we thus reports descriptive statistics
for all destinations and then for those ‘Outside SM’. Notice that Belgian firms are very
open: over the entire sample, on average 52 percent of firms with more than 5 employees
27In these cases, we are aggregating at a level intermediate between 3 and 4-digit NACE, since anISIC code is a subset of a 3-digit NACE code.
24
export. The number of Belgian firms is roughly constant during the sample, with the
exception of 2008, when the number of firms decreases substantially as a result of the
economic and financial crisis. The total number of exporting firms is decreasing over
time, but this observation may be partly driven by the fact that the minimum threshold
required for firms to report their intra-EU exports has significantly increased during the
period. Instead the figures regarding firms exporting outside the Single Market are not
biased, since the threshold required for firms to report their export activities outside the
EU has remained constant during the sample period (i.e., all transactions whose value is
higher than 1,000 euro or whose weight is bigger than 1,000 Kg). The number of firms
exporting outside the single market has not changed significantly during our sample,
again with the exception of 2008.
Table A-4 provides an overview of the top ten destinations and manufacturing sectors
for export and FDI activities, distinguishing between all possible destinations in the
world and those outside the Single Market. In terms of destinations, it is no surprise that
countries in Europe capture all but one of the top ten destinations, the exception being
the United States. A similar description holds true for the location of FDI activities with
the di!erence that two countries in Eastern Europe are also among the top receivers of
Belgian FDI. When restricting attention to the countries outside the Single Market, the
United States is always the top destination for both exports and FDI while the rankings
of the other countries are less correlated. For example, China is the second most popular
destination for FDI but only the ninth for exports. Overall, the concentration of FDI
activities across locations is also much higher than for export markets, as expected.
Table A-5 lists the top ten manufacturing sectors involved in export and FDI ac-
tivities, both all over the world or only outside the Single Market. Some sectors (e.g.,
manufacturing of food products and beverages; manufacture of machinery and equip-
ment) feature in top positions in all columns of the table while for some others there
is quite a bit of heterogeneity when comparing export and FDI activities by their geo-
graphical dimension.
Table A-2 shows that the number of exporting firms is a subset of total firms and
that firms engaging in outward FDI are an even smaller group (4.6 percent of the total
number of Belgian firms).28 When considering the location of foreign a"liates, it is clear
that most of them are located within the Single Market. However, the presence outside
the Single Market is clearly increasing over time and reaching a peak in 2006, when the
28FDI data have been corrected to eliminate “gap” problems (i.e., situations in which a firm reportsno FDI in a destination country in a given year, while its FDI stock was positive in the previous andsubsequent year). The correction implies inputing a 1 when the identifier of the FDI project carriedout by the firm is the same for the year before and after the occurrence of a 0.
25
number of firms with outward FDI is almost double than the number at the beginning
of the sample. Table A-3 reports the total number of export and FDI relationships (i.e.,
firm-destination pairs) that Belgian firms maintain every year. The ratio of the figures
in Tables A-2 and A-3 show that firms export to 13 countries on average. Restricting
our attention to the firms that export outside the Single Market, we see that on average
they serve 9 countries outside of the block, a number that is relatively constant over
time. With respect to FDI, firms engaging in outward FDI maintain a simultaneous
presence on average in 2.3 countries outside Single Market, a number also stable over
time.
Table A-6 provides some information on the size and productivity of Belgian firms
engaging in exports and FDI. In particular, we report summary statistics for those firms
in our sample that in the first year of our sample (1997) do not export to any country
(i.e., Domestic firms), those that export to at least one country, and those that engage
in outward FDI in at least one country.29 It should be stressed that these statistics are
based on the sample of firms that export at least once to at least one country outside of
the Single Market during our sample period. Thus, those firms defined as ‘Domestic’ in
1997 would be exporting at some other point in time and, as such, are probably larger
and more productive that truly domestic firms (i.e., firms that do not export to any
country in any period). With this caveat in mind, these descriptive statistics are in line
with the sorting patterns suggested by the literature on heterogeneous firms and trade
(e.g., Helpman et al., 2004; Head and Ries, 2003). This suggest that, at a given point in
time, the least productive firms only sell in the domestic market, the most productive
ones engage in FDI, while the remaining ones export. In our empirical analysis, we will
control for size and productivity and show that firms may change their mode of serving
a foreign market over time.
5.2 Export entry
As discussed above, in our main empirical analysis, we classify a firm as a “new exporter”
if it exports to a given market in a particular year, after at least four years of no exporting
to that market. This definition of export entry guarantees that our measure of export
experience is not left censored since we have export data since 1993 and we know of new
FDI activities since 1997. It also allows us to focus on the internationalization choices
of firms that have no previous experience in serving a given foreign market, which still
need to acquire important information about local demand and supply conditions.
29The same patterns hold for any other year in our sample period.
26

In line with the findings of recent studies on firms’ export dynamics, we find that most
new exporters sell small amounts and disappear from export markets in the following
period. Table A-8 shows that, out of all Belgian firms that enter a new market in year
t, almost 60 percent of them do not survive in the export market in the following year.
The survival probability of new exporters increases steadily in the following years: the
“death rate” four years after export entry is less than 20 percent. As shown by Figure
A-1, export volumes also increase significantly in the years following export entry. These
findings are in line with the results of recent studies on export dynamics (e.g., Eaton et
al., 2008; Aeberhardt et al., 2009; Lawless, 2009) and suggest a process of “trials and
errors”, in which firms initially test foreign markets to find out whether they can make
profits serving them.
5.3 Export experience and FDI entry
The main goal of our empirical analysis is to verify how a firm’s export experience in
a foreign market a!ects its decision to start investing there. Table A-7 presents some
statistics showing the number of firms that set up new foreign a"liates in a given year,
taking 1996 as the reference year to identify firms engaging in new FDI starting in 1997.30
The first column of Table A-7 shows that there is quite a lot of variation from year to
year, with more action in the early years of the sample. Out of the total 1,349 new
FDI a"liates, 418 were opened outside the Single Market, with the United States the
preferred destination, followed by Brazil, China (and Hong Kong), and Mexico. Table
A-7 also provides some evidence related to our theoretical model. In particular, it shows
that most of the new FDI by Belgian firms takes place in countries where these firms were
exporting beforehand (i.e., in any of the previous 4 years). Based on these figures, 73.5
percent of new a"liates were opened in countries where the Belgian firms undertaking
the FDI were previously exporting. Notice that this is a lower bound, since some firms
that start investing in a foreign market may have been exporting to it in previous years.
30FDI data for 1996 is derived from balance sheet data since the Survey of FDI only started in 1997.We compared the two sources for a common year (i.e., 1997) and the large majority of FDI reported inthe survey are also reported in the balance sheet. The converse is not necessarily the case because ofdi!erent methodologies with the survey being considered a more reliable source.
27
6 Empirical methodology and results
6.1 Empirical methodology
The central question of the literature on the proximity-concentration tradeo! is why a
firm would choose to serve a foreign market through a"liate production, rather than
exporting. Existing empirical studies address this question from a static perspective, us-
ing cross-sectional data to examine the determinants of firms’ exports and FDI decisions
(e.g., Brainard, 1997; Helpman et al., 2004; Ramondo et al., 2010).
However, the descriptive statistics of exports and FDI decisions for Belgian firms
show that the overwhelming majority of companies that start investing in a foreign mar-
ket do so only after having previously served that market via exports. This suggests
that firms’ export and FDI decisions must be understood as part of a broader dynamic
internationalization strategy, as suggested by our theoretical model. This dynamic pro-
cess calls for the use of particular econometric techniques which take into account the
nature of the phenomenon under investigation. To this end, we assess the predictions of
our model using survival analysis (also called duration analysis) which emphasizes the
time it takes for an event (i.e., FDI entry in our case) to materialize.31 Survival analysis
also takes into account the fact that the event of interest may not occur for some of the
individuals (i.e., firms) under study by the end of the sample. Still, their inclusion in
the analysis can provide valuable information. Survival analysis can be implemented in
di!erent ways but we will employ proportional hazard models, which are the most im-
portant and well-known ones. The objective of these models is to estimate the “hazard
rate” hf,i(t), which is the probability that firm f starts investing in country i at time t,
given that FDI entry did not occur earlier. The variables that can potentially explain
the occurrence of an event are represented by a set of (time varying) regressors Xf,i,k,t
that correspond to the variables that we presented in the previous Section. Formally, a
hazard model can be expressed as follows
hf,i(t) = h0(t) exp('Xf,i,k,t) (27)
where h0(t) represents the baseline hazard rate, Xf,i,k,t is the matrix of regressors and '
is the vector of coe"cients to be estimated. The formulation in (27) clarifies why this
type of models are proportional: any change in the explanatory variables results in a
new hazard rate hf,i(t) that is proportional to the baseline hazard rate independently of
31Typically, survival analysis is used by labor economists investigating issues such as the duration ofunemployment.
28
the time variable. Equation (27) specifies a general proportional hazard model but its
estimation requires a further assumption about the baseline hazard rate h0(t). For the
most part of our analysis, we will not actually estimate it so that we remain agnostic
on its functional form. This choice leads to the Cox model, which is widely used and is
a semi-parametric model (parametric in the regressors but not for the baseline hazard
rate). The flexibility of the Cox model comes at the cost of a loss of e"ciency compared to
a situation where an appropriate form for the baseline hazard rate is imposed. However,
an incorrectly specified baseline rate would lead to inconsistent estimates. For this
reason, we only use a full parametric model as a robustness check, and its estimates
should not systematically di!er from the ones obtained with a semi-parametric model if
the baseline hazard rate is not mis-specified. For this robustness check, we will estimate
a Weibull model, which specifies
h0(t) = ptp!1 exp('0) (28)
where p > 0 is an ancillary parameter to be estimated and '0 is a constant. The baseline
hazard rate is constant if p is equal to 1 while it is increasing (decreasing) for p above
(below) 1. The sample for the analysis includes all the new export entries occurring
during the period 1997-2008 in a country outside the Single Market. Starting from the
year when such an entry occurs, each firm is tracked over time until that firm opens a
subsidiary in that country or until the end of the sample if no FDI ever occurs. It is
important to point out that in a survival analysis framework, each firm is included in
the analysis until the time when the event under investigation occurs (i.e., FDI entry).
After that point, no more information can be learned from that firm. Instead, a firm
that never engages in FDI will be included until the end of the sample.
6.2 Export experience and FDI entry
The key prediction of our theoretical model is that export experience in a given country
is a fundamental determinant of the decision to open a subsidiary in that same country
since it allows the firm to learn about its profitability in that market. In order to
provide a first look of the data, in Figure (3) we plot the Kaplan-Meier cumulative
hazard function, which depicts the cumulative probability of FDI entry over time based
on the count of occurring FDI entries in each period out of the total number of firms
that may start FDI. The figure distinguishes the cumulative hazard functions by the
extent of export experience and it clearly shows that FDI entries are much more likely
among firms with an export experience between 1 and 4 years, compared with those
29
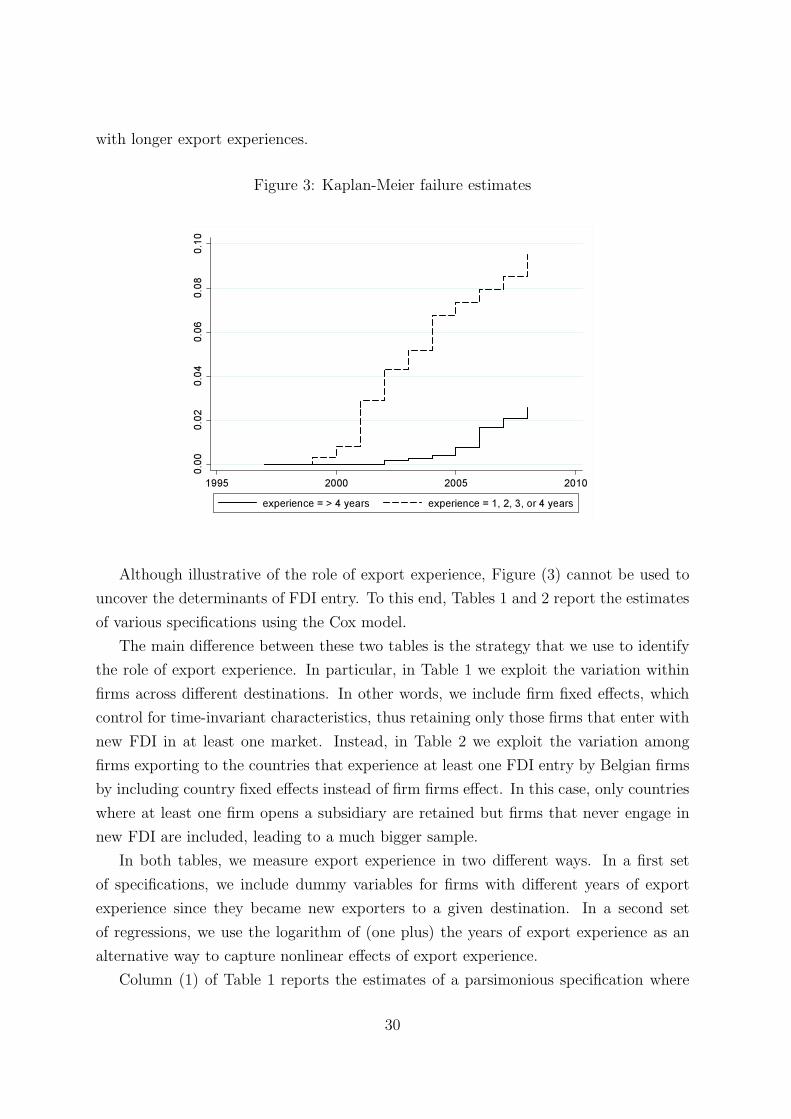
with longer export experiences.
Figure 3: Kaplan-Meier failure estimates
Although illustrative of the role of export experience, Figure (3) cannot be used to
uncover the determinants of FDI entry. To this end, Tables 1 and 2 report the estimates
of various specifications using the Cox model.
The main di!erence between these two tables is the strategy that we use to identify
the role of export experience. In particular, in Table 1 we exploit the variation within
firms across di!erent destinations. In other words, we include firm fixed e!ects, which
control for time-invariant characteristics, thus retaining only those firms that enter with
new FDI in at least one market. Instead, in Table 2 we exploit the variation among
firms exporting to the countries that experience at least one FDI entry by Belgian firms
by including country fixed e!ects instead of firm firms e!ect. In this case, only countries
where at least one firm opens a subsidiary are retained but firms that never engage in
new FDI are included, leading to a much bigger sample.
In both tables, we measure export experience in two di!erent ways. In a first set
of specifications, we include dummy variables for firms with di!erent years of export
experience since they became new exporters to a given destination. In a second set
of regressions, we use the logarithm of (one plus) the years of export experience as an
alternative way to capture nonlinear e!ects of export experience.
Column (1) of Table 1 reports the estimates of a parsimonious specification where
30
only the dummy variables capturing export experience are included together with the
firm fixed e!ects. The coe"cients clearly suggest a positive and nonlinear e!ect: the
importance of export experience decreases over time and it is only significant at 10
percent once a firm reaches 5 years of export experience (compared to the omitted
category of 7 or more years of experience). This result is confirmed when using the log
version of export experience in column (4), whose estimated coe"cient is also highly
significant and positive. In column (2) we add some country specific regressors. The
results on the nonlinear e!ects of export experience are robust, with the estimated
coe"cient for Experience56f,i,t now insignificant, suggesting that the four initial years
after becoming a new exporter are crucial in order to decide whether to engage in FDI
in the same location. As for the added country controls, GDPi,t, GDP per capitai,t, and
BITi,t exert a positive and significant e!ect, as expected, on the likelihood of FDI entry
while Distancei, Common Languagei, and Colonyi are not significant.32 In column (3)
the applied tari! rate is added at the cost of losing almost 2000 observations and 11 FDI
entries. Still, the qualitative results are identical with respect to the previous column,
except for Distancei that is now significant at 10 percent. The level of tari!s presents
a positive but insignificant e!ect. However, the insignificance of this regressor in most
of the specifications may be explained by various factors. First, this variable may be
quite noisy because of its construction, which required bridging various classifications.
Second, its role depends on the type of FDI taking place: higher tari!s should lead to
more horizontal FDI but they would discourage export-supporting FDI.
The specifications in the last three columns of Table 1 include the log version of
export experience. The results are qualitative similar to the respective columns with the
experience dummies and confirm the nonlinear and decreasing role of export experience
on FDI entry.
The regressions in Table 2 are based on a much bigger sample and they exploit the
variation within a country between firms that open subsidiaries and those that do not.
This table presents two extra columns because sector fixed e!ects (at 2-digit NACE)
can be included along with the country fixed e!ects (although some observations are
lost because not all sectors experience FDI entries). The relevance of export experience
is confirmed: the dummy variables in the first 4 columns illustrate, again, the nonliner
e!ect of experience emphasizing the role of the first 4 years, just as in the previous table.
As for the firm level controls, larger firms and MNEs are more likely to engage in new
FDI, although the e!ect of employment is not significant when the sector fixed e!ects
32We did try including time-varying firm variables (i.e., employment, productivity, and MNE) butthey were never significant, most likely because of the little time variation).
31
are included. The level of tari!s presents a positive and significant e!ect only when the
sector fixed e!ects are included. However, the insignificance of this regressor in the other
specifications (and in the ones that follow) may be explained by various factors. First,
this variable may be quite noisy because of its construction, which required bridging
various classifications. Second, its role depends on the type of FDI taking place: higher
tari!s should lead to more horizontal FDI but they would discourage export-supporting
FDI.
The last four regressors try to capture di!erent channels through which a firm may
learn about demand and supply conditions in a destination market. The first two are
“internal” to the firm and count the number of other countries in the same region that
the firm was serving with exports and FDI. Both variables are significant and positive but
they do not diminish the role of export experience in the specific market. The other two
regressors are similar but count the number of other Belgian firms from the same 2-digit
NACE sector that served the same market via FDI or exports. Interestingly, it seems
that firms do not learn from each other since these regressors are never significant or they
present a negative coe"cient (possibly due to a competition e!ect), whose significance
disappear when adding sector fixed e!ects.
The last 4 columns of Table 2 use the log of export experience and the results are
qualitatively similar to the previous columns, except that employment now presents a
consistently significant coe"cient while the count of export destinations by the firm in
the same region is only significant in one out of three specifications.
Overall, the various specifications of the Cox proportional model presented in Tables
1 and 2 confirm our theoretical prediction that export experience plays a crucial role
in determining FDI entry. In the next Section, we proceed one step further to examine
whether the role of experience is a!ected by the extent of country (supply) or sector-level
(demand) uncertainty.
6.3 Learning and Uncertainty
Consistent with our model, it should also be that experience becomes all the more
relevant in particularly uncertain destinations. To empirically verify whether this is the
case, in Table 3 we report the estimates of various specifications where we interact the
log of export experience with variables meant to capture supply and demand uncertainty
in foreign markets. As discussed in section 4, we use Variance Regulationi, which only
varies at country level, as a measure of supply uncertainty. Instead Di!erentiatedk,
which only varies at 3-digit NACE level, should capture uncertainty on the demand side
32
since it is based on the degree of product di!erentiation within a sector.
In the first 4 columns of Table 3, the log of experience is interacted with the variance
of regulation and the variance and the level of regulation are also introduced as control
variables. The estimates in the first 2 columns exploit the within-firm variation while the
identification in columns (3) and (4) is based on comparing firms within a sector. In each
case, the log of experience is positive and significant and its interaction with the variance
of regulation is also positive and significant, indicating that export experience is more
important for countries with higher variance of regulation. As expected, the variance of
regulation presents a negative and significant sign while countries with higher standards
of regulation are more likely to attract new FDI. The estimated coe"cients for the other
controls introduced in column (2) and (4) present the same qualitative e!ects as found
in previous section.33 34
In the last two columns of Table 3, we see that demand uncertainty also plays a
role. In particular, the interaction of the log of experience with the measure of product
di!erentiation based on Rauch (1999) is positive and significant. This suggests that
export experience is more important in determining FDI entry decisions for firms selling
more di!erentiated products.
In conclusions, the results show that export experience is more important in countries
and sectors characterized by more uncertainty, which is consistent with our theoretical
model based on the idea that firms need to learn about their profitability in destination
markets.
6.4 Robustness checks
In this section, we discuss the results of a series of additional regressions aimed to verify
the robustness of our main findings. Our theoretical model applies to horizontal and
export-supporting FDI and, as mentioned in Section 4.2, a casual look at the data
suggests that Belgian firms do engage in both types of FDI. Unfortunately, we cannot
directly exclude the occurrence of vertical FDI, since our data do not directly report
the reasons for which a firm opens subsidiaries in a foreign country. However, exploiting
intra-firm data we can try to eliminate FDI entries that “look” vertical in nature. To
this end, we compute the share of exports out of value added that the subsidiary ships
33We exclude GDP per capitai,t from these specifications because it is highly correlated withRegulationi,t.
34In unreported results, we also estimated the same type of specifications using Rule of lawi,t andits variance. Although less “supply” oriented than regulation, this index measures the enforceability ofrules in a country, which should a!ect the fixed costs associated with serving a foreign market. Theresults when using this index are qualitatively similar.
33
back to the Belgian firm in the years following FDI entry. Then, we re-estimate our
specifications excluding those FDI entries for which such share is above one third. The
results of such exercise for representative specifications from each of the previous tables
are reported in Table 4.
Focusing on the first row of Table 4, we immediately see that the result on the role
of export experience is unchanged when some FDI entries are removed because of their
suspected vertical nature. The first two columns report specifications from Tables 1
(with firm fixed e!ects) and 2 (with country fixed e!ects) and there is no significant
change in the influence of the control variables on the likelihood of FDI entry. In
columns (3) and (4), the role of uncertainty due to the variance of regulations is assessed,
exploiting within-firm variation or within-sector variation. Again, the qualitative results
are unchanged when these estimates are compared with their analogous in Table 3.
Finally, the estimates in column (5) verify the role of product di!erentiation and earlier
results on the relevance of this form of (demand) uncertainty are confirmed.
On a methodological front, we re-estimated all the specifications using the Weibull
model, thus imposing a specific functional form for the baseline hazard rate. The re-
sults, not reported to save on space, do not show any qualitative change (in sign and
significance) with respect to those obtained when estimating Cox proportional models.
As expected, the ancillary parameter of the Weibull model is estimated to be above 1
and highly significant, implying an increasing baseline hazard rate.
Our final robustness check refers to the definition of FDI entry. In our main analysis,
we focus on FDI entry decisions of “new exporters” (i.e., firms for which we can observe
the year of export entry). This allows us to precisely measure the export experience of
firms that start investing in a foreign market, but forces us to exclude from our analysis
all FDI entries of “old exporters” (i.e., firms for which we cannot observe the year of
export entry). To recover these entries, we can treat all firms identically and simply
count the number of years in which a firm has positive exports to a market over the
previous four. 35 Using this less precise measure of export experience allows us to keep
all the 408 FDI entries that have occurred outside the EU Single Market over our sample
period. Cox regressions on this larger sample of FDI entries confirm that the probability
that a firm starts investing in a foreign country depends significantly on the number of
years the firm has been exporting to that country, and that export experience matters
more when firms face more uncertain market conditions.
On a methodological front, we re-estimated all the specifications using the Weibull
35Notice that this measure of export experience does not su!er from left censoring, since we canobserve exports during the four previous years for all FDI entries over the period 1997-2008.
34

model, thus imposing a specific functional form for the baseline hazard rate. The results,
not reported to save on space, do not show any significant change with respect to those
obtained with the Cox proportional model. As expected, the ancillary parameter of the
Weibull model is estimated to be above 1 and highly significant, implying an increasing
baseline hazard rate.
7 Conclusions
This paper analyzes how the need to uncertainty a!ects a firm’s choice of serving a
foreign market by exporting or opening a foreign a"liate. We develop a simple dynamic
model of internationalization choices based on two key assumptions: first, a firm can
only gain knowledge about a foreign market by operating there; second, export involve
lower fixed costs than FDI, but higher variable costs of transportation and trade barriers.
We show that the need to acquire information about foreign market conditions can lead
to a gradual internationalization process: the firm will first “test” the foreign market
via exports to find out local supply and demand conditions; if it discovers that its
profitability in that market is high enough, it will then establish foreign production
facilities.
Our empirical analysis, based on detailed information on export and FDI activities in
individual destination markets for all companies registered in Belgium, provides strong
support for the predictions of our model. We find that the overwhelming majority of
firms start serving a foreign market through exports. After an initial “trial” period”,
most firms exit the foreign market, some continue to export, and a few open foreign
a"liates. Moreover, a firm’s export experience in a foreign country has a crucial impact
on its decision to start investing there, and the e!ect is stronger in the face of more
uncertain supply and demand conditions.
Our results show that exports and horizontal FDI may be substitutes from a static
perspective – since they represent alternative ways of serving a foreign market – but
complements over time – since the knowledge acquired through export experience can
lead firms to invest abroad. Standard internationalization models that abstract from
market uncertainty and learning predict that lower trade costs should lead firms to
substitute a"liate production for exports. Trade liberalization should thus lead to a fall
in FDI. In contrast , our analysis suggests that trade liberalization may actually foster
FDI, by allowing firms to experiment in foreign markets via exports.
35
References
Aeberhardt, R., Buono, I., and H. Fadinger (2009). “Learning and the Dynamics
of Exporting: Theory and Evidence from French Firms,” mimeo, University of
Vienna.
A!endy, A.M., L. S. Yee, and S. Madono (2010). “Commodity-industry Classification
Proxy: A Correspondence Table between SITC Revision 2 and ISIC Revision 3,”
Journal of International Economic Studies 24, 185-202.
Albornoz, F., H. Calvo-Pardo, G. Corcos, and E. Ornelas (2010). “Sequential Export-
ing,” CEP Discussion Paper No 974.
Arkolakis, C. (2010). “Market Penetration Costs and the New Consumers Margin in
International Trade,” Journal of Political Economy 118, 1151-1199.
Blonigen, B. A. (1997). “Firm-Specific Assets and the Link Between Exchange Rates
and Foreign Direct Investment,” American Economic Review 87, 447-465.
Blonigen, B. A. (2005). “A Review of the Empirical Literature on FDI Determinants,”
Atlantic Economic Journal 33, 383-403.
Brainard, L. S. (1997). “An Empirical Assessment of the Proximity- Concentration
Trade-o! Between Multinational Sales and Trade,” American Economic Review
87, 520-544.
Brouthers, K. D., L. E. Brouthers, and S. Werner (2008). “Real Options, International
Entry Mode Choice and Performance,” Journal of Management Studies 45, 936-
960.
Chi, T. (2000). “Option to Acquire or Divest a Joint Venture,” Strategic Management
Journal 21, 665-687.
Chi, T., and D. J. McGuire (1996). “Collaborative Ventures and Value of Learning:
Integrating the Transaction Cost and Strategic Option Perspectives on the Choice
of Market Entry Modes,” Journal of International Business Studies 27, 285-307.
Dixit, A. K., and R. S. Pindyck (1994). Investment and Uncertainty. Princeton, NJ:
Princeton University Press.
Eaton, J., M. Eslava, M. Kugler, and J. Tybout (2008). “The Margins of Entry into Ex-
port Markets: Evidence from Colombia,” in Helpman, H., Marin, D., and Verdier,
T. (eds.), The Organization of Firms in a Global Economy. Cambridge, MA:
Harvard University Press.
36
Eaton, J., M. Eslava, C. J. Krizan, M. Kugler, and J. Tybout (2010). “A Search and
Learning Model of Export Dynamics,” mimeo, Pennsylvania State University.
Ekholm, K., R. Forslid, and J. R. Markusen (2007). “Export-Platform Foreign Direct
Investment,” Journal of the European Economic Association 5, 776-795.
Freund, C. L., and M. D. Pierola (2010). “Export Entrepreneurs: Evidence from Peru,”
World Bank Policy Research Working Paper 5407.
Guiso, L., and G. Parigi (1999). “Investment and Demand Uncertainty,” Quarterly
Journal of Economics 114, 185-227.
Hanson, G., R. J. Mataloni, and M. J. Slaughter (2005). “Vertical Production Networks
in Multinational Firms,” Review of Economics and Statistics 87, 664-678.
Head, K., and J. Ries (2003). “Heterogeneity and the FDI versus Export Decision of
Japanese Manufacturer,” Journal of the Japanese and International Economies
17, 448-467.
Helpman, E., Melitz, M. J., and S. R. Yeaple (2004). “Export versus FDI with Hetero-
geneous Firms,” American Economic Review 94, 300-316.
Horstmann, I., and J. R. Markusen (1992). “Endogenous Market Structures in Inter-
national Trade,” Journal of International Economics 32, 109-29.
Horstmann, I., and J. R. Markusen (1996). “Exploring New Markets: Direct Investment,
Contractual Relations and the Multinational Enterprise,” International Economic
Review 37, 1-19.
Johanson, J., and Vahlne, J.-E. (1977). “The Internationalization Process of the Firm: A
Model of Knowledge Development and Increasing Foreign Market Commitments,”
Journal of International Business Studies 8, 23-32.
Jovanovic, B. (1982). “Selection and the Evolution of Industry,” Econometrica 50,
649-670.
Kaufmann, D., A. Kraay, and M. Mastruzzi (2009). “Governance Matters VIII: Ag-
gregate and Individual Governance Indicators, 1996-2008,” World Bank Policy
Research Working Paper 4978.
Kumar, M. V. S. (2005). “The Value from Acquiring and Divesting a Joint Venture: a
Real Options Approach,” Strategic Management Journal 26, 321-331.
Krautheim, S. (2007). “Export-Supporting FDI,” EUI Working Papers ECO 2007/24.
37

Lawless, M. (2009). “Firm Export Dynamics and the Geography of Trade,” Journal of
International Economics 77, 245-254.
Markusen, J.R., and K. E. Maskus (2003). “General-Equilibrium Approaches to the
Multinational Firm: a Review of Theory and Evidence,” in J. Harrigan and K.
Choi (eds.), Handbook of International Trade. London, Basil Blackwell.
Markusen, J. R. (1984). “Multinationals, Multi-plant Economies, and the Gains from
Trade,” Journal of International Economics 16, 205226.
Markusen, J. R., and A. J. Venables (2000). “The Theory of Endowment, Intra-industry
and Multinational Trade,” Journal of International Economics 52, 209-34.
McDonald, R., and D. Siegel (1986). “The Value of Waiting to Invest,” Quarterly
Journal of Economics 101, 707-727.
Melitz, M. J. (2003). “The Impact of Trade on Intra-Industry Reallocations and Ag-
gregate Industry Productivity,” Econometrica 71, 1695-1725.
Morales, E., G. Sheu, and A. Zahler (2011). “Gravity and Extended Gravity: Estimating
a Structural Model of Export Entry.” Mimeo, Harvard University.
Muuls, M., and M. Pisu (2007). “Imports and Exports at the Level of the Firm:
Evidence from Belgium,” CEP Discussion Paper No 801.
Ra!, H., and M. Ryan (2008). “Firm-Specific Characteristics and the Timing of Foreign
Direct Investment Projects,” Review of World Economics 144, 1-31.
Ramondo, N., V. Rappoport, and K. J. Ruhl (2010). “The Proximity-Concentration
Tradeo! under Uncertainty,” mimeo, Arizona State University.
Rauch, J. E. (1999). “Networks Versus Markets in International Trade,” Journal of
International Economics 48, 7-35.
Rauch, J. E., and J. Watson (2003). “Starting Small in an Unfamiliar Environment,”
International Journal of Industrial Organization 21, 1021-1042.
Rob, R., and N. Vettas (2003). “Foreign Direct Investment and Exports with Growing
Demand,” Review of Economic Studies, 70, 629-648.
Ruhl, K., and J. Willis (2008). “New Exporter Dynamics,” mimeo, New York University.
Unctad (2011). World Investment Report 2011.
38

Table 1: Export experience and FDI entry, comparison within firms
(1) (2) (3) (4) (5) (6)
Experience12f,i,t 1.923*** 1.927*** 1.870***(0.407) (0.360) (0.362)
Experience34f,i,t 1.672*** 1.551*** 1.325***(0.471) (0.421) (0.421)
Experience56f,i,t 1.215* 0.913 0.536(0.626) (0.577) (0.610)
Log Experiencef,i,t 1.726*** 1.532*** 1.430***(0.228) (0.223) (0.250)
GDPi,t 0.220*** 0.229*** 0.180*** 0.191***(0.054) (0.060) (0.051) (0.053)
GDP per capitai,t 0.040*** 0.038** 0.036*** 0.033**(0.013) (0.015) (0.012) (0.014)
BITi,t 1.460*** 1.305*** 1.317*** 1.193***(0.294) (0.336) (0.282) (0.322)
Distancei 0.056 0.077* 0.051 0.070*(0.041) (0.040) (0.038) (0.038)
Common Languagei 0.219 0.509 0.235 0.537(0.467) (0.465) (0.440) (0.435)
Colonyi -0.680 -0.522 -0.409 -0.273(1.089) (1.042) (1.180) (1.142)
Tari!i,t,k 0.407 0.112(1.180) (1.183)
Firm fixed e!ects yes yes yes yes yes yesObservations 9,210 8,762 6,922 9,210 8,762 6,922Export entries 1,570 1,506 1,395 1,570 1,506 1,395FDI entries 74 74 63 74 74 63Log likelihood -497.2 -463.4 -379.6 -488.2 -462.8 -381.6
Notes: The table reports the estimated coe"cients of Cox models, with robust standarderrors in parenthesis. The dependent variable is equal to 1 if firm f in sector k startsinvesting in foreign country i at time t. The sample period is 1997-2008. * denotessignificance at the 10% level, ** 5% level, and *** 1% level.
39
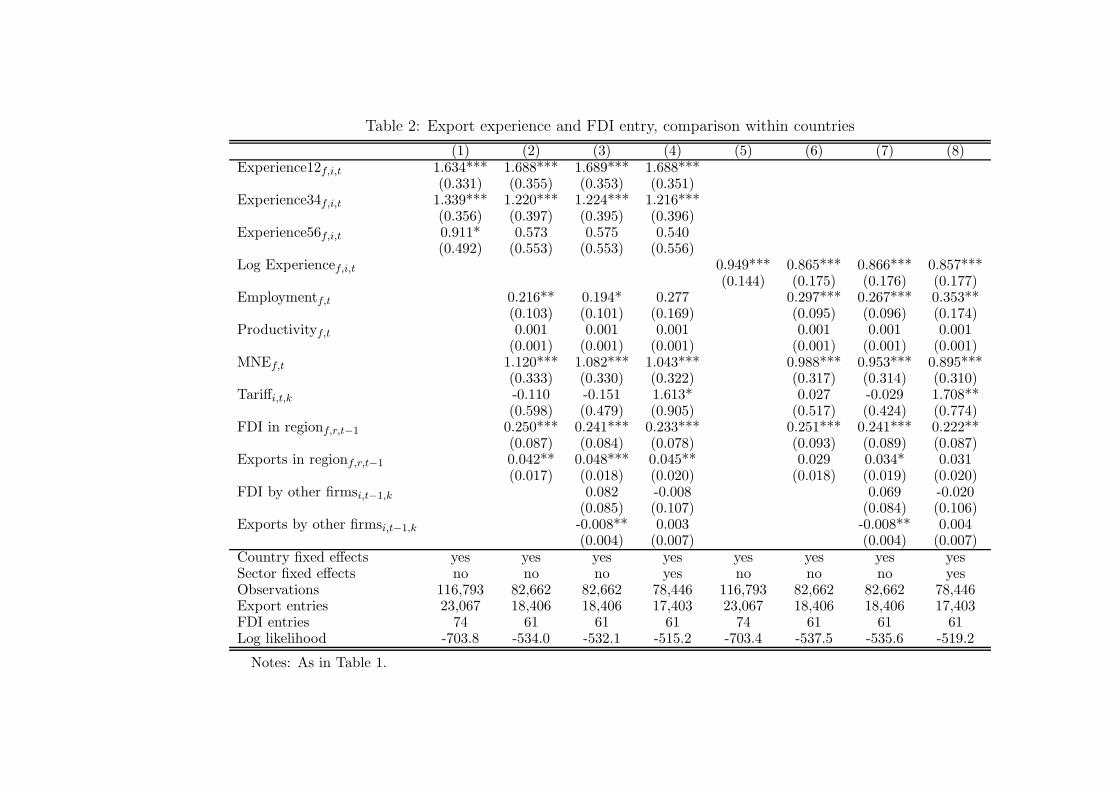
Table 2: Export experience and FDI entry, comparison within countries
(1) (2) (3) (4) (5) (6) (7) (8)Experience12f,i,t 1.634*** 1.688*** 1.689*** 1.688***
(0.331) (0.355) (0.353) (0.351)Experience34f,i,t 1.339*** 1.220*** 1.224*** 1.216***
(0.356) (0.397) (0.395) (0.396)Experience56f,i,t 0.911* 0.573 0.575 0.540
(0.492) (0.553) (0.553) (0.556)Log Experiencef,i,t 0.949*** 0.865*** 0.866*** 0.857***
(0.144) (0.175) (0.176) (0.177)Employmentf,t 0.216** 0.194* 0.277 0.297*** 0.267*** 0.353**
(0.103) (0.101) (0.169) (0.095) (0.096) (0.174)Productivityf,t 0.001 0.001 0.001 0.001 0.001 0.001
(0.001) (0.001) (0.001) (0.001) (0.001) (0.001)MNEf,t 1.120*** 1.082*** 1.043*** 0.988*** 0.953*** 0.895***
(0.333) (0.330) (0.322) (0.317) (0.314) (0.310)Tari!i,t,k -0.110 -0.151 1.613* 0.027 -0.029 1.708**
(0.598) (0.479) (0.905) (0.517) (0.424) (0.774)FDI in regionf,r,t!1 0.250*** 0.241*** 0.233*** 0.251*** 0.241*** 0.222**
(0.087) (0.084) (0.078) (0.093) (0.089) (0.087)Exports in regionf,r,t!1 0.042** 0.048*** 0.045** 0.029 0.034* 0.031
(0.017) (0.018) (0.020) (0.018) (0.019) (0.020)FDI by other firmsi,t!1,k 0.082 -0.008 0.069 -0.020
(0.085) (0.107) (0.084) (0.106)Exports by other firmsi,t!1,k -0.008** 0.003 -0.008** 0.004
(0.004) (0.007) (0.004) (0.007)Country fixed e!ects yes yes yes yes yes yes yes yesSector fixed e!ects no no no yes no no no yesObservations 116,793 82,662 82,662 78,446 116,793 82,662 82,662 78,446Export entries 23,067 18,406 18,406 17,403 23,067 18,406 18,406 17,403FDI entries 74 61 61 61 74 61 61 61Log likelihood -703.8 -534.0 -532.1 -515.2 -703.4 -537.5 -535.6 -519.2
Notes: As in Table 1.
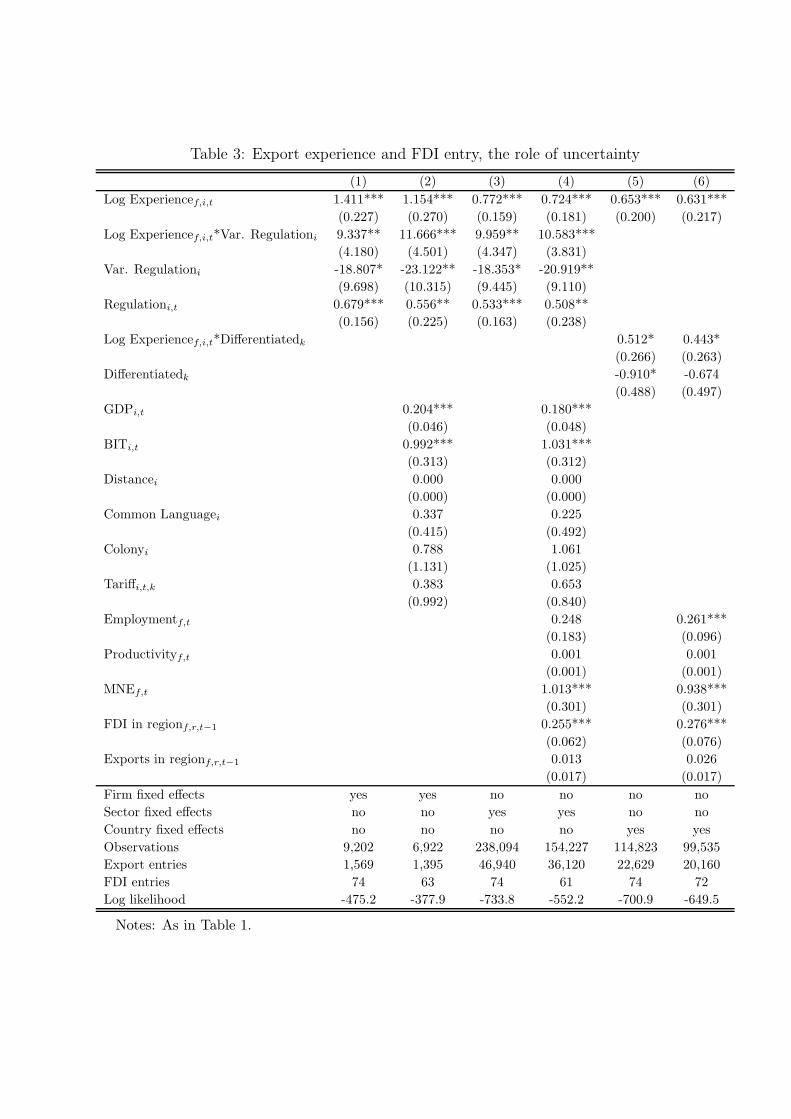
Table 3: Export experience and FDI entry, the role of uncertainty
(1) (2) (3) (4) (5) (6)
Log Experiencef,i,t 1.411*** 1.154*** 0.772*** 0.724*** 0.653*** 0.631***(0.227) (0.270) (0.159) (0.181) (0.200) (0.217)
Log Experiencef,i,t*Var. Regulationi 9.337** 11.666*** 9.959** 10.583***(4.180) (4.501) (4.347) (3.831)
Var. Regulationi -18.807* -23.122** -18.353* -20.919**(9.698) (10.315) (9.445) (9.110)
Regulationi,t 0.679*** 0.556** 0.533*** 0.508**(0.156) (0.225) (0.163) (0.238)
Log Experiencef,i,t*Di!erentiatedk 0.512* 0.443*(0.266) (0.263)
Di!erentiatedk -0.910* -0.674(0.488) (0.497)
GDPi,t 0.204*** 0.180***(0.046) (0.048)
BITi,t 0.992*** 1.031***(0.313) (0.312)
Distancei 0.000 0.000(0.000) (0.000)
Common Languagei 0.337 0.225(0.415) (0.492)
Colonyi 0.788 1.061(1.131) (1.025)
Tari!i,t,k 0.383 0.653(0.992) (0.840)
Employmentf,t 0.248 0.261***(0.183) (0.096)
Productivityf,t 0.001 0.001(0.001) (0.001)
MNEf,t 1.013*** 0.938***(0.301) (0.301)
FDI in regionf,r,t"1 0.255*** 0.276***(0.062) (0.076)
Exports in regionf,r,t"1 0.013 0.026(0.017) (0.017)
Firm fixed e!ects yes yes no no no noSector fixed e!ects no no yes yes no noCountry fixed e!ects no no no no yes yesObservations 9,202 6,922 238,094 154,227 114,823 99,535Export entries 1,569 1,395 46,940 36,120 22,629 20,160FDI entries 74 63 74 61 74 72Log likelihood -475.2 -377.9 -733.8 -552.2 -700.9 -649.5
Notes: As in Table 1.

Table 4: FDI entry and export experience, excluding vertical FDI
(1) (2) (3) (4) (5)Log Experiencef,i,t 1.383*** 0.822*** 1.122*** 0.699*** 0.566***
(0.264) (0.189) (0.286) (0.196) (0.214)Log Experiencef,i,t*Var. Regulationi 10.488** 9.531***
(4.317) (3.501)Var. Regulationi -20.950** -18.401**
(10.003) (8.251)Regulationi,t 0.532** 0.527**
(0.242) (0.261)Log Experiencef,i,t*Di!erentiatedk 0.503*
(0.262)Di!erentiatedk -0.962*
(0.491)GDPi,t 0.193*** 0.197*** 0.178***
(0.059) (0.051) (0.053)GDP per capitai,t 0.027*
(0.014)Bilateral Investment Treatyi,t 1.161*** 0.977*** 1.019***
(0.343) (0.337) (0.341)Distancei 0.000** 0.000 0.000
(0.000) (0.000) (0.000)Common Languagei 0.318 0.094 -0.080
(0.521) (0.499) (0.623)Colonyi 0.025 1.111 1.534
(1.172) (1.158) (1.081)Tari!i,t,k -1.238 -0.455 -0.636 -0.109
(1.364) (1.488) (1.122) (1.331)Employmentf,t 0.316*** 0.276 0.305***
(0.099) (0.184) (0.100)Productivityf,t 0.001 0.000 0.000
(0.001) (0.001) (0.001)MNEf,t 0.979*** 1.027*** 1.067***
(0.339) (0.316) (0.319)FDI in regionf,r,t"1 0.336*** 0.270*** 0.398***
(0.081) (0.061) (0.074)Exports in regionf,r,t"1 0.035* 0.009 0.028
(0.020) (0.019) (0.018)Firm fixed e!ects yes no yes no noSector fixed e!ects no no no yes noCountry fixed e!ects no yes no no yesObservations 6,846 82,587 6,846 154,152 99,435Export entries 1,384 18,395 1,384 36,109 20,149FDI entries 56 54 56 54 61Log likelihood -333.1 -465.4 -329.6 -484.2 -536.8
Notes: As in Table 1.

Table A-1: Definition of variables and sources
Export entryf,i,t Dummy equal to 1 in the first year in which firm f has positive exports to country i NBB Foreign Trade Data
(after at least 4 years of no exports)
FDI entryf,i,t Dummy equal to 1 in the first year in which firm f has positive FDI stock in country i NBB Survey on Foreign Direct Investment
Experiencef,i,t Number of years since export entry of firm f in country i NBB Foreign Trade Data
Experience12f,i,t Dummy equal to 1 if firm f has 1-2 years of export experience NBB Foreign Trade Data
Experience34f,i,t Dummy equal to 1 if firm f has 3-4 years of export experience NBB Foreign Trade Data
Experience56f,i,t Dummy equal to 1 if firm f has 5-6 years of export experience NBB Foreign Trade Data
Log Experiencef,i,t Log of (1+ Experiencef,i,t) NBB Foreign Trade Data
Employmentf,t Employment of firm f in year t (hundreds) NBB Central Balance Sheet Data
Productivityf,t Value added of firm f divided by its employment (hundreds) NBB Central Balance Sheet Data
MNEf,t Dummy equal to 1 if firm receives inward FDI NBB Survey on Foreign Direct Investment
FDI in regionf,r,t"1 Number of countries in region r in which firm f has foreign a"liates at t" 1 NBB Survey on Foreign Direct Investment
Exports in regionf,r,t"1 Number of countries in region r in which firm f exported at t" 1 NBB Foreign Trade Data
FDI by other firmsi,t"1,k Number of Belgian firms of sector k (2 digit NACE) with a"liates in country i at t" 1 NBB Survey on Foreign Direct Investment
Exports by other firmsi,t"1,k Number of Belgian firms of sector k (2 digit NACE) exporting to country i at t" 1 NBB Foreign Trade Data
GDPi,t Gross Domestic Product of country i in year t in constant 2000 US$ (billions) WDI
GDP per capitai,t GDP per capita of country i in year t in constant 2000 US$ (thousands) WDI
BITi,t Dummy equal to 1 if country i has a bilateral investment treaty with Belgium at t ICSID database
Distancei Distance in km between Bruxelles and the capital of country i (thousands) CEPII
Common Languagei Dummy equal to 1 if French is an o"cial language of country i CEPII
Colonyi Dummy equal to 1 if country i has ever been a Belgian colony CEPII
Regulationi,t Index of regulatory quality of country i Kaufmann et al. (2009)
Variance Regulationi Variance of Regulationi,t (1997-2008) Kaufmann et al. (2009)
Di!erentiatedk Share of subsectors classified as di!erentiated (3 digit NACE) Rauch (1999)
Tari!i,t,k Average tari! applied by country i in sector k (4 digit NACE) at t" 1, t" 2, t" 3 WITS
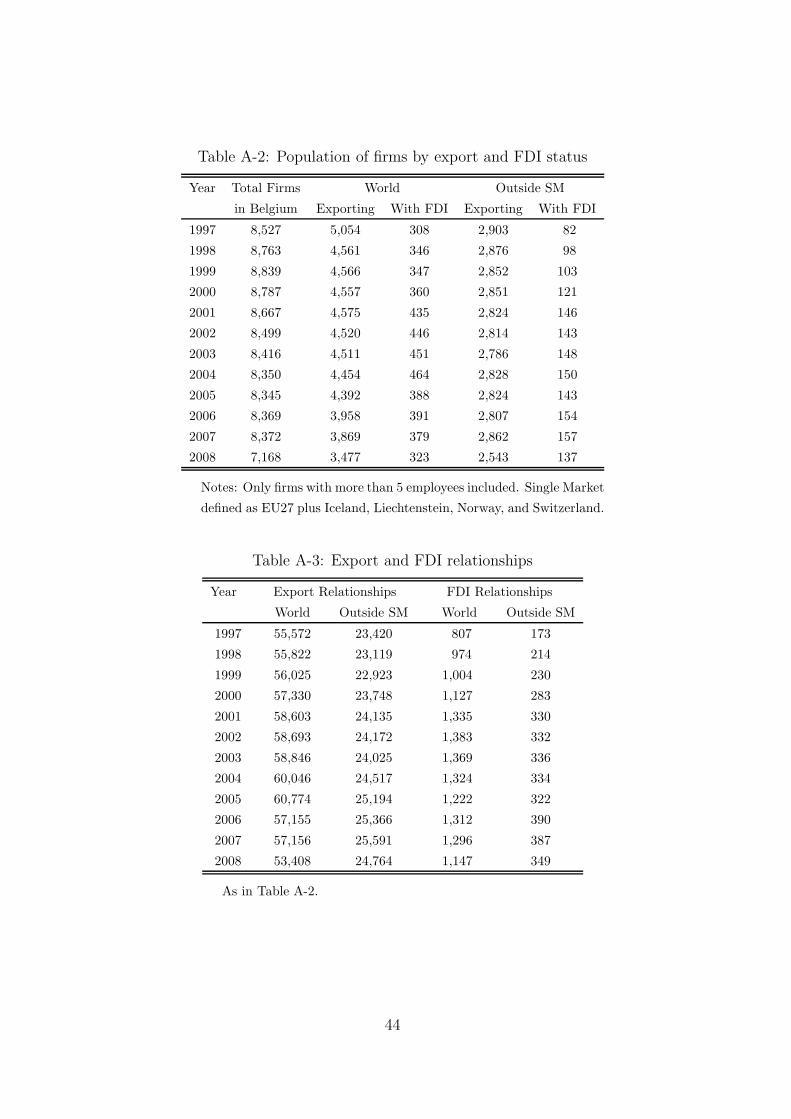
Table A-2: Population of firms by export and FDI status
Year Total Firms World Outside SM
in Belgium Exporting With FDI Exporting With FDI
1997 8,527 5,054 308 2,903 82
1998 8,763 4,561 346 2,876 98
1999 8,839 4,566 347 2,852 103
2000 8,787 4,557 360 2,851 121
2001 8,667 4,575 435 2,824 146
2002 8,499 4,520 446 2,814 143
2003 8,416 4,511 451 2,786 148
2004 8,350 4,454 464 2,828 150
2005 8,345 4,392 388 2,824 143
2006 8,369 3,958 391 2,807 154
2007 8,372 3,869 379 2,862 157
2008 7,168 3,477 323 2,543 137
Notes: Only firms with more than 5 employees included. Single Market
defined as EU27 plus Iceland, Liechtenstein, Norway, and Switzerland.
Table A-3: Export and FDI relationships
Year Export Relationships FDI Relationships
World Outside SM World Outside SM
1997 55,572 23,420 807 173
1998 55,822 23,119 974 214
1999 56,025 22,923 1,004 230
2000 57,330 23,748 1,127 283
2001 58,603 24,135 1,335 330
2002 58,693 24,172 1,383 332
2003 58,846 24,025 1,369 336
2004 60,046 24,517 1,324 334
2005 60,774 25,194 1,222 322
2006 57,155 25,366 1,312 390
2007 57,156 25,591 1,296 387
2008 53,408 24,764 1,147 349
As in Table A-2.
44
Table A-4: Top 10 destinations
Export FDIWorld Outside SM World Outside SM
5.57% Netherlands 5.71% USA 16.71% France 18.70% USA5.42% France 3.13% Turkey 9.19% Germany 7.83% China4.89% Germany 3.04% Japan 9.14% Netherlands 5.52% Turkey3.83% UK 2.81% Canada 7.34% UK 5.03% Singapore2.92% Spain 2.78% Israel 5.03% Italy 4.67% Brazil2.90% Switzerland 2.68% Australia 4.85% USA 4.40% Australia2.88% Italy 2.66% Russia 4.30% Spain 4.29% Japan2.77% Luxembourg 2.49% South Africa 3.08% Luxembourg 4.08% Canada2.41% USA 2.46% China 3.02% Poland 3.56% India2.18% Denmark 2.38% Hong Kong 2.32% Czech Republic 3.48% Hong Kong
Notes: Percentages based on year-firm-destination observations over the 1997-2008 period.
Table A-5: Top 10 manufacturing sectors
Export FDIWorld Outside SM World Outside SM
13.68% 15 12.84% 15 14.89% 24 18.27% 2412.56% 28 10.79% 17 13.82% 15 12.20% 158.83% 17 10.59% 28 9.33% 29 12.07% 298.43% 29 10.27% 29 8.72% 28 7.59% 257.55% 24 9.81% 24 7.40% 25 6.89% 176.42% 22 7.06% 25 6.71% 26 6.70% 266.27% 25 5.27% 36 5.69% 17 5.50% 276.03% 36 4.47% 22 4.56% 27 4.17% 285.08% 26 3.84% 31 4.19% 22 3.92% 313.36% 18 3.65% 18 3.65% 21 3.73% 34
NACE classification:15: Manufacture of food products and beverages16: Manufacture of tobacco products17: Manufacture of textiles18: Manufacture of wearing apparel19: Tanning and dressing of leather20: Manufacture of wood and of products of wood and cork21: Manufacture of pulp, paper and paper products22: Publishing, printing and reproduction of recorded media23: Manufacture of coke, refined petroleum products and nuclear fuel24: Manufacture of chemicals and chemical products25: Manufacture of rubber and plastic products26: Manufacture of other non-metallic mineral products27: Manufacture of basic metals28: Manufacture of fabricated metal products29: Manufacture of machinery and equipment30: Manufacture of o"ce machinery and computers31: Manufacture of electrical machinery and apparatus32: Manufacture of radio, television and communication equipment and apparatus33: Manufacture of medical, precision and optical instruments, watches and clocks34: Manufacture of motor vehicles, trailers and semi-trailers35: Manufacture of other transport equipment36: Manufacture of furniture
Notes: As in Table A-4.
45
Table A-6: Firm size and productivity
Mean St. dev. Min Max
Domestic firmsEmployment 40 73 5 1,542
Productivity 0.50 0.91 0.004 43.86Exporting firmsEmployment 142 446 5 10,283
Productivity 0.60 0.49 0.006 12.77Firms with FDI
Employment 970 1613 12 8,559Productivity 0.77 0.33 0.201 1.67
Notes: Domestic defined as those not exporting to any
market in our sample in 1997; Exporting firms defined as
those exporting to at least one market in our sample in
1997. Firms with FDI defined as those with foreign a"l-
iates in at least one markets in our sample in 1997. Em-
ployment measured in units. Productivity defined as ratio
of value added to employment (divided by 100).
Table A-7: FDI entry
Year World Outside SMwith exports
in previous 4 years
1997 160 40 201998 94 22 181999 98 31 24
2000 170 60 362001 223 58 46
2002 111 27 242003 90 25 242004 99 32 26
2005 74 31 212006 84 40 29
2007 72 26 172008 74 31 26
Total 1,349 423 311(73.5%)
Notes: As in Table A-2.
46
Table A-8: Death rate of new exporters fol-lowing export entry in year t
Time t+ 1 t+ 2 t+ 3 t+ 4Surviving firms 13,428 8,748 6,547 5,262Death rate 58.32 34.85 25.16 19.63
Notes: Statistics based on 32,214 export entries,excluding firms with very small initial exports(1st percentile of export values in year t).
Figure A-1: Firm-level exports in new destinations, by entry cohort
47
Related Documents