Exploring the Politics and Sustainability of Energy Production: A Professional Development Program for Science Teachers Mark Bloom, Dallas Baptist University Sarah Quebec Fuentes, Texas Christian University Kelly Feille, University of North Texas Molly Holden, Tarrant County College Abstract: This paper describes a three-week professional development program, for inservice science teachers, which included on-site field trips to different energy production sites, explored the variety of opinions about them (via film, podcasts, news media, and expert lectures), and incorporated mathematical modeling as a lens through which to evaluate the relative sustainability of each energy type. The teacher participants explored oil, natural gas, hydroelectric, nuclear, wind, and coal energy production methods. This paper describes in detail their experience at a coal strip mine and a coal fueled power plant. For each type of energy, the teachers completed a pre- and post-assessment on their understanding of how the energy source was used to generate electricity and their perceptions of the environmental costs of each. The participants’ change in understanding of the energy production methods and increasing awareness of environmental costs are shared. Further, in their own words, participants describe the impact of the professional development on their own knowledge base and their classroom teaching as well as their perceptions of experiential learning as a vehicle for conceptual change. Keywords: energy politics, sustainability, professional development, inservice teachers, mathematical modeling, experiential learning Mark Bloom ([email protected]) is currently an Associate Professor in the Department of Biology at Dallas Baptist University. His research interests include nature of science, environmental education, STEM education, and the interaction of science and faith-based beliefs. Sarah Quebec Fuentes is currently an Assistant Professor of Mathematics Education at Texas Christian University. Her research focuses on classroom discourse, preservice teacher education, teacher self-efficacy, teacher knowledge, educative curriculum materials, and models of collaboration. Kelly Feille is currently a Senior Lecturer of STEM Education at the University of North Texas. Her research interests include teacher professional development, outdoor science education, and teacher professional life histories. Mary Holden is a professional geologist; science education consultant; and instructor of geology, environmental science and technology, and occupational safety at Tarrant County College and the University of Texas at Arlington's Division of Enterprise Development. Her academic interests include education in earth and environmental sciences, and occupational health and safety.

Welcome message from author
This document is posted to help you gain knowledge. Please leave a comment to let me know what you think about it! Share it to your friends and learn new things together.
Transcript

Exploring the Politics and Sustainability of Energy Production: A
Professional Development Program for Science Teachers
Mark Bloom, Dallas Baptist University
Sarah Quebec Fuentes, Texas Christian University
Kelly Feille, University of North Texas
Molly Holden, Tarrant County College
Abstract: This paper describes a three-week professional development program, for inservice
science teachers, which included on-site field trips to different energy production sites,
explored the variety of opinions about them (via film, podcasts, news media, and expert
lectures), and incorporated mathematical modeling as a lens through which to evaluate
the relative sustainability of each energy type. The teacher participants explored oil,
natural gas, hydroelectric, nuclear, wind, and coal energy production methods. This paper
describes in detail their experience at a coal strip mine and a coal fueled power plant. For
each type of energy, the teachers completed a pre- and post-assessment on their
understanding of how the energy source was used to generate electricity and their
perceptions of the environmental costs of each. The participants’ change in understanding
of the energy production methods and increasing awareness of environmental costs are
shared. Further, in their own words, participants describe the impact of the professional
development on their own knowledge base and their classroom teaching as well as their
perceptions of experiential learning as a vehicle for conceptual change.
Keywords: energy politics, sustainability, professional development, inservice teachers,
mathematical modeling, experiential learning
Mark Bloom ([email protected]) is currently an Associate Professor in the Department of
Biology at Dallas Baptist University. His research interests include nature of science,
environmental education, STEM education, and the interaction of science and faith-based
beliefs.
Sarah Quebec Fuentes is currently an Assistant Professor of Mathematics Education at
Texas Christian University. Her research focuses on classroom discourse, preservice
teacher education, teacher self-efficacy, teacher knowledge, educative curriculum
materials, and models of collaboration.
Kelly Feille is currently a Senior Lecturer of STEM Education at the University of North
Texas. Her research interests include teacher professional development, outdoor science
education, and teacher professional life histories.
Mary Holden is a professional geologist; science education consultant; and instructor of
geology, environmental science and technology, and occupational safety at Tarrant
County College and the University of Texas at Arlington's Division of Enterprise
Development. Her academic interests include education in earth and environmental
sciences, and occupational health and safety.

Mitigation of impending environmental impacts will require an unprecedented
effort on the part of all of earth’s citizens. It will require the public to possess the
intellectual tools necessary to understand and evaluate issues, and to compare
sources and dig deeper into problems so as to differentiate truth from
propaganda. (Saylan & Blumstein, 2011, p. 19)
While multiple definitions of sustainability exist, Cullingford (2004) describes it
generally as “paying attention to the long-term consequences of actions and, by implication,
thinking of others who might suffer from the immediacy of one’s personal greed” (p. 17). While
this most often brings to mind the natural environment, such consequences can also extend to
societal and economic realms (among others). The sustainability of energy in the United States
has become a highly politicized issue, and the various sources of energy and energy production
methods are intimately linked to the looming environmental concerns including water shortages,
habitat destruction, species loss, and climate change. Navigating such a political landscape
requires the ability to (1) understand the basic methods of energy production, (2) see beyond the
rhetoric provided by special interest groups (e.g., industry representatives, environmentalists,
corporations) and recognize the truth and/or fallacy of their various perspectives, and (3)
compare the relative sustainability of various energy sources. The present paper describes a
professional development program, for inservice science teachers, which explored the politics
and sustainability of six distinct energy sources. Participants went on field trips to observe coal,
oil, natural gas, wind, hydroelectric, and nuclear energy production methods and, through news,
expert lectures, media, film, podcast, and text, gained knowledge of multiple opposing opinions
of each energy source. Using a pedagogical approach, which incorporated experiential learning
and mathematics modeling, participants developed a more sophisticated perception regarding the
sustainability of energy.
Literature Review
Politicization of Energy
Large scale environmental concerns such as biodiversity loss, resource depletion,
industrial pollution, and climate change have gained increasing importance over the last several
decades. In his book, Hot, Flat, and Crowded, Friedman (2008) warned that the American way
of energy and resource consumption, if adopted by developing countries, would lead to a
worldwide climate and biodiversity disaster. He advocates for a “redesigning and reinventing”
(p. 76) of how Americans utilize natural resources and consume energy that incorporate
sustainable practices. Such changes, however, do not come easy. Saylan and Blumstein (2011)
describe the highly politicized nature of environmental sustainability and the resulting paralyzing
indecision, argumentation, and lack of change that exists today. They partially blame the current
situation on the educational institutions, which have not fostered critical thinking skills sufficient
to understand complex issues such as environmental sustainability. Instead, they maintain that
society craves simplistic explanations that are “quickly expressed and easily digested” (Saylan &
Blumstein, 2011, pp. 3-4) despite the fact that such snippets rarely express authentic
representations of the issues (Baimbridge, 2004). Indeed, such simplified representations of
complex issues often take the form of diametrically opposed viewpoints that can represent

economic, political, and even religious perspectives and juxtapose ecocentric philosophies
against technocentric (Bybee, McCrae, & Laurie, 2009).
The current political landscape presents distinct viewpoints regarding environmental
issues with the more liberal administrations adopting pro-environmental positions while their
more conservative counterparts align with technocentric, business-friendly positions (Saylan &
Blumstein, 2011). This dichotomy was not always the case. Prior to the mid 1980’s, the strong
political undertones were not yet present and environmentalism was largely bipartisan in nature.
Friedman (2008) marks the Reagan administration (1981-1989) as the turning point away from
bipartisanship regarding the environment: “Regan ran not only against government in general but
against environmental regulation in particular” and “turned environmental regulation into a much
more partisan and polarizing issue than it had ever been before” (p. 15). However, in a
democratic society, an informed citizenry is of utmost importance to meet the challenges
presented with respect to environmental concerns. Only such an informed society will be able to
evaluate the various perspectives presented by distinct interest groups and be able to make
educated decisions.
Experiential Learning
From an experiential standpoint, “Learning is the process whereby knowledge is created
through the transformation of experience” (Kolb, 1984, p. 38). However, what constitutes an
experience varies in the literature on experiential learning (Moon, 1999). Boud, Keogh, and
Walker (1985) adopt a wide-ranging interpretation of experience, which includes professional
development sessions, on-site visits, talks, research, and unanticipated events. Moon argues that
experience typically encompasses more than one component. For example, an on-site visit may
be accompanied by a talk or supporting literature. Further, learners bring preconceived notions
with them to experiences (Moon, 1999). In particular, with respect to sustainability education,
Garvey (2013) stresses the importance of differentiating between unprejudiced reality and biased
perceptions. Experiential learning is a means to make this distinction.
False subjective beliefs can often be supported by increased access to information but
they are rarely supported by increased access to experiences. The more we actually
experience things and use the information available to supplement and complement our
knowledge, the greater and more accurate the understanding. (Garvey, 2013, para. 6)
According to the opening definition, learning requires not only experiences but also the
transformation of these experiences. This process of modifying preconceived notions,
confronting suppositions, and building knowledge involves reflection (Eraut, 1994; Kolb, 1984;
Medrick, 2013; Moon, 1999). Engaging in mathematical modeling is a way to foster this
reflection on experiences.
Mathematical Modeling
Mathematical modeling exemplifies the connection between mathematics and “intelligent
citizenship” often in the arena of scientific concerns (Pollak, 2011, p. vii). In particular, a
mathematical model is a “mathematical construct designed to study a real-world system or
behavior of interest” (Giordano, Weir, & Fox, 2003, p. 1). The process of building a model and

using it to make decisions about a real-life problem encompasses repeated cycles of the
following stages:
1. Identify a problem,
2. Simplify the problem,
3. Create a model to represent the simplified problem using mathematics,
4. Implement the model for the problem,
5. Assess whether the model appropriately addresses the problem, and
6. Modify the model based on the assessment (Munakata, 2006)
The first two stages involve developing an understanding of a problem to build a representative
model. These stages require a great amount of time while simultaneously presenting difficulties
for novice mathematical modelers (Galbraith, Stillman, Brown, & Edwards, 2007; Haines &
Crouch, 2010). In order to understand a problem, modelers must consider what information is
important to the problem, make assumptions, identify relevant variables, and determine any
relationships between the variables (Blum & Kaiser, 1991 as cited in Maaβ, 2006; see also
Moscardini, 1989; Pollak, 2007). To accomplish this level of comprehension, experts in the field
of modeling recommend thorough research via a combination of examinations of literature,
multiple forms of media, interaction with experts, actual experiences, and simulations (Brinkman
& Brinkman, 2007; Caron & Bélair, 2007; Galbraith et al., 2007). Engaging in the modeling
process may lead to an in-depth understanding of and informed decision-making regarding a real
world concern (Brinkman & Brinkman 2007; Galbraith et al., 2007; Hilborn & Mangel, 1997).
Professional Development
The overall intention of the professional development (PD) was to increase the
participants’ awareness of the complexity of energy sustainability and to expose them to the
naivety of simplistic, one-sided perspectives on the sustainability of any single energy source. To
accomplish this, the PD was designed to develop the participants’ understanding of the major
methods of energy production used to generate electricity in Texas and to explore the relative
environmental sustainability of each. Three science educators, a mathematics educator, and
content specialists facilitated the PD, which included an intensive three-week summer session
plus monthly follow-up meetings throughout the subsequent academic year. Sixteen inservice
secondary science teachers participated in the PD program. The three-week portion of the PD is
the focus of the present paper. During the summer experience, participants learned about
mathematical modeling, studied the energy production process via in-class and on-site
instruction and experiences, and participated in group discussions and activities, which helped to
synthesize information gained during classroom and field experiences.
Employing a modeling as vehicle approach (Maaβ, 2006), mathematical modeling
became a frame which participants used as they considered information gained throughout the
three-week PD. An initial introduction to mathematical modeling centered on the beginning
stages of the modeling process: identifying variables and making assumptions. In particular,
participants identified the variables for consideration when establishing a departure time to arrive
at work on time. Subsequently, the mathematics educator guided participants in the generation of
the steps of the modeling process. After two sessions, the participants created and presented
initial models of the environmental costs of locally versus non-locally grown produce.

Instruction about the various energy production processes varied and included non-
biased, scientific background information about general energy production methods and various,
opposing perspectives regarding economic and environmental benefits (and costs) of each energy
source. Information sources that spanned the spectrum of perspectives regarding energy
production sources included The Energy Report published by the Texas Comptroller of Public
Accounts [TCPA] (2008), films (both instructional documentaries and mainstream), news media,
on-site visits to energy extraction/production sites, and presentations by energy sector
representatives and environmental biologists. Before, during, and after on-site visits the
participants shared their developing ideas regarding each energy source and considered the
variables when determining environmental impact of energy production. Table 1 describes the
experiences for each energy source.
Table 1
Energy Type Location of Instruction Instructional Experience
Coal
Oak Hill Mine and
Martin Creek Steam
Electric Plant,
Henderson, TX
Tour of Oak Hill and Martin Creek by energy
company representatives
Film – Coal Country (Geller, 2009)
Film – Burning the Future: Coal in America
(Novack, 2008)
Hydroelectric Buchanan Dam,
Buchanan, TX
Lower Colorado River Authority representative
presentation and tour
Film – Deliverance (Boorman, 1972)
News – 2010/2011 Texas drought
Natural Gas Classroom
XTO Energy representative presentation
Film – Gasland (Fox, 2010)
News – Local construction of gas wells
Nuclear Comanche Peak
Nuclear Power Plant,
Somervell, TX
Video and tour by Comanche Peak
representatives
Film – Silkwood (Nichols & Hausman, 1983)
News – Fukushima Daiichi nuclear power plant
meltdown
Oil East Texas Oil
Museum,
Kilgore, TX
Video and tour by museum representative
Film – A Crude Awakening: The Oil Crash
(Gelpke & McCormack, 2006)
News – Deepwater Horizon oil spill in Gulf of
Mexico
Wind Wolf Ridge Wind
Farm,
Muenster, TX
NextEra representative presentation
Research ecologist presentation

A detailed description for coal is in the next section.
At the completion of on-site visits and instruction, in groups, the participants worked to create
models comparing the energy sources’ impact on the environment. The intention was not for the
groups to generate complete models; however, using a modeling as vehicle approach helped the
participants gain an understanding of the complexity of sustainable energy production, a primary
goal of the PD. At the conclusion of the three-week PD, each group prepared and delivered a
presentation for one assigned stance (either for or against) regarding one assigned energy source.
Participants, acting as audience members during the presentations, applied their new
understanding to contest or support views communicated by their peers.
Coal Generated Electricity
This section provides a detailed description of instruction and experiences intended to
expose participants to multiple perspectives of an energy source, specifically coal power.
Initially, participants read textbook materials regarding the scientific, non-biased, background
information on the generation of electricity from coal (TCPA, 2008). Participants then visited
Oak Hill Mine in Henderson, Texas where a representative from the mine guided them through a
bus-tour, which explored the extraction of coal through surface mining and the reclamation
process and progress at the mine. Participants observed the mine at all states of extraction and
reclamation. The participants were initially surprised by the expansive destruction of the strip
mining dragline as they were driven down into the mining pit (Figure 1). However, the
Figure 1. Strip mine site (left) and dragline bucket (right), Oak Hill Mine, Henderson, TX.
controlled nature of the strip mining operation contrasted with devastation of mountaintop
removal coal mining as depicted in the documentary film, Coal Country (Geller, 2009), which
they watched on the way to the mine. Furthermore, the participants were impressed by the
reclamation efforts taken by the coal mining company. They observed a reforested section of the
mine as well as a constructed wetland to mitigate the environmental impacts of the mining
operation (Figure 2). Overall, participants remarked that the coal mine was not as bad as they had
expected and had a generally improved perception of coal as an energy source.

Figure 2. Forest (left) and wetland (right) reclamation sites, Oak Hill Mine, Henderson, TX.
After touring Oak Hill Mine, participants proceeded to Martin Creek Steam Electric
Power Plant, which was down the road from the mine. At Martin Creek, energy company
representatives continued the bus tour and described the process of using the coal that was just
mined to generate electricity. Participants followed the coal from its arrival point to the flue gas
stack looming high over the plant (Figure 3).
Figure 3. Martin Creek Steam Electric Power Plant, Henderson, TX.
Participants did not tour the internal structure of the facility, but viewed intake and cool-
down ponds and visually assessed the environmental impact of the power plant. The contrast of
the facility with the environmental reclamation areas of the Oak Hill Mine had a negative
impression on the participants, and the general consensus shifted, yet again, as they witnessed a
less environmentally friendly side of coal power production.
After the tours of Oak Hill and Martin Creek, the participants viewed the documentary
film, Burning the Future: Coal in America (Novack, 2008), which further depicted the effect of
coal mining in the Appalachian Mountain region. The two films provided perspectives of coal
power, which were contrary to the coal-positive presentations of the industry representatives at
the mine and power plant.
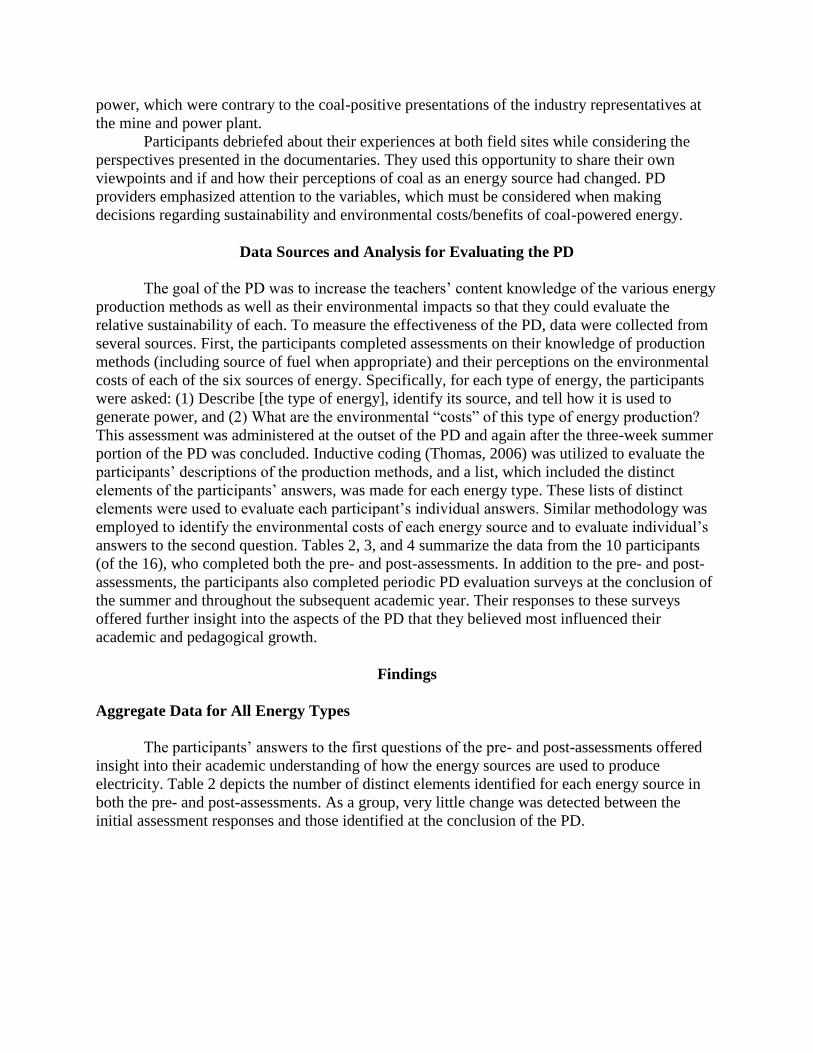
Participants debriefed about their experiences at both field sites while considering the
perspectives presented in the documentaries. They used this opportunity to share their own
viewpoints and if and how their perceptions of coal as an energy source had changed. PD
providers emphasized attention to the variables, which must be considered when making
decisions regarding sustainability and environmental costs/benefits of coal-powered energy.
Data Sources and Analysis for Evaluating the PD
The goal of the PD was to increase the teachers’ content knowledge of the various energy
production methods as well as their environmental impacts so that they could evaluate the
relative sustainability of each. To measure the effectiveness of the PD, data were collected from
several sources. First, the participants completed assessments on their knowledge of production
methods (including source of fuel when appropriate) and their perceptions on the environmental
costs of each of the six sources of energy. Specifically, for each type of energy, the participants
were asked: (1) Describe [the type of energy], identify its source, and tell how it is used to
generate power, and (2) What are the environmental “costs” of this type of energy production?
This assessment was administered at the outset of the PD and again after the three-week summer
portion of the PD was concluded. Inductive coding (Thomas, 2006) was utilized to evaluate the
participants’ descriptions of the production methods, and a list, which included the distinct
elements of the participants’ answers, was made for each energy type. These lists of distinct
elements were used to evaluate each participant’s individual answers. Similar methodology was
employed to identify the environmental costs of each energy source and to evaluate individual’s
answers to the second question. Tables 2, 3, and 4 summarize the data from the 10 participants
(of the 16), who completed both the pre- and post-assessments. In addition to the pre- and post-
assessments, the participants also completed periodic PD evaluation surveys at the conclusion of
the summer and throughout the subsequent academic year. Their responses to these surveys
offered further insight into the aspects of the PD that they believed most influenced their
academic and pedagogical growth.
Findings
Aggregate Data for All Energy Types
The participants’ answers to the first questions of the pre- and post-assessments offered
insight into their academic understanding of how the energy sources are used to produce
electricity. Table 2 depicts the number of distinct elements identified for each energy source in
both the pre- and post-assessments. As a group, very little change was detected between the
initial assessment responses and those identified at the conclusion of the PD.

Table 2
Distinct Elements of Description of Each Energy Source Identified by Participants on the Pre-
and Post-Assessments
Energy Source Pre-Assessment Pre- and Post-Assessment
Coal 6 6
Hydroelectric 3 3
Natural Gas 4 5
Nuclear 5 5
Oil 5 6
Wind 2 3
The second questions on the pre- and post-assessments evaluated the participants’
perceptions of the environmental costs of each energy source. Table 3 displays the number of
environmental costs identified for each before and at the conclusion of the PD (pre- and post-).
Table 3
Number of Environmental Costs of Each Energy Source Identified by Participants on the Pre-
and Post-Assessments
Energy Source Pre-Assessment Pre- and Post-Assessment
Coal 8 10
Hydroelectric 5 8
Natural Gas 10 12
Nuclear 9 10
Oil 7 13
Wind 7 10
In contrast to the descriptions of each energy source, the group identified more environmental
costs for all energy sources on the post-assessment. Tables 2 and 3 represent aggregate data. To
reveal individual growth, each participant’s pre- and post-responses were compared. As an
example, Table 4 illustrates the evaluation of individual responses to questions one and two for
coal.
Individual Data for Coal Generated Electricity
With regard to question one, the participants collectively produced six distinct elements
for how coal is used to generate power; they included (1) mined from the earth, (2) various
grades/types of coal exist, (3) coal is burned, (4) heat from burning coal used to boil water and
produce steam, (5) steam turns a turbine, and (6) a generator captures the energy from the turbine
and converts it to electrical energy. No additional answer elements were identified among the
post-assessments. In contrast to this lack of change as a group, there was individual growth.
Eight of the 10 participants demonstrated a more sophisticated understanding of coal energy
production at the conclusion of the PD (first two columns of Table 4).

Table 4
Distinct Elements of Description and Number of Environmental Costs of Coal Energy on the
Pre- and Post-Assessments for Each Participant
Description Environmental Costs
Participant Pre-Assessment
(out of 6)
Pre- and Post-
Assessment
(out of 6)
Pre-Assessment
(out of 8)
Pre- and Post-
Assessment
(out of 10)
1 3 5 3 5
2 3 3 4 5
3 2 4 3 5
4 5 5 3 5
5 1 3 4 5
6 4 5 4 6
7 0 1 2 3
8 3 5 2 2
9 4 5 2 4
10 1 4 0 2
For example, Participant 10 began the PD with a very limited understanding of how coal is used
to generate electricity. Her initial response (Figure 4) displays that her understanding only
extended to the fact that coal came from the ground (mined from the earth).
Figure 4. Pre-assessment image depicting Participant 10’s understanding of coal energy.
However, by the end of the PD, her conception was much more developed as demonstrated by
her response to the post-assessment prompt:
Coal is [dug] from underground and sent to a place where they will burn this coal. The
heated coal then turns some turbines that connect to generator. This generator then
creates electricity. (Participant 10, post-assessment)
This response includes four answer elements: mined from the earth, coal is burned, steam turns a
turbine, and a generator captures the energy from the turbine and converts it to electrical
energy.
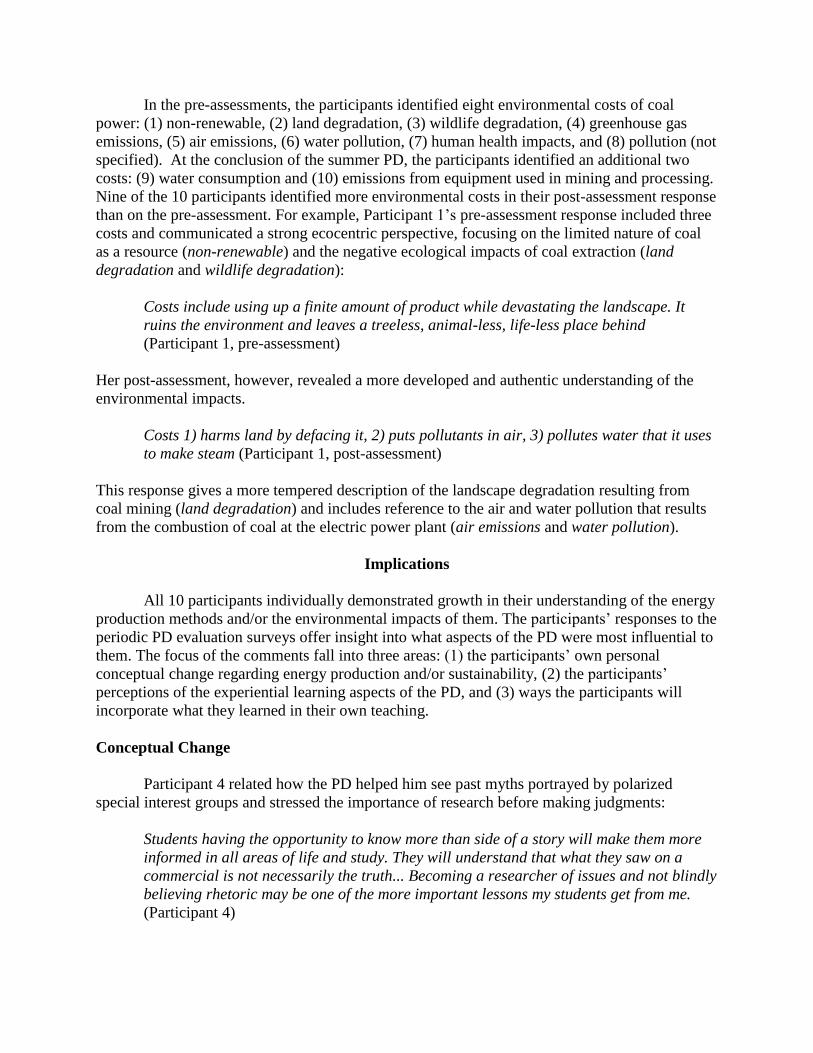
In the pre-assessments, the participants identified eight environmental costs of coal
power: (1) non-renewable, (2) land degradation, (3) wildlife degradation, (4) greenhouse gas
emissions, (5) air emissions, (6) water pollution, (7) human health impacts, and (8) pollution (not
specified). At the conclusion of the summer PD, the participants identified an additional two
costs: (9) water consumption and (10) emissions from equipment used in mining and processing.
Nine of the 10 participants identified more environmental costs in their post-assessment response
than on the pre-assessment. For example, Participant 1’s pre-assessment response included three
costs and communicated a strong ecocentric perspective, focusing on the limited nature of coal
as a resource (non-renewable) and the negative ecological impacts of coal extraction (land
degradation and wildlife degradation):
Costs include using up a finite amount of product while devastating the landscape. It
ruins the environment and leaves a treeless, animal-less, life-less place behind
(Participant 1, pre-assessment)
Her post-assessment, however, revealed a more developed and authentic understanding of the
environmental impacts.
Costs 1) harms land by defacing it, 2) puts pollutants in air, 3) pollutes water that it uses
to make steam (Participant 1, post-assessment)
This response gives a more tempered description of the landscape degradation resulting from
coal mining (land degradation) and includes reference to the air and water pollution that results
from the combustion of coal at the electric power plant (air emissions and water pollution).
Implications
All 10 participants individually demonstrated growth in their understanding of the energy
production methods and/or the environmental impacts of them. The participants’ responses to the
periodic PD evaluation surveys offer insight into what aspects of the PD were most influential to
them. The focus of the comments fall into three areas: (1) the participants’ own personal
conceptual change regarding energy production and/or sustainability, (2) the participants’
perceptions of the experiential learning aspects of the PD, and (3) ways the participants will
incorporate what they learned in their own teaching.
Conceptual Change
Participant 4 related how the PD helped him see past myths portrayed by polarized
special interest groups and stressed the importance of research before making judgments:
Students having the opportunity to know more than side of a story will make them more
informed in all areas of life and study. They will understand that what they saw on a
commercial is not necessarily the truth... Becoming a researcher of issues and not blindly
believing rhetoric may be one of the more important lessons my students get from me.
(Participant 4)

Participant 8 noted how differing opinions on controversial issues such as energy sustainability
and environmental impact can be valid and have their own strengths and weaknesses depending
on the perspective one takes. She stated that the most important theme that emerged for her
during the PD was
…that with each person we met we heard a different view point of the same story and that
each view point each has its strengths and weaknesses and many times the varying
opinion, facts, and general information contradicts each other. So then we are left with
professionals in their fields, all of whom have their own agenda, and we are left with
muddled information with no clear viewpoint from which to take a stance. (Participant 8)
The partisan, one-sided, and often contradictory opinions presented by the various
interested parties, each of which has some elements of truth to them, had exposed the flaw to
accepting any single representation as fully addressing the issue as hand. While the PD exposed
the participants to this complexity behind energy sustainability, it did not provide them with
absolute answers for the problem. Instead, it fostered in them a need to more fully explore such
issues and look for the multiple truths from multiple perspectives.
Experiential Learning
Many of the participants commented on the experiential nature of the PD and attributed
their own personal gains to the first-hand, onsite approach of the field trips. For instance,
Participant 7 commented on her experiences related to coal-generated electricity.
While visiting the coal mine and power plant I saw the entire process with an
understanding of the end result. I was able to understand which buildings served what
function at the plant and critically examine the nature of the mining process and really
analyze if the cost outweighed the benefit. (Participant 7)
Participant 1 noted how the real-life experiences allowed her to connect to her own community
and place.
Having direct contact with the places and topics we were studying really made them real
to me, took them out of abstraction and paper scenarios to a life experience. ... Not only
did the speakers and site visits make the content more relevant, but it also connected us
to what was happening here in our community, in our place. This is an aspect of place
based education that I really had not explored directly in teaching, or in learning.
(Participant 1)
The participants consistently commented on the positive aspects of the experiential learning and
reflected on their desire to replicate, in some way, the experiences for their own students. While
they felt the on-site instruction was most valuable, they also recognized their own inability to
take their students on such extensive field trips due to time and budgetary constraints. They
maintained, however, that they would do what they could via videos, photos, etc. to virtually take
their students on “visits” in order to bring the material to life for them as well.

Impact on Instruction
Participant 4 summed up the impact of the PD as developing his own knowledge base by
exposing the complexity of energy sustainability, reconsidering some of his previously held
beliefs about energy production, developing a healthy skepticism, and considering his classroom
teaching.
I have to assume that what my students may know about a particular topic will not be
coming from a personal encounter, but from something they saw on TV, in a movie, or an
advertisement. The students I teach will be somewhat like me in that they will accept
certain things as true because they hear it all the time. They have not taken the time to
research these things on their own, and until they begin that process, they will not fully
understand these topics. … I tell my students not to take what they hear at face value, but
to check out the claims they are hearing, and this [PD] year has shown me that I have
not been subscribing to my own teaching. It is my plan to provide an opportunity for
students to challenge what they hear in class or in the world in general. (Participant 4)
Participant 4’s ultimate goal of creating a society of informed decision-makers reflects the
overarching intention of the PD. This finding could be the most important as teachers, who
recognize the folly of accepting as fact politically-charged or one-sided stances on environmental
issues, can modify their teaching to encourage their students to avoid making such mistakes.
Conclusions
Sustainability of energy production is a complex issue, and the politicization of
environmentalism over the last several decades has resulted in public perceptions of energy,
which are often simple and one-sided. The present paper describes a professional development
program, which utilized experiential learning in conjunction with mathematical modeling to
expose inservice science teachers to multiple considerations about the sustainability of distinct
energy sources. The overall intention of the PD was to increase the participants’ awareness of the
complexity of energy sustainability. Participants engaged in a combination of experiences
including onsite field trips, expert lectures, documentary films, podcasts, and print media.
Mathematical modeling was used as a vehicle to allow participants to examine these experiences
and identify the variables, which must be considered when determining the sustainability of each
energy type. Via this pedagogical approach, participants’ individual understanding of energy
production methods and their environmental costs was improved. The participants attributed
their conceptual change to the experiential nature of the instruction, in particular the firsthand
observations made possible through field trips.
Most importantly, perhaps, the participants’ conceptions of environmental and
sustainability education developed as well; many reported the desire to use the same learning
approach in their own classrooms to foster their students understanding of sustainability. If future
PD experiences can further inform teachers about the complexity of sustainability issues, then
teachers can take steps to include on-site (or virtual) instruction, presentation of multiple
perspectives, and critical analysis of any sustainability issues. Such PD experiences can further

prepare science teachers to teach for sustainability in a world where such teacher preparedness is
of such critical importance.
Acknowledgements
The professional development described in this paper was funded through the Texas Higher
Education Coordinating Board/Teacher Quality Enhancement grants program.

References
Baimbridge, M. (2004). Towards a new economics. In Blewitt, J. & Cullingford, C. (Eds.), The
sustainability curriculum: The challenge for higher education (pp. 166-178). London,
UK: Earthscan.
Boorman, J. (Director/Producer). (1972). Deliverance [Motion picture]. Burbank, CA: Warner
Home Video.
Boud, D., Keogh, R., & Walker, D. (1985). Reflection: Turning experience into learning.
London, UK: Kogan Page.
Brinkmann, A., & Brinkmann, K. (2007). Integration of energy issues in mathematics
classrooms. In C. Haines, P. Galbraith, W. Blum, & S. Khan (Eds.), Mathematical
modeling (ICTMA 12): Education, engineering and economics (pp. 304-313). Chichester,
UK: Horwood Publishing.
Bybee, R., McCrae, B., & Laurie, R. (2009). PISA 2006: An assessment of scientific literacy.
Journal of Research in Science Teaching, 46(8), 865-883.
Caron, F., & Bélair, J. (2007). Exploring university students’ competencies in modeling. In C.
Haines, P. Galbraith, W. Blum, & S. Khan (Eds.), Mathematical modeling (ICTMA 12):
Education, engineering and economics (pp. 120-129). Chichester, UK: Horwood
Publishing.
Cullingford, C. (2004). Sustainability and higher education. In Blewitt, J. & Cullingford, C.
(Eds.), The sustainability curriculum: The challenge for higher education (pp. pp. 13-23).
London, UK: Earthscan.
Eraut, M. (1994). Developing professional knowledge and competence. London, UK: The Falmer
Press.
Fox, J. (Director/Producer), Adlesic, T. (Producer), & Gandour, M. (Producer). (2010). Gasland:
Can you light your water on fire? [Motion picture]. Brooklyn, NY: International WOW
Company.
Friedman, T.L. (2008). Hot, flat, and crowded: Why we need a green revolution – and how it can
renew America. New York, NY: Farrar, Straus and Giroux.
Galbraith, P., Stillman, G., Brown, J., & Edwards, I. (2007). Facilitating middle secondary
modeling competencies. In C. Haines, P. Galbraith, W. Blum, & S. Khan (Eds.),
Mathematical modeling (ICTMA 12): Education, engineering and economics (pp. 130-
140). Chichester, UK: Horwood Publishing.
Garvey, D. (2013). Only experience can bring us to the truth. Journal of Sustainability
Education, 5(1). Retrieved from http://www.jsedimensions.org/wordpress/2996-2/
Geller, P. (Director/producer) & Evans, M. (Producer). (2009). Coal Country [Motion picture].
Laurel, MD: Evening Star Productions.
Gelpke, B. (Director/producer), McCormack, R. (Director/producer), & Caduff, R. (Co-director).
(2006). A Crude Awakening: The Oil Crash [Motion picture]. Zurich, Switzerland: Lava
Productions AG.
Giordano, F.R., Weir, M.D., & Fox, W.P. (2003). A first course in mathematical modeling.
Pacific Grove, CA: Brooks/Cole.
Haines, C.R., & Crouch, R. (2010). Remarks on a modeling cycle and interpreting variables. In
R. Lesh, P.L. Galbraith, C.R. Haines, & A. Hurford (Eds.), Modeling students’
mathematical competencies (pp. 145-154). New York, NY: Springer.
Hilborn, R., & Mangel, M. (1997). The ecological detective: Confronting models with data.
Princeton, NJ: Princeton University Press.

Kolb, D.A., (1984). Experiential learning: Experience as the source of learning and
development. Englewood Cliffs, NJ: Prentice-Hall.
Maaβ, K. (2006). What are modeling competencies? ZDM. The International Journal of
Mathematics Education, 38(2), 113-142.
Medrick, R. (2013). Experiential education for change. Journal of Sustainability Education, 5(1).
Retrieved from http://www.jsedimensions.org/wordpress/2996-2/ Moon, J.A. (1999). Reflection in learning & professional development: Theory & Practice.
London, UK: Kogan Page.
Moscardini, A.O. (1989). The identification and teaching of mathematical modelling skills. In
W. Blim, M. Niss, & I. Huntley (Eds.), Modelling, applications and applied problem
solving: Teaching mathematics in a real context (pp. 36-42). Chichester, UK: Ellis
Horwood Limited.
Munakata, M. (2006). A little competition goes a long: Holding a mathematical modeling contest
in your classroom. Mathematics Teacher, 100(1), 30-39.
Nichols, M. (Director/Producer) & Hausman, M. (Producer). (1983). Silkwood [Motion picture].
Beverly Hills, CA: Twentieth Century Fox.
Novack, D. (Director/producer), Rosenfeld, D. (Producer), Follini (Producer), & Zoullas
(Producer). (2008). Burning the Future: Coal in America [Motion picture]. New York,
NY: New Video Group, Inc.
Pollak, H. (2007). Mathematical modeling – A conversation with Henry Pollak. In W. Blum,
P.L. Galbraith, H.W., Henn, & M. Niss (Eds.), Modelling and applications in
mathematics education: The 14th
ICMI study (pp. 109-120). New York, NY: Springer.
Pollak, H.O. (2011). What is mathematical modeling? In H. Gould, D.R. Murray, A. Sanfratello,
& B.R. Vogeli (Eds.), Mathematical modeling handbook (pp. vi-vii). Bedford, MA:
COMAP.
Saylan, C. & Blumstein, D.T. (2011). The failure of environmental education [and how we can
fix it]. Berkeley, CA: University of California Press.
Texas Comptroller of Public Accounts. (2008). The Energy Report 2008. Retrieved from
http://www.window.state.tx.us/specialrpt/energy/
Thomas, D.R. (2006). A general inductive approach for analyzing qualitative evaluation data.
American Journal of Evaluation, 27(2), 237-246.

Author Photos
Mark Bloom
Sarah Quebec Fuentes
Kelly Feille
Molly Holden
Photo to represent article
Related Documents