The Value of Engagement

EXPLOREMN_Eklund Presentation 2015
Aug 06, 2015
Welcome message from author
This document is posted to help you gain knowledge. Please leave a comment to let me know what you think about it! Share it to your friends and learn new things together.
Transcript
The Value of Engagement
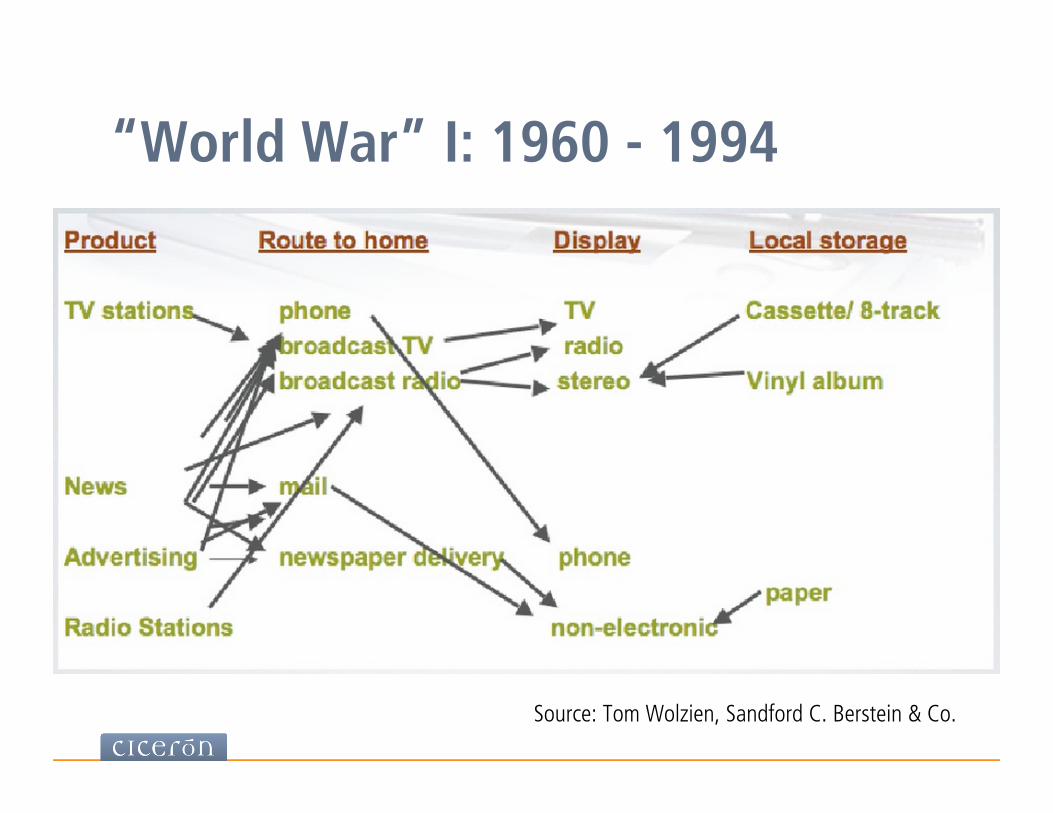
“World War” I: 1960 - 1994
Source: Tom Wolzien, Sandford C. Berstein & Co.
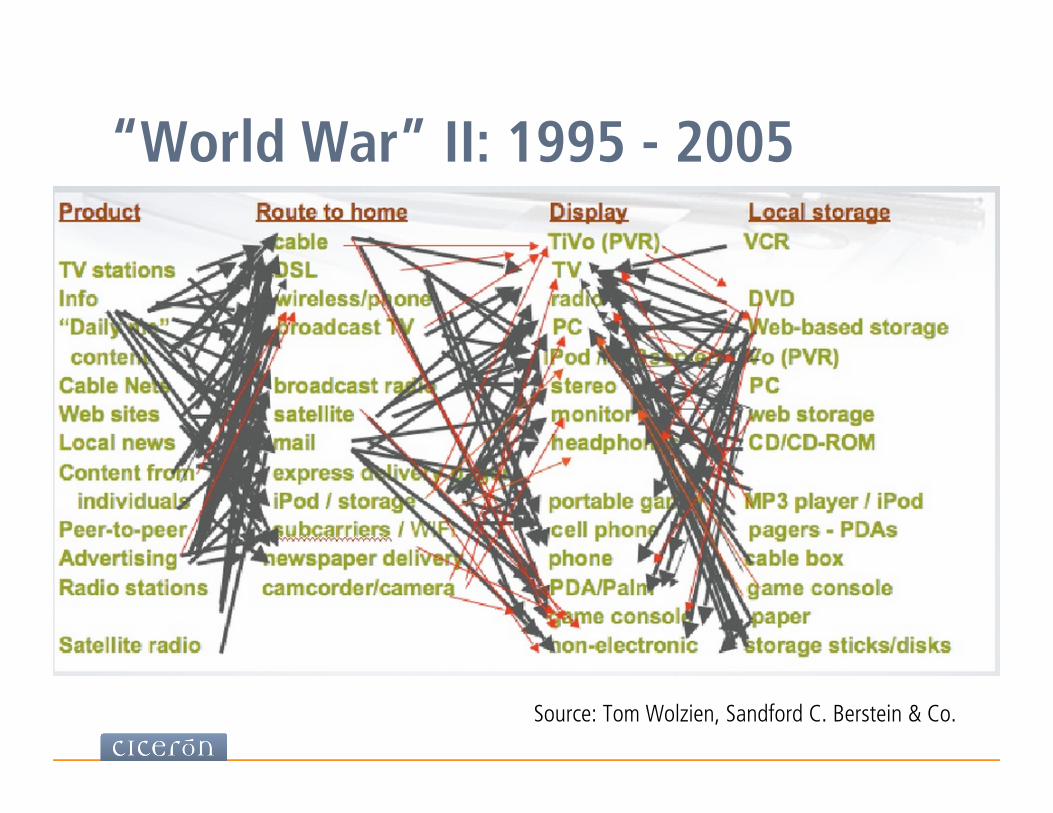
“World War” II: 1995 - 2005
Source: Tom Wolzien, Sandford C. Berstein & Co.
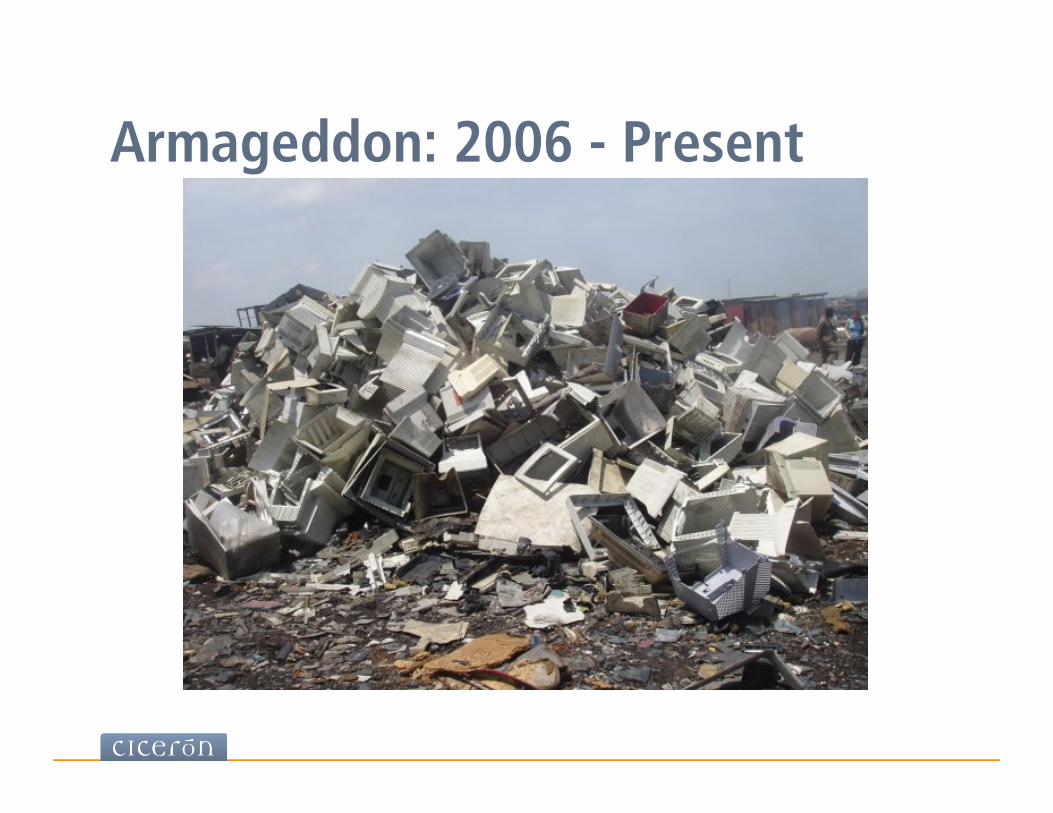
Armageddon: 2006 - Present

Source: Parago, April 2014
Vacationers Turn to Google First FUEL THE CONTENT BEAST
6

Source: Expedia Media Solutions, March 2013
Vacation package travelers visit 38 sites before purchasing a vacation. 2.5 3.0 3.4
5.2
6.9
15.5
5 Weeks Out 4 Weeks Out 3 Weeks Out 2 Weeks Out 1 Week Out Week of Booking
Average Travel Sites Visited per Week
Opportunity: Inspire Travel & Build Awareness of the Delta Vacations Brand Early in the Dreaming & Planning Stages PROBLEM: PURCHASING A VACATION PACKAGE IS A TIME-INTENSIVE PROCESS
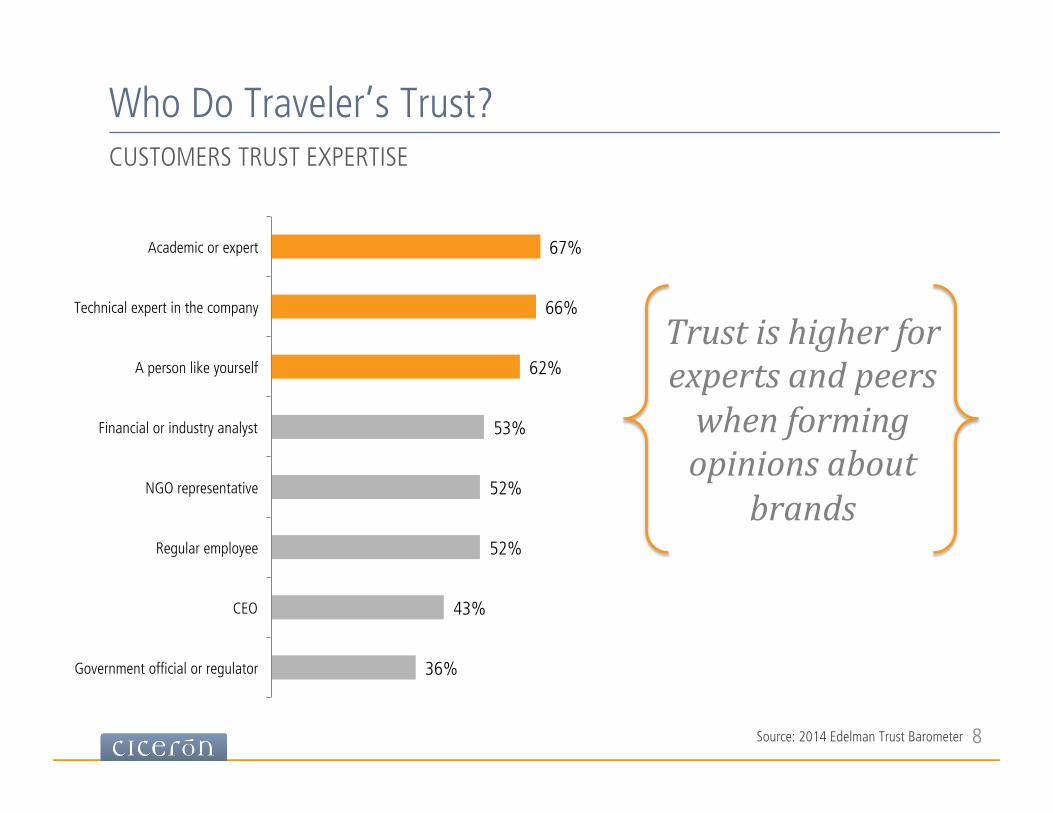
Source: 2014 Edelman Trust Barometer
36%
43%
52%
52%
53%
62%
66%
67%
Government official or regulator
CEO
Regular employee
NGO representative
Financial or industry analyst
A person like yourself
Technical expert in the company
Academic or expert
Trust is higher for experts and peers when forming opinions about
brands
Who Do Traveler’s Trust? CUSTOMERS TRUST EXPERTISE
8
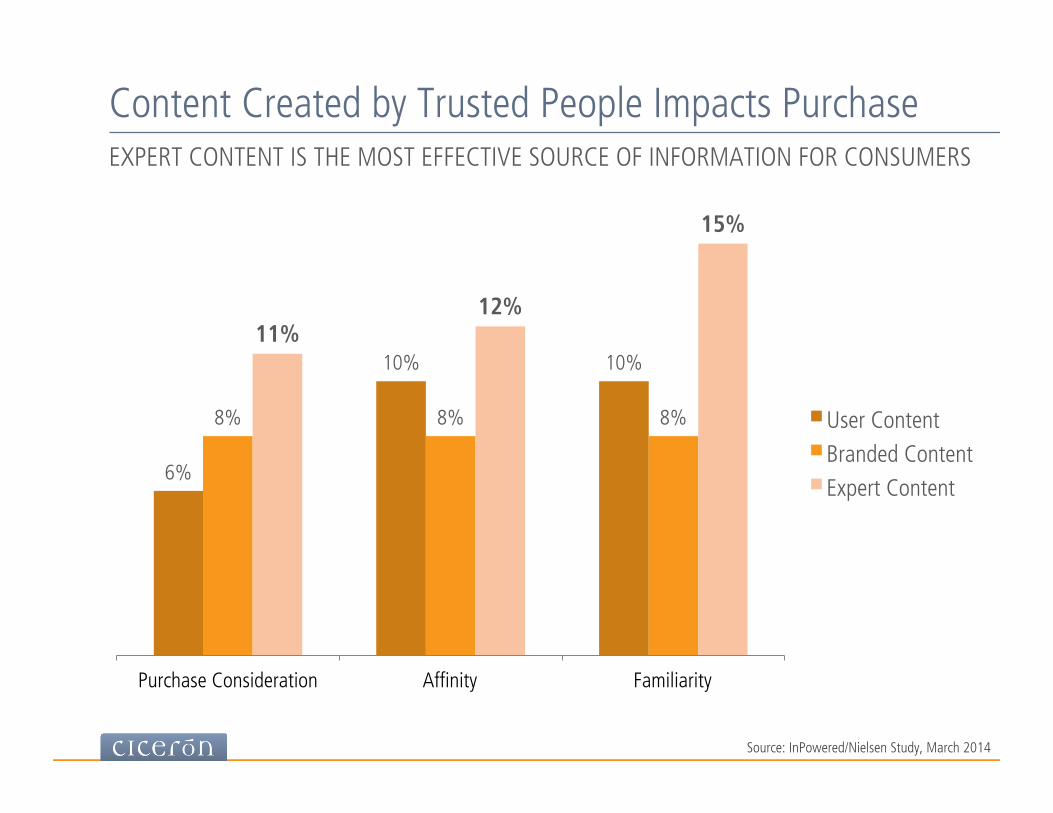
Content Created by Trusted People Impacts Purchase EXPERT CONTENT IS THE MOST EFFECTIVE SOURCE OF INFORMATION FOR CONSUMERS
Source: InPowered/Nielsen Study, March 2014
6%
10% 10%
8% 8% 8%
11% 12%
15%
Purchase Consideration Affinity Familiarity
User Content Branded Content Expert Content
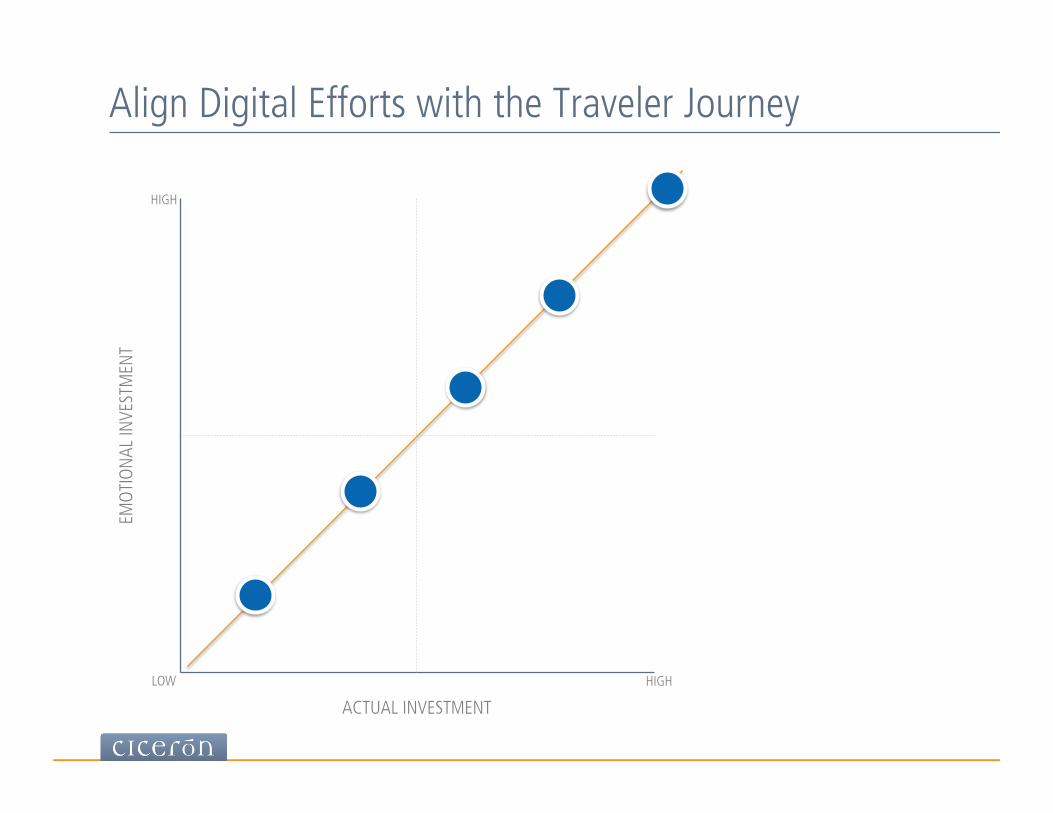
Align Digital Efforts with the Traveler Journey
ACTUAL INVESTMENT
EMOT
IONA
L IN
VEST
MEN
T
LOW HIGH
HIGH

Align Digital Efforts with the Traveler Journey
ACTUAL INVESTMENT
EMOT
IONA
L IN
VEST
MEN
T
LOW HIGH
HIGH
RISK
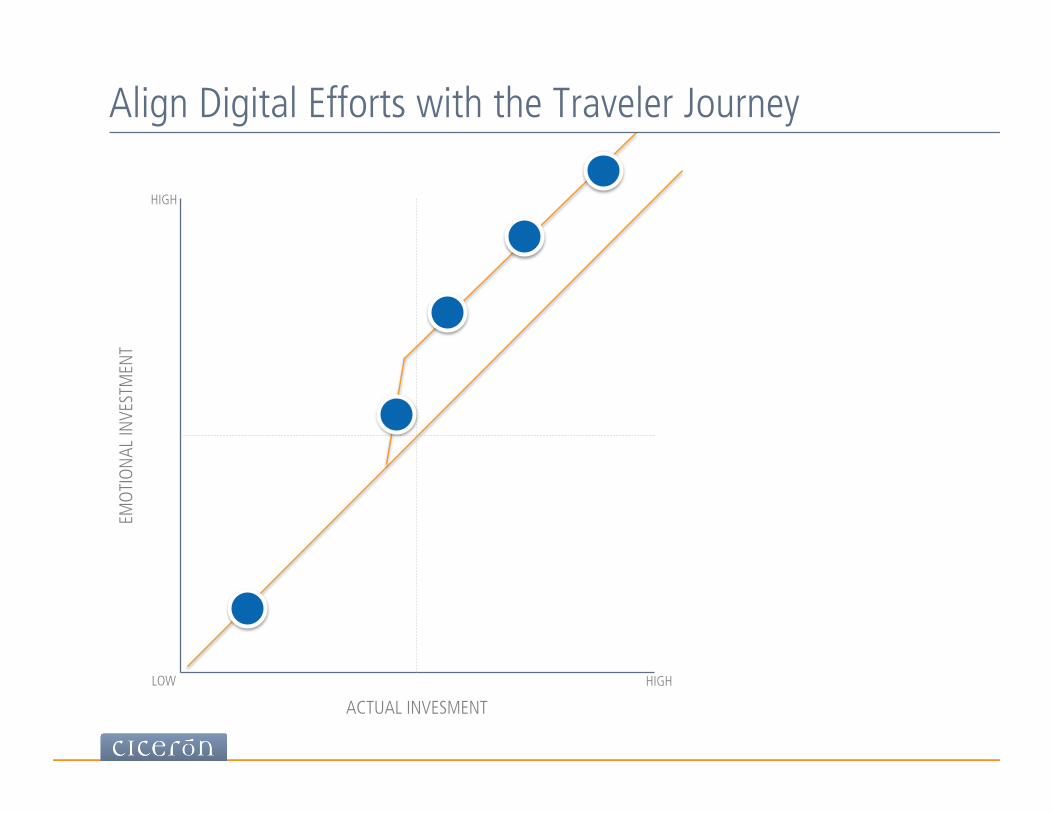
Align Digital Efforts with the Traveler Journey
ACTUAL INVESMENT
EMOT
IONA
L IN
VEST
MEN
T
LOW HIGH
HIGH

Travel Agents Want Expert Content, Too
75%
67%
51%
67%
37%
0% 20% 40% 60% 80%
Upcoming Deals/Promotions
Destination Information
Recommended Trips & Tours
Vacation Inspiration
Client Stories
Deals, destination info & inspirational content are of similar priority.
Source: Travel Professionals Survey, N=450
WHAT TYPE OF INFORMATION DO YOU SHARE ON YOUR SOCIAL MEDIA ACCOUNTS?
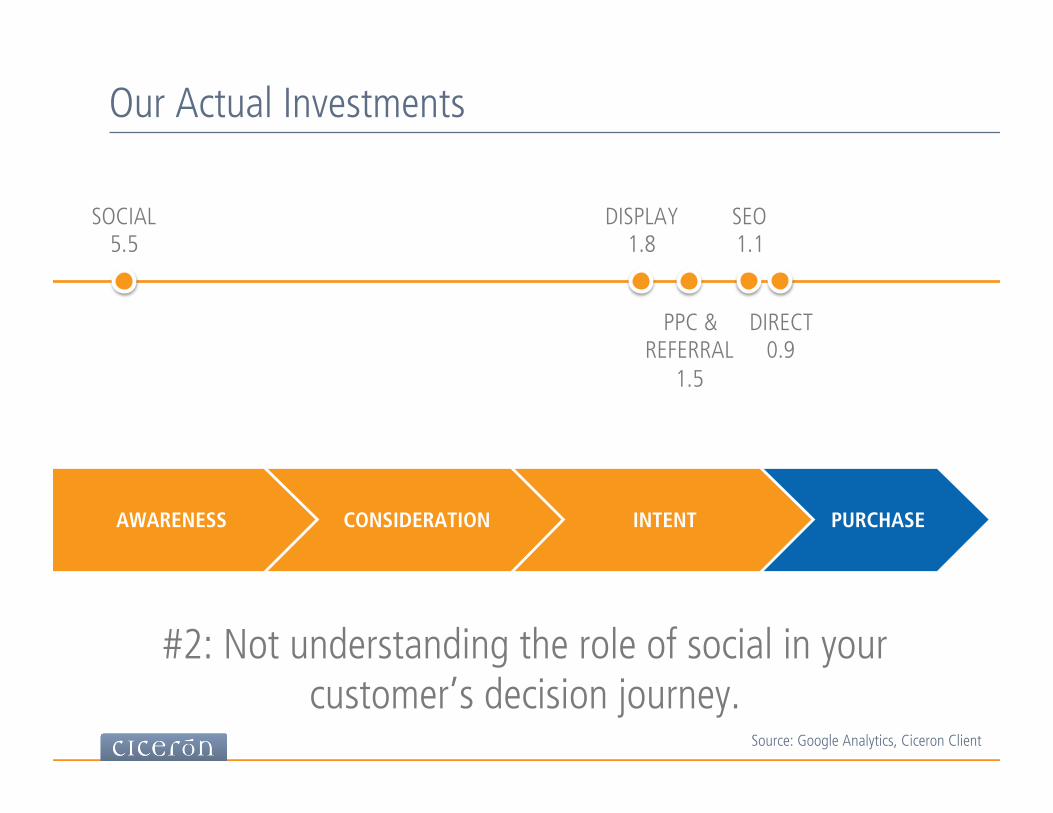
Our Actual Investments
AWARENESS CONSIDERATION INTENT PURCHASE
SOCIAL 5.5
DISPLAY 1.8
PPC & REFERRAL
1.5
DIRECT 0.9
SEO 1.1
#2: Not understanding the role of social in your customer’s decision journey.
Source: Google Analytics, Ciceron Client

Recommendation: Support the Desire for Authentic Travel Experiences CURATE EXPERIENCES FROM EXPERT TRAVELERS INSIGHT: SOCIAL CONTENT DOMINATES TRAVEL RESEARCH ACROSS MULTIPLE SCREENS ü 43% of online travel researchers
read reviews from other travelers1
ü 31% of online travel researchers watched travel-related videos1
ü 24% of online travel researchers read travel-related blogs1
ü 87% of travelers said they use Facebook for inspiration when planning travel2

16
Recommendation: Identify Influential Travelers to Fuel Content Marketing MULTIPLY THE IMPACT OF A SINGLE PIECE OF CONTENT VIA CO-MARKETING

DNA of Advocacy
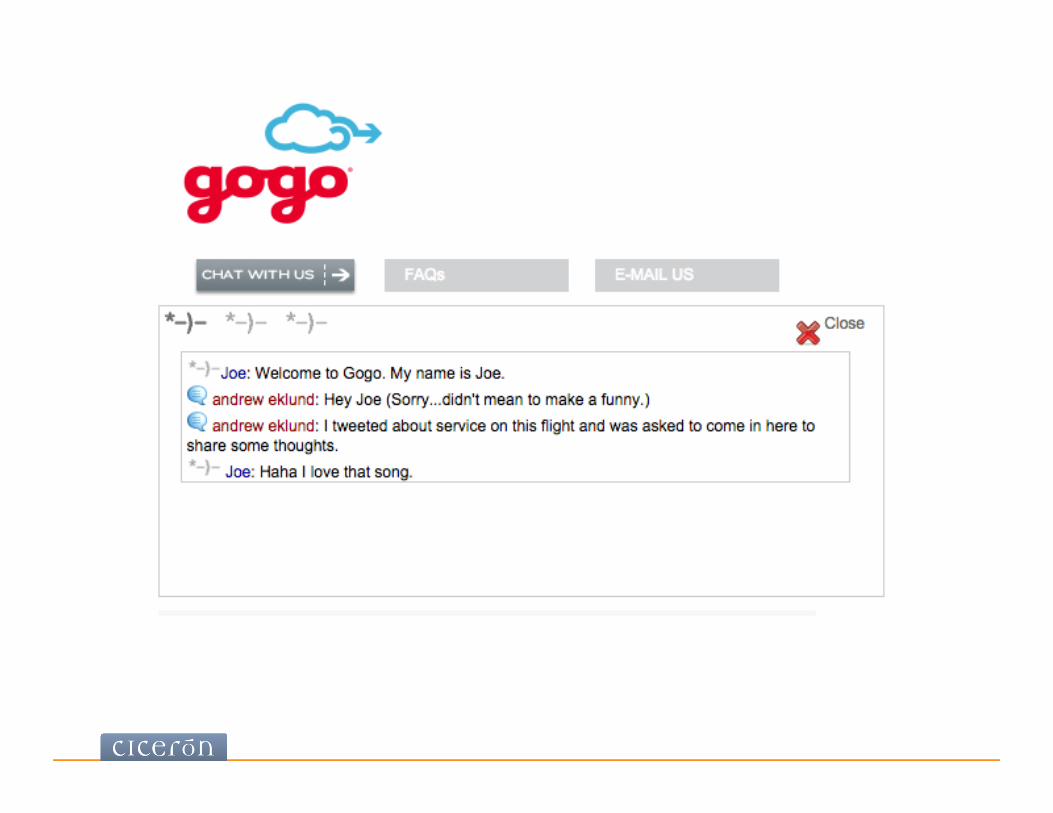
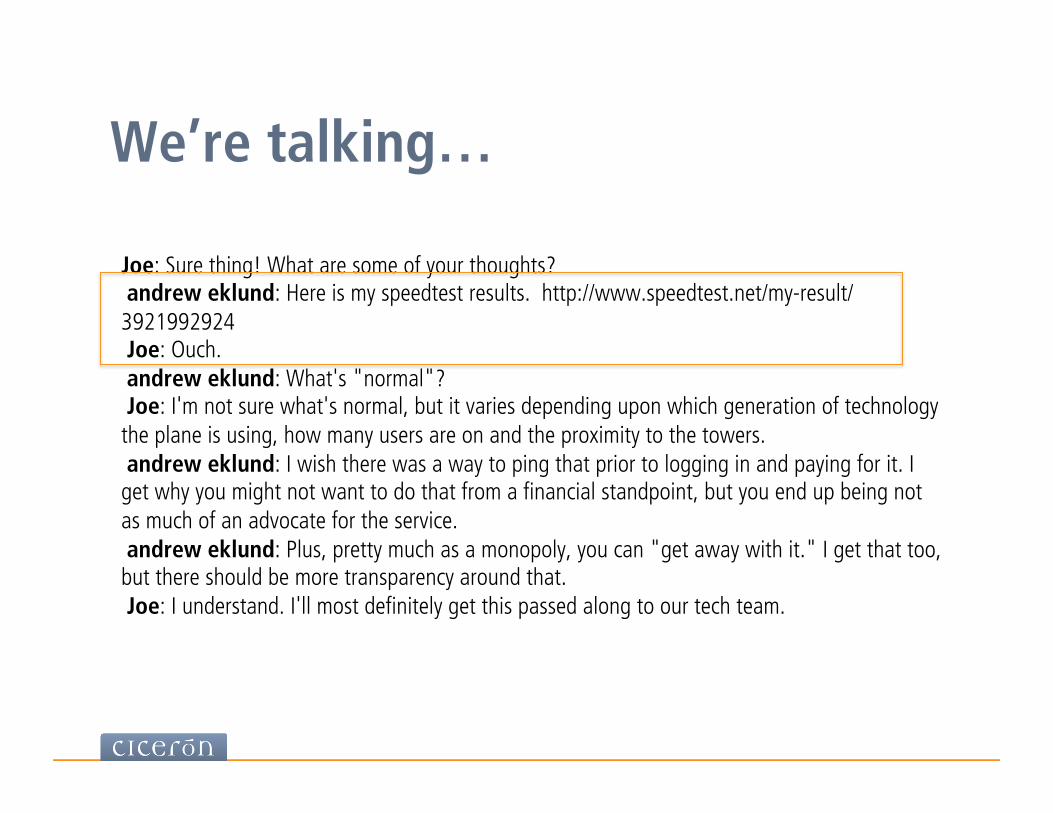
We’re talking…
Joe: Sure thing! What are some of your thoughts? andrew eklund: Here is my speedtest results. http://www.speedtest.net/my-result/3921992924 Joe: Ouch. andrew eklund: What's "normal"? Joe: I'm not sure what's normal, but it varies depending upon which generation of technology the plane is using, how many users are on and the proximity to the towers. andrew eklund: I wish there was a way to ping that prior to logging in and paying for it. I get why you might not want to do that from a financial standpoint, but you end up being not as much of an advocate for the service. andrew eklund: Plus, pretty much as a monopoly, you can "get away with it." I get that too, but there should be more transparency around that. Joe: I understand. I'll most definitely get this passed along to our tech team.

We’re solving…
Joe: If you'd like, I can get you a code for a free pass on your next flight. andrew eklund: I wouldn't mind that. Thank you. Thanks for the help. Joe: You're welcome. Just one moment while I grab that for you. Joe: 2kdybhst324cc7 andrew eklund: Thanks for the help. I'll copy the code for tomorrow. Joe: You're welcome. Is there anything else I can help you with today? andrew eklund: Nope. Good to go. Joe: Great! Have an awesome day Andrew!

Advocacy…

INSTAGRAM WINS?
Facebook Acquires

INSTAGRAM WINS.

=
(This slide meant to be humorous.)

People Lust for One Another • Social Networks • Aggregators • Apps

Q: How many times do you need to be exposed to something to believe that it is true?
Source: 2013 Edelman Trust Barometer
3 Times 35%
4-5 Times 29%
6-9 Times 6%
10+ Times 12%
1 Time 4%
2 Times 14%
64% need to be exposed 3-‐5 times before they believe something is true
The War on Trust CUSTOMERS DO NOT TRUST BRANDS

36%
43%
52%
52%
53%
62%
66%
67%
Government official or regulator
CEO
Regular employee
NGO representative
Financial or industry analyst
A person like yourself
Technical expert in the company
Academic or expert
Source: 2014 Edelman Trust Barometer
Trust is higher for experts and peers when
forming opinions about brands
The War on Trust THEY TRUST EXPERTS & PEOPLE LIKE THEM
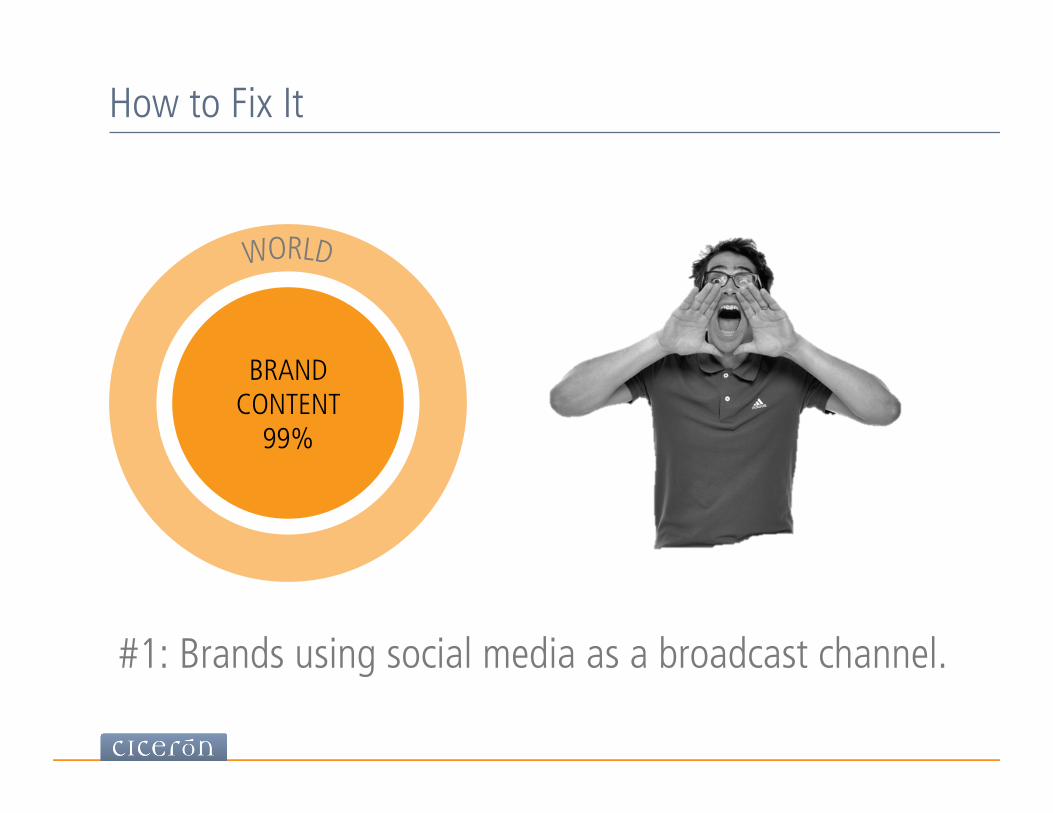
BRAND CONTENT
99%
How to Fix It
#1: Brands using social media as a broadcast channel.

Realign Budgets & Resources
AWARENESS CONSIDERATION INTENT PURCHASE
SOCIAL 5.5
DISPLAY 1.8
PPC & REFERRAL
1.5
DIRECT 0.9
SEO 1.1
#2: Not understanding the role of social in your customer’s decision journey.
Source: Google Analytics, Ciceron Client
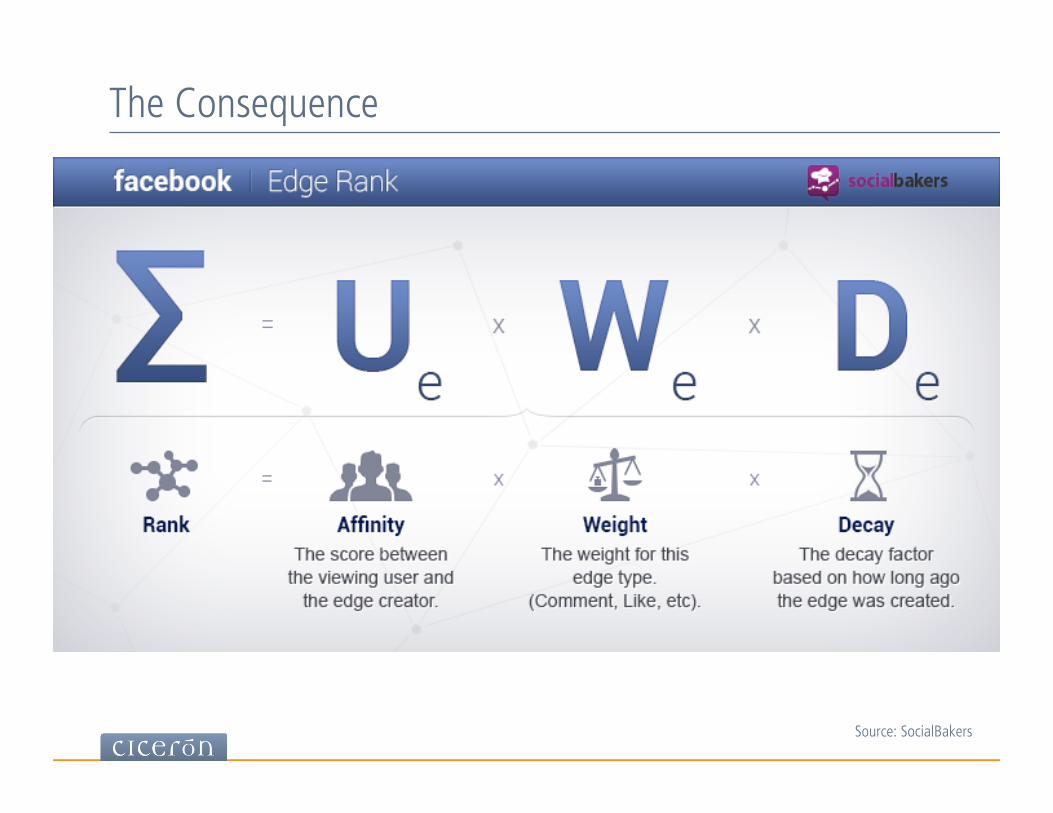
The Consequence
Source: SocialBakers

BRAND CONTENT
1%
The Real Opportunity of Social Media

Advocates share more 12X advocate sharing vs.
fan sharing
Advocate audiences trust friends
10X audience engagement of advocate content vs. paid
branded content
Advocates create the most engaging content 7X advocate engagement of advocate content vs. brand
owned content
Source: SocialChorus, 2014
Why Are Advocates Important?

Define the Business Opportunity
INPUT Advocacy
Identified Advocates 500
Potential Reach per Month 50% Advocate Participation & Share Rate * 350 Avg. Social Network Size * 12 Posts 525,000
Total Clicks to Site 1% Clickthrough Rate 5,250
Site Conversion Rate 2.5%
Potential Sales 131
Potential Monthly Revenue $300 Average Revenue $39,375
Annual Total Revenue $472,500
INPUT Public FB Page
Facebook Fans 100,000
Fans Reached per Month 5% Avg. Fans Reached per Post X 12 Posts per Month 60,000
Total Clicks to Site 1% Clickthrough Rate 600
Site Conversion Rate 2%
Potential Sales 12
Potential Monthly Revenue $300 Average Revenue $3,600
Annual Revenue Potential $43,200
SHOULD YOU FOCUS ON FAN GROWTH OR ADVOCATE ACTIVATION?
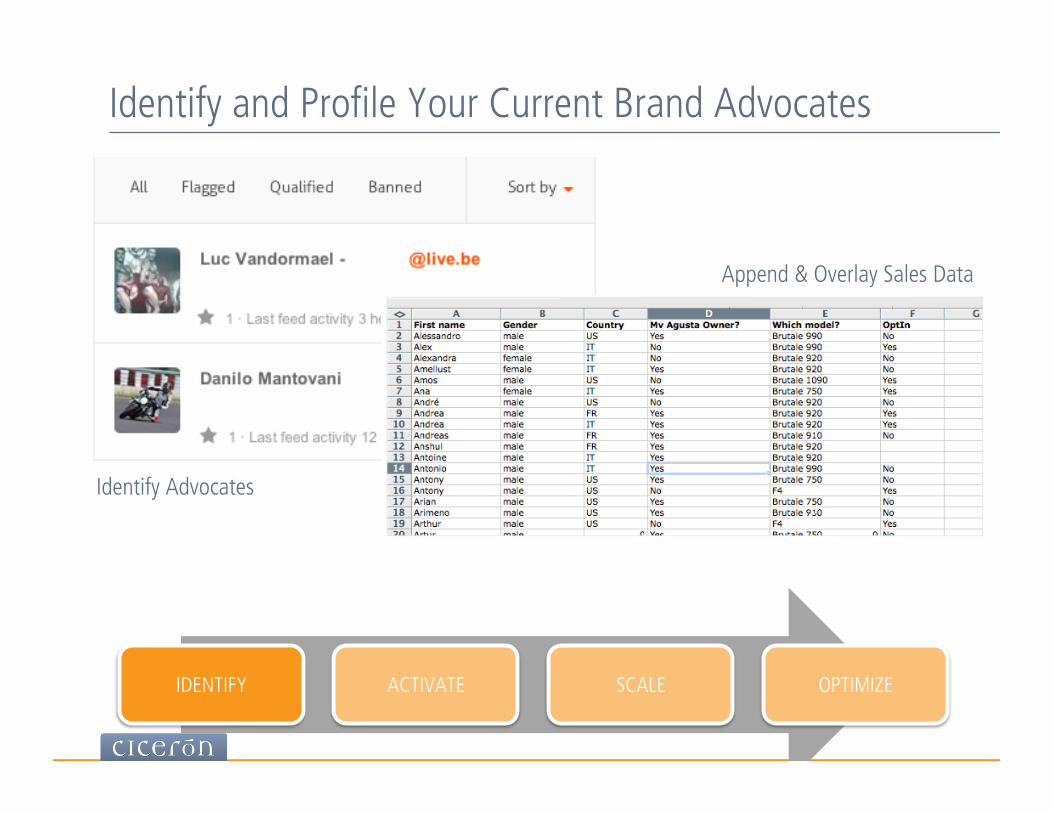
Identify and Profile Your Current Brand Advocates
IDENTIFY ACTIVATE SCALE OPTIMIZE
Identify Advocates
Append & Overlay Sales Data

35
10.5% Engagement Rate 10% of fans Reached
3.6% Engagement Rate 11% of fans Reached
20% Engagement Rate 15% of fans Reached
Create Relevant Content to Engage Advocates
IDENTIFY ACTIVATE SCALE OPTIMIZE

Use Technology to Bring Scale to, NOT Replace, Human Relationships
IDENTIFY ACTIVATE SCALE OPTIMIZE

Measure Results and Optimize Program
IDENTIFY ACTIVATE SCALE OPTIMIZE

Change Required to be Successful in a Social World
BRAND CONTENT
99%
BRAND CONTENT
1%

Thank You! Questions?

The Efficacy of Expert Content

Where brands are investing
(Do you like these infographics? We do too.)

Thank You
We build brand advocacy.
Related Documents