Experimental Verification of Cooling Load Calculations for Spaces with Non-Uniform Temperature Radiant Surfaces ASHRAE 1729-TRP Project Prepared by Dr. Atila Novoselac – Principle Investigator Dr. Stephen Bourne – Research Assistant Ardeshir Moftakhari – Research Assistant Contact Information Department of Civil, Environmental and Architectural Engineering University of Texas at Austin 5.422 ECJ, 1 University Station C 1752 Austin, TX 78712-1076 512-905-4917

Welcome message from author
This document is posted to help you gain knowledge. Please leave a comment to let me know what you think about it! Share it to your friends and learn new things together.
Transcript

Experimental Verification of Cooling Load
Calculations for Spaces with Non-Uniform
Temperature Radiant Surfaces
ASHRAE 1729-TRP Project
Prepared by
Dr. Atila Novoselac – Principle Investigator
Dr. Stephen Bourne – Research Assistant
Ardeshir Moftakhari – Research Assistant
Contact Information
Department of Civil, Environmental and Architectural Engineering
University of Texas at Austin
5.422 ECJ, 1 University Station C 1752
Austin, TX 78712-1076
512-905-4917

2
CONTENTS
Experimental Apparatus …………………………………………………………………………………………….……….7
Experimental Facility…………………………………………………………………………………………………….…...7
Measurement Instrumentations……………………………………………………………………………………….……....8
Uncertainty Analysis…………………………………………………………………………………………………….……9
Experimental Program………………………………………………………………………………………………….….11
Experimental Protocols…………………………………………………………………………………………………….….11
Experimental Matrix………………………………………………………………………………………………….………..11
Summary of Experimental Test……………………………………………………………………………………….……...12
Experiment No.1: Radiant panel vs All-Air system under solar and radiative loads………………………………….………12
Experiment No. 2: Radiant panel vs All-Air system with internal loads……………………………………………………...16
Experiment No. 3: Radiant panel vs All-Air system with constant internal loads ……………………………………………21
Experiment No. 4: Radiant panel vs All-Air system with internal loads in typical office working schedule ………………... 24
Experiment No. 5: Radiant panel vs All-Air system cooling performance under dominant solar load ……………………….27
References ……………………………………………………………………………………………………………………..30

3
LIST OF FIGURES
Fig.1: Test chambers at Thermal Façade Laboratory………………………………………………………………………………..5
Fig. 2: Experimental setups, Radiant cooling sources configurations and temperature sensor map in Test chambers……………..7
Fig. 3: Solar, Radiative and Total Heat gains for the full-scale experiment during August 1st to August 5th. …………………….10
Fig.4: Net sensible space cooling rate for the full-scale experiment during August 1st to August 5th……………...……………...11
Fig.5: Wall surface, mean radiant and air temperatures for the full-scale experiment during August 1st to August 5th…………12
Fig.6: The configuration of internal radiative and convective heater sources for the full-scale experiment………………………14
Fig.7: Solar, internal convective, radiative heat gains for the full-scale experiment during August 9th to August 14th…………...15
Fig.8: Net space cooling rate for the full-scale experiment during August 9th to August 14th1……………………………………16
Fig.9: Wall surface, air temperature profiles for the full-scale experiment during August 9th to August 14th…….………………17
Fig.10: Solar, internal convective, radiative heat gains for full-scale experiment during August 17th to August 20th ……………19
Fig.11: Net space sensible cooling rate for full-scale experiment during August 17th to August 20th………………….…………19
Fig.12: Wall surface, MRT, Air temperatures for full-scale experiment during August 17th to August 20th……..……………….20
Fig.13: Solar, internal convective, radiative heat gains for full-scale experiment during August 22nd to August 24th……..…….22
Fig.14: Net space sensible cooling rate for full-scale experiment during August 22nd to August 24th………………...………….22
Fig.15: Wall surface, MRT, Air temperatures for full-scale experiment during August 22nd to August 24th…………..…………23
Fig.16: Solar, internal convective, radiative heat gains for full-scale experiment during August 31st to September 3rd …...…….25
Fig.17: Net space sensible cooling rate for full-scale experiment during August 31st to September 3rd…………..………………25
Fig.18: Wall surface, MRT, Air temperatures for full-scale experiment during August 31st to September 3rd………………...….26

4
LIST OF TABLES
Table 1: List of instrumentation used and measurement accuracy …………………………………………………………7
Table 2: Experimental matrix of finished experiments ………………………………………………………… 11

5
ACKONOLEDGMENT
The authors would like to express their sincere gratitude toward the dear committee members for their
useful comments, suggestions, guidance, and criticism during the ASHRAE 1729-TRP project meetings.

6
1 EXPERIMENTAL APPARATUS
1-1: Experimental Facility
Two identical test chambers were used to perform a set of comparative experiments on cooling
performance of radiant panel versus all-air system in the-state-of-Art Thermal Façade Laboratory at
University of Texas in Austin, illustrated in Figure 1-a. The main purpose of the test chambers is to represent
typical office spaces exposed to environmental conditions as well as internal occupancy patterns. The mid-
sized test chambers are placed outdoors on a steel deck six meters above the street below. All external walls
of the test chambers are exposed to outdoor weather conditions with a large façade on southern side of each
chamber. As shown in Figure 1-b, the test chambers are employed to emulate cooling load, particularly in
commercial buildings, where total heat exchange is almost negligible among adjacent office spaces. The
state-of-art facility enables precise measurement of environmental heat gain, such as solar radiation, heat
conduction, etc., entering the test chambers during daily operation as shown in Figure 1-c.
The structure of each test chamber is composed of a spacious glass façade on the south side, coupled
with wall/ceiling/floor panels on the remaining sides that are heavily insulated to minimize thermal energy
exchange with the outdoor environment. The glass façade is comprised of an outer pane of 0.006 (m) low-
E glass, a 0.013 (m) argon-filled gap and a 0.006 (m) clear glass inner pane. The total size of the façade is
3.58 (m)×2.64 (m), which is divided into three separate windows by vertical dividers. The external walls
and ceiling are comprised of similar materials; from interior to exterior: 0.032 (m) Gypsum drywall, 0.11
(m) Fiberglass-reinforced polyisocyanurate (FRP), 0.102 (m) structural insulated panel (SIP), 0.013 (m)
Cementous panel over air gap with average U-value of 0.1067 (W m2. K⁄ ). This results in an average U-
value of 0.085 (W m2. K⁄ ). The total net size of each test chamber is 3.62 (m)×3.98 (m)×2.82 (m). The
floor is comprised of the following materials: 0.003 (m) gray carpet, 0.038 (m) plywood, 0.11 (m)
fiberglass-reinforced polyisocyanurate, 0.102 (m) SIP and covered with 0.1 (m) of concrete blocks on its
surface. The structure of each test chamber is well-sealed to prevent infiltration from the outdoor
environment.
Each test chamber includes three parallel radiant cooling panel, that are installed at a height of 2.5
(m) in the ceiling. The size of each radiant panel is 2.4 (m) ×0.65 (m) per each, as it is shown in Figure 2-
b. The Areo-Tech radiant cooling panels were composed of copper tubes mechanically bonded to an
aluminum extrusion sheet. The copper tubes are connected to a hydronic piping loop. To minimize heat
loss from the copper tubes, a 0.2 (m) cotton fiberglass insulation layer was utilized to fill the air gap on the
top side of copper tubes to the ceiling. A dedicated chilled water system is responsible for supplying chilled
water to the radiant panels. The dedicated chiller uses single-phase water - propylene glycol mixture as a
working fluid. The total cooling capacity of the dedicated chilled water system was 2.0 (TONR), which can
be modulated according to load by controlling supply water temperature, flow rate, or fan speed (cooling
coil).

7
(a) Thermal façade lab in University of Texas at Austin
(b) Test chambers emulating office buildings (c) Weather station, Pyranometers and measurement devices
Figure 1: Test chambers at Thermal Façade Laboratory
The use of radiant panels reduces the amount of heat accumulation in the thermal mass within the test
chamber. 180 Concrete blocks (0.4 (m) × 0.19 (m) × 0.05 (m)) have been placed on the floor to mimic the
effects of thermal mass found in actual office buildings. Altering the density and depth of concrete blocks
modulates the effect of thermal mass in the test chambers. A portion of heat gain is absorbed into the
concrete blocks, which is later released into the space to be removed by the cooling equipment.
1-2: Measurement Instrumentations
Table 1 outlines the equipment employed to precisely measure temperatures, heat fluxes, flow rates,
etc. in the test chambers. To analyze heat transfer, a set of Omega 44033 thermistors were deployed to
measure temperature on wall surfaces as shown in Figure 2-a. The Omega 44033 thermistors utilized to
measure surface temperature have an accuracy of ± 0.1 C. These thermistors were placed around the test
chamber as represented in Figure 2-c. There were 46 thermistors integrated into wall surfaces to measure
surface temperatures. These were covered with tape to mimic thermal properties of the walls in the test
chambers. There were 9 distinct thermistors positioned on the active cooled surface of the radiant cooling
panels for temperature measurement. Additionally, a combination of 6 thermistors placed on the concrete
blocks facilitated surface floor temperature measurements. Six thermistors were installed on a vertical stand
at standard height levels (0.1, 0.6, 1.1, 1.6, 2.1, 2.6 m) to monitor both Mean Radiant Temperature (MRT) and
ambient temperature, while specific thermistors were deployed to measure supply and return air
8
temperatures on supply and return vents. On the façade, a set of 9 thermistors were employed for window
surface temperature measurement; these thermistors were covered with metallic tape to prevent solar
radiative heat gain from the space or external sources. In Figure 2-d, the general arrangement of temperature
sensors is presented in further detail.
A Davis Vantage Pro-Plus Weather Station was installed outside the test chambers to monitor
environmental conditions. This device is capable of measuring air temperature with accuracy of ±0.5 C,
wind velocity and direction with accuracy of ±5% using Davis Anemometer 6410, and global solar
radiation with a silicon photodiode type pyranometer with an accuracy of ±5% with ±2% drift per year.
An Eppley Precision Spectral Pyranometer (PSP) with an accuracy of ±1% was used in calculating WWR,
which was field-calibrated. Additionally, an onset silicon pyranometer (S-LIB-M003) was installed in the
southern side of the test chambers outdoors to monitor global horizontal radiation. The Davis Vantage
pyranometer was calibrated during a three-day-reading period using a linear correlation function (R2 =
0.973). Another Eppley PSP was utilized for measuring global diffused solar radiation flux transmitted into
the chanmber; this PSP was located at mid-window on a metal strand in the test chamber.
A set of temperature sensors were deployed on the hydronic loop to monitor chilled water properties
during the operation of radiant cooling panels. The Omega 44033 thermistors were used to measure water
temperature on the copper inlet and outlet pipes of the cooling coil with an accuracy of ±0.1 C. To insure
the accuracy of temperature differences, thermistors used in this application were field-calibrated as a pair.
An Omega FTB-4605 flow meter was used to determine chilled water flow rate in the radiant cooling loop
with an accuracy of ±2%. These are field-calibrated using a linear correlation function (𝑅2 = 0.9995)
between flow rate and output signal meter. A single-phase water-proylene glycol mixture (35% propylene
glycol) was used as a working fluid, with constant density and specific heat capacity assumed within the
operating temperature range of the experiments.
1-3: Uncertainty Analysis
Uncertainty analysis is generally employed to analyze the measurement precision of
experiments. The concept of uncertainty is basically the imprecision inherent in all measured variables for
calculation of a reported value in the experiment. Common uncertainty analysis guidelines are ISO, JCGM,
etc. implemented for precise data analysis in field measurements and calculation. Total heat flux from
radiant cooling panels is a function of numerous measured variables including those associated with
simultaneous effects of convection, radiation and conduction in the test chamber. The aforementioned
variables contain surface area, air flow rate, surface temperature, solar radiation flux, supply and return air
temperatures, conductivity coefficient, emissivity, etc., respectively. The general form of uncertainty
analysis can be presented with the following equation:
𝜑 = 𝑓(𝑢1, 𝑢2, 𝑢3, … . , 𝑢𝑛) (1)
where 𝜑 and 𝑢𝑖 are objective measured function and dependent variables. In this study, we employed the
general theory of uncertainty analysis introduced by ASHRAE 2000 as follows:

9
(a) Experimental setups, equipment and air temperature sensors (b) Radiant source configurations and their locations
(c) Surface map in the test chambers (d) Default Temperature sensor map positions in
Test chambers
Figure 2: Experimental setups, Radiant cooling sources configurations and temperature sensor map in Test chambers
Table 1: List of instrumentations with their measurement accuracy
Variables Instrument used Measurement Accuracy
Surface Temperature Omega 44033 thermistors ± 0.1 (c)
Coil Water temperature Omega 44033 thermistors ± 0.1 (c)
Coil flow rate Omega FTB-4506 2% of measured value
Specific heat and density of
fluid
Experimentally tested Assumed constant over
operating range
Internal equipment loads Brand Electronic ONE power
meter
Watt’s up power meter
± 1 %
Global horiz. Radiation Eppley Pyranometer Within ±1% of WRR
Transitted radiation
(interior)
Apply PSP Within ±1% of WRR
Outdoor air temperature Davis External temp sensor ± 0.5 (c) under 43 (c)
Wind direction Davis Anemometer 6410 ±4 degrees
Wind speed Davis Anemometer 6410 Greater of ±3 (km/h) or ±5%
Precipitation Davis Rain collector II Calibrated 0.01" (0.003 m)
increments

10
𝛿𝜑 = √(𝛿𝑢1 𝛿𝜑
𝛿𝑢1) + (𝛿𝑢2
𝛿𝜑
𝛿𝑢2) + ⋯ + (𝛿𝑢n
𝛿𝜑
𝛿𝑢n) (2)
where n is total number of parameters, 𝛿𝑢 is uncertainty of certain parameter, 𝛿𝜑 uncertainty in objective
value, 𝛿𝜑
𝛿𝑢nis changes in objective value with a unit change of the parameter.

11
2 EXPERIMENTAL PROGRAMME
2-1: Experimental Protocols
A fan coil cooling system with variable supply air temperature was used to represent an all-air
system. The Air Exchange Rate per Hour (ACH) was modulated by controlling fan speed. This system was
capable of maintaining a maximum cooling capacity of 1800 (W) per chamber while maintaining
ventilation requirements for office spaces according to ASHRAE 62.1. Radiant cooling panels, capable of
extracting maximum heat load of 850 (W) under realistic scenarios, were combined with an air ventilation
system to represent a chilled ceiling panel cooling system. Both the radiant panel and all-air systems
underwent a one-day preconditioning cycle to capture incremental changes in load before running full-scale
experiments in both test chambers. The duration of each experiment was individually determined so as to
be sufficiently long to capture typical cyclic cooling load changes resulted from environmental parameters,
internal loads, etc. The duration of experiments varied from hours to days for different load scenarios.
2-2: Experimental Matrix
The experimental matrix is shown in Table 2. Each experiment is represented by a short description
for specific test scenarios. The overall purpose of the studies listed in Table 2 was to examine the cooling
performance of radiant panels compared with an all-air system, and to quantify the effects of different load
scenarios, such as solar, pure convective load, dominant radiative loads, etc. A primary goal is to determine
differences in the heat transfer dynamics of radiant panels verse an all-air system in the test chambers.
Table 2 Experimental matrix of finished experiments

12
3 EXPERIMENTAL MEASUREMENT TESTS
3-1: Experiment No. 1: Radiant panel vs All-Air system under solar and radiative loads
The main purpose of the first full-scale experiment was to evaluate the cooling performance of
radiant panel versus all-air systems under dominant solar load. In order to do this, we set both test chambers
to operate under purely radiative heat gain continuously for five days from August 1st to August 5th. The
solar radiation was entering from the south-facing façade into each test chamber and was continuously
measured with Eppley PSP throughout the experiment. The incident solar radiation causes temperature
increase of interior walls, whose surface temperatures were measured by Omega 44033 thermistors and
recorded by GW Instruments i100 data acquisition hardware. The test chambers were subject to daily solar
radiation along with radiative heat gain by resistive side panel, constantly providing 300 (W, into the
conditioned space. From weather data records, it was noted that the weather was partly cloudy but mostly
sunny during the five-day experiment at Austin, TX.
The present experiment primarily investigates a comparison between radiant panel and all-air
system for space cooling in both test chambers. In the first test chamber, radiant cooling panel was
responsible for space cooling under dominant radiative load. The radiant cooling panel was capable of
maintaining constant zone air temperature in the room using a controller developed using National
Instruments hardware and LabView programming environment. The temperature sensor used for control
purposes was installed in the return air vent. The radiant panel controller modulates a valve that supplies
chilled water into the radiant panel loop in order to maintain a specified zone air set point temperature.
During daily operation, radiant cooling panel removes space heat generated by both solar heat gain and
radiative side panels installed on the west wall of the labs to mimic heat gain in a typical office building.
The radiative side panel was operating from 8:00 AM to 6:00 PM every day, which represents internal load
in typical office buildings. In the second test chamber, an all-air system was responsible to provide cooling.
The second test chamber was similarly subjected to solar and side panel radiative heat gains. The solar
radiation heat gain is presented for five-day operation of both test chambers in Figure 3, which also shows
the operating schedule of the radiative side panels. Additionally, total heat gain can be calculated as the
summation of solar radiation, radiative heat gain by side panel and electric load, as shown in Figure 3. The
all-air system removes a major portion of heat by convection, while the radiant panel extracts space heat
directly by radiation and indirectly by cooling surrounding wall surfaces. It is important to note that the
radiant cooling panels directly remove a major portion of solar radiation and radiative heat gain generated
by side panels.
From a cooling point of view, the cooling performance of radiant panel and all-air system can be
evaluated through a comparison of the results for this five-day experiment. The amount of sensible heat
removed by radiant panels from the first room should be equal to the heat

13
Fig.3: Solar, Radiative and Total Heat gains for the full-scale experiment during August 1st to August 5th
extraction from the conditioned space in the second test chamber. The comparative results of net space
sensible cooling rate are presented in Figure 4 for the full-scale experimental measurement in both
laboratories. According to Figure 4, sensible cooling rate of radiant panel can be calculated with the
following equation:
0
50
100
150
200
250
300
350
400
450
500
550
6:00 PM 12:00 AM 6:00 AM 12:00 PM 6:00 PM 12:00 AM 6:00 AM 12:00 PM 6:00 PM 12:00 AM 6:00 AM 12:00 PM 6:00 PM 12:00 AM 6:00 AM 12:00 PM 6:00 PM 12:00 AM 6:00 AM 12:00 PM 6:00 PM 12:00 AM 6:00 AM 12:00 PM 6:00 PM
Hea
t ga
in (
W)
Solar Heat gain (W): 08-01-2017 to 08-05-2017
Qsolar_LAB1 Qsolar_LAB2
0255075
100125150175200225250275300325350
6:00 PM 12:00 AM 6:00 AM 12:00 PM 6:00 PM 12:00 AM 6:00 AM 12:00 PM 6:00 PM 12:00 AM 6:00 AM 12:00 PM 6:00 PM 12:00 AM 6:00 AM 12:00 PM 6:00 PM 12:00 AM 6:00 AM 12:00 PM 6:00 PM 12:00 AM 6:00 AM 12:00 PM 6:00 PM
hea
t ga
in (
W)
Radiative Side Panel Heat Gain: Working Schedule: 08-01-2017 to 08-05-2017
Radiative Side panel_LAB1 Radiative Side panel_LAB2
0
100
200
300
400
500
600
700
800
900
1000
1100
1200
6:00 PM 12:00 AM 6:00 AM 12:00 PM 6:00 PM 12:00 AM 6:00 AM 12:00 PM 6:00 PM 12:00 AM 6:00 AM 12:00 PM 6:00 PM 12:00 AM 6:00 AM 12:00 PM 6:00 PM 12:00 AM 6:00 AM 12:00 PM 6:00 PM 12:00 AM 6:00 AM 12:00 PM 6:00 PM
Hea
t ga
in (
W)
Total Heat Gain (Solar gain+Conduction+Electric load): 08-01-2017 to 08-05-2017
Total Heat Gain_LAB1 Total Heat Gain_LAB2
14
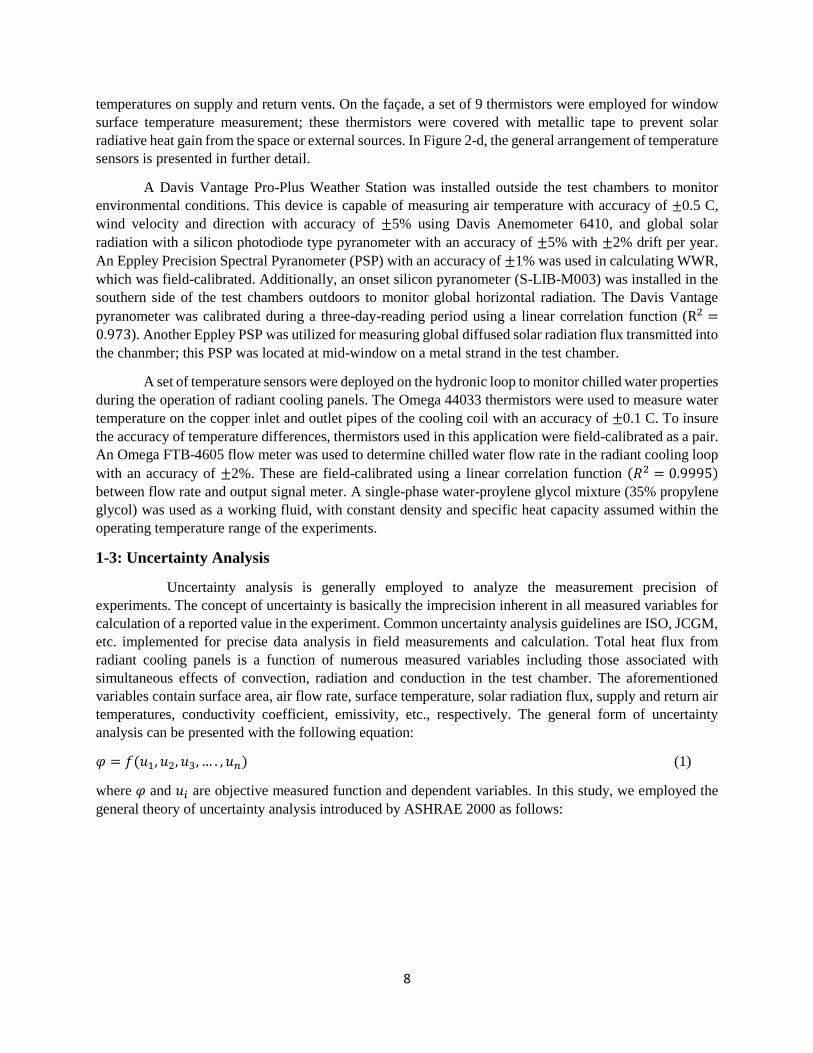
Fig.4: Net sensible space cooling rate for the full-scale experiment during August 1st to August 5th
𝑄Radiant Panel = 𝑚w° 𝐶pw
(𝑇CWR − 𝑇CWS) (3)
where water flow rate, specific heat, chilled return water and chilled water supply to the radiant loop are
denoted by 𝑚w° , 𝐶pw
, 𝑇CWR , 𝑇CWS , respectively. For the all-air system, the net sensible cooling rate was
calculated in the conditioned space as follows:
𝑄air = 𝑚a° 𝐶pa
(𝑇RA − 𝑇SA) (4)
where 𝑚a° , 𝐶pa
, 𝑇RA , 𝑇SA , 𝑄air are air mass flow rate, specific heat of air, return air temperature, supply
air temperature and cooling rate by air, respectively. As shown in Figure 4, there is a good agreement in the
sensible cooling rate between radiant panel and all-air system under similar operational conditions. This
shows that radiant panels can potentially be employed for providing space cooling in typical office buildings
instead of an all-air system, possibly resulting in lower electricity consumption for space conditioning.
The operation of the radiant panel and all-air systems causes temperature changes in air and wall
surfaces during the experiment. The wall surface temperatures were monitored with thermistors, while we
measured air temperature instantaneously using six separate sensors installed on the vertical stand in the
room. The results of wall surface and air temperatures are illustrated in Figure 5 throughout the five-day
experiment. According to Figure 5, the use of radiant panel results in a reduction in wall surface temperature
of the test chamber comparing with the all-air system. Additionally, the air temperature is essentially lower
in the test chamber conditioned with radiant cooling panels. The use of radiant panel may result in stratified
air temperature within the conditioned space.
The results indicates that the radiant panels can fulfill cooling needs similar to an all-air system
under the same operational loads. This experiment demonstrates a comparison on the cooling performance
of radiant panel versus all-air system in the identical test chambers, whose results confirm that, beside
convection, radiant panels mainly extract heat from the space through direct radiative heat transfer and
indirectly by cooling surrounding wall surfaces in the test chambers.
-100
0
100
200
300
400
500
600
700
800
900
12:00 PM 12:00 AM 12:00 PM 12:00 AM 12:00 PM 12:00 AM 12:00 PM 12:00 AM 12:00 PM 12:00 AM 12:00 PM 12:00 AM 12:00 PM 12:00 AM
Co
olin
g ra
te (
W)
Net Space Sensible Cooling Rate: LAB1 vs LAB2: 08-01-2017 to 08-05-2017
Total Space Heat Gain Qrad_LAB1 Qair_LAB2

15
Fig.5: wall surface, mean radiant and air temperatures for the full-scale experiment during August 1st to August 5th
27.827.9
2828.128.228.328.428.528.628.728.828.9
2929.129.229.329.429.529.6
12:00 PM 12:00 AM 12:00 PM 12:00 AM 12:00 PM 12:00 AM 12:00 PM 12:00 AM 12:00 PM 12:00 AM 12:00 PM 12:00 AM 12:00 PM 12:00 AM
Tem
per
atu
re(C
)Wall surface Temperature (C): 08-01-2017 to 08-05-2017
East wall_LAB1 Floor_LAB1 Back wall_LAB1 East wall_LAB2
Floor_LAB2 Back wall_LAB2 Ceiling_LAB2
27.75
28
28.25
28.5
28.75
29
29.25
29.5
29.75
30
30.25
30.5
30.75
12:00 PM 12:00 AM 12:00 PM 12:00 AM 12:00 PM 12:00 AM 12:00 PM 12:00 AM 12:00 PM 12:00 AM 12:00 PM 12:00 AM 12:00 PM 12:00 AM
Tem
per
atu
re (
C)
AUST (Averaged unheated surface temp) = MRT_no panel (C): 08-01-2017 to 08-05-2017
AUST_LAB1 AUST_LAB2 Setpoint Temp
26.8
27
27.2
27.4
27.6
27.8
28
28.2
28.4
28.6
28.8
12:00 PM 12:00 AM 12:00 PM 12:00 AM 12:00 PM 12:00 AM 12:00 PM 12:00 AM 12:00 PM 12:00 AM 12:00 PM 12:00 AM 12:00 PM 12:00 AM
Tem
per
atu
re (
C)
Air Temperature (C): LAB 1 vs LAB 2: 08-01-2017 to 08-05-2017
Tair_20 min ave_LAB1 Tair_20 min ave_LAB2 Setpoint Temp

16
3-2: Experiment No. 2: Radiant panel vs All-Air system with internal loads
The main purpose of Experiment No. 2 is to investigate the effect of internal loads on the cooling
performance of radiant panel and all-air system during a six-day measurement period from August 9th to
August 14th at Austin, TX. Unlike the previous experiment, we combined the radiant cooling panels with a
ventilation air system in the first test chamber and examined its cooling performance with that of the second
test room equipped with all-air system. Before running the experiment, one-day pre-conditioning was used
to stabilize heat balance in both test chambers on August 9th.
A major portion of room heat gain is by internal sources, such as occupants, computers, etc. in the
commercial buildings. The internal loads can be generally divided into convective and radiative heat gains,
which are extracted either by the radiant cooling panels or all-air systems accordingly. For the present
experiment, the potential cooling capacity of the combined radiant cooling panel and all-air system was
examined under a combination of solar and internal convective and radiative loads. To mimic typical office
space buildings, internal convective heat gains were provided by using cylinder shapes covered by thin-
resistive heater element sheets to emulate convective loads resulting from occupancy, computers, etc. as
shown in Figure 6. To minimize radiative energy emissions from these simulated convective loads, thin-
resistive heater element sheets were covered with a low-emissivity material so they would mimic purely
convective loads. The heating capacity of the resistive heater elements was precisely controlled via rheostats
throughout the experiments. Additionally, the internal radiative heat gains were simulated through the use
of portable high-emissivity flat resistive heater panels on the west wall of each test chamber, as illustrated
in Figure 6. The resistive heater panels were powered with a variable power inverter to provide a constant
internal radiative heat flux in the space. In addition, lighting equipment provided both shortwave and
longwave radiation while resistive heater panels only producing longwave radiation. Thermal emissions of
the resistive heater panels was controlled, and thermistors used to measure the panel surface temperature in
both test chambers. In this experiment, the test chambers were subjected to solar heat gain the entire day,
while the internal convective cylindrical resistive heaters were operated during working hours from 9:00
AM to 5:00 PM. The internal convective sources constantly produced 250 (W) in each test room. Moreover,
the internal radiative side panel was configured for continual operation, adding 240 (W) thermal emission
into the conditioned space.
Figure 7 illustrates the results of solar, internal convective and radiative heat gain in both test
rooms during the six-day experiment. As shown in Figure 7, the solar radiation intensity went up to the
maximum 650 (W), while internal loads were added to the space based on the aforementioned schedule.
The presence of internal heaters during OFF condition (5:00 PM – 9:00 AM) represents the computers and
lightings, which are normally operating and adding heat to the space even when there is no occupant in the
building. In Figure 7, both radiative side panel and internal convective heaters increase the level of space
heating energy according to the working schedule in a typical office environment. The results of the total
heat gain,the summation of solar, electric and window conduction, are illustrated for both test rooms in
Figure 7. The only difference between the total heat gain values of both test chambers was on electricity
consumption by circulation fans. We employed a small fan to provide 2.8 (ACH) with average electricity
consumption of 21 (W) in the first laboratory, while a larger fan was utilized to circulate ambient air with
8 (ACH) according to the ventilation standards for office spaces represented in ASHRAE 62.1. This shows
the potential for radiant cooling systems to

17
Fig.6: The configuration of internal radiative and convective heater sources for the full-scale experiment
reduce electricity consumption while keeping cooling performance similar to that of an all-air system under
the same operational conditions.
The cooling performance of a combined radiant panel and ventilation system versus an all-air
system is shown in Figure 8. This compares radiant panel and air cooling in the first test chamber with air
space cooling in the second test chamber, and shows that there was good accordance between the two
chambers during six-day experiment. In Figure 8, the maximum cooling capacity of the radiant panels
combined with air system that provided 3 ACH was ~ 1200 (W), while a minimum load of ~250W occurred
during the night as a result of the radiative side panels in the rooms. This figure demonstrates that the radiant
panel provides efficient space cooling similar to all-air system with significant lower electricity
consumption.
The presence of an active cooled surface affects the heat transfer dynamics of a room conditioned
with radiant panels when compared with that of an all-air system. An indication of heat transfer dynamics
was demonstrated by the temperature profile of chamber surfaces. The results for wall surface temperature
are shown in Figure 9. According to Figure 9, wall surface temperatures were generally lower for the
laboratory conditioned with radiant cooling panel comparing with those of the all-air system because radiant
panel extracted heat from the envelope through radiative heat transfer. In Figure 9, mean radiant
temperature for wall surfaces (AUST) in lab 1 was higher than that of the second test chamber. This figure
also addressed MRT was almost 2 degrees greater than zone air set point temperature (28 C) during the
operation of full-scale experiment. Additionally, the air temperature measured by thermistors installed in
the vertical stand represented the air temperature profile in the vertical direction from the floor to the ceiling.
As shown in Figure 9, the air temperature was higher in the test chamber conditioned with all-air system
comparing with the room equipped with radiant cooling panels.

18
Fig.7: Solar, internal convective, radiative heat gains for the full-scale experiment during August 9th to August 14th
0
50
100
150
200
250
300
350
400
450
500
550
600
650
700
6:00 PM 12:00 AM 6:00 AM 12:00 PM 6:00 PM 12:00 AM 6:00 AM 12:00 PM 6:00 PM 12:00 AM 6:00 AM 12:00 PM 6:00 PM 12:00 AM 6:00 AM 12:00 PM 6:00 PM 12:00 AM 6:00 AM 12:00 PM 6:00 PM 12:00 AM 6:00 AM 12:00 PM 6:00 PM 12:00 AM 6:00 AM 12:00 PM
Hea
t ga
in (
W)
Solar heat gain (W): 08-09-2017 to 08-14-2017
Qsolar_LAB1 Qsolar_LAB2
0
25
50
75
100
125
150
175
200
225
250
275
300
12:00 PM 12:00 AM 12:00 PM 12:00 AM 12:00 PM 12:00 AM 12:00 PM 12:00 AM 12:00 PM 12:00 AM 12:00 PM 12:00 AM 12:00 PM 12:00 AM 12:00 PM 12:00 AM 12:00 PM 12:00 AM 12:00 PM
Hea
t ga
in (
W)
Internal heater working schedule: 08-09-2017 to 08-14-2017
Radiative Side Panel Internal load heaters
0
100
200
300
400
500
600
700
800
900
1000
1100
1200
1300
1400
1500
1600
6:00 PM 12:00 AM 6:00 AM 12:00 PM 6:00 PM 12:00 AM 6:00 AM 12:00 PM 6:00 PM 12:00 AM 6:00 AM 12:00 PM 6:00 PM 12:00 AM 6:00 AM 12:00 PM 6:00 PM 12:00 AM 6:00 AM 12:00 PM 6:00 PM 12:00 AM 6:00 AM 12:00 PM 6:00 PM 12:00 AM 6:00 AM 12:00 PM
Hea
t ga
in (
W)
Total heat gain (W): 08-09-2017 to 08-14-2017
Total Heat Gain_LAB1 Total Heat Gain_LAB2

19
Fig.8: Net space cooling rate for the full-scale experiment during August 9th to August 14th
The present experiment represents the effects of internal loads. The experiment shows a combined
radiant panel with a ventilation system can maintain heat extraction rates similar to an all-air system. The
presence of radiant cooling panel in the room results in significant heat extraction from the space directly
through radiative heat transfer and indirectly by cooling surrounding surfaces, causing efficient temperature
reduction in wall surfaces during daily operation due to decreasing heat accumulation in the envelope.
Another consequence of radiant cooled ceiling is to stabilize temperature stratification in the space
conditioned with radiant panel while achieving thermal comfort in the office space. On the other hand, an
all-air system preserves space cooling majorly through convective heat transfer. The operation of all-air
system will increase heat extraction speed in the room via cooled air circulation as a result of increase in
convection rate on interior wall surfaces. However, Averaged Unheated Surface Temperature (AUST) is
relatively lower for the room conditioned with radiant panels comparing with that of all-air systems.
0
100
200
300
400
500
600
700
800
900
1000
1100
1200
12:00 PM 12:00 AM 12:00 PM 12:00 AM 12:00 PM 12:00 AM 12:00 PM 12:00 AM 12:00 PM 12:00 AM 12:00 PM 12:00 AM 12:00 PM 12:00 AM 12:00 PM
Co
olin
g ra
te (
W)
Net Space Sensible Cooling Rate: LAB1 vs. LAB2: 08-09-2017 to 08-14-2017
(Qrad+Qair)_LAB1 Qair_LAB2 Total space heat gain

20
Fig.9: Wall surface, air temperature profiles for the full-scale experiment during August 9th to August 14th
27.5
27.75
28
28.25
28.5
28.75
29
29.25
29.5
29.75
30
6:00 PM 12:00 AM 6:00 AM 12:00 PM 6:00 PM 12:00 AM 6:00 AM 12:00 PM 6:00 PM 12:00 AM 6:00 AM 12:00 PM 6:00 PM 12:00 AM 6:00 AM 12:00 PM 6:00 PM 12:00 AM 6:00 AM 12:00 PM 6:00 PM 12:00 AM 6:00 AM 12:00 PM 6:00 PM 12:00 AM 6:00 AM 12:00 PM
Tem
per
atu
re (
C)
Wall surface Temperature (C): 08-09-2017 to 08-14-2017
East wall_LAB1 Floor_LAB1 Back wall_LAB1 East wall_LAB2
Floor_LAB2 Back wall_LAB2 Ceiling_LAB2
27.5
28
28.5
29
29.5
30
30.5
31
12:00 PM 12:00 AM 12:00 PM 12:00 AM 12:00 PM 12:00 AM 12:00 PM 12:00 AM 12:00 PM 12:00 AM 12:00 PM 12:00 AM 12:00 PM 12:00 AM 12:00 PM
Tem
per
atu
re (
C)
AUST (average unheated surface temp)=MRT_no panel (c): 08-09-2017 to 08-14-2017
AUST_LAB1 AUST_LAB2 Setpoint Temp
27
27.2
27.4
27.6
27.8
28
28.2
28.4
28.6
28.8
29
12:00 PM 12:00 AM 12:00 PM 12:00 AM 12:00 PM 12:00 AM 12:00 PM 12:00 AM 12:00 PM 12:00 AM 12:00 PM 12:00 AM 12:00 PM 12:00 AM 12:00 PM
Tem
per
atu
re (
C)
Air temperature (C): 08-09-2017 to 08-14-2017
Tair_20 min ave_LAB1 Tair_20 min ave_LAB2 Setpoint Temp

21
3-3: Experiment No. 3: Radiant panel vs All-Air system with constant internal loads
The main purpose of Experiment No. 3 is to investigate the effects constant internal heaters on the
cooling performance of radiant panel and all-air system during three-day full-scale experiment from August
17th to August 20th in Austin, TX. In this experiment, we examined the cooling performance of radiant panel
versus all-air system under constant 250 (W) internal convective and radiative loads. A one-day pre-
conditioning period was run prior to the full-scale measurements to stabilize heat balance in the test rooms.
This experiment investigated the impact of internal cylinder and box heaters on the heat balance of
the test chambers. The internal cylinder and box heaters to simulate occupancy were located in the middle
of the room to secure uniform heat emission to all interior wall surfaces. The objective of utilizing internal
cylinder and box heaters was to emulate occupancy and computers in typical office spaces. The internal
cylinder and box heaters were composed of thin-resistive heater element sheets, which were also covered
with low emissivity coverings to minimize radiative energy emissions. The thermal emissions of the internal
heaters was controlled using rheostats, and their surface temperatures were measured by thermistors
installed on the element sheets. Throughout the experiment the internal cylinder and box heaters were
constantly adding 250(W) day and night to the space. Therefore, either the mixed radiant panel and
ventilation system or all-air system was responsible for extracting the solar and internal loads from the test
rooms. Figure 10 displays the solar heat gain, internal load working schedule and total heat gains in both
test chambers during the experiment. The average solar heat gain was 700 (W), causing to increase the level
of thermal energy in the room required to be removed by the cooling systems.
The net space sensible cooling rate are presented for the radiant panel and all-air system in Figure
11. According to Figure 11, both combined radiant panel with ventilation system and all-air system
managed to handle all loads in the test chambers. In this experiment, the radiant panel was operated at its
maximum cooling capacity of 850 (W), while the rest of heat was extracted by cooled circulating air in the
room. In the second test chamber, all-air system was responsible to remove the maximum cooling load of
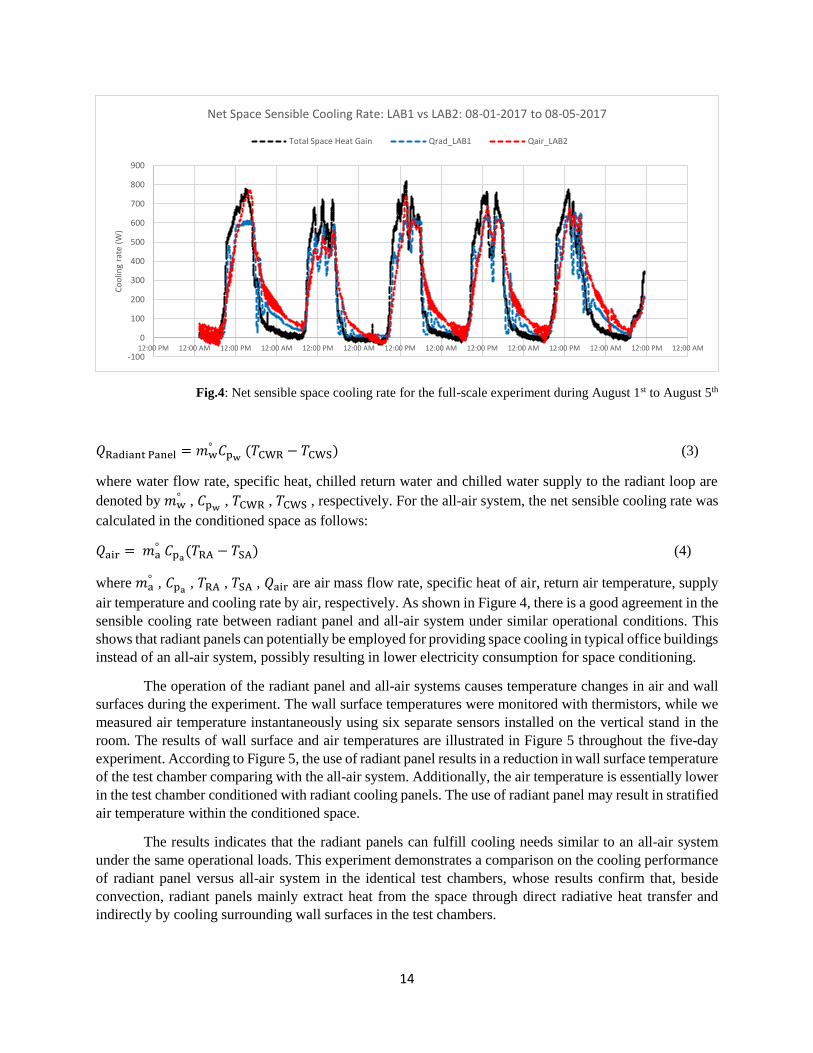
1200 (W) during the experiment. The results of temperature profiles for wall surfaces and ambient air are
illustrated for the experiment in Figure 12. As shown in Figure 12, the wall surface temperatures were
generally lower for the room conditioned with combined radiant panel with ventilation system when
compared with the all-air system. Comparing the MRT, averaged unheated surface temperature was
relatively higher for the walls of the second test room conditioned with all-air system, while average
measured air temperature was lower in the first test chamber with radiant panel.
This experiment shows that radiant panels can manage cooling demand in a room with internal heat
sources in combination when used in combination with a small fan system for ventilation with similar
cooling performance comparing to the all-air system. The result is a reduction in electricity consumption in
the radiant panel configuration compared with that of the all-air system. The use of radiant panels results
in significant temperature decrease in both envelope and ambient air due to an efficient-direct radiative heat
transfer and indirect cooling of the surrounding wall surfaces.

22
Fig.10: Solar, internal convective, radiative heat gains for full-scale experiment during August 17th to August 20th
Fig.11: Net space sensible cooling rate for full-scale experiment during August 17th to August 20th
-500
50100150200250300350400450500550600650700750800850
6:00 AM 12:00 PM 6:00 PM 12:00 AM 6:00 AM 12:00 PM 6:00 PM 12:00 AM 6:00 AM 12:00 PM 6:00 PM 12:00 AM 6:00 AM 12:00 PM 6:00 PM 12:00 AM 6:00 AM
Hea
t ga
in (
W)
Solar Heat Gain (W): 08-17-2017 to 08-20-2017
Qsolar_LAB1 Qsolar_LAB2
0
50
100
150
200
250
300
12:00:00 AM 12:00:00 PM 12:00:00 AM 12:00:00 PM 12:00:00 AM 12:00:00 PM 12:00:00 AM 12:00:00 PM 12:00:00 AM 12:00:00 PM
Hea
t ga
in (
W)
Internal Cylinder and Box heater heat gain: 08-017-2017 to 08-20-2017
Internal load_LAB1 Internal load_LAB2
0100200300400500600700800900
100011001200130014001500
12:00:00 AM 12:00:00 PM 12:00:00 AM 12:00:00 PM 12:00:00 AM 12:00:00 PM 12:00:00 AM 12:00:00 PM 12:00:00 AM 12:00:00 PM
Hea
t ga
in (
W)
Total heat gain (W): 08-17-2017 to 08-2017
Total Heat Gain_LAB1 Total Heat Gain_LAB2
0100200300400500600700800900
100011001200
6:00 AM 12:00 PM 6:00 PM 12:00 AM 6:00 AM 12:00 PM 6:00 PM 12:00 AM 6:00 AM 12:00 PM 6:00 PM 12:00 AM 6:00 AM 12:00 PM 6:00 PM 12:00 AM 6:00 AM
Co
olin
g ra
te (
W)
Net Space Sensible Cooling Rate: LAB1 vs LAB2: 08-17-2017 to 08-20-2017
Total Heat Gain "(Qrad+Qair)_LAB1" Qair_LAB2
23
Fig.12: wall surface, MRT, Air temperatures for full-scale experiment during August 17th to August 20th
27.6
27.85
28.1
28.35
28.6
28.85
29.1
29.35
29.6
6:00 AM 12:00 PM 6:00 PM 12:00 AM 6:00 AM 12:00 PM 6:00 PM 12:00 AM 6:00 AM 12:00 PM 6:00 PM 12:00 AM 6:00 AM 12:00 PM 6:00 PM 12:00 AM 6:00 AM
Tem
per
atu
re (
C)
Wall surface temperature (C): 08-17-2017 to 08-20-2017
East wall_LAB1 West wall_LAB1 Floor_LAB1 Back wall_LAB1 East wall_LAB2
West wall_LAB2 Floor_LAB2 Back wall_LAB2 Ceiling_LAB2
27.8
28
28.2
28.4
28.6
28.8
29
29.2
29.4
29.6
6:00 AM 12:00 PM 6:00 PM 12:00 AM 6:00 AM 12:00 PM 6:00 PM 12:00 AM 6:00 AM 12:00 PM 6:00 PM 12:00 AM 6:00 AM 12:00 PM 6:00 PM 12:00 AM 6:00 AM
Tem
per
atu
re (
C)
AUST(Averaged Unheated Surface Temp)=MRT_no panel (C): 08-17-2017 to 08-20-2017
AUST_LAB1 AUST_LAB2 Setpoint Temp
27.3
27.4
27.5
27.6
27.7
27.8
27.9
28
28.1
28.2
28.3
28.4
28.5
28.6
6:00 AM 12:00 PM 6:00 PM 12:00 AM 6:00 AM 12:00 PM 6:00 PM 12:00 AM 6:00 AM 12:00 PM 6:00 PM 12:00 AM 6:00 AM 12:00 PM 6:00 PM 12:00 AM 6:00 AM
Tem
per
atu
re (
C)
Air Sensor Temp on vertical stand (C): 08-17-2017 to 08-20-2017
Tair_20 min ave_LAB1 Tair_20 min ave_LAB2 Setpoint Temp

24
3-4: Experiment No. 4: Radiant panel vs All-Air system with internal loads in typical office working
schedule
The main purpose of this experiment is to investigate the cooling performance of the radiant panel
and all-air systems in a test chamber subjected to internal heaters using a working schedule appropriate for
a typical office space. The period of the experimental measurement was from August 22nd to August 24th in
Thermal Façade Laboratory in University of Texas at Austin. Before running the experiment, a one-day
pre-conditioning period was used to stabilize heat balance in the test rooms.
The present experiment was designed to mimic the effects of internal loads in a normal work
operating schedule for a typical office space. In this experiment, internal cylinder and box heaters were
employed to constantly add 250 (W) during the office working hours. The test chambers were subjected to
normal solar radiation as well as internal convective and radiative loads from 7:00AM to 5:00 PM
throughout the experiment. During this time, a combined radiant panel with ventilation system was working
in the first test chamber, while an all-air system was used to remove space heat in the second test chamber.
From 5:00 PM to 7:00 AM, the HVAC systems, consisting of cooling coil, fans, pumps, etc., were turning
off in both test chambers. The major reason for this was to emulate normal HVAC operation schedule in
commercial buildings. During the so-called OFF condition (5:00 PM-7:00 AM), the test chambers were
experiencing a free-floating condition where the air temperature increased in the occupied zone. As the
HVAC system were restored during the so-called ON period, both radiant panel and all-air system worked
to remove the thermal energy stored during the free-float period and restore the set point temperature.
The cooling equipment was designed to remove solar and internal heat gains from the test rooms.
The results of solar heat gain, working schedule for internal convective and radiative heaters and total heat
gain are illustrated in Figure 13. Solar heat gain varied throughout two days with the average value of 700
(W). The results of total heat gain as the sum of electric load, solar heat gain and conduction through
façade, are also displayed for the experiment. The main difference between total heat gain was the electricity
consumption by circulating fans in the test rooms. In Figure 14, we have compared the cooling performance
of the two test chambers by using net space sensible cooling rate as the metric, where the sum of heat
extraction rate by radiant panel and air circulation system in the first laboratory was compared with heat
removal by the fan coil in the second test room. According to Figure 14, there was a good accordance
between the cooling capacity of combined radiant panel with ventilation system versus the all-air system.
As shown, the sensible cooling rate went to zero during OFF condition for both sets of cooling equipment.
However, as soon as the HVAC systems were restored at 7:00 AM, both radiant panel and all-air system
facilitated heat extraction with full-cooling capacity according to the controller command until the set point
for the space was restored..
The cooling performance of the radiant panel and all-air system results in a considerable change in
the temperature profile for the air and envelope, which are shown in Figure 15. In this Figure, wall surface
temperatures were generally lower for the test room conditioned with radiant panel comparing with those
of the all-air system. Also, the averaged unheated surface temperature or MRT was significantly lower for
the test room with radiant panel due to efficient heat extraction by radiative heat transfer comparing to that
of the all-air system in the second laboratory. According to Figure 15, the measured air temperature

25
Fig.13: Solar, internal convective, radiative heat gains for full-scale experiment during August 22nd to August 24th
Fig.14: Net space sensible cooling rate for full-scale experiment during August 22nd to August 24th
-1000
100200300400500600700800900
6:00 PM 12:00 AM 6:00 AM 12:00 PM 6:00 PM 12:00 AM 6:00 AM 12:00 PM 6:00 PM 12:00 AM 6:00 AM 12:00 PM
Hea
t ga
in (
W)
Solar heat gain (W): 08-22-2017 to 08-24-2017
Qsolar_LAB1 Qsolar_LAB2
-50
0
50
100
150
200
250
300
6:00 PM 12:00 AM 6:00 AM 12:00 PM 6:00 PM 12:00 AM 6:00 AM 12:00 PM 6:00 PM 12:00 AM 6:00 AM 12:00 PM
Hea
t ga
in (
W)
Working schedule for internal load heaters: 08-22-2017 to 08-24-2017
internal load heater_LAB1 internal load heater_LAB1
0
250
500
750
1000
1250
1500
1750
6:00 PM 12:00 AM 6:00 AM 12:00 PM 6:00 PM 12:00 AM 6:00 AM 12:00 PM 6:00 PM 12:00 AM 6:00 AM 12:00 PM
Hea
t ga
in (
W)
Total heat gain (W): 08-22-2017 to 08-24-2017
Total Heat Gain_LAB1 Total Heat Gain_LAB2
-1000
100200300400500600700800900
1000110012001300
6:00 PM 12:00 AM 6:00 AM 12:00 PM 6:00 PM 12:00 AM 6:00 AM 12:00 PM 6:00 PM 12:00 AM 6:00 AM 12:00 PM
Co
olin
g ra
te (
W)
Net Space Sensible Cooling Rate: LAB 1 vs. LAB 2: 08-22-2017 to 08-24-2017
Total space heat gain (Qrad+Qair)_LAB1 Qair_LAB2

26
Fig.15: wall surface, MRT, Air temperatures for full-scale experiment during August 22nd to August 24th
changed during ON and OFF conditions, while air temperature was relatively higher for all-air system in
the second test chamber comparing with radiant panel.
These results show that the radiant panel system was capable of maintaining comfort in the space
during ON-OFF schedule used in typical office buildings as well as the all-air system. The use of combined
radiant panel and ventilation system facilitated heat extraction from the envelope on the daily operation of
typical office spaces.
27
27.5
28
28.5
29
29.5
30
30.5
31
31.5
6:00 PM 12:00 AM 6:00 AM 12:00 PM 6:00 PM 12:00 AM 6:00 AM 12:00 PM 6:00 PM 12:00 AM 6:00 AM 12:00 PM
Tem
per
atu
re (
C)
Wall surface temperature (C): 08-22-2017 to 08-24-2017
East wall_LAB1 West wall_LAB1 Floor_LAB1 Back wall_LAB1 East wall_LAB2
West wall_LAB2 Floor_LAB2 Back wall_LAB2 Ceiling_LAB2
27
27.5
28
28.5
29
29.5
30
30.5
31
6:00 PM 12:00 AM 6:00 AM 12:00 PM 6:00 PM 12:00 AM 6:00 AM 12:00 PM 6:00 PM 12:00 AM 6:00 AM 12:00 PM
Tem
per
atu
re (
C)
AUST(Averaged Unheated Surface Temp) = MRT_no panel (C): 08-22-2017 to 08-24-2017
AUST_LAB1 AUST_LAB2 Setpoint Temp
2424.5
2525.5
2626.5
2727.5
2828.5
2929.5
3030.5
31
6:00 PM 12:00 AM 6:00 AM 12:00 PM 6:00 PM 12:00 AM 6:00 AM 12:00 PM 6:00 PM 12:00 AM 6:00 AM 12:00 PM
Tem
per
atu
re (
C)
Air Temperature on vertical stand (C): 08-22-2017 to 08-24-2017
Tair_20 min ave_LAB1 Tair_20 min ave_LAB2 Setpoint Temp
27
3-5: Experiment No. 5: Radiant panel vs All-air system cooling performance under dominant solar
load
The main objective of this experiment was to investigate the cooling performance of a radiant panel
versus an all-air system under dominant solar load from August 31st to September 3rd in Thermal Façade
Laboratory in University of Texas at Austin. As before, there was a one-day pre-conditioning performed to
allow both the radiant cooling panel and all-air systems to stabilize heat balance before running the full-
scale experiment.
The present experiment was designed to determine the effects of pure solar load on the cooling
performance of a radiant panel and all-air system according to the working schedule of commercial
buildings. Note that the first test room was equipped with combined radiant panel with 2.8 (ACH)
ventilation system, while an all-air system was used in the second laboratory, capable of providing 8 (ACH)
for the ventilation requirement as addressed by ASHRAE 62.1 in office spaces. The test chambers were
subjected to dominant solar heat gain entering from the south-facing glass façade without any internal load.
The result of solar heat gain is displayed in Figure 16 for the full-scale experiment. Although the weather
was partly cloudy, the maximum solar heat gain was 1000 (W). The total heat gain in both test chambers is
shown in Figure 16 during the three-day experiment as the summation of solar heat gain, electric load and
conduction through the façade. According to Figure 16, the total heat gains of the test chambers were
different because of their using distinct fan configurations with different electricity consumptions. The test
rooms were operating according to ON-OFF schedule in typical office buildings. The cooling equipment
started to work from 7:00 AM to 6:00 PM non-stop (ON condition), and turned off from 6:00 PM to 7:00
AM (OFF condition). To analyze cooling capacity, net space sensible cooling rate was used as the metric
to check cooling performance of the radiant panels versus that of the all-air system. Figure 17 shows that
the cooling capacity of radiant panel was equal to zero during the OFF condition, suddenly ramps upward
as the cooling system is restored, and then modulates the sensible cooling rate for the rest of the day. The
same happened for the all-air system. As can be seen in Figure 17, the all-air system was capable of meeting
the cooling demand during peak heat gain just as well as the combined radiant panel and ventilation system.
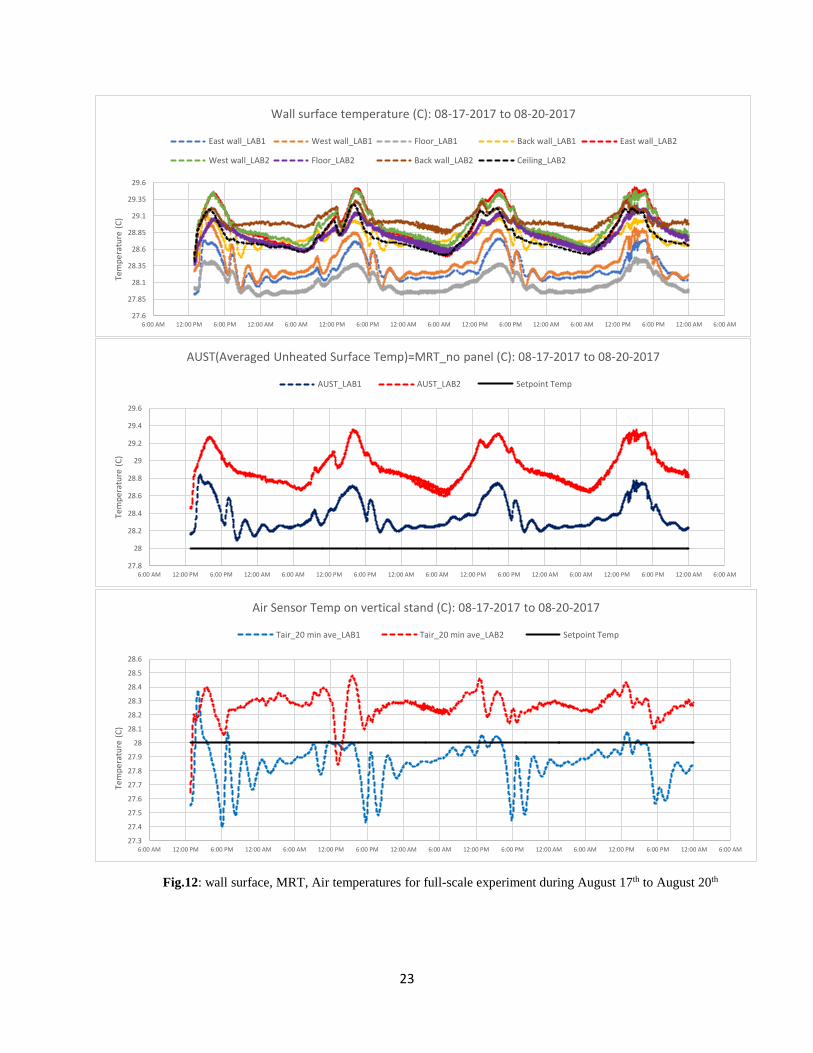
The cooling performance of the radiant panel and all-air system affects the temperature profile in
the air and wall surfaces in the test chambers. The results of wall surface temperature are represented in
Figure 18, where it can be seen the surface temperatures were generally higher in the test room conditioned
with all-air system compared with those of the combined radiant panel and ventilation system. The averaged
unheated surface temperature of walls was almost 0.5 (C) higher than the zone air set point temperature in
the room conditioned with radiant panels, while it was 1.5 (C) higher than the set point temperature for the
all-air system. This shows that the radiant panels can efficiently extract heat from the space. The air
temperature measured by six separate temperature sensors on the vertical stand, was also lower in the test
room conditioned with radiant panels when compared with the all-air system. Additionally, it should be
noted that the free-float temperature increased to the range of 29.5-31.5 (C) in the test chambers when the
systems were off.
From the results, the cooling performance of the radiant panel and all-air systems was dependent
on the solar load during cooling operations in typical office spaces. For radiant panels, a major portion of
solar load was directly removed through shortwave radiation while the rest of the heat was absorbed in the
envelope and then extracted either by longwave radiation or convection in the space. However, the all-air
system was capable of removing space heat through convective heat transfer by circulating chilled

28
Fig.16: Solar and total heat gain for full-scale experiment during August 22nd to August 24th
Fig.17: Net space sensible cooling rate for full-scale experiment during August 31st to September 3rd
air. The present experiment indicates the the choice of either radiant panel or all-air system can provide
space cooling; however, the use of combined radiant panel with a reduced-size ventilation system will save
electrical energy in the commercial building scale comparing with the all-air system.
0
100
200
300
400
500
600
700
800
900
1000
1100
6:00 AM 12:00 PM 6:00 PM 12:00 AM 6:00 AM 12:00 PM 6:00 PM 12:00 AM 6:00 AM 12:00 PM 6:00 PM 12:00 AM 6:00 AM 12:00 PM 6:00 PM 12:00 AM 6:00 AM
Hea
t ga
in (
W)
Solar Heat Gain (W): 08-31-2017 to 09-03-2017
Qsolar_LAB1 Qsolar_LAB2
0
125
250
375
500
625
750
875
1000
1125
1250
1375
1500
6:00 AM 12:00 PM 6:00 PM 12:00 AM 6:00 AM 12:00 PM 6:00 PM 12:00 AM 6:00 AM 12:00 PM 6:00 PM 12:00 AM 6:00 AM 12:00 PM 6:00 PM 12:00 AM 6:00 AM
Hea
t ga
in (
W)
Total heat gain (W): 08-31-2017 to 09-03-2017
Total Heat Gain_LAB1 Total Heat Gain_LAB2
-1000
100200300400500600700800900
100011001200
6:00 AM 12:00 PM 6:00 PM 12:00 AM 6:00 AM 12:00 PM 6:00 PM 12:00 AM 6:00 AM 12:00 PM 6:00 PM 12:00 AM 6:00 AM 12:00 PM 6:00 PM 12:00 AM 6:00 AM
Co
olin
g ra
te (
W)
Net Space Sensible Cooling Rate: LAB1 vs. LAB2 : 08-31-2017 to 09-03-2017
Total space heat gain (Qrad+Qair)_LAB1 Qair_LAB2

29
Fig.18: wall surface, MRT, Air temperatures for full-scale experiment during August 31st to September 3rd
26.5
27
27.5
28
28.5
29
29.5
30
30.5
31
31.5
32
6:00 AM 12:00 PM 6:00 PM 12:00 AM 6:00 AM 12:00 PM 6:00 PM 12:00 AM 6:00 AM 12:00 PM 6:00 PM 12:00 AM 6:00 AM 12:00 PM 6:00 PM 12:00 AM 6:00 AM
Tem
per
atu
re (
C)
Wall surface Temperature (C): 08-31-2017 to 09-03-2017
East wall_LAB1 West wall_LAB1 Floor_LAB1 Back wall_LAB1 East wall_LAB2
West wall_LAB2 Floor_LAB2 Back wall_LAB2 Ceiling_LAB2
27
27.5
28
28.5
29
29.5
30
30.5
31
31.5
6:00 AM 12:00 PM 6:00 PM 12:00 AM 6:00 AM 12:00 PM 6:00 PM 12:00 AM 6:00 AM 12:00 PM 6:00 PM 12:00 AM 6:00 AM 12:00 PM 6:00 PM 12:00 AM 6:00 AM
Tem
per
atu
re (
C)
AUST (Averaged Unheated Surface Temp)=MRT_no panel (c): 08-31-2017 to 09-03-2017
AUST_LAB1 AUST_LAB2 Setpoint Temp
26
26.5
27
27.5
28
28.5
29
29.5
30
30.5
31
31.5
6:00 AM 12:00 PM 6:00 PM 12:00 AM 6:00 AM 12:00 PM 6:00 PM 12:00 AM 6:00 AM 12:00 PM 6:00 PM 12:00 AM 6:00 AM 12:00 PM 6:00 PM 12:00 AM 6:00 AM
Tem
per
atu
re (
C)
Air Temperature on vertical stand (C): 08-31-2017 to 09-03-2017
Tair_20 min ave_LAB1 Tair_20 min ave_LAB2 Setpoint Temp

30
REFERENCES
[1] Causone F, Corgnati SP, Filippi M, Olesen BW. 2009. ``Experimental evaluation of heat transfer
coefficients between radiant ceiling and room”. Energy and Buildings;41 (6):622–8.
[2] Miller, P. L. and Nash, R. T. 1971. “A further analysis of room air distribution performance.”
ASHRAE Transactions 77(2):205
[3] Miller, P. L. and Nevins, R. G. 1969. “Room air distribution with an air distributing ceiling – Part II.
“ASHRAE Transactions 75:118
[4] Miller, P. L. and Nevins, R. G. 1970. “Room air distribution performance of ventilating ceilings and
cone-type circular ceiling diffusers.” ASHRAE Transactions 7660:186
[5] Miller, P. L. and Nevins, R. G. 1972. “An analysis of the performance of room air distribution
systems.” ASHRAE Transactions.
[6] Novoselac, Clark, Goldstein, Peeters. “Development of Internal Surface Convection Correlations for
Energy and Load Calculation Methods- ASHRAE Research Project 1416-RP Final Report. ASHRAE
2012
[7] Peeters L. and Novoselac A., "Impact Of Human Activity On Unsteadiness Of Airflow And
Convective Heat Transfer In Indoor Environmental Studies". Proceeding of Indoor Air 2011, Indoor Air
2011, June 5-10, Austin, TX.
[8] Frediksson J, Sandberg M, Moshfegh B. “Experimental investigation of the velocity field and airflow
pattern generated by cooling ceiling beams”. Building and Environment 36 (2001) pp. 891-899.
[9] J. Feng, S. Schiavon, F. Bauman, “Cooling load differences between radiant and air systems”, Energy
and Buildings, Volume 65, Pages 310-321.
[10] J. Feng, F. Bauman, S. Schiavon, “Experimental comparison of zone cooling load between radiant
and air systems”, Energy and Buildings, Volume 84, Pages 152-159.
Related Documents


