Procedia Materials Science 7 (2014) 138 – 147 Available online at www.sciencedirect.com 2211-8128 © 2014 The Authors. Published by Elsevier Ltd. This is an open access article under the CC BY-NC-ND license (http://creativecommons.org/licenses/by-nc-nd/3.0/). Selection and peer-review under responsibility of the scientific committee of SumGLASS 2013 doi:10.1016/j.mspro.2014.10.019 ScienceDirect 2 nd International Summer School on Nuclear Glass Wasteform: Structure, Properties and Long- Term Behavior, SumGLASS 2013 Experimental determination of thermodynamical quantities in oxide mixtures and glasses Pierre Benigni a *, Jacques Rogez a , Sophie Schuller b a Aix-Marseille Université, CNRS, IM2NP UMR 7334, Faculté des Sciences de Saint Jérôme, Service 251 - 13397 Marseille Cedex, France b CEA Marcoule, DEN, DTCD/SECM/LDMC, Bagnols/Cèze F-30207, France Abstract An overview of the experimental methods for the determination of thermodynamic functions in oxides systems is presented with a focus on two techniques: the solution calorimetry, which is applied in our laboratory both at room and at high temperature on oxide glasses and the Knudsen Effusion Mass Spectrometry (KEMS) which is under development in our team for activity measurement at high temperature. Emphasis is put on the description of the experimental setups and the measurement procedures. In this regard some key literature references are given added to some references concerning the measurements carried out on simplified glass systems. Keywords : Thermo-chemistry; Oxides, Glasses; Solution calorimetry; Knudsen Effusion Mass Spectrometry 1. Overview of experimental methods An exhaustive review of experimental methods for the determination of thermodynamic functions can be found in Kubaschewski et al. (1993) and in Komarek (1992). The methods can be classified into two main types: the calorimetric methods and the heterogeneous equilibrium methods. The calorimetric methods are based on the direct or indirect measurement of the heat quantity evolved or absorbed by a sample undergoing a temperature change, a structural transition or a chemical reaction. A classification of the various types of calorimeters has been proposed by Hemminger and Höhne (1984) relying on * Corresponding author. Tel.: +33-491-282-887; fax: +33-491-282-886 E-mail address: [email protected] © 2014 The Authors. Published by Elsevier Ltd. This is an open access article under the CC BY-NC-ND license (http://creativecommons.org/licenses/by-nc-nd/3.0/). Selection and peer-review under responsibility of the scientific committee of SumGLASS 2013 brought to you by CORE View metadata, citation and similar papers at core.ac.uk provided by Elsevier - Publisher Connector

Welcome message from author
This document is posted to help you gain knowledge. Please leave a comment to let me know what you think about it! Share it to your friends and learn new things together.
Transcript
Procedia Materials Science 7 ( 2014 ) 138 – 147
Available online at www.sciencedirect.com
2211-8128 © 2014 The Authors. Published by Elsevier Ltd. This is an open access article under the CC BY-NC-ND license (http://creativecommons.org/licenses/by-nc-nd/3.0/).Selection and peer-review under responsibility of the scientifi c committee of SumGLASS 2013 doi: 10.1016/j.mspro.2014.10.019
ScienceDirect
2nd International Summer School on Nuclear Glass Wasteform: Structure, Properties and Long-Term Behavior, SumGLASS 2013
Experimental determination of thermodynamical quantities in oxide mixtures and glasses
Pierre Benignia*, Jacques Rogeza, Sophie Schullerb aAix-Marseille Université, CNRS, IM2NP UMR 7334, Faculté des Sciences de Saint Jérôme, Service 251 - 13397 Marseille Cedex, France
bCEA Marcoule, DEN, DTCD/SECM/LDMC, Bagnols/Cèze F-30207, France
Abstract
An overview of the experimental methods for the determination of thermodynamic functions in oxides systems is presented with a focus on two techniques: the solution calorimetry, which is applied in our laboratory both at room and at high temperature on oxide glasses and the Knudsen Effusion Mass Spectrometry (KEMS) which is under development in our team for activity measurement at high temperature. Emphasis is put on the description of the experimental setups and the measurement procedures. In this regard some key literature references are given added to some references concerning the measurements carried out on simplified glass systems.
2211-8128 © 2014 The Authors. Published by Elsevier Ltd. Selection and peer-review under responsibility of the scientific committee of SumGLASS 2013.
Keywords : Thermo-chemistry; Oxides, Glasses; Solution calorimetry; Knudsen Effusion Mass Spectrometry
1. Overview of experimental methods
An exhaustive review of experimental methods for the determination of thermodynamic functions can be found in Kubaschewski et al. (1993) and in Komarek (1992). The methods can be classified into two main types: the calorimetric methods and the heterogeneous equilibrium methods.
The calorimetric methods are based on the direct or indirect measurement of the heat quantity evolved or absorbed by a sample undergoing a temperature change, a structural transition or a chemical reaction. A classification of the various types of calorimeters has been proposed by Hemminger and Höhne (1984) relying on
* Corresponding author. Tel.: +33-491-282-887; fax: +33-491-282-886 E-mail address: [email protected]
© 2014 The Authors. Published by Elsevier Ltd. This is an open access article under the CC BY-NC-ND license (http://creativecommons.org/licenses/by-nc-nd/3.0/).Selection and peer-review under responsibility of the scientifi c committee of SumGLASS 2013
brought to you by COREView metadata, citation and similar papers at core.ac.uk
provided by Elsevier - Publisher Connector

139 Pierre Benigni et al. / Procedia Materials Science 7 ( 2014 ) 138 – 147
their measuring principle, their mode of operation and their construction principle. The most frequently used sensors are thermocouples and thermopiles for respectively temperature and heat flow measurements. The heterogeneous equilibrium methods include the Electro-Motive Force (EMF) and the vapor pressure measurement methods. A very recent and comprehensive overview of the EMF method is given by Ipser et al. (2012). Among the different vapor pressure techniques, the Knudsen Effusion Mass Spectrometry (KEMS), alternatively named High Temperature Mass Spectrometry (HTMS), is the most versatile and powerful one which can deal with complex vapors in large pressure (from 10-12 up to 10-4 atm) and temperature (up to 2500-3000K) intervals.
The measurement methods for the thermal and the formation (or mixing) functions of a given phase, which can be a crystal, a liquid or a vitreous phase, are summarized in Table 1. The enthalpy change 2
1
TTH between two
temperatures T1 and T2 is measured by isothermal drop calorimetry. For glasses, the inverse drop calorimetry, in which a sample held in a high temperature furnace is dropped into a room temperature calorimeter, is most frequently used (Stebbins and Carmichael 1983). The transition enthalpy Htrs can also be measured by the same technique if the drops are repeated from two temperatures slightly below (Ttrs – ) and slightly above (Ttrs + ) the transition temperature Ttrs or by temperature scanning techniques such as adiabatic calorimetry or Differential Scanning Calorimetry (DSC). The heat capacity (CP) can be indirectly determined as the derivative of the enthalpy curve versus temperature obtained by drop calorimetry experiments performed at different temperatures. However, this method is very time consuming. Moreover if the heat capacity undergoes large changes within a small temperature range, DSC and adiabatic calorimetric operating in scanning mode are more accurate at low scanning rates. The absolute entropy can be derived by temperature integration of the heat capacity over temperature ratio if the heat capacity is measured from a temperature of few degrees Kelvin up to the temperature of interest. For example, this approach has been successfully implemented by Gailhanou et al. (2012) on a series of clay minerals by using low temperature adiabatic calorimetry in conjunction with DSC above room temperature. Similarly, the heat capacities of three ternary sodium borosilicate glasses have been measured by adiabatic calorimetry between 13 and 300K by Yamashita et al. (2001). The variations with temperature of the enthalpy and of the Gibbs energy are of course easily derived from the complete Cp curve.
Table 1. Functions relative to a single phase
Thermal functions Formation or mixing functions Quantity Method Quantity Method
2
1
TTH
J.mol-1
Isothermal drop calorimetry Inverse drop calorimetry for
glasses
Hf or
Hmix
J.mol-1
Direct reaction calorimetry Solution calorimetry Temperature coefficient in heterogeneous
equilibrium (2nd law) 3rd law knowing the absolute entropy of all
the products and reactants
Htrs
J.mol-1
Isothermal drop calorimetry Adiabatic calorimetry Differential Scanning
Calorimetry (DSC)
Gf or
Gmix
J.mol-1
Equilibrium constant of heterogeneous equilibrium:
KRTG ln
PC
J.mol-1.K-1
Derivative of H with respect to T
Adiabatic calorimetry DSC
Sf or
Smix
J.mol-1.K-1
Equilibrium constant of heterogeneous equilibrium:
TGHS 2
1
TTS
J.mol-1.K-1 trs
trsT
TP
THdT
TC2
1

140 Pierre Benigni et al. / Procedia Materials Science 7 ( 2014 ) 138 – 147
The enthalpy of formation (or of mixing) can be accurately measured by solution calorimetry or by direct reaction calorimetry if the reactivity between the reactants and the temperature are high enough for complete reaction. These enthalpies can also be experimentally determined using heterogeneous equilibrium techniques provided that the measurements are performed as a function of temperature over a sufficiently large temperature range. For example, raw vapor pressure data are processed according to the so-called 2nd law of thermodynamics and possibly the 3rd law if the thermal functions of all the individual components of the reaction are known (Chase Jr 1998). Gibbs energy of formation is only measured by heterogeneous equilibrium techniques.
The experimental methods for measuring partial functions relative to a solution are summarized in Table 2. The partial Gibbs energy is only measured by heterogeneous equilibrium techniques such as Knudsen effusion in which a condensed phase is equilibrated with its vapor, or by the EMF method. A third method consists in equilibrating a phase to be studied with one phase the thermodynamic properties of which are known and measuring the chemical composition. The most accurate method for partial enthalpy determination is the direct reaction or solution calorimetry. An example of the latter approach can be found in the work of Linard et al. (2008) who measured the enthalpies of solution of La2O3, TiO2, HfO2, NiO and CuO by high-temperature drop calorimetry in a sodium silicate solvent.
Table 2. Partial functions relative to a solution
Quantity Method
iG
J.mol-1
Equilibrium between a gaseous and a condensed phase: Knudsen effusion Electrochemical equilibrium: EMF method Equilibrating a phase to be studied with one phase the properties of which are known
iH
J.mol-1 Direct reaction calorimetry Solution calorimetry
The subsequent parts of the paper are focused on two techniques: the solution calorimetry, which is applied in our
laboratory both at room and high temperature on oxide glasses and the KEMS which is under development in our team for activity measurement at high temperature.
2. Measurement of the enthalpy of formation of oxide glasses by solution calorimetry
As, because of its metastable nature, it is not possible to form a glass by direct reaction of its various constitutive simple oxides inside the calorimeter, solution calorimetry is the generally preferred method in order to determine the enthalpy of formation of a glass.
In this method, prior elaboration of the glass is required then, in a second step, the glass and each of its constitutive reference oxides are separately dissolved in various batches of the same liquid solvent S at the temperature T. For example, for a ternary glass xSiO2-yAl2O3-zNa2O, the individual separate solution reactions are written as:
Glass + 3S ((xSiO2, yAl2O3, zNa2O))3S (1) xSiO2 + S ((xSiO2))S (2) yAl2O3 + S ((yAl2O3))S (3) zNa2O + S ((zNa2O))S (4)
Where “Glass” in equation (1) represents one mole of a ternary glass xSiO2-yAl2O3-zNa2O and “(( ))S
” means that the species between the double parentheses are dissolved in the quantity S of the solvent.
The formation reaction of the glass is written as follows: xSiO2 + yAl2O3 + zNa2O Glass (5)
141 Pierre Benigni et al. / Procedia Materials Science 7 ( 2014 ) 138 – 147
According to the reaction (5), the enthalpy of formation of the glass is simply obtained from the difference between the algebraic sum of the enthalpies of solution of the reference oxides and the solution enthalpy of the glass:
fH(Glass) solH(2) + solH(3) + solH(4) - solH(1) (6) Where the enthalpy of reaction (i) is denoted solH(i).
However equation (6) holds true only if the sum of the final states of the reactions (2), (3) and (4) is the same as the final state of reaction (1) requiring that there are no interactions between SiO2, Na2O and Al2O3 in the final bath of reaction (1). This condition is fulfilled if the solH of all the reactions are measured at infinite dilution.
Practically, the solution enthalpies are measured versus the concentration in the solvent and the values are extrapolated to zero concentration. In the cases where the solH at high dilution are not concentration dependent, extrapolation to infinite dilution is not necessary.
The solvent must meet several requirements: It must dissolve the substance to be studied and all the references in order to attain a final equilibrium state; In a reasonable time compatible with the thermal stability of the calorimeter. ΔsolH for the glass and for all references (i = 1,…n) must have the same order of magnitude in order to obtain a
good precision on ΔfH, because ΔfH is calculated by a difference through equation (6). The dissolution process depends on the nature of the chemical bonding in the solute, on the nature of the solvent
and on the temperature. It involves the destruction of the solid lattice of the substance to be dissolved, the dissolution effect in the solvent (e.g. ionization of a metal in an acid aqueous solution) and potential side reactions with the solvent like the precipitation of a compound (e.g. CaF2 after dissolving a CaO containing glass in a HF aqueous solution if Ca2+ concentration exceeds the solubility limit) or the formation of a complex by solvatation.
Solution calorimetry on nuclear glasses can be performed both at room temperature using mixtures of aqueous acids as the solvent or at higher temperature in molten oxide bathes.
2.1. Room temperature solution calorimetry
The instrument is a special rotary Tian-Calvet microcalorimeter named CALSOL. This prototype constructed in the “Centre de Thermodynamique et Microcalorimétrie de Marseille” by Ganteaume and his coworkers is described in details in Ganteaume et al. (1991). The C80 calorimeter from the Setaram Instrumentation Company is based on the same principle.
The apparatus (Fig. 1a) is a heat flow meter based on a differential twin cell design. It is used in isothermal mode. To promote good mixing of the solute and the solvent, the whole calorimeter is able to rotate around the horizontal axis (Fig. 1a). The calorimeter is itself located in a temperature-controlled (±0.5K) room.
The reaction cell is shown in Fig. 1b. In the starting position, the solute and the solvent are housed in separate containers. During the first rotation, the cell is turned upside down and the lid covering the solute container falls and the solvent is brought in contact with the solute. Periodic rocking of the calorimeter is continued for the entire duration of the dissolution reaction.
The differential voltage of the two copper/constantan thermopiles surrounding respectively the sample and the reference cells is recorded versus time. This voltage is proportional to the instantaneous heat flow. The calibration, which is needed to convert the recorded voltage (V) to a thermal power (J.s-1), can be performed using the calibration resistance embedded in the cell (Fig. 1b) or preferably by the endothermic or exothermic effect resulting from the dissolution of a reference material in a well defined solvent (e.g. THAM in HCl 0.12M, Ganteaume et al., 1991). The heat quantity is obtained by time integration of the instantaneous heat flow over the whole duration of the dissolution.

142 Pierre Benigni et al. / Procedia Materials Science 7 ( 2014 ) 138 – 147
a) b)
K
I
35 mm
K
I
K
I
35 mm
A, calorimeter block; B, thick thermo-regulated vessel; C, outer vessel; D, temperature sensor of the controller; E, double coil heating resistance; G, electronic control board; I, thermal insulator; K, cones for even distribution of outer thermal disturbances; L and T, thermopiles; M, thermistor for calorimeter temperature control; N, cell blocking rods; P and Q, housings of the reaction and reference cells; R et S, top et bottom outer vessel lids.
A, cell body; B, immersion sleeve; C, calibration electrical resistance; D, solute container; E, platinum lid; F, Viton O-ring; G, screwed lid of the cell; H, electrical leads of the calibration resistance; I, Solute; J, liquid seal; K, solvent; ab, height of the cell which is inserted in the thermopile
Fig. 1. a) Section of the CALSOL calorimeter b) section of the reaction cell, adapted from Ganteaume et al. (1991)
The calorimeter has a time constant of 45 min and combines a high sensitivity of 0.05 μW/cm3 with a very steady response. It has been checked that the calibration constant does not change appreciably over several years. The baseline is very stable over several days.
For compounds containing silica and silicate glasses, the usual solvent is a mixture of acids involving hydrofluoric acid: e.g. HF(13M) – HNO3(6M) for a Beidellite clay mineral.
The thermal effect induced by stirring the solvent must be measured and subtracted from the overall effect. In Fig. 2 the return of the calorimetric signal to its initial baseline as soon as the stirring is stopped is an evidence of the completion of the dissolution reaction. Practically, the dissolution is considered finished when the heat flow becomes lower than 10-4 of its peak recorded value.
The scale displayed on the vertical axis also shows that the baseline has a stability better than ±4 μW allowing very small heat effects to be accurately measured. Despite this, the return of the calorimetric signal to the baseline may become difficult to assess when the dissolution kinetics is slow and last several days. It represents the main measuring error in this case.
Among the experimental errors originating from the sample, the weighing of the sample mass is usually not an issue as samples of the order of 10 mg are determined with an accuracy of 0.01 mg on a conventional laboratory balance. For samples of 1 mg, a microbalance should be used to achieve a 0.001 mg accuracy. However, significant error may result from insufficient purity of the sample due to presence of a secondary phase, or if the sample is not fully equilibrated at the issue of the elaboration route.
A systematic error of the order of ±0.1% also arises from the chemical calibration of the calorimeter. It always remains possible to a posteriori correct the experimental results, if a revised and more accurate value of the solution enthalpy of the reference material becomes available.
Finally, the attainable precision in the determination of a heat of solution is in the range 0.1 to 0.5%. The CALSOL calorimeter has been recently used in an unconventional way to investigate the solubility of
molybdenum oxide in a ternary model glass containing silica, sodium and boron oxides. The solution enthalpy is plotted against the atomic percent of molybdenum oxide in Fig. 3. The curve presents a slope change around 1.5% which is a signature of the precipitation of a crystalline phase inside the glass. Beyond this solubility limit, the

143 Pierre Benigni et al. / Procedia Materials Science 7 ( 2014 ) 138 – 147
dissolution enthalpy is a linear function of the atomic percentage of molybdenum oxide typical of a two phased region. Moreover, if the crystalline phase is well identified and its dissolution enthalpy is separately measured, then the precipitated phase fraction can be determined.
-20
0
20
40
60
80
100
120
140
160
180
200
220
0 2000 4000 6000 8000 10000 12000 14000
Time, s
Hea
t fl
ow
, µW
End of stirring
Exothermic effect
Fig. 2. Typical calorimetric signal recorded during dissolution of silica or silicate solute in an acidic solvent
215
220
225
230
235
240
0 0.5 1 1.5 2 2.5
mol% MoO3 in the glass
dis
sH, k
J/m
ol
Fig. 3. Solution enthalpy of a ternary model glass against molar percent of molybdenum oxide
2.2. High temperature solution calorimetry in molten oxide solvent
This technique is described in details by Kleppa (1971) and in two subsequent reviews by Navrotsky (1977, 1997). High temperature Tian-Calvet calorimeters are mainly used. The principle of these calorimeters, which operate up to 1300K, is identical to their room temperature version but their technology is obviously different. Refractory materials, able to withstand long-term stay at high temperature, are required. For example, the thermopiles are made of platinum/rhodium wires.
Among the different oxides mixtures used as solvents in the literature, lead metaborate 2PbO-B2O3 is the most largely utilized (Navrotsky, 1977) because of its excellent ability to dissolve both acidic (e.g. SiO2, Al2O3) and basic (e.g. CaO or MgO) oxides. Moreover, this specific solvent acts as a buffer avoiding significant change of the dissolution enthalpy with slight variations of the melt composition. Lead metaborate is also easy to elaborate and to store because it is vitreous and weakly hygroscopic at room temperature. Its eutectic composition is fully liquid at a relatively low temperature of 773 K.
However, in the temperature range of the calorimetric experiments, the viscosity of lead metaborate and of oxide melts in general is sufficiently high to render stirring of the melt mandatory in order to enhance dissolution of the samples.
In practice, solvent stirring is performed by vertical translation of the platinum sample holder inside the bath. In the operating mode of Kleppa (1971) and Navrotsky (1977), after thermal equilibration of the sample holder at the calorimeter temperature, dissolution reaction is initiated by lowering the sample cup into the melt, performing a quick stirring and then returning the sample holder to its original position. This procedure is repeated several times during the dissolution. After completion of the dissolution, the heat effect induced by the intermittent stirring is evaluated by a blank experiment. Even if a standard length of time and a number of up and down movements are applied for each stirring, the procedure remains manual. Another difficulty can arise if the sample is not totally washed up from the cup during the first immersion.
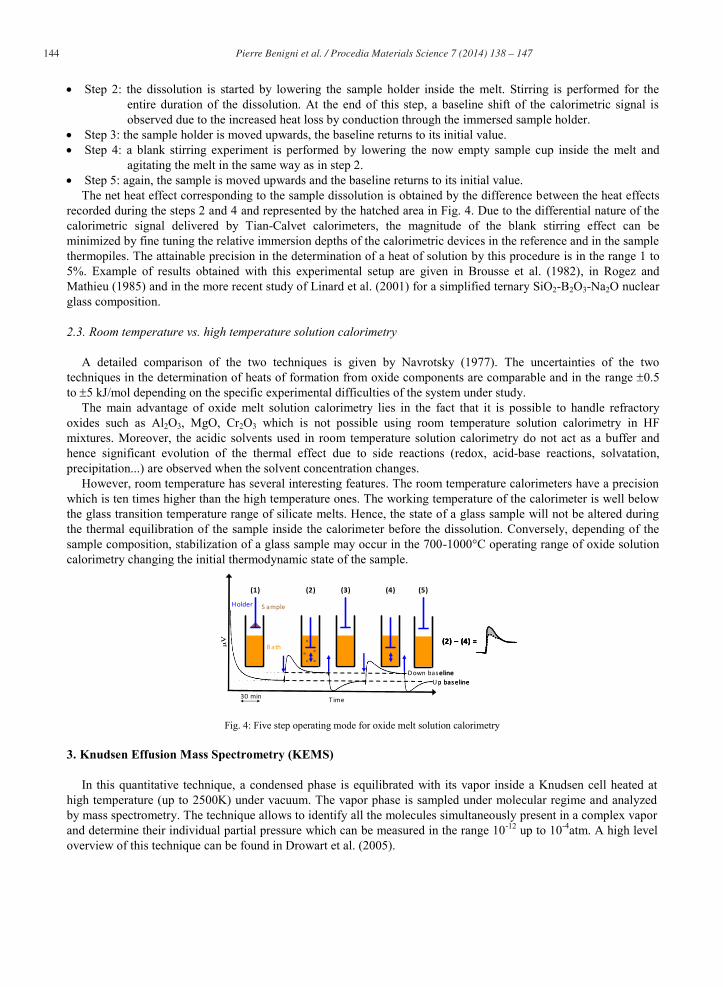
In order to increase the reproducibility of such experiments and enhance the sample dissolution, Brousse et al. (1981, 1982) in the Centre de Thermodynamique et Microcalorimétrie de Marseille have developed an automated stirring device equipped with synchronous motors to provide periodic vertical movement of the sample holder. The experiments follow a five step operating mode (Fig. 4): Step 1: the filled sample cup is thermally equilibrated at the calorimeter temperature few millimeters above the
solvent bath,
144 Pierre Benigni et al. / Procedia Materials Science 7 ( 2014 ) 138 – 147
Step 2: the dissolution is started by lowering the sample holder inside the melt. Stirring is performed for the entire duration of the dissolution. At the end of this step, a baseline shift of the calorimetric signal is observed due to the increased heat loss by conduction through the immersed sample holder.
Step 3: the sample holder is moved upwards, the baseline returns to its initial value. Step 4: a blank stirring experiment is performed by lowering the now empty sample cup inside the melt and
agitating the melt in the same way as in step 2. Step 5: again, the sample is moved upwards and the baseline returns to its initial value.
The net heat effect corresponding to the sample dissolution is obtained by the difference between the heat effects recorded during the steps 2 and 4 and represented by the hatched area in Fig. 4. Due to the differential nature of the calorimetric signal delivered by Tian-Calvet calorimeters, the magnitude of the blank stirring effect can be minimized by fine tuning the relative immersion depths of the calorimetric devices in the reference and in the sample thermopiles. The attainable precision in the determination of a heat of solution by this procedure is in the range 1 to 5%. Example of results obtained with this experimental setup are given in Brousse et al. (1982), in Rogez and Mathieu (1985) and in the more recent study of Linard et al. (2001) for a simplified ternary SiO2-B2O3-Na2O nuclear glass composition.
2.3. Room temperature vs. high temperature solution calorimetry
A detailed comparison of the two techniques is given by Navrotsky (1977). The uncertainties of the two techniques in the determination of heats of formation from oxide components are comparable and in the range 0.5 to 5 kJ/mol depending on the specific experimental difficulties of the system under study.
The main advantage of oxide melt solution calorimetry lies in the fact that it is possible to handle refractory oxides such as Al2O3, MgO, Cr2O3 which is not possible using room temperature solution calorimetry in HF mixtures. Moreover, the acidic solvents used in room temperature solution calorimetry do not act as a buffer and hence significant evolution of the thermal effect due to side reactions (redox, acid-base reactions, solvatation, precipitation...) are observed when the solvent concentration changes.
However, room temperature has several interesting features. The room temperature calorimeters have a precision which is ten times higher than the high temperature ones. The working temperature of the calorimeter is well below the glass transition temperature range of silicate melts. Hence, the state of a glass sample will not be altered during the thermal equilibration of the sample inside the calorimeter before the dissolution. Conversely, depending of the sample composition, stabilization of a glass sample may occur in the 700-1000°C operating range of oxide solution calorimetry changing the initial thermodynamic state of the sample.
Up baselineDown baseline
B ath
S ampleHolder
30 min
(1) (2) (3) (4) (5)
T ime
(2) – (4) =
Up baselineDown baseline
B ath
S ampleHolder
30 min
(1) (2) (3) (4) (5)
T ime
(2) – (4) = (2) – (4) =
Fig. 4: Five step operating mode for oxide melt solution calorimetry
3. Knudsen Effusion Mass Spectrometry (KEMS)
In this quantitative technique, a condensed phase is equilibrated with its vapor inside a Knudsen cell heated at high temperature (up to 2500K) under vacuum. The vapor phase is sampled under molecular regime and analyzed by mass spectrometry. The technique allows to identify all the molecules simultaneously present in a complex vapor and determine their individual partial pressure which can be measured in the range 10-12 up to 10-4atm. A high level overview of this technique can be found in Drowart et al. (2005).

145 Pierre Benigni et al. / Procedia Materials Science 7 ( 2014 ) 138 – 147
The schematic of a KEMS apparatus is presented in Fig. 5. The molecular beam (in blue) effusing from one Knudsen cell crosses an electron beam (in red) inside an ion source. Neutral molecules of the vapor are ionized, extracted and accelerated by an ion optics to form an ion beam (in green) before entering a mass filter, which can be a quadripole, a magnetic sector, or a double focusing spectrometer composed of a magnetic sector and an electrostatic sector as shown in Fig. 5. The ionic current is measured using a Faraday cup and/or an electron multiplier to increase the sensitivity.
Magnetic sector B
Multiple cell furnace
Moveable F araday cup
S econdary electronmultiplier
Ion source
E lectrostaticsector E
E lectron beam
Molecular beam
Ion beam
Magnetic sector B
Multiple cell furnace
Moveable F araday cup
S econdary electronmultiplier
Ion source
E lectrostaticsector E
E lectron beam
Molecular beam
Ion beam
Fig. 5. Principle of the multiple cell Knudsen Effusion Mass Spectrometry.
The fundamental relation of the spectrometer (eq. 7) links the partial pressure pi (Pa) of a species i in the Knudsen cell to the ionic current Ii (A) which is detected for this species.
TI
Spii
ii (7)
Obviously, the pressure is proportional to the temperature T (K) of the Knudsen cell (perfect gas law). The quantities at the denominator of equation (7) are the ionization cross section i (m2) and the relative detector sensitivity i (dimensionless), they depend on the species. The S factor is a device constant which includes geometric factors of the apparatus.
The S factor can not be calculated and in the most general case a calibration of the apparatus is needed to convert ionic intensities to vapor pressures. This calibration can be performed by using a reference sample of known vapour pressure or, when relevant, by weighing the cell before and after the experiment in order to determine the total mass loss.
Inside a Knudsen cell, the thermodynamic equilibrium imposes that the activity in the condensed phase ai equals the activity in the gas phase (eq. 8):
0i
iiii p
pXa (8)
where i and Xi are respectively the activity coefficient and the molar fraction of i in the condensed phase, pi is the partial pressure of i above the melt or glass and p°i the partial pressure of i above a condensed reference state (e.g. pure oxide). Using monocell effusion, two successive experimental runs are required for activity determination: the first for the solution sample and the second for the reference. The activity can then be written as a function of the ion intensities according to eq. 9:
2run 0
i
1run i TSTS
i
i
i
ii I
Ia (9)
However, S can not be kept strictly constant between these two runs because venting of the spectrometer is needed to exchange samples and in general the ion source has also to be stopped. Different methods are used in the literature to overcome this problem. They are based on simultaneous measurements of ion intensities for different species i and j using additional relations to eliminate or evaluate the remaining unknown quantities (Raychaudhuri and Stafford 1975). Among these methods the dual or multiple cell effusion, alternately named differential mass spectrometry, has been strongly developed by C. Chatillon and its coworkers from 1975 up to now in Grenoble (Chatillon et al. 1976). A minimum of 2 up to 6 cells are used and this comparative method has many advantages: One cell filled with a reference sample acts as an internal standard allowing a continuous calibration of the mass
spectrometer for each species considered and at a strictly identical ionization energy. Several chemical compositions can be studied and compared in a single run.
146 Pierre Benigni et al. / Procedia Materials Science 7 ( 2014 ) 138 – 147
Different dimensions and shapes of the effusion orifice for each cell can be used simultaneously during a single run to estimate the equilibrium pressure when the evaporation coefficients are low.
Activity is measured directly in a single run provided that the multicell block is isothermal and S remains the same when the cells are switched. The data treatment is straightforward and easily extended to ternary or multicomponent systems.
Only one component needs to be volatile. This feature is very interesting in oxide systems because vapor pressures of the components are low and sometimes measurable only for one vapor component preventing the use of the classical ratio methods in monocell effusion.
Measurement over a large composition range is not mandatory to obtain an activity value: any single measurement at any composition gives one activity value.
It is possible to check the internal consistency of the results; for example in a binary system, measurements of two volatile components give a Gibbs-Duhem check. The price to pay for these increased abilities is that part of the spectrometer has to be rebuilt because, in general,
vacuum chambers of conventional spectrometers are not large enough to house a multicell furnace. It is worth noting that isothermicity of the multicell block is harder to achieve and can be an issue at T < 1100°C. Similarly, the pumping capacities must be increased because of the higher steady flow of molecules effusing from the multicell device. Moreover, a special furnace positioning mechanism, with a good reproducibility, is required for switching the cells and careful collimation of the molecular beam is mandatory. No experimental device of this type is available on a commercial basis and the system has to be homemade in the lab but requires the technical and scientific support of an experienced team/researcher in the field.
The source of errors in the KEMS experiments fall under four headings (Drowart et al. 2005): the instrumental factors include the design of the Knudsen cell assembly, the mode of heating this assembly, the
temperature measurement, the mode of forming and collimating the molecular beam with respect to the ion source of the mass spectrometer, the design and mode of operation of the ion source, the type of mass spectrometer (magnetic or quadrupole), the type of detector and operating mode (analog or ion counting), the quality of the vacuum achieved.
The physical factors are mainly the ionization cross-sections of the vapour species involved. The chemico-physical factors include the purity of the substances under investigations, their potential interaction
with the container or other substance with which they coexist, the degree of establishment of mutual equilibrium between these substances as well as with the gas phase, the modification of equilibrium partial pressures by the sampling process, the phase relationships at each time during the measurement.
The thermodynamic factors include the thermal data for the relevant condensed phases and gas species. Despite these numerous factors, the technique provides many different ways to check the internal consistency and
accuracy of the measurements. It is very difficult to provide an overall uncertainty value for such a method. For activity measurements, an uncertainty of few percents is attainable with a well operated multiple cell mass spectrometer.
The results obtained by KEMS on glasses are reviewed in the textbook of Stolyarova and Semenov (1994). The KEMS studies performed between 1990 and 2010 are reviewed by Miller and Armatys (2013).
In our team, good results have been obtained in the past years on alkaline silicates systems by monocell effusion (Chastel et al. 1987, Bennour et al. 1996) using the method of Belton and Fruehan (1967). At present, the transformation of a double focusing mass spectrometer for multicell effusion is underway (Benigni et al. 2013).
4. Conclusion
Thermodynamic functions on oxides and oxide glass systems can be accurately determined by calorimetry, both at room and at high temperatures, and by heterogeneous equilibrium techniques such as Electro-Motive Force measurements and vapor pressure measurements by Knudsen Effusion Mass Spectrometry. Whenever possible, use of these techniques in a complementary fashion can give a greater insight in the thermodynamic properties as illustrated by the case of study of the mixing properties of NaAlSi3O8-KAlSi3O8 melts and glasses (Fraser & Bottinga, 1985).
147 Pierre Benigni et al. / Procedia Materials Science 7 ( 2014 ) 138 – 147
References
Belton, G. R., & Fruehan, R. J. (1967). Determination of activities by mass spectrometry. I. The liquid metallic systems iron-nickel and iron- cobalt. J. Phys. Chem., 71(5), 1403–1409.
Benigni, P., Berche, A., Mikaelian, G., & Rogez, J. (2013). Transformation of a Double Focusing B-E Mass Spectrometer for Multiple-Cell Knudsen Effusion – Part I: Scientific Concepts. Electrochemical Society Transactions, 46(1), 127–141.
Bennour, F., Chastel, R., Mathieu, J.-C., Coutures, J.-P., & Bergman, C. (1996). Determination of the Excess Thermodynamic Functions in Ternary Cs2O-SiO2-Na2O Melts by Knudsen Effusion Mass Spectrometry. Physics and Chemistry of Liquids, 33(4), 229–248.
Brousse, C. (1981). Contribution à l’étude thermodynamique du système NaAlSi3O8 -KAlSi3O8 (albite - orthose). Thèse de Spécialité, Institut National Polytechnique de Grenoble.
Brousse, C., Rogez, J., Castanet, R., & Mathieu, J.-C. (1982). Enthalpie de melange du système vitreux albite-orthose (Na,K) AlSi3O8. Materials Research Bulletin, 17(1), 125–132.
Chase Jr, M. (1998). NIST-JANAF Thermochemical Tables Fourth Edition. Journal of Physical and Chemical Reference Data, Monograph 9 (Part I Al-Co).
Chastel, R., Bergman, C., Rogez, J., & Mathieu, J.-C. (1987). Excess thermodynamic functions in ternary Na2O-K2O-SiO2 melts by Knudsen cell mass spectrometry. Chemical Geology, 62(1), 19–29.
Chatillon, C., Senillou, C., Allibert, M., & Pattoret, A. (1976). High temperature thermodynamical studies by a mass spectrometry device for measurements using multiple effusion cells. Review of scientific instruments, 47(3), 334–340.
Drowart, J., Chatillon, C., Hastie, J., & Bonnell, D. (2005). High-temperature mass spectrometry: Instrumental techniques, ionization cross-sections, pressure measurements, and thermodynamic data (IUPAC Technical Report). Pure and applied chemistry, 77(4), 683–737.
Fraser, D. G., & Bottinga, Y. (1985). The mixing properties of melts and glasses in the system NaAlSi3O8-KAlSi3O8: Comparison of experimental data obtained by knudsen cell mass spectrometry and solution calorimetry. Geochimica et Cosmochimica Acta, 49(6), 1377–1381.
Gailhanou, H., Blanc, P., Rogez, J., Mikaelian, G., Kawaji, H., Olives, J., Gaucher, E. C. (2012). Thermodynamic properties of illite, smectite and beidellite by calorimetric methods: Enthalpies of formation, heat capacities, entropies and Gibbs free energies of formation. Geochimica et Cosmochimica Acta, 89, 279–301.
Hemminger, W., & Höhne, G. (1984). Calorimetry. Fundamentals and Practice (p. 310). Heyrman, M., Chatillon, C., Collas, H., & Chemin, J.-L. (2004). Improvements and new capabilities for the multiple Knudsen cell device used in
high-temperature mass spectrometry. Rapid communications in mass spectrometry, 18(2), 163–74. Ipser, H., Mikula, A., & Katayama, I. (2010). Overview: The emf method as a source of experimental thermodynamic data. Calphad, 34(3), 271–
278 Kleppa, O. J. (1971). Oxide melt solution calorimetry. In CNRS (Ed.), Thermochimie (pp. 119–127). Marseille. Komarek, K. L. (1992). Experimental techniques in high temperature thermodynamics. Pure and applied chemistry, 64(1), 93–102. Kubaschewski, O., Alcock, C. B., & Spencer, P. J. (1993). Materials thermochemistry (6th ed., p. 363). Pergamon Press. Linard, Y., Yamashita, I., Atake, T., Rogez, J., & Richet, P. (2001). Thermochemistry of nuclear waste glasses: an experimental determination.
Journal of Non-Crystalline Solids, 286(3), 200–209. Linard, Y., Wilding, M. C., & Navrotsky, A. (2008). High temperature calorimetric studies of heat of solution of NiO, CuO, La2O3, TiO2, HfO2 in
sodium silicate liquids. Geochimica et Cosmochimica Acta, 72(2), 590–601. Miller, M., & Armatys, K. (2013). Twenty Years of Knudsen Effusion Mass Spectrometry: Studies Performed in the Period 1990-2010. The
Open Thermodynamics Journal, (March), 2–9. Navrotsky, A. (1977). Progress and New Directions in High Temperature Calorimetry. Physics and Chemistry of Minerals, 2(1-2), 89–104. Navrotsky, A. (1997). Progress and new directions in high temperature calorimetry revisited. Physics and Chemistry of Minerals, 24(3), 222–241. Raychaudhuri, P., & Stafford, F. (1975). Alloy thermodynamics by mass spectrometry: A critical review. Materials Science and Engineering, 20,
1–18. Rogez, J., & Mathieu, J. C. (1985). Enthalpie de Formation dans le Système Na2O-K2O-SiO2. Physics and Chemistry of Liquids, 14(4), 259–272. Stebbins, J. F., & Carmichael, I. S. E. (1983). The high temperature liquid and glass heat contents and the heats of fusion of diopside, albite,
sanidine and nepheline. American Mineralogist, 68, 717–730. Stolyarova, V., & Semenov, G. A. (1994). Mass spectrometric study of the vaporization of oxides systems (1st ed., p. 446). John Wiley & Sons
Ltd. Yamashita, I., Tojo, T., Kawaji, H., Atake, T., Linard, Y., & Richet, P. (2001). Low-temperature heat capacity of sodium borosilicate glasses at
temperatures from 13 K to 300 K. The Journal of Chemical Thermodynamics, 33(5), 535–553.
Related Documents