Experimental design for binary diagnostic tests Frank Schaarschmidt Institute of Biostatistics - Leibniz Universit¨ at Hannover 2009 September 23 ESNATS Summerschool, Zermatt email: [email protected] Frank Schaarschmidt (Biostatistics, LUH) Diagnostic tests 2009 September 23 1 / 39

Welcome message from author
This document is posted to help you gain knowledge. Please leave a comment to let me know what you think about it! Share it to your friends and learn new things together.
Transcript

Experimental design for binary diagnostic tests
Frank Schaarschmidt
Institute of Biostatistics - Leibniz Universitat Hannover
2009 September 23
ESNATS Summerschool, Zermatt
email: [email protected]
Frank Schaarschmidt (Biostatistics, LUH) Diagnostic tests 2009 September 23 1 / 39
1 Motivation and introduction
2 Some basic statistical concepts
3 Binary diagnostic test
4 Experimental design for binary diagnostic tests
5 Software
6 References
Frank Schaarschmidt (Biostatistics, LUH) Diagnostic tests 2009 September 23 2 / 39
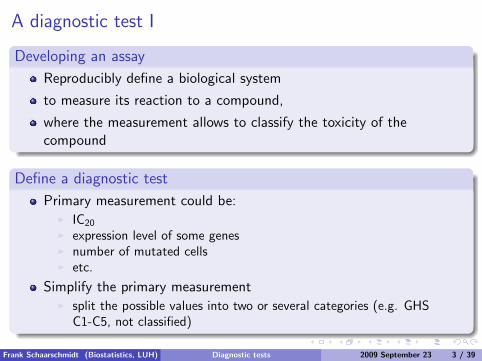
A diagnostic test I
Developing an assay
Reproducibly define a biological system
to measure its reaction to a compound,
where the measurement allows to classify the toxicity of thecompound
Define a diagnostic test
Primary measurement could be:I IC20
I expression level of some genesI number of mutated cellsI etc.
Simplify the primary measurementI split the possible values into two or several categories (e.g. GHS
C1-C5, not classified)
Frank Schaarschmidt (Biostatistics, LUH) Diagnostic tests 2009 September 23 3 / 39

A diagnostic test II
Binary diagnostic test
Most simple scenario: classify into only two categoriesI fatal vs. not fatal, or,I {C1, C2, C3, C4} vs. {C5, not classified}, or,I IC20 ≤ 0.001 vs. IC20 > 0.001
Validation
For a given set of compounds
compare the results of the new assay toI the results of an existing gold standard (e.g. an in-vivo assay)I the summary of all available knowledge from different sources (the
’truth’ as defined by an expert)
Frank Schaarschmidt (Biostatistics, LUH) Diagnostic tests 2009 September 23 4 / 39
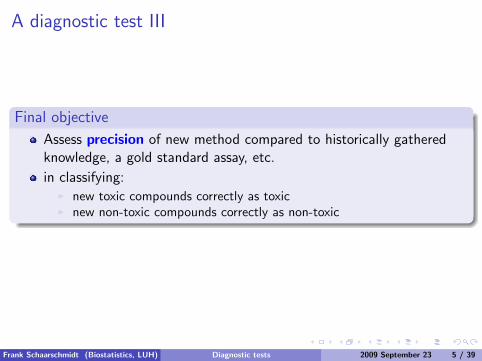
A diagnostic test III
Final objective
Assess precision of new method compared to historically gatheredknowledge, a gold standard assay, etc.
in classifying:I new toxic compounds correctly as toxicI new non-toxic compounds correctly as non-toxic
Frank Schaarschmidt (Biostatistics, LUH) Diagnostic tests 2009 September 23 5 / 39
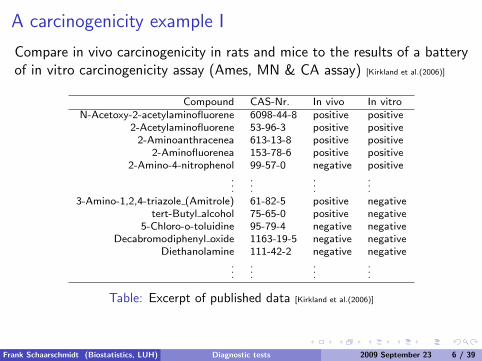
A carcinogenicity example I
Compare in vivo carcinogenicity in rats and mice to the results of a batteryof in vitro carcinogenicity assay (Ames, MN & CA assay) [Kirkland et al.(2006)]
Compound CAS-Nr. In vivo In vitroN-Acetoxy-2-acetylaminofluorene 6098-44-8 positive positive
2-Acetylaminofluorene 53-96-3 positive positive2-Aminoanthracenea 613-13-8 positive positive
2-Aminofluorenea 153-78-6 positive positive2-Amino-4-nitrophenol 99-57-0 negative positive
......
......
3-Amino-1,2,4-triazole (Amitrole) 61-82-5 positive negativetert-Butyl alcohol 75-65-0 positive negative
5-Chloro-o-toluidine 95-79-4 negative negativeDecabromodiphenyl oxide 1163-19-5 negative negative
Diethanolamine 111-42-2 negative negative...
......
...
Table: Excerpt of published data [Kirkland et al.(2006)]
Frank Schaarschmidt (Biostatistics, LUH) Diagnostic tests 2009 September 23 6 / 39

A carcinogenicity example II
In-vivoIn vitro negative positive
negative 9 9positive 18 41
Total 27 50
Table: Summary: In vitro vs. in vivo test results [Kirkland et al.(2006)]
Relative predictivity:
9 + 41
9 + 9 + 18 + 41=
50
77= 0.65 (1)
Is that all to present? What does it tell? What else to present?
Frank Schaarschmidt (Biostatistics, LUH) Diagnostic tests 2009 September 23 7 / 39
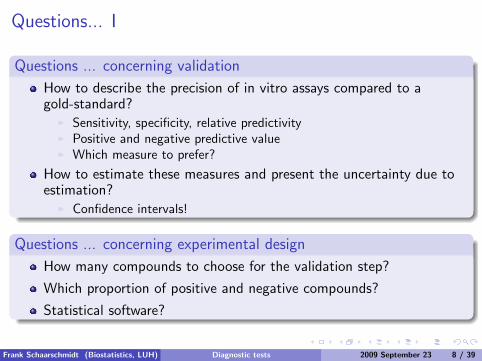
Questions... I
Questions ... concerning validation
How to describe the precision of in vitro assays compared to agold-standard?
I Sensitivity, specificity, relative predictivityI Positive and negative predictive valueI Which measure to prefer?
How to estimate these measures and present the uncertainty due toestimation?
I Confidence intervals!
Questions ... concerning experimental design
How many compounds to choose for the validation step?
Which proportion of positive and negative compounds?
Statistical software?
Frank Schaarschmidt (Biostatistics, LUH) Diagnostic tests 2009 September 23 8 / 39
Questions... II
IN THIS TALK:1 Introduction to basic statistical concepts
2 Binary diagnostic tests: Validation
3 Experimental design for binary diagnostic tests
4 Software
Frank Schaarschmidt (Biostatistics, LUH) Diagnostic tests 2009 September 23 9 / 39

Some basic statistical concepts
Frank Schaarschmidt (Biostatistics, LUH) Diagnostic tests 2009 September 23 10 / 39
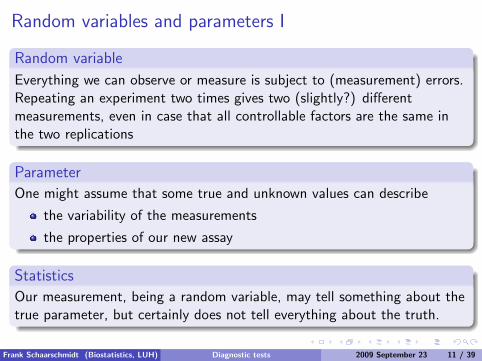
Random variables and parameters I
Random variable
Everything we can observe or measure is subject to (measurement) errors.Repeating an experiment two times gives two (slightly?) differentmeasurements, even in case that all controllable factors are the same inthe two replications
Parameter
One might assume that some true and unknown values can describe
the variability of the measurements
the properties of our new assay
Statistics
Our measurement, being a random variable, may tell something about thetrue parameter, but certainly does not tell everything about the truth.
Frank Schaarschmidt (Biostatistics, LUH) Diagnostic tests 2009 September 23 11 / 39

Decisions under uncertainty - Hypothesis tests I
Decisions
Two complementary statements:
1 The new assay is sufficiently precise in distinguishing (toxic vs.non-toxic)
2 The new assay is NOT sufficiently precise in ...
might be expressed in terms of a parameter for precision:
1 H1: The precision of the new assay is greater x0.
2 H0: The precision of the new assay is smaller or equal x0.
where x0 is the margin of insufficient precision.
Whenever we decide for one of these statements, based onobservations, the decision could be wrong, because the observationsare random variables.
Frank Schaarschmidt (Biostatistics, LUH) Diagnostic tests 2009 September 23 12 / 39

Decisions under uncertainty - Hypothesis tests II
Right and wrong decisions in hypothesis tests
Unknown truthTest decision H0 is true H1 is true
H0 is true 1− α β
H1 is true α 1− β
Table: Type-I and Type-II errors in statistical tests
Type-I-error (α): Risk of rejecting H0 when indeed H0 is true
Type-II-error (β): Risk of not rejecting H0 when indeed H1 is true
Power (1− β): Chance of deciding for H1, when H1 is indeed true
Frank Schaarschmidt (Biostatistics, LUH) Diagnostic tests 2009 September 23 13 / 39

Decisions under uncertainty - Hypothesis tests III
In our case
Type-I-error (α): Risk of deciding that the assay is sufficientlyprecise, when indeed it is NOT
Type-II-error (β): Risk of deciding that the assay is insufficientlyprecise, when indeed the assay is sufficiently precise
Power (1− β): Chance of correctly identifying the new assay assufficiently precise
Controlling the type-I-error α
Directly fixed and controlled by the test
Specify the hypotheses such that the more important risk is controlledvia α
By convention chosen at α = 0.05 (’5% significance level’)
Frank Schaarschmidt (Biostatistics, LUH) Diagnostic tests 2009 September 23 14 / 39
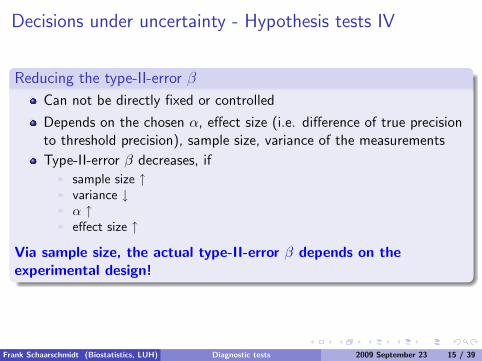
Decisions under uncertainty - Hypothesis tests IV
Reducing the type-II-error β
Can not be directly fixed or controlled
Depends on the chosen α, effect size (i.e. difference of true precisionto threshold precision), sample size, variance of the measurements
Type-II-error β decreases, ifI sample size ↑I variance ↓I α ↑I effect size ↑
Via sample size, the actual type-II-error β depends on theexperimental design!
Frank Schaarschmidt (Biostatistics, LUH) Diagnostic tests 2009 September 23 15 / 39

Confidence intervals I
Confidence intervals
constructed based on the measurements
such that the interval contains the true parameter in (1− α)*100 %of the cases
estimate a parameter, including the uncertainty of the estimation(due to measurement error, limited sample size, type-I-error)
decide upon arbitrary hypotheses concerning that parameter
Frank Schaarschmidt (Biostatistics, LUH) Diagnostic tests 2009 September 23 16 / 39
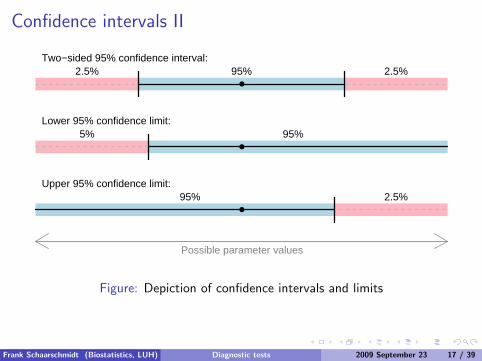
Confidence intervals II
●
2.5% 2.5%95%Two−sided 95% confidence interval:
●
5% 95%Lower 95% confidence limit:
●
2.5%95%Upper 95% confidence limit:
Possible parameter values
Figure: Depiction of confidence intervals and limits
Frank Schaarschmidt (Biostatistics, LUH) Diagnostic tests 2009 September 23 17 / 39
A binary diagnostic test for assay validation
Frank Schaarschmidt (Biostatistics, LUH) Diagnostic tests 2009 September 23 18 / 39

A binary diagnostic testObjective is the validation of a new assay method/protocol
Experimental setup
A sample of n compounds are investigated
n0 compounds are known to be non-toxic
n1 compounds are known to be toxic
the new assay is applied on all n = n0 + n1 compounds
Results in a 2× 2 table:
Truth (or gold standard)Assay result toxic non-toxic
toxic (1) x11 x10
non-toxic (0) x01 x00
Sample size n1 n0
Table: 2× 2 table summarizing the output of an experiment for estimatingpredictive values.
the result x11, x01, x10, x00 is a random variablerunning the same experiment a second time, in a different lab, with adifferent sample of n compounds will give (slightly?) different resultsHence: everything calculated from x11, x01, x10, x00 is subject touncertainty
Frank Schaarschmidt (Biostatistics, LUH) Diagnostic tests 2009 September 23 19 / 39
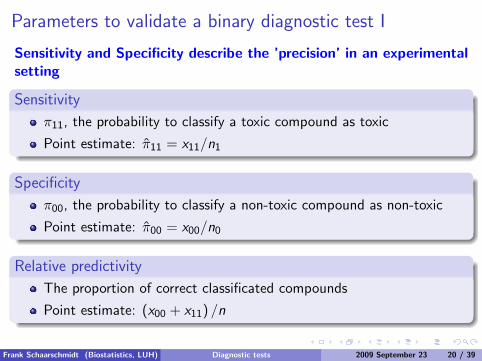
Parameters to validate a binary diagnostic test I
Sensitivity and Specificity describe the ’precision’ in an experimentalsetting
Sensitivity
π11, the probability to classify a toxic compound as toxic
Point estimate: π11 = x11/n1
Specificity
π00, the probability to classify a non-toxic compound as non-toxic
Point estimate: π00 = x00/n0
Relative predictivity
The proportion of correct classificated compounds
Point estimate: (x00 + x11) /n
Frank Schaarschmidt (Biostatistics, LUH) Diagnostic tests 2009 September 23 20 / 39
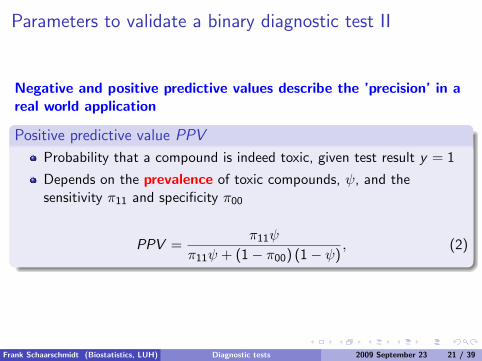
Parameters to validate a binary diagnostic test II
Negative and positive predictive values describe the ’precision’ in areal world application
Positive predictive value PPV
Probability that a compound is indeed toxic, given test result y = 1
Depends on the prevalence of toxic compounds, ψ, and thesensitivity π11 and specificity π00
PPV =π11ψ
π11ψ + (1− π00) (1− ψ), (2)
Frank Schaarschmidt (Biostatistics, LUH) Diagnostic tests 2009 September 23 21 / 39
Parameters to validate a binary diagnostic test III
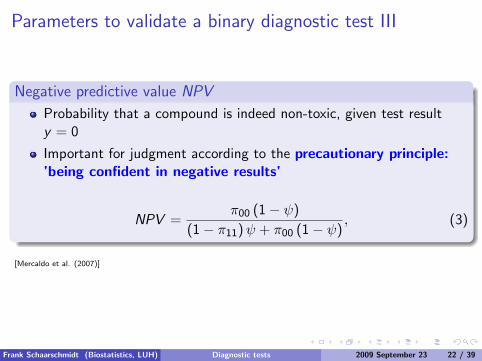
Negative predictive value NPV
Probability that a compound is indeed non-toxic, given test resulty = 0
Important for judgment according to the precautionary principle:’being confident in negative results’
NPV =π00 (1− ψ)
(1− π11)ψ + π00 (1− ψ), (3)
[Mercaldo et al. (2007)]
Frank Schaarschmidt (Biostatistics, LUH) Diagnostic tests 2009 September 23 22 / 39
Hypotheses / Confidence limits I
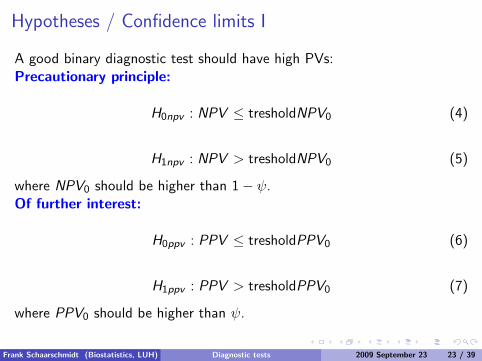
A good binary diagnostic test should have high PVs:Precautionary principle:
H0npv : NPV ≤ tresholdNPV0 (4)
H1npv : NPV > tresholdNPV0 (5)
where NPV0 should be higher than 1− ψ.Of further interest:
H0ppv : PPV ≤ tresholdPPV0 (6)
H1ppv : PPV > tresholdPPV0 (7)
where PPV0 should be higher than ψ.
Frank Schaarschmidt (Biostatistics, LUH) Diagnostic tests 2009 September 23 23 / 39

Hypotheses / Confidence limits II
Confidence interval methods
Confidence intervals for sensitivity and specificity (exact andapproximative) are available[Agresti and Coull (1998), Brown et al. (2001), Cai (2005)]
Confidence intervals for PPV and NPV are discussed by[Mercaldo et al. (2007)]
Frank Schaarschmidt (Biostatistics, LUH) Diagnostic tests 2009 September 23 24 / 39
A medical example on diagnosing Alzheimers disease I
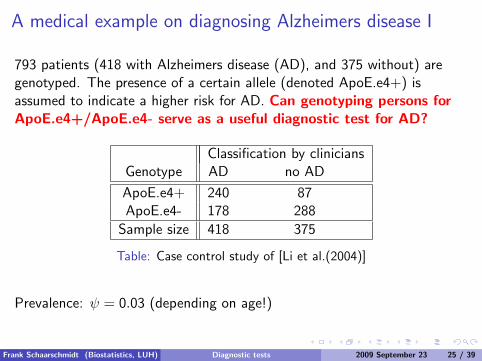
793 patients (418 with Alzheimers disease (AD), and 375 without) aregenotyped. The presence of a certain allele (denoted ApoE.e4+) isassumed to indicate a higher risk for AD. Can genotyping persons forApoE.e4+/ApoE.e4- serve as a useful diagnostic test for AD?
Classification by cliniciansGenotype AD no AD
ApoE.e4+ 240 87ApoE.e4- 178 288
Sample size 418 375
Table: Case control study of [Li et al.(2004)]
Prevalence: ψ = 0.03 (depending on age!)
Frank Schaarschmidt (Biostatistics, LUH) Diagnostic tests 2009 September 23 25 / 39
A medical example on diagnosing Alzheimers disease II
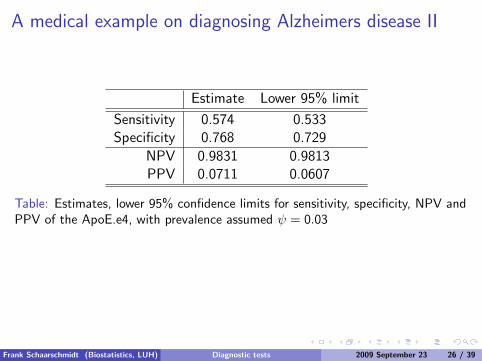
Estimate Lower 95% limit
Sensitivity 0.574 0.533Specificity 0.768 0.729
NPV 0.9831 0.9813PPV 0.0711 0.0607
Table: Estimates, lower 95% confidence limits for sensitivity, specificity, NPV andPPV of the ApoE.e4, with prevalence assumed ψ = 0.03
Frank Schaarschmidt (Biostatistics, LUH) Diagnostic tests 2009 September 23 26 / 39

Experimental design for binary diagnostic tests
Frank Schaarschmidt (Biostatistics, LUH) Diagnostic tests 2009 September 23 27 / 39
Experimental Design I
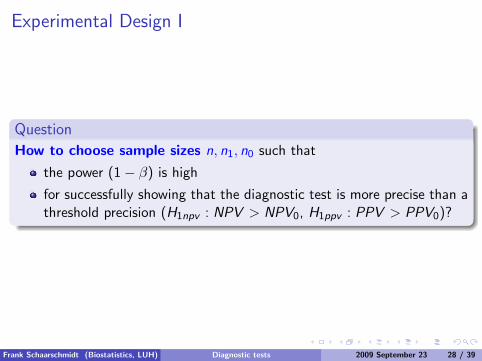
Question
How to choose sample sizes n, n1, n0 such that
the power (1− β) is high
for successfully showing that the diagnostic test is more precise than athreshold precision (H1npv : NPV > NPV0, H1ppv : PPV > PPV0)?
Frank Schaarschmidt (Biostatistics, LUH) Diagnostic tests 2009 September 23 28 / 39

Experimental Design II
Statistical background
The uncertainty of the test decision depends on the uncertainty of theestimates π11, π00.This again depends on:
True sensitivity π11 and specificity π00,
Sample size n and the proportion of true positives n1/n (and truenegatives)
The power (1− β) additionally depends on
prevalence ψ of positive compounds,
type-I-error rate α
Frank Schaarschmidt (Biostatistics, LUH) Diagnostic tests 2009 September 23 29 / 39
Experimental Design III
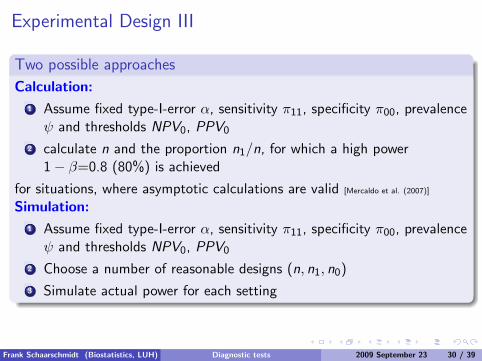
Two possible approaches
Calculation:
1 Assume fixed type-I-error α, sensitivity π11, specificity π00, prevalenceψ and thresholds NPV0, PPV0
2 calculate n and the proportion n1/n, for which a high power1− β=0.8 (80%) is achieved
for situations, where asymptotic calculations are valid [Mercaldo et al. (2007)]
Simulation:
1 Assume fixed type-I-error α, sensitivity π11, specificity π00, prevalenceψ and thresholds NPV0, PPV0
2 Choose a number of reasonable designs (n, n1, n0)
3 Simulate actual power for each setting
Frank Schaarschmidt (Biostatistics, LUH) Diagnostic tests 2009 September 23 30 / 39

An example of an assay for acute toxicity I
Setting
Acute toxicity
Prevalence ψ, of toxic compounds among all new chemicals (since1981):
a) Toxic ψ = 0.132 (13.2 %) (GHS C1-C4)b) Very toxic ψ = 0.004 (0.4%) (GHS C1, C2; fatal, LD50 ≤ 50 mg/kg)
[Bulgheroni et al. (2009)]
Investigating several assays,
[Clothier et al. (2008)] used n = 97 compounds
Frank Schaarschmidt (Biostatistics, LUH) Diagnostic tests 2009 September 23 31 / 39
An example of an assay for acute toxicity II
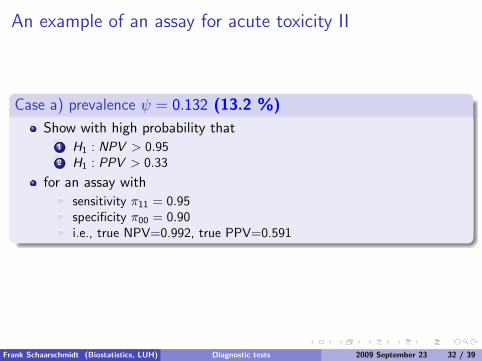
Case a) prevalence ψ = 0.132 (13.2 %)
Show with high probability that1 H1 : NPV > 0.952 H1 : PPV > 0.33
for an assay withI sensitivity π11 = 0.95I specificity π00 = 0.90I i.e., true NPV=0.992, true PPV=0.591
Frank Schaarschmidt (Biostatistics, LUH) Diagnostic tests 2009 September 23 32 / 39

An example of an assay for acute toxicity III
0.0 0.2 0.4 0.6 0.8 1.0
050
100
150
200
Proportion of toxic compounds, P ==n1
n
Tot
al s
ampl
e si
ze ,
n==
n 0++
n 1
All toxic compounds GHS: C1−C4Prevalence, ψψ == 0.132Sensitivity, ππ11 == 0.95Specificity, ππ00 == 0.9
Probability to rejectH0: NPV0 ≤≤ 0.9
0.90.80.70.5
Probability to rejectH0: PPV0 ≤≤ 0.33
0.90.80.70.5
Figure: Example of experimental design with intermediate prevalence
Case b) prevalence ψ = 0.004 (0.4 %)
Show with high probability that1 H1 : NPV > 0.9992 H1 : PPV > 0.33
for an assay withI sensitivity π11 = 0.98I specificity π00 = 0.90I i.e., true NPV=0.9999, true PPV=0.0379
Note: It is impossible to show that PPV > 0.33, since the true PPV forsuch an assay is about 0.0379.
0.0 0.2 0.4 0.6 0.8 1.0
050
100
150
200
Proportion of toxic compounds, P ==n1
n
Tot
al s
ampl
e si
ze ,
n==
n 0++
n 1
Very toxic compounds: GHS: C1, C2Prevalence, ψψ == 0.004Sensitivity, ππ11 == 0.98Specificity, ππ00 == 0.9
Probability to rejectH0: NPV0 ≤≤ 0.999
0.90.80.70.5
Probability to rejectH0: PPV0 ≤≤ 0.33
0.90.80.70.5
Figure: Example of experimental design for very low prevalence
Frank Schaarschmidt (Biostatistics, LUH) Diagnostic tests 2009 September 23 33 / 39

Software I
Frank Schaarschmidt (Biostatistics, LUH) Diagnostic tests 2009 September 23 34 / 39
Software I
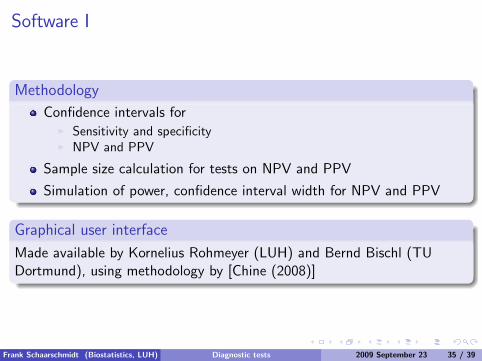
Methodology
Confidence intervals forI Sensitivity and specificityI NPV and PPV
Sample size calculation for tests on NPV and PPV
Simulation of power, confidence interval width for NPV and PPV
Graphical user interface
Made available by Kornelius Rohmeyer (LUH) and Bernd Bischl (TUDortmund), using methodology by [Chine (2008)]
Frank Schaarschmidt (Biostatistics, LUH) Diagnostic tests 2009 September 23 35 / 39

Software II
Installation
Needed before installation:
Java 6
R-2.9.2 (at least R>2.8.0)
http://dr-ibs.biostat.uni-hannover.de:8080/rjavaclient/deploy/esnats/
click Java Web Start
to download and run the installer
Frank Schaarschmidt (Biostatistics, LUH) Diagnostic tests 2009 September 23 36 / 39

References I
Agresti, A. and Coull, B.A. (1998). Approximate is better than ”exact” for intervalestimation of binomial proportions. The American Statistician 52, 119-126.
Brown, L.D., Cai, T.T., DasGupta, A. (2001). Interval estimation for a binomialproportion. Statistical Science 16, 101-128.
Bulgheroni A, Kinsner-Ovaskainen A, Hoffmann S, Hartung T, Prieto P (2009):Estimation of acute oral toxicity using the No Observed Adverse Effect Level(NOAEL) from the 28 day repeated dose toxicity studies in rats. RegulatoryToxicology and Pharmacology 53, 16-19.
Cai, T.T. (2005). One-sided confidence intervals in discrete distributions. Journalof Statistical Planning and Inference 131, 63-88.
Chine K (2008). Biocep, Towards a Federative, Collaborative, User-Centric,Grid-Enabled and Cloud-Ready Computational Open Platform. escience, 321-322.Fourth IEEE International Conference on eScience
Frank Schaarschmidt (Biostatistics, LUH) Diagnostic tests 2009 September 23 37 / 39
References II
Clothier R, Dierickx P, Lakhanisky T, Fabre M, Betanzos M, Curren R, SjostromM, Raabe H, Bourne N, Hernandez V, Mainez J, Owen M, Watts S andAnthonissen R (2008): A Database of IC50 Values and Principal ComponentAnalysis of Results from Six Basal Cytotoxicity Assays, for Use in the Modelling ofthe In Vivo and In Vitro Data of the EU ACuteTox Projecta. ATLA 36, 503-519.
Kirkland D, Aardemab M, Mueller L, Hayashi M (2006): Evaluation of the abilityof a battery of three in vitro genotoxicity tests to discriminate rodent carcinogensand non-carcinogens II. Further analysis of mammalian cell results, relativepredictivity and tumour profiles. Mutation Research 608, 29-42.
Li et al.(2004). Association of late-onset Alzheimers disease with genetic variationin multiple members of the GAPD gene family. Proceedings of the NationalAcademy of Sciences, U.S.A. 101, 15688-15693.
Mercaldo, N.D., Lau, K.F. and Zhou, X.H. (2007). Confidence intervals forpredictive values with emphasis to case - control studies. Statistics in Medicine 26,2170-2183
Frank Schaarschmidt (Biostatistics, LUH) Diagnostic tests 2009 September 23 38 / 39

References III
R Development Core Team (2008). R: A language and environment for statisticalcomputing. R Foundation for Statistical Computing, Vienna, Austria. ISBN3-900051-07-0, URL http://www.R-project.org.
Steinberg, D.M., Fine, J. and Chappell, R. (2009). Sample size for positive andnegative predictive value in diagnostic research using case-control designs.Biostatistics 10, 94-105.
Frank Schaarschmidt (Biostatistics, LUH) Diagnostic tests 2009 September 23 39 / 39
Related Documents