ORIGINAL ARTICLE Experimental design and environmental parameters affect Rhodospirillum rubrum S1H response to space flight Felice Mastroleo 1,2 , Rob Van Houdt 1 , Baptiste Leroy 2 , M Abderrafi Benotmane 1 , Ann Janssen 1 , Max Mergeay 1 , Filip Vanhavere 3 , Larissa Hendrickx 1,{ , Ruddy Wattiez 2 and Natalie Leys 1 1 Expert group Molecular and Cellular Biology, Belgian Nuclear Research Center (SCK . CEN), Mol, Belgium; 2 Department of Proteomics and Protein Biochemistry, University of Mons, Mons, Belgium and 3 Expert group Radiation Protection, Dosimetry and Calibration, Belgian Nuclear Research Center (SCK . CEN), Mol, Belgium In view of long-haul space exploration missions, the European Space Agency initiated the Micro- Ecological Life Support System Alternative (MELiSSA) project targeting the total recycling of organic waste produced by the astronauts into oxygen, water and food using a loop of bacterial and higher plant bioreactors. In that purpose, the a-proteobacterium, Rhodospirillum rubrum S1H, was sent twice to the International Space Station and was analyzed post-flight using a newly developed R. rubrum whole genome oligonucleotide microarray and high throughput gel-free proteomics with Isotope-Coded Protein Label technology. Moreover, in an effort to identify a specific response of R. rubrum S1H to space flight, simulation of microgravity and space-ionizing radiation were performed on Earth under identical culture set-up and growth conditions as encountered during the actual space journeys. Transcriptomic and proteomic data were integrated and permitted to put forward the importance of medium composition and culture set-up on the response of the bacterium to space flight-related environmental conditions. In addition, we showed for the first time that a low dose of ionizing radiation (2 mGy) can induce a significant response at the transcriptomic level, although no change in cell viability and only a few significant differentially expressed proteins were observed. From the MELiSSA perspective, we could argue the effect of microgravity to be minimized, whereas R. rubrum S1H could be more sensitive to ionizing radiation during long-term space exploration mission. The ISME Journal (2009) 3, 1402–1419; doi:10.1038/ismej.2009.74; published online 2 July 2009 Subject Category: Integrated genomics and post-genomics approaches in microbial ecology Keywords: ionizing radiation; MELiSSA; random positioning machine; Rhodospirillum rubrum; space flight Introduction In view of long-haul manned space exploration missions, the cargo weight to be uploaded is of major concern. Taking into account the crew’s need for water and food and the corresponding wastes build- up during a several years trip, a biological recycling system seems to be essential (Farges et al., 2008). For that purpose, the European Space Agency started the Micro-Ecological Life Support System Alternative (MELiSSA) project 20 years ago (Mergeay et al., 1988). The MELiSSA concept is based on a lake ecosystem and consists of interconnected processes (that is, bioreactors, higher plant compartments, filtration units and so on) targeting the total recycling of the crew’s organic waste into oxygen, water and food (Hendrickx et al., 2006). Within the MELiSSA system, the purple non-sulfur a-proteobacterium, Rhodospirillum rubrum S1H, is used to convert volatile fatty acids released from the upstream raw waste-digesting reactor to carbon dioxide and bio- mass, and to complete the mineralization of amino acids into free ammonium that will be forwarded to the nitrifying compartment. The functional stability of the bioreactors in long-term use and under space flight conditions is of paramount importance for the efficiency of the life support system, and consequently, crew safety (Hendrickx et al., 2006; Hendrickx and Mergeay, 2007). The radiation on Earth comes from a combination of terrestrial (from the 40 K, 232 Th, 226 Ra, etc.) and cosmic Received 16 March 2009; revised 29 May 2009; accepted 30 May 2009; published online 2 July 2009 Correspondence: N Leys, Expert group Molecular and Cellular Biology, Belgian Nuclear Research Center (SCK . CEN), Boeretang 200, Mol 2400, Belgium. E-mail: [email protected] { Deceased. The ISME Journal (2009) 3, 1402–1419 & 2009 International Society for Microbial Ecology All rights reserved 1751-7362/09 $32.00 www.nature.com/ismej

Welcome message from author
This document is posted to help you gain knowledge. Please leave a comment to let me know what you think about it! Share it to your friends and learn new things together.
Transcript
ORIGINAL ARTICLE
Experimental design and environmentalparameters affect Rhodospirillum rubrumS1H response to space flight
Felice Mastroleo1,2, Rob Van Houdt1, Baptiste Leroy2, M Abderrafi Benotmane1,Ann Janssen1, Max Mergeay1, Filip Vanhavere3, Larissa Hendrickx1,{, Ruddy Wattiez2
and Natalie Leys1
1Expert group Molecular and Cellular Biology, Belgian Nuclear Research Center (SCK.CEN), Mol, Belgium;2Department of Proteomics and Protein Biochemistry, University of Mons, Mons, Belgium and 3Expert groupRadiation Protection, Dosimetry and Calibration, Belgian Nuclear Research Center (SCK.CEN), Mol, Belgium
In view of long-haul space exploration missions, the European Space Agency initiated the Micro-Ecological Life Support System Alternative (MELiSSA) project targeting the total recycling oforganic waste produced by the astronauts into oxygen, water and food using a loop of bacterial andhigher plant bioreactors. In that purpose, the a-proteobacterium, Rhodospirillum rubrum S1H, wassent twice to the International Space Station and was analyzed post-flight using a newly developedR. rubrum whole genome oligonucleotide microarray and high throughput gel-free proteomics withIsotope-Coded Protein Label technology. Moreover, in an effort to identify a specific response ofR. rubrum S1H to space flight, simulation of microgravity and space-ionizing radiation wereperformed on Earth under identical culture set-up and growth conditions as encountered during theactual space journeys. Transcriptomic and proteomic data were integrated and permitted to putforward the importance of medium composition and culture set-up on the response of the bacteriumto space flight-related environmental conditions. In addition, we showed for the first time that a lowdose of ionizing radiation (2 mGy) can induce a significant response at the transcriptomic level,although no change in cell viability and only a few significant differentially expressed proteins wereobserved. From the MELiSSA perspective, we could argue the effect of microgravity to beminimized, whereas R. rubrum S1H could be more sensitive to ionizing radiation during long-termspace exploration mission.The ISME Journal (2009) 3, 1402–1419; doi:10.1038/ismej.2009.74; published online 2 July 2009Subject Category: Integrated genomics and post-genomics approaches in microbial ecologyKeywords: ionizing radiation; MELiSSA; random positioning machine; Rhodospirillum rubrum;space flight
Introduction
In view of long-haul manned space explorationmissions, the cargo weight to be uploaded is of majorconcern. Taking into account the crew’s need forwater and food and the corresponding wastes build-up during a several years trip, a biological recyclingsystem seems to be essential (Farges et al., 2008). Forthat purpose, the European Space Agency started theMicro-Ecological Life Support System Alternative(MELiSSA) project 20 years ago (Mergeay et al.,1988). The MELiSSA concept is based on a lake
ecosystem and consists of interconnected processes(that is, bioreactors, higher plant compartments,filtration units and so on) targeting the total recyclingof the crew’s organic waste into oxygen, water andfood (Hendrickx et al., 2006). Within the MELiSSAsystem, the purple non-sulfur a-proteobacterium,Rhodospirillum rubrum S1H, is used to convertvolatile fatty acids released from the upstream rawwaste-digesting reactor to carbon dioxide and bio-mass, and to complete the mineralization of aminoacids into free ammonium that will be forwarded tothe nitrifying compartment. The functional stabilityof the bioreactors in long-term use and underspace flight conditions is of paramount importancefor the efficiency of the life support system, andconsequently, crew safety (Hendrickx et al., 2006;Hendrickx and Mergeay, 2007).
The radiation on Earth comes from a combination ofterrestrial (from the 40K, 232Th, 226Ra, etc.) and cosmic
Received 16 March 2009; revised 29 May 2009; accepted 30 May2009; published online 2 July 2009
Correspondence: N Leys, Expert group Molecular and CellularBiology, Belgian Nuclear Research Center (SCK.CEN), Boeretang200, Mol 2400, Belgium.E-mail: [email protected]{Deceased.
The ISME Journal (2009) 3, 1402–1419& 2009 International Society for Microbial Ecology All rights reserved 1751-7362/09 $32.00
www.nature.com/ismej
radiation (photons, electrons and so on) and is fairlyconstant over the world, in order of 2–4mGy day�1
(Idaho State University, 2008). Monitoring radiationon board the International Space Station (ISS) in lowEarth orbit (ca. 400 km altitude) indicated an averagedose of ca. 180mGy day�1 (Goossens et al., 2006;Vanhavere et al., 2008). Thus, on board the ISS,organisms undergo radiation stress up to 80-foldhigher than the background radiation levels on theEarth. In addition, gravity in low Earth orbit rangesbetween 10�6 and 10�3 g compared with 1 g on Earth(Nicholson et al., 2000). As environmental changesinduce and select for physiological, metabolic and/orgenetic variations in microorganisms (Foster, 2007), itis envisioned that such adaptations will also likelyoccur under space flight conditions. Indeed, numer-ous in-flight studies have confirmed that space flightcan have a pronounced effect on a variety of microbialparameters including changes in microbial prolifera-tion rate, cell morphology, cell physiology, cellmetabolism, genetic transfer among cells and viralreactivation within the cells (reviewed in Leys et al.,2004; Nickerson et al., 2004; Nicholson et al., 2005;Klaus and Howard, 2006). However, previous studieshave also shown that the results from space flight andspace flight analog experiments can radically differwhen using different bacteria or when using the samebacterium but different culture media (Baker and Leff,2004, 2006; Benoit and Klaus, 2007; Wilson et al.,2008; Leys et al., in press).
In this study, R. rubrum S1H, inoculated on richand minimal agar media, was sent for ca. 10 days tothe ISS, respectively, in October 2003 (MESSAGE-part 2 experiment) and September 2006 (BASE-partA experiment). After flight, R. rubrum S1H cultureswere subjected to both transcriptomic and proteo-mic analysis, respectively, by whole-genome oligo-nucleotide microarrays and high throughputproteomics to analyze the response of S1H to spaceflight. Moreover, ground simulation of space-ioniz-ing radiation and microgravity were performed toidentify radiation and gravity effects.
Materials and methods
Strain and mediaR. rubrum strain S1H was obtained from theAmerican Type Culture Collection (ATCC25903).Sistrom medium A containing 2 g l�1 Na-succinate(Sistrom, 1960) or Sistrom-peptone-yeast medium(Saegesser et al., 1992) containing 30 g l�1 peptoneand 10 g l�1 yeast extract (BD Franklin Lakes, NJ,USA), supplemented with 20 g l�1 agar for solidcultures, were used. For the MESSAGE 2-relatedexperiments Sistrom-peptone-yeast was used,whereas Sistrom-succinate was used for the BASE-A-related experiments. The 869 medium (Mergeayet al., 1985) supplemented with 2 mM H6TeO6
(Sigma-Aldrich, Bornem, Belgium) was used forpost-flight analysis of tellurate resistance.
Space flight experiment set-upThe MESSAGE 2 experiment. Three independentcultures of R. rubrum S1H grown to stationary phasein Sistrom medium A in dark aerobic conditions weresuspended in 0.85% NaCl (Saline tablets, Oxoid,Hampshire, United Kingdom) to a final OD680 of ca.0.600 and transported at room temperature from thelaboratory in SCK.CEN (Mol, Belgium) to the cosmo-drome in Baikonour (Kazakhstan) 8 days beforelaunch. Inoculation was performed 15 h before launchon Sistrom-peptone-yeast Petri dishes (Surfair Plate,PBI International, Milano, Italy). Drops of 10mlcontaining 3� 107 colony forming units of R. rubrumS1H, as well as dilution series (3� 103 and 3� 102
colony forming units) for viable count purpose, werespotted in biological triplicates spread over two agarplates (Supplementary Figure 1A). After inoculation,Petri plates were sealed first with Parafilm (PechineyPlastic Packaging, Chicago, IL, USA) and Kapton tape(3M, Cergy-Pontoise, France), next, individuallypacked in Ziplock bags, and then jointly packed in asecond Ziplock bag and placed in a sealed jar.Radiation dosimeters (Track-Etch Detectors, OpticallyStimulated Luminescence Detectors and ThermoLu-minescent Detectors, described in Goossens et al.,2006) and temperature sensors (CUBE, MeilhausElectronic, Puchheim, Germany) were added in thejar. This jar was then wrapped in protective foam andNOMEX fabric bags (DuPont, Richmond, VA, USA)and stored at room temperature (SupplementaryFigure 1). Finally, the exterior of the package wasdisinfected with 3% hydrogen peroxide wipes ac-cording to Russian flight procedures and was placedinto the Soyuz (TMA-3) 8 h before launch. On arrivalin the ISS (after 2 days at ambiant temperature in theSoyuz), the containers were incubated for 8 days inthe Russian Service Module of the ISS behindstructural bars (Supplementary Figure 1E) at a relativeconstant temperature of 21±2 1C. After a total of 10days flight, including ca. 2 days in the Soyuz and ca.8 days in the ISS (18–28 October 2003), the samplesreturned to the Earth (Soyuz TMA-2). After landing inthe Kazakhstan desert (near Arkalyk), the jar contain-ing the cultures in Petri dishes was transportedwithin 40 h at 4 1C without exposure to airport X-raysscanning, to SCK.CEN (Mol, Belgium). In contrast,the parallel-prepared ground control samples re-turned immediately after preparation in Kazakhstanto SCK.CEN and were cultured in dark conditionsunder comparable temperature and time profile as theISS samples. From both ground control and ISS-exposed samples, colonies were harvested for bothtranscriptomic and proteomic analysis.
The BASE-A experiment. Cultures of R. rubrumS1H grown as mentioned above were transported atroom temperature from SCK.CEN (Mol, Belgium) toBaikonour (Kazakhstan) 10 days before launch. Threebiologically independent culture suspensions weredeposited 24 h before launch as 4 spots of 10ml forlife count, as mentioned above, and as 1 mat of 150ml
R. rubrum S1H response to space flightF Mastroleo et al
1403
The ISME Journal
corresponding to 3� 107 cells per ca. 10 cm2 surfaceof a 5 ml layer Sistrom-succinate agar medium in six-well culture plates (CellStar 6, Greiner Bio-One,Frickenhausen, Germany) (Supplementary Figure1F) and kept at ambient temperature. An oxygenindicator strip (Anaerotest, Merck, Darmstadt, Ger-many) was added at the bottom of the multiwell platein between the wells, to visualize oxygen concentra-tion in the gas phase in the multiwell plate duringincubation pre-, in- and post-flight. Culture plateswere sealed with one layer of Parafilm and one layerof Scotch tape (3M, Cergy-Pontoise, France). Radia-tion dosimeters (Track-Etch Detectors and OpticallyStimulated Luminescence Detectors described inVanhavere et al., 2008) and temperature sensors(SmartButton, ACR Systems, Surrey, BC, Canada)were added in the container. Two culture plateswere sealed hermetically in one polycarbonate‘Biocontainer’ (PedeoTechniek, Oudenaarde, Belgium)(described in Vanhavere et al., 2008) and vacuumsealed in a highly transparent Minigrip polyethy-lene bag (Minigrip, Brussels, Belgium) of 60-mmthickness. During the 2-day trip in the Soyuz (TMA-9) to the ISS, the temperature of the pouch wasmaintained at 22±1 1C. After docking, all sampleswere stored at ambient temperature in the ISSRussian Zvezda service module (the exact locationin the module is unknown) and a temperature of21±1 1C was recorded. The samples returned to theEarth after a total of 12 days in-flight including ca. 2days in the Soyuz and ca. 10 days in the ISS (17–28September 2006). Samples were handled as men-tioned for the MESSAGE 2 experiment, and 24 hafter landing of the Soyuz (TMA-8) the analysis wasstarted at SCK.CEN. The parallel ground controlexperiment was maintained at 22±1 1C duringtransport from Baikonur to Belgium in transportationbox, followed by an incubation at 22±1 1C, andsimultaneously cooled down to 4 1C after landing ofthe space samples. From both ground control and ISSexposed samples, colonies and cell mats wereharvested for transcriptomic and proteomic analysis.
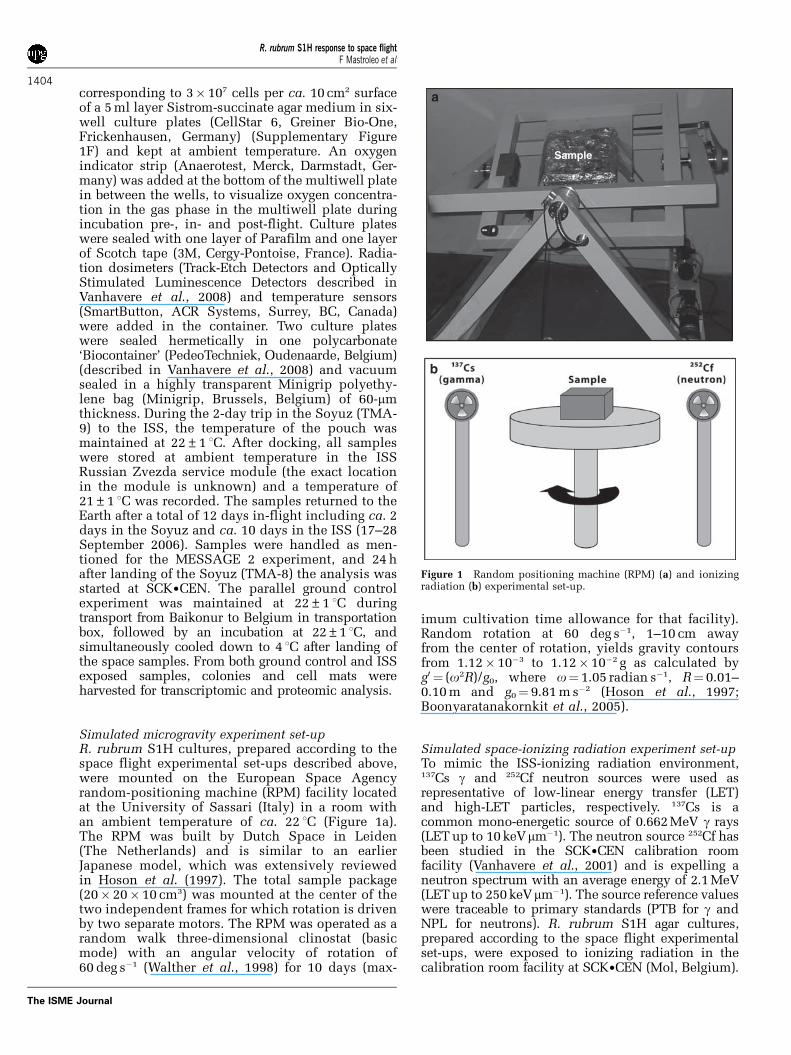
Simulated microgravity experiment set-upR. rubrum S1H cultures, prepared according to thespace flight experimental set-ups described above,were mounted on the European Space Agencyrandom-positioning machine (RPM) facility locatedat the University of Sassari (Italy) in a room withan ambient temperature of ca. 22 1C (Figure 1a).The RPM was built by Dutch Space in Leiden(The Netherlands) and is similar to an earlierJapanese model, which was extensively reviewedin Hoson et al. (1997). The total sample package(20� 20� 10 cm3) was mounted at the center of thetwo independent frames for which rotation is drivenby two separate motors. The RPM was operated as arandom walk three-dimensional clinostat (basicmode) with an angular velocity of rotation of60 deg s�1 (Walther et al., 1998) for 10 days (max-
imum cultivation time allowance for that facility).Random rotation at 60 deg s�1, 1–10 cm awayfrom the center of rotation, yields gravity contoursfrom 1.12� 10�3 to 1.12� 10�2 g as calculated byg0 ¼ (o2R)/g0, where o¼ 1.05 radian s�1, R¼ 0.01–0.10 m and g0¼ 9.81 m s�2 (Hoson et al., 1997;Boonyaratanakornkit et al., 2005).
Simulated space-ionizing radiation experiment set-upTo mimic the ISS-ionizing radiation environment,137Cs g and 252Cf neutron sources were used asrepresentative of low-linear energy transfer (LET)and high-LET particles, respectively. 137Cs is acommon mono-energetic source of 0.662 MeV g rays(LET up to 10 keVmm�1). The neutron source 252Cf hasbeen studied in the SCK.CEN calibration roomfacility (Vanhavere et al., 2001) and is expelling aneutron spectrum with an average energy of 2.1 MeV(LET up to 250 keVmm�1). The source reference valueswere traceable to primary standards (PTB for g andNPL for neutrons). R. rubrum S1H agar cultures,prepared according to the space flight experimentalset-ups, were exposed to ionizing radiation in thecalibration room facility at SCK.CEN (Mol, Belgium).
Sample
Figure 1 Random positioning machine (RPM) (a) and ionizingradiation (b) experimental set-up.
R. rubrum S1H response to space flightF Mastroleo et al
1404
The ISME Journal
During irradiation, samples were kept rotating at2 r.p.m. in between the two sources for 10 days(maximum irradiation time allowance for thefacility) at 21±2 1C (Figure 1b), being exposed toca. 0.16 mGy day�1 of g rays and 0.02 mGy day�1 ofneutron rays, totaling ca. 1.8 mGy per 10 days, whichis comparable with the actual space flights experi-ments (Goossens et al., 2006; Vanhavere et al. 2008).The total cumulative absorbed dose was measured insitu by using ThermoLuminescent Detectors (LiF:Mg,Ti ‘TLD-100’ from Harshaw Bicron, Solon, OH, USAand LiF:Mg,Cu,P ‘MCP-N’ from TLD-Poland, Krakow,Poland) and Optically Stimulated LuminescenceDetectors (Al2O3:C ‘TLD-500’ from Harshaw Bicron)for g dosimetry and bubble detectors (BD-PND/BDTfrom Bubble Technology Industry, Chalk River, ON,Canada) for neutron dosimetry. Non-irradiated controlsamples were kept outside the irradiation bunker atthe same temperature for the same period of time.
Transcriptomic analysisMicroarray platform. The R. rubrum S1 genomecomprising a chromosome (4.35 Mb; GenBank ID:CP000230) and a plasmid (53.7 kb; GenBank ID:CP000231) was used to design 60-mer aminosilane-modified oligonucleotide probes corresponding tothe 3829 candidate protein-encoding genes. Theoligonucleotides were spotted in triplicate ontoglass slides by Eurogentec SA (Liege, Belgium), thusproviding three technical replicates for each sample.The full description of the array analysis platformhas been deposited at the Gene Expression Omnibuswebsite (http://www.ncbi.nlm.nih.gov/geo/) underaccession number GPL7256. The full experimentaldetails on the RNA extraction, labeling, hybridiza-tion and microarray analysis can be found inSupplementary Data. All microarray data have beendeposited at the Gene Expression Omnibus underaccession number GSE14265.
Data analysis. Only genes with a P-value below0.05 and showing a fold change below 0.5 or above2.0 were kept for data interpretation. Genes ofinterest were explored and some were re-annotatedusing the Magnifying Genomes (MaGe) platform(Genoscope, Evry, France), a microbial genomeannotation system (Vallenet et al., 2006). The parentstrain Rhodospirillum rubrum S1 is part of the MaGe‘MagnetoScope’ project available at https://www.genoscope.cns.fr/agc/mage/wwwpkgdb/MageHome/index.php?webpage¼mage.
Proteomic analysisProtein extraction and quantification. Bacterialcells were collected by centrifugation at 7000 r.p.m.for 10 min. Protein samples were obtained by high-power sonication (U50 control, IKA Labortechnik,Staufen, Germany) of the bacterial pellet suspendedin 6 M (v/v) guanidine chloride. Sonication wasrealized by three cycles of 10 s (40% amplitude,
cycle 1) followed by 1 min cooling on ice. Sampleswere cleared by centrifugation at 13 500 r.p.m. for15 min at 4 1C. Protein concentration of the super-natants was measured by the Bradford method(Bradford, 1976), according to the Bio-Rad ProteinAssay kit (Bio-Rad, Hercules, CA, USA), with bovineg-globulin as a protein standard. Protein concentra-tion of each sample was adjusted to 5mgml�1 andequal amounts of the three biological replicates werepooled before labeling.
Isotope-coded protein labeling. Isotope-coded pro-tein labeling (ICPL) was performed using the ICPL-kit(SERVA Electrophoresis, Heildberg, Germany) asdescribed previously (Schmidt et al., 2005). Briefly,two protein mixtures of 100mg each, obtained fromtwo different culture conditions, were first individu-ally reduced and alkylated to denature proteins and toensure easier access to the free amino acid groups thatare subsequently derivatized with the 12C (light) or 13C(heavy) form of the ICPL reagent (N-nicotinoyloxy-succinimide). The heavy (H) form of the IPCL reagentwas used to label the experimental sample, whereasthe light (L) form was used to label the control sample.Labeled samples were then combined in a H/L ratio of1:1. After subsequent overnight digestions by trypsin(protein/enzyme ratio of 1/50 and incubation at 37 1C)and by endoproteinase Glu-C (protein/enzyme ratio of1/30 and incubation at 25 1C), peptides were desaltedusing HyperSep SpinTip C18 (Thermo Electron,Columbia, MD, USA) and analyzed by MudPIT(Multi-Dimensional Protein Identification Technol-ogy). Each ICPL sample was run twice to increasethe peptides detection number and the proteinidentification and quantification accuracy. As differ-entially labeled protein samples derived from iden-tical peptides differ in mass, they appeared asdoublets in the acquired mass spectra. From the ratioof the ion intensity of these sister peptide pairs, therelative abundance of their parent protein in theoriginal samples was determined. H/L ratios greaterthan 1 and lower than 1 indicate, respectively, theoverexpression and downexpression of the protein ofinterest in the experimental sample. Experimentaldetails on the MudPIT approach including thechromatographic separation and the mass spectro-metry analysis can be found in Supplementary data.
Data extraction and database search. Dataacquired from both runs were combined in a singlefile using AnalysisCombiner (Bruker Daltonics,Bremen, Germany) and using DataAnalysis 3.4(Bruker Daltonics) a peak list in Mascot GenericFile format was generated. The peak list wassearched against a local copy of the NCBInr databasereleased in June 2008 (taxonomy¼Rhodospirillumrubrum S1) using an in-house Mascot 2.2 server(Matrix Science, Boston, MA, USA) for proteinidentification (Po0.05). Protein identification wasachieved using the Mascot search engine includingthe following parameters: database¼NCBInr,
R. rubrum S1H response to space flightF Mastroleo et al
1405
The ISME Journal
organism¼Rhodospirillum rubrum S1, fixed mod-ification¼ carbamidomethyl cystein, variable mod-ification¼ oxidation of methionine, ICPL light andheavy (on lysine-K- and N-terminal), mass tolerancein MS¼ 1.3 Da and mass tolerance in MS/MS¼ 0.5 Da. Correct mixing of the experimental(H-labeled) and the control (L-labeled) samples waschecked by plotting the protein fold change (that is,H/L ratio) distribution. Accepted value for themedian value of the H/L ratio distribution was1.0±0.1 (Supplementary Figure 2). The false dis-covery rate (FDR) was estimated using the Mascot‘decoy’ option. If TP was true-positive matches andFP was false-positive matches, the number ofmatches in the target database was TPþFP and thenumber of matches in the decoy database was FP.The quantity that was reported was the FDR¼FP/(FPþTP) (Elias et al., 2005). Only proteins identi-fied with a Mascot score above 50 and quantified byat least two different peptides or by the samepeptide detected at different times during theanalysis were considered. The Mascot score is givenas S¼�10� log10(P), where P is the probability thatthe observed match is a random event. Proteinquantification was completed using WARP-LC (Bru-ker Daltonics) that detects isotopic pairs resultingfrom differentially labeled proteins and calculatesintensity ratio of each peptide pair based on peakintensity. Proteins quantified with a mean calcu-lated peptide ratio showing a standard deviationhigher than 20% were manually checked. Proteinswere considered as significant when fold changewas higher than 1.5 or lower than 0.7.
Results
MESSAGE 2 and related experiments:sistrom-peptone-yeast mediumTranscriptomic analysis. For the MESSAGE 2space flight experiment, the ground control andground-based simulations of microgravity and ioniz-ing radiation, the same hardware configurationswere used consisting of 10-day incubation time onrich medium in Petri dishes under dark aerobicconditions. Using the whole-genome DNA chip,4.94% and 0.78% of the genes (out of 3826 genesretained) were identified as, respectively, signifi-cantly up- and downregulated after space flightcompared with the ground control. Concerningthe modeled microgravity experiment, 3.88% and0.26% of the genes (out of the 3814 genes retained)were identified as, respectively, significantlyup- and downregulated when cultured on the RPMcompared with culturing in normal gravity. Finally,for the ionizing radiation simulation, 0.13% and0.10% of the genes (out of 3794 genes retained) wereidentified, respectively, as significantly up- and down-regulated compared with non-irradiated samples.
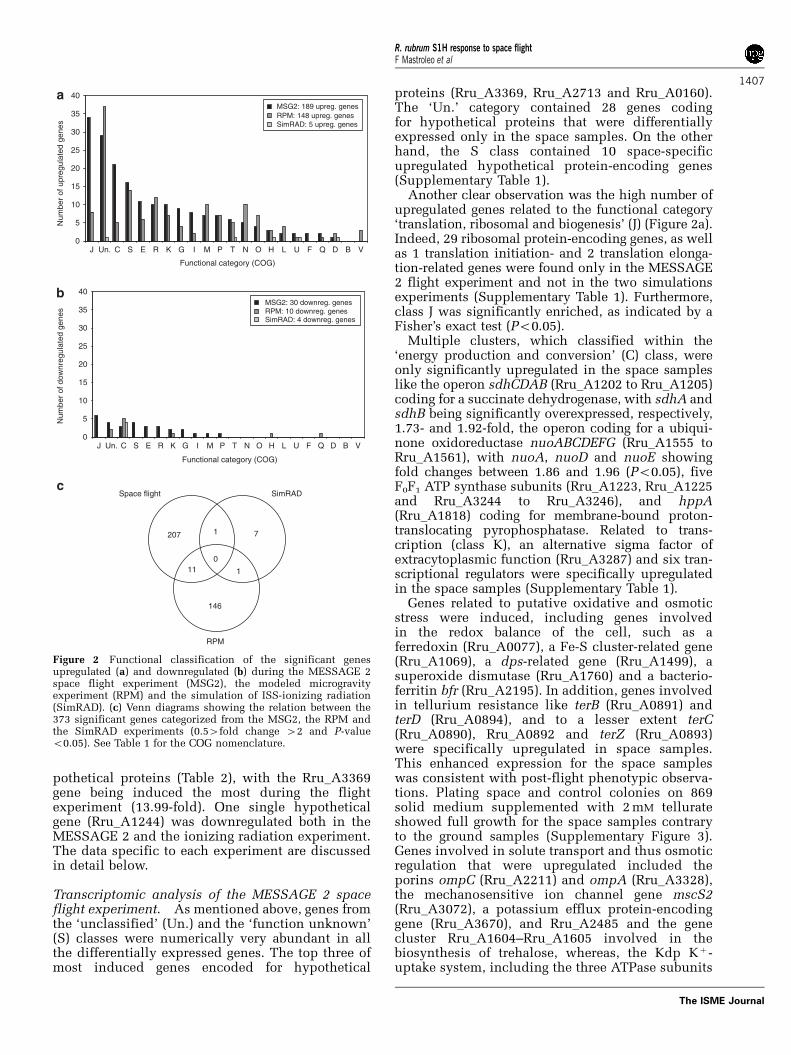
When sorting the differentially expressed genesaccording to their COG functional category(Table 1 and http://www.ncbi.nlm.nih.gov/COG/),
the ‘unclassified’ (Un.) class was the most numeri-cally abundant in the ionizing radiation and RPMexperiments, and the second most in the MESSAGE2 experiment (Figure 2). Moreover, of the 373significant genes found in at least one of the tests,30% coded for hypothetical proteins (Supplemen-tary Table 1).
No genes met the threshold criteria for differentialexpression in all three culture conditions tested,that is, space flight, RPM and ionizing radiationexperiments (Figure 2c). However, one hypotheticalgene (Rru_A0197) was downregulated in the irradia-tion and the RPM experiment and showed a 0.59-fold change (Po0.001) in the MESSAGE 2 experi-ment. Moreover, Rru_A0196 and Rru_A0198, bothencoding for hypothetical proteins, were signifi-cantly downregulated (0.51-fold change) in theirradiation experiment and were slightly, but sig-nificantly, downregulated in the RPM (onlyRru_A0196) and MESSAGE 2 (both Rru_A0196 andRru_A0198) experiments. For the 11 significantgenes that were jointly induced in the MESSAGE 2flight and RPM experiments, four coded for hy-
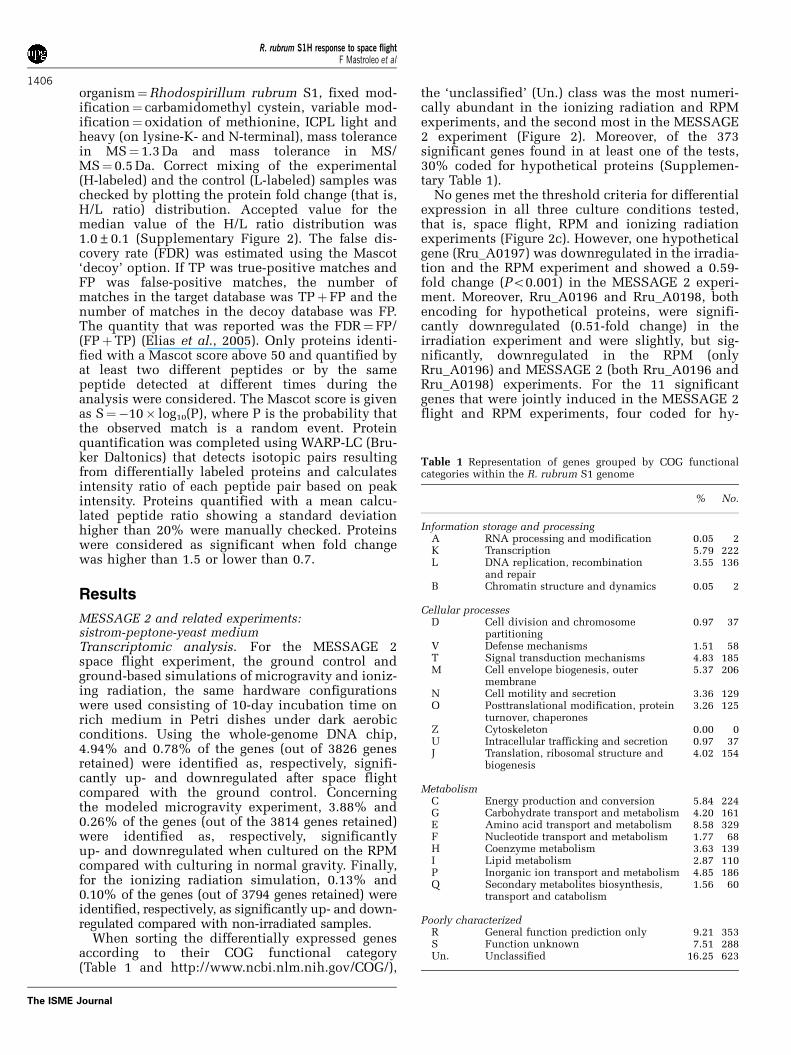
Table 1 Representation of genes grouped by COG functionalcategories within the R. rubrum S1 genome
% No.
Information storage and processingA RNA processing and modification 0.05 2K Transcription 5.79 222L DNA replication, recombination
and repair3.55 136
B Chromatin structure and dynamics 0.05 2
Cellular processesD Cell division and chromosome
partitioning0.97 37
V Defense mechanisms 1.51 58T Signal transduction mechanisms 4.83 185M Cell envelope biogenesis, outer
membrane5.37 206
N Cell motility and secretion 3.36 129O Posttranslational modification, protein
turnover, chaperones3.26 125
Z Cytoskeleton 0.00 0U Intracellular trafficking and secretion 0.97 37J Translation, ribosomal structure and
biogenesis4.02 154
MetabolismC Energy production and conversion 5.84 224G Carbohydrate transport and metabolism 4.20 161E Amino acid transport and metabolism 8.58 329F Nucleotide transport and metabolism 1.77 68H Coenzyme metabolism 3.63 139I Lipid metabolism 2.87 110P Inorganic ion transport and metabolism 4.85 186Q Secondary metabolites biosynthesis,
transport and catabolism1.56 60
Poorly characterizedR General function prediction only 9.21 353S Function unknown 7.51 288Un. Unclassified 16.25 623
R. rubrum S1H response to space flightF Mastroleo et al
1406
The ISME Journal
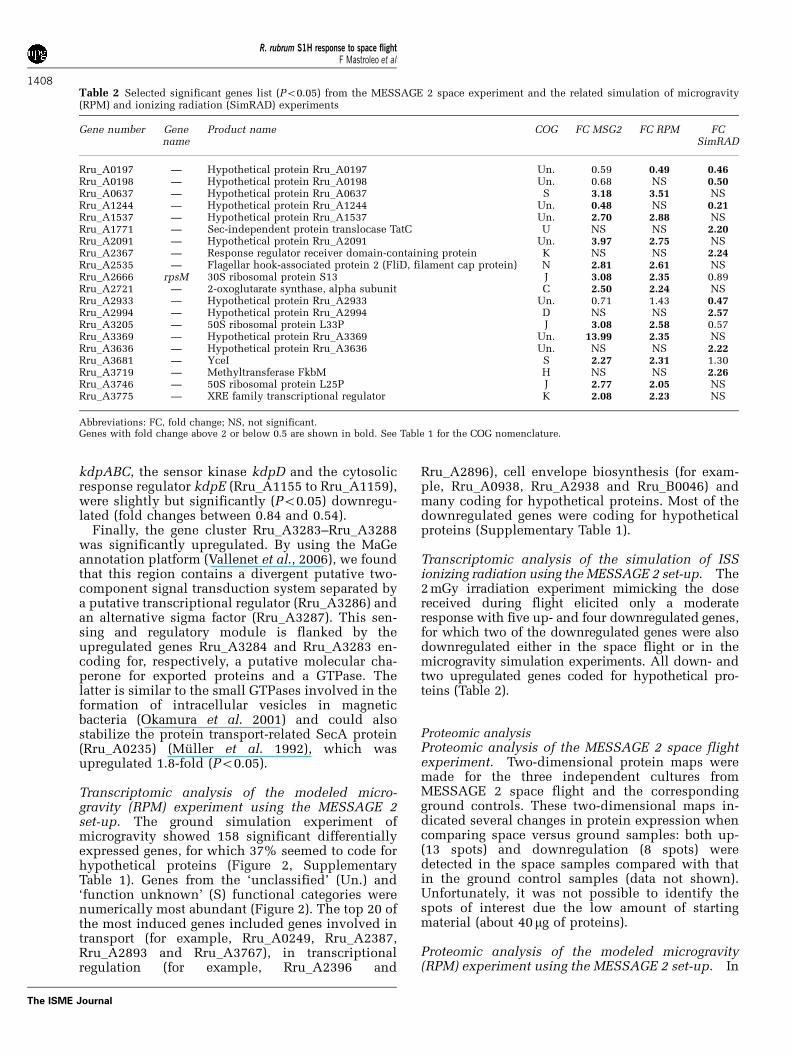
pothetical proteins (Table 2), with the Rru_A3369gene being induced the most during the flightexperiment (13.99-fold). One single hypotheticalgene (Rru_A1244) was downregulated both in theMESSAGE 2 and the ionizing radiation experiment.The data specific to each experiment are discussedin detail below.
Transcriptomic analysis of the MESSAGE 2 spaceflight experiment. As mentioned above, genes fromthe ‘unclassified’ (Un.) and the ‘function unknown’(S) classes were numerically very abundant in allthe differentially expressed genes. The top three ofmost induced genes encoded for hypothetical
proteins (Rru_A3369, Rru_A2713 and Rru_A0160).The ‘Un.’ category contained 28 genes codingfor hypothetical proteins that were differentiallyexpressed only in the space samples. On the otherhand, the S class contained 10 space-specificupregulated hypothetical protein-encoding genes(Supplementary Table 1).
Another clear observation was the high number ofupregulated genes related to the functional category‘translation, ribosomal and biogenesis’ (J) (Figure 2a).Indeed, 29 ribosomal protein-encoding genes, as wellas 1 translation initiation- and 2 translation elonga-tion-related genes were found only in the MESSAGE2 flight experiment and not in the two simulationsexperiments (Supplementary Table 1). Furthermore,class J was significantly enriched, as indicated by aFisher’s exact test (Po0.05).
Multiple clusters, which classified within the‘energy production and conversion’ (C) class, wereonly significantly upregulated in the space sampleslike the operon sdhCDAB (Rru_A1202 to Rru_A1205)coding for a succinate dehydrogenase, with sdhA andsdhB being significantly overexpressed, respectively,1.73- and 1.92-fold, the operon coding for a ubiqui-none oxidoreductase nuoABCDEFG (Rru_A1555 toRru_A1561), with nuoA, nuoD and nuoE showingfold changes between 1.86 and 1.96 (Po0.05), fiveF0F1 ATP synthase subunits (Rru_A1223, Rru_A1225and Rru_A3244 to Rru_A3246), and hppA(Rru_A1818) coding for membrane-bound proton-translocating pyrophosphatase. Related to trans-cription (class K), an alternative sigma factor ofextracytoplasmic function (Rru_A3287) and six tran-scriptional regulators were specifically upregulatedin the space samples (Supplementary Table 1).
Genes related to putative oxidative and osmoticstress were induced, including genes involvedin the redox balance of the cell, such as aferredoxin (Rru_A0077), a Fe-S cluster-related gene(Rru_A1069), a dps-related gene (Rru_A1499), asuperoxide dismutase (Rru_A1760) and a bacterio-ferritin bfr (Rru_A2195). In addition, genes involvedin tellurium resistance like terB (Rru_A0891) andterD (Rru_A0894), and to a lesser extent terC(Rru_A0890), Rru_A0892 and terZ (Rru_A0893)were specifically upregulated in space samples.This enhanced expression for the space sampleswas consistent with post-flight phenotypic observa-tions. Plating space and control colonies on 869solid medium supplemented with 2 mM tellurateshowed full growth for the space samples contraryto the ground samples (Supplementary Figure 3).Genes involved in solute transport and thus osmoticregulation that were upregulated included theporins ompC (Rru_A2211) and ompA (Rru_A3328),the mechanosensitive ion channel gene mscS2(Rru_A3072), a potassium efflux protein-encodinggene (Rru_A3670), and Rru_A2485 and the genecluster Rru_A1604–Rru_A1605 involved in thebiosynthesis of trehalose, whereas, the Kdp Kþ -uptake system, including the three ATPase subunits
0
5
10
15
20
25
30
35
40
J
Functional category (COG)
Num
ber
of u
preg
ulat
ed g
enes
_
MSG2: 189 upreg. genesRPM: 148 upreg. genesSimRAD: 5 upreg. genes
0
5
10
15
20
25
30
35
40
Functional category (COG)
Num
ber
of d
ownr
egul
ated
gen
es
MSG2: 30 downreg. genesRPM: 10 downreg. genesSimRAD: 4 downreg. genes
Space flight SimRAD
RPM
207 1 7
1
011
146
a
b
c
VBDQFULHONTPMIGKRESCUn.
J VBDQFULHONTPMIGKRESCUn.
Figure 2 Functional classification of the significant genesupregulated (a) and downregulated (b) during the MESSAGE 2space flight experiment (MSG2), the modeled microgravityexperiment (RPM) and the simulation of ISS-ionizing radiation(SimRAD). (c) Venn diagrams showing the relation between the373 significant genes categorized from the MSG2, the RPM andthe SimRAD experiments (0.54fold change 42 and P-valueo0.05). See Table 1 for the COG nomenclature.
R. rubrum S1H response to space flightF Mastroleo et al
1407
The ISME Journal
kdpABC, the sensor kinase kdpD and the cytosolicresponse regulator kdpE (Rru_A1155 to Rru_A1159),were slightly but significantly (Po0.05) downregu-lated (fold changes between 0.84 and 0.54).
Finally, the gene cluster Rru_A3283–Rru_A3288was significantly upregulated. By using the MaGeannotation platform (Vallenet et al., 2006), we foundthat this region contains a divergent putative two-component signal transduction system separated bya putative transcriptional regulator (Rru_A3286) andan alternative sigma factor (Rru_A3287). This sen-sing and regulatory module is flanked by theupregulated genes Rru_A3284 and Rru_A3283 en-coding for, respectively, a putative molecular cha-perone for exported proteins and a GTPase. Thelatter is similar to the small GTPases involved in theformation of intracellular vesicles in magneticbacteria (Okamura et al. 2001) and could alsostabilize the protein transport-related SecA protein(Rru_A0235) (Muller et al. 1992), which wasupregulated 1.8-fold (Po0.05).
Transcriptomic analysis of the modeled micro-gravity (RPM) experiment using the MESSAGE 2set-up. The ground simulation experiment ofmicrogravity showed 158 significant differentiallyexpressed genes, for which 37% seemed to code forhypothetical proteins (Figure 2, SupplementaryTable 1). Genes from the ‘unclassified’ (Un.) and‘function unknown’ (S) functional categories werenumerically most abundant (Figure 2). The top 20 ofthe most induced genes included genes involved intransport (for example, Rru_A0249, Rru_A2387,Rru_A2893 and Rru_A3767), in transcriptionalregulation (for example, Rru_A2396 and
Rru_A2896), cell envelope biosynthesis (for exam-ple, Rru_A0938, Rru_A2938 and Rru_B0046) andmany coding for hypothetical proteins. Most of thedownregulated genes were coding for hypotheticalproteins (Supplementary Table 1).
Transcriptomic analysis of the simulation of ISSionizing radiation using the MESSAGE 2 set-up. The2 mGy irradiation experiment mimicking the dosereceived during flight elicited only a moderateresponse with five up- and four downregulated genes,for which two of the downregulated genes were alsodownregulated either in the space flight or in themicrogravity simulation experiments. All down- andtwo upregulated genes coded for hypothetical pro-teins (Table 2).
Proteomic analysisProteomic analysis of the MESSAGE 2 space flightexperiment. Two-dimensional protein maps weremade for the three independent cultures fromMESSAGE 2 space flight and the correspondingground controls. These two-dimensional maps in-dicated several changes in protein expression whencomparing space versus ground samples: both up-(13 spots) and downregulation (8 spots) weredetected in the space samples compared with thatin the ground control samples (data not shown).Unfortunately, it was not possible to identify thespots of interest due the low amount of startingmaterial (about 40mg of proteins).
Proteomic analysis of the modeled microgravity(RPM) experiment using the MESSAGE 2 set-up. In
Table 2 Selected significant genes list (Po0.05) from the MESSAGE 2 space experiment and the related simulation of microgravity(RPM) and ionizing radiation (SimRAD) experiments
Gene number Genename
Product name COG FC MSG2 FC RPM FCSimRAD
Rru_A0197 — Hypothetical protein Rru_A0197 Un. 0.59 0.49 0.46Rru_A0198 — Hypothetical protein Rru_A0198 Un. 0.68 NS 0.50Rru_A0637 — Hypothetical protein Rru_A0637 S 3.18 3.51 NSRru_A1244 — Hypothetical protein Rru_A1244 Un. 0.48 NS 0.21Rru_A1537 — Hypothetical protein Rru_A1537 Un. 2.70 2.88 NSRru_A1771 — Sec-independent protein translocase TatC U NS NS 2.20Rru_A2091 — Hypothetical protein Rru_A2091 Un. 3.97 2.75 NSRru_A2367 — Response regulator receiver domain-containing protein K NS NS 2.24Rru_A2535 — Flagellar hook-associated protein 2 (FliD, filament cap protein) N 2.81 2.61 NSRru_A2666 rpsM 30S ribosomal protein S13 J 3.08 2.35 0.89Rru_A2721 — 2-oxoglutarate synthase, alpha subunit C 2.50 2.24 NSRru_A2933 — Hypothetical protein Rru_A2933 Un. 0.71 1.43 0.47Rru_A2994 — Hypothetical protein Rru_A2994 D NS NS 2.57Rru_A3205 — 50S ribosomal protein L33P J 3.08 2.58 0.57Rru_A3369 — Hypothetical protein Rru_A3369 Un. 13.99 2.35 NSRru_A3636 — Hypothetical protein Rru_A3636 Un. NS NS 2.22Rru_A3681 — YceI S 2.27 2.31 1.30Rru_A3719 — Methyltransferase FkbM H NS NS 2.26Rru_A3746 — 50S ribosomal protein L25P J 2.77 2.05 NSRru_A3775 — XRE family transcriptional regulator K 2.08 2.23 NS
Abbreviations: FC, fold change; NS, not significant.Genes with fold change above 2 or below 0.5 are shown in bold. See Table 1 for the COG nomenclature.
R. rubrum S1H response to space flightF Mastroleo et al
1408
The ISME Journal
the modeled microgravity experiment, 406 proteinswere identified for which 224 were quantifiedwith at least two peptides (Supplementary Table2). This constituted, respectively, 10.6% and 5.9%of the total candidate protein-encoding genes with acomputed FDR of 0.59% estimated at the peptidelevel. The median value for the protein fold changedistribution plot was 1.04, indicating a correctmixing of the control and the experimental samplesduring the differential proteomic protocol (Supple-mentary Figure 2A).
Of the 158 significant differentially expressed genesin modeled microgravity, 16 were confirmed to bepresent as protein in the same sample (Table 3).However, none of the latter quantified proteins passedthe threshold limit set to define differential expres-sion. Proteins that did pass the threshold limit werethe electron carrier GrxC, the tellurium resistance-related TerZ and TerD, CreA (function is unknown)and the polyphosphate kinase (Table 4).
Proteomic analysis of the simulation of ISS-ionizing radi-ation experiment using the MESSAGE 2 set-up. For thesimulation of ISS-ionizing radiation, 341 proteins
were identified including 192 quantified with at leasttwo peptides (Supplementary Table 3). This repre-sents 6.9% and 5% of the total candidate protein-encoding genes with a computed FDR of 0.34%estimated at the peptide level. The median value forthe protein fold change distribution plot was 1.04,indicating again a correct mixing of the control andthe experimental samples during the differentialproteomic protocol (Supplementary Figure 2B). Noneof the nine differentially expressed genes from thesimulation of the ISS-ionizing radiation using theMESSAGE 2 set-up were identified or quantifiedusing the differential proteomic approach. Proteomicanalysis revealed only three proteins showing asignificant upregulation considering the thresholdmentioned in the Materials and methods part (Ta-ble 5). However, the slight upregulation of theosmoprotectant glycine betaine transporter periplas-mic subunit ProX (Rru_A2477) could be pointed out.
BASE-A and related experiments: sistrom-succinatemediumTranscriptomic analysis. The methylene oxygenindicator strip placed inside the six-well plate
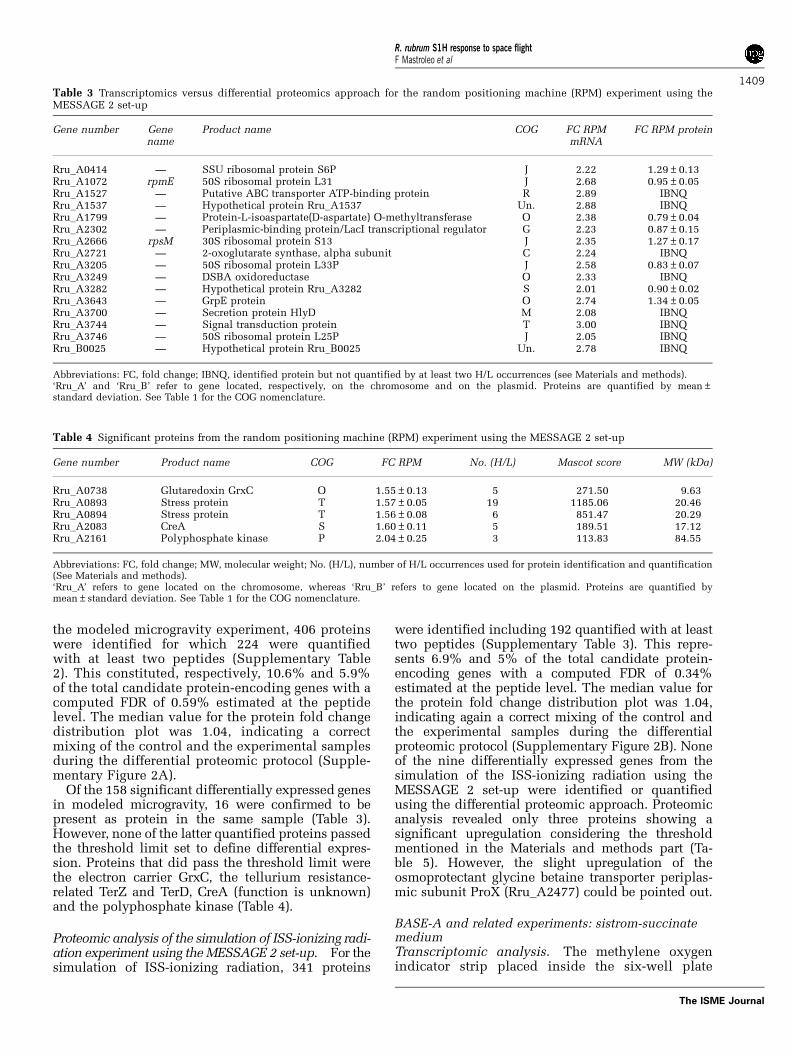
Table 3 Transcriptomics versus differential proteomics approach for the random positioning machine (RPM) experiment using theMESSAGE 2 set-up
Gene number Genename
Product name COG FC RPMmRNA
FC RPM protein
Rru_A0414 — SSU ribosomal protein S6P J 2.22 1.29±0.13Rru_A1072 rpmE 50S ribosomal protein L31 J 2.68 0.95±0.05Rru_A1527 — Putative ABC transporter ATP-binding protein R 2.89 IBNQRru_A1537 — Hypothetical protein Rru_A1537 Un. 2.88 IBNQRru_A1799 — Protein-L-isoaspartate(D-aspartate) O-methyltransferase O 2.38 0.79±0.04Rru_A2302 — Periplasmic-binding protein/LacI transcriptional regulator G 2.23 0.87±0.15Rru_A2666 rpsM 30S ribosomal protein S13 J 2.35 1.27±0.17Rru_A2721 — 2-oxoglutarate synthase, alpha subunit C 2.24 IBNQRru_A3205 — 50S ribosomal protein L33P J 2.58 0.83±0.07Rru_A3249 — DSBA oxidoreductase O 2.33 IBNQRru_A3282 — Hypothetical protein Rru_A3282 S 2.01 0.90±0.02Rru_A3643 — GrpE protein O 2.74 1.34±0.05Rru_A3700 — Secretion protein HlyD M 2.08 IBNQRru_A3744 — Signal transduction protein T 3.00 IBNQRru_A3746 — 50S ribosomal protein L25P J 2.05 IBNQRru_B0025 — Hypothetical protein Rru_B0025 Un. 2.78 IBNQ
Abbreviations: FC, fold change; IBNQ, identified protein but not quantified by at least two H/L occurrences (see Materials and methods).‘Rru_A’ and ‘Rru_B’ refer to gene located, respectively, on the chromosome and on the plasmid. Proteins are quantified by mean±standard deviation. See Table 1 for the COG nomenclature.
Table 4 Significant proteins from the random positioning machine (RPM) experiment using the MESSAGE 2 set-up
Gene number Product name COG FC RPM No. (H/L) Mascot score MW (kDa)
Rru_A0738 Glutaredoxin GrxC O 1.55±0.13 5 271.50 9.63Rru_A0893 Stress protein T 1.57±0.05 19 1185.06 20.46Rru_A0894 Stress protein T 1.56±0.08 6 851.47 20.29Rru_A2083 CreA S 1.60±0.11 5 189.51 17.12Rru_A2161 Polyphosphate kinase P 2.04±0.25 3 113.83 84.55
Abbreviations: FC, fold change; MW, molecular weight; No. (H/L), number of H/L occurrences used for protein identification and quantification(See Materials and methods).‘Rru_A’ refers to gene located on the chromosome, whereas ‘Rru_B’ refers to gene located on the plasmid. Proteins are quantified bymean±standard deviation. See Table 1 for the COG nomenclature.
R. rubrum S1H response to space flightF Mastroleo et al
1409
The ISME Journal
showed that at the end of all the BASE-A-relatedexperiments the culture conditions were still aerobic.
Using the whole-genome DNA chip, respectively,1.7% and 0.4% of the genes (out of 3143 genes
retained) were identified as significantly up- anddownregulated after a 12-day journey in spacecompared with that in the ground control. For themodeled microgravity experiment, 0.6% and onlyone of the genes (out of the 3797 genes retained)were identified as, respectively, significantlyup- and downregulated after 10 days of culturingon the RPM compared with that on the normalgravity control. For the ionizing radiation simula-tion, 4.5% and 1.2% of the genes (out of 3723genes retained) were identified as, respectively,significantly up- and downregulated after a 10-dayionizing radiation experiment compared withnon-irradiated samples.
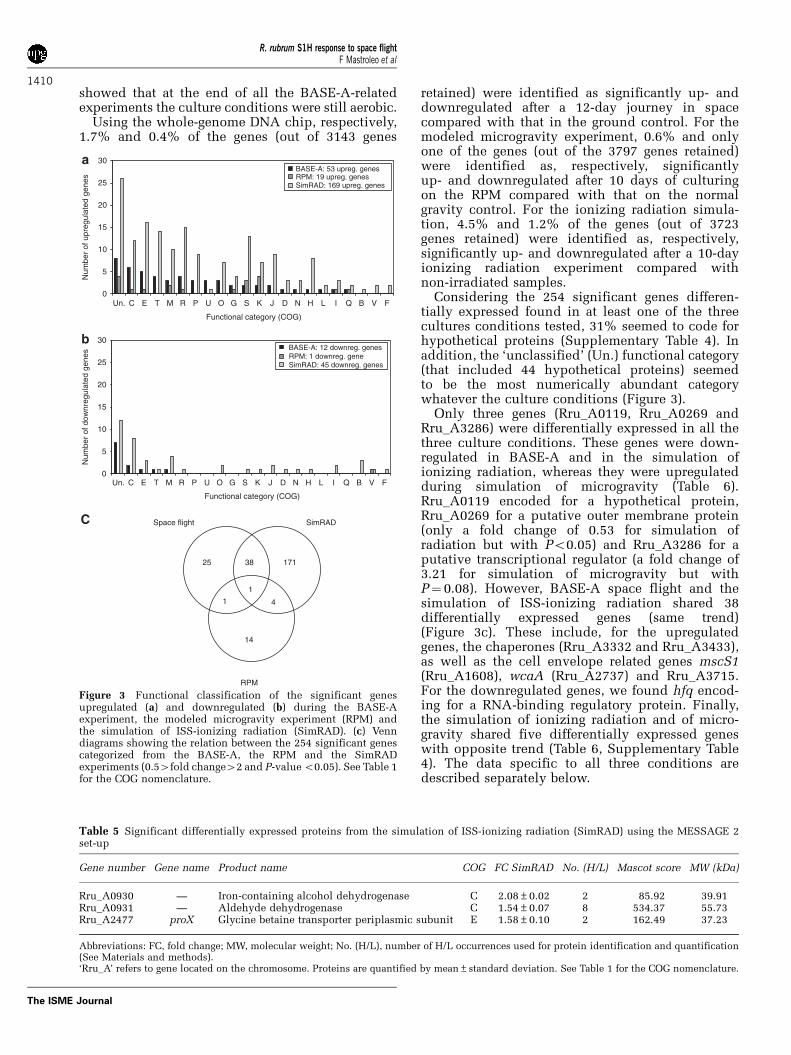
Considering the 254 significant genes differen-tially expressed found in at least one of the threecultures conditions tested, 31% seemed to code forhypothetical proteins (Supplementary Table 4). Inaddition, the ‘unclassified’ (Un.) functional category(that included 44 hypothetical proteins) seemedto be the most numerically abundant categorywhatever the culture conditions (Figure 3).
Only three genes (Rru_A0119, Rru_A0269 andRru_A3286) were differentially expressed in all thethree culture conditions. These genes were down-regulated in BASE-A and in the simulation ofionizing radiation, whereas they were upregulatedduring simulation of microgravity (Table 6).Rru_A0119 encoded for a hypothetical protein,Rru_A0269 for a putative outer membrane protein(only a fold change of 0.53 for simulation ofradiation but with Po0.05) and Rru_A3286 for aputative transcriptional regulator (a fold change of3.21 for simulation of microgravity but withP¼ 0.08). However, BASE-A space flight and thesimulation of ISS-ionizing radiation shared 38differentially expressed genes (same trend)(Figure 3c). These include, for the upregulatedgenes, the chaperones (Rru_A3332 and Rru_A3433),as well as the cell envelope related genes mscS1(Rru_A1608), wcaA (Rru_A2737) and Rru_A3715.For the downregulated genes, we found hfq encod-ing for a RNA-binding regulatory protein. Finally,the simulation of ionizing radiation and of micro-gravity shared five differentially expressed geneswith opposite trend (Table 6, Supplementary Table4). The data specific to all three conditions aredescribed separately below.
Table 5 Significant differentially expressed proteins from the simulation of ISS-ionizing radiation (SimRAD) using the MESSAGE 2set-up
Gene number Gene name Product name COG FC SimRAD No. (H/L) Mascot score MW (kDa)
Rru_A0930 — Iron-containing alcohol dehydrogenase C 2.08±0.02 2 85.92 39.91Rru_A0931 — Aldehyde dehydrogenase C 1.54±0.07 8 534.37 55.73Rru_A2477 proX Glycine betaine transporter periplasmic subunit E 1.58±0.10 2 162.49 37.23
Abbreviations: FC, fold change; MW, molecular weight; No. (H/L), number of H/L occurrences used for protein identification and quantification(See Materials and methods).‘Rru_A’ refers to gene located on the chromosome. Proteins are quantified by mean±standard deviation. See Table 1 for the COG nomenclature.
0
5
10
15
20
25
30
Un.
Functional category (COG)
Num
ber
of u
preg
ulat
ed g
enes
BASE-A: 53 upreg. genesRPM: 19 upreg. genesSimRAD: 169 upreg. genes
0
5
10
15
20
25
30
Functional category (COG)
Num
ber
of d
ownr
egul
ated
gen
es
BASE-A: 12 downreg. genesRPM: 1 downreg. geneSimRAD: 45 downreg. genes
Space flight SimRAD
RPM
25
4
1
1
14
FVBQILHNDJKSGOUPRMTEC
Un. FVBQILHNDJKSGOUPRMTEC
17138
Figure 3 Functional classification of the significant genesupregulated (a) and downregulated (b) during the BASE-Aexperiment, the modeled microgravity experiment (RPM) andthe simulation of ISS-ionizing radiation (SimRAD). (c) Venndiagrams showing the relation between the 254 significant genescategorized from the BASE-A, the RPM and the SimRADexperiments (0.54fold change42 and P-value o0.05). See Table 1for the COG nomenclature.
R. rubrum S1H response to space flightF Mastroleo et al
1410
The ISME Journal
Transcriptomic analysis of the BASE-A space flightexperiment. For the BASE-A flight experiment, thehighest induction (3.83-fold) was found for Rru_A3097encoding for a hypothetical protein. The 52 upregu-lated genes encode for numerous functions related totranslation (for example, Rru_A3746), transport (forexample, Rru_A0235 (secA)), metabolism, transcrip-tional regulation, transposition (Rru_A2588,Rru_A2590 and Rru_A3310) and stress, including aDNA mismatch repair gene mutL (Rru_A2946) and themechanosensitive channel mscS1 (Rru_A1608). Mostdownregulated genes encoded for hypothetical pro-teins (Supplementary Table 4).
Transcriptomic analysis of the modeled micro-gravity (RPM) experiment using the BASE-A set-up. With one down- and eight upregulated genes,the simulation of microgravity induced less differ-ential gene expression than the BASE-A space flightexperiment or the simulation of ISS-ionizing radia-tion (Supplementary Table 4). The downregulatedgene Rru_A1311 encoded for a MerR-family tran-scriptional regulator. Among the upregulated genes,we could identify genes encoding for transcriptionalregulators (for example, Rru_A1116 andRru_A2049), transport functions and hypotheticalproteins.
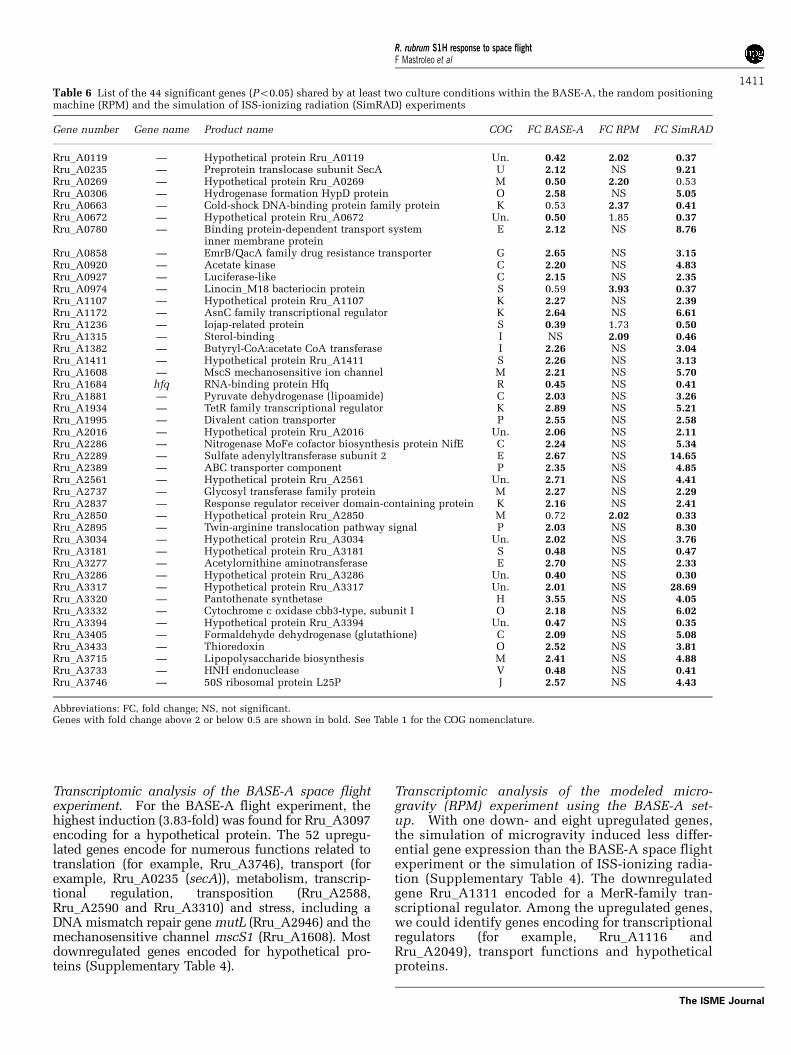
Table 6 List of the 44 significant genes (Po0.05) shared by at least two culture conditions within the BASE-A, the random positioningmachine (RPM) and the simulation of ISS-ionizing radiation (SimRAD) experiments
Gene number Gene name Product name COG FC BASE-A FC RPM FC SimRAD
Rru_A0119 — Hypothetical protein Rru_A0119 Un. 0.42 2.02 0.37Rru_A0235 — Preprotein translocase subunit SecA U 2.12 NS 9.21Rru_A0269 — Hypothetical protein Rru_A0269 M 0.50 2.20 0.53Rru_A0306 — Hydrogenase formation HypD protein O 2.58 NS 5.05Rru_A0663 — Cold-shock DNA-binding protein family protein K 0.53 2.37 0.41Rru_A0672 — Hypothetical protein Rru_A0672 Un. 0.50 1.85 0.37Rru_A0780 — Binding protein-dependent transport system
inner membrane proteinE 2.12 NS 8.76
Rru_A0858 — EmrB/QacA family drug resistance transporter G 2.65 NS 3.15Rru_A0920 — Acetate kinase C 2.20 NS 4.83Rru_A0927 — Luciferase-like C 2.15 NS 2.35Rru_A0974 — Linocin_M18 bacteriocin protein S 0.59 3.93 0.37Rru_A1107 — Hypothetical protein Rru_A1107 K 2.27 NS 2.39Rru_A1172 — AsnC family transcriptional regulator K 2.64 NS 6.61Rru_A1236 — Iojap-related protein S 0.39 1.73 0.50Rru_A1315 — Sterol-binding I NS 2.09 0.46Rru_A1382 — Butyryl-CoA:acetate CoA transferase I 2.26 NS 3.04Rru_A1411 — Hypothetical protein Rru_A1411 S 2.26 NS 3.13Rru_A1608 — MscS mechanosensitive ion channel M 2.21 NS 5.70Rru_A1684 hfq RNA-binding protein Hfq R 0.45 NS 0.41Rru_A1881 — Pyruvate dehydrogenase (lipoamide) C 2.03 NS 3.26Rru_A1934 — TetR family transcriptional regulator K 2.89 NS 5.21Rru_A1995 — Divalent cation transporter P 2.55 NS 2.58Rru_A2016 — Hypothetical protein Rru_A2016 Un. 2.06 NS 2.11Rru_A2286 — Nitrogenase MoFe cofactor biosynthesis protein NifE C 2.24 NS 5.34Rru_A2289 — Sulfate adenylyltransferase subunit 2 E 2.67 NS 14.65Rru_A2389 — ABC transporter component P 2.35 NS 4.85Rru_A2561 — Hypothetical protein Rru_A2561 Un. 2.71 NS 4.41Rru_A2737 — Glycosyl transferase family protein M 2.27 NS 2.29Rru_A2837 — Response regulator receiver domain-containing protein K 2.16 NS 2.41Rru_A2850 — Hypothetical protein Rru_A2850 M 0.72 2.02 0.33Rru_A2895 — Twin-arginine translocation pathway signal P 2.03 NS 8.30Rru_A3034 — Hypothetical protein Rru_A3034 Un. 2.02 NS 3.76Rru_A3181 — Hypothetical protein Rru_A3181 S 0.48 NS 0.47Rru_A3277 — Acetylornithine aminotransferase E 2.70 NS 2.33Rru_A3286 — Hypothetical protein Rru_A3286 Un. 0.40 NS 0.30Rru_A3317 — Hypothetical protein Rru_A3317 Un. 2.01 NS 28.69Rru_A3320 — Pantothenate synthetase H 3.55 NS 4.05Rru_A3332 — Cytochrome c oxidase cbb3-type, subunit I O 2.18 NS 6.02Rru_A3394 — Hypothetical protein Rru_A3394 Un. 0.47 NS 0.35Rru_A3405 — Formaldehyde dehydrogenase (glutathione) C 2.09 NS 5.08Rru_A3433 — Thioredoxin O 2.52 NS 3.81Rru_A3715 — Lipopolysaccharide biosynthesis M 2.41 NS 4.88Rru_A3733 — HNH endonuclease V 0.48 NS 0.41Rru_A3746 — 50S ribosomal protein L25P J 2.57 NS 4.43
Abbreviations: FC, fold change; NS, not significant.Genes with fold change above 2 or below 0.5 are shown in bold. See Table 1 for the COG nomenclature.
R. rubrum S1H response to space flightF Mastroleo et al
1411
The ISME Journal
Transcriptomic analysis of the simulation of ISS-ionizing radiation using the BASE-A set-up. With169 up- and 41 downregulated genes, this conditiongave the highest number of significant differentiallyexpressed genes (Supplementary Table 4). Further-more, whereas the fold change neither in the spaceflight nor in the RPM experiments exceeded 4, theionizing radiation rendered 20 genes with a foldchange above 5. Genes that were upregulated codedfor functions involved in transport, cell envelopebiosynthesis or maintenance, redox balance, tran-scriptional regulation, amino acid metabolism andstress response. These included secA (Rru_A0235)and mcsS1 (Rru_A1608), which were also upregu-lated in the BASE-A flight experiment; a ferricuptake regulator fur (Rru_A3788), which was alsoslightly (1.83-fold), but significantly, upregulated inthe MESSAGE 2 flight experiment; the DNA mis-match repair genes mutS (Rru_A3541) and mutL(Rru_A2946), the latter only slightly upregulatedand also upregulated in the BASE-A flight experi-ment. The downregulated genes not only included alot of genes encoding for hypothetical proteins butalso Rru_A2723, which codes for rubrerythrin andhfq (Rru_A1684), also downregulated in the BASE-Aspace experiment.
Proteomic analysisProteomic analysis of the BASE-A space flightexperiment. For the BASE-A flight experiment,366 proteins were identified (SupplementaryTable 5) including 248 quantified with at least two
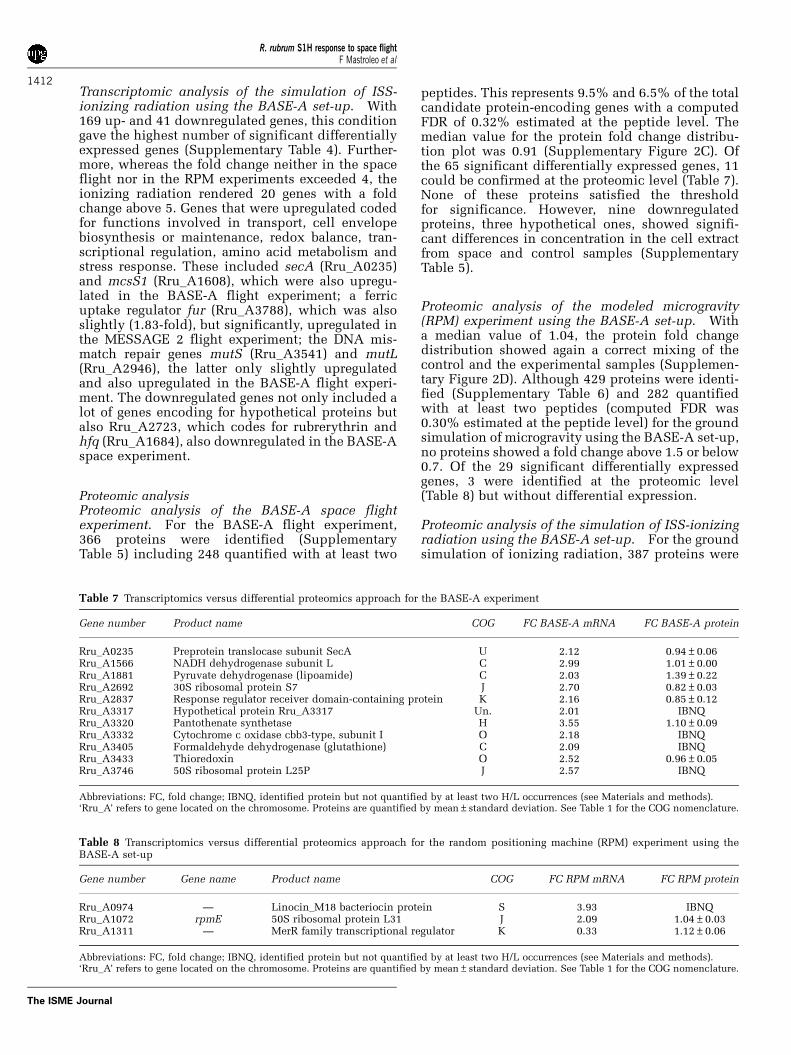
peptides. This represents 9.5% and 6.5% of the totalcandidate protein-encoding genes with a computedFDR of 0.32% estimated at the peptide level. Themedian value for the protein fold change distribu-tion plot was 0.91 (Supplementary Figure 2C). Ofthe 65 significant differentially expressed genes, 11could be confirmed at the proteomic level (Table 7).None of these proteins satisfied the thresholdfor significance. However, nine downregulatedproteins, three hypothetical ones, showed signifi-cant differences in concentration in the cell extractfrom space and control samples (SupplementaryTable 5).
Proteomic analysis of the modeled microgravity(RPM) experiment using the BASE-A set-up. Witha median value of 1.04, the protein fold changedistribution showed again a correct mixing of thecontrol and the experimental samples (Supplemen-tary Figure 2D). Although 429 proteins were identi-fied (Supplementary Table 6) and 282 quantifiedwith at least two peptides (computed FDR was0.30% estimated at the peptide level) for the groundsimulation of microgravity using the BASE-A set-up,no proteins showed a fold change above 1.5 or below0.7. Of the 29 significant differentially expressedgenes, 3 were identified at the proteomic level(Table 8) but without differential expression.
Proteomic analysis of the simulation of ISS-ionizingradiation using the BASE-A set-up. For the groundsimulation of ionizing radiation, 387 proteins were
Table 7 Transcriptomics versus differential proteomics approach for the BASE-A experiment
Gene number Product name COG FC BASE-A mRNA FC BASE-A protein
Rru_A0235 Preprotein translocase subunit SecA U 2.12 0.94±0.06Rru_A1566 NADH dehydrogenase subunit L C 2.99 1.01±0.00Rru_A1881 Pyruvate dehydrogenase (lipoamide) C 2.03 1.39±0.22Rru_A2692 30S ribosomal protein S7 J 2.70 0.82±0.03Rru_A2837 Response regulator receiver domain-containing protein K 2.16 0.85±0.12Rru_A3317 Hypothetical protein Rru_A3317 Un. 2.01 IBNQRru_A3320 Pantothenate synthetase H 3.55 1.10±0.09Rru_A3332 Cytochrome c oxidase cbb3-type, subunit I O 2.18 IBNQRru_A3405 Formaldehyde dehydrogenase (glutathione) C 2.09 IBNQRru_A3433 Thioredoxin O 2.52 0.96±0.05Rru_A3746 50S ribosomal protein L25P J 2.57 IBNQ
Abbreviations: FC, fold change; IBNQ, identified protein but not quantified by at least two H/L occurrences (see Materials and methods).‘Rru_A’ refers to gene located on the chromosome. Proteins are quantified by mean±standard deviation. See Table 1 for the COG nomenclature.
Table 8 Transcriptomics versus differential proteomics approach for the random positioning machine (RPM) experiment using theBASE-A set-up
Gene number Gene name Product name COG FC RPM mRNA FC RPM protein
Rru_A0974 — Linocin_M18 bacteriocin protein S 3.93 IBNQRru_A1072 rpmE 50S ribosomal protein L31 J 2.09 1.04±0.03Rru_A1311 — MerR family transcriptional regulator K 0.33 1.12±0.06
Abbreviations: FC, fold change; IBNQ, identified protein but not quantified by at least two H/L occurrences (see Materials and methods).‘Rru_A’ refers to gene located on the chromosome. Proteins are quantified by mean±standard deviation. See Table 1 for the COG nomenclature.
R. rubrum S1H response to space flightF Mastroleo et al
1412
The ISME Journal
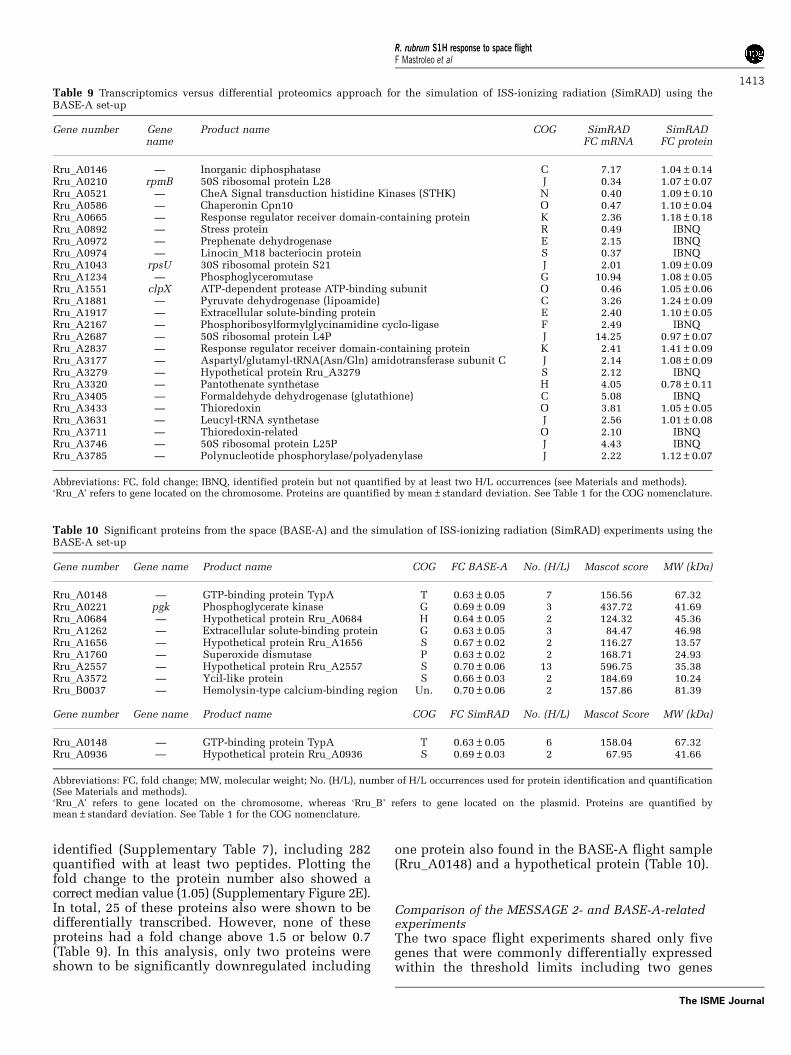
identified (Supplementary Table 7), including 282quantified with at least two peptides. Plotting thefold change to the protein number also showed acorrect median value (1.05) (Supplementary Figure 2E).In total, 25 of these proteins also were shown to bedifferentially transcribed. However, none of theseproteins had a fold change above 1.5 or below 0.7(Table 9). In this analysis, only two proteins wereshown to be significantly downregulated including
one protein also found in the BASE-A flight sample(Rru_A0148) and a hypothetical protein (Table 10).
Comparison of the MESSAGE 2- and BASE-A-relatedexperimentsThe two space flight experiments shared only fivegenes that were commonly differentially expressedwithin the threshold limits including two genes
Table 9 Transcriptomics versus differential proteomics approach for the simulation of ISS-ionizing radiation (SimRAD) using theBASE-A set-up
Gene number Genename
Product name COG SimRADFC mRNA
SimRADFC protein
Rru_A0146 — Inorganic diphosphatase C 7.17 1.04±0.14Rru_A0210 rpmB 50S ribosomal protein L28 J 0.34 1.07±0.07Rru_A0521 — CheA Signal transduction histidine Kinases (STHK) N 0.40 1.09±0.10Rru_A0586 — Chaperonin Cpn10 O 0.47 1.10±0.04Rru_A0665 — Response regulator receiver domain-containing protein K 2.36 1.18±0.18Rru_A0892 — Stress protein R 0.49 IBNQRru_A0972 — Prephenate dehydrogenase E 2.15 IBNQRru_A0974 — Linocin_M18 bacteriocin protein S 0.37 IBNQRru_A1043 rpsU 30S ribosomal protein S21 J 2.01 1.09±0.09Rru_A1234 — Phosphoglyceromutase G 10.94 1.08±0.05Rru_A1551 clpX ATP-dependent protease ATP-binding subunit O 0.46 1.05±0.06Rru_A1881 — Pyruvate dehydrogenase (lipoamide) C 3.26 1.24±0.09Rru_A1917 — Extracellular solute-binding protein E 2.40 1.10±0.05Rru_A2167 — Phosphoribosylformylglycinamidine cyclo-ligase F 2.49 IBNQRru_A2687 — 50S ribosomal protein L4P J 14.25 0.97±0.07Rru_A2837 — Response regulator receiver domain-containing protein K 2.41 1.41±0.09Rru_A3177 — Aspartyl/glutamyl-tRNA(Asn/Gln) amidotransferase subunit C J 2.14 1.08±0.09Rru_A3279 — Hypothetical protein Rru_A3279 S 2.12 IBNQRru_A3320 — Pantothenate synthetase H 4.05 0.78±0.11Rru_A3405 — Formaldehyde dehydrogenase (glutathione) C 5.08 IBNQRru_A3433 — Thioredoxin O 3.81 1.05±0.05Rru_A3631 — Leucyl-tRNA synthetase J 2.56 1.01±0.08Rru_A3711 — Thioredoxin-related O 2.10 IBNQRru_A3746 — 50S ribosomal protein L25P J 4.43 IBNQRru_A3785 — Polynucleotide phosphorylase/polyadenylase J 2.22 1.12±0.07
Abbreviations: FC, fold change; IBNQ, identified protein but not quantified by at least two H/L occurrences (see Materials and methods).‘Rru_A’ refers to gene located on the chromosome. Proteins are quantified by mean±standard deviation. See Table 1 for the COG nomenclature.
Table 10 Significant proteins from the space (BASE-A) and the simulation of ISS-ionizing radiation (SimRAD) experiments using theBASE-A set-up
Gene number Gene name Product name COG FC BASE-A No. (H/L) Mascot score MW (kDa)
Rru_A0148 — GTP-binding protein TypA T 0.63±0.05 7 156.56 67.32Rru_A0221 pgk Phosphoglycerate kinase G 0.69±0.09 3 437.72 41.69Rru_A0684 — Hypothetical protein Rru_A0684 H 0.64±0.05 2 124.32 45.36Rru_A1262 — Extracellular solute-binding protein G 0.63±0.05 3 84.47 46.98Rru_A1656 — Hypothetical protein Rru_A1656 S 0.67±0.02 2 116.27 13.57Rru_A1760 — Superoxide dismutase P 0.63±0.02 2 168.71 24.93Rru_A2557 — Hypothetical protein Rru_A2557 S 0.70±0.06 13 596.75 35.38Rru_A3572 — YciI-like protein S 0.66±0.03 2 184.69 10.24Rru_B0037 — Hemolysin-type calcium-binding region Un. 0.70±0.06 2 157.86 81.39
Gene number Gene name Product name COG FC SimRAD No. (H/L) Mascot Score MW (kDa)
Rru_A0148 — GTP-binding protein TypA T 0.63±0.05 6 158.04 67.32Rru_A0936 — Hypothetical protein Rru_A0936 S 0.69±0.03 2 67.95 41.66
Abbreviations: FC, fold change; MW, molecular weight; No. (H/L), number of H/L occurrences used for protein identification and quantification(See Materials and methods).‘Rru_A’ refers to gene located on the chromosome, whereas ‘Rru_B’ refers to gene located on the plasmid. Proteins are quantified bymean±standard deviation. See Table 1 for the COG nomenclature.
R. rubrum S1H response to space flightF Mastroleo et al
1413
The ISME Journal
encoding for hypothetical proteins (Rru_A0119,Rru_A0269), the NADH dehydrogenase subunit L(Rru_A1566), a ribosomal protein (Rru_A3746) andthe putative transcriptional regulator Rru_A3286.The latter was downregulated in the BASE-A flightexperiment and its simulation of ionizing radiationand upregulated in the BASE-A simulation ofmicrogravity. Furthermore, Rru_A3286 is part ofthe cluster Rru_A3283–Rru_A3288 upregulated inthe MESSAGE 2 flight experiment.
However, as mentioned above, about 600 genesfrom the BASE-A space experiment were not keptfor statistical analysis after the microarray spotfiltering quality control. As a direct consequence,of the 219 significant differentially expressed genesfrom the MESSAGE 2 experiment, 49 have nocorresponding fold induction value in the BASE-Aexperiment.
One hypothetical protein-encoding gene(Rru_A2994) was jointly overexpressed in the ISS-ionizing radiation simulations of MESSAGE 2 andBASE-A, whereas two genes (Rru_A1537 andRru_A2850 coding for hypothetical proteins) werecommon to the microgravity simulation experi-ments. Noteworthy is that the cluster Rru_A0196–Rru_A0198, which was slightly but significantly(Po0.05) downregulated in the MESSAGE 2 andrelated simulations (except for Rru_A0198 in micro-gravity simulation), was also slightly but signifi-cantly downregulated in BASE-A and its simulationof ionizing radiation. Within the differential proteo-mic approach, no overlap was found between theMESSAGE 2- and BASE-A-related experiments (thatis, flight, ionizing radiation and RPM).
In the MESSAGE 2 experimental set-up, con-ducted on rich medium, space flight and simulationof microgravity elicited the highest number ofdifferentially expressed genes and showed thelargest overlap (Figure 2c), whereas for the BASE-A experimental set-up, performed on minimalmedium, space flight and simulation of ionizingradiation showed the highest number of significantdifferentially expressed genes and the largest over-lap (Figure 3c). A general comparison of thedifferentially expressed genes from the two spaceflight and their related simulation experiments onthe different culture media indicated an overall lowoverlap (Figure 4).
Discussion
Experiment set-up and bacterial responseA different response of R. rubrum S1H cultivated inspace-related environmental conditions wasobserved for rich compared with that for minimalmedium, and overall there was limited overlapobserved in differential gene expression for theconditions tested. In addition, when interpretingdifferential gene expression of large sets of genes, itshould be considered that the observed overlapcould be expected just by chance. Indeed, consider-ing the length of the compared genes lists and thetotal number of genes surveyed, an overlap could beexpected of, respectively, seven, two and three genes(Po0.05) for the space, the ionizing radiation andthe modeled microgravity experiments taken 2 by 2.
The BASE-A set-up involving minimal mediumshowed a more pronounced effect for the simulationof ionizing irradiation than for microgravity simula-tion, whereas the opposite was observed for theMESSAGE 2 set-up with rich medium. Severalstudies already reported a more apparent bacterialresponse when cultivation in space flight, and spaceflight analogs was performed on rich medium (Bakerand Leff, 2004, 2006; Benoit and Klaus, 2007;Wilson et al., 2008). However, the difference ingrowth medium composition is probably not theonly factor responsible for the difference in expres-sion pattern for MESSAGE 2 and BASE-A. Particu-larly, the experimental set-up is an importantadditional difference. The use of different hardwaredimensions like Petri dishes (MESSAGE 2) com-pared with six-well plates (BASE-A), and differentinoculation load affect amongst others the surfacearea and oxygen availability per cell. In combinationwith (simulated) microgravity that will affect gasand fluid transport processes (Klaus et al., 1997) andionizing radiation, the hardware properties probablyinfluenced the effect of space flight and conse-quently influenced the bacterium’s response to it.
Osmotic stress in MESSAGE 2 rich medium culti-vation. The MESSAGE 2 transcriptomic resultssuggest a response to what is felt by the cell aspossibly an osmotic stress. Indeed, together with thegene coding for the biosynthesis of the osmoprotec-tant trehalose synthesis, two membrane-based os-mosensors, the mechanosensitive channel MscSand, to a lesser extent, the two-component sensorkinase KdpD as well as a potassium efflux proteinwere differentially expressed in the MESSAGE 2space samples (Wood, 1999; Ballal et al., 2007;Gunasekera et al., 2008; Hurst et al., 2008). During ahypo-osmotic shock, that is, sudden reduction of theexternal osmolarity, induction of a mechanosensi-tive channel could act as an emergency safety valve(reviewed in Booth et al., 2007) and decreasingpotassium influx (down-regulation Kdp-system) andincreasing potassium efflux would help to adapt tothis hypo-osmotic conditions. A disruption of the
MSG2 BASE-A MSG2SimRAD
BASE-ASimRAD
MSG2RPM
BASE-ARPM
60214 5 18156 2 2138 1
Figure 4 Comparison of significant genes expressed in theMESSAGE 2 (MSG2) and BASE-A related experiments. RPM,modeled microgravity experiment using the random-positioningmachine; SimRAD, simulation of ISS-ionizing radiation.
R. rubrum S1H response to space flightF Mastroleo et al
1414
The ISME Journal
cellular homeostasis may partially explain theobserved increase in expression of genes related toenergy production and conversion, to restore thehomeostasis. Another evidence for a response tostress could be the accumulation of trehalose.Indeed, studying Saccharomyces cerevisiae,Benaroudj et al. (2001) showed that in addition toits structural function in desiccation tolerance,trehalose accumulates during cellular stress(exposure to mild heat shock at 38 1C or to aproteasome inhibitor) and markedly protectscells and proteins from damage generated froman oxygen radical-generating system (that is, H2O2
and FeCl3 through the Fenton reaction).A similar role was suggested by Cytryn et al.(2007) who studied the desiccation-inducedstress in the a-proteobacterium Bradyrhizobiumjaponicum.
Oxidative stress in BASE-A minimal medium culti-vation. Stress elicited by ionizing radiation solelyhas apparently a more pronounced effect in aminimal medium compared with that in a richmedium where less reactive oxygen species aregenerated (Lee et al., 2006) or where the producedreactive oxygen species are more rapidly scavengedby the anti-oxidant compounds present in themedium. Differential gene expression that could belinked to oxidative stress putatively included theupregulation of the ferric uptake repressor fur(Rru_A3788), which links cellular iron status tooxidative stress by scavenging iron (Hantke, 2001;Imlay, 2003), and the downregulation of hfq, whichnegatively regulates the expression of Fur in E. coli(Vecerek et al., 2003). However, rubrerythrin in-volved in oxidative stress defense in anaerobicbacteria (Lehmann et al., 1996; Lumppio et al.,2001) was downregulated. Previous reports on theeffect of low doses (in the range of 0.1 Gy of X-rays)on prokaryotes only focused on the induction of theadaptive response by means of SOS repair-relatedgenes (Huang and Claycamp, 1993; Ewing, 1995;Basak, 1996) and Ewing (1995) predicted the thresh-old dose that just activates a physiological response(that is, SOS repair mechanism) in E. coli to be aslow as 1 mGy. Our study was the first to analyze theglobal transcriptomic and proteomic response tosuch low doses of ionizing radiation (ca. 2 mGy) andindicated a pronounced transcriptomic response ofR. rubrum S1H to low-dose radiation when grown inminimal medium.
Space flight versus simulations of microgravity andionizing radiation on EarthSimulation of microgravity with the RPM. Exceptfor the preliminary work of de Vet and Rutgers(2007), who tested bacterial fuel cells in both realspace and RPM-simulated microgravity conditions,this study is unique in cultivating bacteria using theRPM and comparing it with real space flight data at
both the transcriptomic and proteomic levels. Thelow overlap between space and ground simulationexperiments, however, raises the question of theproper simulation of microgravity using the RPM.The principle of the RPM is that the direction of thegravity vector experienced by an organism continu-ously changes in three-dimensional space (Hosonet al., 1997). Although the RPM device is currentlythe only facility allowing to study agar culture undermicrogravity simulation, it is clear that there is adifference in gravity values present in space and theones obtained using microgravity simulators. Inaddition, particular aspects of the space flightexperiment including launch and landing effects(high vibrations, hyper-g) and the ISS on-boardenvironment regarding vibrations are not includedin such simulations and might have had an impacton the final results. Future studies involving activa-tion, cultivation and fixation of the bacterial culturein-flight, starting the complete experiment afterlaunch and stopping it before return to the Earth,could minimize the effects mentioned above. More-over, the possible use of an in-flight centrifuge, suchas the KUBIK incubator (COMAT Aerospace, Flou-rens, France) from the European Space Agency,could bring an additional control, eliminating theeffect of microgravity. But still, some questionswould remain, as launch acceleration, vibrationand so on, may cause damage to the ‘inactive’ cellthat will be processed when the bacterium isactivated in-flight and the elicited response couldstill be more than space flight alone.
Simulation of ISS-ionizing radiation. In ourexperimental set-up, a combination of single beamsof low-LET g rays and high-LET neutron rays waschosen. The high-LET neutrons are importantbecause they are among the most important second-ary radiation particles found in the space craft interms of radiation protection (that is, biologicaleffectiveness) (Armstrong and Colborn, 2001; Ben-ton and Benton, 2001; Mitaroff and Silari, 2002).When passing through the skin and structure of theISS, primary ionizing particles can undergo interac-tions with the nuclei that constitute the spaceship’smass, producing a wide variety of secondaryparticles, such as neutrons, protons, recoil nuclei,projectile fragments, g-particles and so on. Theseparticles occupy a quite broad energy spectrum andrange from low-LET to high-LET including LETvalues from approximately 10�1 to 103 keV mm�1
(Armstrong and Colborn, 2001; Benton and Benton,2001). Therefore, the difference between singlebeam ground-based irradiation (g and neutron witha maximum LET of 250 keV mm�1) and the complexmixture of particles over a wide range of energyinside the ISS could account for discrepancies thatneed to be taken into account when comparingground simulation with space flight data. Rea et al.(2008) recently underlined the difficulty to measureand above all, to reproduce different radiation
R. rubrum S1H response to space flightF Mastroleo et al
1415
The ISME Journal
components at the same time over a wide energyrange.
In a few words, no simulations set-up on the Earthwould be able to reproduce all the stress factorsrelated to a space flight mission. Still, they willalways be more accessible than flight opportunities(but also in terms of experiment size, weight,electric power requirements and so on) and cangive an indication of which particular physiologicalaspect to monitor during cultivation in actual spaceflight conditions.
Integrating transcriptomics and quantitativeproteomics resultsThe specific search for differentially expressedproteins in the MudPIT approach obviously limitedthe number of detected proteins. Nevertheless, therelative poor correlation between transcriptomicand proteomic data has been reported before (Coxet al., 2007; Giotis et al., 2008). Moreover, Julka andRegnier (2004) concluded their research by mention-ing that one must be cautious in concluding that thepresence or absence of significant mRNA abundancechange of a gene detected by transcriptomicsnecessarily corresponds to the presence or absenceof significant protein abundance change detected byproteomics. The discrepancy between the mRNAlog-ratio and the protein log-ratio of a gene can stemfrom sustained protein presence from transienttranscriptional induction, post-transcriptional regu-lation or possible measurement errors or anycombinations of these causes.
Therefore, although not differentially expressed atthe transcriptomic level, the upregulation of theosmoprotectant transporter ProX (among the veryfew upregulated proteins) in the simulation ofionizing radiation using the MESSAGE 2 set-upremains an interesting result that could be related toa probable oxidative stress too. Indeed, exposure ofthe cells to one type of stress can also conditionthem against other, seemingly unrelated, stresses.In this respect, it has been shown that when bacteriaare challenged with high osmolarity, they acquiredincreased resistance to high temperature and oxida-tive stress through an RpoS-dependent mechanism(Hengge-Aronis et al., 1993; Smirnova et al., 2000;Canovas et al., 2001). However, based on the genomeannotation, R. rubrum does not seem to have aspecific sigma factor involved in general stress orentry into stationary phase such as RpoS. This hasalso been observed for the closely related a-proteo-bacterium, Rhodobacter sphaeroides 2.4.1 (Mack-enzie et al., 2007). Thus, we can suspect thesefunctions to be ascribed to another sigma factor or tonon-sigma-factor-type regulator(s). Palma et al.(2004) reported the response of Pseudomonasaeruginosa to hydrogen peroxide to induce anupregulation of extracellular protein such as extra-cytoplasmic function. Interestingly, we found theupregulation of an alternative sigma factor of
extracytoplasmic function in the MESSAGE 2experiment that could be involved in the oxidativestress response of R. rubrum.
Genes coding for hypothetical proteinsThis group seemed to constitute an important part(30%) of the differentially expressed genes detectedin the three studied culture conditions related toMESSAGE 2 and even occupied the top threeupregulated genes in the MESSAGE 2 spaceflight experiment (Rru_A3369, Rru_A2713 andRru_A0160). The amount of genes annotated ashypothetical proteins (ca. 25%) in the genome of R.rubrum indicates that a substantial part of thegenetics of this organism is not well known. Theexpression of these genes in response to environ-mental parameters not encountered on the Earthraises the question of their earthly niche origin andhow these genes have been kept during evolution.Therefore, exploring new environmental and stressconditions, such as space or RPM cultivation, couldassign novel functions to these hypothetical pro-teins. After manual annotation using the MaGeplatform, four genes coding for hypothetical pro-teins were further explored: (i) Rru_A2588,Rru_A2590 and Rru_A3310, induced in the BASE-A space samples, seemed to belong to mobile geneticelements, that is, insertion sequences. The mobilityof insertion sequences has been linked to variousbacterial stress responses (reviewed in Foster, 2007);(ii) Rru_A2016, induced in the space and theionizing radiation experiments using the BASE-Aset-up, is a conserved protein frequently associatedwith DnaJ-like chaperones, and therefore gaveanother argument in favor of a stress response.
Conclusion and perspectives
Transcriptomic and proteomic data showed thatR. rubrum S1H is able to sense and react toenvironmental changes such as microgravity andionizing radiation that are linked to space flight.Subtle effects were already seen after 10 days inspace featuring an ionizing radiation dose as lowas 2 mGy. Thus, it is not excluded that similarresponses will occur in a continuous culturebioreactor during extended space exploration mis-sions of several years and may eventually affect thebioreactor performance. Within the MELiSSA sys-tem, it is, however, foreseen that the R. rubrum S1Hbioreactor is fully mixed to allow homogeneousculture feeding and illumination. Therefore, wecould argue that the effect of microgravity wouldbe minimized due to intensive mixing. Although thecomposition of the R. rubrum reactor input flowcoming from the upstream fermentation reactor ispresently not fully characterized, the medium couldpotentially also provide specific antioxidants (suchas present in a rich culture medium), which may
R. rubrum S1H response to space flightF Mastroleo et al
1416
The ISME Journal
protect the bacterium also against ionizing radia-tion. Moreover, also the selection of R. rubrumradio-resistant mutants could be considered. On theother hand, the bioreactor conditions may elucidateadditional stress (medium composition, light inten-sity, long-term culturing and so on), which maystress the cells and in combination with radiation benevertheless a risk for good reactor performance.Therefore, additional space experiments and groundsimulations (for example, space microgravity andionizing radiation) in continuous bioreactors arecrucial to draw final conclusions concerning thespace flight impact for MELiSSA. New spaceexperiments need to be done in conditions mimick-ing the future MELiSSA loop conditions (with lightand in anaerobic conditions), and should include adetailed metabolic analysis in addition to theproteomic and transcriptomic profiling. As shownin this study, conducting scientific space flightexperiments remains a technical and logisticalchallenge but space research is truly a rich sourceof new findings.
Acknowledgements
This work is dedicated to the memory of Dr ir L Hendrickxwho initiated the study of R. rubrum S1H in space flightconditions. This research was partly funded by theBelgian Nuclear Research Center (SCK.CEN) throughthe PhD AWM grant of F Mastroleo. We also thank theEuropean Space Agency (ESA-PRODEX, ESA-GSTP)and the Belgian Science Policy (Belspo) for the flightopportunities and the financial support to conductmicrobial experiments in space. We thank C Lasseur andC Paille, both from ESTEC/ESA, for constant supportand advice in the frame of the MELiSSA project. Weare thankful to Prof Dr P Pippia and Dr M Meloni forgiving us access to their ESA RPM facility and to GCampus for providing technical support. We gratefullyacknowledge the contribution of Dr M Coeck and BMarlein for their help in the design of the ionizingradiation experiment. Professor R Wattiez is a ResearchAssociate of FNRS.
References
Armstrong TW, Colborn BL. (2001). Predictions of sec-ondary neutrons and their importance to radiationeffects inside the International Space Station. RadiatMeas 33: 229–234.
Baker PW, Leff L. (2004). The effect of simulatedmicrogravity on bacteria from the Mir space station.Microgravity Sci Technol 15: 35–41.
Baker PW, Leff L. (2006). Mir space station bacteriaresponses to modeled reduced gravity under starva-tion conditions. Adv Space Res 38: 1152–1158.
Ballal A, Basu B, Apte SK. (2007). The Kdp-ATPase systemand its regulation. J Biosci 32: 559–568.
Basak J. (1996). Characterization of the adaptiveresponse to ionizing radiation induced by lowdoses of X-rays to Vibrio cholerae cells. Mutat Res372: 115–118.
Benaroudj N, Lee DH, Goldberg AL. (2001). Trehaloseaccumulation during cellular stress protects cells andcellular proteins from damage by oxygen radicals.J Biol Chem 276: 24261–24267.
Benoit MR, Klaus DM. (2007). Microgravity, bacteriaand the influence of motility. Adv Space Res 39:1225–1232.
Benton ER, Benton EV. (2001). Space radiation dosimetryin low-Earth orbit and beyond. Nucl Instrum MethodsPhys Res B 184: 255–294.
Boonyaratanakornkit JB, Cogoli A, Li CF, Schopper T,Pippia P, Galleri G et al. (2005). Key gravity-sensitivesignaling pathways drive T cell activation. FASEB J 19:2020–2022.
Booth IR, Edwards MD, Black S, Schumann U, Miller S.(2007). Mechanosensitive channels in bacteria: signsof closure? Nat Rev Microbiol 5: 431–440.
Bradford MM. (1976). A rapid and sensitive method forthe quantitation of microgram quantities of proteinutilizing the principle of protein-dye binding. AnalBiochem 72: 248–254.
Canovas D, Fletcher SA, Hayashi M, Csonka LN. (2001).Role of trehalose in growth at high temperature ofSalmonella enterica serovar Typhimurium. J Bacteriol183: 3365–3371.
Cox B, Kislinger T, Wigle DA, Kannan A, Brown K, OkuboT et al. (2007). Integrated proteomic and transcrip-tomic profiling of mouse lung development and Nmyctarget genes. Mol Syst Biol 3: 109.
Cytryn EJ, Sangurdekar DP, Streeter JG, Franck WL, ChangWS, Stacey G et al. (2007). Transcriptional andphysiological responses of Bradyrhizobium japonicumto desiccation-induced stress. J Bacteriol 89:6751–6762.
de Vet SJ, Rutgers R. (2007). From waste to energy: firstexperimental bacterial fuel cells onboard the interna-tional space station. Microgravity Sci Technol XIX-5/6:225–229.
Elias JE, Haas W, Faherty BK, Gygi SP. (2005). Comparativeevaluation of mass spectrometry platforms used inlarge-scale proteomics investigations. Nat Methods 2:667–675.
Ewing D. (1995). Can an X-ray dose threshold be measuredfor the induction of SOS repair activity in E. coli.Biochem Biophys Res Commun 206: 781–785.
Farges B, Poughon L, Creuly C, Cornet JF, Dussap CG,Lasseur C. (2008). Dynamic aspects and controllabilityof the MELiSSA project: a bioregenerative system toprovide life support in space. Appl Biochem Bio-technol 151: 686–699.
Foster PL. (2007). Stress-induced mutagenesis in bacteria.Crit Rev Biochem Mol Biol 42: 373–397.
Giotis ES, Muthaiyan A, Blair IS, Wilkinson BJ, McDowellDA. (2008). Genomic and proteomic analysis of theAlkali-Tolerance Response (AlTR) in Listeria mono-cytogenes 10403S. BMC Microbiol 24: 102.
Goossens O, Vanhavere F, Leys N, De Boever P, O’SullivanD, Zhou D et al. (2006). Radiation dosimetry formicrobial experiments in the International SpaceStation using different etched track and luminescentdetectors. Radiat Prot Dosimetry 120: 433–437.
Gunasekera TS, Csonka LN, Paliy O. (2008). Genome-widetranscriptional responses of Escherichia coli K-12 tocontinuous osmotic and heat stresses. J Bacteriol 190:3712–3720.
Hantke K. (2001). Iron and metal regulation in bacteria.Curr Opin Microbiol 4: 172–177.
R. rubrum S1H response to space flightF Mastroleo et al
1417
The ISME Journal
Hendrickx L, De Wever H, Hermans V, Mastroleo F, MorinN, Wilmotte A et al. (2006). Microbial ecology of theclosed artificial ecosystem MELiSSA (Micro-Ecologi-cal Life Support System Alternative): reinventing andcompartmentalizing the Earth’s food and oxygenregeneration system for long-haul space explorationmissions. Res Microbiol 157: 77–86.
Hendrickx L, Mergeay M. (2007). From the deep sea to thestars: human life support through minimal commu-nities. Curr Opin Microbiol 10: 231–237.
Hengge-Aronis R, Lange R, Henneberg N, Fischer D.(1993). Osmotic regulation of rpoS-dependent genesin Escherichia coli. J Bacteriol 175: 259–265.
Hoson T, Kamisaka S, Masuda Y, Yamashita M, Buchen B.(1997). Evaluation of the three-dimensional clinostatas a simulator of weightlessness. Planta 203(Suppl):S187–S197.
Huang H, Claycamp HG. (1993). DNA excision repair as acomponent of adaptation to low doses of ionizingradiation in Escherichia coli. Int J Radiat Biol 64:613–619.
Hurst AC, Petrov E, Kloda A, Nguyen T, Hool L, MartinacB. (2008). MscS, the bacterial mechanosensitivechannel of small conductance. Int J Biochem Cell Biol40: 581–585.
Idaho State University (ISU) (2008). ‘Radioactivity innature’, ISU connection website (August 2008)http://www.physics.isu.edu/radinf/natural.htm#top.
Imlay JA. (2003). Pathways of oxidative damage. Annu RevMicrobiol 57: 395–418.
Julka S, Regnier F. (2004). Quantification in proteomicsthrough stable isotope coding: a review. J ProteomeRes 3: 350–363.
Klaus DM, Howard HN. (2006). Antibiotic efficacy andmicrobial virulence during space flight. Trends Bio-technol 24: 131–136.
Klaus D, Simske S, Todd P, Stodieck L. (1997). Investiga-tion of space flight effects on Escherichia coli and aproposed model of underlying physical mechanisms.Microbiology 143: 449–455.
Lee Y, Pena-Llopis S, Kang Y-S, Shin H-D, Demple B,Madsen EL et al. (2006). Expression analysis of the fpr(ferredoxin-NADP+ reductase) gene in Pseudomonasputida KT2440. Biochem Biophys Research Comm339: 1246–1254.
Lehmann Y, Meile L, Teuber M. (1996). Rubrerythrin fromClostridium perfringens: cloning of the gene, purifica-tion of the protein, and characterization of its super-oxide dismutase function. J Bacteriol 178: 7152–7158.
Leys N, Baatout S, Rosier C, Dams A, S’Heeren C, WattiezR et al. The response of Cupriavidus metalliduransCH34 to spaceflight in the international space station.Antonie Van Leeuwenhoek (in press).
Leys NM, Hendrickx L, De Boever P, Baatout S, MergeayM. (2004). Space flight effects on bacterial physiology.J Biol Regul Homeost Agents 18: 193–199.
Lumppio HL, Shenvi NV, Summers AO, Voordouw G,Kurtz Jr DM. (2001). Rubrerythrin and rubredoxinoxidoreductase in Desulfovibrio vulgaris: a noveloxidative stress protection system. J Bacteriol 183:101–108.
Mackenzie C, Eraso JM, Choudhary M, Roh JH, Zeng X,Bruscella P et al. (2007). Postgenomic adventures withRhodobacter sphaeroides. Annu Rev Microbiol 61:283–307.
Mergeay M, Nies D, Schlegel HG, Gerits J, Charles P, VanGijsegem F. (1985). Alcaligenes eutrophus CH34 is a
facultative chemolithotroph with plasmid-boundresistance to heavy metals. J Bacteriol 162: 328–334.
Mergeay M, Verstraete W, Dubertret G, Lefort-Tran M,Chipaux C, Binot RA ‘MELiSSA’—A micro-organisms-based model for ‘CELSS’ development. Proceedingsat the 3rd European Symposium on Space ThermalControl & Life Support Systems Noordwijk, TheNetherlands (1988) pp 65–68.
Mitaroff A, Silari M. (2002). The CERN-EU high-energyreference field (CERF) facility for dosimetry at com-mercial flight altitudes and in space. Radiat ProtDosimetry 102: 7–22.
Muller J, Walter F, van Dijl JM, Behnke D. (1992).Suppression of the growth and export defects of anEscherichia coli secA(Ts) mutant by a gene clonedfrom Bacillus subtilis. Mol Gen Genet 235: 89–96.
Nicholson WL, Munakata N, Horneck G, Melosh HJ,Setlow P. (2000). Resistance of Bacillus endosporesto extreme terrestrial and extraterrestrial environ-ments. Microbiol Mol Biol Rev 64: 548–572.
Nicholson WL, Schuerger AC, Setlow P. (2005). The solarUV environment and bacterial spore UV resistance:considerations for Earth-to-Mars transport by naturalprocesses and human spaceflight. Mutat Res 571:249–264.
Nickerson AC, Ott CM, Wilson JW, Ramamurthy R,Pierson DL. (2004). Microbial responses to micrograv-ity and other low-shear environments. Microbiol MolBiol Rev 68: 345–361.
Okamura Y, Takeyama H, Matsunaga T. (2001). Amagnetosome-specific GTPase from the magneticbacterium Magnetospirillum magneticum AMB-1.J Biol Chem 276: 48183–48188.
Palma M, DeLuca D, Worgall S, Quadri LE. (2004).Transcriptome analysis of the response of Pseudomo-nas aeruginosa to hydrogen peroxide. J Bacteriol 186:248–252.
Rea G, Esposito D, Damasso M, Serafini A, Margonelli A,Faraloni C et al. (2008). Ionizing radiation impactsphotochemical quantum yield and oxygen evolutionactivity of Photosystem II in photosynthetic micro-organisms. Int J Radiat Biol 84: 867–877.
Saegesser S, Ghosh R, Bachofen R. (1992). Stability ofbroad host range cloning vectors in the phototrophicbacterium Rhodospirillum rubrum. FEMS MicrobiolLett 95: 7–12.
Schmidt A, Kellermann J, Lottspeich F. (2005). A novelstrategy for quantitative proteomics using isotope-coded protein labels. Proteomics 5: 4–15.
Sistrom WR. (1960). A requirement for sodium in thegrowth medium of Rhodopseudomonas sphaeroides.J Gen Microbiol 22: 77–85.
Smirnova GV, Muzyka NG, Oktyabrsky ON. (2000). Therole of antioxidant enzymes in response of Escherichiacoli to osmotic upshift. FEMS Microbiol Lett 186:209–213.
Vallenet D, Labarre L, Rouy Z, Barbe V, Bocs S, CruveillerS et al. (2006). MaGe: a microbial genome annotationsystem supported by synteny results. Nucleic AcidsRes 34: 53–65.
Vanhavere F, Coeck M, Vermeersch F. (2001). Proceduresfor neutron scattering corrections in a calibrationfacility with a non-symmetric set-up. Radiat ProtDosimetry 93: 5–10.
Vanhavere F, Genicot JL, O’Sullivan D, Zhou D, Spurny F,Jadrnickova I et al. (2008). DOsimetry of BIologicalEXperiments in SPace (DOBIES) with luminescence
R. rubrum S1H response to space flightF Mastroleo et al
1418
The ISME Journal
(OSL and TL) and track etch detectors. Radiat Meas43: 694–697.
Vecerek B, Moll I, Afonyushkin T, Kaberdin V, Blasi U.(2003). Interaction of the RNA chaperone Hfq withmRNAs: direct and indirect roles of Hfq in ironmetabolism of Escherichia coli. Mol Microbiol 50:897–909.
Walther I, Pippia P, Meloni MA, Turrini F, Mannu F,Cogoli A. (1998). Simulated microgravity inhibits thegenetic expression of interleukin-2 and its receptor
in mitogen-activated T lymphocytes. FEBS Lett 436:115–118.
Wilson JW, Ott CM, Quick L, Davis R, zuBentrup KH, Crabbe A et al. (2008). Media ioncomposition controls regulatory and virulenceresponse of Salmonella in spaceflight. PLoS ONE 3:e3923.
Wood JM. (1999). Osmosensing by bacteria: signals andmembrane-based sensors. Microbiol Mol Biol Rev 63:230–262.
Supplementary Information accompanies the paper on The ISME Journal website (http://www.nature.com/ismej)
R. rubrum S1H response to space flightF Mastroleo et al
1419
The ISME Journal
Related Documents