Experimental characterization and modeling of energy dissipation in reinforced concrete beams subjected to cyclic loading R. Crambuer a,b , B. Richard a,⇑ , N. Ile a , F. Ragueneau b a CEA, DEN, DANS, DM2S, SEMT, Laboratoire d’Etude Mécanique Sismique, F-91191 Gif-sur-Yvette, France b LMT, ENS-Cachan, Univ P.&M. Curie/CNRS/PRES Universud Paris, 61 avenue du Président Wilson, F-94230 Cachan, France article info Article history: Received 9 February 2013 Revised 12 June 2013 Accepted 14 June 2013 Available online 17 July 2013 Keywords: Damping Three point bending tests Damage model Reinforced concrete Reverse cyclic loading abstract The way of modeling the damping phenomenon in nonlinear time history analysis is still an opened ques- tion and remains a motivating challenge in the scientific community. The well-known approach lies in considering non-physical viscous forces that are proportional to the velocity field. A damping matrix must be defined and its identification is not based on physical considerations. This study aims at explor- ing the possibility of identifying a local constitutive model in order to account for damping in a natural way. To reach this objective, an experimental campaign based on reinforced concrete beams subjected to reverse three-point bending tests is presented. These results allow identifying in an accurate way the hysteretic scheme used to take into account the hysteretic phenomenon. In particular, an ad hoc hyster- etic scheme is shown to be consistent in terms of energy dissipation. Numerical free vibration tests are then carried out in order to demonstrate that the use of a viscous damping can be avoided if the local constitutive concrete model accounting for hysteretic phenomenon is accurately identified. Ó 2013 Elsevier Ltd. All rights reserved. 1. Introduction When considering time excitation loading applied to a mechan- ical system, a damping phenomenon is observed. The way of mod- eling this damping phenomenon is still an open question and remains a motivating challenge in the scientific community. Now- adays, several sources of damping have been identified and related phenomena are recognized as contributing factors to the overall damping phenomenon. In the case of concrete or reinforced con- crete one can point out (i) the frictional sliding between the sur- faces of the crack, (ii) the bond at the steel/concrete interface that may induce residual displacements, (iii) the radiation damp- ing and (iv), the energy dissipation at connections or the dissipa- tion due to non-structural components. Classically, damping is modeled in a global and non-physical way by considering additional viscous forces in the momentum balance equation. A so-called viscous damping matrix accounting for several contributing phenomena, responsible for energy dissi- pation is introduced. Such a damping matrix is considered for example in the engineering practice, in a design context, to de- scribe the effects of highly dissipative phenomena such as cracking and other sources of energy dissipation. In such a case, linear or quasi-linear structural models are used to predict the time history response of a given structure. Typically 5% viscous damping ratio for concrete structures is considered to cover all sources of damp- ing up to member yielding, including concrete cracking. The most common linear viscous damping model is the Ray- leigh’s damping model [1] described in [2] which is a particular case from the Caughey series [3]: C ¼ aM þ bK ð1Þ where C is the damping matrix, a and b are scalar parameters iden- tified from the two first modal frequencies, M is the mass matrix and K is the stiffness matrix. This damping model is directly propor- tional to the mass and to the original stiffness of the structure. A rheological interpretation of this type of damping is presented in Fig. 1a. A damping matrix of the form presented in (1) is also largely used in nonlinear time history analysis. Recent works [4–8], have demonstrated that the use of a viscous damping model, in the frame of nonlinear time history analysis, often leads to inaccurate estimations of displacement and internal forces in the structure. In such analysis, several improvements can however be applied to the well-known Rayleigh’s damping. The most common is to re- place the initial stiffness by the tangent stiffness [9–11]. This ap- proach allows taking into account the damping evolution as a function of the damage state of the structure. It gives better results 0141-0296/$ - see front matter Ó 2013 Elsevier Ltd. All rights reserved. http://dx.doi.org/10.1016/j.engstruct.2013.06.024 ⇑ Corresponding author. Tel.: +33 169087674. E-mail address: [email protected] (B. Richard). Engineering Structures 56 (2013) 919–934 Contents lists available at SciVerse ScienceDirect Engineering Structures journal homepage: www.elsevier.com/locate/engstruct Author's Personal Copy

Welcome message from author
This document is posted to help you gain knowledge. Please leave a comment to let me know what you think about it! Share it to your friends and learn new things together.
Transcript
Engineering Structures 56 (2013) 919–934
Author's Personal Copy
Contents lists available at SciVerse ScienceDirect
Engineering Structures
journal homepage: www.elsevier .com/ locate /engstruct
Experimental characterization and modeling of energy dissipationin reinforced concrete beams subjected to cyclic loading
0141-0296/$ - see front matter � 2013 Elsevier Ltd. All rights reserved.http://dx.doi.org/10.1016/j.engstruct.2013.06.024
⇑ Corresponding author. Tel.: +33 169087674.E-mail address: [email protected] (B. Richard).
R. Crambuer a,b, B. Richard a,⇑, N. Ile a, F. Ragueneau b
a CEA, DEN, DANS, DM2S, SEMT, Laboratoire d’Etude Mécanique Sismique, F-91191 Gif-sur-Yvette, Franceb LMT, ENS-Cachan, Univ P.&M. Curie/CNRS/PRES Universud Paris, 61 avenue du Président Wilson, F-94230 Cachan, France
a r t i c l e i n f o a b s t r a c t
Article history:Received 9 February 2013Revised 12 June 2013Accepted 14 June 2013Available online 17 July 2013
Keywords:DampingThree point bending testsDamage modelReinforced concreteReverse cyclic loading
The way of modeling the damping phenomenon in nonlinear time history analysis is still an opened ques-tion and remains a motivating challenge in the scientific community. The well-known approach lies inconsidering non-physical viscous forces that are proportional to the velocity field. A damping matrixmust be defined and its identification is not based on physical considerations. This study aims at explor-ing the possibility of identifying a local constitutive model in order to account for damping in a naturalway. To reach this objective, an experimental campaign based on reinforced concrete beams subjected toreverse three-point bending tests is presented. These results allow identifying in an accurate way thehysteretic scheme used to take into account the hysteretic phenomenon. In particular, an ad hoc hyster-etic scheme is shown to be consistent in terms of energy dissipation. Numerical free vibration tests arethen carried out in order to demonstrate that the use of a viscous damping can be avoided if the localconstitutive concrete model accounting for hysteretic phenomenon is accurately identified.
� 2013 Elsevier Ltd. All rights reserved.
1. Introduction
When considering time excitation loading applied to a mechan-ical system, a damping phenomenon is observed. The way of mod-eling this damping phenomenon is still an open question andremains a motivating challenge in the scientific community. Now-adays, several sources of damping have been identified and relatedphenomena are recognized as contributing factors to the overalldamping phenomenon. In the case of concrete or reinforced con-crete one can point out (i) the frictional sliding between the sur-faces of the crack, (ii) the bond at the steel/concrete interfacethat may induce residual displacements, (iii) the radiation damp-ing and (iv), the energy dissipation at connections or the dissipa-tion due to non-structural components.
Classically, damping is modeled in a global and non-physicalway by considering additional viscous forces in the momentumbalance equation. A so-called viscous damping matrix accountingfor several contributing phenomena, responsible for energy dissi-pation is introduced. Such a damping matrix is considered forexample in the engineering practice, in a design context, to de-scribe the effects of highly dissipative phenomena such as crackingand other sources of energy dissipation. In such a case, linear or
quasi-linear structural models are used to predict the time historyresponse of a given structure. Typically 5% viscous damping ratiofor concrete structures is considered to cover all sources of damp-ing up to member yielding, including concrete cracking.
The most common linear viscous damping model is the Ray-leigh’s damping model [1] described in [2] which is a particularcase from the Caughey series [3]:
C ¼ aM þ bK ð1Þ
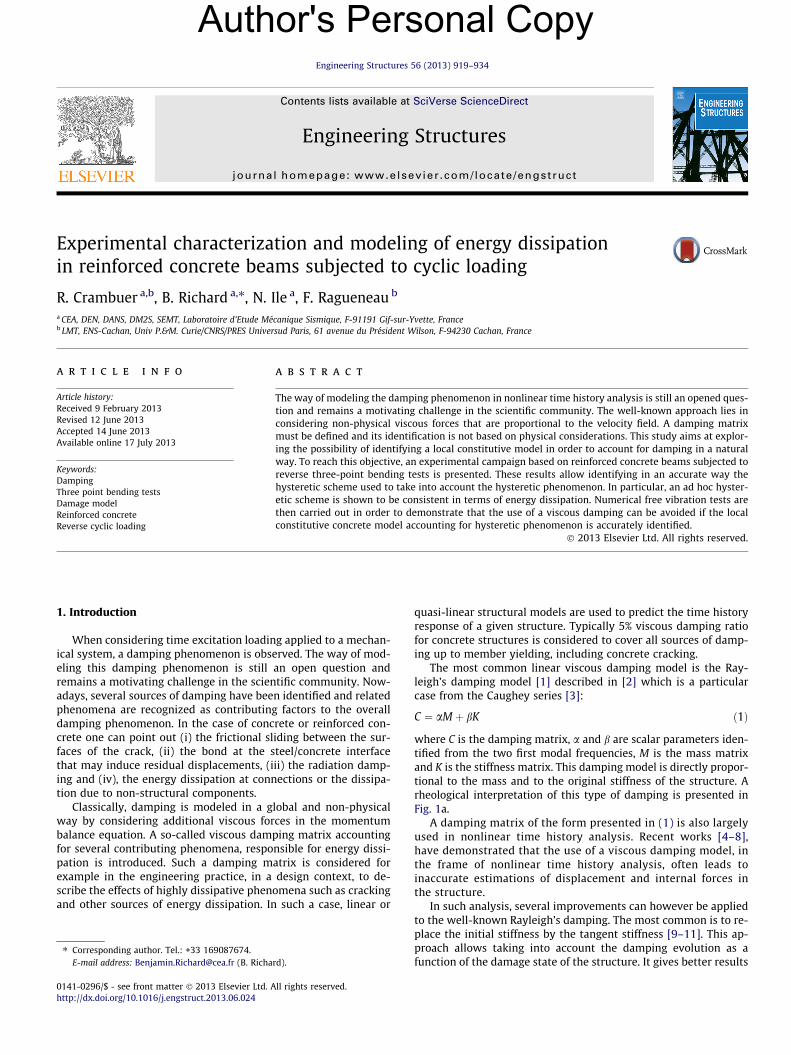
where C is the damping matrix, a and b are scalar parameters iden-tified from the two first modal frequencies, M is the mass matrixand K is the stiffness matrix. This damping model is directly propor-tional to the mass and to the original stiffness of the structure. Arheological interpretation of this type of damping is presented inFig. 1a.
A damping matrix of the form presented in (1) is also largelyused in nonlinear time history analysis. Recent works [4–8],have demonstrated that the use of a viscous damping model, inthe frame of nonlinear time history analysis, often leads toinaccurate estimations of displacement and internal forces inthe structure.
In such analysis, several improvements can however be appliedto the well-known Rayleigh’s damping. The most common is to re-place the initial stiffness by the tangent stiffness [9–11]. This ap-proach allows taking into account the damping evolution as afunction of the damage state of the structure. It gives better results
Nomenclature
English alphabetC damping matrixD1 scalar tension damage variableD2 scalar compression damage variableE Young modulusE0 initial Young modulusG1(z1) hardening function for concrete in tensionG2(z2) hardening function for concrete in compressionH consolidation functionK stiffness matrixM mass matrixR consolidation function for steelR0 control the transition from elastic to plastic branchesY energy rate released for damage activationY1 energy rate released for damage in tension activationY2 energy rate released for damage in compression activa-
tionY0 initial threshold for damage activationY01 initial threshold for tension activationY02 initial threshold for compression activationZ thermodynamics force associated with damageZ1 thermodynamics force associated with damage in ten-
sionZ2 thermodynamics force associated with damage in com-
pressionaR plastic hardening modulus 1b strain-hardening ratiobR plastic hardening modulus 2d scalar damage variableEc experimental concrete Young modulusEs experimental steel Young modulusfcm concrete compressive strengthftm concrete tensile strengthfu steel ultimate strengthfy steel yielding strengthkeff effective stiffnessp cumulative plastic strainu(x) axial displacement
m(x) transverse displacementz isotropic hardening variable
Greek alphabeta mass coefficient for damping matrixb stiffness coefficient for damping matrixb1 coefficient related to the tension inelastic strainsb2 coefficient related to the compression inelastic strainsc kinematic hardening modulus 1e strainep permanent strainep internal sliding straineu ultimate strainexx normal local strainexy shear local strainey yield straing closure variableh(x) rotationk load ratioks maximum load ratio of a blockt Poisson’s rationeq equivalent damping ratiow Helmotz free energyq material density. kinematic hardening modulus 2r stressr+ positive part of the stressr� negative part of the stressrc compressive strengthrf mean closure stressry yield stressru ultimate stressv Gibbs free enthalpy
AcronymB500B steel class according to eurocodeC30/37 concrete class according to eurocode
920 R. Crambuer et al. / Engineering Structures 56 (2013) 919–934
Author's Personal Copy
in the low frequency range but problems remain in high frequencyregion, as one can notice in Fig. 1b. Another approach lies in updat-ing the coefficients a and b. This method produces damping ratiosthat are close to the experimental ones. However it needs torecompute the modal frequencies at each computational stepwhich is not practical [12].
From the above discussion, it is clear that modeling the damp-ing phenomenon properly is still nowadays not an easy task. Thisstudy aims at exploring the possibility to identify better local
Fig. 1. (a) Physical interpretation of the Rayleigh’s dampi
constitutive models in order to account for damping in a naturalway, leading to a drastic reduction of the viscous damping matrixcontribution. In fact, the choice of the laws used to model thedamping mechanisms will have a great influence on the resultsof the numerical analysis. A key point is that the concrete constitu-tive law accounts for hysteretic phenomena. Nevertheless, the hys-teretic scheme needs to be identified properly. To do so, anexperimental campaign has been carried out in order to acquireappropriate experimental data related to energy dissipation in RC
ng and (b) Rayleigh’s damping ratio/frequency curve.
R. Crambuer et al. / Engineering Structures 56 (2013) 919–934 921
Author's Personal Copy
structural elements. This campaign is based on reverse cyclic threepoints bending loading applied to RC beams. The experimental re-sults are post-processed in an original way, helping to better iden-tify local hysteretic schemes to be used in nonlinear constitutivelaws. The identified model is validated at the structural scale andused to carry out a numerical campaign that consists in free vibra-tion tests. The influence of several hysteretic schemes is studiedand discussed, leading to some conclusions and proposals to im-prove damping identification and modeling in reinforced concretestructures.
This paper is outlined as follows. In Section 2, the experimentalsetup is exposed. A particular attention is paid to the presentationof the different types of applied loads. Then, the results of the cyclicthree point bending tests are presented and discussed in order topoint out the mechanisms that appear during the tests. Based onJacobsen’s technique [13] and according to Varum [14], an equiva-lent viscous damping ratio is determined for each stabilized cycle.The aim of this analysis is to provide meaningful quantities thatwill be used to identify hysteretic schemes. In Section 3, a numer-ical analysis is presented. The constitutive concrete model is ex-posed. Formulated within the theoretical framework of theirreversible thermodynamic processes, the first and second ther-modynamic principles are fulfilled. This major feature providesthe physical consistency of the constitutive law. Then, experimen-tal/numerical comparisons are presented and discussed. In partic-ular, the influence of the cracking process on the damping ratio ispointed out. Finally, a numerical campaign based on free vibrationtests is conducted, highlighting the fact that the damping matrixcan be drastically decreased when using such a refined constitutivemodel.
2. Experimental campaign
2.1. Experimental setup
2.1.1. Aim and scopeIn order to better understand and to identify the local mecha-
nisms responsible for energy dissipation that contribute to thedamping phenomenon, specific experimental data are needed.Very interesting experimental campaigns which were carried outin the past decades, focused on RC structures. Most of the testsconsisted on hammer shock tests [15–17]. Four point bending testswere performed on RC beams in order to achieve different damagelevels [18]. Then, for each damage level, hammer shocks tests wereperformed on several points. Although these results were a first at-tempt to link the modal characteristics with the overall damage le-vel, hammer shock data suffer from a high dispersion. Another wayof studying energy dissipation is to realize cyclic loading tests onRC structure and to quantify the hysteretic damping of each cycle.In that framework, some campaign have been performed on RC
Table 1Specimen specifications and loading characteristics.
Series Beam Ec (MPa)/coefficientof variation (%)
fcm (MPa)/coefficienof variation (%)
1 HA8-L1 26,500/0.9 32/0.6HA8-L2
2 HA10-L1 28,000/3.5 34/2.5HA10-L2
3 HA12-L1 29,000/5.2 38/12.3HA12-L2
Ec – concrete Young modulus.fcm – concrete compressive strength.ftm – concrete tensile strength.
beams and columns with a load applied at the top [19,20] or atthe midspan [21] of the specimen. In all of these tests a cyclic dis-placement-controlled load was applied in a monotonic way. Basedon that state-of-the-art review, it appears that (i) cyclic loadingtests are able to quantify the energy dissipation in RC structuresand that (ii) initially damaged structural components have neverbeen deeply investigated. Note that in the case of earthquake load-ing, the energy dissipation of damaged components is of primaryimportance, in particular when considering the possible occur-rence of an after-shock after a main shock. The aim of this experi-mental campaign is to bring some additional data to fill the lacksidentified in the literature regarding the energy dissipation of dam-aged RC components. In this experimental campaign, the behaviorof non-damaged RC components is compared with the behavior ofdamaged ones. In this way, the local mechanisms responsible forenergy dissipation that contribute to the damping phenomenoncan be accurately identified and quantified.
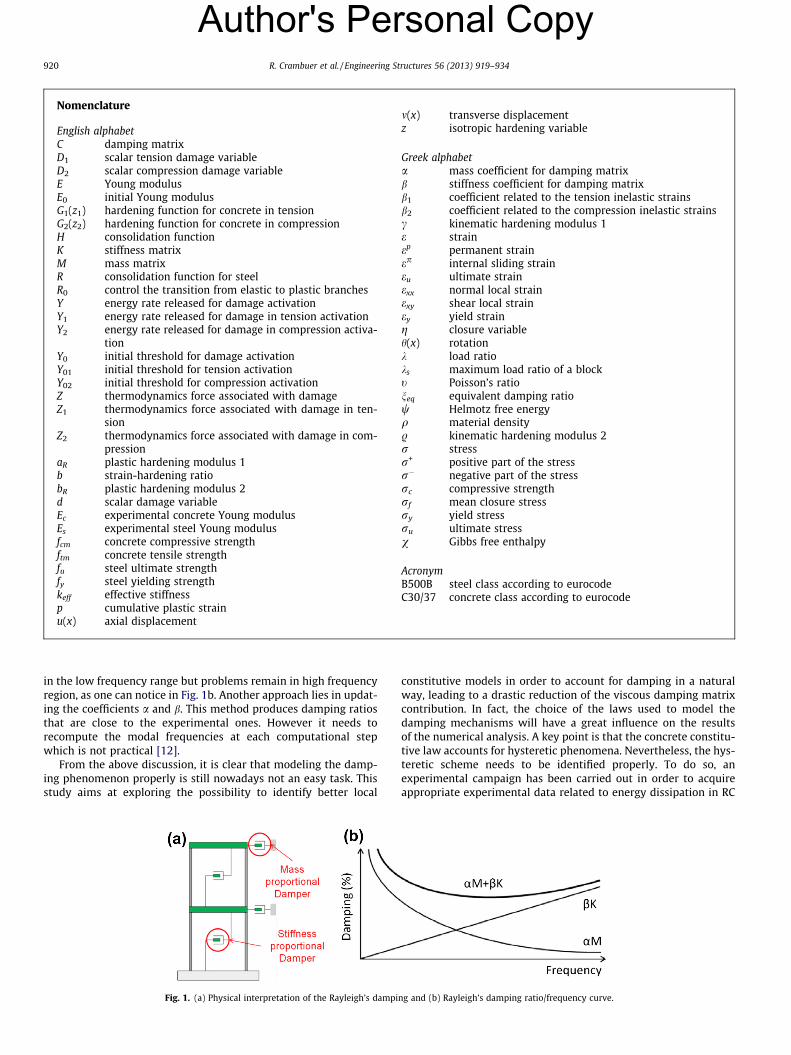
2.1.2. RC specimenSix rectangular RC beams are tested with different longitudinal
reinforcement steel ratios that are presented in Table 1. They aresubjected to cyclic loading that follows two different loading paths[22]. The specimens are 1.65 m length, 0.22 m high and 0.15 mlarge. The reinforcement details are presented in Fig. 2.
2.1.3. Material propertiesThe concrete used is a regular one C30/37. The average concrete
compressive and tensile strengths obtained on samples, accordingto standard NF EN 12390-3 and NF EN 12390-6 [23], are summa-rized in Table 1.The reinforcing steel bars are B500B type, theyare characterized in Table 2.
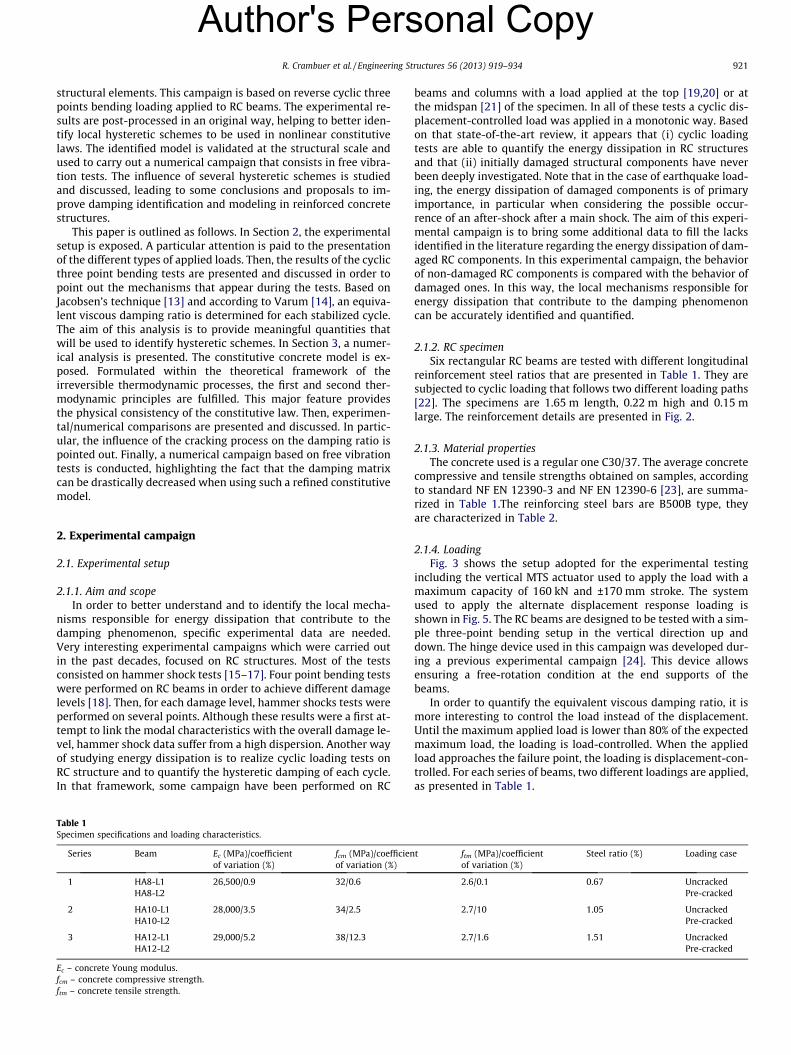
2.1.4. LoadingFig. 3 shows the setup adopted for the experimental testing
including the vertical MTS actuator used to apply the load with amaximum capacity of 160 kN and ±170 mm stroke. The systemused to apply the alternate displacement response loading isshown in Fig. 5. The RC beams are designed to be tested with a sim-ple three-point bending setup in the vertical direction up anddown. The hinge device used in this campaign was developed dur-ing a previous experimental campaign [24]. This device allowsensuring a free-rotation condition at the end supports of thebeams.
In order to quantify the equivalent viscous damping ratio, it ismore interesting to control the load instead of the displacement.Until the maximum applied load is lower than 80% of the expectedmaximum load, the loading is load-controlled. When the appliedload approaches the failure point, the loading is displacement-con-trolled. For each series of beams, two different loadings are applied,as presented in Table 1.
t ftm (MPa)/coefficientof variation (%)
Steel ratio (%) Loading case
2.6/0.1 0.67 UncrackedPre-cracked
2.7/10 1.05 UncrackedPre-cracked
2.7/1.6 1.51 UncrackedPre-cracked
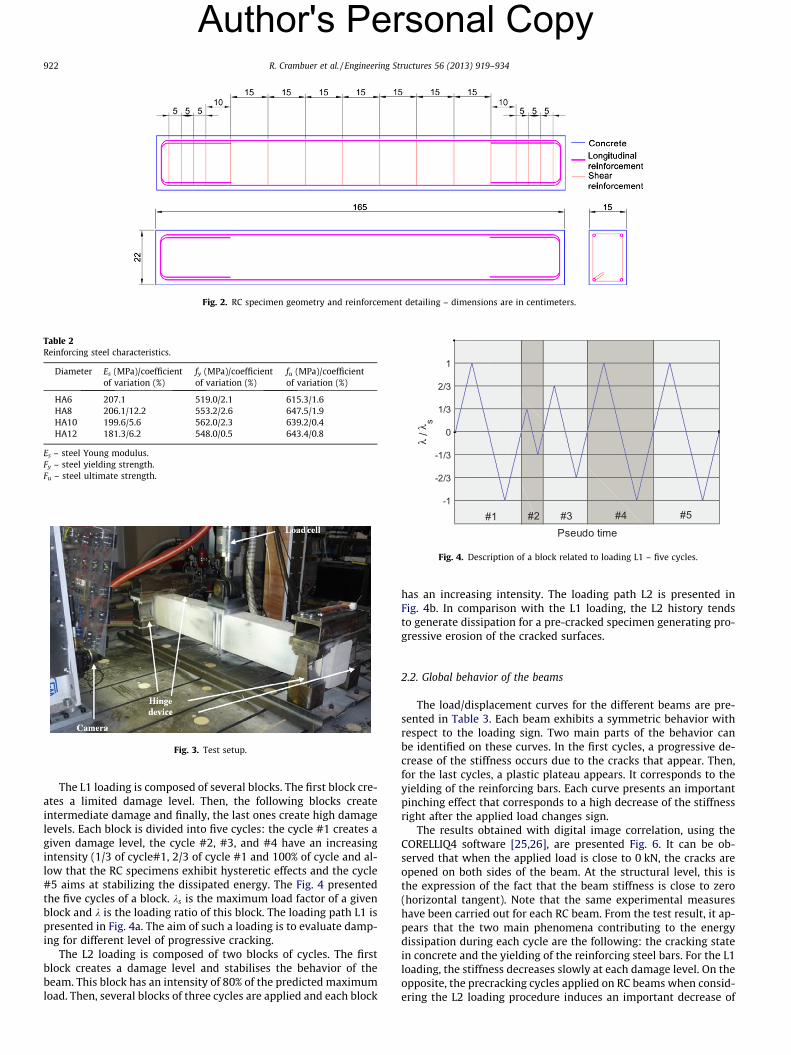
Fig. 3. Test setup.
Pseudo time
λ / λ
s
-1
-2/3
-1/3
0
1/3
2/3
1
#3 #4 #5#2#1
Fig. 4. Description of a block related to loading L1 – five cycles.
Fig. 2. RC specimen geometry and reinforcement detailing – dimensions are in centimeters.
Table 2Reinforcing steel characteristics.
Diameter Es (MPa)/coefficientof variation (%)
fy (MPa)/coefficientof variation (%)
fu (MPa)/coefficientof variation (%)
HA6 207.1 519.0/2.1 615.3/1.6HA8 206.1/12.2 553.2/2.6 647.5/1.9HA10 199.6/5.6 562.0/2.3 639.2/0.4HA12 181.3/6.2 548.0/0.5 643.4/0.8
Es – steel Young modulus.Fy – steel yielding strength.Fu – steel ultimate strength.
922 R. Crambuer et al. / Engineering Structures 56 (2013) 919–934
Author's Personal Copy
The L1 loading is composed of several blocks. The first block cre-ates a limited damage level. Then, the following blocks createintermediate damage and finally, the last ones create high damagelevels. Each block is divided into five cycles: the cycle #1 creates agiven damage level, the cycle #2, #3, and #4 have an increasingintensity (1/3 of cycle#1, 2/3 of cycle #1 and 100% of cycle and al-low that the RC specimens exhibit hysteretic effects and the cycle#5 aims at stabilizing the dissipated energy. The Fig. 4 presentedthe five cycles of a block. ks is the maximum load factor of a givenblock and k is the loading ratio of this block. The loading path L1 ispresented in Fig. 4a. The aim of such a loading is to evaluate damp-ing for different level of progressive cracking.
The L2 loading is composed of two blocks of cycles. The firstblock creates a damage level and stabilises the behavior of thebeam. This block has an intensity of 80% of the predicted maximumload. Then, several blocks of three cycles are applied and each block
has an increasing intensity. The loading path L2 is presented inFig. 4b. In comparison with the L1 loading, the L2 history tendsto generate dissipation for a pre-cracked specimen generating pro-gressive erosion of the cracked surfaces.
2.2. Global behavior of the beams
The load/displacement curves for the different beams are pre-sented in Table 3. Each beam exhibits a symmetric behavior withrespect to the loading sign. Two main parts of the behavior canbe identified on these curves. In the first cycles, a progressive de-crease of the stiffness occurs due to the cracks that appear. Then,for the last cycles, a plastic plateau appears. It corresponds to theyielding of the reinforcing bars. Each curve presents an importantpinching effect that corresponds to a high decrease of the stiffnessright after the applied load changes sign.
The results obtained with digital image correlation, using theCORELLIQ4 software [25,26], are presented Fig. 6. It can be ob-served that when the applied load is close to 0 kN, the cracks areopened on both sides of the beam. At the structural level, this isthe expression of the fact that the beam stiffness is close to zero(horizontal tangent). Note that the same experimental measureshave been carried out for each RC beam. From the test result, it ap-pears that the two main phenomena contributing to the energydissipation during each cycle are the following: the cracking statein concrete and the yielding of the reinforcing steel bars. For the L1loading, the stiffness decreases slowly at each damage level. On theopposite, the precracking cycles applied on RC beams when consid-ering the L2 loading procedure induces an important decrease of
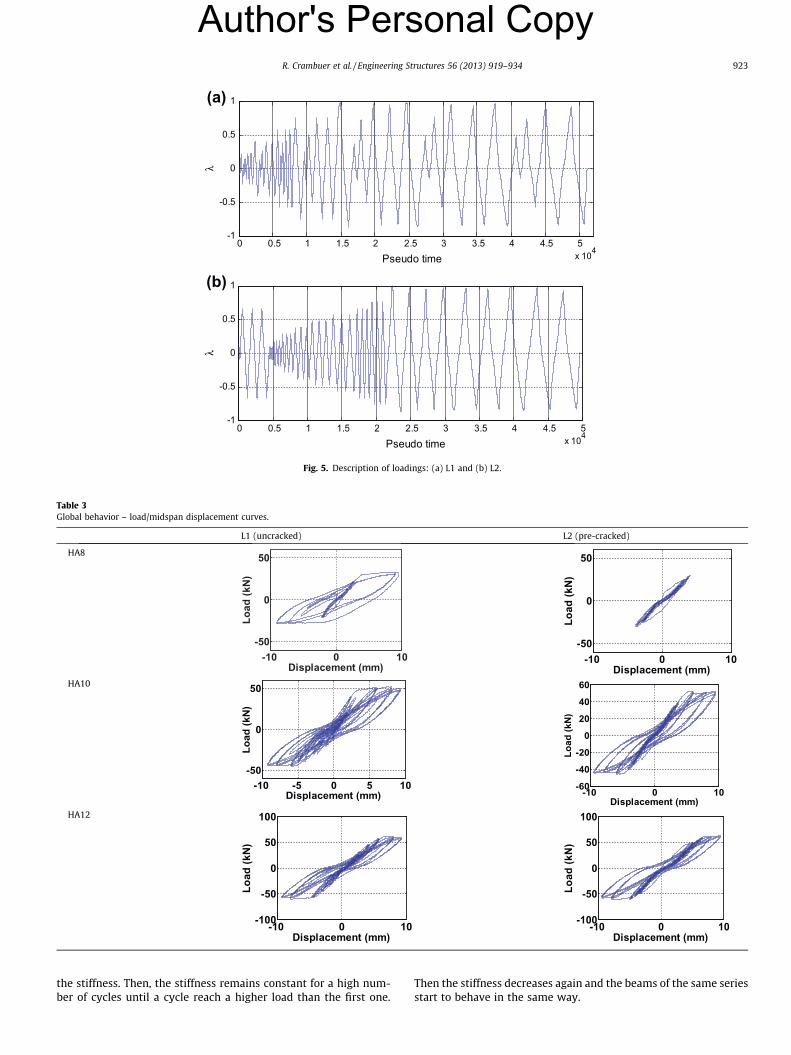
Table 3Global behavior – load/midspan displacement curves.
L1 (uncracked) L2 (pre-cracked)
HA8
-10 0 10-50
0
50
Displacement (mm)
Load
(kN
)
-10 0 10-50
0
50
Displacement (mm)
Load
(kN
)
HA10
-10 -5 0 5 10-50
0
50
Displacement (mm)
Load
(kN
)
-10 0 10-60
-40
-20
0
20
40
60
Displacement (mm)
Load
(kN
)
HA12
-10 0 10-100
-50
0
50
100
Displacement (mm)
Load
(kN
)
-10 0 10-100
-50
0
50
100
Displacement (mm)
Load
(kN
)
(a)
0 0.5 1 1.5 2 2.5 3 3.5 4 4.5 5x 10⁴
-1
-0.5
0
0.5
1
Pseudo time
λ
(b)
0 0.5 1 1.5 2 2.5 3 3.5 4 4.5 5x 10⁴
-1
-0.5
0
0.5
1
Pseudo time
λ
Fig. 5. Description of loadings: (a) L1 and (b) L2.
R. Crambuer et al. / Engineering Structures 56 (2013) 919–934 923
Author's Personal Copy
the stiffness. Then, the stiffness remains constant for a high num-ber of cycles until a cycle reach a higher load than the first one.
Then the stiffness decreases again and the beams of the same seriesstart to behave in the same way.
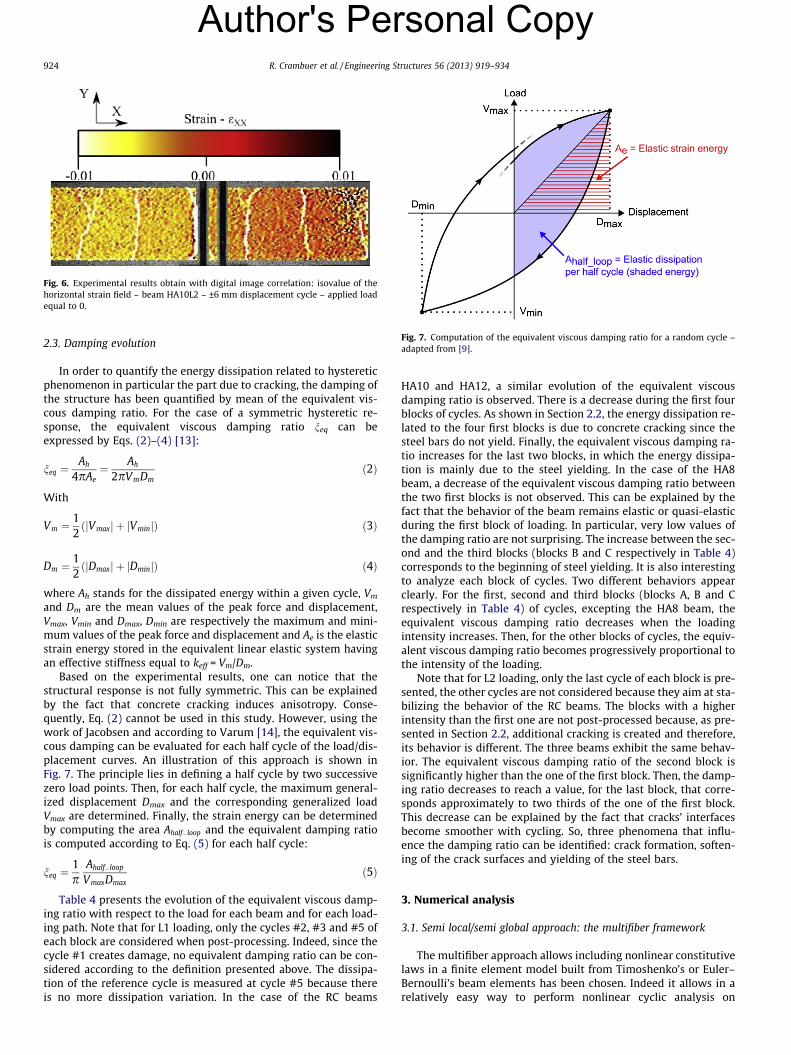
Fig. 7. Computation of the equivalent viscous damping ratio for a random cycle –adapted from [9].
Fig. 6. Experimental results obtain with digital image correlation: isovalue of thehorizontal strain field – beam HA10L2 – ±6 mm displacement cycle – applied loadequal to 0.
924 R. Crambuer et al. / Engineering Structures 56 (2013) 919–934
Author's Personal Copy
2.3. Damping evolution
In order to quantify the energy dissipation related to hystereticphenomenon in particular the part due to cracking, the damping ofthe structure has been quantified by mean of the equivalent vis-cous damping ratio. For the case of a symmetric hysteretic re-sponse, the equivalent viscous damping ratio neq can beexpressed by Eqs. (2)–(4) [13]:
neq ¼Ah
4pAe¼ Ah
2pVmDmð2Þ
With
Vm ¼12ðjVmaxj þ jVminjÞ ð3Þ
Dm ¼12ðjDmaxj þ jDminjÞ ð4Þ
where Ah stands for the dissipated energy within a given cycle, Vm
and Dm are the mean values of the peak force and displacement,Vmax, Vmin and Dmax, Dmin are respectively the maximum and mini-mum values of the peak force and displacement and Ae is the elasticstrain energy stored in the equivalent linear elastic system havingan effective stiffness equal to keff = Vm/Dm.
Based on the experimental results, one can notice that thestructural response is not fully symmetric. This can be explainedby the fact that concrete cracking induces anisotropy. Conse-quently, Eq. (2) cannot be used in this study. However, using thework of Jacobsen and according to Varum [14], the equivalent vis-cous damping can be evaluated for each half cycle of the load/dis-placement curves. An illustration of this approach is shown inFig. 7. The principle lies in defining a half cycle by two successivezero load points. Then, for each half cycle, the maximum general-ized displacement Dmax and the corresponding generalized loadVmax are determined. Finally, the strain energy can be determinedby computing the area Ahalf� loop and the equivalent damping ratiois computed according to Eq. (5) for each half cycle:
neq ¼1p
Ahalf� loop
VmaxDmaxð5Þ
Table 4 presents the evolution of the equivalent viscous damp-ing ratio with respect to the load for each beam and for each load-ing path. Note that for L1 loading, only the cycles #2, #3 and #5 ofeach block are considered when post-processing. Indeed, since thecycle #1 creates damage, no equivalent damping ratio can be con-sidered according to the definition presented above. The dissipa-tion of the reference cycle is measured at cycle #5 because thereis no more dissipation variation. In the case of the RC beams
HA10 and HA12, a similar evolution of the equivalent viscousdamping ratio is observed. There is a decrease during the first fourblocks of cycles. As shown in Section 2.2, the energy dissipation re-lated to the four first blocks is due to concrete cracking since thesteel bars do not yield. Finally, the equivalent viscous damping ra-tio increases for the last two blocks, in which the energy dissipa-tion is mainly due to the steel yielding. In the case of the HA8beam, a decrease of the equivalent viscous damping ratio betweenthe two first blocks is not observed. This can be explained by thefact that the behavior of the beam remains elastic or quasi-elasticduring the first block of loading. In particular, very low values ofthe damping ratio are not surprising. The increase between the sec-ond and the third blocks (blocks B and C respectively in Table 4)corresponds to the beginning of steel yielding. It is also interestingto analyze each block of cycles. Two different behaviors appearclearly. For the first, second and third blocks (blocks A, B and Crespectively in Table 4) of cycles, excepting the HA8 beam, theequivalent viscous damping ratio decreases when the loadingintensity increases. Then, for the other blocks of cycles, the equiv-alent viscous damping ratio becomes progressively proportional tothe intensity of the loading.
Note that for L2 loading, only the last cycle of each block is pre-sented, the other cycles are not considered because they aim at sta-bilizing the behavior of the RC beams. The blocks with a higherintensity than the first one are not post-processed because, as pre-sented in Section 2.2, additional cracking is created and therefore,its behavior is different. The three beams exhibit the same behav-ior. The equivalent viscous damping ratio of the second block issignificantly higher than the one of the first block. Then, the damp-ing ratio decreases to reach a value, for the last block, that corre-sponds approximately to two thirds of the one of the first block.This decrease can be explained by the fact that cracks’ interfacesbecome smoother with cycling. So, three phenomena that influ-ence the damping ratio can be identified: crack formation, soften-ing of the crack surfaces and yielding of the steel bars.
3. Numerical analysis
3.1. Semi local/semi global approach: the multifiber framework
The multifiber approach allows including nonlinear constitutivelaws in a finite element model built from Timoshenko’s or Euler–Bernoulli’s beam elements has been chosen. Indeed it allows in arelatively easy way to perform nonlinear cyclic analysis on
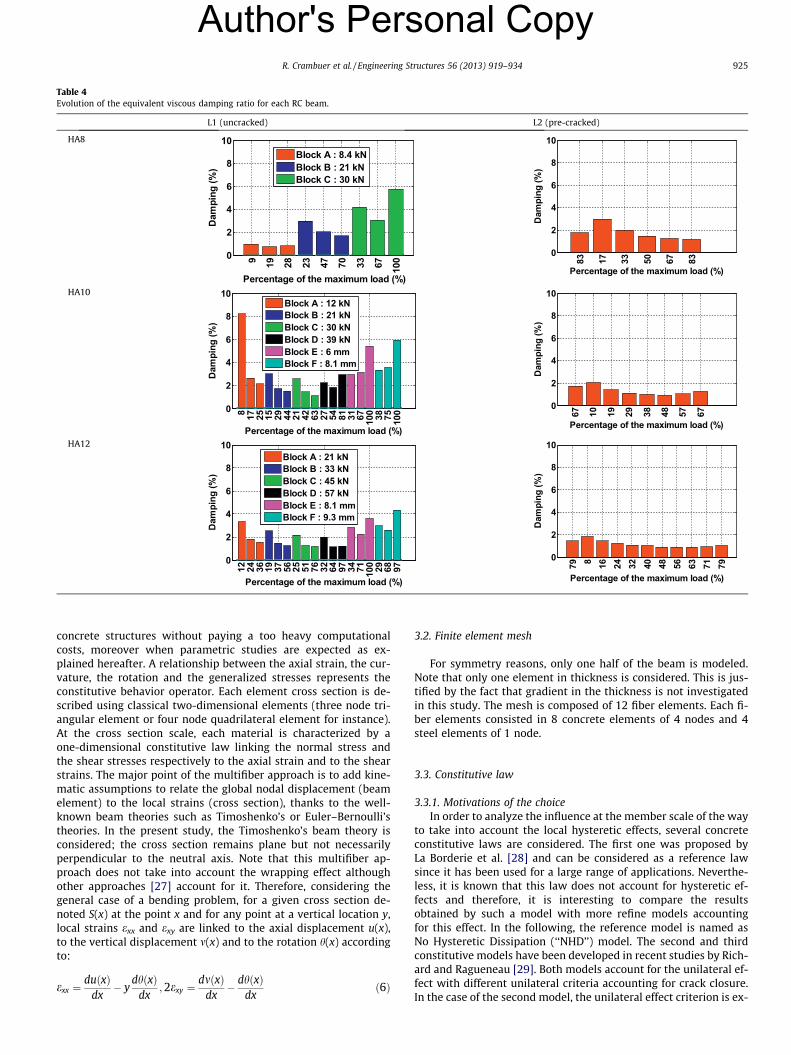
Table 4Evolution of the equivalent viscous damping ratio for each RC beam.
L1 (uncracked) L2 (pre-cracked)
HA8
0
2
4
6
8
10
Percentage of the maximum load (%)
Dam
ping
(%)
9 19 28 23 47 70 33 67 100
Block A : 8.4 kNBlock B : 21 kNBlock C : 30 kN
0
2
4
6
8
10
Percentage of the maximum load (%)
Dam
ping
(%)
83 17 33 50 67 83
HA10
0
2
4
6
8
10
Percentage of the maximum load (%)
Dam
ping
(%)
8 17 25 15 29 44 21 42 63 27 54 81 31 67 100 38 75 100
Block A : 12 kNBlock B : 21 kNBlock C : 30 kNBlock D : 39 kNBlock E : 6 mmBlock F : 8.1 mm
0
2
4
6
8
10
Percentage of the maximum load (%)
Dam
ping
(%)
67 10 19 29 38 48 57 67
HA12
0
2
4
6
8
10
Percentage of the maximum load (%)
Dam
ping
(%)
12 24 36 19 37 56 25 51 76 32 64 97 34 71 100 29 68 97
Block A : 21 kNBlock B : 33 kNBlock C : 45 kNBlock D : 57 kNBlock E : 8.1 mmBlock F : 9.3 mm
0
2
4
6
8
10
Percentage of the maximum load (%)
Dam
ping
(%)
79 8 16 24 32 40 48 56 63 71 79
R. Crambuer et al. / Engineering Structures 56 (2013) 919–934 925
Author's Personal Copy
concrete structures without paying a too heavy computationalcosts, moreover when parametric studies are expected as ex-plained hereafter. A relationship between the axial strain, the cur-vature, the rotation and the generalized stresses represents theconstitutive behavior operator. Each element cross section is de-scribed using classical two-dimensional elements (three node tri-angular element or four node quadrilateral element for instance).At the cross section scale, each material is characterized by aone-dimensional constitutive law linking the normal stress andthe shear stresses respectively to the axial strain and to the shearstrains. The major point of the multifiber approach is to add kine-matic assumptions to relate the global nodal displacement (beamelement) to the local strains (cross section), thanks to the well-known beam theories such as Timoshenko’s or Euler–Bernoulli’stheories. In the present study, the Timoshenko’s beam theory isconsidered; the cross section remains plane but not necessarilyperpendicular to the neutral axis. Note that this multifiber ap-proach does not take into account the wrapping effect althoughother approaches [27] account for it. Therefore, considering thegeneral case of a bending problem, for a given cross section de-noted S(x) at the point x and for any point at a vertical location y,local strains exx and exy are linked to the axial displacement u(x),to the vertical displacement m(x) and to the rotation h(x) accordingto:
exx ¼duðxÞ
dx� y
dhðxÞdx
;2exy ¼dmðxÞ
dx� dhðxÞ
dxð6Þ
3.2. Finite element mesh
For symmetry reasons, only one half of the beam is modeled.Note that only one element in thickness is considered. This is jus-tified by the fact that gradient in the thickness is not investigatedin this study. The mesh is composed of 12 fiber elements. Each fi-ber elements consisted in 8 concrete elements of 4 nodes and 4steel elements of 1 node.
3.3. Constitutive law
3.3.1. Motivations of the choiceIn order to analyze the influence at the member scale of the way
to take into account the local hysteretic effects, several concreteconstitutive laws are considered. The first one was proposed byLa Borderie et al. [28] and can be considered as a reference lawsince it has been used for a large range of applications. Neverthe-less, it is known that this law does not account for hysteretic ef-fects and therefore, it is interesting to compare the resultsobtained by such a model with more refine models accountingfor this effect. In the following, the reference model is named asNo Hysteretic Dissipation (‘‘NHD’’) model. The second and thirdconstitutive models have been developed in recent studies by Rich-ard and Ragueneau [29]. Both models account for the unilateral ef-fect with different unilateral criteria accounting for crack closure.In the case of the second model, the unilateral effect criterion is ex-
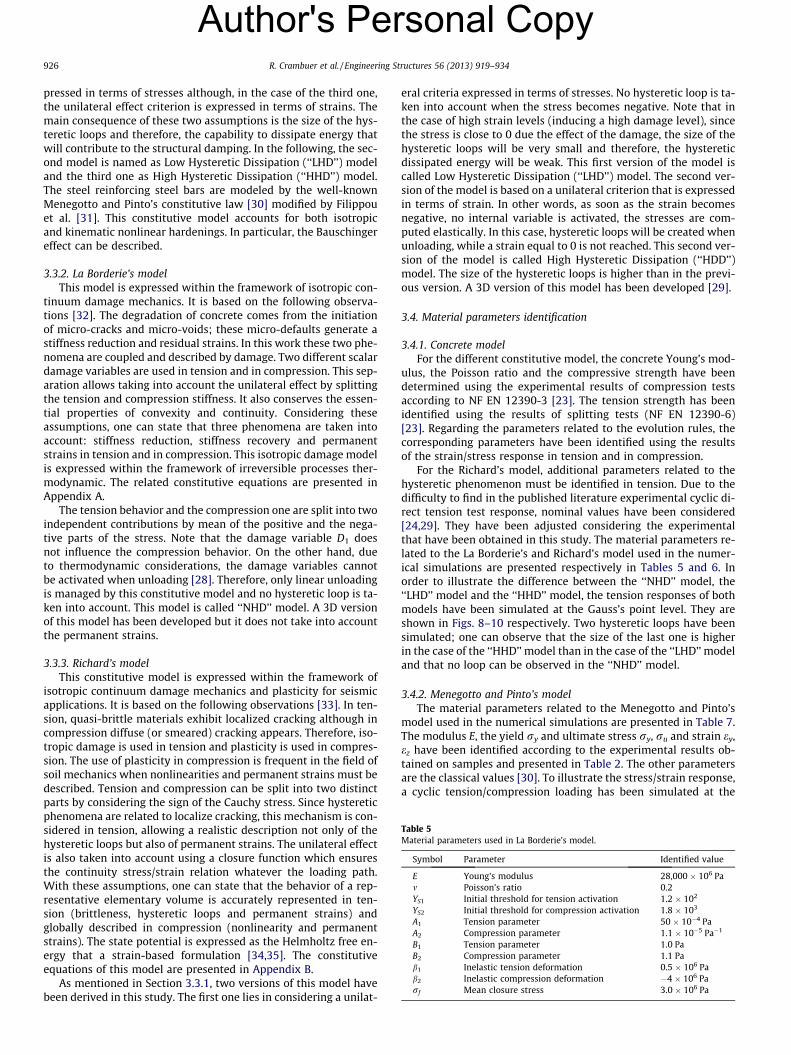
Table 5Material parameters used in La Borderie’s model.
Symbol Parameter Identified value
E Young’s modulus 28,000 � 106 Pam Poisson’s ratio 0.2YS1 Initial threshold for tension activation 1.2 � 102
YS2 Initial threshold for compression activation 1.8 � 103
A1 Tension parameter 50 � 10�4 PaA2 Compression parameter 1.1 � 10�5 Pa�1
B1 Tension parameter 1.0 PaB2 Compression parameter 1.1 Pab1 Inelastic tension deformation 0.5 � 106 Pab2 Inelastic compression deformation �4 � 106 Parf Mean closure stress 3.0 � 106 Pa
926 R. Crambuer et al. / Engineering Structures 56 (2013) 919–934
Author's Personal Copy
pressed in terms of stresses although, in the case of the third one,the unilateral effect criterion is expressed in terms of strains. Themain consequence of these two assumptions is the size of the hys-teretic loops and therefore, the capability to dissipate energy thatwill contribute to the structural damping. In the following, the sec-ond model is named as Low Hysteretic Dissipation (‘‘LHD’’) modeland the third one as High Hysteretic Dissipation (‘‘HHD’’) model.The steel reinforcing steel bars are modeled by the well-knownMenegotto and Pinto’s constitutive law [30] modified by Filippouet al. [31]. This constitutive model accounts for both isotropicand kinematic nonlinear hardenings. In particular, the Bauschingereffect can be described.
3.3.2. La Borderie’s modelThis model is expressed within the framework of isotropic con-
tinuum damage mechanics. It is based on the following observa-tions [32]. The degradation of concrete comes from the initiationof micro-cracks and micro-voids; these micro-defaults generate astiffness reduction and residual strains. In this work these two phe-nomena are coupled and described by damage. Two different scalardamage variables are used in tension and in compression. This sep-aration allows taking into account the unilateral effect by splittingthe tension and compression stiffness. It also conserves the essen-tial properties of convexity and continuity. Considering theseassumptions, one can state that three phenomena are taken intoaccount: stiffness reduction, stiffness recovery and permanentstrains in tension and in compression. This isotropic damage modelis expressed within the framework of irreversible processes ther-modynamic. The related constitutive equations are presented inAppendix A.
The tension behavior and the compression one are split into twoindependent contributions by mean of the positive and the nega-tive parts of the stress. Note that the damage variable D1 doesnot influence the compression behavior. On the other hand, dueto thermodynamic considerations, the damage variables cannotbe activated when unloading [28]. Therefore, only linear unloadingis managed by this constitutive model and no hysteretic loop is ta-ken into account. This model is called ‘‘NHD’’ model. A 3D versionof this model has been developed but it does not take into accountthe permanent strains.
3.3.3. Richard’s modelThis constitutive model is expressed within the framework of
isotropic continuum damage mechanics and plasticity for seismicapplications. It is based on the following observations [33]. In ten-sion, quasi-brittle materials exhibit localized cracking although incompression diffuse (or smeared) cracking appears. Therefore, iso-tropic damage is used in tension and plasticity is used in compres-sion. The use of plasticity in compression is frequent in the field ofsoil mechanics when nonlinearities and permanent strains must bedescribed. Tension and compression can be split into two distinctparts by considering the sign of the Cauchy stress. Since hystereticphenomena are related to localize cracking, this mechanism is con-sidered in tension, allowing a realistic description not only of thehysteretic loops but also of permanent strains. The unilateral effectis also taken into account using a closure function which ensuresthe continuity stress/strain relation whatever the loading path.With these assumptions, one can state that the behavior of a rep-resentative elementary volume is accurately represented in ten-sion (brittleness, hysteretic loops and permanent strains) andglobally described in compression (nonlinearity and permanentstrains). The state potential is expressed as the Helmholtz free en-ergy that a strain-based formulation [34,35]. The constitutiveequations of this model are presented in Appendix B.
As mentioned in Section 3.3.1, two versions of this model havebeen derived in this study. The first one lies in considering a unilat-
eral criteria expressed in terms of stresses. No hysteretic loop is ta-ken into account when the stress becomes negative. Note that inthe case of high strain levels (inducing a high damage level), sincethe stress is close to 0 due the effect of the damage, the size of thehysteretic loops will be very small and therefore, the hystereticdissipated energy will be weak. This first version of the model iscalled Low Hysteretic Dissipation (‘‘LHD’’) model. The second ver-sion of the model is based on a unilateral criterion that is expressedin terms of strain. In other words, as soon as the strain becomesnegative, no internal variable is activated, the stresses are com-puted elastically. In this case, hysteretic loops will be created whenunloading, while a strain equal to 0 is not reached. This second ver-sion of the model is called High Hysteretic Dissipation (‘‘HDD’’)model. The size of the hysteretic loops is higher than in the previ-ous version. A 3D version of this model has been developed [29].
3.4. Material parameters identification
3.4.1. Concrete modelFor the different constitutive model, the concrete Young’s mod-
ulus, the Poisson ratio and the compressive strength have beendetermined using the experimental results of compression testsaccording to NF EN 12390-3 [23]. The tension strength has beenidentified using the results of splitting tests (NF EN 12390-6)[23]. Regarding the parameters related to the evolution rules, thecorresponding parameters have been identified using the resultsof the strain/stress response in tension and in compression.
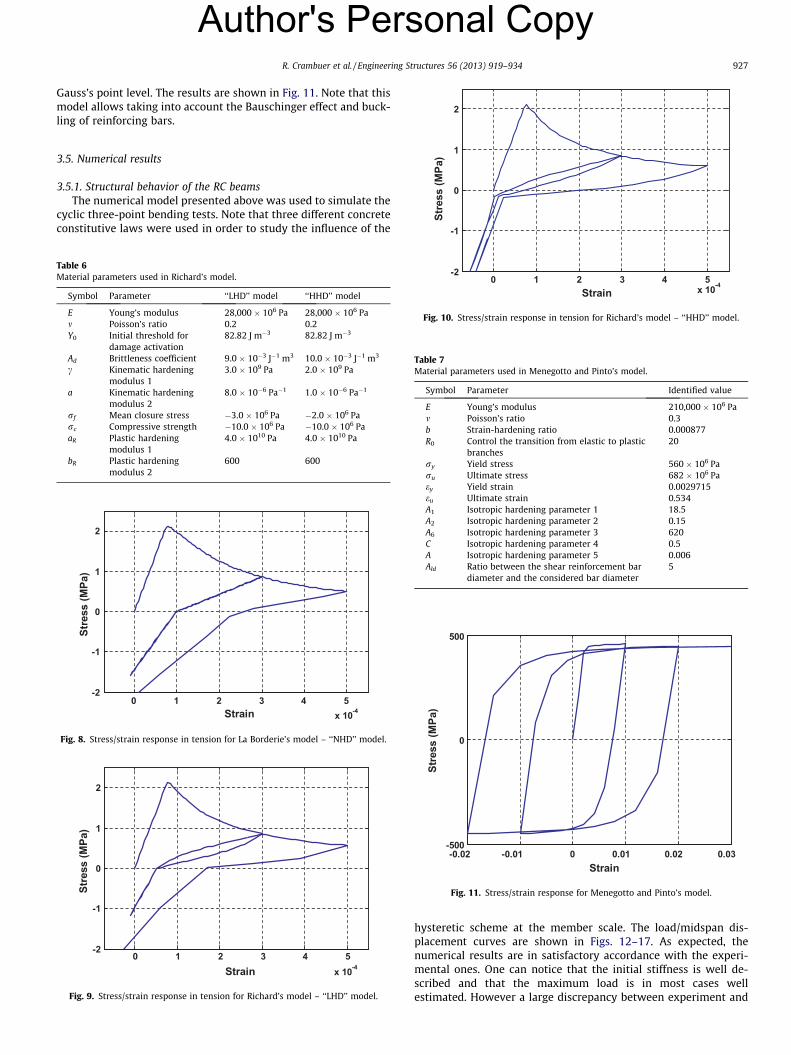
For the Richard’s model, additional parameters related to thehysteretic phenomenon must be identified in tension. Due to thedifficulty to find in the published literature experimental cyclic di-rect tension test response, nominal values have been considered[24,29]. They have been adjusted considering the experimentalthat have been obtained in this study. The material parameters re-lated to the La Borderie’s and Richard’s model used in the numer-ical simulations are presented respectively in Tables 5 and 6. Inorder to illustrate the difference between the ‘‘NHD’’ model, the‘‘LHD’’ model and the ‘‘HHD’’ model, the tension responses of bothmodels have been simulated at the Gauss’s point level. They areshown in Figs. 8–10 respectively. Two hysteretic loops have beensimulated; one can observe that the size of the last one is higherin the case of the ‘‘HHD’’ model than in the case of the ‘‘LHD’’ modeland that no loop can be observed in the ‘‘NHD’’ model.
3.4.2. Menegotto and Pinto’s modelThe material parameters related to the Menegotto and Pinto’s
model used in the numerical simulations are presented in Table 7.The modulus E, the yield ry and ultimate stress ry, ru and strain ey,ez have been identified according to the experimental results ob-tained on samples and presented in Table 2. The other parametersare the classical values [30]. To illustrate the stress/strain response,a cyclic tension/compression loading has been simulated at the
2
R. Crambuer et al. / Engineering Structures 56 (2013) 919–934 927
Author's Personal Copy
Gauss’s point level. The results are shown in Fig. 11. Note that thismodel allows taking into account the Bauschinger effect and buck-ling of reinforcing bars.
-1
0
1
Stre
ss (M
Pa)
3.5. Numerical results3.5.1. Structural behavior of the RC beamsThe numerical model presented above was used to simulate the
cyclic three-point bending tests. Note that three different concreteconstitutive laws were used in order to study the influence of the
Table 6Material parameters used in Richard’s model.
Symbol Parameter ‘‘LHD’’ model ‘‘HHD’’ model
E Young’s modulus 28,000 � 106 Pa 28,000 � 106 Pam Poisson’s ratio 0.2 0.2Y0 Initial threshold for
damage activation82.82 J m�3 82.82 J m�3
Ad Brittleness coefficient 9.0 � 10�3 J�1 m3 10.0 � 10�3 J�1 m3
c Kinematic hardeningmodulus 1
3.0 � 109 Pa 2.0 � 109 Pa
a Kinematic hardeningmodulus 2
8.0 � 10�6 Pa�1 1.0 � 10�6 Pa�1
rf Mean closure stress �3.0 � 106 Pa �2.0 � 106 Parc Compressive strength �10.0 � 106 Pa �10.0 � 106 PaaR Plastic hardening
modulus 14.0 � 1010 Pa 4.0 � 1010 Pa
bR Plastic hardeningmodulus 2
600 600
0 1 2 3 4 5x 10⁻⁴
-2
-1
0
1
2
Strain
Stre
ss (M
Pa)
Fig. 9. Stress/strain response in tension for Richard’s model – ‘‘LHD’’ model.
0 1 2 3 4 5x 10⁻⁴
-2
-1
0
1
2
Strain
Stre
ss (M
Pa)
Fig. 8. Stress/strain response in tension for La Borderie’s model – ‘‘NHD’’ model.
0 1 2 3 4 5x 10⁻⁴
-2
Strain
Fig. 10. Stress/strain response in tension for Richard’s model – ‘‘HHD’’ model.
Table 7Material parameters used in Menegotto and Pinto’s model.
Symbol Parameter Identified value
E Young’s modulus 210,000 � 106 Pam Poisson’s ratio 0.3b Strain-hardening ratio 0.000877R0 Control the transition from elastic to plastic
branches20
ry Yield stress 560 � 106 Paru Ultimate stress 682 � 106 Paey Yield strain 0.0029715eu Ultimate strain 0.534A1 Isotropic hardening parameter 1 18.5A2 Isotropic hardening parameter 2 0.15A6 Isotropic hardening parameter 3 620C Isotropic hardening parameter 4 0.5A Isotropic hardening parameter 5 0.006Ald Ratio between the shear reinforcement bar
diameter and the considered bar diameter5
-0.02 -0.01 0 0.01 0.02 0.03-500
0
500
Strain
Stre
ss (M
Pa)
Fig. 11. Stress/strain response for Menegotto and Pinto’s model.
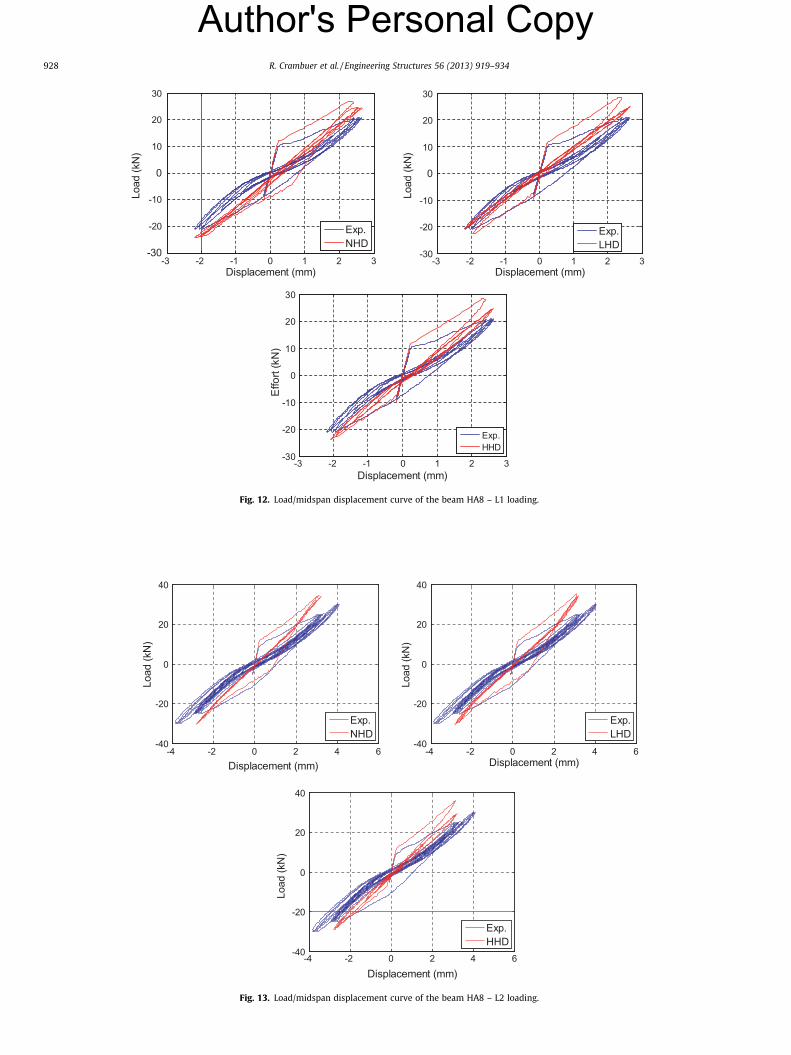
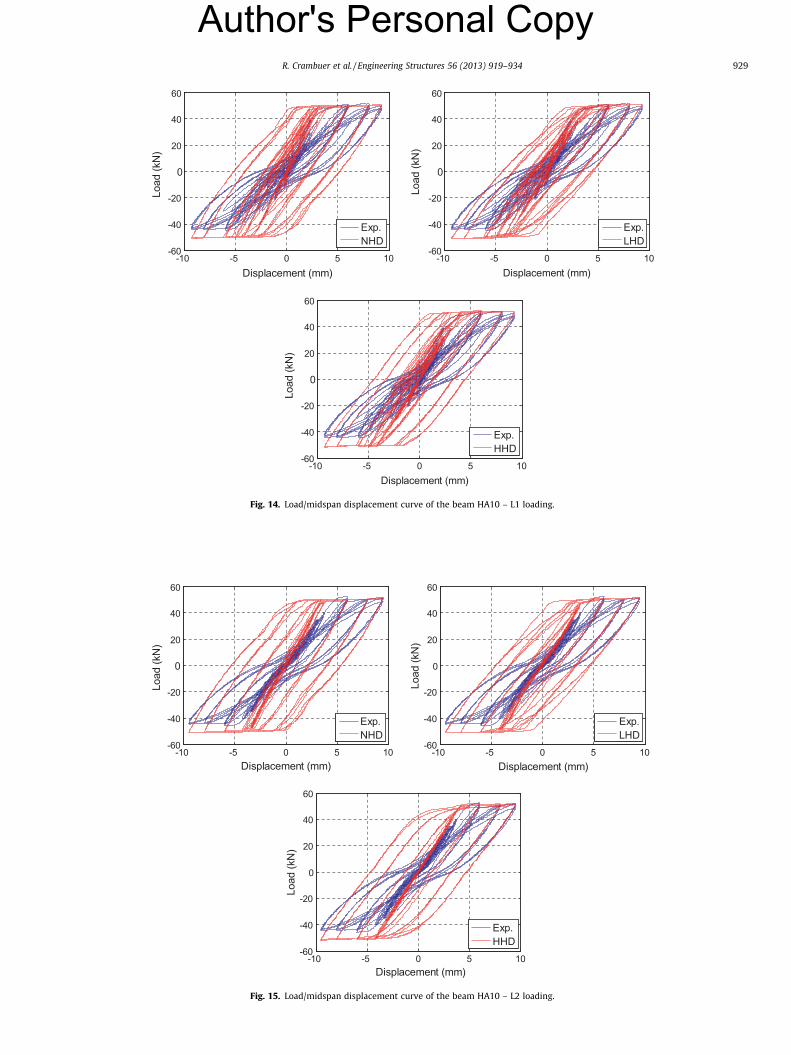
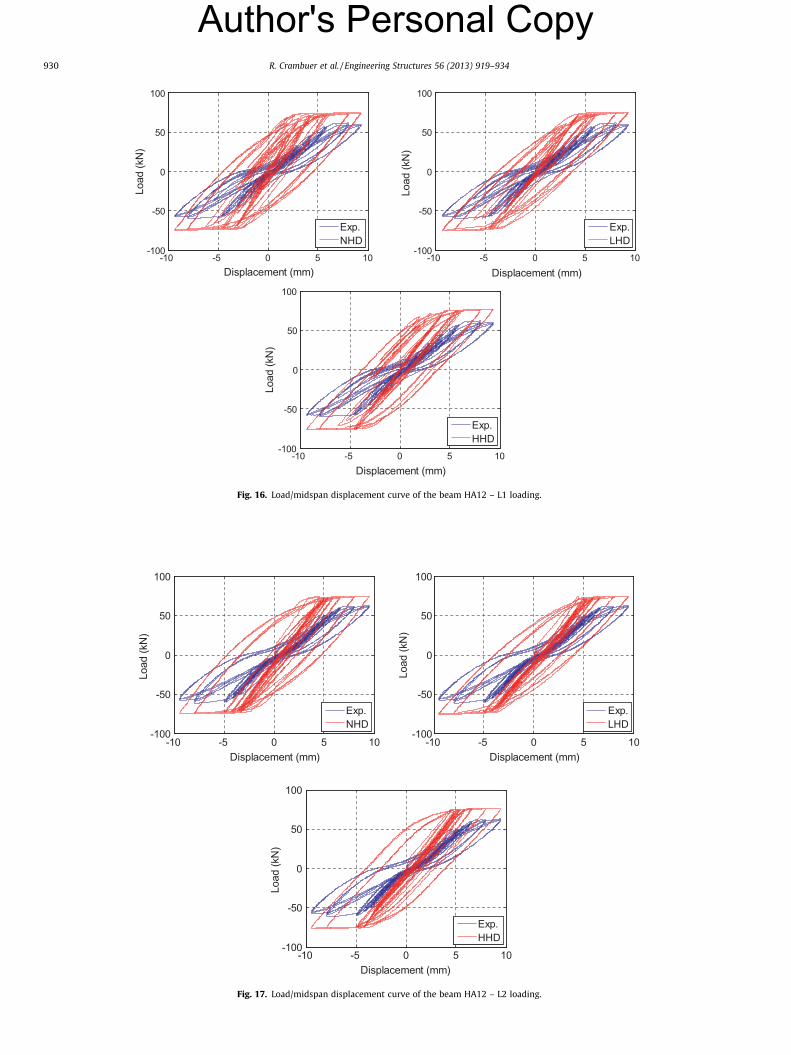
hysteretic scheme at the member scale. The load/midspan dis-placement curves are shown in Figs. 12–17. As expected, thenumerical results are in satisfactory accordance with the experi-mental ones. One can notice that the initial stiffness is well de-scribed and that the maximum load is in most cases wellestimated. However a large discrepancy between experiment and
-3 -2 -1 0 1 2 3-30
-20
-10
0
10
20
30
Displacement (mm)
Load
(kN
)
Exp.NHD
-3 -2 -1 0 1 2 3-30
-20
-10
0
10
20
30
Load
(kN
)
Exp.LHD
-3 -2 -1 0 1 2 3-30
-20
-10
0
10
20
30
Effo
rt (k
N)
Exp.HHD
Displacement (mm)
Displacement (mm)
Fig. 12. Load/midspan displacement curve of the beam HA8 – L1 loading.
-4 -2 0 2 4 6-40
-20
0
20
40
Displacement (mm)
Load
(kN
)
Exp.NHD
-4 -2 0 2 4 6-40
-20
0
20
40
Displacement (mm)
Load
(kN
)
Exp.LHD
-4 -2 0 2 4 6-40
-20
0
20
40
Displacement (mm)
Load
(kN
)
Exp.HHD
Fig. 13. Load/midspan displacement curve of the beam HA8 – L2 loading.
928 R. Crambuer et al. / Engineering Structures 56 (2013) 919–934
Author's Personal Copy
-10 -5 0 5 10-60
-40
-20
0
20
40
60
Displacement (mm)
Load
(kN
)
Exp.NHD
-10 -5 0 5 10-60
-40
-20
0
20
40
60
Displacement (mm)
Load
(kN
)
Exp.LHD
-10 -5 0 5 10-60
-40
-20
0
20
40
60
Displacement (mm)
Load
(kN
)
Exp.HHD
Fig. 14. Load/midspan displacement curve of the beam HA10 – L1 loading.
-10 -5 0 5 10-60
-40
-20
0
20
40
60
Displacement (mm)
Load
(kN
)
Exp.NHD
-10 -5 0 5 10-60
-40
-20
0
20
40
60
Displacement (mm)
Load
(kN
)
Exp.LHD
-10 -5 0 5 10-60
-40
-20
0
20
40
60
Displacement (mm)
Load
(kN
)
Exp.HHD
Fig. 15. Load/midspan displacement curve of the beam HA10 – L2 loading.
R. Crambuer et al. / Engineering Structures 56 (2013) 919–934 929
Author's Personal Copy
-10 -5 0 5 10-100
-50
0
50
100
Displacement (mm)
Load
(kN
)
Exp.NHD
-10 -5 0 5 10-100
-50
0
50
100
Displacement (mm)
Load
(kN
)
Exp.LHD
-10 -5 0 5 10-100
-50
0
50
100
Displacement (mm)
Load
(kN
)
Exp.HHD
Fig. 16. Load/midspan displacement curve of the beam HA12 – L1 loading.
-10 -5 0 5 10-100
-50
0
50
100
Displacement (mm)
Load
(kN
)
Exp.NHD
-10 -5 0 5 10-100
-50
0
50
100
Displacement (mm)
Load
(kN
)
Exp.LHD
-10 -5 0 5 10-100
-50
0
50
100
Displacement (mm)
Load
(kN
)
Exp.HHD
Fig. 17. Load/midspan displacement curve of the beam HA12 – L2 loading.
930 R. Crambuer et al. / Engineering Structures 56 (2013) 919–934
Author's Personal Copy
R. Crambuer et al. / Engineering Structures 56 (2013) 919–934 931
Author's Personal Copy
calculation is obtained for the last cycle because none of the modelis able to capture the pinching effect that appears. The beam kine-matics imposed in the analysis prevents one to account for com-plete 2D behavior and local bond-slip degradation between steeland concrete. Such a lack in the description may explain suchresults.
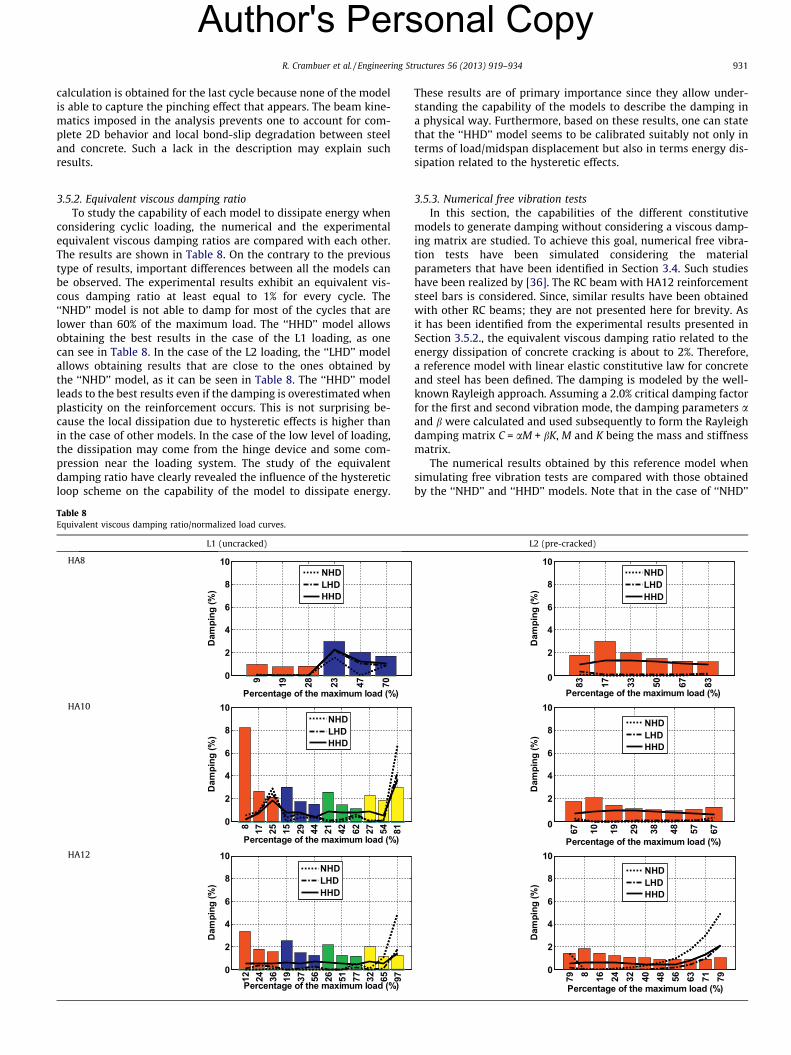
3.5.2. Equivalent viscous damping ratioTo study the capability of each model to dissipate energy when
considering cyclic loading, the numerical and the experimentalequivalent viscous damping ratios are compared with each other.The results are shown in Table 8. On the contrary to the previoustype of results, important differences between all the models canbe observed. The experimental results exhibit an equivalent vis-cous damping ratio at least equal to 1% for every cycle. The‘‘NHD’’ model is not able to damp for most of the cycles that arelower than 60% of the maximum load. The ‘‘HHD’’ model allowsobtaining the best results in the case of the L1 loading, as onecan see in Table 8. In the case of the L2 loading, the ‘‘LHD’’ modelallows obtaining results that are close to the ones obtained bythe ‘‘NHD’’ model, as it can be seen in Table 8. The ‘‘HHD’’ modelleads to the best results even if the damping is overestimated whenplasticity on the reinforcement occurs. This is not surprising be-cause the local dissipation due to hysteretic effects is higher thanin the case of other models. In the case of the low level of loading,the dissipation may come from the hinge device and some com-pression near the loading system. The study of the equivalentdamping ratio have clearly revealed the influence of the hystereticloop scheme on the capability of the model to dissipate energy.
Table 8Equivalent viscous damping ratio/normalized load curves.
L1 (uncracked)
HA8
0
2
4
6
8
10
Percentage of the maximum load (%)
Dam
ping
(%)
9 19 28 23 47 70
NHDLHDHHD
HA10
0
2
4
6
8
10
Percentage of the maximum load (%)
Dam
ping
(%)
8 17 25 15 29 44 21 42 62 27 54 81
NHDLHDHHD
HA12
0
2
4
6
8
10
Percentage of the maximum load (%)
Dam
ping
(%)
12 24 36 19 37 56 26 51 77 32 65 97
NHDLHDHHD
These results are of primary importance since they allow under-standing the capability of the models to describe the damping ina physical way. Furthermore, based on these results, one can statethat the ‘‘HHD’’ model seems to be calibrated suitably not only interms of load/midspan displacement but also in terms energy dis-sipation related to the hysteretic effects.
3.5.3. Numerical free vibration testsIn this section, the capabilities of the different constitutive
models to generate damping without considering a viscous damp-ing matrix are studied. To achieve this goal, numerical free vibra-tion tests have been simulated considering the materialparameters that have been identified in Section 3.4. Such studieshave been realized by [36]. The RC beam with HA12 reinforcementsteel bars is considered. Since, similar results have been obtainedwith other RC beams; they are not presented here for brevity. Asit has been identified from the experimental results presented inSection 3.5.2., the equivalent viscous damping ratio related to theenergy dissipation of concrete cracking is about to 2%. Therefore,a reference model with linear elastic constitutive law for concreteand steel has been defined. The damping is modeled by the well-known Rayleigh approach. Assuming a 2.0% critical damping factorfor the first and second vibration mode, the damping parameters aand b were calculated and used subsequently to form the Rayleighdamping matrix C = aM + bK, M and K being the mass and stiffnessmatrix.
The numerical results obtained by this reference model whensimulating free vibration tests are compared with those obtainedby the ‘‘NHD’’ and ‘‘HHD’’ models. Note that in the case of ‘‘NHD’’
L2 (pre-cracked)
0
2
4
6
8
10
Percentage of the maximum load (%)
Dam
ping
(%)
83 17 33 50 67 83
NHDLHDHHD
0
2
4
6
8
10
Percentage of the maximum load (%)
Dam
ping
(%)
67 10 19 29 38 48 57 67NHDLHDHHD
0
2
4
6
8
10
Percentage of the maximum load (%)
Dam
ping
(%)
79 8 16 24 32 40 48 56 63 71 79
NHDLHDHHD

0.1 0.12 0.14 0.16 0.18 0.2-5
0
5
Time (s)
Forc
e (k
N)
Linear 2%NHD 0.1%
Fig. 18. Load/time results – initial load applied equal to 40 kN – ‘‘NHD’’ model.
0.1 0.12 0.14 0.16 0.18 0.2-5
0
5
Time (s)
Load
(kN
)
Linear 2%HHD 0.1%
Fig. 19. Load/time results – initial load applied equal to 40 kN – ‘‘HHD’’ model.
932 R. Crambuer et al. / Engineering Structures 56 (2013) 919–934
Author's Personal Copy
and ‘‘HHD’’ models, the contribution of the damping matrix is verylow since the coefficients have been calibrated to obtain a criticaldamping factor equal to 0.1% on the first and second vibrationmode for numerical robustness reasons. The loading is load-con-trolled. The maximum load is equal to 40 kN, that correspond to60% of the beam capacity, and is applied at midspan. The load/timeresults are presented in Figs. 18 and 19. In the case of the ‘‘NHD’’model, it clearly appears that without considering a significant vis-cous damping matrix, the oscillations of the RC beam cannot bedamped. This is mainly due to the fact that no hysteretic effect istaken into account in the model. On the opposite, in the case ofthe ‘‘HHD’’ model, the damping level obtained is similar to theone obtained by the reference model. This result shows that thedamping phenomenon can be modeled in a physical way sincethe constitutive laws describe reasonably well the main sourcesof dissipation. Furthermore, it can be stated that the contributionof the viscous damping matrix can be drastically reduced in thisway.
4. Conclusions
Throughout the previous sections, a study aiming at betteridentifying and quantifying the damping in RC structures has beenpresented. First, an experimental campaign has been exposed.
Tests on RC beams subjected to cyclic three point bending testshave been conducted. Two loading paths were considered in orderto fill the lacks identified in the literature regarding the quantifica-tion of damping in the case of undamaged RC beams and of dam-aged RC beams. The loading paths allow studying the energydissipation related to the local hysteretic effects, as they are oneof the main contributing factors to the structural damping phe-nomenon. A quantification of the energy dissipation through theequivalent viscous damping ratio has been carried out, leading tothe identification of three major dissipative mechanisms contribut-ing to structural damping: crack formation, softening of the cracksurfaces and the steel yielding. Second, a numerical study has beenexposed. A semi local/semi global finite element model has beendeveloped, based on several concrete constitutive laws comingfrom previous works. The first constitutive law does not accountfor hysteretic loop although the second and the third one accountfor them. It has been shown that the energy dissipation due to hys-teretic effects was higher in the case of the third constitutive lawthan in the second one. Thanks to these three concrete laws, a sen-sitivity study has been carried out, leading to two types of resultsregarding to (i) the load/midspan displacement and to (ii) the en-ergy dissipation. It can be concluded that the third constitutivelaw is the most appropriate. Nevertheless, the simulations per-formed with this constitutive law lead to satisfactory results aslong as the steel reinforcements do not yield. In the yielding region,the damping is overestimated. When plasticity is activated, phe-nomena such as steel/concrete interface sliding, local shear degra-dation, pinching also appear in the same time. These mechanismsare not included into the model. This result is of primary impor-tance since it gives some guidelines to take into account in a real-istic way not only the hysteretic effect but also the unilateral effect.Considering the main features of this constitutive law, it can be sta-ted that the unilateral effect should be managed in terms of strains,meaning that the stiffness recovery is activated as soon as the totalstrain becomes negative. Furthermore, the hysteretic effect shouldbe allowed even though the Cauchy stress (or related indicator) be-comes negative. To achieve the objective of this study, a numericalcampaign based on free vibration tests has been realized to explorethe possibility to avoid using a viscous damping matrix to accountfor damping. From the numerical results obtained, it appears thatthe use of refine constitutive models at the material scale allowsdecreasing in a drastic way the contribution of the viscous damp-ing matrix. Therefore, additional viscous forces classically intro-duced in the momentum balance equation are no more needed.In other terms, this paper shows that if the major sources of dissi-pation are included in the constitutive models at the material scale,a physical explanation for damping can be given. There are twomain perspectives of this work. The first one lies in realizing 2Dand 3D modeling in order to investigate the overestimation ofthe damping when yielding occurs. The second one consists in per-forming an experimental campaign to investigate the loading casesof cyclic shear and tension (splitting tests for instance) to estimateto dissipated energy in such cases. These experimental data will beuseful to identify a shell based model accounting for hystereticphenomena.
Acknowledgements
The authors would like to thank LMT Cachan and in particularX. Pinneli for helping and for availability during the experimentalcampaign. This study is supported by CEA and EDF.
Appendix A. La Borderie’s model
Table 9 presents the constitutive equations of the La Borderie’smodel. v is the Gibbs free enthalpy, e is the axial strain, r+ and r�
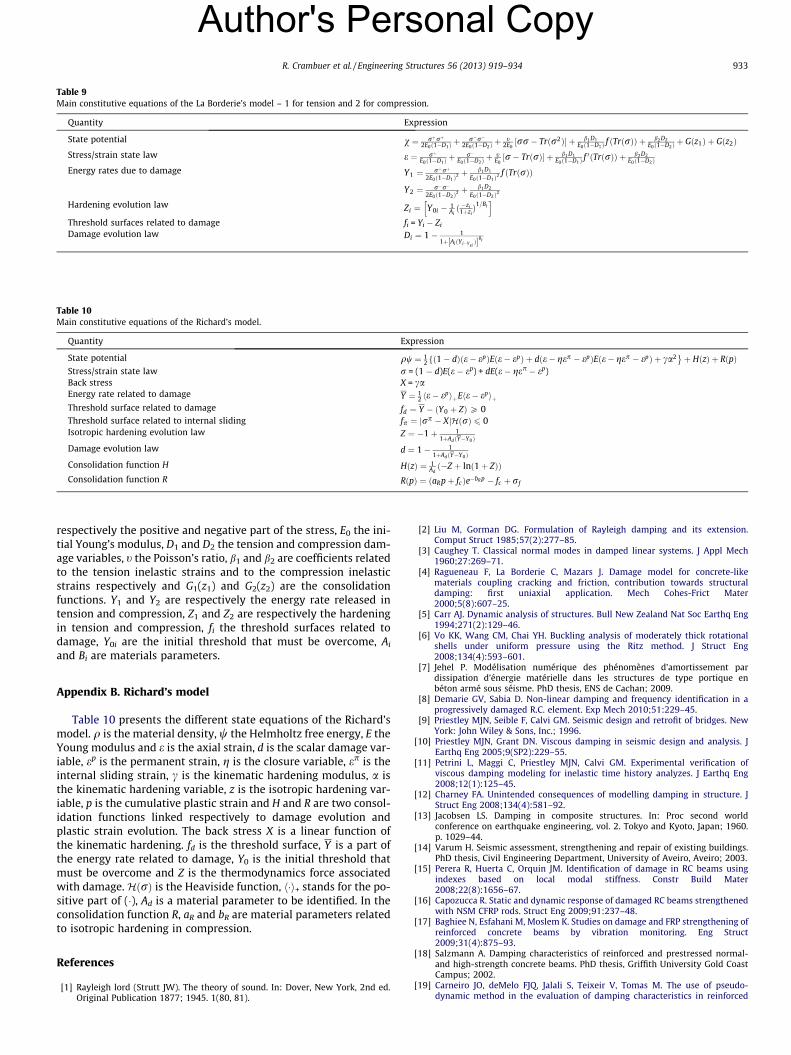
Table 9Main constitutive equations of the La Borderie’s model – 1 for tension and 2 for compression.
Quantity Expression
State potential v ¼ rþrþ2E0ð1�D1Þ þ
r�r�2E0ð1�D2Þ þ
t2E0½rr� Trðr2Þ� þ b1D1
E0ð1�D1Þ f ðTrðrÞÞ þ b2 D2E0ð1�D2Þ þ Gðz1Þ þ Gðz2Þ
Stress/strain state law e ¼ rþE0ð1�D1Þ þ
r�E0ð1�D2Þ þ
tE0½r� TrðrÞ� þ b1D1
E0ð1�D1Þ f0ðTrðrÞÞ þ b2D2
E0ð1�D2Þ
Energy rates due to damage Y1 ¼ rþrþ2E0ð1�D1Þ2
þ b1D1
E0ð1�D1Þ2f ðTrðrÞÞ
Y2 ¼ r�r�2E0ð1�D2Þ2
þ b1D2
E0ð1�D2Þ2
Hardening evolution law Zi ¼ Y0i � 1Aið �zi
1þziÞ1=Bi
h i
Threshold surfaces related to damage fi = Yi � Zi
Damage evolution law Di ¼ 1� 11þ AiðYi�Ysi
Þ½ �Bi
Table 10Main constitutive equations of the Richard’s model.
Quantity Expression
State potential qw ¼ 12 ð1� dÞðe� epÞEðe� epÞf þ dðe� gep � epÞEðe� gep � epÞ þ ca2
�þ HðzÞ þ RðpÞ
Stress/strain state law r = (1 � d)E(e � ep) + dE(e � gep � ep)Back stress X = caEnergy rate related to damage Y ¼ 1
2 he� epiþEhe� epiþThreshold surface related to damage fd ¼ Y � ðY0 þ ZÞP 0Threshold surface related to internal sliding fp ¼ jrp � XjHðrÞ 6 0Isotropic hardening evolution law Z ¼ �1þ 1
1þAdðY�Y0Þ
Damage evolution law d ¼ 1� 11þAdðY�Y0Þ
Consolidation function H HðzÞ ¼ 1Adð�Z þ lnð1þ ZÞÞ
Consolidation function R RðpÞ ¼ ðaRpþ fcÞe�bR p � fc þ rf
R. Crambuer et al. / Engineering Structures 56 (2013) 919–934 933
Author's Personal Copy
respectively the positive and negative part of the stress, E0 the ini-tial Young’s modulus, D1 and D2 the tension and compression dam-age variables, t the Poisson’s ratio, b1 and b2 are coefficients relatedto the tension inelastic strains and to the compression inelasticstrains respectively and G1(z1) and G2(z2) are the consolidationfunctions. Y1 and Y2 are respectively the energy rate released intension and compression, Z1 and Z2 are respectively the hardeningin tension and compression, fi the threshold surfaces related todamage, Y0i are the initial threshold that must be overcome, Ai
and Bi are materials parameters.
Appendix B. Richard’s model
Table 10 presents the different state equations of the Richard’smodel. q is the material density, w the Helmholtz free energy, E theYoung modulus and e is the axial strain, d is the scalar damage var-iable, ep is the permanent strain, g is the closure variable, ep is theinternal sliding strain, c is the kinematic hardening modulus, a isthe kinematic hardening variable, z is the isotropic hardening var-iable, p is the cumulative plastic strain and H and R are two consol-idation functions linked respectively to damage evolution andplastic strain evolution. The back stress X is a linear function ofthe kinematic hardening. fd is the threshold surface, Y is a part ofthe energy rate related to damage, Y0 is the initial threshold thatmust be overcome and Z is the thermodynamics force associatedwith damage. HðrÞ is the Heaviside function, h�i+ stands for the po-sitive part of (�), Ad is a material parameter to be identified. In theconsolidation function R, aR and bR are material parameters relatedto isotropic hardening in compression.
References
[1] Rayleigh lord (Strutt JW). The theory of sound. In: Dover, New York, 2nd ed.Original Publication 1877; 1945. 1(80, 81).
[2] Liu M, Gorman DG. Formulation of Rayleigh damping and its extension.Comput Struct 1985;57(2):277–85.
[3] Caughey T. Classical normal modes in damped linear systems. J Appl Mech1960;27:269–71.
[4] Ragueneau F, La Borderie C, Mazars J. Damage model for concrete-likematerials coupling cracking and friction, contribution towards structuraldamping: first uniaxial application. Mech Cohes-Frict Mater2000;5(8):607–25.
[5] Carr AJ. Dynamic analysis of structures. Bull New Zealand Nat Soc Earthq Eng1994;271(2):129–46.
[6] Vo KK, Wang CM, Chai YH. Buckling analysis of moderately thick rotationalshells under uniform pressure using the Ritz method. J Struct Eng2008;134(4):593–601.
[7] Jehel P. Modélisation numérique des phénomènes d’amortissement pardissipation d’énergie matérielle dans les structures de type portique enbéton armé sous séisme. PhD thesis, ENS de Cachan; 2009.
[8] Demarie GV, Sabia D. Non-linear damping and frequency identification in aprogressively damaged R.C. element. Exp Mech 2010;51:229–45.
[9] Priestley MJN, Seible F, Calvi GM. Seismic design and retrofit of bridges. NewYork: John Wiley & Sons, Inc.; 1996.
[10] Priestley MJN, Grant DN. Viscous damping in seismic design and analysis. JEarthq Eng 2005;9(SP2):229–55.
[11] Petrini L, Maggi C, Priestley MJN, Calvi GM. Experimental verification ofviscous damping modeling for inelastic time history analyzes. J Earthq Eng2008;12(1):125–45.
[12] Charney FA. Unintended consequences of modelling damping in structure. JStruct Eng 2008;134(4):581–92.
[13] Jacobsen LS. Damping in composite structures. In: Proc second worldconference on earthquake engineering, vol. 2. Tokyo and Kyoto, Japan; 1960.p. 1029–44.
[14] Varum H. Seismic assessment, strengthening and repair of existing buildings.PhD thesis, Civil Engineering Department, University of Aveiro, Aveiro; 2003.
[15] Perera R, Huerta C, Orquin JM. Identification of damage in RC beams usingindexes based on local modal stiffness. Constr Build Mater2008;22(8):1656–67.
[16] Capozucca R. Static and dynamic response of damaged RC beams strengthenedwith NSM CFRP rods. Struct Eng 2009;91:237–48.
[17] Baghiee N, Esfahani M, Moslem K. Studies on damage and FRP strengthening ofreinforced concrete beams by vibration monitoring. Eng Struct2009;31(4):875–93.
[18] Salzmann A. Damping characteristics of reinforced and prestressed normal-and high-strength concrete beams. PhD thesis, Griffith University Gold CoastCampus; 2002.
[19] Carneiro JO, deMelo FJQ, Jalali S, Teixeir V, Tomas M. The use of pseudo-dynamic method in the evaluation of damping characteristics in reinforced

934 R. Crambuer et al. / Engineering Structures 56 (2013) 919–934
Author's Personal Copy
concrete beams having variable bending stiffness. Mech Res Commun2006;33(5):601–13.
[20] Elmenshawi A, Brown T. Hysteretic energy and damping capacity of flexuralelements constructed with different concrete strengths. Eng Struct2010;32(1):297–305.
[21] Vintzileou E, Tassios TP, Chronopoulos M. Experimental validation of seismiccode provisions for RC columns. Eng Struct 2007;29(6):1153–64.
[22] Crambuer R, Richard B, Ile N, Ragueneau F. Experimental characterization andmodelling of energy dissipation in reinforced concrete beams subjected tocyclic loading. In: 14th World conference of earthquake engineering, Lisbon;2012 [Paper no. 2913].
[23] AFNOR. Béton et constituants du béton. Ref.: 3131861CD ISBN: 2-12-131861-5; 2006.
[24] La Borderie C. Phénoménes unilatéreaux dans un matériau endommageable:modélisation et application à l’analyse de structure en béton. PhD thesis,Université de Paris 6; 1991.
[25] Hild F. CORRELILMT: a software for displacement field measurements bydigital image correlation. France: LMT-Cachan (ENS Cachan/CNRS/UniversiteParis 6/UniverSud Paris): Internal Report No. 254; 2002.
[26] Hild F, Roux S. Measuring stress intensity factors with a camera: integrateddigital image correlation I-DIC. C R Méc 2006;334(1):8–12.
[27] Mazars J, Kotronis P, Ragueneau F, Casaux G. Using multifiber beams toaccount for shear and torsion: applications to concrete structural elements.Comput Methods Appl Mech Eng 2006;195(52):7264–81.
[28] La Borderie C, Mazars J, Pijaudier-Cabot G. Damage mechanics model for reinforcedconcrete structures under cyclic loading. Am Concr Inst 1994;134:147–72.
[29] Richard B, Ragueneau F. Continuum damage mechanics based model for quasibrittle materials subjected to cyclic loadings: formulation, numericalimplementation and applications. Eng Fract Mech 2013;98:386–406.
[30] Menegotto M, Pinto PE. Method of analysis for cyclically loaded reinforcedconcrete plane frames including changes in geometry and non-elastic behaviorof elements under combined normal force and bending. In: Proc IABSE symp ofresistance and ultimate deformability of structures acted on by well-definedrepeated loads, international association of bridge and structural engineering,vol. 13. Libson, Portugal; 1973. p. 15–22.
[31] Filippou FC, Popov EP, Bertero VV. Effects of bond deterioration on hystereticbehavior of reinforced concrete joints. Earthquake Engineering ResearchCenter. Berkeley: University of California: Internal, Report No. UCB/EERC-83/19; 1983.
[32] Hermann B, Kestin J. On thermodynamics foundations of a damage theory inelastic solids. In: Proc CNRS-NSF workshop on strain localization and sizeeffect due to damage and cracking; 1988. p. 228–32.
[33] Mazars J, Berthaud Y, Ramtani S. The unilateral behaviour of damagedconcrete. Eng Fract Mech 1990;35(4–5):629–35.
[34] Lemaitre J, Chaboche JL, Germain P. Mécanique des matériaux solides. Dunod;1985.
[35] Richard B, Ragueneau F, Cremona C, Adelaide L. Isotropic continuum damagemechanics for concrete under cyclic loading: stiffness recovery, inelasticstrains and frictional sliding. Eng Fract Mech 2010;77(8):1203–23.
[36] Desmorat R, Ragueneau F, Pham TH. Continuum damage mechanics forhysteresis and fatigue of quasi-brittle materials and structures. Int J NumerAnal Methods Geomech 2007;31(2):307–29.
Related Documents