RESEARCH PAPER Experimental and numerical investigation of capillary flow in SU8 and PDMS microchannels with integrated pillars Auro Ashish Saha Sushanta K. Mitra Mark Tweedie Susanta Roy Jim McLaughlin Received: 2 October 2008 / Accepted: 9 December 2008 / Published online: 8 January 2009 Ó Springer-Verlag 2008 Abstract Microfluidic channels with integrated pillars are fabricated on SU8 and PDMS substrates to understand the capillary flow. Microscope in conjunction with high- speed camera is used to capture the meniscus front movement through these channels for ethanol and isopro- pyl alcohol, respectively. In parallel, numerical simulations are conducted, using volume of fluid method, to predict the capillary flow through the microchannels with different pillar diameter to height ratio, ranging from 2.19 to 8.75 and pillar diameter to pitch ratio, ranging from 1.44 to 2.6. The pillar size (diameter, pitch and height) and the physical properties of the fluid (surface tension and viscosity) are found to have significant influence on the capillary phe- nomena in the microchannel. The meniscus displacement is non-uniform due to the presence of pillars and the non- uniformity in meniscus displacement is observed to increase with decrease in pitch to diameter ratio. The sur- face area to volume ratio is observed to play major roles in the velocity of the capillary meniscus of the devices. The filling speed is observed to change more dramatically under different pillar heights upto 120 lm and the change is slow with further increase in the pillar height. The details per- taining to the fluid distribution (meniscus front shapes) are obtained from the numerical results as well as from experiments. Numerical predictions for meniscus front shapes agree well with the experimental observations for both SU8 and PDMS microchannels. It is observed that the filling time obtained experimentally matches very well with the simulated filling time. The presence of pillars creates uniform meniscus front in the microchannel for both ethanol and isopropyl alcohol. Generalized plots in terms of dimensionless variables are also presented to predict the performance parameters for the design of these microfluidic devices. The flow is observed to have a very low Capillary number, which signifies the relative impor- tance of surface tension to viscous effects in the present study. Keywords Capillary flow Microchannel Numerical Three-dimensional 1 Introduction Microchannels are used for the transport of minute amount of liquids for cell-sorting and cellular assays, protein crystallization, immunoassays, DNA analysis, and medical applications (Zimmermann et al. 2005). Precise liquid volume control and guiding fluid flow to the desired outlet reservoir are two important operations in Lab-on-a-Chip design. Passive systems typically rely upon the balance of surface tension and fluid pressure forces to perform their function. In particular, it is possible to exploit surface tension forces to create passive microfluidic valves and metering systems. When capillary action is used for mi- crofluidics, the wetting property of microchannels has a significant effect on the liquid behavior. It is very well- known fact that, a hydrophilic surface assists fluid motion A. A. Saha Department of Mechanical Engineering, Indian Institute of Technology Bombay, Mumbai, India S. K. Mitra (&) Department of Mechanical Engineering, University of Alberta, Edmonton, Canada e-mail: [email protected] M. Tweedie S. Roy J. McLaughlin Nanotechnology and Integrated BioEngineering Centre, University of Ulster, Jordanstown, Northern Ireland 123 Microfluid Nanofluid (2009) 7:451–465 DOI 10.1007/s10404-008-0395-0

Welcome message from author
This document is posted to help you gain knowledge. Please leave a comment to let me know what you think about it! Share it to your friends and learn new things together.
Transcript
RESEARCH PAPER
Experimental and numerical investigation of capillary flow in SU8and PDMS microchannels with integrated pillars
Auro Ashish Saha Æ Sushanta K. Mitra ÆMark Tweedie Æ Susanta Roy Æ Jim McLaughlin
Received: 2 October 2008 / Accepted: 9 December 2008 / Published online: 8 January 2009
� Springer-Verlag 2008
Abstract Microfluidic channels with integrated pillars
are fabricated on SU8 and PDMS substrates to understand
the capillary flow. Microscope in conjunction with high-
speed camera is used to capture the meniscus front
movement through these channels for ethanol and isopro-
pyl alcohol, respectively. In parallel, numerical simulations
are conducted, using volume of fluid method, to predict the
capillary flow through the microchannels with different
pillar diameter to height ratio, ranging from 2.19 to 8.75
and pillar diameter to pitch ratio, ranging from 1.44 to 2.6.
The pillar size (diameter, pitch and height) and the physical
properties of the fluid (surface tension and viscosity) are
found to have significant influence on the capillary phe-
nomena in the microchannel. The meniscus displacement is
non-uniform due to the presence of pillars and the non-
uniformity in meniscus displacement is observed to
increase with decrease in pitch to diameter ratio. The sur-
face area to volume ratio is observed to play major roles in
the velocity of the capillary meniscus of the devices. The
filling speed is observed to change more dramatically under
different pillar heights upto 120 lm and the change is slow
with further increase in the pillar height. The details per-
taining to the fluid distribution (meniscus front shapes) are
obtained from the numerical results as well as from
experiments. Numerical predictions for meniscus front
shapes agree well with the experimental observations for
both SU8 and PDMS microchannels. It is observed that the
filling time obtained experimentally matches very well
with the simulated filling time. The presence of pillars
creates uniform meniscus front in the microchannel for
both ethanol and isopropyl alcohol. Generalized plots in
terms of dimensionless variables are also presented to
predict the performance parameters for the design of these
microfluidic devices. The flow is observed to have a very
low Capillary number, which signifies the relative impor-
tance of surface tension to viscous effects in the present
study.
Keywords Capillary flow � Microchannel � Numerical �Three-dimensional
1 Introduction
Microchannels are used for the transport of minute amount
of liquids for cell-sorting and cellular assays, protein
crystallization, immunoassays, DNA analysis, and medical
applications (Zimmermann et al. 2005). Precise liquid
volume control and guiding fluid flow to the desired outlet
reservoir are two important operations in Lab-on-a-Chip
design. Passive systems typically rely upon the balance of
surface tension and fluid pressure forces to perform their
function. In particular, it is possible to exploit surface
tension forces to create passive microfluidic valves and
metering systems. When capillary action is used for mi-
crofluidics, the wetting property of microchannels has a
significant effect on the liquid behavior. It is very well-
known fact that, a hydrophilic surface assists fluid motion
A. A. Saha
Department of Mechanical Engineering,
Indian Institute of Technology Bombay, Mumbai, India
S. K. Mitra (&)
Department of Mechanical Engineering, University of Alberta,
Edmonton, Canada
e-mail: [email protected]
M. Tweedie � S. Roy � J. McLaughlin
Nanotechnology and Integrated BioEngineering Centre,
University of Ulster, Jordanstown, Northern Ireland
123
Microfluid Nanofluid (2009) 7:451–465
DOI 10.1007/s10404-008-0395-0
whereas, a hydrophobic surface retards fluid motion inside
microchannels. Pillar structures are often used in micro-
channels to increase the surface/volume ratio and increase
the capillary flow. The pillar structures have also found to
increase the yield of cell capture from blood (Thorslund
et al. 2008). An important consideration in the design of
the inlet/exit ports of microfluidic devices is to use of
micropillars. It is a common practice to include arrays of
micromachined posts that serve to modify fluid flow and
act as sites for heterogeneous catalysis (Losey et al. 2002).
Son et al. (2006) used a PDMS structure with a pillar
array (200 lm in diameter, 250 lm in distance between
pillars, and 1 mm in height) for filtration of beads. They
used disposable bio-chip for immobilizing hemoglobin Alc
(HbAlc) and to measure its concentration. Nissila et al.
(2007) developed a lidless micropillar array electrospray
ionization chip for analysis of drugs and biomolecules. The
chip made of silicon, consisted of an array of micropillars
in an open-channel and an electrospray emitter tip for
ionization. The micropillar array provided the necessary
liquid transfer in the chip by capillary force.
Over the last few years, attempts have been made by
number of researchers to simulate such passive transport in
microchannels. Tseng et al. (2002) applied the volume of
fluid (VOF) interface tracking technique to understand the
reservoir filling process, and investigated factors such as
the contact angle and reservoir shape on the filling process.
They verified their simulation using a microscale particle
image velocimetry (l-PIV). They identified hydrophilic/
hydrophobic nature of the wall as the key issue for liquid
filling into the micro-reservoir for the channel/reservoir of
1 mm in size. It was further demonstrated experimentally
that, the complete filling becomes difficult for their devices
with feature size around 100 lm, even with hydrophilic
wall.
Quinte et al. (2001) present the validation of the com-
mercial simulation tools FLOW-3D and CFX4 with regard
to capillary driven flows in two-dimensional rectangular
channels. The computational time ranged between a few
minutes to hours for the elementary microchannel config-
urations considered in their study. They verified their
simulation with analytical solution and experimental data.
The measurement data showed lower values of average
filling velocity than those obtained through analysis and
simulations. They also proposed capillary driven flow in a
three-dimensional microchannel with integrated columns
for a medical test strip. However, simulation for the three-
dimensional microchannel with integrated columns was not
carried out in their work.
Microchannels with integrated pillared structures will
form an integral component in the development of bio-
medical chips (Mery et al. 2008). Micropillars array also
help to deliver fluid from the reservoir to microfluidic
channels (Jokinen and Franssila 2008). Capillary action,
which is purely governed by the surface tension forces
(Probstein 1994), is used for the transport of the fluid into
these devices. The wall surfaces of the devices exhibit
different characteristics based on the substrate material
used during their fabrication. There is a need to understand
the flow behavior in these devices in order to accurately
design the high performance chips. Due to the complexity
of the geometry, it is often difficult to formulate analytical
solutions. Analytical models have been proposed for
modeling of underfill process in the flip-chip assembly
(Wan et al. 2005, 2007; Lin et al. 2007; Lin 2004). How-
ever, the details pertaining to the fluid distribution
(meniscus front shapes) cannot be obtained from the the-
oretical analysis based on these analytical models. In the
numerical study for flip-chip underfill flow (Wan et al.
2005), the calculated filling time matched well with the
measured results, whereas, the flow front shape did not
match well with the measured results. The front shapes,
which is a measure of, how well the fluid gets distributed,
is an important parameter to ensure reliability and perfor-
mance of microfluidic devices. Hence it becomes necessary
to rely on numerical techniques to predict the flow phe-
nomena in such cases. The general features of free surface
flow in microchannels requires enormous computational
time based on the complexity of geometry of the flow
under study. To the best of the authors knowledge, limited
work has been conducted to study the capillary flow in
microchannel with integrated pillars.
We present a three-dimensional simulation of free sur-
face phenomena in a microfluidic channel containing
10 9 15 array of 350 lm circular cross-section pillars by
VOF technique. The VOF technique, is the most commonly
used technique for the simulation of free surfaces within
commercial and academic CFD packages (Jimack 2004).
Microfluidic imaging is used to experimentally visualize
the interface movement on the fabricated microchannels
using SU8 and PDMS substrates. This helps in under-
standing how free surface is modified by the presence of
pillars for performing microfluidic analysis. A parametric
study is also performed to understand the effects of surface
tension and viscosity of the working fluid on the geometry
of the integrated pillars.
2 Microchannel fabrication and characterization
The microfluidic devices fabricated from polymer materi-
als such as PDMS have simpler manufacturing procedures
and are comparatively cheaper and particularly used for
disposable microfluidic devices. There has also been a
growing interest in using organic-based, negative tone
photoresists, such as the epoxy-derived material, SU8 in
452 Microfluid Nanofluid (2009) 7:451–465
123
biofluidics applications. Hence, microchannels made of
SU8 and PDMS consisting of arrays of circular pillar are
considered in this study. However, PDMS and SU8 are low
surface energy materials and are innately hydrophobic, and
do not adhere well to other materials brought in contact.
This necessitates their surface modification/treatment to
render them adhesionable. The modified/treated surface
recovers its hydrophobicity very shortly (Kim et al. 2004).
In the present study, the surface of the PDMS/SU8 have not
been modified. The SU8 and PDMS channels are sealed
with glass slides which is hydrophilic in nature and thus
will assist fluid motion under passive surface tension
forces.
2.1 SU8 substrate
The SU8 channel is fabricated from glass microscope
slides patterned with SU8 photoresist using an SF 100
maskless lithography system (Kern et al. 2007). Subse-
quently, microscope slide have been adhered with
cyanoacrylate adhesive for sealing the device. The pillars
are 350 lm diameter and 120 lm height (confirmed with
stylus profilometer), with adjacent pillars being separated
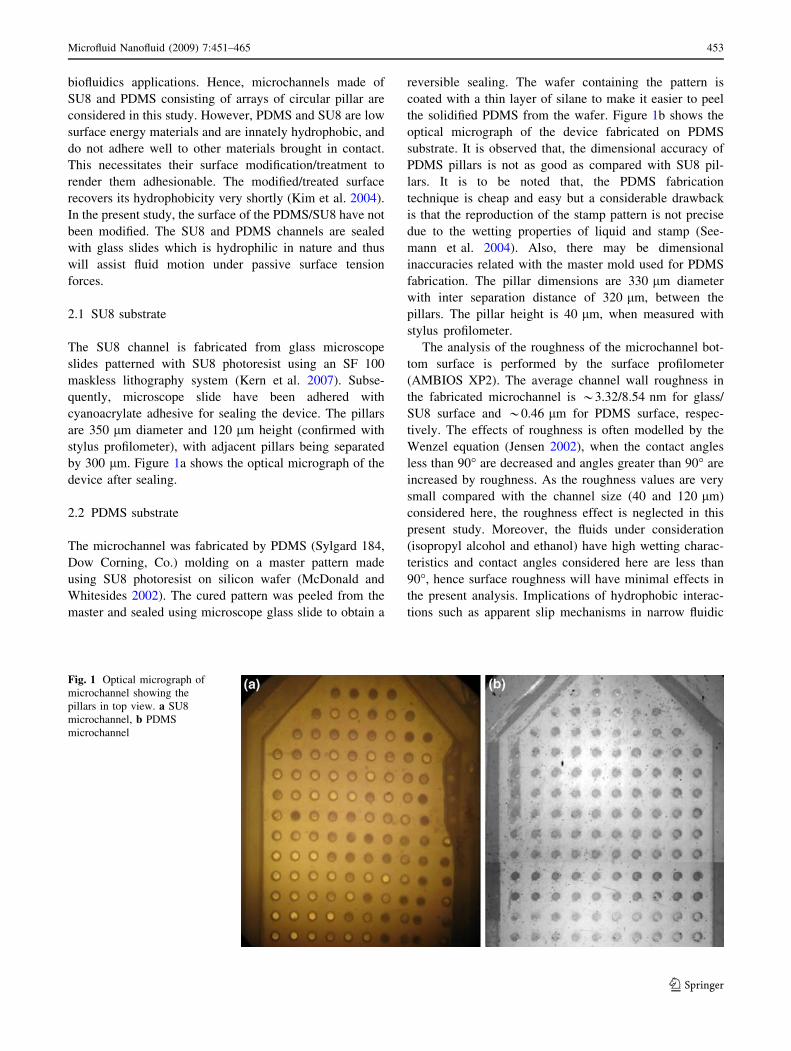
by 300 lm. Figure 1a shows the optical micrograph of the
device after sealing.
2.2 PDMS substrate
The microchannel was fabricated by PDMS (Sylgard 184,
Dow Corning, Co.) molding on a master pattern made
using SU8 photoresist on silicon wafer (McDonald and
Whitesides 2002). The cured pattern was peeled from the
master and sealed using microscope glass slide to obtain a
reversible sealing. The wafer containing the pattern is
coated with a thin layer of silane to make it easier to peel
the solidified PDMS from the wafer. Figure 1b shows the
optical micrograph of the device fabricated on PDMS
substrate. It is observed that, the dimensional accuracy of
PDMS pillars is not as good as compared with SU8 pil-
lars. It is to be noted that, the PDMS fabrication
technique is cheap and easy but a considerable drawback
is that the reproduction of the stamp pattern is not precise
due to the wetting properties of liquid and stamp (See-
mann et al. 2004). Also, there may be dimensional
inaccuracies related with the master mold used for PDMS
fabrication. The pillar dimensions are 330 lm diameter
with inter separation distance of 320 lm, between the
pillars. The pillar height is 40 lm, when measured with
stylus profilometer.
The analysis of the roughness of the microchannel bot-
tom surface is performed by the surface profilometer
(AMBIOS XP2). The average channel wall roughness in
the fabricated microchannel is *3.32/8.54 nm for glass/
SU8 surface and *0.46 lm for PDMS surface, respec-
tively. The effects of roughness is often modelled by the
Wenzel equation (Jensen 2002), when the contact angles
less than 90� are decreased and angles greater than 90� are
increased by roughness. As the roughness values are very
small compared with the channel size (40 and 120 lm)
considered here, the roughness effect is neglected in this
present study. Moreover, the fluids under consideration
(isopropyl alcohol and ethanol) have high wetting charac-
teristics and contact angles considered here are less than
90�, hence surface roughness will have minimal effects in
the present analysis. Implications of hydrophobic interac-
tions such as apparent slip mechanisms in narrow fluidic
Fig. 1 Optical micrograph of
microchannel showing the
pillars in top view. a SU8
microchannel, b PDMS
microchannel
Microfluid Nanofluid (2009) 7:451–465 453
123
confinements induced by surface roughness-hydrophobic-
ity coupling have been discussed in the recent literature
(Chakraborty 2007a, b; Chakraborty et al. 2007; Chakr-
aborty and Dinkar 2008).
3 Numerical simulation
3.1 Geometry of microchannel
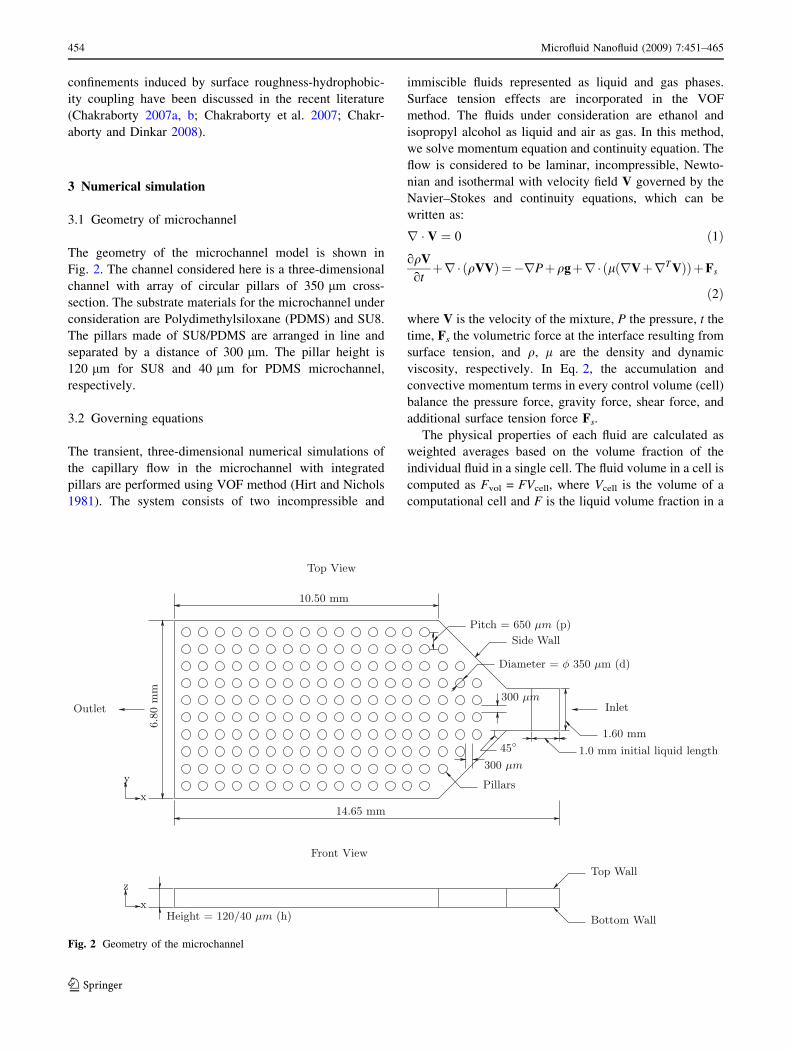
The geometry of the microchannel model is shown in
Fig. 2. The channel considered here is a three-dimensional
channel with array of circular pillars of 350 lm cross-
section. The substrate materials for the microchannel under
consideration are Polydimethylsiloxane (PDMS) and SU8.
The pillars made of SU8/PDMS are arranged in line and
separated by a distance of 300 lm. The pillar height is
120 lm for SU8 and 40 lm for PDMS microchannel,
respectively.
3.2 Governing equations
The transient, three-dimensional numerical simulations of
the capillary flow in the microchannel with integrated
pillars are performed using VOF method (Hirt and Nichols
1981). The system consists of two incompressible and
immiscible fluids represented as liquid and gas phases.
Surface tension effects are incorporated in the VOF
method. The fluids under consideration are ethanol and
isopropyl alcohol as liquid and air as gas. In this method,
we solve momentum equation and continuity equation. The
flow is considered to be laminar, incompressible, Newto-
nian and isothermal with velocity field V governed by the
Navier–Stokes and continuity equations, which can be
written as:
r � V ¼ 0 ð1ÞoqV
otþr�ðqVVÞ¼�rPþqgþr�ðlðrVþrT VÞÞþFs
ð2Þ
where V is the velocity of the mixture, P the pressure, t the
time, Fs the volumetric force at the interface resulting from
surface tension, and q, l are the density and dynamic
viscosity, respectively. In Eq. 2, the accumulation and
convective momentum terms in every control volume (cell)
balance the pressure force, gravity force, shear force, and
additional surface tension force Fs.
The physical properties of each fluid are calculated as
weighted averages based on the volume fraction of the
individual fluid in a single cell. The fluid volume in a cell is
computed as Fvol = FVcell, where Vcell is the volume of a
computational cell and F is the liquid volume fraction in a
Fig. 2 Geometry of the microchannel
454 Microfluid Nanofluid (2009) 7:451–465
123
cell. The value of F in a cell should range between 1 and 0.
Here, F = 1 represents a cell which is completely filled
with liquid, F = 0 represents a cell which is completely
filled with gas and 0 \ F \ 1 represents the liquid/gas
interface.
The liquid volume fraction distribution can be determined
by solving a separate passive transport equation, given as:
oF
otþ V � rF ¼ 0 ð3Þ
where,
F ¼ cell volume occupied by liquid
total volume of the control cellð4Þ
The mixture’s physical properties are derived from that
of the two phases through the volume fraction function. In
particular, the average value of q and l in a computational
cell can be computed from the value of F in accordance
with:
q ¼ Fq2 þ ð1� FÞq1 ð5Þl ¼ Fl2 þ ð1� FÞl1 ð6Þ
where the subscripts 1 and 2 represent the gas and the
liquid phases, respectively.
The surface tension model follows the continuum sur-
face force (CSF) model proposed by Brackbill et al.
(1992). The surface tension in Eq. 2 according to the CSF
model is computed as:
Fs ¼ rjrF ð7Þ
The surface tension is taken to be constant along the
surface and only the forces normal to the interface are
considered. According to the CSF model, the surface
curvature j is computed from local gradients in the surface
normal to the interface, which is given as:
j ¼ 1
j n jn
j n j � r� �
j n j �r � n� �
ð8Þ
where n = rF is the normal vector. Wall adhesion is
included in the model through the contact angle:
n̂ ¼ n̂wcoshþ t̂wsinh ð9Þ
where n̂ is the unit vector normal to the surface, n̂ ¼ njnj; n̂w
and t̂w represents the unit vector normal and tangent to the
wall, respectively.
Equations 1–9 are solved iteratively to obtain the liquid
volume fraction and the velocity field solution under
appropriate initial and boundary conditions. The effect of
gravity is not taken into account in the present study, as the
Bond number (Bo), qg h2/r is much less than unity, where
h is the height of the microchannel, g is the acceleration
due to gravity, q and r are the fluid density and surface
tension coefficient, respectively.
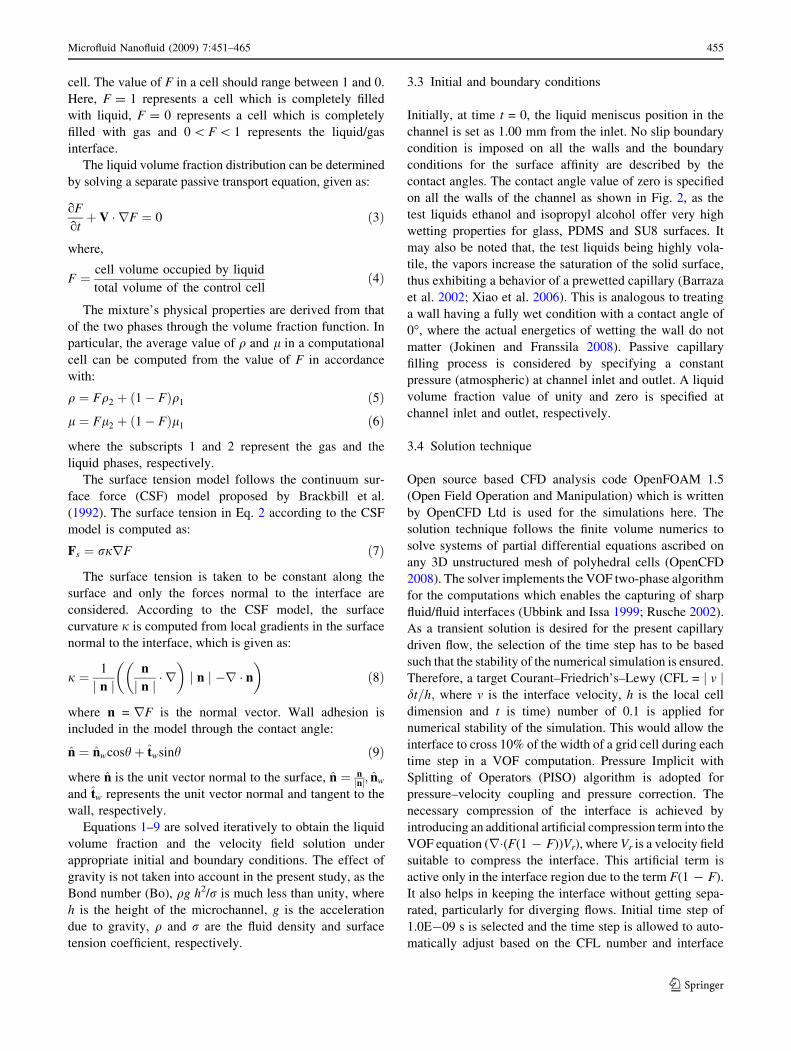
3.3 Initial and boundary conditions
Initially, at time t = 0, the liquid meniscus position in the
channel is set as 1.00 mm from the inlet. No slip boundary
condition is imposed on all the walls and the boundary
conditions for the surface affinity are described by the
contact angles. The contact angle value of zero is specified
on all the walls of the channel as shown in Fig. 2, as the
test liquids ethanol and isopropyl alcohol offer very high
wetting properties for glass, PDMS and SU8 surfaces. It
may also be noted that, the test liquids being highly vola-
tile, the vapors increase the saturation of the solid surface,
thus exhibiting a behavior of a prewetted capillary (Barraza
et al. 2002; Xiao et al. 2006). This is analogous to treating
a wall having a fully wet condition with a contact angle of
0�, where the actual energetics of wetting the wall do not
matter (Jokinen and Franssila 2008). Passive capillary
filling process is considered by specifying a constant
pressure (atmospheric) at channel inlet and outlet. A liquid
volume fraction value of unity and zero is specified at
channel inlet and outlet, respectively.
3.4 Solution technique
Open source based CFD analysis code OpenFOAM 1.5
(Open Field Operation and Manipulation) which is written
by OpenCFD Ltd is used for the simulations here. The
solution technique follows the finite volume numerics to
solve systems of partial differential equations ascribed on
any 3D unstructured mesh of polyhedral cells (OpenCFD
2008). The solver implements the VOF two-phase algorithm
for the computations which enables the capturing of sharp
fluid/fluid interfaces (Ubbink and Issa 1999; Rusche 2002).
As a transient solution is desired for the present capillary
driven flow, the selection of the time step has to be based
such that the stability of the numerical simulation is ensured.
Therefore, a target Courant–Friedrich’s–Lewy (CFL = j v jdt=h; where v is the interface velocity, h is the local cell
dimension and t is time) number of 0.1 is applied for
numerical stability of the simulation. This would allow the
interface to cross 10% of the width of a grid cell during each
time step in a VOF computation. Pressure Implicit with
Splitting of Operators (PISO) algorithm is adopted for
pressure–velocity coupling and pressure correction. The
necessary compression of the interface is achieved by
introducing an additional artificial compression term into the
VOF equation (r�(F(1 - F))Vr), where Vr is a velocity field
suitable to compress the interface. This artificial term is
active only in the interface region due to the term F(1 - F).
It also helps in keeping the interface without getting sepa-
rated, particularly for diverging flows. Initial time step of
1.0E-09 s is selected and the time step is allowed to auto-
matically adjust based on the CFL number and interface
Microfluid Nanofluid (2009) 7:451–465 455
123
velocity which ensures the stability in the solver. A con-
vergence criteria of 0.0001 is specified to control the
iterative solution process. In the numerical simulation, the
symmetry boundary condition about the center plane is used
because of the symmetric flow along the width and thickness
of the microchannel, and thus quarter of the geometry is only
computed. The isocontour of F = 0.5 is usually applied to
identify the interfacial position for computation and visu-
alization purposes. The computations are performed within a
clustered parallel environment based on open message
passing interface (OpenMPI) library and the mesh has been
decomposed using automatic load-balanced decomposition
method (Metis). The physical properties of ethanol and
isopropyl alcohol used for simulations are provided in
Table 1.
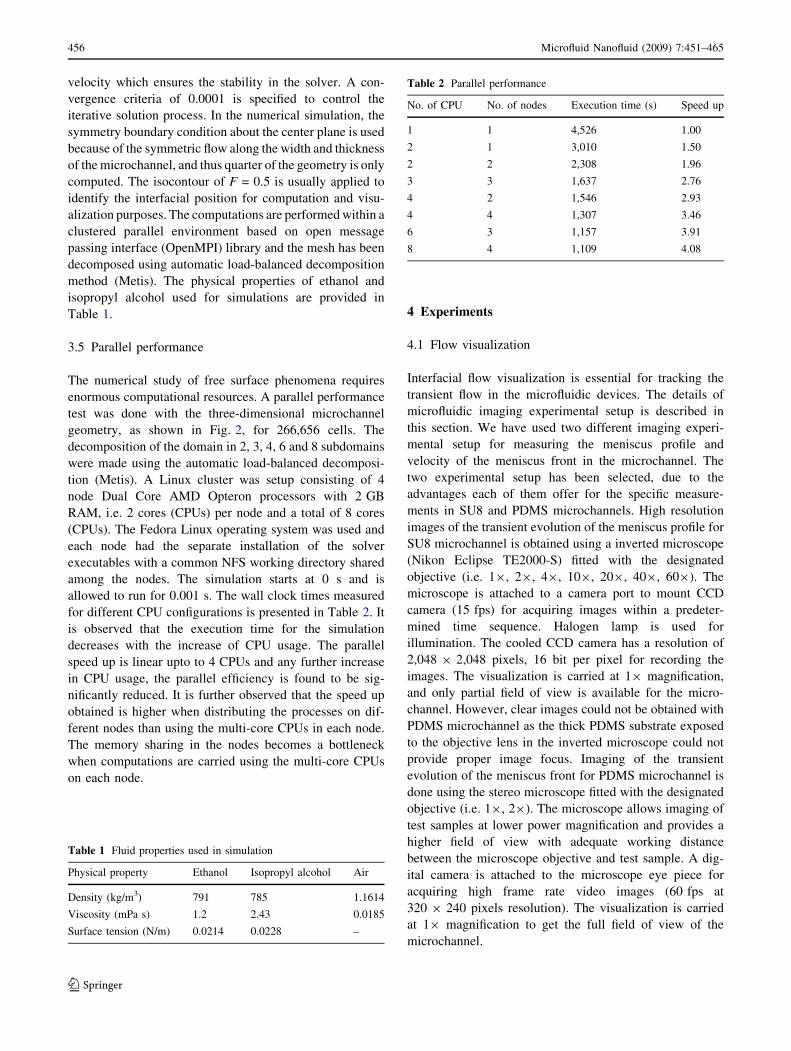
3.5 Parallel performance
The numerical study of free surface phenomena requires
enormous computational resources. A parallel performance
test was done with the three-dimensional microchannel
geometry, as shown in Fig. 2, for 266,656 cells. The
decomposition of the domain in 2, 3, 4, 6 and 8 subdomains
were made using the automatic load-balanced decomposi-
tion (Metis). A Linux cluster was setup consisting of 4
node Dual Core AMD Opteron processors with 2 GB
RAM, i.e. 2 cores (CPUs) per node and a total of 8 cores
(CPUs). The Fedora Linux operating system was used and
each node had the separate installation of the solver
executables with a common NFS working directory shared
among the nodes. The simulation starts at 0 s and is
allowed to run for 0.001 s. The wall clock times measured
for different CPU configurations is presented in Table 2. It
is observed that the execution time for the simulation
decreases with the increase of CPU usage. The parallel
speed up is linear upto to 4 CPUs and any further increase
in CPU usage, the parallel efficiency is found to be sig-
nificantly reduced. It is further observed that the speed up
obtained is higher when distributing the processes on dif-
ferent nodes than using the multi-core CPUs in each node.
The memory sharing in the nodes becomes a bottleneck
when computations are carried using the multi-core CPUs
on each node.
4 Experiments
4.1 Flow visualization
Interfacial flow visualization is essential for tracking the
transient flow in the microfluidic devices. The details of
microfluidic imaging experimental setup is described in
this section. We have used two different imaging experi-
mental setup for measuring the meniscus profile and
velocity of the meniscus front in the microchannel. The
two experimental setup has been selected, due to the
advantages each of them offer for the specific measure-
ments in SU8 and PDMS microchannels. High resolution
images of the transient evolution of the meniscus profile for
SU8 microchannel is obtained using a inverted microscope
(Nikon Eclipse TE2000-S) fitted with the designated
objective (i.e. 19, 29, 49, 109, 209, 409, 609). The
microscope is attached to a camera port to mount CCD
camera (15 fps) for acquiring images within a predeter-
mined time sequence. Halogen lamp is used for
illumination. The cooled CCD camera has a resolution of
2,048 9 2,048 pixels, 16 bit per pixel for recording the
images. The visualization is carried at 19 magnification,
and only partial field of view is available for the micro-
channel. However, clear images could not be obtained with
PDMS microchannel as the thick PDMS substrate exposed
to the objective lens in the inverted microscope could not
provide proper image focus. Imaging of the transient
evolution of the meniscus front for PDMS microchannel is
done using the stereo microscope fitted with the designated
objective (i.e. 19, 29). The microscope allows imaging of
test samples at lower power magnification and provides a
higher field of view with adequate working distance
between the microscope objective and test sample. A dig-
ital camera is attached to the microscope eye piece for
acquiring high frame rate video images (60 fps at
320 9 240 pixels resolution). The visualization is carried
at 19 magnification to get the full field of view of the
microchannel.
Table 1 Fluid properties used in simulation
Physical property Ethanol Isopropyl alcohol Air
Density (kg/m3) 791 785 1.1614
Viscosity (mPa s) 1.2 2.43 0.0185
Surface tension (N/m) 0.0214 0.0228 –
Table 2 Parallel performance
No. of CPU No. of nodes Execution time (s) Speed up
1 1 4,526 1.00
2 1 3,010 1.50
2 2 2,308 1.96
3 3 1,637 2.76
4 2 1,546 2.93
4 4 1,307 3.46
6 3 1,157 3.91
8 4 1,109 4.08
456 Microfluid Nanofluid (2009) 7:451–465
123
5 Results and discussion
5.1 Simulation results
5.1.1 Validation of numerical solution with analytical
solution for a two-dimensional and three-
dimensional rectangular microchannel
Validation of the numerical results with analytical solution
has been carried out for a rectangular microchannel 40 lm
in height, 7,000 lm length and 3000 lm wide with black
ink (Quinte et al. 2001) as working fluid (q = 1032.2 kg/
m3, r = 0.072 N/m and l = 0.00137 Pa s) with contact
angle h = 36�. The time evolution of meniscus displace-
ment is considered as the parameter for validating the
numerical results.
The analytical solution is based on a reduced-order
model (Zeng 2007) and is derived here for clarity. For the
channel height of 120 lm selected in this study, the
Capillary number (Ca), lU/r, is much less than unity and
hence, the effects of dynamic contact angle are not taken
into account in the present study (Huang et al. 2006;
Bayramli and Powell 1989). A more elaborate approach
for a capillary flow in two-dimensional channel has been
considered including the effects of added or virtual mass,
meniscus traction regime and dynamical evolution of the
contact angle in (Chakraborty 2005, 2007c; Chakraborty
and Mittal 2007; Chakraborty and Tsuchiya 2008). A
reduced order model (Zeng 2007) which accounts for
inertial forces is considered for validating the numerical
results with analytical solution for a rectangular micro-
channel. The momentum conservation in a two-
dimensional microchannel can be expressed in terms of a
balance between the surface tension force, pressure
overhead and wall viscous force. At time t, if L is the
distance travelled by the liquid meniscus and uavg is the
average fluid velocity, then the momentum balance can be
written as,
d
dtðqhLuavgÞ ¼ 2rcoshþ DPh� 12lL
huavg ð10Þ
For a passive capillary filling process, DP = 0. Noting
uavg = dL/dt, the equation above can be re-written as
d2
dt2L2 þ B
d
dtL2 ¼ A ð11Þ
where,
A ¼ 4rcoshþ 2DPh
qh; B ¼ 12l
qh2
Considering the initial liquid meniscus position in the
channel as L0 and with zero velocity, the transient solution
of the capillary filling problem is given as:
L ¼ A
B2expð�BtÞ þ At
Bþ ðL2
0 �A
B2Þ
� �12
ð12Þ
uavg ¼Að1� expð�BtÞÞ
2BLð13Þ
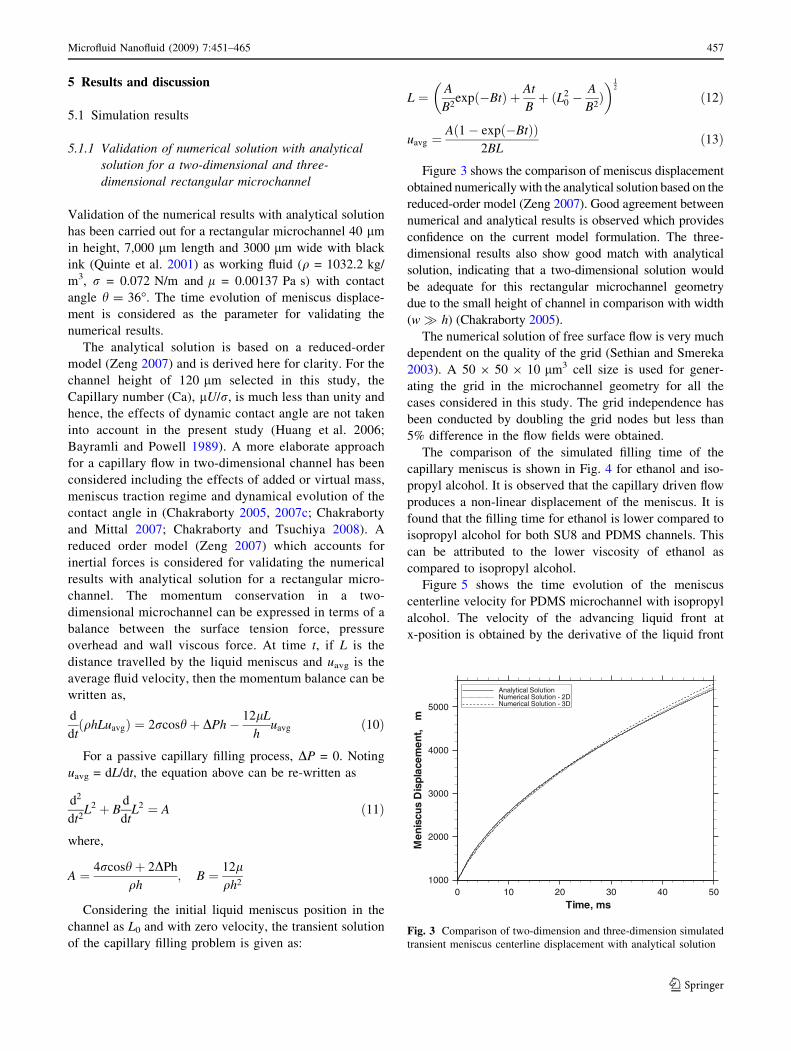
Figure 3 shows the comparison of meniscus displacement
obtained numerically with the analytical solution based on the
reduced-order model (Zeng 2007). Good agreement between
numerical and analytical results is observed which provides
confidence on the current model formulation. The three-
dimensional results also show good match with analytical
solution, indicating that a two-dimensional solution would
be adequate for this rectangular microchannel geometry
due to the small height of channel in comparison with width
(w� h) (Chakraborty 2005).
The numerical solution of free surface flow is very much
dependent on the quality of the grid (Sethian and Smereka
2003). A 50 9 50 9 10 lm3 cell size is used for gener-
ating the grid in the microchannel geometry for all the
cases considered in this study. The grid independence has
been conducted by doubling the grid nodes but less than
5% difference in the flow fields were obtained.
The comparison of the simulated filling time of the
capillary meniscus is shown in Fig. 4 for ethanol and iso-
propyl alcohol. It is observed that the capillary driven flow
produces a non-linear displacement of the meniscus. It is
found that the filling time for ethanol is lower compared to
isopropyl alcohol for both SU8 and PDMS channels. This
can be attributed to the lower viscosity of ethanol as
compared to isopropyl alcohol.
Figure 5 shows the time evolution of the meniscus
centerline velocity for PDMS microchannel with isopropyl
alcohol. The velocity of the advancing liquid front at
x-position is obtained by the derivative of the liquid front
Time, ms
Men
iscu
sD
ispl
acem
ent,
µm
0 10 20 30 40 501000
2000
3000
4000
5000
Analytical SolutionNumerical Solution - 2DNumerical Solution - 3D
Fig. 3 Comparison of two-dimension and three-dimension simulated
transient meniscus centerline displacement with analytical solution
Microfluid Nanofluid (2009) 7:451–465 457
123
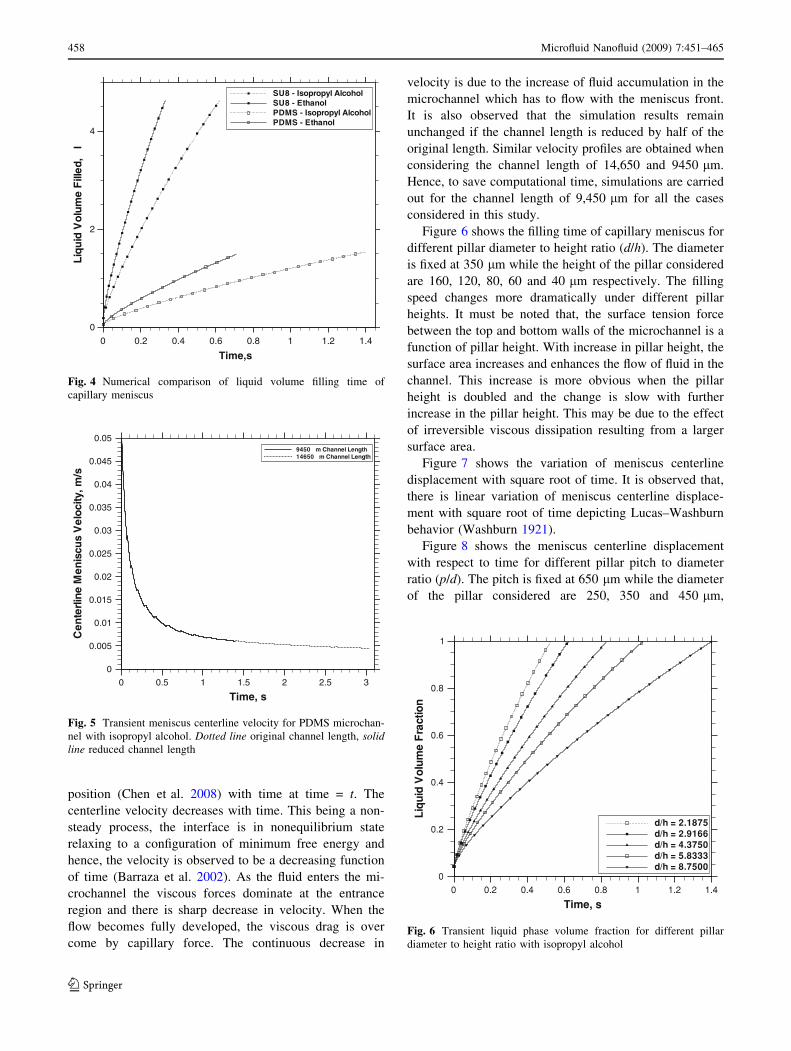
position (Chen et al. 2008) with time at time = t. The
centerline velocity decreases with time. This being a non-
steady process, the interface is in nonequilibrium state
relaxing to a configuration of minimum free energy and
hence, the velocity is observed to be a decreasing function
of time (Barraza et al. 2002). As the fluid enters the mi-
crochannel the viscous forces dominate at the entrance
region and there is sharp decrease in velocity. When the
flow becomes fully developed, the viscous drag is over
come by capillary force. The continuous decrease in
velocity is due to the increase of fluid accumulation in the
microchannel which has to flow with the meniscus front.
It is also observed that the simulation results remain
unchanged if the channel length is reduced by half of the
original length. Similar velocity profiles are obtained when
considering the channel length of 14,650 and 9450 lm.
Hence, to save computational time, simulations are carried
out for the channel length of 9,450 lm for all the cases
considered in this study.
Figure 6 shows the filling time of capillary meniscus for
different pillar diameter to height ratio (d/h). The diameter
is fixed at 350 lm while the height of the pillar considered
are 160, 120, 80, 60 and 40 lm respectively. The filling
speed changes more dramatically under different pillar
heights. It must be noted that, the surface tension force
between the top and bottom walls of the microchannel is a
function of pillar height. With increase in pillar height, the
surface area increases and enhances the flow of fluid in the
channel. This increase is more obvious when the pillar
height is doubled and the change is slow with further
increase in the pillar height. This may be due to the effect
of irreversible viscous dissipation resulting from a larger
surface area.
Figure 7 shows the variation of meniscus centerline
displacement with square root of time. It is observed that,
there is linear variation of meniscus centerline displace-
ment with square root of time depicting Lucas–Washburn
behavior (Washburn 1921).
Figure 8 shows the meniscus centerline displacement
with respect to time for different pillar pitch to diameter
ratio (p/d). The pitch is fixed at 650 lm while the diameter
of the pillar considered are 250, 350 and 450 lm,
Time,s
Liq
uid
Vol
um
eF
illed
,µl
0 0.2 0.4 0.6 0.8 1 1.2 1.4
0
2
4
SU8 - Isopropyl AlcoholSU8 - EthanolPDMS - Isopropyl AlcoholPDMS - Ethanol
Fig. 4 Numerical comparison of liquid volume filling time of
capillary meniscus
Time, s
Cen
terl
ine
Men
iscu
sV
elo
city
,m/s
0 0.5 1 1.5 2 2.5 3
0
0.005
0.01
0.015
0.02
0.025
0.03
0.035
0.04
0.045
0.059450 µm Channel Length14650 µm Channel Length
Fig. 5 Transient meniscus centerline velocity for PDMS microchan-
nel with isopropyl alcohol. Dotted line original channel length, solidline reduced channel length
Time, s
Liq
uid
Vo
lum
eF
ract
ion
0 0.2 0.4 0.6 0.8 1 1.2 1.4
0
0.2
0.4
0.6
0.8
1
d/h = 2.1875d/h = 2.9166d/h = 4.3750d/h = 5.8333d/h = 8.7500
Fig. 6 Transient liquid phase volume fraction for different pillar
diameter to height ratio with isopropyl alcohol
458 Microfluid Nanofluid (2009) 7:451–465
123
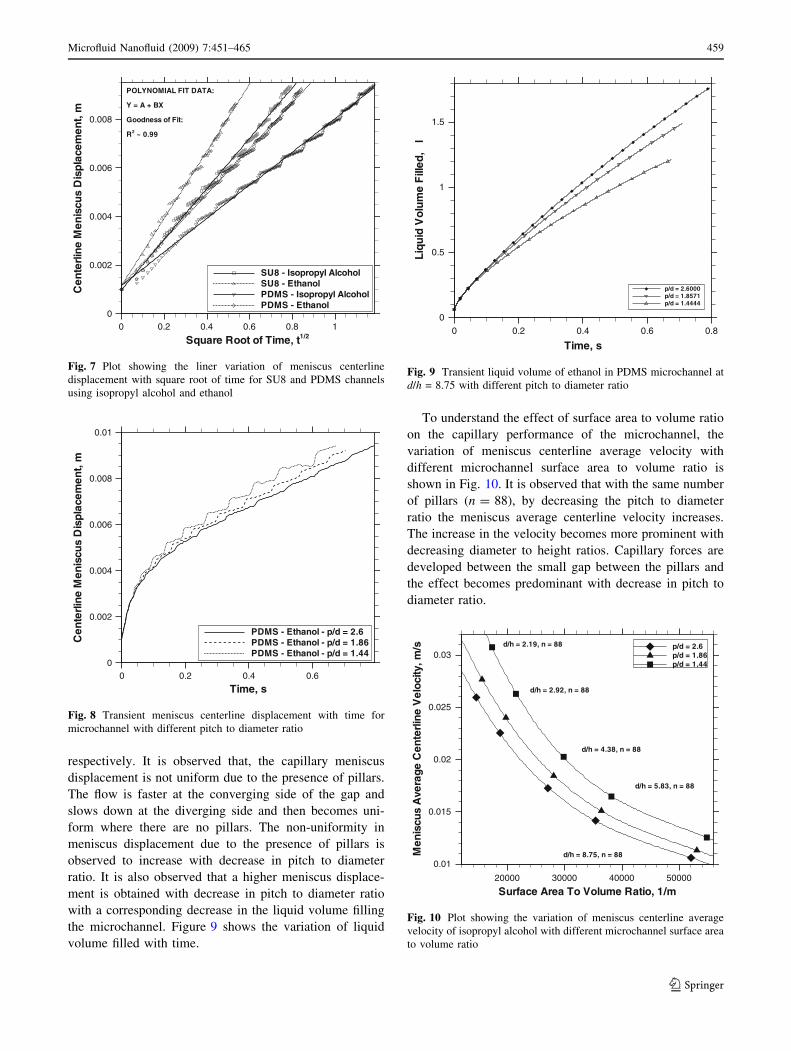
respectively. It is observed that, the capillary meniscus
displacement is not uniform due to the presence of pillars.
The flow is faster at the converging side of the gap and
slows down at the diverging side and then becomes uni-
form where there are no pillars. The non-uniformity in
meniscus displacement due to the presence of pillars is
observed to increase with decrease in pitch to diameter
ratio. It is also observed that a higher meniscus displace-
ment is obtained with decrease in pitch to diameter ratio
with a corresponding decrease in the liquid volume filling
the microchannel. Figure 9 shows the variation of liquid
volume filled with time.
To understand the effect of surface area to volume ratio
on the capillary performance of the microchannel, the
variation of meniscus centerline average velocity with
different microchannel surface area to volume ratio is
shown in Fig. 10. It is observed that with the same number
of pillars (n = 88), by decreasing the pitch to diameter
ratio the meniscus average centerline velocity increases.
The increase in the velocity becomes more prominent with
decreasing diameter to height ratios. Capillary forces are
developed between the small gap between the pillars and
the effect becomes predominant with decrease in pitch to
diameter ratio.
Square Root of Time, t1/2
Cen
terl
ine
Men
iscu
sD
isp
lace
men
t,m
0 0.2 0.4 0.6 0.8 10
0.002
0.004
0.006
0.008
SU8 - Isopropyl AlcoholSU8 - EthanolPDMS - Isopropyl AlcoholPDMS - Ethanol
POLYNOMIAL FIT DATA:
Y = A + BX
Goodness of Fit:
R2 ~ 0.99
Fig. 7 Plot showing the liner variation of meniscus centerline
displacement with square root of time for SU8 and PDMS channels
using isopropyl alcohol and ethanol
Time, s
Cen
terli
ne
Men
iscu
sD
isp
lace
men
t,m
0 0.2 0.4 0.60
0.002
0.004
0.006
0.008
0.01
PDMS - Ethanol - p/d = 2.6PDMS - Ethanol - p/d = 1.86PDMS - Ethanol - p/d = 1.44
Fig. 8 Transient meniscus centerline displacement with time for
microchannel with different pitch to diameter ratio
Time, s
Liq
uid
Vo
lum
eF
illed
,µl
0 0.2 0.4 0.6 0.8
0
0.5
1
1.5
p/d = 2.6000p/d = 1.8571p/d = 1.4444
Fig. 9 Transient liquid volume of ethanol in PDMS microchannel at
d/h = 8.75 with different pitch to diameter ratio
Surface Area To Volume Ratio, 1/m
Men
iscu
sA
vera
geC
ente
rlin
eV
elo
city
,m/s
20000 30000 40000 50000
0.01
0.015
0.02
0.025
0.03p/d = 2.6p/d = 1.86p/d = 1.44
d/h = 2.92, n = 88
d/h = 4.38, n = 88
d/h = 2.19, n = 88
d/h = 8.75, n = 88
d/h = 5.83, n = 88
Fig. 10 Plot showing the variation of meniscus centerline average
velocity of isopropyl alcohol with different microchannel surface area
to volume ratio
Microfluid Nanofluid (2009) 7:451–465 459
123
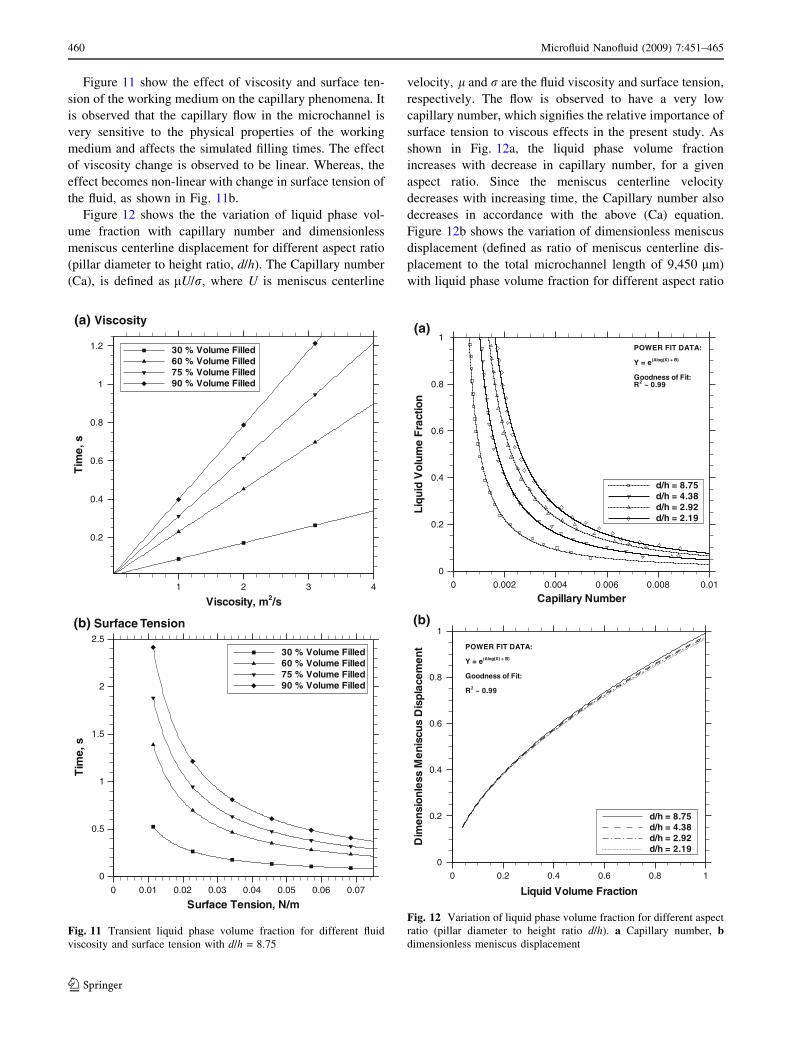
Figure 11 show the effect of viscosity and surface ten-
sion of the working medium on the capillary phenomena. It
is observed that the capillary flow in the microchannel is
very sensitive to the physical properties of the working
medium and affects the simulated filling times. The effect
of viscosity change is observed to be linear. Whereas, the
effect becomes non-linear with change in surface tension of
the fluid, as shown in Fig. 11b.
Figure 12 shows the the variation of liquid phase vol-
ume fraction with capillary number and dimensionless
meniscus centerline displacement for different aspect ratio
(pillar diameter to height ratio, d/h). The Capillary number
(Ca), is defined as lU/r, where U is meniscus centerline
velocity, l and r are the fluid viscosity and surface tension,
respectively. The flow is observed to have a very low
capillary number, which signifies the relative importance of
surface tension to viscous effects in the present study. As
shown in Fig. 12a, the liquid phase volume fraction
increases with decrease in capillary number, for a given
aspect ratio. Since the meniscus centerline velocity
decreases with increasing time, the Capillary number also
decreases in accordance with the above (Ca) equation.
Figure 12b shows the variation of dimensionless meniscus
displacement (defined as ratio of meniscus centerline dis-
placement to the total microchannel length of 9,450 lm)
with liquid phase volume fraction for different aspect ratio
Viscosity, m2/s
Tim
e,s
1 2 3 4
0.2
0.4
0.6
0.8
1
1.2 30 % Volume Filled60 % Volume Filled75 % Volume Filled90 % Volume Filled
Surface Tension, N/m
Tim
e,s
0 0.01 0.02 0.03 0.04 0.05 0.06 0.07
0
0.5
1
1.5
2
2.530 % Volume Filled60 % Volume Filled75 % Volume Filled90 % Volume Filled
(a) Viscosity
(b) Surface Tension
Fig. 11 Transient liquid phase volume fraction for different fluid
viscosity and surface tension with d/h = 8.75
Capillary Number
Liqu
idV
olu
me
Fra
ctio
n
0 0.002 0.004 0.006 0.008 0.01
0
0.2
0.4
0.6
0.8
1
d/h = 8.75d/h = 4.38d/h = 2.92d/h = 2.19
POWER FIT DATA:
Y = e(Alog(X) + B)
Goodness of Fit:R2 ~ 0.99
Liquid Volume Fraction
Dim
ensi
onle
ssM
enis
cus
Dis
plac
emen
t
0 0.2 0.4 0.6 0.8 1
0
0.2
0.4
0.6
0.8
1
d/h = 8.75d/h = 4.38d/h = 2.92d/h = 2.19
POWER FIT DATA:
Y = e(Alog(X) + B)
Goodness of Fit:
R2 ~ 0.99
(a)
(b)
Fig. 12 Variation of liquid phase volume fraction for different aspect
ratio (pillar diameter to height ratio d/h). a Capillary number, bdimensionless meniscus displacement
460 Microfluid Nanofluid (2009) 7:451–465
123
(pillar diameter to height ratio, d/h). It is observed that,
there is a non linear variation of dimensionless meniscus
displacement with liquid phase volume fraction. This
relates the meniscus centerline displacement with the vol-
ume of fluid filled for different aspect ratios. It is observed
that with decrease in aspect ratio a lower liquid phase
volume fraction is obtained for a fixed dimensionless
meniscus displacement. This is more prominent at higher
values of dimensionless meniscus centerline displacement.
The lower liquid phase volume fraction may be due to the
irreversible viscous dissipation resulting from a larger
surface area when aspect ratio is less. These results can be
used for quick estimates of the performance parameters for
the design of the microfluidic devices.
5.2 Experimental verification
Droplets of ethanol and isopropyl alcohol are introduced in
the microchannel reservoir using a micro pipette (0.5–
10 ll) so that adequate volume of droplets are dispensed
for effective passive capillary flow. Figure 13 shows the
schematic drawing of experimental setup. Many successive
runs were performed for each of the test fluids. After each
experiment, the liquid in the microchannel is blown away
to set the initial condition in the channel free of any liquid
traces. We have allowed sufficient time to ensure no trace
of liquid is left before the commencement of repeat runs.
From the successive runs of isopropyl alcohol and ethanol,
the interface motion seems to be well repeatable under
identical conditions. It was also observed during the
experiments that, always a thin liquid film is formed
adjacent to the meniscus interface for both the working
medium. Thus the interface motion is always wet due to the
high wetting properties of the test liquids for glass, PDMS
and SU8 surfaces.
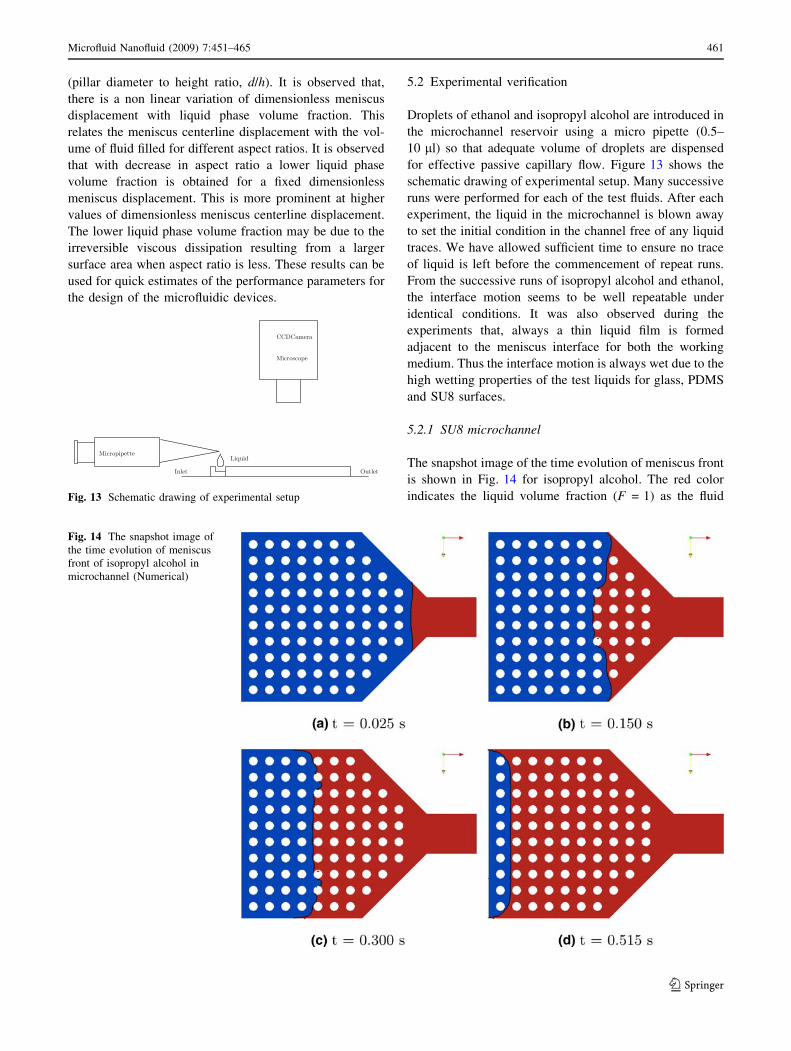
5.2.1 SU8 microchannel
The snapshot image of the time evolution of meniscus front
is shown in Fig. 14 for isopropyl alcohol. The red color
indicates the liquid volume fraction (F = 1) as the fluid
Fig. 14 The snapshot image of
the time evolution of meniscus
front of isopropyl alcohol in
microchannel (Numerical)
CCDCamera
Microscope
teltuOtelnI
MicropipetteLiquid
Fig. 13 Schematic drawing of experimental setup
Microfluid Nanofluid (2009) 7:451–465 461
123
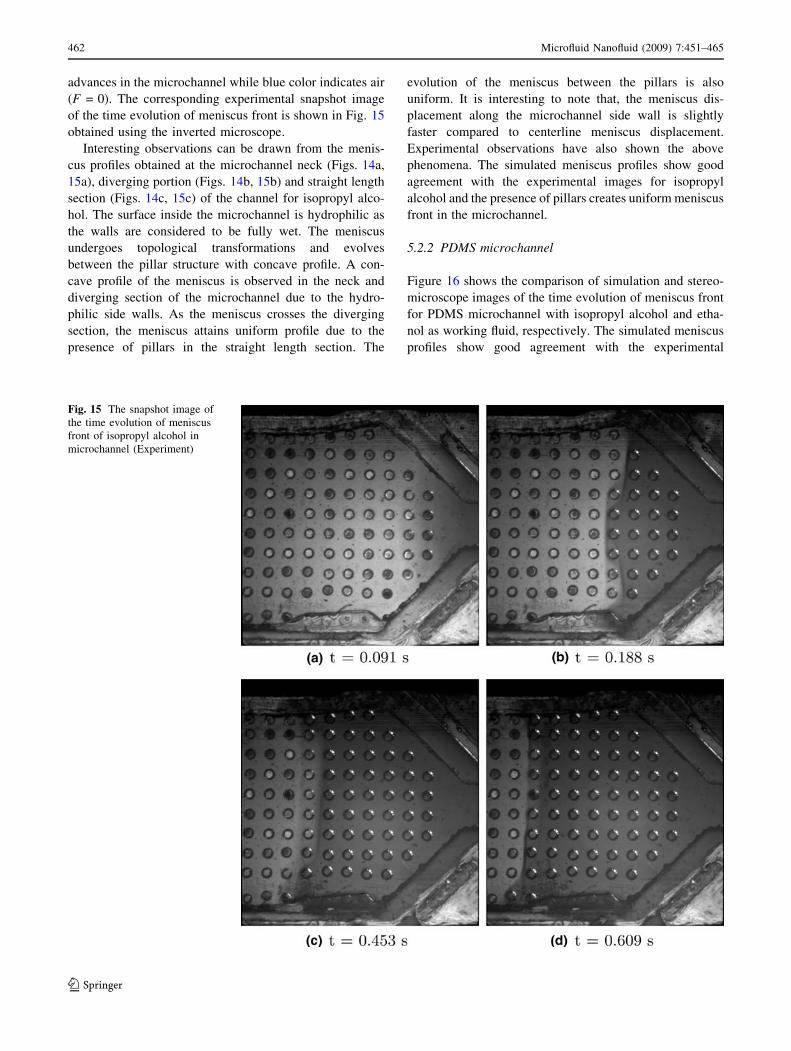
advances in the microchannel while blue color indicates air
(F = 0). The corresponding experimental snapshot image
of the time evolution of meniscus front is shown in Fig. 15
obtained using the inverted microscope.
Interesting observations can be drawn from the menis-
cus profiles obtained at the microchannel neck (Figs. 14a,
15a), diverging portion (Figs. 14b, 15b) and straight length
section (Figs. 14c, 15c) of the channel for isopropyl alco-
hol. The surface inside the microchannel is hydrophilic as
the walls are considered to be fully wet. The meniscus
undergoes topological transformations and evolves
between the pillar structure with concave profile. A con-
cave profile of the meniscus is observed in the neck and
diverging section of the microchannel due to the hydro-
philic side walls. As the meniscus crosses the diverging
section, the meniscus attains uniform profile due to the
presence of pillars in the straight length section. The
evolution of the meniscus between the pillars is also
uniform. It is interesting to note that, the meniscus dis-
placement along the microchannel side wall is slightly
faster compared to centerline meniscus displacement.
Experimental observations have also shown the above
phenomena. The simulated meniscus profiles show good
agreement with the experimental images for isopropyl
alcohol and the presence of pillars creates uniform meniscus
front in the microchannel.
5.2.2 PDMS microchannel
Figure 16 shows the comparison of simulation and stereo-
microscope images of the time evolution of meniscus front
for PDMS microchannel with isopropyl alcohol and etha-
nol as working fluid, respectively. The simulated meniscus
profiles show good agreement with the experimental
Fig. 15 The snapshot image of
the time evolution of meniscus
front of isopropyl alcohol in
microchannel (Experiment)
462 Microfluid Nanofluid (2009) 7:451–465
123
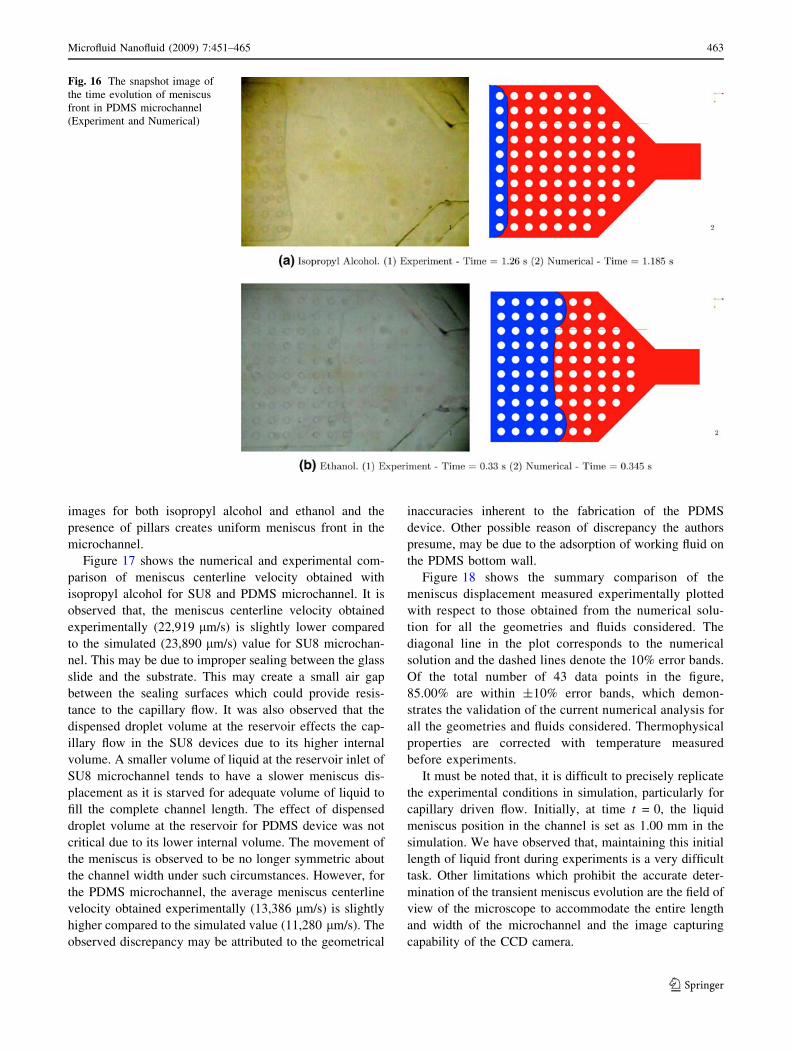
images for both isopropyl alcohol and ethanol and the
presence of pillars creates uniform meniscus front in the
microchannel.
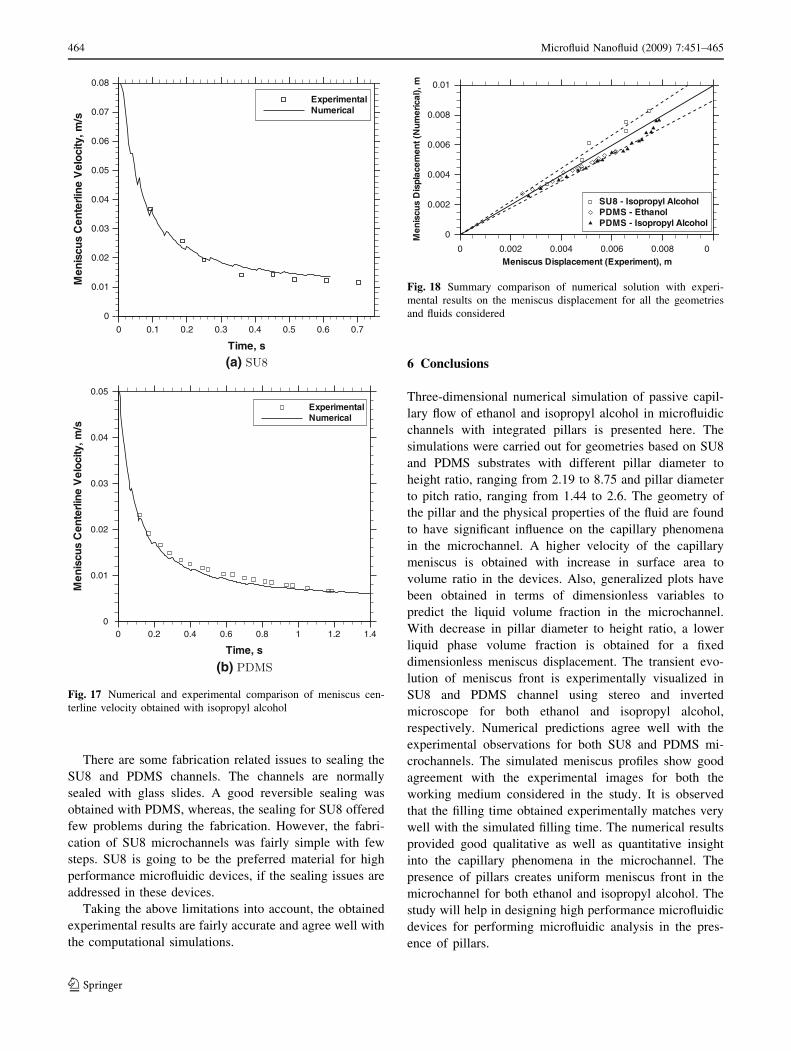
Figure 17 shows the numerical and experimental com-
parison of meniscus centerline velocity obtained with
isopropyl alcohol for SU8 and PDMS microchannel. It is
observed that, the meniscus centerline velocity obtained
experimentally (22,919 lm/s) is slightly lower compared
to the simulated (23,890 lm/s) value for SU8 microchan-
nel. This may be due to improper sealing between the glass
slide and the substrate. This may create a small air gap
between the sealing surfaces which could provide resis-
tance to the capillary flow. It was also observed that the
dispensed droplet volume at the reservoir effects the cap-
illary flow in the SU8 devices due to its higher internal
volume. A smaller volume of liquid at the reservoir inlet of
SU8 microchannel tends to have a slower meniscus dis-
placement as it is starved for adequate volume of liquid to
fill the complete channel length. The effect of dispensed
droplet volume at the reservoir for PDMS device was not
critical due to its lower internal volume. The movement of
the meniscus is observed to be no longer symmetric about
the channel width under such circumstances. However, for
the PDMS microchannel, the average meniscus centerline
velocity obtained experimentally (13,386 lm/s) is slightly
higher compared to the simulated value (11,280 lm/s). The
observed discrepancy may be attributed to the geometrical
inaccuracies inherent to the fabrication of the PDMS
device. Other possible reason of discrepancy the authors
presume, may be due to the adsorption of working fluid on
the PDMS bottom wall.
Figure 18 shows the summary comparison of the
meniscus displacement measured experimentally plotted
with respect to those obtained from the numerical solu-
tion for all the geometries and fluids considered. The
diagonal line in the plot corresponds to the numerical
solution and the dashed lines denote the 10% error bands.
Of the total number of 43 data points in the figure,
85.00% are within ±10% error bands, which demon-
strates the validation of the current numerical analysis for
all the geometries and fluids considered. Thermophysical
properties are corrected with temperature measured
before experiments.
It must be noted that, it is difficult to precisely replicate
the experimental conditions in simulation, particularly for
capillary driven flow. Initially, at time t = 0, the liquid
meniscus position in the channel is set as 1.00 mm in the
simulation. We have observed that, maintaining this initial
length of liquid front during experiments is a very difficult
task. Other limitations which prohibit the accurate deter-
mination of the transient meniscus evolution are the field of
view of the microscope to accommodate the entire length
and width of the microchannel and the image capturing
capability of the CCD camera.
Fig. 16 The snapshot image of
the time evolution of meniscus
front in PDMS microchannel
(Experiment and Numerical)
Microfluid Nanofluid (2009) 7:451–465 463
123
There are some fabrication related issues to sealing the
SU8 and PDMS channels. The channels are normally
sealed with glass slides. A good reversible sealing was
obtained with PDMS, whereas, the sealing for SU8 offered
few problems during the fabrication. However, the fabri-
cation of SU8 microchannels was fairly simple with few
steps. SU8 is going to be the preferred material for high
performance microfluidic devices, if the sealing issues are
addressed in these devices.
Taking the above limitations into account, the obtained
experimental results are fairly accurate and agree well with
the computational simulations.
6 Conclusions
Three-dimensional numerical simulation of passive capil-
lary flow of ethanol and isopropyl alcohol in microfluidic
channels with integrated pillars is presented here. The
simulations were carried out for geometries based on SU8
and PDMS substrates with different pillar diameter to
height ratio, ranging from 2.19 to 8.75 and pillar diameter
to pitch ratio, ranging from 1.44 to 2.6. The geometry of
the pillar and the physical properties of the fluid are found
to have significant influence on the capillary phenomena
in the microchannel. A higher velocity of the capillary
meniscus is obtained with increase in surface area to
volume ratio in the devices. Also, generalized plots have
been obtained in terms of dimensionless variables to
predict the liquid volume fraction in the microchannel.
With decrease in pillar diameter to height ratio, a lower
liquid phase volume fraction is obtained for a fixed
dimensionless meniscus displacement. The transient evo-
lution of meniscus front is experimentally visualized in
SU8 and PDMS channel using stereo and inverted
microscope for both ethanol and isopropyl alcohol,
respectively. Numerical predictions agree well with the
experimental observations for both SU8 and PDMS mi-
crochannels. The simulated meniscus profiles show good
agreement with the experimental images for both the
working medium considered in the study. It is observed
that the filling time obtained experimentally matches very
well with the simulated filling time. The numerical results
provided good qualitative as well as quantitative insight
into the capillary phenomena in the microchannel. The
presence of pillars creates uniform meniscus front in the
microchannel for both ethanol and isopropyl alcohol. The
study will help in designing high performance microfluidic
devices for performing microfluidic analysis in the pres-
ence of pillars.
Time, s
Men
iscu
sC
ente
rline
Vel
oci
ty,m
/s
0 0.1 0.2 0.3 0.4 0.5 0.6 0.7
0
0.01
0.02
0.03
0.04
0.05
0.06
0.07
0.08
ExperimentalNumerical
Time, s
Men
iscu
sC
ente
rline
Vel
oci
ty,m
/s
0 0.2 0.4 0.6 0.8 1 1.2 1.40
0.01
0.02
0.03
0.04
0.05
ExperimentalNumerical
SU8
PDMS
(a)
(b)
Fig. 17 Numerical and experimental comparison of meniscus cen-
terline velocity obtained with isopropyl alcohol
Meniscus Displacement (Experiment), m
Men
iscu
sD
ispl
acem
ent(
Nu
mer
ical
),m
0 0.002 0.004 0.006 0.008 0
0
0.002
0.004
0.006
0.008
0.01
SU8 - Isopropyl AlcoholPDMS - EthanolPDMS - Isopropyl Alcohol
Fig. 18 Summary comparison of numerical solution with experi-
mental results on the meniscus displacement for all the geometries
and fluids considered
464 Microfluid Nanofluid (2009) 7:451–465
123
Acknowledgments The support of Suman Mashruwala Advanced
Microengineering Laboratory, IIT Bombay is highly appreciated. The
authors also like to acknowledge the UKIERI funding provided to S.
K. Mitra and J. McLaughlin to carry out this collaborative work.
References
Barraza HJ, Kunapuli S, O’Rear EA (2002) Advancing contact angles
of Newtonian fluids during high velocity, transient, capillary
driven flow in a parallel plate geometry. J Phys Chem B
106:4979–4987
Bayramli E, Powell RL (1989) The normal (transverse) impregnation
of liquids into axially oriented fibre bundles. J Colloid Interface
Sci 138(2):346–353
Brackbill JU, Kothe DB, Zemach C (1992) A continuum method for
modeling surface tension. J Comp Phys 100:335–354
Chakraborty S (2005) Dynamics of capillary flow of blood into
microfluidic channel. Lab Chip 5:421–430
Chakraborty S (2007a) Order parameter modeling of fluid dynamics
of narrow confinements subjected to hydrophobic interactions.
Phys Rev Lett 99:094504
Chakraborty S (2007b) Towards a generalized representation of
surface effects on pressure-driven liquid flow in microchannels.
Appl Phys Lett 90:034108
Chakraborty S (2007c) Electroosmotically driven capillary transport
of typical non-Newtonian biofluids in rectangular microchan-
nels. Anal Chim Acta 605:175–184
Chakraborty S, Mittal R (2007) Droplet dynamics in a microchannel
subjected to electrocapillary actuation. J Appl Phys 101:104901
Chakraborty S, Das T, Chattoraj S (2007) A generalized model for
probing frictional characteristics of pressure-driven liquid
microflows. J Appl Phys 102:104907
Chakraborty S, Tsuchiya K (2008) Development and fluidic simula-
tion of microneedles for painless pathological interfacing with
living systems. J Appl Phys 103:114701
Chakraborty S, Dinkar AK (2008) Implications of hydrophobic
interactions and consequent apparent slip phenomenon on the
entrance region transport of liquid through microchannels. Phys
Fluids 20:043602
Chen YF, Tseng FG, Chien SYC, Chen MH, Yu RJ, Chieng CC
(2008) Surface tension driven flow for open microchannels with
different turning angles. Microfluid Nanofluid 5(2):193–203
Hirt CW, Nichols BD (1981) Volume of fluid (VOF) method for the
dynamics of free boundaries. J Comp Phys 39:201–225
Huang W, Liu Q, Li Y (2006) Capillary filling flows inside patterned-
surface microchannels. Chem Eng Technol 26:716–723
Jensen MJ (2002) Bubbles in microchannels. MSc thesis, Technical
University of Denmark, Denmark
Jimack PK (2004) Adaptive algorithms for free-surface flow
problems. In: Proceedings of the 4th international conference
on engineering computational technology, Lisbon, Portugal,
pp 1–24
Jokinen V, Franssila S (2008) Capillarity in microfluidic channels
with hydrophilic and hydrophobic walls. Microfluid Nanofluid
5:443–448
Kern P, Veh J, Michler J (2007) New developments in through-mask
electrochemical micromachining of titanium. J Micromech
Microeng 17:1168–1177
Kim B, Peterson ETK, Papautsky I (2004) Long-term stability of
plasma oxidized PDMS surfaces. In: Proceedings of the 26th annual
international conference of the IEEE EMBS, San Francisco,
pp 5013–5016
Lin CM (2004) Enhancement of underfill capillary flow in flip-chip
packaging by means of the inertia effect. IEEE Trans Adv
Packag 27(3):533–539
Lin CM, Chang WJ, Fang TH (2007) Flip-Chip underfill packaging
considering capillary force, pressure difference, and inertia
effects. J Electron Packag 129:48–55
Losey MW, Jackman RJ, Firebaugh SL, Schmidt MA, Jensen KF
(2002) Design and fabrication of microfluidic devices for
multiphase mixing and reaction. J Microelectromech Syst
11(6):709–717
McDonald JC, Whitesides GM (2002) Poly(dimethylsiloxane) as a
material for fabricating microfludic devices. Acc Chem Res
35(7):491–499
Mery E, Ricoul F, Sarrut N, Constantin O, Delapierre D, Garin J,
Vinet F (2008) A silicon microfluidic chip integrating an ordered
micropillar array separation column and a nano-electrospray
emitter for LC/MS analysis of peptides. Sens Actuators B
134:438–446
Nissila T, Sainiemi L, Sikanen T, Kotiaho T, Franssila S, Kostiainen
R, Ketola RA (2007) Silicon micropillar array electrospray chip
for drug and biomolecule analysis. Rapid Commun Mass
Spectrom 21:3677–3682
OpenCFD Ltd (2008) OpenFOAM user guide. Version 1.5 ed
Probstein R (1994) Physicochemical hydrodynamics. Wiley, New
York
Quinte A, Halstenberg S, Eggert H (2001) Use of numerical methods
for modeling and simulating capillary driven flows in micro-
channels. Nanotech 2001:250–253
Rusche H (2002) Computational fluid dynamics of dispersed two-
phase flows at high phase fractions. PhD thesis, Imperial
College, University of London, London
Seemann R, Kramer EJ, Lange FF (2004) Patterning of polymers:
precise channel stamping by optimizing wetting properties. New
J Phys 6:110
Sethian JA, Smereka P (2003) Level set methods for fluid interfaces.
Ann Rev Fluid Mech 35:341–372
Son SU, Seo JH, Choi YH, Lee SS (2006) Fabrication of a disposable
biochip for measuring percent hemoglobin Alc (% HbAlc). Sens
Actuators A 130–131:267–272
Thorslund S, Larsson R, Bergquist J, Nikolajeff F, Sanchez J (2008)
A PDMS-based disposable microfluidic sensor for CD4?
lymphocyte counting. Biomed Microdevices 10:851–857
Tseng FG, Yang ID, Lin KH, Ma KT, Lu MC, Tseng YT, Chieng CC
(2002) Fluid filling in micro-fabricated reservoirs. Sens Actua-
tors A 97–98:131–138
Ubbink O, Issa RI (1999) A method for capturing sharp fluid
interfaces on arbitrary meshes. J Comp Phys 153:26–50
Wan JW, Zhang WJ, Bergstrom DJ (2005) Influence of transient flow
and solder bump resistance on underfill process. Microelectron J
36(8):687–693
Wan JW, Zhang WJ, Bergstrom DJ (2007) Recent advances in
modeling the underfill process in flip-chip packaging. Micro-
electron J 38:67–75
Washburn EW (1921) The dynamics of capillary flow. Phys Rev
17:273–299
Xiao Y, Yang F, Pitchumani R (2006) A generalized analysis of
capillary flows in channels. J Colloid Interface Sci 298:880–888
Zeng J (2007) On modeling of capillary filling. http://www.coventor.
com/pdfs/on_modeling_of_capillary_filling.pdf. Accessed on 15-
03-2007
Zimmermann M, Bentley S, Schmid H, Hunziker P, Delamarche E
(2005) Continuous flow in open microfluidics using controlled
evaporation. Lab Chip 5:1355–1359
Microfluid Nanofluid (2009) 7:451–465 465
123
Related Documents