Experimental and Analytical Investigation of the Cavity Expansion Method for Mechanical Characterization of Soft Materials by Wanis Nafo A thesis presented to the University of Waterloo in fulfillment of the thesis requirement for the degree of Master of Applied Science in Civil Engineering Waterloo, Ontario, Canada 2016 © Wanis Nafo 2016

Welcome message from author
This document is posted to help you gain knowledge. Please leave a comment to let me know what you think about it! Share it to your friends and learn new things together.
Transcript

Experimental and Analytical Investigation of the Cavity Expansion Method
for Mechanical Characterization of Soft Materials
by
Wanis Nafo
A thesis
presented to the University of Waterloo
in fulfillment of the
thesis requirement for the degree of
Master of Applied Science
in
Civil Engineering
Waterloo, Ontario, Canada 2016
© Wanis Nafo 2016

ii
I hereby declare that I am the sole author of this thesis. This is a true copy of the
thesis, including any required final revisions, as accepted by my examiners.
I understand that my thesis may be made electronically available to the public

iii
ABSTRACT
In biomedical engineering, the mechanical properties of biological tissues are commonly
determined by using conventional methods such as tensile stretching, confined and unconfined
compression, indentation and elastography. With the exception of elastography, most techniques
are implemented on ex-vivo soft tissue samples. This study evaluated a newly developed
technique that has the potential to measure the mechanical properties of soft tissues in their in-
vivo condition. This technique is based on the mechanics of internal spherical cavity expansion
inside soft materials. Experimental, mathematical and numerical investigations were conducted.
Experimentally, the pressure-cavity volume relationship was measured using two types of
polyvinyl alcohol (PVA) hydrogels of different stiffnesses, namely Sample1 and Sample 2. In
addition, unconfined compression tests were conducted to measure the stress-strain relationship
of the two gels. Based on the cavity expansion test results, the measured pressure-volume data
was translated into the stress-strain relationship using a mathematical model. The stiffness of the
two gels was then compared to that determined by the unconfined compression technique. The
resulting stiffness of the two techniques was then compared at overlapping range of strains, with
the average percentage of difference being 8.46% for Sample1 and 5.36% for Sample 2. A
numerical model was developed to investigate the analytical solution of the new technique. This
investigation was based on verifying the displacement predicted by the analytical solution.
iv
The promising outcome of the technique encouraged extending this study to include
bovine liver tissues. A tissue sample was extracted from a bovine liver and subjected to tensile
loading to evaluate its stiffness. The result was a stiffness of 76.92 kPa. A second sample of the
same bovine liver was evaluated using the spherical expansion technique which resulted in a
stiffness of 87.94 kPa.
Keywords: Young’s modulus; Spherical expansion; Unconfined compression; Finite element
model; Evaluated stiffness; Radial displacement; Tensile test

v
في وصفه أنظر الكون و قل "
كل هذا أصله من أبوين
فإذا ما قيل ما أصلهما
قل هم الرحمة في مرحمتين
الجنة في إيجادنا فقدا
و نعمنا منهما في جنتين
و هما العذر إذا ما أغضبا
و هما الصفح لنا مسترضيين"
أحمد شوقي.
To my friend, my coach, and above all, my Father, Thank you.
To my queen, my grace, and my mentor, my Mother, Thank you.
vi
ACKNOWLEDGEMENTS
I would like to express my profound thanks to my supervisor, Prof. Adil Al-Mayah
from Civil & Environmental Engineering at the University of Waterloo for his guidance and
encouragement throughout my studies. Prof. Al-Mayah introduced me to a new aspect of
engineering and offered me the opportunity to contribute tangibly to the field of biomedical
engineering.
I would like to express my deep thanks to Prof. Wayne Brodland, also from Civil &
Environmental Engineering at the University of Waterloo for his assistance in my experimental
work.
Thanks also to Terry Ridgway from Civil & Environmental Engineering and Mark Griffet
from Mechanical & Mechatronics Engineering who supported me in the running of my
experiments.

vii
TABLE OF CONTENTS
ABSTRACT iii
DEDICATION v
ACKNOWLEDGEMENT vi
TABLE OF CONTENT vii
LIST OF FIGURES x
LIST OF TABLES xiv
NOTATION xv
Chapter 1 Introduction
1. 1. General 1
1. 2. Objectives 2
1. 3. Thesis Arrangement 3
Chapter 2 Literature Review
2. 1. Background and significance 4
2. 2. Hydrogel 4
2. 2. 1. General 4
2. 2. 2. Mechanical properties of PVA hydrogels 9
2. 2. 3. Applications of the mechanical behaviour of PVA hydrogel 12
2. 3. Soft tissues 13
2. 3. 1. General 13
2. 3. 2. Mechanical properties of soft tissues 14
2. 3. 3. Applications for the mechanical properties of soft tissues 19
2. 3. 4. Techniques of measuring the mechanical properties of
soft tissues
20
2. 4. Challenges related to measuring biomechanical properties of soft tissues 23

viii
2. 5. Summary 26
Chapter 3 Cavity Expansion Technique
3. 1. Cavity expansion: Theory and applications 27
3. 1. 1. General 27
3. 1. 2. Elastic solution of spherical cavity expansion 28
3. 2. Applications of cavity expansion 32
3. 2. 1. Ballistic penetration 32
3. 2. 2. Geomechanics 33
3. 3. Needle insertion mechanics 35
3. 4. Summary 38
Chapter 4 Experimental Work on Polyvinyl Alcohol Hydrogels
4. 1. Test program 39
4. 2. PVA hydrogels samples 40
4. 3. Unconfined compression test 41
4. 3. 1. Test set up 41
4. 3. 2. Results 42
4 .4. Spherical expansion test 44
4. 4. 1. Test set up 44
4. 4. 2. Results 45
4. 4. 3. Mathematical model analysis 46
4 .5. Comparison between unconfined pressure and cavity expansion
results
52
4. 6. X-ray imaging 55
4. 7. Conclusions 60

ix
Chapter 5 Finite Element Study
5. 1. Finite element model 61
5. 1. 1. Model configuration 61
5. 1. 2. Material properties 63
5. 1. 3. Contact surfaces and friction 64
5. 1. 4. Boundary conditions 65
5 .2. Results 65
5. 3. Summary 67
Chapter 6 Case study: Evaluating the Stiffness of Liver
6. 1. Test program 69
6. 2. Test samples 69
6. 2. 1. Uniaxial tensile test sample 69
6. 2. 2. Spherical expansion test sample 70
6. 3. Test set up 71
6. 3. 1. Uniaxial tensile test 71
6. 4. Results 72
6. 5. Analysis and results 73
6. 6. Summary 76
Chapter 7 Discussion and Conclusions
7. 1. Size of the balloon 77
7. 2. Incompressible fluids 79
7. 3. Balloon stiffness effect 81
7. 4. Conclusions 84
7. 5. Recommendations 85
References 86
x
LIST OF FIGURES
Fig (2.1) Ideal macromolecular network of hydrogel; multifunctional junctions
networks; hydrogels with physical entanglements
5
Fig (2.2) Polymers crosslinking with multifunctional crosslinkers 6
Fig (2.3) Intrinsic viscosity of PVA vs temperature at different crosslinking
degrees: 0%, 1.2%, 2.4%, and 4.5%
7
Fig (2.4) Transmittance of light through aqueous PVA solutions crosslinked by
freezing for 45min, 60min, 75min, 105min, 120min, and 150min, and then
thawing at 23𝐶𝑜, vs .thawing time
8
Fig (2.5) Stress-strain relationships of PVA hydrogel samples with different
initial strains (0%, 25%, 50%, 75%, and 100%),
10
Fig (2.6) Uniaxial tensile test to dog-bone shaped hydrogel sample. 10
Fig (2.7) Stress-strain relationship of hydrated and non-hydrated PVA
hydrogels
11
Fig (2.8) Ball indentation technique.
12
Fig (2.9) Vascular grafting.
13
Fig (2.10) Typical (tensile) stress-strain curve for skin
14
Fig (2.11) Tension-elongation curves of Fresh, formic acid-treated, and
trypsin-treated arteria walls
15
Fig (2.12) Tensile properties of elastin-rich canine nuchal ligament,
collagen-rich sole tendon, and intestinal smooth muscle
16
Fig (2.13) Tension-elongation relations of rabbit skin
17
Fig (2.14) Relaxation curves of collagen fascicles and patellar tendons
17
Fig (2.15) Stress-strain curve for connective tissue
20
Fig (2.16) typical force-elongation curves for slow and fast stretches for a
muscle, tendon, or ligament
21
Fig (2.17) Vertical displacement cause by different indenter diameters
22

xi
Fig (2.18) An adenocarcinoma appears stiffer in the elasticity image and
darker in the ultrasound image.
23
Fig (3.1) Sphere under external and internal pressure
28
Fig (3.2) Radial and hoop stress distribution 29
Fig (3.3) Schematic of the elastic and fractured response around a spherical
cavity
32
Fig (3.4) Typical photos from the high-speed videos recording the temporary
cavity caused by different types of projectiles
33
Fig (3.5) The pipe bursting operation layout
34
Fig (3.6) Crack formation, it starts with a micro crack at the needle tip of
original area A, as the applied force 𝐹𝑛 increases, the micro-crack
extends to dA. 𝑊𝑐 is the work applied by the needle
36
Fig (3.7) Force-displacement curve for needle insertion into porcine cardiac
tissue
37
Fig (4.1) PVA hydrogels samples. 40
Fig (4.2) Instron (model 4465; Canton, MA, USA). The apparatus used in the
unconfined compression test.
41
Fig (4.3) PVA hydrogel sample mounted between two flat plates during
unconfined compression test.
42
Fig (4.4) Stress-strain relationship for Sample1 and Sample2. 43
Fig (4.5) Low durometer balloon assembled with the needle. 44
Fig (4.6) Spherical expansion system. 45
Fig (4.7) Effect of applied pressure from balloon-hydrogel contact surface to
the edge of the hydrogel a) Sample1 and b) Sample2.
47
Fig (4.8) Stress-radial strain relationship of spherical expansion test for
samples (1) & (2), at a) 2mm, b) 3 mm and c) 5 mm distances from
the balloon-hydrogel interface.
51
Fig (4.9) Comparison between stress-strain relationships of unconfined
compression test and spherical expansion test of Sample1 at a) 2
mm, b) 3 mm and c) 5mm from the balloon-hydrogel interface.
53

xii
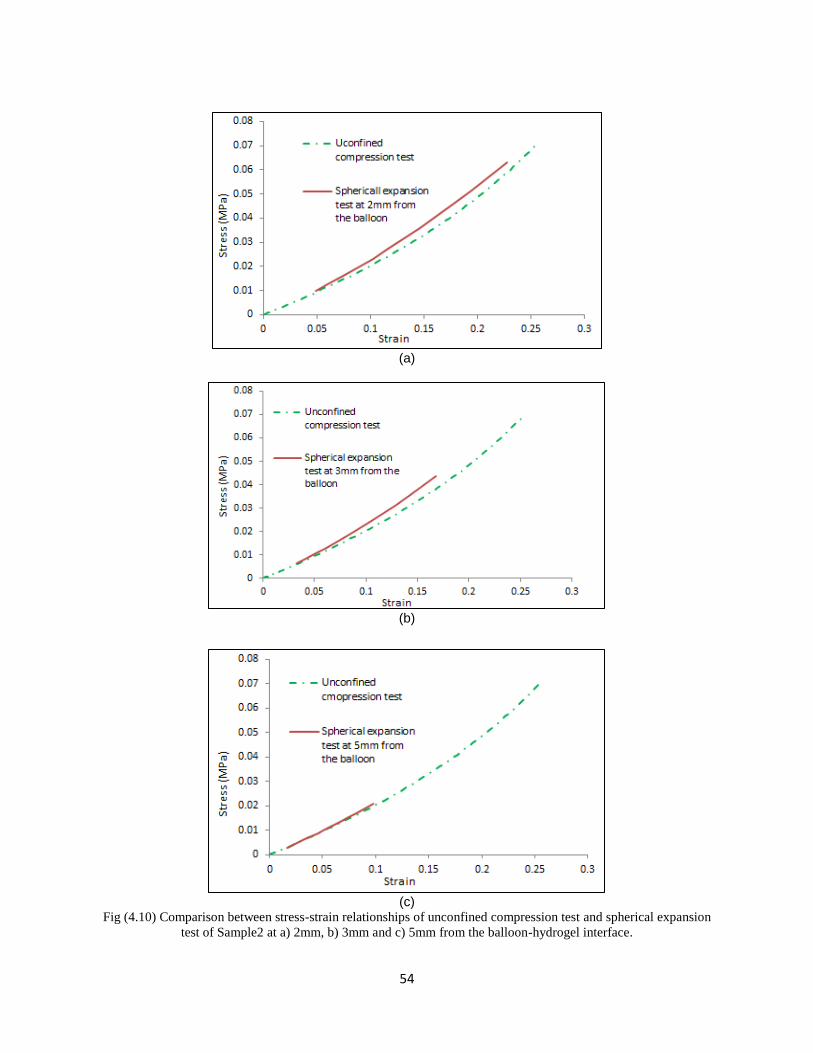
Fig (4.10) Comparison between stress-strain relationships of unconfined
compression test and spherical expansion test of Sample2 at
a) 2 mm, b) 3 mm and c) 5mm from the balloon-hydrogel interface.
54
Fig (4.11) Hydrogel sample injected with water and subjected to beams of x-
rays to create 3-D images of the cavity expansion.
56
Fig (4.12) 3ml of air injected inside hydrogel samples. 56
Fig (4.13) X-ray image of balloon filled with water inside a hydrogel sample. 57
Fig (4.14) X-ray image for the balloon injected with sodium iodide solution
inside a hydrogel sample.
59
Fig (5.1) An axisymmetric finite element body constructed on Abaqus to
simulate the combination of the hydrogel and the balloon,
62
Fig (5.2) Simulation of balloon inflation inside the hydrogel (Sample2), the
balloon was injected with 1724ul of water
65
Fig (5. 3) Comparison between the radial displacements obtained by the
mathematical model and numerical model for Sample1.
66
Fig (5. 4) Comparison between the radial displacements obtained by the
mathematical model and numerical model for Sample2.
66
Fig (6. 1) A segment of liver punished using 2 cm cylinder.
69
Fig (6. 2) Liver sample 2.85mm ⨉6mm.
70
Fig (6. 3) Sample of spherical expansion test. 70
Fig (6. 4) The biotester. 71
Fig (6.5) Liver sample 2.85mm x 6mm mounted in the biotester.
71
Fig (6.6) Paper clips mounted on the liver tissues to evaluate the starching
strain.
72
Fig (6.7) Stress–strain curve. Calculation of Liver stiffness. 73
Fig (6.8) Stress-strain data of tensile test and cavity expansion test. 75
Fig (7.1) Stress-strain relationships of unconfined compression test and
spherical expansion test. (A) PVA hydrogel, Sample1.
78

xiii
Fig (7.2) Stress-strain relationships of unconfined compression test and
spherical expansion test. (B) PVA hydrogel, Sample2.
79
Fig (7.3) Using air, top view of X-ray image for 3ml of air injected in PVA
hydrogel (Sample1).
80

xiv
LIST OF TABLES
Table (2.1) Young’s modulus of humeral (n=9) ; patellar (n=8) and femoral
(n=9) articular cartilages (Mean+/- SD, MPa).
25
Table (4.1) Characteristics of PVA samples.
40
Table (4.2) Stiffness at different points of stress-strain curves, and Poisson’s
ratio for samples (1) and (2).
43
Table (4.3) Applied water volumes and consequent applied pressures for
samples (1) & (2).
46
Table (4.4) Volumetric strain, bulk modulus, young’s modulus, and radial strain for
Sample1.
49
Table (4.5) Volumetric strain, bulk modulus, young’s modulus, and radial strain for
Sample2.
50
Table (4.6) Comparison between E values of unconfined compression test
and spherical expansion test.
52
Table (5.1) Stress-strain relationship of the test balloon .
63
Table (7.1) Applied volume, diameter calculated from the theoretical sphere
(𝐷𝑐), diameter evaluated from X-ray images (𝐷𝑒).
.
82
Table (7.2) Re-evaluated balloon diameters at each applied volume of water 83
xv
NOTATIONS
𝜎𝑟
Radial stress
𝜎𝜃
Tangential stress
𝑃𝑖
Inner pressure
𝑃𝑜
Outer pressure
Ԑ𝑟
Radial strain
Ԑ𝜃
Tangential strain
𝑢
Radial displacement
𝐴, 𝐵
Integration constants
𝑟𝑖
Inner radius
𝑟𝑜
Outer radius
𝐸
Young’s modulus
𝛥𝑣
Change in volume
𝑉
Volume of affected zone
𝑟𝑙𝑖𝑚
Out radius of PVA hydrogel samples
K
Bulk modulus of PVA hydrogel samples
Ԑ𝑣
Volumetric strain
∆𝑟
Radial deformation
De
Evaluated balloon diameter
Dc
Calculated balloon diameter

1
Chapter 1
Introduction
1. 1. General
Different methods have been proposed to measure the direct mechanical properties of soft
tissues including, indentation, tensile and compression testing; these are in addition to the
image-based technique of elastography. Tensile testing is a conventional technique used to
evaluate the mechanical properties of ex-vivo soft tissue samples. Indentation and
compression tests are used widely to evaluate the mechanical properties of soft tissues.
Although both techniques are based on applying compressive force, only the indentation test
can be applied on in-vivo soft tissues. When evaluating the stiffness of soft tissue using
indentation, Poisson’s ratio has to be evaluated using a separate technique such as tensile or
compressive testing.
In this study, an experimental and analytical evaluation of a stretching technique
developed by Al-Mayah (2011) based on the cavity expansion theory is presented. The
cavity expansion theory is one of the most common theories in civil engineering, widely
used to analyze geotechnical problems. Since 2000, this theory has been mastered and
developed to be used in the analysis of different media that exhibit different responses; it is
used in analyzing ballistic penetration problems of concrete, metals and geological targets.
Using the cavity expansion theory in evaluating the properties of biological tissues is a
pioneering solution which could help healthcare professionals to understand the
characteristics of biological organs.

2
The technique has the potential to enable medical professionals to measure the
mechanical properties of in-vivo and patient-specific soft tissues in order to improve the
accuracy of biomechanical modeling for image-guided interventions and diagnoses.
1. 2. Objectives
The main goal of this study is to evaluate the potential of using the cavity expansion theory
in measuring soft tissue elastic moduli. A comprehensive experimental and analytical
investigation was conducted. The new technique was evaluated using hydrogel and animal tissue
samples, and the results were compared to the analytical and numerical modeling outcomes.
The main objective was achieved through the following specific steps:
- investigating, experimentally, the cavity expansion method using different
hydrogels and biological tissues
- comparing the results of the method with other conventional testing methods,
namely, compression and tensile
- conducting an imaging investigation using computed tomography (CT) to
investigate the configuration of the cavity inside the soft materials;
- developing analytical models to translate the pressure-volume data to the stress-
strain relationship
- developing a finite element model for the cavity expansion method to provide an
insight into the stress distribution inside the soft materials

3
1. 3. Thesis Arrangement
A thorough literature review is presented in Chapter 2. It addresses the background of
manufacturing PVA hydrogels, applications of PVA hydrogels, behaviour of soft tissues,
mechanical properties of soft tissues, and applications for the mechanical properties of soft
tissues. Chapter 3 addresses the elastic solution of the spherical cavity expansion theory and the
application of this theory in different aspects of engineering. Chapter 4 provides details about the
experimental work including test setups, devices and instrumentations, test results, and a
comparison of results to investigate the validity of the new proposed technique. In Chapter 5,
further investigation is conducted using the finite element method (FEM) to examine the validity
of the new technique. As the investigation exhibited positive outcomes, this study was extended
(see Chapter 6) to include bovine liver tissues. Chapter 7 reports the research discussion,
conclusions and recommendations.

4
Chapter 2
Literature Review
2. 1. Background and Significance
The mechanical properties of soft materials, such as hydrogels and soft tissues, play a
significant role in many applications including medical and engineering. In medical
applications, the mechanical properties of soft tissues are the essential part of biomechanical
modeling of human organs that has been expanding in its application in many cancer centers
around the world to accurately locate the tumor for radiotherapy applications. Image-guided
surgery and brachytherapy are other applications for biomechanical modeling. This chapter
presents a review of the mechanical properties of hydrogels and soft tissues. The techniques of
measuring the properties of these materials are also presented.
2. 2. Hydrogels
2. 2. 1 General
Hydrogels are water-swollen gels formed by polymer chains held together in networks by
one or a combination of the following interactions: ionic forces, polymer crystallites, affinity
interactions, hydrophobic interactions, hydrogen bonds, and covalent crosslinks. These networks
are shown in Figure (2.1).

5
Fig (2.1) Ideal macromolecular network of hydrogels; multifunctional junctions networks; hydrogels with physical
entanglements (Buddy et al. 2013).
Different types of hydrogels have been developed based on their biomedical application,
method of presentation, physical structure, and ionic charge. Some of these hydrogels are acrylic
hydrogels, polyvinyl alcohol (PVA) hydrogels, polyethylene glycol (PEG) hydrogels, pH-
sensitive hydrogels, and pH-responsive complexation hydrogels.
PVA hydrogels, an artificial polymer used widely in biomedical and tissue engineering
fields, are the main focus of this study. This preference is mainly because of its biocompatibility,
biodegradability, and hydrophilicity (Paradossi et al., 2003), especially in maintaining various
tissues such as heart valves (Jiang et al., 2004), corneal implants (Vijayasekaran et al., 1998),
and arterial phantoms (Chu and Rutt, 1997). PVA hydrogels are water-soluble (Kumeta et al.,
2003). For PVA hydrogels to be feasible in the medical field, they must be crosslinked.
Crosslinking is a curing process conducted to modify polymers to reach new and enhanced
properties (Hassan and Peppas, 2000). Generally, there are two techniques to achieve
crosslinking:

6
- Chemical crosslinking
Chemical crosslinking is based on the modification of a PVA hydrogel by adding
multifunctional crosslinking agents to its hydroxyl group. These agents include: dicarboxylic
acids (Huang and Rhim, 1993), dialdehydes (Cha et al., 1993), dianhydrides (Gimenez et al.
1996).
Fig (2.2) Polymers crosslinking with multifunctional crosslinkers (Buddy et al. 2013).
According to Kuhn and Balmer (1962), when a crosslinking agent is used, two types of
crosslinking can be produced: intermolecular and intramolecular. Intermolecular is between
molecules of the crosslinked polymer leading to a formation of gel due to significant increase in
viscosity. Intramolecular occurs within a single molecule of the crosslinked polymer resulting in
the volume shrinkage of polymer coils because of a decrease in viscosity. Gebben and his
colleagues measured the viscosity of different degrees of crosslinked PVA hydrogels (Gebben et
al., 1985). Figure (2.3) shows that the uncrosslinked PVA hydrogel experienced a drop in
viscosity as the temperature increased. This was attributed to an alteration of the molecules’
conformation as the temperature changed. When the PVA hydrogel was crosslinked, its
flexibility was reduced and its molecules lost their ability to change their conformation.

7
Fig (2.3) Intrinsic viscosity of PVA vs temperature at different crosslinking degrees: 0%, 1.2%, 2.4%, and 4.5%
(Gebben et al. 1985).
In many applications, irradiation is used in the crosslinking process. Using electron
beams or ɣ-rays, the irradiation process demonstrated its ability to enhance the properties of
PVA polymers on a large commercial scale (Yoshii et al., 2007; Slamawi, 2010; Nikolic, 2007).
Generally, the polymer interacts with the radiation and absorbs its energy which triggers
different chemical reactions (Mishra et al., 2007). These reactions are based substantially on the
chemical structure of the polymer. When a polymer interacts with radiation, two opposing trends
occur; namely, crosslinking and degradation. They co-exist and compete with each other under
radiation.
Crosslinking of polymer molecules is an important phenomenon because it enhances the
mechanical and thermal properties of the polymer. On the other hand, degradation is an
undesirable outcome because it weakens the polymer. According to Cota and his colleagues, the
predomination of either crosslinking or degradation

8
depends on the magnitude of oxygen existing in the polymer and the polymer’s capability
to substitute the oxygen with radicals produced throughout the irradiation process (Cota et al.
2007).
- Physical crosslinking (Freeze-thaw cycles)
Chemical crosslinking can cause toxic residue which makes the crosslinked polymer
undesirable for pharmaceutical and biomedical applications. Therefore, the need for physical
crosslinking of polymers is needed. In general, PVA aqueous solutions can form hydrogels if
they are stored for long periods of time at room temperature. This hydrogel is considered very
weak and inefficient for a broad scale of applications in which the mechanical properties of PVA
are the main focus (Kenawy et al., 2013). An alternative to physically crosslinking PVA
polymers is to apply cycles of freezing and thawing. Peppas (1975) pioneered the use of the
freeze-thaw technique to crosslink PVA polymers. In his work, Peppas made crystalline PVA
hydrogels by subjecting aqueous PVA solutions to freezing at -20 𝐶𝑜for 45 to 120 minutes and
then thawing at room temperature for periods of up to 12 hours. Figure (2.4) shows the
transmittance of light recorded as a function of thawing time.
Fig (2.4) Transmittance of light through aqueous PVA solutions crosslinked by freezing for 45min, 60min, 75min,
105min, 120min, and 150min, and then thawing at 23𝐶𝑜, vs thawing time (Peppas, 1975).

9
The properties of physically crosslinked PVA hydrogels can be modified by controlling
the number of freeze-thaw cycles and the concentration of PVA. Gupta et al. (2011)
demonstrated that the degree of crystallinity, swelling, transparency, wettability, and the
mechanical properties pf PVA hydrogels were strongly controlled by the number of freeze-thaw
cycles.
2. 2. 2. Mechanical Properties of PVA Hydrogels
The mechanical properties of hydrogels play a major role in their application. The
investigation of the mechanical properties of PVA hydrogels to overcome the challenges related
to the mechanical properties of soft tissues has been the main interest of many researchers.
Different techniques have been used to characterize the mechanical properties of PVA
hydrogels. The tensile test is one of the applied techniques used to investigate the mechanical
properties of PVA hydrogels. This technique is based on stretching a test sample at a specific
rate while observing the force necessary to maintain the constant rate of stretching. Figure (2.5)
shows the tensile test results of hydrogel samples at different initial strains (Millon et al., 2006).

10
Fig (2.5) Stress-strain relationships of PVA hydrogel samples with different initial strains (0%, 25%, 50%, 75%, and
100%) (Millon et al. 2006).
Fig (2.6) Uniaxial tensile test to dog-bone shaped hydrogel sample (Liu, 2010).
An unconfined compression test was used to measure the mechanical behaviour of PVA
hydrogels (Lee et al. 2009). In this technique, PVA hydrogel samples were subjected to
compressive forces between two plates. Applied forces and the resulting deformations were
observed to derive the stress-strain relationship, as shown in Figure (2.7).

11
A confined compression technique was also applied where samples were confined to a
chamber to prevent lateral deformation as the axial compressive load was applied (Behravesh et
al., 2002). Indentation is another technique to evaluate the mechanical properties of hydrogels.
Liu and Ju (2001) developed a novel indentation technique to characterize the viscoelastic
properties of polymer films bi-axially and axisymmetrically, as shown in Figure (2.8). This
technique is based on indenting a circumferentially fastened polymer membrane using a stainless
steel ball of known weight and dimension. The corresponding deformation at the center of the
membrane was observed to evaluate the mechanical properties of hydrogels in a non-destructive
manner.
Fig (2.7) Stress-strain relationship of hydrated and non-hydrated PVA hydrogels (Lee et al., 2009).

12
Fig (2.8) Ball indentation technique (Ahearne et al. 2005).
2. 2. 3. Applications of the Mechanical Behaviour of PVA Hydrogels
In the biomedical engineering field, there is a need to build feasible replicas of many
human tissues, each of which exhibits its own unique behaviour. Hydrogels showed a remarkable
capability to match the behaviour of biological soft tissues when the preparation technique was
controlled. Wan et al. (2002) showed that controlling the conditions of preparing PVA hydrogels
using the freeze/thaw technique, led to behaviour close to the porcine aortic root. The mechanical
behaviour of PVA-based membranes, in addition to their distinctive biocompatibility, makes
them a great option in vascular grafting (a vascular graft [or vascular bypass] is a redirection of
blood flow. Surgeons use vascular grafting when performing organ transplantations and in cases
of schemia, as shown in figure (2.9).
13
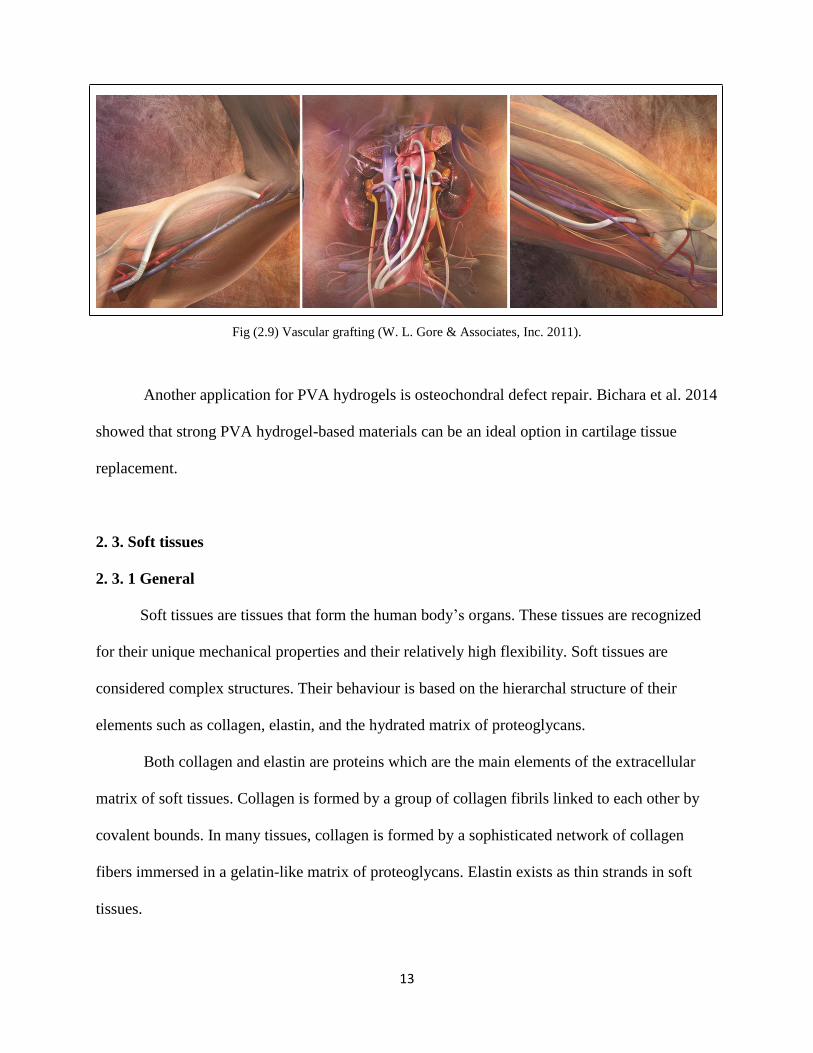
Fig (2.9) Vascular grafting (W. L. Gore & Associates, Inc. 2011).
Another application for PVA hydrogels is osteochondral defect repair. Bichara et al. 2014
showed that strong PVA hydrogel-based materials can be an ideal option in cartilage tissue
replacement.
2. 3. Soft tissues
2. 3. 1 General
Soft tissues are tissues that form the human body’s organs. These tissues are recognized
for their unique mechanical properties and their relatively high flexibility. Soft tissues are
considered complex structures. Their behaviour is based on the hierarchal structure of their
elements such as collagen, elastin, and the hydrated matrix of proteoglycans.
Both collagen and elastin are proteins which are the main elements of the extracellular
matrix of soft tissues. Collagen is formed by a group of collagen fibrils linked to each other by
covalent bounds. In many tissues, collagen is formed by a sophisticated network of collagen
fibers immersed in a gelatin-like matrix of proteoglycans. Elastin exists as thin strands in soft
tissues.

14
2. 3. 2 Mechanical Properties of Soft Tissues
Soft tissues behave anisotropically because their fibers are formed in certain directions.
In addition, they exhibit viscoelastic behaviour because of the lubrication offered by a matrix of
heavily glycosylated proteins between collagen fibrils called Proteoglycans (Minns et al., 1973).
The main characteristics of soft tissues are as follows:
1. Nonlinearity: “The stress –strain relationship for most tissues is nonlinear” (Gao et al.
1996). For example, the stress-strain behaviour of skin shows a typical J-shaped curve when
tensile stress is applied. Figure (2.10) shows a schematic diagram of a typical (tensile) stress-
strain curve for skin.
Fig (2.10) Typical (tensile) stress-strain curve for skin (Holzapfel 2000).
The deformation of the skin goes through three main stages:
Stage I: In this stage, the collagen fibers are in a relaxed condition; they exist in their entangled
form as no load or a small load is applied.
15
Stage II: As the load increases, the collagen fibers straighten with the direction of the load. As
the fibers start to prolong, they interact with the hydrated proteoglycan matrix.
Stage III: At this stage, most of the collagen fibers are straight and the response of the collagen
fibers is stiffer, resulting in a linear stress-strain relationship. As the load continues to increase
beyond the ultimate tensile strength, the fibers start to break.
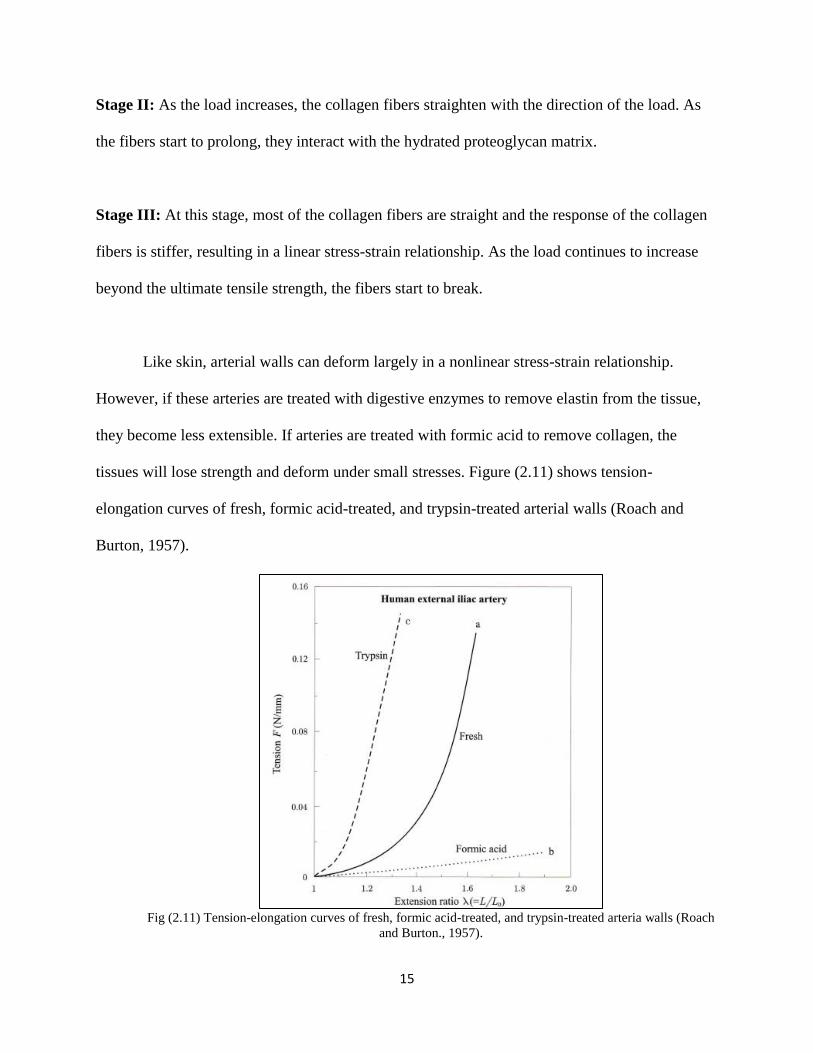
Like skin, arterial walls can deform largely in a nonlinear stress-strain relationship.
However, if these arteries are treated with digestive enzymes to remove elastin from the tissue,
they become less extensible. If arteries are treated with formic acid to remove collagen, the
tissues will lose strength and deform under small stresses. Figure (2.11) shows tension-
elongation curves of fresh, formic acid-treated, and trypsin-treated arterial walls (Roach and
Burton, 1957).
Fig (2.11) Tension-elongation curves of fresh, formic acid-treated, and trypsin-treated arteria walls (Roach
and Burton., 1957).

16
2. Inhomogeneity: Different soft tissue constituents have different chemical and physical
characteristics. Therefore, these tissues behave as composite materials made up of constituents of
different properties. For instance, tissues rich in elastin, collagen, and smooth muscle such as
nuchal ligament, sole tendon, and intestinal smooth muscle have different tensile properties. The
elastin-rich tissues have much less strength and much more flexibility than the collagen-rich
tissues. The intestinal smooth muscle is much softer than the other two tissues and more
viscoelastic as it has a wide hysteresis loop in its stress-strain relationship. Figure (2.12) shows
the tensile properties of nuchal ligament, sole tendon, and intestinal smooth muscle (Hasagawa
and Azuma, 1974).
Fig (2.12) Tensile properties of elastin-rich canine nuchal ligament, collagen-rich sole tendon, and intestinal
smooth muscle (Hasagawa and Azuma, 1974).
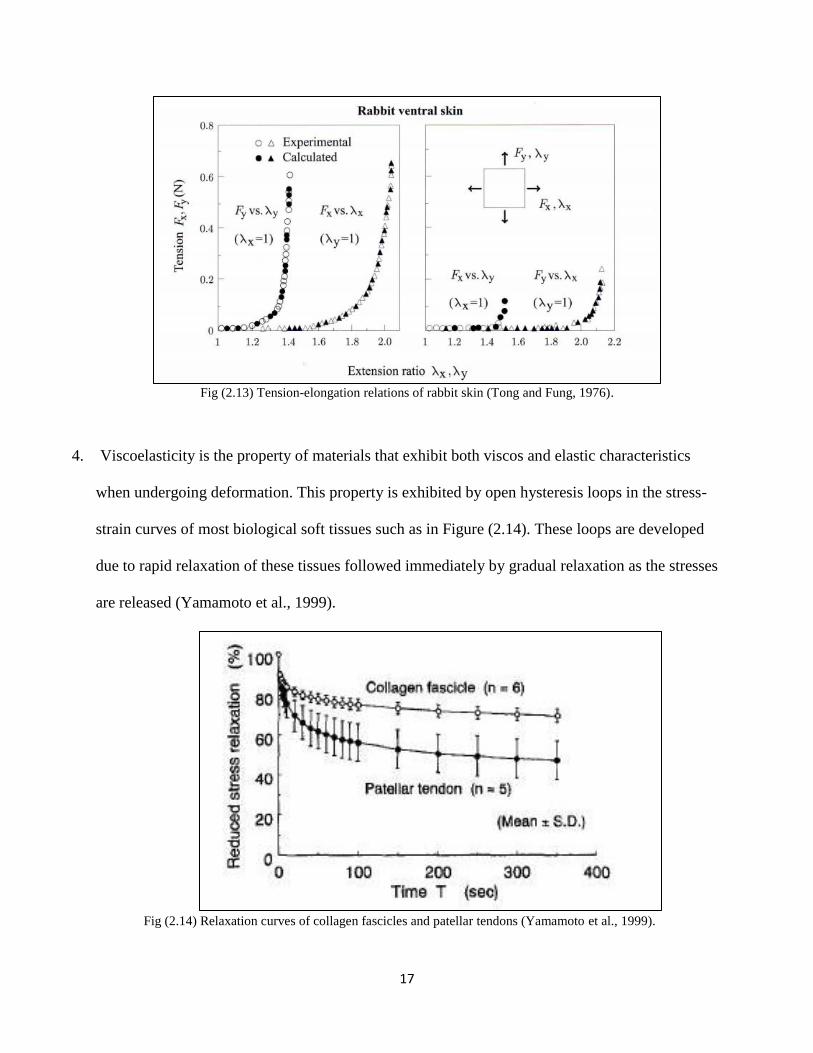
3. Anisotropy: “Almost all biological soft tissues are mechanically anisotropic”
(Holzapfel and Ogden, 2003). This is mainly because of the content of collagen and elastin
which are intrinsically anisotropic. For example, a tissue such as skin has different properties in
different directions as shown in Figure (2.13), (Tong and Fung, 1976).
17
Fig (2.13) Tension-elongation relations of rabbit skin (Tong and Fung, 1976).
4. Viscoelasticity is the property of materials that exhibit both viscos and elastic characteristics
when undergoing deformation. This property is exhibited by open hysteresis loops in the stress-
strain curves of most biological soft tissues such as in Figure (2.14). These loops are developed
due to rapid relaxation of these tissues followed immediately by gradual relaxation as the stresses
are released (Yamamoto et al., 1999).
Fig (2.14) Relaxation curves of collagen fascicles and patellar tendons (Yamamoto et al., 1999).
18
5. Incompressibility: Most biological soft tissues are considered incompressible, mainly
because they have a water content that exceeds 70% (Holzapfel and Ogden, 2003).
Experimentally, this has been proven in arterial walls (Choung and Fung, 1984; Care et al.,
1968). However, the concept of incompressibility is not applicable in some soft tissues such
as articular cartilage, because cartilage contains micro pores, allowing water to leave the
pores when loads are applied (Woo et al., 1979).
These properties are the main focus of much of the research into modelling soft tissues
behaviour. Taber (1984) studied the nonlinear stress-strain relationship by observing the elastic
behaviour of pigs’ eyeballs when compressed by rigid cylindrical indentures. Viidik (1966)
studied the behaviour of the achilles tendon of rabbits and the anterior cruciate ligaments in
trained and untrained animals subjected to tensile stresses. Fung (1981) developed a quasilinear
viscoelastic theory of soft tissues. Troung (1971) measured both the attenuation coefficient and
velocity of wave-propagation in striated muscles. Levinson (1987) proposed a linear transverse
anisotropic model of frog sartorius samples by observing the velocity of ultrasound wave
propagation in these samples. Parker et al. (1993) measured the linear and non-linear modulus of
elasticity of human prostate samples. The impedance of tissues increase with increased
frequencies. Von Gierke et al. (1952) and Oestreicher (1951) developed a theory to explain this
increase by observing the behaviour of the human body surface as it undergoes mechanical
vibration and sound fields.

19
2. 3. 3. Applications for the Mechanical Properties of Soft Tissues
As evidenced by the outcome of the studies mentioned above, modelling of biological
soft tissues has significant potential in many medical applications, including image guided
radiotherapy and brachytherapy.
Image guided therapy is a cancer treatment approach based on local tumor ablation. In
this approach, tumors are destroyed by delivering a measured dose of radiation that elevates the
temperature within the tumorous tissue above lethal levels. However, deformations associated
with anatomical change, patients’ movement, and physiological functions can also harm the
healthy tissues around the tumor. Therefore, deformable image registration is applied to process
soft tissue deformation. Much work has been conducted to apply biomechanical modelling for
the image registration of breast (Semani et al., 2001; Reiter et al., 2004; Zhang et al., 2007; Krol
et al., 2006), head and neck (Al-Mayah et al., 2010), prostate (Wu et al., 2006; Yan et al., 1999),
and lungs (Werner et al., 2009; Al-Mayah et al., 2009; Zhang et al., 2004).
Brachytherapy is a radioactive therapy based on inserting a radiation source such as
radioactive seeds, in or near the tumor. Temporal deformations during the insertion process may
result in misplacement of the seeds. Therefore, much FEM work has been conducted to model
deformation during the insertion process (Bharatha et al., 2001; Alterovitz et al., 2003; DiMaio
and Salcudean, 2005; Goksel et al., 2006; McAnearney et al., 2010).

20
2. 3. 4. Techniques of Measuring the Mechanical Properties of Soft Tissues:
As noted earlier in this thesis, there are many testing methods used to measure the
biomechanical properties of soft tissues: tensile stretching, confined and unconfined
compression, indentation and elastography.
Tensile stretching is based on applying tensile stresses to ex-vivo tissues of known
dimensions. The tension mechanisms generated by tissues such as muscles are active and
passive. Active tension originates from the interaction of actin and myosin filaments. Passive
tension is generated by the elongation of muscles beyond their resting length. The behaviour of
the tested tissue depends on the rate of stress applied. The stress-strain curves of soft tissues have
several regions. The Toe region is the initial elongation. The Elastic region is the non-linear
region which follows the Toe region, also called the “transition zone”. If the applied stress
increases, the curve will flatten to represent permanent damage of the tissue, this region is called
the Plastic region. Figure (2.15) shows the stress-strain curve for connective tissue.
Fig (2.15) Stress-strain curve for connective tissue (Tanaka and Eijden, 2003).

21
During normal activities, the strain in most ligaments and tendons is typically in the Toe
or Transition regions (Carlstedt and Nordin, 1989). The slow application of tensile stress will
create less passive tension on soft tissues. On the other hand, the fast application of tensile stress
will result in a higher stiffness of soft tissue. Figure (2.16) shows typical force-elongation curves
for slow and fast stretches for a muscle, tendon, and ligament (Knudson, 2006).
Fig (2.16) Typical force-elongation curves for slow and fast stretches for a muscle, tendon, and
ligament (Knudson 2006).
Confined and unconfined compression is based on applying direct compression stress on
ex-vivo samples of known dimensions in order to measure their properties. This test is applied on
many types of soft tissues including articular cartilage (Korhonen et al., 2002). Articular
cartilage is an inhomogeneous material that shows non-linear and anisotropic mechanical
properties in both tension and compression (Roth and Mow, 1980; Korhonen et al., 2001;
Jurvelin et al., 1996). Much work has been conducted to simulate the mechanical behaviour of
articular cartilage; elastic (Hayes et al., 1972), viscoelastic (Parson and Black, 1977), biphasic
and triphasic (Mow et al., 1980; Lai et al., 1991), transversely isotropic biphasic (Cohen et al.,

22
1998), poroviscoelastic (Mak., 1986), fibril reinforced poroelastic (Soulhat et al., 1999; Li et al.,
1999), and cone-wise linear elasticity (Soltz and Ateshian, 2000).
Indentation tests are widely used to study the mechanical properties of soft tissues such
as subcutaneous tissues (Bader and Bowker, 1983; Reynolds and Lord, 1992; Mak et al., 1994;
Vannah and Childress, 1996), articular cartilage (Sokoloff, 1966; Mow et al., 1989), lungs( Hajji
et al., 1979), prostate (Carson et al., 2011), breast (Samani and Plewes, 2004). The test is based
on observing the response of soft tissues when a localized pressure is applied by an indenter. The
interaction between the tissues and the indenter depends on the dimensions of the indenter.
Figure (2.17) shows that indenters with smaller diameters tend to cause larger vertical
displacements because the stress they generate is higher (Ja’afreh et al., 2008).
Fig (2.17) Vertical displacement cause by different indenter diameters (Ja’afreh et al., 2008).
Elastography is a state-of-the-art medical imaging process in which the mechanical
properties of soft tissues are identified. In this process, cancerous tissues can be diagnosed by

23
mapping the elastic properties of the targeted tissues due to their harder and stiffer constitution
when compared to the surrounding tissues. Ultrasound elastography and magnetic resonance
elastography are the two major applications of elastography. Ultrasound elastography is based on
the propagation of high frequency waves to quantitatively image the modulus of elasticity which
exhibit significant variations between different biological tissues (Sarvazyan et al., 1995).
Figure (2.18) shows the difference in stiffness between cancerous and healthy tissues. Magnetic
resonance elastography (MRE) is based on measuring the stiffness of soft tissues by introducing
secondary waves (shear waves) and using the magnetic resonance imaging (MRI) technique to
image their propagation. Mariappan and his colleagues developed a technique where the
secondary waves are encoded into the phase of MRI images with the help of motion-encoding
gradient pairs (Mariappan et al., 2010).
Fig (2.18) An adenocarcinoma appears stiffer in the elasticity image and darker in the ultrasound image, (Gennisson
et al., 2013).
2. 4. Challenges Related to Measuring Biomechanical Properties of Soft Tissues
Most of the biomechanical modeling techniques use ex-vivo mechanical properties to
model in-vivo tissues. This is mainly related to the challenges associated with measuring in-vivo
tissues.
24
The tests mentioned above are commonly used to measure parameters such as Young’s
modulus (Stiffness, E), aggregate modulus (Ha), and Poisson ratio (ν). These parameters
characterize the biomechanical properties of soft tissues. Young’s modulus is perhaps the most
important parameter because it depends on the structure of soft tissues (Gao et al., 1996).
Changes in the stiffness of soft tissues could be related to abnormal growth of soft tissues such as
cancerous tumors. Despite the broad foundation of modelling elastic tissue parameters that exist
today, there remain huge gaps in our knowledge of the elastic properties of diseased and normal
tissue. One of these gaps is the lack of determining the in-vivo mechanical properties of soft
tissues.
It is a well-known fact that the biomechanical properties of soft tissues vary depending on
how they are measured, i.e., in-vivo or in-vitro, in-situ or as an excised sample. The majority of
the measured soft tissue parameters are based on ex-vivo samples. As these samples are
dissected from their natural environment, they tend to provide substantially different parameters
when tested due to a lack of the additional factors that contribute to their natural environment,
such as blood circulation, temperature and surrounding constraints (Miller et al. 2005; Kerdok et
al., 2006; Fung, 1993; Gefen and Margulies, 2004). In addition, ex-vivo soft tissue conditions are
different because the tissue is exposed to different preservation conditions and undergoes
different experimental conditions, such as time of tissue excision, temperature and hydration. As
a result, laboratory work usually consists of testing a number of samples with a large standard
deviation because of these variations.

25
The outcome of different testing methods can vary from method to method. Korhonen et
al. (2002) showed that parameters such Young’s modulus varies based on the testing method.
Table (2.1) Young’s modulus of humeral (n=9); patellar (n=8) and femoral (n=9) articular cartilages (Mean+/- SD,
MPa)
The values obtained from the compression tests differ slightly, while a broad gap exists
between the results of indentation and compression testing. The main cause of these differences
is believed to be the source of applied stresses. In compression testing, the load is applied on a
larger surface area than in indentation testing, which results in higher applied stresses in the
latter.

26
2. 5. Summary
This chapter introduced the mechanical behaviour of PVA hydrogels and soft tissues. PVA
hydrogels showed the potential to overcome the challenges related to mimicking the mechanical
behaviour of soft tissues given their unique distinguishing behaviours. Therefore, PVA hydrogels
were used in numerous medical applications. For PVA hydrogels, the mechanical behaviour is
usually characterized by common techniques, i.e., stretching, compression (unconfined and
confined), and indentation.
The mechanical properties of soft tissues play an essential role in developing models that
simulate the behaviour of soft tissues. These models showed significant potentials in many
medical applications such as image guided therapy and brachytherapy. The evaluation of soft
tissues’ mechanical properties is usually applied through the common techniques in the
biomedical engineering field. These techniques intersect with those used with PVA hydrogels in
addition to elastography.
27
Chapter 3
Cavity Expansion Technique
The developed technique of the cavity expansion method involves the expansion of a
balloon inside a soft media in addition to the needle insertion. In this chapter, the mechanics of
cavity expansion are presented as is its application in related fields. Needle insertion and other
factors contributing to its performance are also presented.
3. 1 Cavity Expansion: Theory and Applications
3. 1. 1 General
Studying the stresses and displacements caused by the contraction and expansion of
spherical or cylindrical cavities is the main scope of cavity expansion theory. Although the
pioneering work that drew attention to the theory occurred between the 1940s and the 1960s,
significant work has been conducted in the past three decades. These studies focused mainly on
the development of primary solutions for cavity expansion and the application of cavity
expansion theory to physical problems in various fields of engineering. There have been many
solutions developed for the cavity expansion theory such as elastic analysis of multilayered
sphere (Borisov, 2010), solutions in isotropic and anisotropic media (Yu, 2000), mathematical
models for ductile materials (Bishop et al., 1945) and elastic plastic materials (Zhen et al., 2013),
and the fractured response of materials that have large elastic deformations such as gelatin-like
materials (Liu et al., 2014). In this latter study, the investigation used hydrogels that exhibited
elastic behaviour.
28
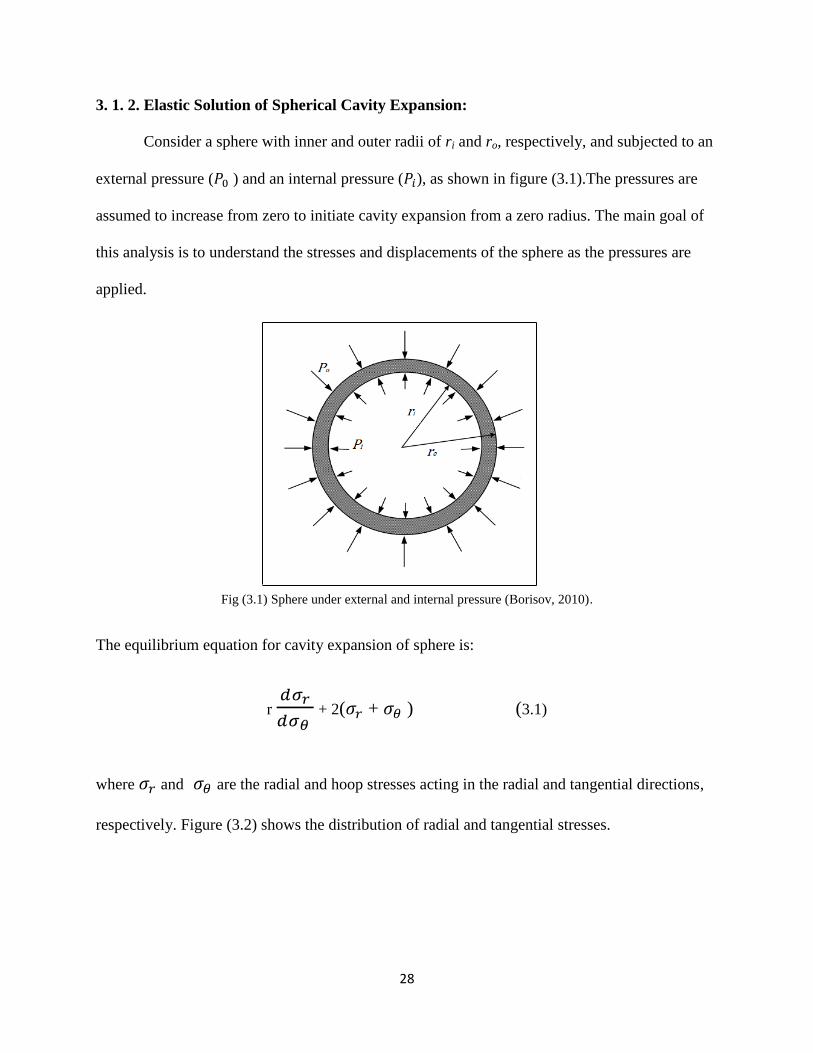
3. 1. 2. Elastic Solution of Spherical Cavity Expansion:
Consider a sphere with inner and outer radii of ri and ro, respectively, and subjected to an
external pressure (𝑃0 ) and an internal pressure (𝑃𝑖), as shown in figure (3.1).The pressures are
assumed to increase from zero to initiate cavity expansion from a zero radius. The main goal of
this analysis is to understand the stresses and displacements of the sphere as the pressures are
applied.
Fig (3.1) Sphere under external and internal pressure (Borisov, 2010).
The equilibrium equation for cavity expansion of sphere is:
r 𝑑𝜎𝑟
𝑑𝜎𝜃 + 2(𝜎𝑟 + 𝜎𝜃 ) (3.1)
where 𝜎𝑟 and 𝜎𝜃 are the radial and hoop stresses acting in the radial and tangential directions,
respectively. Figure (3.2) shows the distribution of radial and tangential stresses.

29
Fig (3.2) Radial and hoop stress distribution (Shigley and Mischke, 1989).
The boundary conditions that govern this equation are:
𝜎𝑟 = 𝑃𝑖 at r = 𝑟𝑖 , and 𝜎𝑟 = 𝑃𝑜 at r = 𝑟𝑜.
These stresses generate strains in the radial and tangential directions, and are expressed as:
Ԑ𝑟 = −𝑑𝑢𝑑𝑟
, and Ԑ𝜃 = −𝑢𝑟 (3.2)
Where 𝑢 is the displacement in the radial direction
Ԑ𝑟 = 𝑑(𝑟 Ԑ𝜃)
𝑑𝑟 (3.3)
For elastic materials, the stress-strain relationship for spherical cavities is:
Ԑ𝑟= 1
𝐸 [ 𝜎𝑟 − 2 𝜐 𝜎𝜃 ] (3.4)

30
Ԑ𝜃= 1
𝐸 [ −𝜐𝜎𝑟 + (1 − 𝜐 )𝜎𝜃] (3.5)
Where 𝐸 is the modulus of elasticity and 𝜐 is Poisson’s ratio.
By combining equations (3.1), (3.3), (3.4), and (3.5), the result will be a differential equation in
terms of radial stress:
𝜎𝑟 = A + 𝐵
𝑟3 (3.6)
Where A and B are integration constants, the hoop stress can be evaluated by substituting (2.6)
into (2.1).
𝜎𝜃 = 𝐴 - 𝐵
2𝑟3 (3.7)
Since at r = 𝑟𝑖, 𝜎𝑟 = 𝑃𝑖 and r =𝑟𝑜, 𝜎𝑟 =𝑃𝑜.
A + 𝐵
𝑟𝑖3 = 𝑃𝑖 (3.8)
A + 𝐵
𝑟𝑜3 = 𝑃𝑜 (3.9)
Solving for A and B:
A= 𝑃𝑖 𝑟𝑖
3− 𝑃𝑜𝑟𝑜3
𝑟𝑖3−𝑟𝑜
3 (3.10)

31
B= (𝑃𝑜−𝑃𝑖) 𝑟𝑖
3𝑟𝑜3
𝑟𝑖3−𝑟𝑜
3 (3.11)
Substituting A and B into equations (2.6) and (2.7) to reach the solution for the stresses
𝜎𝑟 = 1
𝑟𝑖3−𝑟𝑜
3 (𝑃𝑖 𝑟𝑖3 − 𝑃𝑜𝑟𝑜
3 + 𝑟𝑖3𝑟𝑜
3
𝑟3 (𝑃𝑜 − 𝑃𝑖) ) (3.12)
𝜎𝜃= 1
𝑟𝑖3−𝑟𝑜
3 (𝑃𝑖 𝑟𝑖3 − 𝑃𝑜𝑟𝑜
3 − 𝑟𝑖3𝑟𝑜
3
2𝑟3 (𝑃𝑜 − 𝑃𝑖) ) (3.13)
Substituting 𝜎𝑟 and 𝜎𝜃 into (2.4) to determine the radial and tangential strains.
Ԑ𝑟 = 𝑃𝑖 𝑟𝑖
3− 𝑃𝑜𝑟𝑜3
𝑟𝑖3−𝑟𝑜
3 . 1−2𝜐
𝐸 +
𝑟𝑖3𝑟𝑜
3
𝑟3 . 𝑃𝑜−𝑃𝑖
𝑟𝑖3−𝑟𝑜
3 . 1+𝜐
𝐸 (3.14)
Ԑ𝜃 = 𝑃𝑖 𝑟𝑖
3− 𝑃𝑜𝑟𝑜3
𝑟𝑖3−𝑟𝑜
3 . 1−2𝜐
𝐸 -
𝑟𝑖3𝑟𝑜
3
𝑟3 . 𝑃𝑜−𝑃𝑖
𝑟𝑖3−𝑟𝑜
3 . 1+𝜐
2𝐸 (3.15)
By setting 𝑟𝑜 ∞, the new solution for stresses can be
Obtained:
𝜎𝑟 = 𝑃𝑜 + (𝑃𝑖 − 𝑃𝑜) (𝑟𝑖
3
𝑟3 ) (3.16)
𝜎𝜃 = 𝑃𝑜 + 1
2 (𝑃𝑖 − 𝑃𝑜) (
𝑟𝑖3
𝑟3 ) (3.17)

32
3. 2. Applications of Cavity Expansion
3. 2. 1. Ballistic Penetration
In the field of ballistic penetration, cavity expansion and penetration are the two main
areas of research. Extensive research work has been conducted in penetration problems such as
(Hunter and Crozier, 1968; Bishop et al., 1945; Chadwick, 1959). These researchers tried to
derive models to determine the wall pressure on cylindrical or spherical cavity expansion.
Forrestal (1985) developed the elastic-cracked model for cavity expansion by studying the
penetration into geological targets such as porous rocks. Luk et al. (1991) developed the dynamic
spherical cavity expansion model in which the effects of strain hardening were taken into
account. There is also a comprehensive study conducted by Satapathy (1997) on cavity
expansion models for brittle and ductile materials. In ballistic tests, gelatin is used as a substitute
for the human body to evaluate penetration and impact trauma. Liu et al. (2014) developed a
cavity expansion model for gelatin-like materials. The solution was based on the assumption that
there is a fractured layer around the cavity wall as shown in figure (3.3).
Fig (3.3) Schematic of the elastic and fractured response around a spherical cavity (Liu et al., 2014).

33
The model is used to estimate the work needed to open a unit volume of the cross-layered
cavity. The model’s prediction is then compared with experiments of gelatin blocks penetrated
by various shaped fragments. The experiments are shown in figure (3.4).
Fig (3.4) Typical photos from high-speed videos recording the temporary cavity caused by different types of
projectiles (Liu et al., 2014).
3. 2. 2. Geomechanics
Cavity expansion theory has been commonly used in the field of geomechanics, especially
in in-situ soil testing, pile foundation, and pipe bursting.
- Pile foundation:
Pile foundations have two mechanisms to transfer loads from upper structural systems to
different layers of soils and rocks. Capacity is based on the end bearing (point bearing) and the
friction along the embedded shaft. Shaft capacity is the amount of load being resisted by the
pile’s shaft; it is based on the friction mechanism between the pile’s shaft and the surrounding
soil. End bearing capacity, on the other hand, is the amount of load transferred from the pile to
the soil from the lower end of the pile. Predicting end bearing capacity is considered one of the
geotechnical engineering challenges because of the many factors such as soil compressibility,
34
shear stiffness, strength, and the angle tapering of the pile, that need to be taken into account. As
a consequence, many researchers have tried to model the behaviour of piles such as Baligh
(1985) who developed the strain path method in an attempt to predict the behaviour of pile
foundations. Similarly, other researchers focused on developing solutions to predict the end
bearing capacity of driven piles. Yasufuku and colleagues used spherical cavity expansion to
derive an evaluation technique for the end bearing capacity in straight cylindrical piles
(Yasufuku et al., 1995, Yasufuku et al., 2001). Manandhar and Yasufuku (2012) used spherical
cavity expansion theory to evaluate the end bearing capacity of tapered piles.
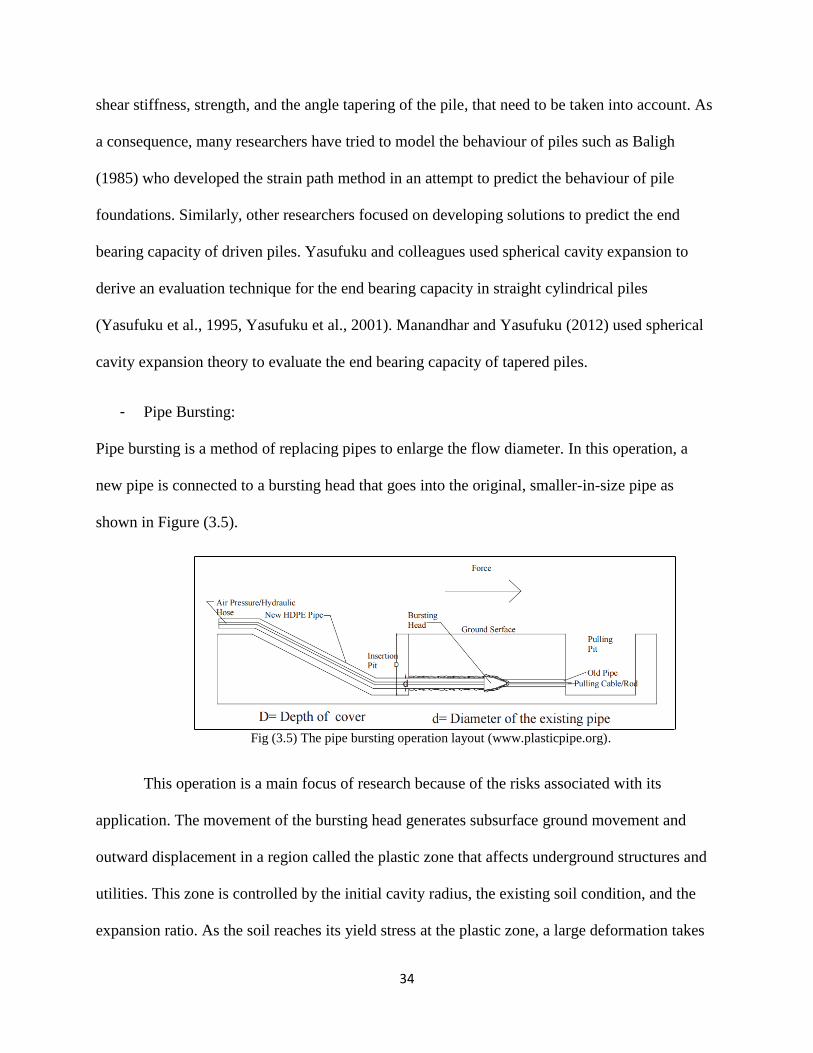
- Pipe Bursting:
Pipe bursting is a method of replacing pipes to enlarge the flow diameter. In this operation, a
new pipe is connected to a bursting head that goes into the original, smaller-in-size pipe as
shown in Figure (3.5).
Fig (3.5) The pipe bursting operation layout (www.plasticpipe.org).
This operation is a main focus of research because of the risks associated with its
application. The movement of the bursting head generates subsurface ground movement and
outward displacement in a region called the plastic zone that affects underground structures and
utilities. This zone is controlled by the initial cavity radius, the existing soil condition, and the
expansion ratio. As the soil reaches its yield stress at the plastic zone, a large deformation takes

35
place which damages neighboring utilities. Therefore, the extension of the plastic zone from the
new pipe is considered one of the major concerns to fulfill safety requirements of utilities and
subsurface structures. There has been much work done to evaluate the geometry and extension of
the plastic zone. O’Rouke (1985) proposed a solution that estimates the extension of the plastic
zone based on soil stiffness and cavity expansion. Yu and Houlsby (1991) used the cavity
expansion theory to develop a solution to predict ground displacements, Fernando and Moore
(2002) investigated their work by conducting a comparison using measures from Atalah et al.,
(1997) who used the cavity expansion theory to predict the extension of the soil plastic zone.
3. 3. Needle Insertion Mechanics
In this research, volumes of water are injected into the test samples. These volumes will
generate internal stresses and deformations which are the main components needed to measure
the mechanical properties of the samples. This process is done by attaching a balloon to a
medical needle and then injecting the balloon into the samples in order to deliver specific
volumes of water. Since the balloon is inserted into test samples using a medical needle, the
mechanics of needle insertion will be highlighted in this chapter.
In medical fields, medical needles are used to access tissue structures in a variety of
applications, such as, injecting specific dosages of drugs, delivering radioactive treatment to
tumor sites, especially in cases of prostate cancer, and to remove samples for diagnostic
examination. The insertion of a needle into biological tissue creates a deformation of the tissue
followed by its sudden rupture. This rupture occurs because of the formation and propagation of
uncontrolled cracks inside the tissue. Figure (3.6) shows the formation mechanism of an

36
uncontrolled crack. Strain energy is stored during the deformation, but the formation of initial
cracks releases this energy which causes the cracks to extend.
Fig (3.6) Crack formation starts with a micro crack at the needle tip of the original area A; s the applied force 𝐹𝑛
increases, the micro-crack extends to an increase of dA. 𝑊𝑐 is the work applied by the needle,
Mahvash and Dupont (2010).
It is known that as the motion velocity of the needle insertion increases, less deformation
occurs during the penetration process. This effect was studied by Brett et al. (1997) and Hing et
al. (2007). Brett et al. (1997) found that the cutting force profile of a needle in porcine samples
and cadavers did not change with insertion velocity, but the maximum force decreased as the
insertion velocity increased. Moreover, Hing et al. (2007) observed a decrease in the average
needle penetration force in liver samples as the insertion velocity increased. Mahvash and
Dupont (2010) confirmed the same response when the test results of porcine cardiac tissue
agreed with the analytical prediction of their fracture model. In their work, the insertion process
was modeled based on four main stages shown in Figure (3.7).

37
Fig (3.7) Force-displacement curve for needle insertion into porcine cardiac tissue, Mahvash and Dupont (2010).
The needle insertion force-displacement relationship can be divided into four stages. 0 to
1, known as deformation; 1 to 2, known as rupture, where the crack is formed and starts to
propagate; 2 to 3, known as cutting stage, where the crack breaks through in an organized
manner as the needle moves forward; 3 to 4, known as unloading deformation, where another
displacement takes place as the needle ceases its forward movement and begins to go backward.
The process of delivering volumes of water and how they are related to measuring the
mechanical properties of the samples will be discussed in details in the next chapters.
Note: Sign convention: This study adopts the conventional sign notation generally used in
geomechanics wherein compressive pressures and stresses are considered positive.

38
3. 4. Summary
This chapter addressed the theoretical aspect of the cavity expansion technique. For half a
century, the cavity expansion theory was used to solve a variety of engineering problems. It has
been implemented to provide analytical solutions in many different media and for various
material behaviours. This study adopts the elastic solution of spherical cavity expansion to
evaluate the mechanical behaviour of soft materials. This theory is used in many fields of
engineering including ballistic penetration and geomechanics.
The cavity expansion technique is based on developing an expanding cavity within soft
materials. This process is achieved through injecting an expanding sphere using a medical
needle. This chapter addressed needle insertion mechanics, which can be described as the sudden
rupture which occurs due to the propagation of uncontrolled cracks. These cracks are generated
as a result of deformation when the needle is applied to soft tissue.

39
Chapter 4
Experimental Work on Polyvinyl Alcohol Hydrogels
A new testing method is used to evaluate the stiffness of PVA hydrogel samples. To
check the validity of the new techniques’ results, the results were compared with the results from
a conventional test method used to evaluate the mechanical properties of the hydrogel samples
known as unconfined compression test. The unconfined compression test is based on applying a
uniaxial compression load to the test samples without providing side supports against the lateral
displacement. The new proposed method is based on creating a spherical cavity within the
hydrogels by applying uniform stresses from a volume-controlled region inside the test samples.
In this chapter, the procedures of testing the PVA samples by unconfined compression
test and the new spherical cavity expansion method are presented, in addition to X-ray imaging
works.
4.1. Test Program
Using hydrogel samples, two types of experimental tests were conducted, namely: (a)
unconfined compression test, and (b) spherical expansion test. X-ray computed tomography (CT)
imaging was performed to investigate the internal expansion of the spherical cavity.
In the unconfined compression test, as uniaxial load was applied, both vertical and lateral
displacements were monitored. To evaluate Poisson’s ratios, the maximum lateral displacements
at the end of the test were observed and used to evaluate the lateral strains.
40
In the spherical expansion test, stresses were applied from a controlled region from
within the hydrogel samples. These stresses were generated by applying various cavity volumes
of water inside the hydrogel samples. The stiffness of the samples was then evaluated based on
the applied volumes of water and corresponding applied stresses.
4. 2. PVA Hydrogel Samples
In this study, the new proposed method is based on an assumption that the PVA hydrogel
samples are homogeneous isotropic linear elastic materials. Knowing the PVA to water ratio,
both samples were physically cross-linked by a single freeze and thaw cycle (FTC). Table (4.1)
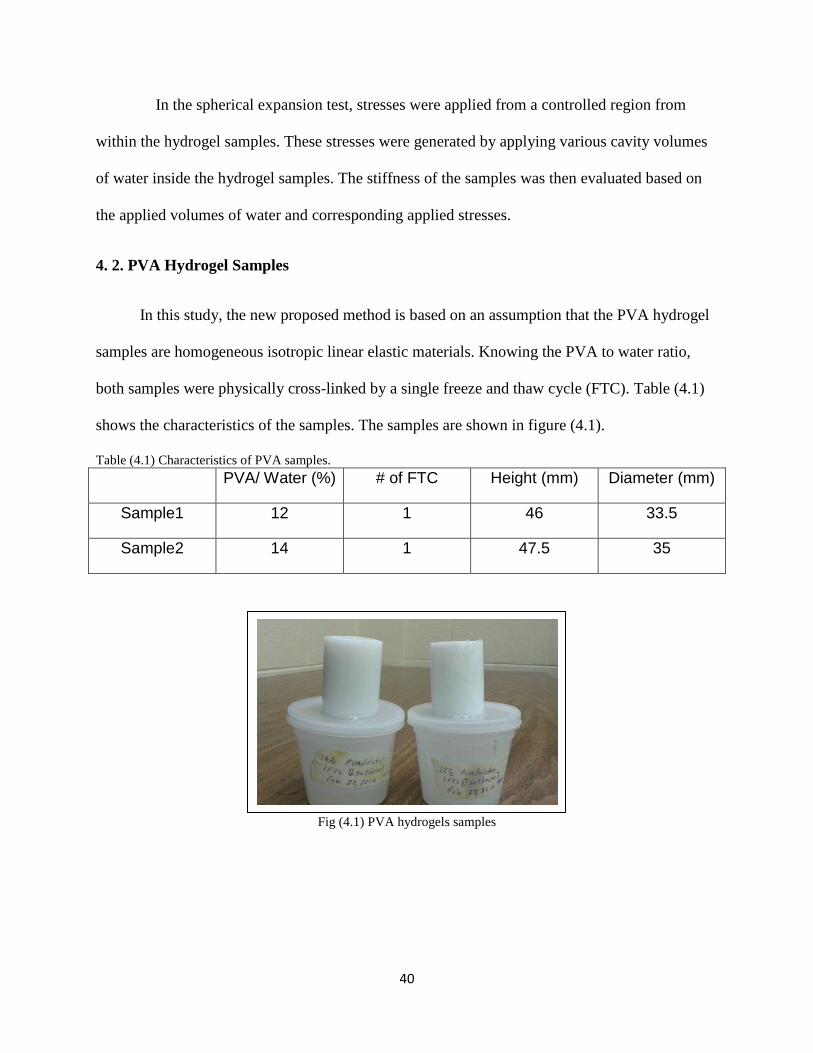
shows the characteristics of the samples. The samples are shown in figure (4.1).
Table (4.1) Characteristics of PVA samples.
PVA/ Water (%) # of FTC Height (mm) Diameter (mm)
Sample1 12 1 46 33.5
Sample2 14 1 47.5 35
Fig (4.1) PVA hydrogels samples

41
4. 3. Unconfined Compression Test
4. 3. 1. Test Setup
To characterize the mechanical behaviour of the hydrogel samples, uniaxial unconfined
compression test of the samples was performed between two flat plates. The samples were
loaded at a rate of 10mm/min using an Instron loading machine (model 4465; Canton, MA,
USA). Figure (4.2) shows the apparatus used in the unconfined compression test. A linear
variable differential transformer (LVDT) and load cell were used to measure displacement and
load. The load-displacement relationship was recorded during the test using a data acquisition
system. Figure (4.3) shows the application of compression loads on a hydrogel sample. A digital
vernier caliper was used to measure the transverse (lateral) deformation at the maximum applied
vertical displacement. Sample1 was uniaxially deformed with a vertical displacement of 17mm.
Sample 2 was deformed with a vertical displacement of 12mm.
Fig (4.2) Instron (model 4465; Canton, MA, USA); the apparatus used in the unconfined
compression test.

42
Fig (4.3) PVA hydrogel sample mounted between two flat plates during unconfined compression test.
4. 3. 2 Results
The stress-strain relationship was established for both samples using measured load and
displacement data, as shown in figure (4.4). As expected for hydrogel, a nonlinear relationship
between stress and strain was observed. Therefore, the Young’s modulus was measured at
different strain levels.
For Sample 1, Young’s modulus was calculated at 15%, 25%, and 30% strain. An
assumption was made that the average of tangents of 15%-25%, 20%-30%, and 25%-35% from
stress-strain data were equal to 20%, 25%, and 30% strain, respectively. Following the same
trend, the average of tangents of 10%-20%, 15%-25%, and 18%-25% from stress-strain data of
Sample 2 were assumed to be equal to 15%, 20%, and 22% strain, respectively.

43
Fig (4.4) stress-strain relationship for Sample 1 and Sample 2.
Transverse diameters of Sample 1 and Sample 2 at maximum applied loads were
39.04mm and 39.2mm, respectively. Poisson’s ratio was then evaluated as the ratio of transverse
strain to axial strain. Table (4.2) shows the stiffness and Poisson’s ratio for each sample.
Table (4.2) Stiffness at different points of stress-strain curves, and Poisson’s ratio for samples (1) and (2).
Strain%
Stiffness
(KPa)
Poisson’s ratio
Sample1
20% 224.5
0.46
25% 235.08
30% 306.67
Sample2
15% 299.53
0.46
20% 351.68
22% 379.35

44
4. 4 Spherical Expansion Test
4. 4. 1 Test Setup
A prototype was constructed to apply the required cavity volumes. The prototype
consisted of a low durometer urethane balloon with a radius of 5 mm manufactured by Vention
Medical Inc, medical needle (0.7mm x 40mm, BD Precision GlideTM), syringe (3ml), syringe
pump (Cole-Parmer Instrument Co. Model 75900-00, USA), and a digital pressure gauge
(Ashcroft Inc. Model DG25, USA).
The needle was machined to provide an opening which was later used to provide
various volumes of water. The balloon was slid onto the needle as shown in figure (4.5) and then
epoxy glue was applied to securely attach the balloon to the needle at both open sides of the
balloon. The sharp open head of the needle was blocked using epoxy to limit the water flow to
the balloon through the side opening on the needle. The system is assembled as shown in Figure
(4.6).
Fig (4.5) Low durometer balloon assembled with the needle.
45
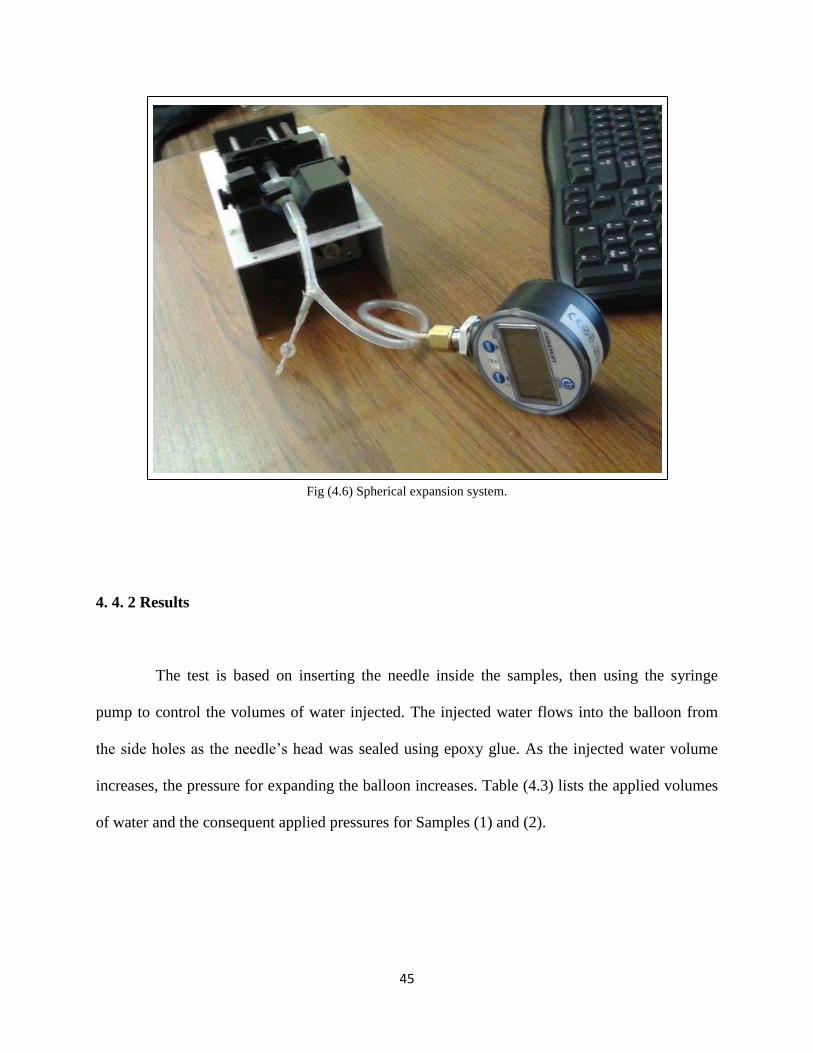
Fig (4.6) Spherical expansion system.
4. 4. 2 Results
The test is based on inserting the needle inside the samples, then using the syringe
pump to control the volumes of water injected. The injected water flows into the balloon from
the side holes as the needle’s head was sealed using epoxy glue. As the injected water volume
increases, the pressure for expanding the balloon increases. Table (4.3) lists the applied volumes
of water and the consequent applied pressures for Samples (1) and (2).

46
Table (4.3) Applied water volumes and consequent applied pressures for samples (1) & (2)
4. 4. 3. Mathematical Model Analysis
The pressure vs volume change relationship is an efficient way for the mechanical
characterization of material subjected to volumetric changes. This relationship has been used in
finite element models as the required input for soft tissue properties. However, the raw data can
be used to find the conventional stress-strain relationship.
The calculation of the strain (such as radial strain) is based on the volumetric strain.
The volumetric strain can be defined as the ratio of the change in volume (𝛥𝑣) to the volume of
the affected zone (𝑉). The first is known as the injected volume of water with increasing
increments of 100ul. The second is assumed to be a spherical volume with a radius (𝑟𝑙𝑖𝑚). This
radius represents the radius of each hydrogel sample. This assumption was based on an
investigation conducted using equation (3.16) to verify the limit of the balloon expansion effect
at each applied volume. The outcome of this investigation is shown in figures (4.7a and b),
Sample1 Sample2
Applied Volumes
(ul)
Consequent applied pressure
(kPa)
Consequent applied pressure
(kPa)
523.6
7
24.95 28.47
623.6 31.09 36.16
723.6 37.36 42.33
823.6 44.12 49.98
923.6 51.22 58.19
1023.6 58.95 66.74
1123.6 67.01 75.84
1223.6 75.42 85.42
1323.6 84.59 95.49
1423.6 94.38 106.11
1523.6 104.8 117.34
1623.6 115.9 128.93
1723.6 125.96 141.13
1823.6 135.82 -
1923.6 142.72 -

47
which shows that the effect of applied pressure significantly decreases at the edge of the
hydrogel samples.
(a)
(b)
Fig (4.7) Effect of applied pressure from balloon-hydrogel contact surface to the edge of the hydrogel a) Sample 1
and b) Sample 2.
48
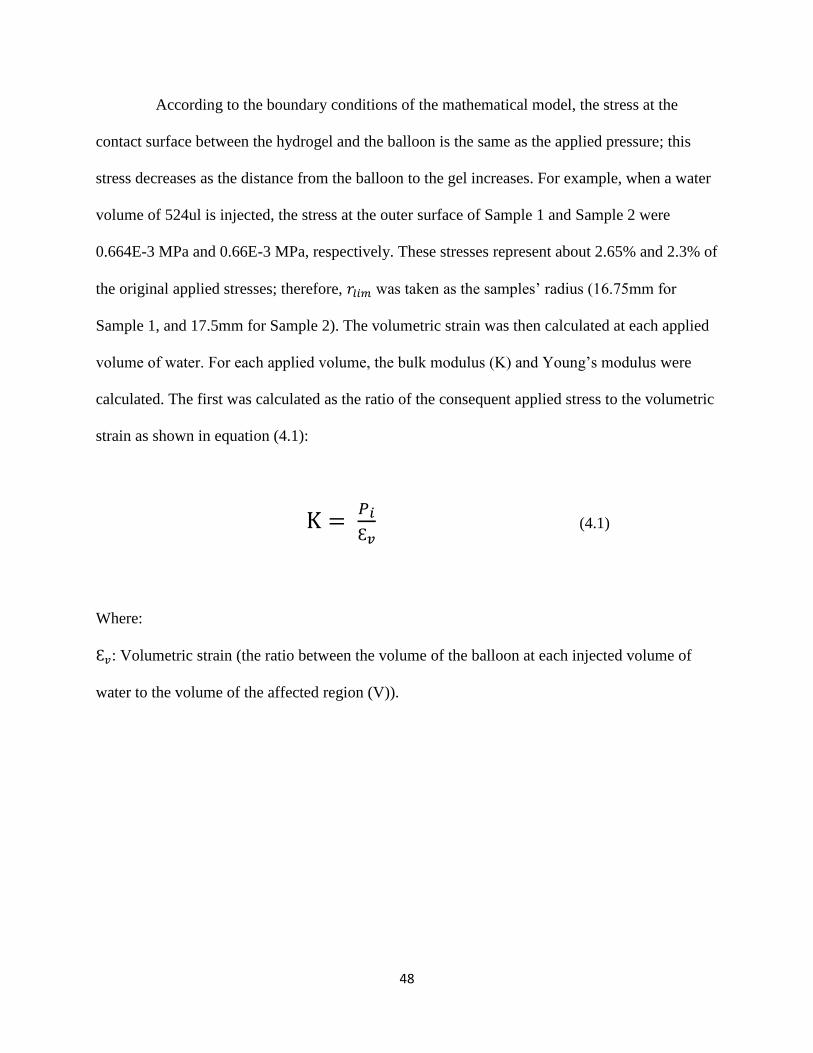
According to the boundary conditions of the mathematical model, the stress at the
contact surface between the hydrogel and the balloon is the same as the applied pressure; this
stress decreases as the distance from the balloon to the gel increases. For example, when a water
volume of 524ul is injected, the stress at the outer surface of Sample 1 and Sample 2 were
0.664E-3 MPa and 0.66E-3 MPa, respectively. These stresses represent about 2.65% and 2.3% of
the original applied stresses; therefore, 𝑟𝑙𝑖𝑚 was taken as the samples’ radius (16.75mm for
Sample 1, and 17.5mm for Sample 2). The volumetric strain was then calculated at each applied
volume of water. For each applied volume, the bulk modulus (K) and Young’s modulus were
calculated. The first was calculated as the ratio of the consequent applied stress to the volumetric
strain as shown in equation (4.1):
K = 𝑃𝑖
Ԑ𝑣 (4.1)
Where:
Ԑ𝑣: Volumetric strain (the ratio between the volume of the balloon at each injected volume of
water to the volume of the affected region (V)).

49
Young’s modulus is then calculated from equation (4.2):
K = E
3(1−2υ) (4.2)
υ : is the Poisson’s ratio evaluated using the unconfined pressure test.
The radial and hoop stresses were calculated using equations 3.12 and 3.13,
respectively. The radial strain is calculated using equation (3.4). Tables (4.4) and (4.5) include
the volumetric strain, bulk modulus, Young’s modulus, and radial strain for each applied volume
of water into samples (1) and (2) at the contact surface between the hydrogel and the balloon.
Table (4.4) Volumetric strain, bulk modulus, young’s modulus, and radial strain for Sample 1.
Applied volume (ul)
Volumetric strain Bulk modulus (MPa) E (kPa) Radial strain (Ԑr)
523.6 0.0169 1.47 256.6 0.1660
623.6 0.0202 1.54 268.5 0.1987
723.6 0.0234 1.59 278.1 0.2318
823.6 0.0266 1.65 288.5 0.2651
923.6 0.0299 1.71 298.6 0.2988
1023.6 0.0331 1.78 310.1 0.3329
1123.6 0.0363 1.84 321.1 0.3672
1223.6 0.0396 1.90 331.9 0.4020
1323.6 0.0428 1.97 344.1 0.4371
1423.6 0.0461 2.04 357.0 0.4726
1523.6 0.0493 2.12 370.4 0.5084
1623.6 0.0525 2.20 384.4 0.5446
1723.6 0.0558 2.26 393.5 0.5812
1823.6 0.0590 2.3 401.0 0.6182
1923.6 0.0623 2.37 413.5 0.6556

50
Table (4.5) Volumetric strain, bulk modulus, Young’s modulus, and radial strain for Sample 2
Applied volume (ul)
Volumetric strain Bulk modulus (MPa) E (KPa) Radial strain (Ԑr)
523.6 0.0233 1.22 314.8 0.1347
623.6 0.0277 1.26 326.4 0.1611
723.6 0.0322 1.31 338.6 0.1878
823.6 0.0367 1.36 351.3 0.2147
923.6 0.0411 1.41 364.7 0.2418
1023.6 0.0456 1.46 377.4 0.2692
1123.6 0.0500 1.51 390.7 0.2968
1223.6 0.0545 1.57 404.1 0.3246
1323.6 0.0589 1.62 417.6 0.3527
1423.6 0.0634 1.67 431.4 0.3811
1523.6 0.0679 1.73 445.8 0.4097
1623.6 0.0723 1.78 459.7 0.4386
1723.6 0.0768 1.84 474.0 0.4677
For further investigation of the effect of applied stresses on the hydrogel samples,
arbitrary zones were chosen at 2mm, 3mm, and 5mm from the contact surface between the
balloon and the hydrogel. Figures (4.8a, b and c) show the relationship between the consequent
applied stress and the radial strain at 2mm from the contact surface, 3mm from the contact
surface, and 5mm from the contact surface for samples (1) and (2). It is clearly observed that
Sample 1 showed a softer behaviour when compared with Sample 2 which agreed with the data
obtained from the unconfined compression test.

51
(a)
(b)
(c)
Fig (4.8) Stress-radial strain relationship of spherical expansion test for samples (1) & (2), at a) 2mm, b) 3mm and c)
5mm distances from the balloon-hydrogel interface.
52
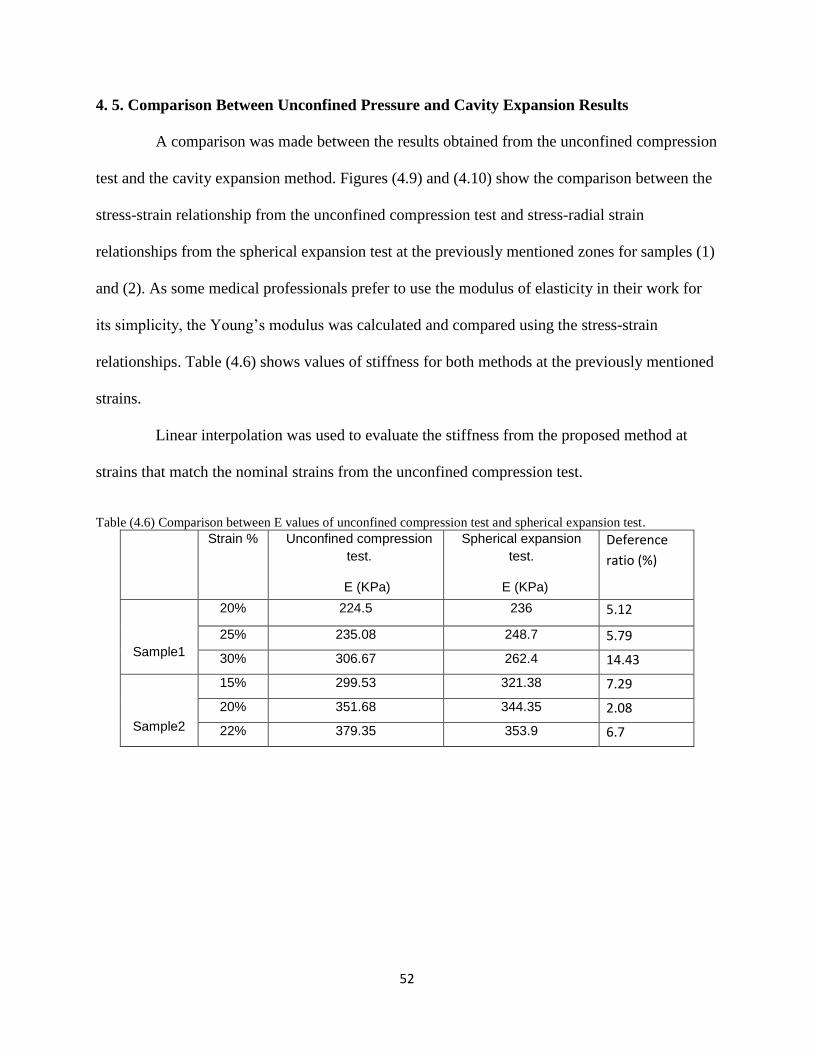
4. 5. Comparison Between Unconfined Pressure and Cavity Expansion Results
A comparison was made between the results obtained from the unconfined compression
test and the cavity expansion method. Figures (4.9) and (4.10) show the comparison between the
stress-strain relationship from the unconfined compression test and stress-radial strain
relationships from the spherical expansion test at the previously mentioned zones for samples (1)
and (2). As some medical professionals prefer to use the modulus of elasticity in their work for
its simplicity, the Young’s modulus was calculated and compared using the stress-strain
relationships. Table (4.6) shows values of stiffness for both methods at the previously mentioned
strains.
Linear interpolation was used to evaluate the stiffness from the proposed method at
strains that match the nominal strains from the unconfined compression test.
Table (4.6) Comparison between E values of unconfined compression test and spherical expansion test.
Strain %
Unconfined compression
test.
E (KPa)
Spherical expansion
test.
E (KPa)
Deference
ratio (%)
Sample1
20% 224.5 236
5.12
25% 235.08 248.7 5.79
30% 306.67 262.4 14.43
Sample2
15% 299.53 321.38
7.29
20% 351.68 344.35 2.08
22% 379.35 353.9 6.7

53
(a)
(b)
(c)
Fig (4.9) Comparison between stress-strain relationships of unconfined compression test and spherical expansion
test of Sample1 at a) 2mm, b) 3mm and c) 5mm from the balloon-hydrogel interface.
54
(a)
(b)
(c)
Fig (4.10) Comparison between stress-strain relationships of unconfined compression test and spherical expansion
test of Sample2 at a) 2mm, b) 3mm and c) 5mm from the balloon-hydrogel interface.

55
From Table (4.6) and Figures (4.9) and (4.10), the stiffness values obtained from the
cavity expansion technique showed a slight difference in the stiffness obtained from the
unconfined compression test. However, at 30% strain in Sample 1, the difference ratio was the
highest. This can be attributed to the nature of the PVA hydrogels’ behaviour under unconfined
compression testing. As it will be shown in chapter 7, the J-shaped stress-strain relationship
exhibited by the unconfined compression test showed a noteworthy curvature at 30% strain when
compared with the stress-strain relationship obtained from the cavity expansion test.
4. 6. X-ray Imaging
To verify the response of the balloon inside the hydrogel samples, GE X-ray inspection
system (v/tome/x s 240, Germany) was used. Figure (4.11) shows how the samples were
installed inside the X-ray system. Both air and water injections were investigated. First, the
needle was inserted into the hydrogel samples and the samples were then injected with 3ml of
air, as shown in Figure (4.12). It was noticed that air compressibility resulted in generating
random shapes of expansion which affected the precision of the mathematical solution.
Therefore, an incompressible fluid, such as water was tried in the second imaging process.

56
Fig (4.11) Hydrogel sample injected with water and subjected to beams of X-ray to create 3-D images of the cavity
expansion.
Fig (4.12) 3ml of air injected inside hydrogel samples.

57
It was obvious in the collected images that water exhibited a more spherically uniform
expansion as shown in Figure (4.13). As such, water was used for the rest of the testing
procedure of the cavity expansion method. Notwithstanding, the images were not clear. This is
mainly due to the fact that the main component of the hydrogel samples is water. In X-ray
imaging, when X-ray beams exit an object, they contain an image of the object formed by the
variation in exposure to these beams. This variation occurs as a result of attenuation when the X-
ray beam passes through different parts of the object. Since samples (1) and (2) were made of
PVA/water ratios of 12% and 14%, respectively, and water was used to create cavity voids, the
X-ray system was not able to clearly identify the applied water void inside the hydrogel samples.
Fig (4.13) X-ray image of balloon filled with water inside a hydrogel sample.

58
To enhance the quality of the images, a contrast agent was used. Contrast agents are
materials used to increase the contrast of an object’s components when subjected to X-ray
beams. X-ray attenuation-based contrast agents are the most common, especially in medical
imaging. In this type of contrast agent, iodine and barium are widely used to enhance X-ray
based imaging.
Iodine is a chemical element with an atomic number of 53. As an element with a
relatively high atomic number, iodine has the potential to efficiently absorb X-ray beams which
makes it a very good option as a contrast agent. The method adopted to make a contrast agent
was based on dissolving small parts of iodine into distilled water or alcohol. However, iodine
solubility in water is considered relatively low, so that we redirected our interest towards iodide.
Iodide is the ion state of iodine. Ionic compounds dissolve in polar solvents such as water.
Therefore, we used sodium iodide (Nal) which is a salt of iodide and sodium. A solution was
made by dissolving sodium iodide into water with a concentration of 1.5g/ml. Figure (4.14)
shows a cavity created inside a hydrogel sample using a sodium iodide solution.

59
Fig (4.14) X-ray image of the balloon injected with a sodium iodide solution inside a hydrogel sample
It can be noticed from the top view that the expansion of the balloon inside the hydrogel
is more uniform, unlike when air was injected. This difference can be attributed to the
intermolecular distance between air particles. On a molecular level, this distance is large in
gases, like air, which allow them to expand and occupy any space available, or compress when
subjected to applied pressures. On the other hand, the intermolecular distance between particles
of liquids, or water in our case, is less which made them less compressible. The molecular
property of liquids, made water an acceptable option as a source of applied internal pressure.

60
4. 7. Conclusions
1. Two hydrogel samples with different PVA water ratios were tested using the unconfined
compression and cavity expansion methods.
2. The Young’s modulus for each sample was measured at different strain levels. As expected,
the Young’s modulus increased with strain in both samples to the nonlinear elasticity nature of
the gel.
3. A good agreement between Young’s moduli at different stress levels using the two testing
methods was seen.
4. Using X-ray CT imaging, the injection of water into the balloon resulted in a more spherical
cavity formation than that formed when injecting air. This was attributed to the incompressibility
nature of water.

61
Chapter 5
Finite Element Study
The feasibility of the mathematical model presented in Chapter 3 can be examined using
the finite element model. It has been demonstrated that the behaviour of soft tissues radically
change when dissociated from their environment (Ottensmeyer et al., 2004). In this research, the
new proposed method is believed to pioneer a new testing technique that will allow surgeons to
probe and anticipate the mechanical response of soft tissues, in vivo; therefore, finite element
models were developed to investigate the validity of the mathematical model. A comparison will
be made between the values of radial displacement calculated by both the mathematical and
finite element models.
5.1. Finite Element Model
5. 1. 1. Model Configuration
An axisymmetric finite element model was constructed using ABAQUS/CAE (version
6.12-3) to investigate the validity of the mathematical solution. Investigation criterion was based
on examining the displacements anticipated by the mathematical model at each applied volume
of water for each hydrogel sample. As the elastic moduli were determined from experimental
work, the values of Young’s moduli obtained from the spherical expansion test were used in the
finite element model. The model is a rectangular shell with dimensions of 35mm by 47mm with
an empty opening at the neutral axis of 5mm in radius. An arch shell of 0.2mm in thickness was
constructed to occupy the arch vacancy to represent the balloon. The model was then discretized

62
by four-node bilinear elements (CAX4) with the 0.5 x 0.5mm2grid density as shown in Figure
(5.1).
Fig (5.1) An axisymmetric finite element body constructed on ABAQUS to simulate the combination of the
hydrogel and the balloon.
The opening was created as the size of the balloon radius. The size of the balloon limits
the minimum spherical form of the balloon to 524mm3. Smaller volumes of injected water
would result in non-spherical balloon inflations which were not addressed in the analytical
solution presented in Chapter 4.

63
5. 1. 2. Material Properties
The material behaviour of the hydrogel was defined by the mathematical model
(isotropic, elastic material). The balloon behaviour was defined as hyperelastic. A cavity
expansion test was conducted on the balloon while it was free, with the test data analyzed and
used as a source to compute the strain energy. These data are series of applied stresses and radial
strains presented in Table (5.1).
Table (5.1) Stress-strain relationship of the test balloon.
Applied stress (MPa) Radial strain.
0.0055 0.06
0.00979 0.113
0.0142 0.1628
0.0188 0.2081
0.0235 0.25
0.0282 0.289
0.033 0.326
0.0377 0.362
0.0424 0.395
0.047 0.427
0.051 0.457
0.0515 0.487
The radial strain was evaluated from the volumetric strain of the balloon. Since the
original balloon volume is 524ul, and the injection increment was 100ul, the volumetric strain

64
was evaluated as the ratio of the change in volume (∆V) to the original volume (V). The radial
strain was then calculated using equation (5.1)
∆𝐕
𝑽= Ԑ3 + 3Ԑ2 + 3Ԑ (5.1)
Where Ԑ is the radial strain of the balloon.
In the mathematical model, Poisson’s ratio of the balloon was assumed to be 0.499;
therefore, the assumption of incompressibility was adopted for the balloon in the numerical
model. As in the experiment, the values of Young’s modulus of the hydrogel obtained from the
cavity expansion test (Tables 4.4 & 4.5) were inserted with their matching stresses at each
consequent applied pressure.
5. 1. 3. Contact Surfaces and Friction
In the FEM, the interaction between the balloon and the hydrogel was modeled as a
contact surface between the outer surface of the balloon and the hydrogel. This surface was
defined as surface-to-surface interaction on ABAQUS, defining the balloon surface as the master
surface and the hydrogel surface as the slave surface. As observed from Figure (4.13) in the past
chapter, when the balloon was inflated, it experienced an overwhelming entrapment by the
hydrogel samples; therefore, a rough surface interaction was chosen to define the contact
between the balloon and the hydrogel on ABAQUS.

65
5. 1. 4. Boundary Conditions
Boundary conditions (BCs) in the numerical axisymmetric model consisted of two types,
namely: constant and variable. The constant BCs represented constraints, with the variable BCs
representing applied pressures. In the constant BCs, the hydrogel was constrained from moving
horizontally along the symmetry axes. In the variable BCs, the values of pressures obtained from
the spherical expansion test were entered in the FE model. These pressures were then applied on
the inner surface of the balloon. Each applied pressure was uniformly distributed through the
inner surface of the balloon.
5. 2. Results:
Figure (5.2) shows the inflation of the balloon inside the hydrogel simulated by finite
element software.
Fig (5.2) Simulation of balloon inflation inside the hydrogel (Sample2), the balloon was injected with 1724ul of
water.
A verification of the mathematical solution is conducted by comparing the radial
displacement calculated from the mathematical model and the displacement calculated by the
finite element model. By using Young’s modulus at each applied volume of water and Poisson’s

66
ratios obtained from the experimental work (Tables 4.2, 4.4, and 4.5), hoop strain can be
calculated from equation (3.5). The radial displacement is then computed by equation (3.2).
Figures (5.3) and (5.4) show radial displacements, and radial displacements computed by the
finite element model at each applied volume of water for gel Sample 1 and Sample 2.
Fig (5.3) Comparison between the radial displacements obtained by the mathematical model and numerical model
for Sample 1.
Fig (5.4) Comparison between the radial displacements obtained by the mathematical model and numerical model
for Sample 2.
67
As can be noticed from Figures (5.3) and (5.4), the results of the displacements from the
mathematical model and finite element analysis are close. This outcome encourages extending
the research further to include investigating the stiffness of real soft tissue.
5. 3. Summary
An axisymmetric finite element model was developed using ABAQUS/CAE (version
6.12-3). It consisted of a hydrogel sample and a balloon. The material properties used to define
the behaviour of FE models were the results obtained from the experimental work.
The purpose of this FE study was to verify the mathematical solution presented in chapter
4. The criterion of verification was the comparison between the radial displacements predicted
by both the numerical analysis and mathematical analysis. The outcome of this study encouraged
extending this work to include investigating the validity of the cavity expansion technique on
actual soft tissues.

68
Chapter 6
Case Study: Evaluating the Stiffness of Liver
In most mammals, the largest ventral organ is the liver. The liver is a glandular organ
responsible for major functions including metabolism, regulating glycogen storage, producing
hormones, synthesizing blood proteins, and filtering blood before it goes to the rest of the body.
Although the liver is located in a relatively protected position, according to Brammer et al.
(2002), it is one of the most common abdominal organs that experience injury as a result of blunt
trauma. For example, in frontal vehicle accidents, the liver is frequently injured (Elhagediab and
Rouhana, 1998). It is also subjected to many diseases such as cirrhosis, cancer, fatty liver,
hepatitis, and fibrosis. Evaluating the mechanical properties of liver tissues is critical to
comprehending their behaviour which is essential to many medical applications. Several
techniques have been proposed for the mechanical testing of liver tissue (Brown et al., 2003;
Kalanovic et al., 2003; Nava et al., 2004; Nava et al. 2004). One of the common techniques to
evaluate the mechanical properties of liver tissues is the tensile test (Kemper et al., 2010; Lu et
al., 2014; Brunon et al., 2010).
This chapter adopts the same pattern used in chapter (4). Bovine liver tissues were tested
using a uniaxial tensile test, in addition to the spherical expansion method to evaluate their
stiffness. The results obtained from the tensile test were then used as a reference to investigate
the validity of the results obtained from the spherical expansion method.

69
6. 1. Test Program
In this case study, the program consisted of two test series: (a) uniaxial tensile test; and
(b) cavity expansion test. Both tests were conducted on a bovine liver. The liver samples used in
both tests were extracted from the right lobe. The sample used in the spherical expansion test
was aged 24 hours (from extraction). The sample used in the uniaxial tensile test was aged 72
hours (from extraction).
6. 2. Test Samples
6. 2. 1. Uniaxial Tensile Test Samples
In the tensile test, the sample was extracted from the core of the liver. A 2.5cm thick slice
was cut from the liver, then punched at a region where there was no vascular veins using a 2cm
machined tube connection as shown in Figure (6.1)
Fig (6.1) A segment of liver punched using a 2cm cylinder.
The cylindrical liver segment was then cut into a small sample with a cross-section of 2.85mm ⨉
6mm, as shown in Figure (6.2).

70
Fig (6.2) Liver sample 2.85mm x 6mm.
6. 2. 2. Spherical Expansion Test Sample
The sample used in this test was cut from the right lobe of the liver. This sample had an
average thickness of 4cm. The sample is shown in Figure (6.3).
Fig (6.3) Sample of spherical expansion test.

71
6. 3. Test Setup
6. 3. 1. Uniaxial Tensile Test
A uniaxial tensile test was conducted using a uniaxial test system (Biotester, CellScale,
Waterloo, ON, Canada). Figure (6.4) shows the apparatus used in the test.
Fig (6.4) The biotester.
The liver sample was entangled to rakes with hooks at their ends of 2.5mm in length as shown in
Figure (6.5). The sample was preloaded with a force of 2.5mN. At this state, the strain is
considered zero. The distance between the hooks at this state was 15.85mm. The sample was
then loaded with a loading rate of 10mN/s.
Fig (6.5) Liver 2.85mm x 6mm liver sample mounted in the biotester.

72
6. 4. Results
A set of data representing the applied forces was obtained from the output of load cells
located on the actuators. A group of images were captured using a high-definition camera
throughout the test. To procure the stress-strain relationship, stress was calculated by dividing
the force data by the area of initial cross-section. Two paper clips were mounted on the surface
of the liver sample as shown in figure (6.6); strain was then calculated by tracking the grid point
coordinates of the paper clips throughout the test. The method used to calculate the stiffness of
the liver sample is shown in Figure (6.7). This method was adopted from Kahlon et al., 2014.
The stiffness was determined as the slope of the maximum linear portion of the stress-strain
curve. The maximum linear region was defined with an R-squared value of 0.989. The tensile
elastic modulus was then calculated as the slope of the line, and the stiffness of the liver tissue
was 76.92 KPa.
Fig (6.6) Paper clips mounted on the liver tissues to evaluate the stretching strain.
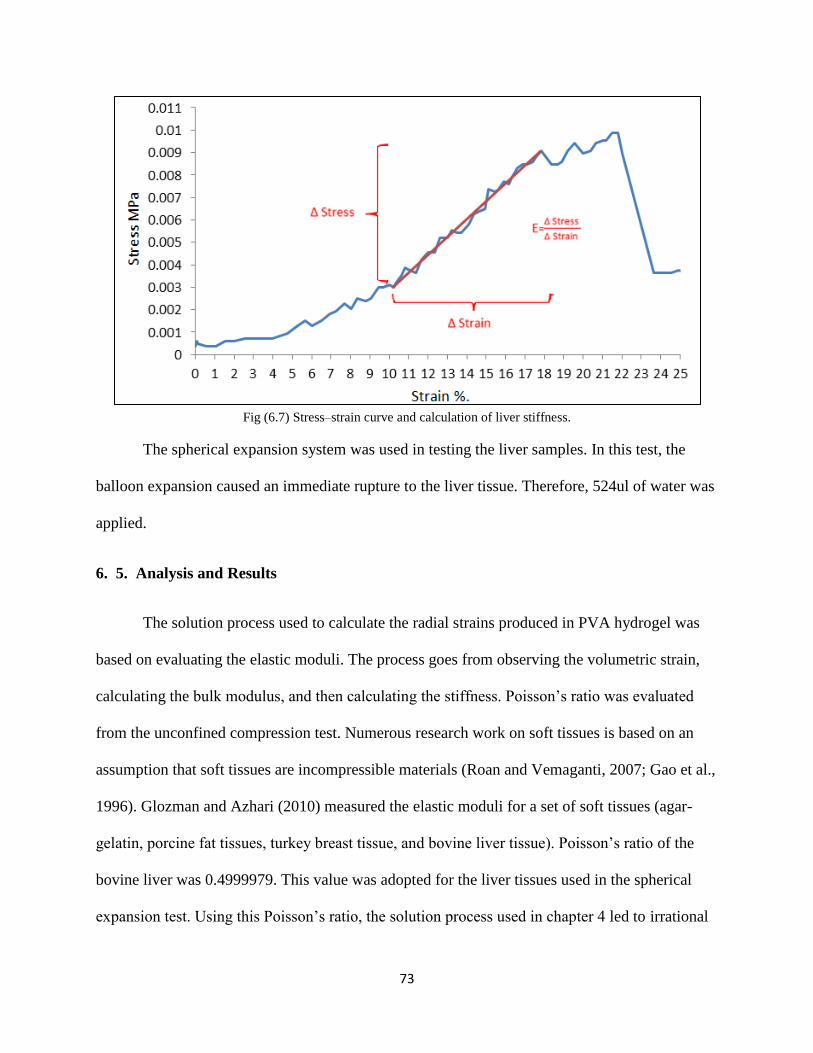
73
Fig (6.7) Stress–strain curve and calculation of liver stiffness.
The spherical expansion system was used in testing the liver samples. In this test, the
balloon expansion caused an immediate rupture to the liver tissue. Therefore, 524ul of water was
applied.
6. 5. Analysis and Results
The solution process used to calculate the radial strains produced in PVA hydrogel was
based on evaluating the elastic moduli. The process goes from observing the volumetric strain,
calculating the bulk modulus, and then calculating the stiffness. Poisson’s ratio was evaluated
from the unconfined compression test. Numerous research work on soft tissues is based on an
assumption that soft tissues are incompressible materials (Roan and Vemaganti, 2007; Gao et al.,
1996). Glozman and Azhari (2010) measured the elastic moduli for a set of soft tissues (agar-
gelatin, porcine fat tissues, turkey breast tissue, and bovine liver tissue). Poisson’s ratio of the
bovine liver was 0.4999979. This value was adopted for the liver tissues used in the spherical
expansion test. Using this Poisson’s ratio, the solution process used in chapter 4 led to irrational

74
values of liver stiffness, i.e. E 0. Therefore, a more simplified method to evaluate the strain in
liver tissues was used. For an elastic and isotropic material, Ehrgott (1971) defined the radial
strain as the ratio of the change in radius to the original radius.
Ԑ𝑟 = ∆𝑟
𝑟0 (6.1)
This concept was used in the expansion test. Inside the liver sample, the original radius
was defined as the radius of an assumed spherical region that has a radius equivalent to the
average thickness of the liver sample. The radial deformation (∆𝑟) was considered as the radius
of the inflated balloon as it was injected with 524ul of water. 𝑟0 considered as the radius of a
sphere that has a diameter equal to the average thickness. The pressure reading observed at this
injected volume was 0.0219 MPa. The radial strain evaluated from equation 6.1 was 0.2501.
Since the technique assumes that the liver is a linear elastic isotropic material, the stiffness was
evaluated using equation 6.2
E= 𝜎𝑟
Ԑ𝑟 (6.2)
Equation 6.2 yields a Young’s modulus of 87.56 KPa.
Figure (6.8) shows a stress-strain chart representing the data of both techniques.

75
Fig (6.8) Stress-strain data of tensile test and cavity expansion test.
The data obtained from the cavity expansion test provided the behaviour of liver tissues
only at the rupture stage. A smaller balloon size is recommended in order to extend the range of
the recorded stress-strain relationship in tissues like liver. Although the stiffness evaluation of
the liver tissue in the cavity test (E1) was based on an assumption of linear elastic behaviour, it
predicted a close behaviour to the one observed from the tensile test (E2). In the next chapter, a
detailed discussion will address the restrictions that lead to limited cavity expansion data.

76
6. 6. Summary
Two techniques were used to evaluate the stiffness of bovine liver tissues, uniaxial tensile
testing and cavity expansion testing.
In the uniaxial tensile test, the liver tissue sample (2.85mm x 6mm x 15.85mm) was
stretched using the biotester. The stiffness was evaluated as the slope of the maximum linear
region of the stress-strain curve. The tensile stiffness was 76.92 kPa.
In the cavity expansion test, the liver sample had an average thickness of 4cm. 524ul of
water was injected into the balloon while it was inside the liver sample. The stiffness was
evaluated using equation (6.2). The evaluated stiffness was 87.56 kPa.

77
Chapter 7
Discussion and Conclusions
In this study, the technique of cavity expansion was applied to evaluate the mechanical
properties of PVA hydrogels; the results were compared with a conventional testing method
(unconfined compression test) to investigate the validity of the new technique. Additional
verification was conducted by creating an FEM for further investigation of the validity of the
new proposed technique. The outcome of this further investigation encouraged the expansion of
the study to apply the new technique on bovine liver tissues.
This chapter presents a discussion on the factors that affected the accuracy of the new
technique.
7. 1. Size of the Balloon
The balloon dimensions were 10mm in diameter and 0.2mm in thickness. These
dimensions limited the minimum applied cavity volume to 524mm3. In the case of PVA
hydrogel samples, the strains ranged from 16.6% to 65.56% for Sample 1 and from 13.47% to
46.77% for Sample 2. Therefore, the comparison of stiffness was conducted in the overlapping
range of strains using unconfined pressure test and spherical expansion. Although the
comparison showed promising outcomes, extending the stress-strain relationship line to the
region where smaller stresses and strains occur will provide more accurate results of stiffness.
Therefore, a smaller balloon can extend the stress-strain relationship to cover lower stress-strain
zones. An assumption was made that the balloon inflates spherically at volumes of 100ul, 200ul,

78
300ul, and 400ul; these volumes are less than the actual spherical shape of the inflated balloon
(524ul). The results are shown in Figures (7.1) & (7.2).
Fig (7.1) Stress-strain relationships of unconfined compression test and spherical expansion test. (A) PVA hydrogel,
Sample 1.

79
Fig (7.2) Stress-strain relationships of unconfined compression test and spherical expansion test. (B) PVA hydrogel,
Sample 2.
It is common in rubbery materials that their stiffness increases with stretching; therefore,
building a balloon that has the ability to extend from a very small volume to a large volume is
recommended to provide a wider range of stress-strain data.
7. 2. Incompressible Fluids
The compressibility of the injected fluid is one of the factors that affects the accuracy of
the new technique. This technique was first tried using air as the injected component into the soft
material. As shown in Figure (7.3), the 3ml of air that was injected into Sample 1 resulted in an
elliptic cavity expansion. This deformation caused an inaccurate calculation of volumetric strain.

80
Fig (7.3) Using air, top view of X-ray image for 3ml of air injected in PVA hydrogel (Sample 1).
In the balloon expansion technique, the soft materials were assumed to be linear, elastic,
isotropic materials. However, in reality they did not exhibit this behaviour. Therefore, injected
fluids will encounter different resistances from different directions within the soft materials. Air
is a gas with a bulk modulus around 1x10² KPa. As a gas, the distance between air individual
particles is relatively large. When air is injected, balloon expansion will encounter different
resistances; as more air is injected, the individual air particles will be compressed relative to the
resistance they encounter (a higher resistance will result in a higher deformation). Therefore, the
balloon deforms more at the point where it experiences higher resistance from the soft materials.
In this study, the alternative to air was water. Water, with a bulk modulus around 2 x 10⁶ KPa, is
commonly known as an incompressible fluid mainly because of the adjacent individual particles
of water.

81
7. 3. Balloon Stiffness Effect
In this study, the balloon effect starts to contribute to the stiffness of the material at
volumes greater than 524ul. Based on the experimental work (tensile testing and unconfined
compression testing), the liver tissue showed very soft behaviour when compared with the PVA
hydrogel samples. Unlike hydrogel testing, the balloon contribution was ignored in the analysis
of the liver tissue as no balloon stresses resulted at 524ul of injected water.
The balloon effect on the softer PVA hydrogel sample (Sample 1) was investigated. The
investigation plan was based on using the GE X-ray inspection system to check the average
diameter of the balloon at each applied volume of contrast agent. The average diameter was
estimated by taking the average of the largest diameters from the imaging outcome (side view,
front view, and top view). Unfortunately, when the epoxy that was used to a fix the balloon to
the needle and to seal the needle’s head was in continuous contact with the contrast agent during
the imaging, the epoxy slowly deteriorated, causing the contrast agent to leak within the hydrogel
sample. Although every effort was made to evaluate the balloon diameter where the balloon-
needle entity was perfectly sealed, some leakage occurred during the imaging process (average
duration 15 minutes) which affected the evaluated diameter (De).Table (7.1) shows applied
volumes, calculated diameters, and the evaluated diameters from the X-ray inspection system. It
is worth mentioning that the contrast agent was used for imaging only.

82
Table (7.1) Applied volume, diameter calculated from the theoretical sphere (𝐷𝑐), diameter evaluated from X-ray
images (𝐷𝑒). Applied volume
(ul)
Calculated diameter (𝑫𝒄)
(mm)
Evaluated diameter (𝑫𝒆)
(mm)
Ratio
(𝑫𝒄/ 𝑫𝒆)
Average
ratio.
524 10 6.92 1.445
1.315
824 11.631 9.32 1.248
1124 12.9 10.21 1.263
1424 13.959 10.7 1.304
To generalize the difference between the theoretical diameters (Dc) and the evaluated
diameters (De) from the available data, the average value of the ratio between calculated
diameters and evaluated diameters Dc and De was calculated and redistributed on all the data at
the observed volumes, and then generalized on all applied volumes of water, as shown in Table
(7.2).

83
Table (7.2) Re-evaluated balloon diameters at each applied volume of water.
Applied volume (ul) Strain (%) 𝑫𝒄 (mm) 𝑫𝒆′ (mm)
524 16.60 10.00 7.60
624 19.87 10.60 8.06
724 23.18 11.14 8.47
824 26.51 11.63 8.84
924 29.88 12.08 9.18
1024 33.29 12.50 9.51
1124 36.72 12.90 9.81
1224 40.20 13.27 10.09
1324 43.71 13.62 10.36
1424 47.26 13.95 10.61
1524 50.84 14.27 10.85
1624 54.46 14.58 11.09
1724 58.12 14.87 11.31
1824 61.82 15.16 11.52
1924 65.56 15.43 11.73
From Table (7.2), balloon diameters at strains of 20%, 25%, and 30% are less than
10mm.Therefore, the balloon effect was neglected in evaluating Young’s modulus of hydrogel
samples. Although the evaluation of the balloon effect was based on approximation (by studying
only limited actual balloon diameters) in the case of PVA hydrogels, considering the precise
balloon effect in data analysis will significantly increase the accuracy of obtained values of
Young’s modulus. If the precise diameter of the balloon is known while it acts inside the soft
material, balloon stiffness can be evaluated when it inflates to that certain diameter. By
84
eliminating balloon stiffness, the stiffness of soft materials can be precisely evaluated, especially
when large volumes of water are injected.
7. 4. Conclusions
The balloon expansion technique showed promising results in evaluating the stiffness of
different soft materials. Good agreement was found between this technique and conventional
techniques, as well as the verification with numerical analysis.
From this study, the following can be concluded:
1. The mathematical model used in the balloon technique provides simple and practical
evaluation of the strain that could not be observed during the test.
2. A direct comparison between the values of stiffness obtained from the spherical
expansion test and the unconfined compression test at the overlapping range of strains
resulted in congruence between the two techniques.
3. The use of the contrast agent indicated that fluids with high bulk moduli, such as water,
represent the best option to be used in the balloon expansion technique instead of air.
4. The range of strains used to evaluate the stiffness is controlled by controlling the size of
the balloon and the range of expansions provided by the test balloon.
5. The FEM model created to investigate the validity of the mathematical model used in the
balloon expansion technique showed good agreement in radial displacement values
obtained from both models.
6. Notwithstanding the limitation represented by the fixed size of the balloon which
constrained the stress-strain data of the liver sample, the value obtained from the new

85
technique showed promising results of bovine liver stiffness when compared with the
tensile stiffness of the liver.
7. 5. Recommendations
The following recommendations require further investigation as they are believed to increase
the accuracy of the balloon expansion technique:
1. Building a smaller balloon with softer material behaviour is believed to significantly
contribute to expanding the range of stress-strain relationship to lower strain values.
2. Although using distilled water in the balloon technique showed good results, using fluids
with higher bulk moduli such as seawater, glycerin, or sulfuric acid is believed to
enhance the accuracy of the balloon expansion technique. As these fluids could be
questionable in terms of safety, recommending their use is for investigation purposes
only.
3. Since soft materials are known to be non-homogeneous and anisotropic, developing the
mathematical model to consider the anisotropy of soft materials is believed to tangibly
improve the obtained results from the spherical expansion technique.
4. Nonlinear elastic properties can be calculated using a technique with different energy
functions.

86
References
1. Ahearne, M., Yang, Y., Haj, A., J., Then, K. Y, and Liu, K.-K. (2005). Characterizing the
viscoelastic properties of thin hydrogel-based constructs for tissue engineering
applications. Journal of the Royal Society Interface, 2, 455-463. doi:
10.1098/rsif.2005.0065.
2. Al Ja’afreh, T., Zweiri, Y., Seneviratne, L., and Althoefer, K. (2008). A new soft-tissue
indentation model for estimating circular indenter “force-displacement” characteristics.
Journal of Engineering in Medicine, Vol. 222, Part H, 805-815.
doi:10.1243/09544119JEIM319.
3. Al-Mayah, A. (2011). Soft tissues mechanical characterization using internal deformation.
Technology Disclosure, University of Waterloo.
4. Al-Mayah, A., Moseley, J., Velec, M., and Brock, K. (2009). Sliding characteristics and
material compressibility of human lung: Parametric Study and Verification. Medical
Physics, 36, 4625-4633. doi: 10.1118/1.3218761.
5. Al-Mayah, A., Moseley, J., Hunter, S., Velec, M., Chau, L., Breen, S., and Brock, K.
(2010). Biomechanical based deformable image registration of head and neck for
radiation therapy. Physics in Medicine and Biology, 55, 6491-6500.
6. Alteroritz, R., Pouliot, J., Taschereau, R., Hsu, I. C. J., and Goldberg, K. (2003).
Simulating needle insertion and radioactive and implantation for prostate brachytherapy.
Studies in Health Technology and Informatics, Vol. 94 19-25. doi10.3233/978-1-60750-
938-7-19.

87
7. Atalah, A., Lei, Y. and Du, X-C. (1997).The effect of pipe bursting on nearby utilities,
pavement, and structures. Technical Report, Trenchless Technology Center, Louisiana
Tech University.
8. Bader, D. L., and Bowker, P. (1983). Mechanical characteristics of skin and underlying
tissues in vivo. Biomaterials, Vol. 4, 305-308.
9. Behravesh, E., Timmer, M. D., Lemoine, J. J., Liebschner, M. K., and Mikos, A. G.
(2002). Evaluation of the in Vitro Degradation of Macroporous Hydrogels Using
gravimetry, confined compression testing, and microcomputed tomography.
Biomacromolecules. 3, pp: 1263 – 1270.
10. Baligh, M. M. (1985). Strain path method. Journal of Geotechnical Engineering, ASCE,
Vol. 111(9), 1108-1136.
11. Bichara, D. A., Bodugoz-sentruk, H., Ling, D., Malchau, E., Bragdon, C. R, and
Muratoglu, O. K. (2014). Osteochondral defect repair using a polyvinyl alcohol-
polyacrylic acid (PVA-PAAc) hydrogel. Biomedical Materials, 9, 7pp. doi:
10.1088/1748-6041/9/4/045012.
12. Bishop, R. F., Hill, R., and Mott, F. N. (1945). The theory of indentation and hardness
tests. The Proceedings of the Physical Society, Vol. 57, Part 3, 147-159.
13. Bharatha, A., Hirose, M., Hata, N., Warfield, S. K., Ferrant, M., Zou, K. H, Suarez-
Santana, E., Ruiz-Azola, J., Damico, A., Cormack, R. A., Kikinis, R., Jolez, F. A., and
Tempany, C. M. (2001). Evaluation of three-dimensional finite element- based
deformable registration pf pre- and intra operative prostate imaging. Medical Physics, 28,
2551-2560.

88
14. Borisov, A. V. (2010). Elastic analysis of multilayered thick-walled spheres under
external load. MECHANIKA. ISSN 1392-1207. Nr. 4(84).
15. Brammer, R.D., Bramhall, S.R., Mirza, D.F., Mayer, A.D., McMaster, P., Buckels, J.A.
(2002). A 10-year experience of complex liver trauma. British Journal of Surgery, 89,
1532–1537
16. Brett, P, Parker, T, Harrison, A, Thomas, T, and Carr, A. (1997). Simulation of resistance
forces acting on surgical needles. Proc. Inst. Mech. Eng., Vol. 221, pp. 335-347.
17. Brown, J. D., Rosen, J., Kim, Y.S., Chang, L., Sinanan, M., Hannaford, B. (2003). In
vivo and in situ compressive properties of porcine abdominal soft tissues. Med. Meets
Virtual Reality 11.
18. Brunon. A., Bruyere-Garnier. K., and Coret. M. (2010). Mechanical characterization of
liver capsule through uniaxial quasi-static tensile tests until failure. Journal of
Biomechanics. 43, PP: 2221-2227.
19. Carson, W. C., Gerling, G. J., Krupski, T. L., Kowalik, C. G., Harper, J. C., and
Moskaluk, C. A. (2011). Material characterization of ex-vivo prostate tissue via spherical
indentation in the clinic. Medical Engineering and Physics, Vol. 33, 302-309.
doi:10.1016/j.medengphy.2010.10.013.
20. Carew, T. E., Vaishnav, R. N., and Patel, D. J. (1968). Compressibility of arterial wall.
Circulation Research, 23, 61- 68.
21. Carlstedt, A. C., and Nordin, M. (1989). Biomechanics of tendons and ligaments in:
Basic biomechanics of the musculoskeletal system. Eds: Nordin, M., and Frankel, H. V.
2nd
edition, Philadelphia: Lea and Febiger, 59-74.

89
22. Cha. W.I., Hyon. S.H., and Ikada. Y. (1993). Microstructures of poly(vinyl alcohol)
hydrogels investigated with differential scanning calorimetry, Makromol. Chem., 194,
2433-2441.
23. Chadwick, P. (1959). The quasi-static expansion of a spherical cavity in metals and ideal
soils. Q J Mech Appl, Vol. 12, No. 1, 52-71.
24. Chu, K.C., Rutt, B.K., (1997). Polyvinyl alcohol cryogel: an ideal phantom material for
MR studies of arterial flow and elasticity. Magn. Reson. Med. 37, 314–319.
25. Cota. S. S., Vasconcelos. V., Senne Jr. M., Carvalho. L. L., Rezende. D. B., and R.
F. Côrrea. (2007). CHANGES IN MECHANICAL PROPERTIES DUE TO GAMMA
irradiation of high-density polyethylene (HDPE). Brazilian Journal of Chemical
Engineering, Vol. 24, NO. 2, 259-265.
26. Cohen, B. Lai, W. M., and Mow, V. C. (1998). A transversely isotropic biphasic model
for unconfined compression of growth plate and chondroepiphysis. Journal of
Biomedical Engineering, Vol. 120, 491-496.
27. Coung, C. J., and Fung, Y. C. (1984). Compressibility and constitutive equation of
arterial wall in radial compression experiment. Journal of Biomechanics. 17, 35 - 40.
28. DiMaio, S. P., and Salcudaean, S. E. (2005). Interactive simulation of needle insertion
models. IEEE Transaction on Bio-medical Engineering, 52, 1167-1179.
29. Elhagediab A., Rouhana S. (1998). Patterns of abdominal injury in frontal automotive
crashes. In: Proceedings of the 16th International Technical Conference on the Enhanced
Safety of Vehicles, Windsor, Ontario, Canada.
30. Ehgrott, L. Q. (1971). Calculation of stress and strain from triaxial test data on undrained
soil specimen. National Technical Information Service. Miscellaneous Paper S-71-9.
90
31. Fernando, D. and Moore, I. A. (2002). Use of cavity expansion theory to predict ground
displacement during pipe bursting. American Society of Civil Engineers, Pipeline
Division. Specialty Conference. Cleveland, Ohio.
32. Forrestal, M. J. (1985). Penetration into dry porous rock. Int J Solids Struct. Vol. 22,
No.12, 1485-1500.
33. Fung, Y. C. (1993). Biomechanical properties of living tissues. Springer Verlag New
York, 2nd
edition.
34. Gao, L., Parker. K. J., Lemer, R. M., and Levinson. S. F. (1996). Imaging of the elastic
properties of tissue - A review. Ultrasound in Medicine and Biology. Vol. 22, 8, PP:
959-977.
35. Gefen, A., and Margulies, S. S. (2004). Are in-vivo and in-situ brain tissues mechanically
similar? Journal of Biomechanics, Vol. 37, 1339-1353.
doi:10.1016/j.jbiomech.2003.12.032.
36. Gebben. B., Van der Berg. W. A., Baregman. D., and Smolder. C. A. (1985).
Intramolecular crosslinking of poly(vinyl alcohol). POLYMER, Vol. 26, (1737-1740).
37. Gennisson, J. L., Deffieux, T., Fink, M., and Tanter, M. (2013). Ultrasound elastography:
Principles and techniques. Diagnostic and Interventional Imaging, Vol. 94, 487-495.
38. Gimenez. V., Mantecon. A., and Cadiz. V. (1996). Crosslinking of poly(vinyl alcohol)
using dianhydrides as hardeners. Journal of Applied Polymer Science, Vol.59, 425-431.
DOI: 10.1002/(SICI)1097-4628(19960118)59:3.
39. Glozman. T., Azhari. H. (2010). A method of characterization of tissue elastic properties
combining ultrasonic computed tomography with elastography. Journal of Ultrasound in
Medicine. 29, PP: 387- 398.

91
40. Gokesl, O., Salcudean, S. E., and DiMaio, S. P. (2006). 3D simulation of needle tissue
interaction with application to prostate brachytherapy. Journal of Image Guided Surgery,
11, 279-288.
41. Gupta. S., Goswami. S., and Sinha. A. (2012). A combined effect of freeze-thaw cycles
and polymer concentration on the structure and mechanical properties of transparent PVA
gels. Biomedical Materials, 7, 8pp. doi: 10.1088/1748-6041/7/1/015006.
42. Hajji, M. A., Wilson, T. A., and Lai-Fook, S. J. (1979). Improved measurements of shear
modulus and pleural membrane tension of the lung. Journal of Applied physiology, 47,
175-181.
43. Hasegawa, M., and Azuma, T. (1974). Wall structure and static viscoelasticities of large
veins. J. Jap. Collagen Angiol, 14, 87-92.
44. Hassan. C. M., and Peppas. N. A., (2000). Structure and applications of poly(vinyl
alcohol) hydrogels produced by conventional crosslinking or by freezing/thawing
methods. Advances in Ploymer science, Vol. 153, 38-60.
45. Hayes, W. C., Keer, L. M., Herrmann, G., and Mockros, L. F. (1972). A mathematical
analysis for indentation tests of articular cartilage. Journal of Biomechanics, Vol. 5, 541-
551.
46. Hing, J., Brooks, A., and Desai, J. (2007). A biplanar fluoroscopic approach for the
measurement, modeling, and simulation of needle and soft-tissue interaction. Med. Image
Anal., Vol. 11, No.1, 62-78.
47. Holzapfel, A. G. (2000). Biomechanics of soft tissue. Handbook of Material Behaviour.
Springer Wein New York, 3-4.
92
48. Holzapfel, A. G., and Ogden, W. R., (2003). Biomechanics of soft tissue in
cardiovascular systems. Springer Wein New York, 2, 15-21.
49. Huang. R. Y. M., and Rhim. J. W. (1993). Modification of poly(vinyl alcohol) using
maleic acid and its application to the separation of acetic acid-water mixtures by the
pervaporation technique. Polymer International, Vol. 30, 129-135.
DOI: 10.1002/pi.4990300119.
50. Hunter, S. C., Crozier, R. (1968). Similarity solution for the rapid uniform expansion of a
spherical cavity in a compressible elastic-plastic solid. Q J Mech Appl Math, Vol. 21,
No.4, 467- 486.
51. Image of Pipe Bursting Operation Layout. Retrieved May 8, 2015,
www.plasticpipe.org/publications.
52. Jiang, H., Campbell, G., Boughner, D., Wan, W.K., Quantz, M., (2004). Design and
manufacture of a polyvinyl alcohol (PVA) cryogel tri-leaflet heart valve prosthesis. Med.
Eng. Phys. 26, 269–277.
53. Jurvelin, J. S., Buschmann, M. D., and Hunziker, E. B. (1996). Mechanical anisotropy of
human knee articular cartilage in compression. Journal of Engineering in Medicine, Vol.
217, No. 3, 215-219. doi: 10.1243/095441103765212712.
54. Kahlon. A., Hurting. M. B., and Gordon. K. D. (2014). Regional and depth variability of
porcine meniscal mechanical properties through biaxial testing. Journal of the
Mechanical Behaviour of Biomedical Materials. 41, 808-114.
55. Kalanovic, D., Ottensmeyer, M.P., Gross, J., Gerhardt B., Dawson, S.I. (2003).
Independent testing of soft tissue viscoelasticity using indention and rotary shear
deformation. Med. Meets Virtual Reality, 11
93
56. Kemper. A. R., Santago. A. C., Stitzel. J. D., Sparks. J.L., and Duma. S. M. (2010).
Biomechanical response of human liver in tensile loading. Ann Adv Automot Med. 54, PP:
15-26.
57. Kenawy. R., Kamoun. B. A., Mohy Eldin. M. S., and El-Meligy. M. A. (2013).
Physically crosslinked poly(vinyl alcohol)- hydroxyethyl starch blend hydrogel
membranes: Synthesis and characterization for biomedical applications. Arabian Journal
of Chemistry, 7, 372-380.
58. Kerdok, A. E., Ottensmeyer, M. P., and Howe, R. D. (2006). Effects of perfusion on the
viscoelastic characteristics of liver. Journal of Biomechanics, Vol. 39, 2221-2231.
doi:10.1016/j.jbiomech.2005.07.005.
59. Knudson, D. (2006). The biomechanics of stretching. Journal of Exercise Science and
Physiotherapy, Vol. 2, 3-12.
60. Korhonen, K. R., Toyras, J., Nieminen, T. M., Reippo, J., Hirvonen, J., Helminen, J. H.,
and Jurvelin, S. J. (2001). Effect of ionic environment on the compression-tension
nonlinearity of articular cartilage in the direction perpendicular to articular surface. 47th
Annual Meeting, Orthopaedic Research Society, 439.
61. Korhonen, K. R., Laasanen, S. M., Töyräs, J., Rieppo, J., Hirvonen, J., Helminen, J. H.,
and Jurvelin, S. J. (2002). Comparison of the equilibrium response of articular cartilage
in unconfined compression, confined compression and indentation. Journal of
Biomechanics, 35, 903-909.
62. Krol, A., Ünlü, M. Z., and Baum, K. G. (2006). MRI/PET non rigid breast-image
registration using skin fiducial markers. Physica Medica 21, 39-43.

94
63. Kumeta, K., Nagashima, I., Matsui. S., Mizoguchi, K. (2003). Crosslinking Reaction of
Poly(vinyl alcohol) with Poly(acrylic acid) (PAA) by Heat Treatment: Effect of
Neutralization of PAA. Journal of Applied Polymer Science, Vol. 90, 2420–2427.
64. Kuhn, W., and Balmer, G. (1969). Crosslinking of single linear macromolccules. J.
Polymer Sci, 57, 311.
65. Lai, W.M., Hou, J.S., and Mow, V.C. (1991). A triphasic theory for the swelling and
deformation behaviour of articular cartilage. Journal of Biomedical Engineering, Vol.
113, 245-258.
66. Lee, S.-Y., Pereira, B.P., Yousof, N., Selvaratnam L., Yu, Z., Abbas, A.A, Kamarul, T.
2009. Unconfined compression properties of a porous poly(vinyl alcohol)–chitosan-based
hydrogel after hydration. Acta Biomaterialia. 5, 1919-1925.
67. Li, L.P., Soulhat, J., Buschmann, M.D., and Shirazi-Adl, A. (1999). Nonlinear analysis of
cartilage in unconfined ramp compression using a fibril reinforced poroelastic model.
Clinical Biomechanics, Vol. 14, 673-682.
68. Liu, K.K. & Ju, B.F. (2001). A novel technique for mechanical characterization of thin
elastomeric membrane. J. Phys. D Appl. Phys. 34, L91–L94. doi:10.1088/0022-3727/34/
15/102.
69. Liu, L., Jia, Z., Ma, X., Fan, Y., Li, W., and Liu, H. (2013). A spherical cavity expansion
model of large deformation and its application to ballistic gelatin penetration problems.
International Journal of Impact Engineering, 71(2014), 106-116.
70. Liu, Y. (2010). Composite hydrogel - nanofibre vessels for vascular graft applications.
PhD thesis, Dublin City University.

95
71. Lu, Y.C., Kemper. A. R., Untatoiu. C. D. 2014. Effect of storage on tensile material
properties of bovine liver. Journal of the Mechanical Behaviour of biomedical Materials.
29, PP: 339-349.
72. Luk, V. K., Forrestal, M. J, Amos, D. E. (1991). Dynamic spherical cavity expansion of
strain hardening materials. J Appl Mech, Vol. 58.
73. Mahvash, M, Dupont, P. E. (2010). Mechanics of Dynamic Needle Insertion into a
Biological Material. IEEE TRANSACTIONS ON BIOMEDICAL ENGINEERING, VOL.
57, NO. 4, 934-943.
74. Mak, A. F. (1986). Unconfined compression of hydrated viscoelastic tissues: a biphasic
poroviscoelastic analysis. Biorheology, 23, 371-383.
75. Mak, A. F., Liu, G. H., and Lee, S. Y. (1994). Biomechanical assessment of below-knee
residual limb tissue. J. Rehabil. Res. Dev, Vol. 31, No. 3, 188-198.
76. Manandhar, S. and YAsufuku, N. (2012). Analytical model for the end-bearing capacity
of tapered piles using cavity expansion theory. Advances in Civil Engineering, Vol 2012.
doi: 10.1155/2012/749540.
77. Marechal, E. (1989). Comprehensive polymer science. Chemical modification of
synthetic polymers, Vol. 6, Chap1. Oxford: Pergamon Press.
78. Mariappan, Y. K., Glaser, K. J., and Ehman, R. L. (2010). Magnetic resonance
elastography: A review. Clinical Anatomy, Vol. 23, No. 5, 497-511.
doi: 10.1002/ca.21006.
96
79. McAnearney, S., Fedorov, A., Joldes, G., Hata, N., Tampany,C., Miller, K., and Wittek,
A. (2010). The effect of young’s modulus on predicting prostate deformation for MRI-
guided interventions. Computational Biomechanics for Medicine, part 1, 39-49. doi
10.1007/978-1-4419-9619-0-5.
80. Miller, K. (2005). Method of testing very soft biological tissues in compression. Journal
of Biomechanics, Vol. 38, 153-158. doi:10.1016/j.jbiomech.2004.03.004.
81. Millon, L. E., MOhammadi, H., and Wan, W. K. (2006). Anisotropic Polyvinyl Alcohol
Hydrogel for Cardiovascular Applications. Mater Res Part B: Appl Biomater 79B, 305-
311. doi: 10.1002/jbm.b.30543
82. Minns, J. R., Soden, D. P., and Jackson, S. D. (1973). The role of the fibrous components
and ground substance in the mechanical properties of biological tissues: A preliminary
investigation. Journal of Biomechanics, Vol. 6, 153-165.
83. Mishra, S., Bajpai, R., Katare, R., and Bajpai, A. K. (2007). Radiation induced
crosslinking effect on semi-interpenetrating polymer networks of poly(vinyl alcohol).
eXPRESS Polymer Letters, Vol. 1, No.7, (407-415).
DOI:10.3144/expresspolymlett.2007.58.
84. Mow, V. C., Kuei, S. C., W, M. Lai., and Armstrong, C. G. (1980). Biphasic creep and
stress relaxation of articular cartilage in compression: theory and experiments. Journal of
Biomedical Engineering, Vol. 102, 73-84.
85. Mow, V. C., Gibbs, M. C., Lai, W. M., Zhu, W. B., and Athanasiou, K. A. (1989).
Biphasic indentation of articular cartilage. Part II: a numerical algorithm and an
experimental study. Journal of Biomechanics, Vol 22, 853-861. doi:10.1016/0021-
9290(89)90069-9.
97
86. Nava, A., Mazza, E., Kleinermann, F., Avis, N.J., McClure J., Bajka, M. (2004).
Evaluation of the mechanical properties of human liver and kidney through aspiration
experiments. Technol. Health Care, 12, 269-280
87. Nava, A., Mazza, E., Häfner, O., Bajka, M. (2004). Experimental observation and
modelling of preconditioning in soft biological tissues. Lecture Notes in Computer
Science vol. 3078, PP: 1- 8.
88. Nikolic, V. M., Krkljes, A., Popovic, Z. K., Lausevic. Z. V., and Miljanic, S. S. (2007).
On the use of gamma irradiation crosslinked PVA membranes in hydrogen fuel cells.
Electrochemistry Communications, 9, (2661–2665). doi:10.1016/j.elecom.2007.08.022.
89. Oestreicher, L. H. (1951). Field and impedance of an oscillating share in a viscoelastic
medium with an application to biophysics. J Acoust Soc Am, 23, 707-714.
90. O’Rourke, T. (1985). Ground movements caused by trenchless construction,
Proceedings. 1st International Conference on Trenchless Construction for Utilities, No-
Dig 85, London, U.K.
91. Ottensmeyers, M. P., Kerdok, A. E., Howe, R. D., Dawson, S. L. (2004). The effect of
testing environment on viscoelastic properties of soft tissues. Proceedings of Second
International Symposium on Medical Simulation. Lecture Notes in Computer Science,
Vol. 3078, Springer-Verlag, PP. 9-18.
92. Paradossi, G., Cavalieri, F., Chiessi, E., Spagnoli, C., Cowan, M.K., (2003). Poly(vinyl
alcohol) as versatile biomaterial for potential biomedical applications. J. Mater.
Sci.Mater. Med. 14, 687–691.
93. Parson, J. R., and Black, J. (1977). The viscoelastic shear behaviour of normal rabbit
articular cartilage. Journal of Biomechanics, Vol.10, 21-29.

98
94. Peppas, N. A. (1975). Turbidimetric studies of aqueous poly(vinyl alcohol) solutions. Die
Makromoleculare Chemie, 176, (3433-3440).
95. Ratner, B. D., Hoffman, A. S., Schoen, F. J., and Lemons, J. E. (2013). Biomaterials
science: An introduction to materials in medicine. 3rd
edition, Elsevier, pp (166-178).
96. Reynolds, D., and Lord, M. (1992). Interface load analysis for computer-aided design of
below-knee prosthetic sockets. Med. Boil. Eng. Comput, 1, 89-96.
97. Roan. E., and Vemaganti. K. (2007). The nonlinear material properties of liver tissue
determined from no-slip uniaxial compression experiment. ASME. Vol 129, PP: 450-456.
98. Roth, V., and Mow, V. C. (1980). The intrinsic tensile behaviour of the matrix of bovine
articular cartilage and its variation with age. The Journal of Bone Joint Surgery, 62,
1102-1117.
99. Ruiter, N. V., Stotzka, R., Muller, T. O., and Gemmeke, H. (2004). Model-based
registration of X-ray mammograms and MR images of female breast. IEEE Nuclear
Science Symposium Conference Record 5, 3290-3294.
100. Russell, A.R., and Khalili, N. (2006). Cavity expansion theory and the cone penetration
test in unsaturated sands. ASCE, 2456 - 2557.
101. Salmawi, K. M. (2010). Gamma Radiation‐Induced Crosslinked PVA/Chitosan
Blends for Wound Dressing. Journal of Macromolecular Science, Part A: Pure
and Applied Chemistry, 44:5, (541-545). DOI: 10.1080/10601320701235891.
102. Samani, A., Bishop, J., Piewes, D, B., Yaffe, M. J. (2001). Biomechanical 3-D finite
element modeling of human breast using MRI data. IEEE Transaction on Medical
Imaging, Vol 20, 271-279.

99
103. Samani, A., and Plewes, D. B. (2004). A method to measure the hyperplastic parameters
of ex-vivo breast tissue samples. Physics in Medicine and Biology, Vol. 49, 4395-4405.
104. Sarvazyan, A., Skovorod, A. R., Emelianov, S., and Fowlkes, J. B. (1995). Biophysical
bases of elasticity imaging. Acoust Imag, Vol. 21, 223-241.
105. Satapathy, S. and Bless, S. (1995). Cavity expansion analysis of brittle materials. Texas
University at Austin Institution for Advanced Technology.
106. Satapathy, S. (1997). Application of cavity expansion analysis to penetration problems.
Texas University at Austin Institution for Advanced Technology.
107. Shigley, J. E, Mischke, C. R. (1989). Mechanical Engineering Design. McGrew Hill. 5th
edition, p59.
108. Sokoloff, L. (1966). Elasticity of articular cartilage. Fed. Proc. Am. Soc. Exp. Biol. Vol.
25, 1089-1095.
109. Soltz, M. A., and Ateshian, G. A. (2000). A conewise linear elasticity mixture model for
the analysis of tension-compression nonlinearity in articular cartilage. Journal of
Biomedical Engineering, Vol. 122, 576-586.
110. Soulhat, J., Buschmann, M. D., and Shirazi-Adl, A. (1999). A fibril-network-reinforced
biphasic model of cartilage in unconfined compression. Journal of Biomedical
Engineering, Vol. 121, 340-347.
111. Tanaka, E., and Eijden, V. T. (2003). Biomechanical behavior of the
temporomandibular joint disc. Crit Rev Oral Biol Med, 14, 138-150.
112. Taper, L. A. (1984). Large deformation mechanics of enucleated eyeball. Journal of
Biomechanics, Vol. 106, 229 - 234. doi:10.1115/1.3138487.
100
113. Tong, P., and Fung, C. Y. (1976). The stress-strain relationship for the skin. Journal of
Biomechanics, 9, 649-657.
114. Vannah, W. M., and Childress, D. S. (1996). Indenter tests and finite element modeling
of bulk muscular tissue in-vivo. J. Rehabil. Res. Dev. Vol. 33, No. 3, 239-252.
115. Viidik, A. (1966). Biomechanics and functional adaptation of tendons and joint
ligaments In: Studies on the anatomy and function of bone and joint. Springer-Verlag
Berlin New York, 17- 39.
116. Vijayasekaran, S., Fitton, J.H., Hicks, C.R., Chirila, T.V., Crawford, G.J., Constable, I.J.
(1998). Cell viability and inflammatory response in hydrogel sponges implanted in the
rabbit cornea. Biomaterials, 19, 2255–2267.
117. Wan, W. K., Campbell, G., Zhang, Z. F., Hui, A. J., and Boughner, D. R. (2002).
Optimizing the Tensile Properties of Polyvinyl Alcohol Hydrogel for the Construction
of a Bioprosthetic Heart Valve Stent. J Biomed Mater Res (Appl biomater), 63, 854-861.
118. Werner, R., Ehrhardt, J., Schmidt, R., and Handels, H. (2009). Patient-specific finite
element modeling of respiratory lung motion using 4D CT image data. Medical Physics,
36, 1500-1511. doi: 10.1118/1.3101820.
119. W. L. Gore & Associates, Inc. (2011). Vascular grafting. Retrieved November, 22, 2015
from http://www.goremedical.com/eu/hybrid.
120. Woo, S. L., Lubock, P., Gomez, M. A., Jemott, G. F., Kuei, S. C., and Akeson, W. H.
(1978). Large deformation nonhomogeneous and directional properties of articular
cartilage. Journal of Biomechanics, 12, 437- 446.

101
121. Wu, Q., Liang, J., and Yan, D. (2006). Application of dose compensation in image-
guided radiotherapy of prostate cancer. Physics in Medicine and Biology, 51, 1405-1419.
doi:10.1088/0031-9155/51/6/003.
122. Yamamoto, E., Hayashi, K., and Yamamoto, N. (1999). Mechanical properties of
collagen fascicles from the rabbit patellar tendon. Clinical Biomechanics, 14. 418 - 425.
123. Yan, D., Jaffray, D. A., and Wang, J. W. (1999). A model to accumulate fractionated
dose in a deforming organ. International Journal of Radiation Oncology Biology Physics,
Vol 44, 65-75.
124. Yasufuku, N., and Hyde, A. F. L. (1995). Pile end-bearing capacity in crushable sands.
Geotechnique, vol. 45(4), 663–676.
125. Yasufuku, N., Ochiai. H., and Ohno, S. (2001). Pile end-bearing capacity of sand related
to soil compressibility. Soils and Foundations, vol. 41(4), 59–71.
126. Yoshii. F., Zhanshan, Y., Isobe. K., Shinozaki, K., Makuuchi, K. (1998). Electron beam
crosslinked PEO and PEO/PVA hydrogels for wound dressing. Radiation Physics and
Chemistry, 55, 133-138.
127. Yu, H.S and Houlsby, G.T. (1991).Finite cavity expansion in dilatant soils: loading
analysis. Geotechnique, Vol. 41, 173-183.
128. Yu, H. S., and Mitchell, J. K. (1998). Analysis of cone resistance: review of methods.
Journal Geotechnical and Environmental Engineering. ASCE, Vol 124, 140 -149.
129. Yu, H.S. (2000). Cavity expansion methods in geomechanics. Kluwer Academic
Publisher. London, UK.
102
130. Zhang, T., Orton, N.P., Mackie, T. R., and Paliwal, B.R. (2004). Technical note: A
novel boundary condition using contact elements for finite element based deformable
image registration. Medical Physics, 631, 2412-2415. doi: 10.1118/1.1774131.
131. Zhang, Y., Qiu, Y., Goldgof, D., Sarkar, S., and Li, L. (2007). 3D finite element
modeling of non-rigid breast deformation for feature registration on X-ray and MR
images. IEEE workshop on application of computer vision.
132. Zhen, M., Jiang, Z., Sonf, D., and Liu, F. (2013). Analytical solutions for finite
cylindrical dynamic cavity expansion in compressible elastic-plastic materials. Applied
Mathematics and Mechanics, Vol. 35, No.8, 1039-1050. doi: 10.1007/s10483-014-18427.
Related Documents


