EUEI-PDF Review of Experiences with Rural Electrification Agencies Lessons for Africa Draft August 24, 2008 Wolfgang Mostert

Welcome message from author
This document is posted to help you gain knowledge. Please leave a comment to let me know what you think about it! Share it to your friends and learn new things together.
Transcript

EUEI-PDF
Review of Experiences with Rural Electrification Agencies Lessons for Africa
Draft August 24, 2008
Wolfgang Mostert

2
Glossary, Abbreviations and Definitions .........................................................................................5 Acknowledgements..........................................................................................................................8 Executive Summary: Key Conclusions............................................................................................9
1 INTRODUCTION .....................................................................................................................15 1.1 Rural Electrification Agencies as Stepchildren of Power Sector Reforms........................15
1.1.1 Objectives for Power Sector Restructuring and Privatisation....................................15 1.1.2 The concept of non-commercial rural electrification concessions.............................16 1.1.3 “Decentralised” versus “centralised” rural electrification approaches ......................17
1.2 Early Stage and End-Phase Rural Electrification ..............................................................18 1.3 Structure of Report.............................................................................................................19
1.3.1 Classification of reviewed countries and division into chapters................................19 1.3.2 Details found in Annexes...........................................................................................19 1.3.3 Key success factors for RE: the “Rural Electrification Diamond” ............................20
2 REVIEW OF CENTRALISED RURAL ELECTRIFICATION...............................................23 2.1 Innovations in Centralised Rural Electrification................................................................23 2.2 Examples of Early Stage Centralised Rural Electrification: Côte d’Ivoire and Ghana .....24
2.2.1 Côte d’Ivoire ..............................................................................................................24 2.2.2 Ghana .........................................................................................................................26 2.2.3 Results of centralised re in Mozambique – a short note ............................................29
2.3 End-Phase Rural Electrification: Morocco and Guatemala ...............................................31 2.3.1 Morocco: on-and off- grid electrification by national power company.....................31 2.3.2 Guatemala: rural electrification by a private power company...................................32
2.4 Comparison: Rural Electrification Diamonds under Centralised Electrification...............35 3 DECENTRALISED RURAL ELECTRIFICATION DURING EARLY INCREMENTAL ELECTRIFICATION PHASE...........................................................................................................37
3.1 Institutional and Regulatory Support Structures for Decentralised Rural Electrification .37 3.1.1 Power sector structure and role of REA/REF ............................................................37 3.1.2 Organisation of REA/REF and costs of operation .....................................................43 3.1.3 Rural electrification planning and project selection ..................................................46 3.1.4 Regulation of decentralised rural electrification concessions....................................51 3.1.5 Subsidy policy for support to electrification projects ................................................55 3.1.6 Instruments for regional equity ..................................................................................57 3.1.7 Support by REA/REF to energy services other than electricity.................................57 3.1.8 Involvement of co-financing donors in program management ..................................58
3.2 Support to the Technical Supply Side................................................................................59 3.3 Project Finance for De-centralised Rural Electrification...................................................61
3.3.1 Sources of Finance for REA/REFs ............................................................................61 3.3.2 Composition of project finance..................................................................................62 3.3.3 Tariffs.........................................................................................................................65
3.4 Organisation of Electricity Supply in De-Centralised Electrification ...............................67 3.4.1 Grid based electrification: on-main-grid and off-main-grid ......................................67 3.4.2 Supply of solar PV-systems .......................................................................................69
3.5 Results................................................................................................................................71 3.5.1 Number of projects, connection rates and installed RET-capacity............................71 3.5.2 Capacity building and costs .......................................................................................74 3.5.3 Cost of Investment and cost of subsidies per customer .............................................74 3.5.4 Cost effectiveness of decentralised rural electrification ............................................75

3
3.6 Comparison: Rural Electrification Diamonds in De-Centralised Electrification...............76 4 DECENTRALISED END-PHASE RURAL ELECTRIFICATION: CHILE’S PER ...............78 ANNEX I: CASE STUDIES OF RURAL ELECTRIFICATION EXPERIENCES .........................80
I.1 Burkina Faso: Community Asset Ownership with outsourced Management & Operation..80 I.2 Ethiopia REF: Loan-financed investment Subsidies and Village Electricity Cooperatives.99 I.3 Guinea’s BERD: the low-cost Champion...........................................................................114 I.4 Mali: Combining Rural Electrification & Household Energy, Small & Large Concessions..................................................................................................................................................126 I.5 Nepal: Successful Promotion of Renewable Energy for Decentralised Electricity Service..................................................................................................................................................138 I.6 Guatemala: Rural Electrification Financed by State and Implemented by Private Utility.164 I.7 Côte d’Ivoire: The basic Infrastructure Approach to RE....................................................172
ANNEX II: LITTERATURE LIST .................................................................................................178 Table 1: Basic Electrification Statistics about Countries included in this Study...............................18 Table 2: Grouping of reviewed countries by major category ............................................................19 Table 3: Côte d’Ivoire Basic Data......................................................................................................24 Table 4: Ghana Basic Data.................................................................................................................26 Table 5: Mozambique Basic Data......................................................................................................29 Table 6: Morocco Basic Data.............................................................................................................31 Table 7: Guatemala Basic Data..........................................................................................................32 Table 8: Energy Services supported by REA/REF by Country.........................................................37 Table 9: Involvement of state and private actors in the national power system ................................38 Table 10: Legal status of REA/REFs.................................................................................................43 Table 11: Number of Staff in REA/REFs ..........................................................................................44 Table 12: FUNAE Costs of Operation in % of total FUNAE Budget, 2002-2006............................46 Table 13: Modalities for project identification ..................................................................................48 Table 14: Agents involved in identification of decentralized power projects ...................................49 Table 15: Modalities for award of projects ........................................................................................50 Table 16: Institutions involved in Regulation of Decentralized Electrification Projects ..................51 Table 17: Light handed regulation – exemptions for authorizations and concessions ......................52 Table 18: Subsidy instruments provided by REA/REFs....................................................................55 Table 19: Type of support provided by REA/REFs to technical supply side ....................................59 Table 20: Sources of finance for REA/REFs .....................................................................................61 Table 21: Composition of Project Finance for REA/REF supported projects...................................62 Table 22: Financial instruments provided by REA/REFs..................................................................65 Table 23: Tariff structures and levels early 2007 in Euro..................................................................65 Table 24: Organisation of Decentralised Electricity Supply – Legal and Institutional Solutions .....67 Table 25: Projects under implementation or with applications being processed, end-2007..............71 Table 26: Number of grid electrification projects, investment volume and connections, end 2007 .72 Table 27: Connection rates and payment default rates in projects supported by REA/REFs............73 Table 28: Installed Solar PV-Systems, end 2007...............................................................................73 Table 29: Installed generation capacity using renewable energy, end 2007......................................73 Table 30: Costs of REA/REF Operation, of capacity building TA and of RE-Investments, €million............................................................................................................................................................74 Table 31: Training of consultants, installers and operators, 1999 to 2007 ........................................74 Table 32: Cost of investment in € per serviced customer, excluding indirect subsidies, prices early 2007 in €.............................................................................................................................................75

4
Table 33: Chile Basic Data ................................................................................................................78 Table 34: Burkina Faso, investment strategy.....................................................................................83 Table 35: Burkina Faso Investment 2007-2032 by Type of Region..................................................84 Table 36: Burkina Faso Investment 2007-2032 by Type of Technology ..........................................84 Table 37: Burkina Faso FDE Subsidy Levels and Level of Soft Loan Finance in % of Total Cost..90 Table 38: Burkina Faso Subsidies to Urban and to Rural Electricity Consumers .............................90 Table 39: Use of DGE and FDE Funds for operating costs, TA and investments, 1999-2007 .........96 Table 40: Decentralised RE Projects finished or in active Preparation Early 2007 ..........................96 Table 41: Ethiopia Estimated Breakdown of REF Budget for 2005-2011 Period...........................102 Table 42: Ethiopia EEPCO and REF fees and connection rates......................................................105 Table 43: Ethiopia DBE/REF Loans Terms and Conditions ...........................................................105 Table 44: Guinea BERD Evolution in Applications for Concessions .............................................122 Table 45: Suggested ERD Investment Program 2006-2008 ............................................................124 Table 46: Cost of FERD-Finance and Cost of BERD-Assistance per expected serviced Customer..........................................................................................................................................................125 Table 47: Nepal Costs of Rural Electrification................................................................................144 Table 48: Rural Electrification Investments in Nepal 2000 – mid 2007 .........................................162 Table 49: Basic Statistics Côte d’Ivoire, 1997.................................................................................172 Table 50: Côte d’Ivoire Urban and Rural Electrification Rates, 1998.............................................176 Chart 1: Mozambique, EDM, New Connections per Year 2001 to 2006 ..........................................29 Chart 2: Electrification Rates in Mozambique by Province ..............................................................30

5
Glossary, Abbreviations and Definitions Country abbreviations:
BF Burkina Faso CI Côte d’Ivoire ET Ethiopia GH Ghana GN Guinea GT Guatemala MA Morocco ML Mali MZ Mozambique NP Nepal UG Uganda
Other abbreviations AEPC Alternative Energy Promotion Centre (NP) AfDB African Development Bank AMADER Malian Agency for the Development or Rural Energy ASER Senegalese Agency for Rural Electrification BERD Unit for Decentralised RE (Bureau d'Electrification Rurale Décentralisée – GN)) CIE Compagnie Ivoirienne d’Electricité (CI) DANIDA Danish International Development Assistance DGE Energy Department of MEM in Burkina Faso (Direction Générale de l’Energie) EdM Mozambique Power Company EDM Mali Power Company (Société Energie du Mali) EECI Energie Electrique de la Côte d’Ivoire (CI) ERD Decentralised Rural Electrification (Electrification Rurale Décentralisé – BF, GN) EEPCo Ethiopian Electric Power Corporation EREDPC Ethiopia Rural Energy Development and Promotion Center FDE Rural Electrification Fund (Fonds de Développement de l’Electrification – BF) FERD Fund for Decentralized Rural Electrification (BF, GN) GIS Geographic Information System HIPC Highly Indebted Poor Countries IDA International Development Agency IFC International Finance Agency INGO International Non Governmental Organisation KfW Kreditanstalt für Wiederaufbau FRAR Fonds Régionals d’Aménagement Rural (CI) FUNAE National Energy Fund (MZ) LIREP Locally Initiated Rural Electrification Project (UG) MEM Ministry of Energy and Mines (Ministère de l’Energie et des Mines, BF) MEMD Ministry of Energy and Mineral Development (UG) MENA Middle East & North Africa MIREME Ministry of Mineral Resources and Energy (MZ) MME Ministry of Mines and Energy (ET, GH) NEA National Electricity Authority (ET)

6
OBA Output based Aid PER Rural Electrification Program (Program Electrification Rural, GT) PERG Guinea Rural Electrification Program PPA Power Purchase Agreement PPP Public-Private-Partnership PPP Purchasing Power Parity (only used in connection with tables showing GDP/capita) PREP Priority Rural Electrification Project (UG) PURC Public Utility Regulatory Commission PV Photovoltaic RE Rural Electrification REA Rural Electrification Agency (UG) REB Rural Electrification Board (ET) REES Rural Electrification Executive Secretariat (ET) REF Rural Electrification Fund (UG) REA/REF Term used in this report as a generic term for Rural Electrification Agencies/Funds RET Rural Electrification Technology SHS Solar Home Systems SIDA Swedish International Development Agency SWER Single Wire Earth Return TA Technical Assistance WB World Bank ZEM Rural Electrification Zone (ML)
Definitions Capital deepening Bringing in additional finance for investments in RE in the
form of private equity and of private debt capital (commercial bank loans).
Capital stretching Getting more kms of MV/LV lines and new connections
for a give amount of finance for RE through increased cost efficiency in investments and in operation.
Centralised rural electrification Planning and implementation of rural electrification by a
single rural distribution company, which may sub-delegate some functions to other (local) actors as a means to reach its service targets.
Decentralised rural electrification Implementation of rural electrification by a plurality of
actors, who have access to project finance on non-discriminatory terms and use a mix of RE-technologies to keep costs down.
Electrification coverage Percent of national and rural population living in electrified
communities

7
Electrification rate Percent of national and rural households that have electricity service (grid connected or individual generators/PV systems)
Final-big push phase of RE Program for rest-electrification, usually with a ten-years’
timeframe. Initial phase RE Stage of RE when less than 20 percent of the rural
population, often as low as 2 percent, have access to electricity.
Off-grid-electrification (=“Off-main-grid electrification”) Electrification either
through isolated grid systems using diesels or hydro-power or through stand alone systems such as pico-hydro and solar PV
Performance-based-Subsidies Use of explicit performance-based subsidies to support
delivery of basic services, where policy concerns justify public funding to complement user fees. In literature also referred to as output-based-aid.
Success factors The key tasks and functions that have to be performed well
if an organization is to achieve its performance objectives.

8
Acknowledgements During 2007, four “information gathering visits” were undertaken for the study. The first from March 20-24 to Burkina Faso to attend a seminar for rural electrification agency managers from the Club of African National Rural Electrification Agencies and Structures (CLUB-ER), mostly from Francophone West Africa, and to interview officials involved in Burkina Faso’s rural electrification program. A visit to Washington from April 2-11 served to interview World Bank staff involved in rural electrification projects. A visit from May7-16 to Guinea and Mali provided information about the experiences of BERD and AMADER, while a visit from May 26-31 to Addis Ababa served to collect information about Ethiopia’s experience. This report builds on inputs from many, very busy persons, who spent scarce time in response to requests from me to find background papers or to engage in discussions face-to-face, via the phone or via the internet. I am very grateful that they took time to provide information despite being buried in urgent work, and for the interest all have shown in the subject matter covered in this report. Interviews and correspondence with actors in decentralized rural electrification Burkina Faso: Saliou Tall. Ethiopia: Andarke Bekele, Yesto Dasti, Armara Hadgu, Getahun Moges Kifle, Shiferan Telila, Eyob Aguma. Guinea: Nava Touré, Alphadio Barry, Jean-Paul le Bailly, Mali: Ismaêl Tourê, Alassane Agalassou, Adama Sisogo. Mozambique: Carlos Yum. Senegal: Amadou Sow. In addition, I would like to thank the following for sharing their insights about rural electrification with me during meetings in previous years: Mozambique: Miquelina Menenes. Nepal: Vishwa B. Amatya. Uganda: Fred Kalissa, Paul Mubiru, Albert Rugomayo, Godfrey Turyahikayo. Interviews with World Bank staff: Armarquay Armar, Doug Barnes, Susan Bogach, Anil Cabraal, Chandra Govindarajalu, Malcolm Cosgrove-Davies, Reynold Duncan, Phillipe Durand, Koffi Ekouevi, Vivien Foster, Susan Goldmark, Christophe de Gouvello, Ralph Karhammer, Fernando Lecaros, Mohua Mukherjee, Dana Rysankova, Arun Sanghvi, Bernard Tenenbaum, Ernesto Terrado, Clemencia Torres, Xiadong Wang, Interviews with consultants: Jon Exel, Jim Finucane, Francis Gbeddy, Karen Helweg Petersen, Preben Jørgensen, Michael Kvetny, Jean-Paul Laude, Gérard Madon, Søren Frisenborg Marker, Rolf Peter Owsianowski, Anders C. Pedersen, Denis Rambeau-Measson and Kilian Reiche, who also peer reviewed the draft report. Finally, but not least, the direct contract partners at EUEI-PDF, Lucius Rasso Mayer-Tasch and Ray Holland who copied many emails to me containing useful information on efforts in decentralized rural electrification.

9
Executive Summary: Key Conclusions The TOR for the study asked for an analysis of the experience of rural electrification agencies (REAs) and rural electrification funds (REFs). The specific institutional set-up varies: some countries have a “REA” with a budget, some a “REF” with a secretariat, and some a “REA” and a “REF” as separate legal entities. This report uses the generic term REA/REF for the concept: use of a specialised institution to manage multi-year funds earmarked for rural electrification on a transparent and non-discriminatory basis to support the implementation of rural electrification (RE) projects by a multitude of actors. The REA/REF experience covers few years only. Very little information and literature exist about them. This study is believed to be the first to make a comparative analysis of several REA/REFs. Macro-issues for the REA/REF concept Proponents of the REA/REF concept believe in the superiority of what in this report is dubbed “decentralised RE”: the implementation of RE projects through multiple private actors – private power companies, project developers from outside the conventional power sector and community cooperatives. In developing countries, where it is introduced, the REA/REF approach replaces “centralised RE”, where a single national or major regional power companies (each operating only in its region) have a monopoly concession for rural power supply. Superiority in RE is measured first of all by the speed of RE: the number of new and sustainable connections per year1 Proponents of the REA/REF approach argue that decentralised RE increases the number of connections and of electrified communities due to three effects:
(i) The entry of private developers would through recourse to equity capital and commercial bank loans bring in extra capital to RE (“capital deepening”).
(ii) The higher efficiency of private investors (and a reduction in the possibility of corruption in assigning contracts for construction) would, for a given volume of annual finance for RE, allow more connections and km of MV/LV lines to be achieved per year (“capital stretching”).
(iii) The bringing in of new actors to identify and develop “spontaneous projects” would allow more projects to be initiated.
The proponents also expected that the REA/REF approach would provide a number of additional advantages:
(i) The creation of a REF would encourage “basket funding”: the pooling of individual donor contributions for RE into a single fund, the REF.
(i) Positive rural transformation impacts were expected from the entry of private banks into rural finance: it was believed that the relatively important investment volumes in decentralised RE would attract commercial banks who previously found individual loans too small to motivate setting up lending operations in rural areas.
1 In initial phase RE, the Government target can be either increase in electrification rate – the percent of national and rural households that have electricity service (grid connected or individual generators/PV systems) – or in electrification coverage – the percent of national and rural population living in electrified communities. An electrification rate strategy targets the number of households, an electrification coverage strategy the number of electrified communities.

10
(ii) The REA/REF approach of small, medium and larger project concessions would enable national private actors to enter the RE-utility business; whereas only foreign-owned utilities would have the resources to bid for a large concession.
The thesis of this report is that the success of the REA/REF approach depends on three factors:
1. The importance of economies of scope and scale in RE 2. Contextual factors, partly the stage of national/rural electrification, partly specific national
market conditions, in particular the quality and breadth of the financial markets 3. The quality of the design for the REA/REF set-up
The essential question for the choice between the new REA/REF and the conventional paradigms for RE is whether the natural cost-advantages of centralised RE from economies of scale (in finance, investments and management) and of scope (integration of planning, securing of investment finance and implementation) are superior to the “competitive” forces of unleashing multiple private actors in de-centralised RE, or vice-versa?2 The issue can be refined by asking whether decentralised RE is expected to be superior to centralised RE in general or only for the case of off-grid RE? The REA/REF community is divided on this. In some countries, REA/REF is responsible for all types of RE projects: rural grid extension projects and off-grid RE projects. In the others, REA/REF is responsible only for off-grid electrification projects - isolated grid projects and stand-alone renewable energy systems such as solar PV-systems. Grid-extension projects from the national/regional grids remain the monopoly of the national/regional power company. The off-grid REA/REF approach implicitly assumes that centralised RE is superior for grid extension projects, and the decentralised approach for off-grid projects. A contextual factor of substantial influence for the choice of RE paradigm, whose importance is independent of other specific contextual conditions in a country, is the level of national and rural electrification that has been reached. The options for countries in the early stages of RE are different from the options for countries in the “final-push” phase of RE, where a concerted program for rest-electrification can be implemented. From the data collected in this report it seems that once a country passes two thresholds - a national electrification rate above 50% and a per capita income higher than US$3000 on a PPP basis - it becomes financially feasible to implement a program to achieve “100% rural electrification” within a ten-years’ timeframe. A comparison of RE strategies must refer to the stage of electrification to be meaningful. For the purpose of the comparative analysis of the country experiences in the report, the 12 countries are therefore grouped according to the matrix structure shown below.
Centralised approach to RE De-centralised approach to RE
Initial stage electrification Côte d’Ivoire, Ghana Total RE: Burkina Faso, Mali, Uganda
Off-main grid RE: Ethiopia, Guinea, Nepal, Mozambique.
End-phase electrification Morocco, Guatemala Chile
2 The issue of centralised versus decentralised is separate from the debate about whether power utilities are managed most effectively for the public good through private or through public ownership. Centralised electrification can be implemented by state-owned or private power utilities; the sample of countries in this report contains examples of both.

11
Four of the examples concern experiences with centralised RE, the other eight with decentralised RE, one of which, Chile, did not use the REA/REF approach to implement its RE program.3 The design challenge for the REA/REF set-up is to develop appropriate answers for the four key
successor factors4 that are decisive for the REA/REF modality to work. They are summarized in the RE diamond chart: (i) The institutional support structure for RE, composed of REA/REF, the Ministry responsible for energy and the power sector regulator must be of high quality. Essential features are a REF for grant support which is co-financed by a fee on electricity, an indicative rural electrification master plan or detailed RE concession plans, efficient administration of applications, transparent procedures for subsidy calculation and approval and for keeping subsidies per connection at the
minimum needed, a strong TA component for the supply chain for small scale service providers and for the financial community (if needed), and light handed regulation. (ii) The supply chain refers to project developers, consultants for feasibility studies, and installers (construction and electricians) who must be available in sufficient quantity and quality. (iii) Investment finance for RE investments must be available from banks in sufficient quantities and at pertinent terms (length of maturity beyond 10 years and rates of interest). (iv) Retail supply of electricity must be provided by companies having the technical and financial strength to maintain service in the long term. Experience so far The comparison of centralised and decentralised approaches to RE shows a clear superiority of centralised RE in achieving connections; as long as the power company in charge is reasonably efficient. The result applies for countries in the early and in the late stages of RE.
• Ghana and Côte d’Ivoire are examples of countries in the early stages of RE, who achieved good progress with a centralised approach, whereas the annual connections achieved by REA/REFs - except Nepal’s AEPC and Ethiopia’s REES - were all below 5,000 per year. Nepal achieved its results through the deployment of solar home systems, Ethiopia not through any novelty from the REA/REF modality, but through use of its support structure for cooperatives; the sustainability of the created electricity cooperatives is weak.
• Morocco and Guatemala are examples of countries in the final stages of RE, who used a single company to connect un-served communities. Morocco connected 4,000 communities per year, Guatemala managed 66,000 new rural connections per year, of which 20,000 in previously unserved communities. The 24,000 per year connections achieved by Chile’s decentralised approach in its rural electrification program PER pale in comparison.
3 Chile’s decentralised RE approach did not use the REA/REF structure of a specialised RE agency and a specialised
fund for RE. Chile added funds earmarked for RE to its general regional development funds and used the regional/provincial administrative set-up to manage the RE program. 4 The key tasks and functions that have to be performed well if an organization is to achieve its performance objectives.
RE Diamonds for De-Centralized Electrification
FinancialIntermediation
Supply Chain
Organisation of Supply / Electricity Service to Consumers
REF/REA and
Subsidy Policy
Burkina Faso
Guinea
Nepal
Ethiopia
Mali

12
The conclusion about the superiority of centralised RE in getting connections is not surprising. The economies of scale and of scope are huge in the development of new service areas; whereas the organisation of decentralised RE has substantial costs of transactions. The REA/REF approach makes best sense when applied to the implementation of off-main-grid projects only¸ as done in Ethiopia, Guinea, Nepal, Mozambique. In that case, decentralised RE (by REA/REF) is an add-on – providing 20 percent or less of annual rural connections - to the centralised approach used for grid extension projects (by the national/regional power company) and a tool for regional equity and relieving regional tensions.´ The data allows no conclusions concerning the cost-effectiveness of REA/REF versus centralised RE in off-grid electrification. Whereas the REA/REF approach for off-grid electrification makes good sense in the initial stages of RE, it is not recommended for the final-push electrification stage. Once ONE in Morocco and VNE in Vietnam turned their attention to get the last isolated communities electrified, their speed of implementation was vastly superior to results from previous decentralised approaches. ONE’s approach shows that centralised RE does not prevent new actors from coming in: activities where the national/regional company possesses no comparative advantage can be outsourced. ONE organised tenders for solar PV fee-for-service concessions. What conclusions can be drawn from the strategies for “total RE” used by the REA/REFs who are engaged in on-grid and off-main-grid RE?
1. Burkina Faso uses a small-scale priority investment approach, where the investments are identified by individual feasibility studies by REA/REF, the investment and operation is entrusted to installers and ownership of assets to the national power company (MV-lines) and to local community cooperatives (LV-lines).
2. Mali uses a country-covering geographic area concession approach, but the concessions allow locally developed projects as long as the concession holder does not object and offers to undertake the investment. Senegal has a similar approach but put less emphasis on getting smaller scale projects off the ground before the tendering of the first concession.
3. Uganda uses a combination of tendered larger-scale priority projects identified in an Indicative Rural Electrification Master Plan) and smaller scale locally identified and implemented projects.
The conclusions from Burkina Faso’s approach are quite clear: it is not possible to achieve country wide RE through the efforts of small-scale private companies. It is too early to form opinions about the “multiple geographic area concessions” approach, as no ZEM concession has been tendered so far in Mali. The first RE concession in Senegal, won by ONE resulted in an almost sensationally low bid for subsidy per serviced customer ONE, by bringing in equity and a substantial foreign loan, committed itself to more connections for the available subsidy payment than expected by ASER, the Senegalese REA/REF. But this was an entry level bid – some 16 more concessions are to be tendered. The many years that are needed to get concessions prepared, tendered and implemented confirm the wisdom of Mali’s strong support to spontaneous projects: Amader has achieved far more connections than ASER so far. Bids that “are too good to be true” have a tendency to be just that. After the tender, implementation leads to re-negotiations. Uganda experienced this with the West Nile concession (where the winner

13
insisted and got higher subsidies in response to the claims (i) that demand for electricity was lower than estimated in the demand studies being part of the tender documents and (ii) that many MV-poles set up by the national power company UEB turned out to be rotten. Bolivia had a similar experience with its tender for the “right to subsidies for sales of SHS in a given area”. One of the two winners, a Spanish company realised it had under-estimated costs. The result was a renegotiation of the terms. The relative slowness of the REA/REF approach in getting connections is not due to design failures in the REA/REF set-up. As far as the “institutional support infrastructure” is concerned, all countries made great efforts in designing REA/REFs that matched requirements, hiring good staff, investing in capacity building and in hiring consultants to develop required software, manuals and policy-recommendations. The differences in the REA/REFs are astonishing. The designers of the schemes showed impressive imagination and skills in finding innovative solutions to challenges posed by the complexities of the REA/REF approach in general and by specific conditions in the country. The REA/REF experience confirms the golden rule of applied economic policy: no silver bullet exists, all countries try to adjust measures to national reality. The RE diamond chart gives the best scores to Nepal, except as regards the quality of debt finance for RE. Due to decade long capacity building efforts, Nepal has the best supply chain! A reinforcing factor is the high quality of AEPC staff. Burkina Faso’s approach with community cooperative utilities signing construction plus operation and management contracts with local installers has been too difficult for the local supply base: it was too weak in terms of numbers of firms, financial strength of firms and quality of engineering consultants to manage the job. The national RE-program is hurt twice by the weakness of its technical supply chain: because the installers are used to manage and operate the installed systems as well also the organization of supply gets a low rating. Due to its zero-rate-of-interest policy for loans, it has the least sustainable system for channeling loan finance to projects in the long term. Mali managed to attract foreign utilities as well as local firms with relative solid financial strength to engage in its RE program. Pushing smaller local projects while the ten country wide concessions are being prepared enabled a relatively important number of connections to be achieved. Amader’s multi-energy activities have shown interesting results, but its discretionary policies for calculating subsidy levels and charges of corruption that led to the retirement of its previous Executive Director reduce the ranking for its institutional set-up. Ethiopia’s REA/REF set-up gets a high score for making excellent use of scarce specialized know-how by embedding its REA/REF set-up within existing institutions and for having prepared a Master Plan for Off-Grid RE already by 2006. The strong set-up for organising projects and the use of 85% loan finance for projects drives the implementation rate of projects forward. The system of financial intermediation receives a positive rating because of the use of a professional bank for the administration of loans and the financial appraisal of applications. But the technical supply chain is weak in rural areas. The cooperative utilities charge tariffs below their costs of operation and low connection charges attract households to connect who are unable to pay the monthly electricity bills. Guinea gets results for two reasons: (i) the quality of BERD’s TA to project developers (the supply chain as such is weak, but solid software and other TA support, including market monitoring by BERD, manage to solve many obstacles in practice) and (ii) BERD’s collaboration with a local bank provides loan finance to projects. Three countries in the sample - Mali, Mozambique and Nepal - chose to organise their REA/REF as a Rural Energy Agency serving rural energy needs in general and not just RE. Their experience shows no synergies in field work between electricity projects and energy projects other than

14
electricity. But it leads to savings in administration and to better use of specialised skill resources concerning management of subsidy schemes, project monitoring & evaluation and reporting to donors. The multi-energy approach increases the political visibility of household energy projects (improved stoves and woodfuel supply projects) through its alignment with RE, which enjoys a high political profile. The REA/REF approach has attracted very little private capital into RE and the willingness and ability of commercial banks to cofinance RE-projects that are supported by REA/REF subsidies has been disappointingly low. In many African countries commercial banks are by banking regulations restricted from providing loans with maturities of 10 years and longer. The reality of rural poverty (need for high investment subsidies to keep tariffs low) limits the share of private co-finance through investor equity, commercial bank-loans and community contributions to one third or less. The experience is not limited to the REA/REF modality, the centralised RE approach in Guatemala led to investment subsidies (paid per connected customer) that were higher than the cost of investment. The REA/REFs have not served as focal recipient/distributor of donor funding for RE-projects. Part of the explanation may be in the shortness of the REA/REF experience vis-à-vis the long lead times for the planning of the multi-annual assistance programs of donors. Part of the explanation is the start-up slowness of the REA/REF approach in getting projects implemented; potential donors were not sufficiently tempted to join the example of the initial donor(s) who assisted the creation of a REA/REF. Recommendations: For countries in the initial stage of RE the overall recommendation arising from the analysis of this report are:
• To apply the centralized RE approach for grid extensions in combination with a REA/REF set-up for off-grid electrification;
• For countries that use the total areas concession approach, like Mali and Senegal, the
recommendation is to reduce the planned number of concession areas from 10 and 17 to two or three. In that case, the country moves toward the combined centralized and decentralized approach recommended above.
• Preferably to set up rural multi-energy agencies rather than agencies with a single focus on
RE.

15
1 INTRODUCTION
The great challenge is not the number of connections, but to have an approach that works, Nana Touré, DG BERD
1.1 Rural Electrification Agencies as Stepchildren of Power Sector Reforms
1.1.1 Objectives for Power Sector Restructuring and Privatisation
During the late 1990s, many developing countries implemented power sector reforms, which replaced the monopolistic structure of a state-owned vertically integrated power company5 with a new structure composed of vertically and horizontally separated power companies, many of which would become privately owned.6 A key objective of power sector restructuring and privatization in all countries was and is to increase the operational and investment (allocative) efficiency of the existing power system. When increased operational and allocative efficiency is the key objective, the design challenge for power sector reform is to identify real and contestable markets in the supply chain for electricity services.7 In countries with low electrification rates a more important success criterion for power sector reform is “increased efficiency in expanding access”. The challenge is to create a structure that can provide universal and good quality electricity service to the national population within the shortest number of years and at the lowest cost to the economy. In this context, improving operational and alllocative efficiency is still important, but more as a tool to liberate financial resources that can be used for investments in increased access. 8 Yet, even in countries with low electrification rates, the main factor triggering reform was the bad state of the power sector managed by the state-owned power company. Power system losses (technical and non-technical) were high, the financial situation of the power company was weak and load shedding was a daily feature. The starting point for reform was, therefore, how the existing
5 The classical paradigm for the structure of the power industry emphasised the existence of large economies of scale and of scope in the power industry, which could be reaped by a vertically integrated monopoly. The “public service” duties of the industry led to favourable views on public ownership. 6 The new paradigm for the structure of the power sector points out the diseconomies of monopolistic structures – by economists referred to a as “X-inefficiency”. It recommends introducing competitive pressure in the power industry as a means to promote productive and allocative efficiency. 7 Meaning markets, where competition in the supply of the offered goods and services is possible. A contestable market may be served by a single operator (e.g. billing services for a power supply company), but the service provider faces the potential threat that competitors enter the market to replace him if he is not cost-effective and quality conscious. 8 Improved investment and operational efficiencies of the existing power system are important ends in themselves: inefficient management of UEB in Uganda and of TANESCO in Tanzania during the 1990s imposed huge economic losses on their national economies in the form of black-outs, low annual connections and private imports of back-up diesel generators. But they are also a means to generate finance for investments in the expansion of the system.

16
power system could be made more effective and what role privatisation could play in this effort. This pushed the objective of rural electrification into the background, as a secondary consideration. Restructuring – the vertical and horizontal separation of previously integrated functions – was the “standard tool” for making the power sector more effective. Separation was to enable potential competition in generation and in supply and provide greater transparency for regulation. Privatisation was pushed by two arguments. (i) One was search for efficiency gains founded in the belief in the inherent higher efficiency of private companies. (ii) The other was the claim that the volume of finance needed for required future infrastructure investment was beyond the financing capacity of state-owned companies and their co-financing donors; private capital had to be brought in to close the perceived financing gap.
1.1.2 The concept of non-commercial rural electrification concessions
In the horizontal separation of distribution concessions, a particular distinction was introduced between “commercially viable (urban) distribution concessions” and “non-commercial” (rural) distribution concessions”. The distinction between loss-making rural and cost-covering urban electrification projects was not new. In the traditional national power company structure, governments and donors began during the 1990s to make the distinction when defining on-lending policies for grants and concessional loans given to electrification. The Ministry of Finance, as recipient of the loans, would on-lend these to the national power company at near-commercial rates of interest when the loan was used for urban projects and at subsidized rates or as grants if used for rural projects. In the post-reform structure with multiple concessions, the novelty was the establishment of separate tariff and regulatory regimes for urban and rural concessions. This allowed subsidy levels to be calculated and fixed according to more objective criteria than before. The introduction of specific rural concessions solved one major weakness of rural electrification when done by a national power company: that the combined revenue from national tariffs in rural areas and from rural investment subsidies usually was insufficient to cover the costs of rural electrification including operation and maintenance costs. As consequence, the engagement in rural electrification undermined the financial health of the national power company. In the post-reform set-up, providing “non-commercial rural electrification” through “specific rural concessions” was to serve three purposes.
(i) As a risk minimization instrument it was to attract investments from risk-averse foreign utilities into “commercial distribution” areas. National decision takers were concerned that a tender for the total distribution area of the national power company would attract too few bids and that the winning bid price would be low if the concession included rural electrification projects.
(ii) The separation provides clarity about the main performance parameter for the utility: (i)
reduction of system losses and load shedding for the commercial concessions (plus connections in peri-urban areas) and (ii) maximum new connections for the non-commercial concessions. This facilitates the regulation of the concessions. The commercial concession area was, typically, narrowly defined as the area lying within the distance of 100-200 meters from existing grids. Since anybody living within the

17
concession area had a right to be connected promotion of connections in this area was not a regulatory issue except with regard to the approval of connection fees.
(iii) The separation was to attract new sources of project finance for investments in
transmission and distribution: the “commercial distribution concession” was expected to get loans on commercial terms through the commercial capital market9; allowing scarce donor funds to be channelled to rural electrification projects only.
1.1.3 “Decentralised” versus “centralised” rural electrification approaches
Depending on whether reformers believed in economies of scale or in entrepreneurial competition as the more important force for bringing down the cost of power supply, countries would implement a centralised or a decentralised implementation structure for rural electrification. In both cases, rural electrification is done through public private partnerships (PPPs). The concession holder connects rural villages and households in accordance with the terms of the concession contract. The responsible public authority pays the provider a subsidy which makes the rural activity commercially viable: tariffs are brought down to levels that match the ability to pay of a significant number of households in the service area, yet cover the investor-operator’s own costs of investment, operation and maintenance. In the “decentralised electrification” modality, rural electrification is undertaken by a plurality of actors, who have access to project finance on non-discriminatory terms and use a mix of RE-technologies to keep costs down. The approach in most countries comprises the creation of an institutional-regulatory framework composed of three pillars: (i) a Rural Electrification Agency, (ii) a Rural Electrification Fund, and (iii) light-handed regulation of rural distribution concessions. In principle, the “decentralised rural electrification” modality scores well with regard to three success factors: (i) it gives high visibility to rural electrification as a policy goal; (ii) the REF allows financial resources from various sources to be pooled, (iii) REA has one clear objective against which its performance is measured: progress in rural electrification, whereas previously, rural electrification was a side activity of the national power company. In the “centralized rural electrification” approach, only one or two rural electrification concessions are tendered; in large countries like Brazil this “rule” applies to state/provincial level. In Guatemala one private distribution company won both rural distribution concessions that were tendered; competition for the rural concessions was a once-and-for-all affair.
9 That expectation turned out to be too optimistic. As investment in distribution projects in Africa is seen as high risk by private utilities and commercial banks9; development banks continue to be the main source of funding for “commercial distribution investments”.

18
1.2 Early Stage and End-Phase Rural Electrification In 2004, the average national electrification rate in Sub-Saharan Africa reached 21 percent10; the rural electrification rate was probably one third of that. The stages of rural electrification – initial or final rural electrification - present different challenges for policy makers, which a review of experiences must take into account. The national electrification rates of the countries discussed in this study range from 6% to 98% and the rural from 1% to 95%; Guinea and Morocco were the extremes in both cases, see table 1. Table 1: Basic Electrification Statistics about Countries included in this Study
BF CI ET GH GN GT MA ML MZ NP UG
GDP (at PPP)/capita1) 1220 1490 1000 2370 2240 4410 4360 1000 1270 1530 1500
People/sq.km. 1) 48 57 71 97 38 116 68 11 25 190 146
Rural Population in %2) 80% 50% 85% 59% 70% 52% 40% 80% 64% 80% 80%
National electrification rate2) 17% 25% 8% 42% 6% 89% 98% 11% 8% 39% 8%
Rural electrification rate2) 3% 8% 1% 17% 1% 80% 95% 1% 2% 33% 3%
1) Figures for year 2005, according to World Development Report 2007, World Bank 2) Figures for years 2005, 2006, 2007 depending on country, the figures for CI, however, are from 1998. Table 1 illustrates the close dependence of the national and rural electrification rates on two economic data: (i) GDP per capita and (ii) the share of the population living in rural areas (the percentage itself being closely correlated with GDP per capita). It seems that once a country passes two thresholds: a national electrification rate above 50% and a per capita income higher than US$3000 on a PPP basis - it becomes financially feasible to implement a rural electrification program to achieve “100% rural electrification” within a few years. When Guatemala, Morocco and Chile in the 1990s undertook to reach total rural electrification within a ten-years’ investment period, they had passed these two thresholds. The end phase is in this report referred to as the “final big-push phase” of rural electrification. The characteristic features are (i) that the Government takes the policy decision to complete rural electrification within 10 years, (ii) that sufficient investment finance is secured for the purpose and (iii) that the target is to reach “100 percent” connection rates within each service area. Differences in political stability explain differences in national and rural electrification rates:
• Mozambique has, relatively to its GDP per capita, a high urbanisation rate which reduces the costs for electrifying this segment of the population. But a low population density (leading to high costs of rural transmission and distribution projects) and a bitter civil war during the 80s and early 90s kept down the national electrification rate.
• The urbanisation rates, GDPs per capita and population densities are similar in Nepal and Uganda; yet, Nepal’s electrification rate is five times higher. Partly, this is due to Nepal’s higher overall political stability; and that even the Maoist insurgency during the early 2000s had little negative impact on the continuity of donor-finance to rural electrification.
10 Source: World Bank: Ghana Energy Development and Access Project, Project Information Document (PID)

19
• Relative political stability explains the comparatively high electrification scores of Burkina Faso and Ghana.
1.3 Structure of Report
1.3.1 Classification of reviewed countries and division into chapters
The political, financial and organisational challenges are different in the “early” and the “final” stages of rural electrification, the comparative reviews in this study treat these experiences in separate sections and chapters. Some countries in the initial rural electrification phase apply a decentralised approach (under the responsibility of REA/REF) to all rural electrification, others apply it to off-main grid electrification only. Distinguishing between the two dimensions of electrification approach and stage of electrification, we get the groupings shown in the table below. Table 2: Grouping of reviewed countries by major category
Centralised approach to RE De-centralised approach to RE
Initial stage electrification Côte d’Ivoire, Ghana Total RE: Burkina Faso, Mali, Uganda
Off-main grid RE: Ethiopia, Guinea, Nepal, Mozambique.
End-phase electrification Morocco, Guatemala Chile
The classification shown in the table is used to structure the main body of the report: - Chapter 2 on centralised approaches to rural electrification has one section on early stage/
incremental rural electrification - drawing lessons from Côte d’Ivoire (CI), Ghana (GH) - and one on final/ big push electrification in Guatemala (GT) and Morocco (MA).
- Chapter 3 deals with decentralised approaches to early stage/incremental rural electrification in
Burkina Faso (BF), Ethiopia (ET), Guinea (GN), Mali (ML), Mozambique (MZ), Nepal (NP) and Uganda (UG).
- Chapter 4 reviews the experience of Chile´s PER as an example of a country that uses a
decentralised approach to the final/big push electrification phase.
1.3.2 Details found in Annexes
Experiences with rural electrification funds are still new, and this study is believed to be the first to make an analysis of several funds. There exist few descriptions of individual funds, and they are

20
not detailed. Yet, practitioners are interested in details: to see what solutions and tools have been tried and what the experiences were. Annex I reviews in detail the REA/REF concepts applied in Burkina Faso (BF), Ethiopia (ET), Guinea (GN), Mali (ML), and Nepal (NP). All use a decentralised, multi-actor approach to rural electrification. As a contrast, the Annex includes also two centralised approaches to rural electrification: the state-company driven investments of Côte d’Ivoire (CI) and the single private rural concession approach of Guatemala (GT). One will see astonishingly large differences in the details of implemented REA/REF schemes; there are no look-alikes! But because the operating experience of the funds is short, and implementation of the concept takes several years, one will see few conclusions in this report about individual instruments and approaches. Experiences are too short to allow firm conclusions to be drawn.
1.3.3 Key success factors for RE: the “Rural Electrification Diamond”
The overall lesson from rural electrification worldwide – centralised and decentralised - is that significant progress depends on three macro-factors: (i) a political decision to achieve significant progress is expressed in quantitative targets and dates; (ii) required finance is made available, (iii) a specialised institution is given the responsibility for rural electrification.
The essential design issues at micro-level for rural electrification can be expressed graphically by the rural electrification diamond. It measures how far the actual situation is from the ideal situation in the four areas. For decentralized rural electrification these are. (i) quality of the supply chain for rural electrification projects; (ii) quality of financial intermediation for rural electrification; (iii) quality of the
utilities that implement rural electrification; (iv) quality of the public supporting infrastructure for rural electrification and its policies and procedures - primarily the rural electrification agency, its TA and subsidy policy. The diamond for centralized rural electrification is similar in principle but different in content since some functions (RE planning, preparation of feasibility studies and power supply) are concentrated in the utility, the sources of project finance are different.
The Rural Electrification Diamond
FinancialIntermediation
Supply Chain
Organisation of Supply / Electricity Service to Consumers
Public institutions,regulations and
policies in support
of RE

21
In the “ideal” framework for decentralized rural electrification, the four components would look more or less as follows.
1. The supply chain for rural electrification projects has (i) a number of highly qualified consulting firms, (ii) well-managed, well-financed power construction companies with well-trained staff and in sufficient numbers that at least some degree of genuine competition takes place in tenders for construction projects and (iii) private firms from outside the utility sector with the required equity capital and entrepreneurial interest in developing spontaneous rural electrification projects.. The lowest life-cycle-cost designs and technologies are applied systematically in projects. The Government supports ex-ante quality by providing training courses to consultants and to staff from construction companies and by keeping public lists of qualified consultants and construction firms, whose performance is monitored.
2. The local financial intermediation system enables financial closure of projects with long
pay-back periods. Banks give long-term loans - with a minimum of 10 years maturity - to investors in rural electrification projects, and are normally linked to investors long-term also through working capital loans. The Government may provide a line of credit for rural electrification investments to commercial banks on near-commercial terms, to which the banks add a risk adjusted on-lending rate to projects. Credit-enhancing instruments such as a partial risk guarantee for loans given to rural electrification projects and to PV-dealers may also be used by Government.
3. Supply of electricity service at village level is done by professional power utilities, well-
financed private entrepreneurs or village cooperatives that are monitored and get TA during project preparation and long-term during O&M from a parent organisation or from a contracted management/engineering firm. PV-systems are sold or leased by PV-dealers who have established a nationwide network of qualified retailers. The national authority for the economic regulation of power distribution and supply companies applies light-handed regulation to rural utilities, adequately balancing the costs and benefits of regulatory requirements.
4. The most important parts of the public infrastructure in support of rural electrification are
(i) the Rural Electrification Agency (whatever its name is), (ii) the Rural Electrification Fund, (iii) the national subsidy policy for rural electrification and (iv) tariff regulation that ensures the financial viability of power supply. The REF is co-financed by a rural electrification levy levied on grid-connected electricity consumers (or on power generation), grants and soft loans from multiple donors plus contributions from the state budget as appropriate. The REA has a small, highly qualified staff and may also be engaged in rural energy other than electric power. An indicative rural electrification master plan guides investments for priority projects or defines the terms of area concessions. Simple, transparent procedures are used for project approval and the calculation of project subsidy, done on a rule-bound, non-discretionary basis. Alternatively, the level of subsidy can be fixed through tendering for concessions, either by fixing the subsidy amount and selecting bidders according to the maximum number of connections, or by fixing the number of connections and selecting bidders according to the lowest required subsidy per connection. The costs of transaction for public administration and for project developers are kept down

22
by coordinated application forms and approval procedures for licensing (by the regulatory agency), loan application (bank) and subsidy application (REA). The REA sub-contracts specialised firms to provide TA to (potential) electricity service providers and to the supply chain and is in close contact with sector ministries and agencies who promote productive activities in rural areas. It actively informs potential applicants in urban and rural areas about the availability of subsidies, the criteria that have to be fulfilled and applications procedures.
In reality, hardly any country has a “perfect score” in all four areas; the diamond is skewed. In the hypothetical example shown in the chart, the system for financial intermediation is judged to be weak, the rural electrification agency and its subsidy policy and the supply chain are evaluated to be relatively efficient, whereas the organization of rural electricity supply is judged to be mediocre.

23
2 REVIEW OF CENTRALISED RURAL ELECTRIFICATION
2.1 Innovations in Centralised Rural Electrification Innovative practices are not a prerogative of the REA/REF approach to rural electrification. The challenge posed by high costs of investment per connected customer and low rural electrification rates led to constant searches for cost reductions also in centralised rural electrification:
• One line of effort was in technological innovations. Utilities searched for poles, HV, MV and LV-lines with lower life-cycle costs. As a means to bring down the upfront cost of connection, rural projects installed ready-boards at household premises rather than complete house wiring and installed load-limiters instead of meters. Some projects experimented with pre-payment meters to reduce payment default rates.11
• Another line of effort for achieving cost reductions was public-financed TA to the technical
supply chain in rural electrification – consultants, installers and construction companies. The dual intention was to improve quality and competition by increasing the number of suppliers.
• A third line of effort was in experiments with the outsourcing of activities where the utility
possessed no natural advantage. Meter reading and collection of consumer payments was contracted-out cost-effectively to local firms replacing meter reading and billing by utility staff. Utilities stayed away from the solar home system PV-market as retail sales were not a natural part of the utility business and fee-for-service proved to be very complicated.12
Innovations in project finance comprised co-financing in kind and cash by beneficiary communities as a means to raise more finance and as an instrument for prioritising the sequence of connecting communities. Hence, the general picture in centralised electrification is one of substantial innovation.
11 Utilities are experiences that cheating with electronic recharging of pre-payment meters goal is feasible and can become widespread, leading to an increase in non-technical system losses. 12 However, the responsibility for organising tenders for solar PV-concessions could be entrusted to the national – or regional - utility holding the distribution concession for the area. But in most countries, the ministry responsible for energy would organise these.

24
2.2 Examples of Early Stage Centralised Rural Electrification: Côte d’Ivoire and Ghana
2.2.1 Côte d’Ivoire
Côte d’Ivoire started during the 1980s to lose its position of relative wealth in sub-Saharan Africa as falling international prices for coffee and cacao hit its economy. Yet, in the late 1990s, it was still one of the best performing countries in terms of income per capita and electrification coverage. Table 3: Côte d’Ivoire Basic Data Year GDP (at PPP)/capita Rural Population in % National electrification rate Rural electrification rate
1998 US$1730 54% 25% 8%
Côte d’Ivoire’s approach to electrification during the 1990s had two distinguishing features. The first feature was the organisation of the power sector. The power sector reform of 1990 introduced a separation between public asset ownership and private operation of these assets.13 The management and operation of state-owned power generation, transmission and distribution assets – previously owned and managed by power company Energie Electrique de la Côte d’Ivoire (EECI, 92% owned by the State) - was given to the private power company Compagnie Ivoirienne d’Electricité (CIE)14 in concession until 2002 against a leasing fee. But EECI continued to be responsible for the planning and implementation of investments in transmission and distribution, and monitored CIE’s performance with regard to the maintenance of leased assets. The second feature was the country’s “basic infrastructure approach” to rural electrification. It had four aspects. (i) Emphasis was on progress in “electrification coverage” measured as the number of electrified rural communities and/or the percentage of the national population living in electrified communities. Helped by the 50% urbanisation rate, Côte d’Ivoire had in 1998 two thirds of its population living in electrified communities. But only 25% of national households were connected. (ii) LV-lines and street lights followed only streets laid out in the town plan of the village. (iii) National safety regulations allowed only buildings made of solid material, such as bricks and concrete to be connected to the LV-grid. Other interesting features were found in rural electrification finance:
(i) Since the late 1970s, a rural electrification tax was imposed on electricity consumption as an instrument to cross-subsidize “rural investments” by “urban consumption”. The rural electrification charge generated around 1 billion FCFA per year during the 1980s and about 2 billion FCFA (US$3.7 million) per year during the mid-1990s. As the average cost of investment per electrified village under the 1995-98 rural electrification program was around US$200,000, the annual revenue from the rural electrification tax
13 A first step towards private participation was taken with the Power Sector Law of 1985. It allowed private investment in generation, while transmission and distribution was a monopoly of the state and delegated in the form of concessions. 14
The joint stock company is owned by EDF, Bouygues, private Ivorian investors and the State (20%).

25
equalled the cost of investment of 19 villages or 13% of the electrification of 150 villages per year, which was achieved by the 1995-98 rural electrification program.
(ii) Due to CIE’s nationwide tariffs, urban-rural cross-subsidization of the costs of operation continued, its impact being reinforced by a lifeline tariff policy.
(iii) The state budget paid the electricity bill for street lighting in rural communities. In the smaller rural communities (more than 800 inhabitants) - that started to be electrified in the second half of the 1990s - the revenue from street lighting amounted to about 50% of the total during the initial two years after connection.
(iv) From late 1998, an ordinance issued by the Ministry of Mines and of Energy required villages to co-finance 3 percent of the cost of their electrification. The village authorities in turn asked Fonds Régionals d’Aménagement Rural (FRAR) – a rural infrastructure fund - to co-fund their 3 percent contribution. The remaining gap in funding was covered in kind by “free” local labor during construction and by financial contributions from beneficiary households.
Since the vast majority of subsidy funds for rural investments came from the State budget in the form of grant funds and from donor grants and soft loans, the rural electrification levy guaranteed little investment continuity. Annual investment levels were subject to wide fluctuations during the 1980s and 1990s as the state budget was hit by the national economic recessions and the sector preferences of donors often changed when a new government took office in a donor country. The stop-and-go nature of annual investment volumes undermined valiant state efforts to make the technical supply chain (consultants, electricians, construction companies) more efficient. The sustainable market for their services was simply not there. Technical regulation was over-done, boosting costs further. BNETD (Bureau National d’Études Techniques et de Développement) controlled the investment program performed by EECI on behalf of the State. All tenders, bid selection and contracts had to be approved by BNETD; and BNEDT inspected the internal wiring of new applicants for grid connection to verify their compliance with safety regulations before CIE could undertake a connection. CIDA-financed projects introduced Single Wire Earth Return (SWER) technology in some regional rural electrification projects. But since no parallel efforts were undertaken to introduce single-phase motors on the market in Côte d’Ivoire, the investments failed to replace diesel generators for productive uses. As rural electrification in the late 1990s moved to the phase of electrifying increasingly smaller communities, prioritization – in particular to justify choices on technical and political grounds - became increasingly more difficult. The 1998-ordinance for the 3% local co-financing contribution was a defensive measure by the Ministry of Mines and Energy.

26
2.2.2 Ghana
Ghana has one of the highest electrification rates in Sub-Saharan Africa. More than 80% of its urban and more than 20% of its rural population have access to electricity.15 In part, this reflects its comparatively high GDP per capita, in part it is due to a long-term political willingness to push rural electrification, in part this is due to the quality of the country’s electrification approach. Table 4: Ghana Basic Data Year GDP (at PPP)/capita Rural Population in % National electrification rate Rural electrification rate
2005 US$2370 59% 42% 17%
All countries in the early stages of rural electrification face the difficult political problem that the least cost rural electrification development plan dictates some rural communities to be connected within a year or two and others up to 30 years later. To reduce political pressure and dissatisfaction, some countries allow communities to jump the queue if they are willing to co-finance an important part of the cost of their electrification. Ghana’s electrification program provides an example. In 1989, the Government of Ghana launched the National Electrification Scheme (NES) policy. The goal was to connect all communities with population above 500 to the national grid over a 30-year period from 1990-2020. In 1989, 4221 communities in Ghana had a population above 500 persons, out of which only 478 towns had access to electricity supply, meaning that 3743 of the target communities were without electricity at that time.16 The Government (GOG) commissioned in 1989 a National Electrification Planning Study (NEPS) to determine the modalities for implementing the 30-year national electrification program at least cost and within budgetary constraints imposed by the Government. The NEPS resulted in the production of a National Electrification Master Plan (NEMP), which identified 69 project packages for implementation of the NES over six 5-year phases starting from 1990. The National Electrification Project (NEP), to take care of the first two phases of the NES, was expected to extend the national power grid to all of the 110 political district capitals in the country17 plus to 455 communities. The project was implemented between 1991-2000 at a total cost of US$185 million. Foreign funding was provided by a consortium of institutional and bilateral donors under the auspices of the World Bank. In the Southern regions of Ghana, the programme was executed by the Electricity Company of Ghana (ECG), and in the Northern regions by the Northern Electricity Department (NED) of the state-owned Volta River Authority VRA.18 Between 1995 and 1999, NEP projects were executed by contractors through turnkey supply & erect contracts.
15 As “always” electrification statistics from Africa are uncertain. World Bank (2007b) states that 77 percent of the urban and 17 percent of the rural population were electrified and that the national electrification rate reached 54% in 2004. Multiplying the quoted urban/rural electrification rates with the 41/59% urban/rural population percentages results in a national electrification rate of 42%. 16 Most information about Ghana in this sub-chapter is based on the paper by Gbeddy (2006) 17 At the end of 1989, 64 district capitals were not connected to the national power grid. 18 Tariffs and conditions are uniform throughout Ghana, settled by Public Utility Regulatory Commission (PURC) after consultations with Ministry of Mines and Energy (MME) and the utilities

27
A complementary component of the NES, which was implemented in parallel to the NEP, was the 3-5 year rolling electrification program called the Self-Help Electrification Programme (SHEP). Communities that (i) are not scheduled for immediate connection to the national grid, (ii) which are located within a distance not exceeding 20 km from an existing 33kV or 11kV source of supply); (iii) are willing and demonstrate ability to procure and erect all the required number of standard low voltage poles required for the establishment of the distribution network within the community; and (iv) have at least 30% of the households in the community wired and ready to be serviced as soon as electricity supply is connected can apply to the Ministry of Energy – which oversaw the SHEP - for project finance.19 As long as the ministry has sufficient SHEP funds, all qualified applications are approved; otherwise communities have to wait in line. An interested community is required to set up a village electrification committee to: (i) mobilise funds from local and foreign sources to purchase low voltage poles; (ii) assist in arranging for and acquisition of the Right-of-Way (RoW) without payment of compensation; (iii) organise communal labour for RoW clearing and erection of poles; (iv) apply for electrification of the community through the District Assembly; (v) organise and educate the public on the need and how to wire their houses; and (vi) assist in arranging for storage and for organising security for materials and equipment released by the Ministry of Energy for the electrification project. The Ministry of Energy hired local contractors - drawn from a register of qualified local electrical contractors kept by the distribution utilities - for the installation of materials and equipment for the various village electrification projects. The distribution utility that operates in the areas selected for electrification acts as the Engineer for the SHEP project. The “engineer” provides the Ministry of Energy with the specifications for all materials & equipment required for the SHEP projects; vets and endorses the designs and specifications of all local and imported materials and equipment for the SHEP, as well as the survey and construction drawings submitted by contractors; ensures that installation works are carried out in accordance with the specifications and standards of the distribution utility; tests, commissions, operates and carries out maintenance of the established village distribution networks after installation works are completed. A local consultant hired by the Ministry acts as the Engineer’s Representative at the site. This arrangement was adopted in order to minimize the burden on the distribution utilities whose commercial distribution core activities were already very demanding. Cost-effective standardised distribution network designs were used, ranging from SWER and other single-phase distribution systems to three-phase systems depending on the type of existing loads and potential future developments that had to be supported by the networks in the area. The Ministry of Finance was responsible for securing the funding for the local and foreign costs of the SHEP. It relied on donor grants and “tied” concessional mixed credit facilities to finance offshore materials & equipment for the project; the main source of foreign funding was the Indian Exim Bank. The loans were contracted by the Government and are not passed on to the distribution utilities because SHEP is considered a “government sponsored” program. Assets acquired under the SHEP are therefore not consolidated into the asset base of the distribution utilities; they are operators of the SHEP networks on behalf of Government. The local costs of SHEP-investments are financed from annual budgetary allocations from the Government’s consolidated budget and 19 The energy sector is regulated by MME in interaction with two commissions, the Energy Commission EC and the regulatory commission PURC, both instituted by Act 538 in 1997.

28
from the National Electrification Fund (NEF) which is managed by the Ministry of Energy and financed by a levy charged on electricity consumption by all consumers. In 2000, in order to promote productive and income generating uses of electricity, plans were made to establish a special credit facility (financed by a donor grant) for individuals and groups through the Rural Banking System. This facility was also to provide credits to household for wiring and other upfront connection costs. The banking situation in rural Ghana was relatively favourable: rural banks started operating in 1976; an Association of Rural Banks was formed in 1981 and has today more than 110 members dispersed all over Ghana. The first batch of SHEP projects (SHEP-1 Project) was implemented between 1990-1992 covering about 100 communities at a foreign exchange cost of US$5 million. From 1993-1995, the SHEP-2 project electrified 250 communities at a foreign exchange cost of US$10 million. Initial penetration rates of connection of more than 85% were achieved. A survey in 1994 to identify communities for the SHEP-3 project revealed that over 1400 communities were qualified; the foreign exchange cost of the investment program, expected to run from 1997-2002, was estimated at US$120 million. By 2004, the NEP and SHEP had managed to electrify over 3,000 communities together. The energy-industry linkage of the investments turned out to be disappointing. At the inception of the NES, it was perceived that the scheme would lead to the establishment and development of indigenous local industry to produce and supply the major inputs required for executing the projects under the scheme. However, the NES led only the local production and supply of treated wood poles and concrete poles plus a couple of high quality conductor manufacturing companies that sprung after year 2000. The explanation comprised lack of capital for national investors and over-reliance on tied credits, which reduced the demand for locally manufactured goods. A weak institutional sustainability aspect of the SHEP was the “Ministry as asset owner, utilities as asset-operator” mode of implementation. It opened question marks as to how maintenance and long-term replacement were to be financed. But, in the end, the SHEP was killed by its reliance on tied export credits as a major source of finance. After the HIPC debt relief, Ghana was no longer eligible for several types of export credits that had previously financed the acquisition of rural electrification equipment/supplies to match contributions of the village communities. Ghana now has to rely now almost exclusively on donor grants, etc. which are not usually allocated on demand-driven basis and also not readily available because of bureaucratic procedures. A new phase has begun with the implementation of the Ghana Energy Development and Access Project” (GEDAP). It is co-financed by IDA, GEF, AfDB, SDC (Swiss Agency for Development & Cooperation), commercial banks in Ghana and a free-standing Trust Fund. The “Access Expansion Component” of the project finances (i) increasing market penetration in peri-urban and rural areas where grids already exist; (ii) grid extensions; (iii) mini-grids supplied from mini-hydro, or biomass-based generation; and (iv) solar home PV systems. The major innovation of the project, compared to the previous NEP-SHEP scheme, is the higher emphasis on mini-grids and stand-alone PV-systems.

29
2.2.3 Results of centralised RE in Mozambique – a short note
Mozambique has a population of 19.1 m and a population density of 24 persons per sq.km. Year 2005 gross national income (GNI) per capita was US$310 (nominal) and US$1270 (purchasing power parity).20 Table 5: Mozambique Basic Data Year GDP (at PPP)/capita Rural Population in % National electrification rate Rural electrification rate
2005 US$1270 64% 8% 2%
The civil war in Mozambique from the mid-1980s to the early 1990s had cost the country heavily in terms of destroyed infrastructure and lost human and institutional capacity. The national power company Electricidade de Moçambique (EdM), won praise after the civil war for its work in rebuilding power sector infrastructure. EDM’s generation assets were insignificant. EdM developed a good reputation for its management of the national transmission system. EdM’s performance in distribution was for many years less satisfactory, leading the Government and donors to discuss the option of privatising distribution. But from 2001 and onwards heavy donor investments in capacity building and in new equipment started to pay off. System losses started to go down, while the number of new annual connections jumped up (see chart 1). End 2001, EdM had 279,000 clients, five years later, end 2006, the number of clients had increased to 387,000. In 2006 alone, EdM added 87,000 new clients. Chart 1: Mozambique, EDM, New Connections per Year 2001 to 2006
0
10,000
20,000
30,000
40,000
50,000
60,000
70,000
80,000
90,000
100,000
1 2 3 4 5 6
Serie2
In rural electrification, Mozambique has divided the responsibility between EdM, which undertakes all rural electrification by extension from the national grid, and FUNAE, the national energy fund and agency, which funds isolated grid projects and solar PV-projects. FUNAE’s rural electrification effort is discussed in chapter 3; compared to EdM’s rural connections it is very marginal. EdM’s efforts during the five years increased the national electrification rate from 6.8% in 2001 to 8.2% in 2006. The electrification rate of Maputo, the capital, increased from 22% to 32%, see chart 2. EdM estimates that about 30% of the 237,000 new connections were in rural areas, meaning that
20 World Bank: “World Development Report 2007”

30
roughly 70,000 rural customers were connected during that period. As can be seen in chart 2, the electrification effort roughly doubled the electrification rates in the individual provinces. Thus, also from the point of view of regional equity, EdM’s efforts deserve praise. Chart 2: Electrification Rates in Mozambique by Province
Acess by province(from 2001 to 2006)
0.00%
5.00%
10.00%
15.00%
20.00%
25.00%
30.00%
35.00%
2001 2002 2003 2004 2005 2006
Ace
ss(%
)
Cabo Delgado
Niassa
Nampula
Zambézia
Tete
Manica
Sofala
Inhambane
Gaza
Maputo

31
2.3 End-Phase Rural Electrification: Morocco and Guatemala
2.3.1 Morocco: on-and off- grid electrification by national power company
Morocco’s rural electrification program is a huge success story in terms of outcome and cost-effectiveness. In 1997, when the rural population made up 45% of the national population in Morocco and the rural electrification rate was 18%, the Moroccan Government implemented the rural electrification program PERG with the objective to reach “100%” rural electrification within 10 years.21 Table 6: Morocco Basic Data Year GDP (at PPP)/capita Rural Population in % National electrification rate Rural electrification rate
1997 US$3190 45% 62% 18%
Ten years later, at the end 2007, the rural electrification rate reached 95% with the electrification of the 40,000 unserved villages in 1997 being almost completed. Responsibility for the implementation of the program was entrusted to the state-owned power company Office National de l’Electricité (ONE), which set up a dedicated rural electrification office to coordinate the program. ONE, an integrated power company, generated 36% of national power production in 2006, is “single buyer”, national transmission and system operator and distribution company. ONE has a 50% market share in final power supply; municipal and private distribution companies supply the rest. ONE collected basic data on the 40,000 unserved villages and undertook the electrification on the basis of contracts with local authorities which financed part of the cost, with ONE financing the rest. Funding for the investment program came from four national sources: (i) 30% from ONE’s own funds, (ii) 25% from a “taxe de solidarité” of 2 centimes (=0.2 eurocents) par kWh imposed on electricity consumers, (iii) 20% from local municipalities and (iv) 25% from beneficiaries. ONE used competitive pressure to keep down the cost of the rural investment projects by contracting construction firms from the Mediterranean region, not limiting itself to Morocco. Communities that were too expensive to electrify through the grid, were served by solar PV-systems. The cut-off criteria of ONE’s PERG program for rural electrification between electrification through extension of the national grid and off-grid electrification decentralized electrification was a cost of investment (MV and LV) higher than 2,500 euros per household. The first major solar PV home system-initiative, the GEF and IFC supported "Photovoltaic Market Transformation Initiative” which started in 1998, used the system purchase model: it established a credit line for PV-dealers and a credit line for micro-credits to household purchasing a PV-system.
21 Almost all information in the Morocco section is taken from Claus and Mostert (May 2007)

32
12 Moroccan PV-dealers entered this market. But as only “higher income” households accessed PV-systems in this way, the system purchase modality was not compatible with the 100% connection rate requirement of Morocco’s “final stage” rural electrification program. From 2001 PV-systems were disseminated through a “fee-for-service” concession system. Finance for the SHS-program was secured from KfW and AfD. The concessionaire provides “100%” household coverage in the concession area, disseminating 50 Wp, 75 Wp and up to 200 Wp-systems (with a refrigerator); the monthly fee paid by the recipient covers component replacement costs. A first concession program covering 16,000 households was completed in 2005 at a cost of DH 224 million (€1256 per system), a second of 16,000 at a cost of DH188 m (€717 per system) was still ongoing early 2007. The concessionaire was Temasol, a firm jointly owned by Total Energie and Electricité de France (EDF).22 By August 2006, 34,000 PV-systems had been installed in 2,333 villages. In 2007 ONE launched tenders for two other PV-projects; one for 37,000 systems, the other for 40,000 systems for a total cost of DH 1 billion (€1165 per system). When the program started, the expectation was that 8% of the rural “electrified” households, or 160,000 beneficiaries, would be served by a solar PV-home system upon completion of the program, with the other 92% being grid connected. Although the expectation for the market share of SHS-systems is being scaled down, the program made Morocco the North African leader in installed solar home systems. The ambitious rural electrification program turned the national power company ONE into a “rural electrification company of excellence”. With rural electrification in Morocco almost complete, ONE is exporting its expertise. In early 2007, ONE won the first rural electrification concession to be tendered in Senegal. ONE has electrification contracts in several African countries.
2.3.2 Guatemala: rural electrification by a private power company
When Guatemala started on its end-phase rural electrification program in 1998, the scope and scale of the country’s rural electrification challenge were similar to the one in Morocco, see the table below. But Guatemala chose a private (foreign) utility as agent to implement the program. Table 7: Guatemala Basic Data Year GDP (at PPP)/capita Rural Population in % National electrification rate Rural electrification rate
1998 US$4070 44% 64% 41%
Before the enactment of the new Electricity Law in November 1996, four actors operated on the power market in Guatemala. (i) The state-owned distribution company Empresa Eléctrica de Guatemala S.A. (EEGSA) served the urban consumers in Guatemala City and surrounding departments. (ii) The state-owned utility Instituto Nacional de Electrificación (INDE) was the dominant generator, and responsible for transmission and system operation as well as for rural electrification in distribution in areas not served by EEGSA. (iii) 18 municipal distribution
22 The tender ran into the problem that the Moroccan firms participating in the tender were judged to be too weak financially; after the evaluation of the “technical envelopes” submitted by the bidders, only the financial proposal of Temasol was opened.

33
companies serviced the 18 “major” rural cities. (iv) Independent power producers had entered the power market in the early 1990s by signing long-term PPAs with INE and EEGSA. The liberalisation and privatisation reform of the power sector split INDE’s rural distribution assets into two electricity distribution companies: DEORSA (Distribuidora Eléctrica de Oriente S.A) with 222,000 customers covering the Eastern regions and DEOCSA (Distribuidora Eléctrica de Occidente, S.A.) with 410,000 customers covering the Western rural parts of the country. The two companies’ assets were privatized by tender in 1998 with a 50-year concession to operate the distribution. The concession conditions combined regulatory and financial instruments to achieve full rural electrification within a ten years period. Both concessions were won by the Spanish power utility Union Fenosa; it paid US$101 million for an 80 percent shareholder stake in the two. Regulation was used to promote “intensification” within the two concession areas. The 1996 Electrification Law obliges distribution concessionaires to connect anybody who requests a connection and who lives within 200 meters of the distribution grid (the concession area for a distribution). The concession contract reinforced the impact of the regulatory measure by stipulating that the connection charge would be zero apart from a two months’ consumption deposit.23 Investment grants were used to promote connection of customers located outside the 200 meters concession area. The Rural Electrification Program “PER” for the extension of the rural distribution grids into un-served areas, developed by INDE, was a detailed plan for the 1999-2004 period to electrify 2,633 communities and reach 280,000 new connections. The conditions in the tender for the two rural concessions provided for the creation of a Rural Electrification Trust Fund to 100% grant finance PER’s transmission and distribution investments. The proceeds from the privatisation of the two rural concessions were to be placed into the Rural Electrification Trust Fund. The state was to double that revenue through its own funds and with loans from development banks. The scheme was ingenious: the plough-back of the proceeds into the expansion of the concession maximised the sales revenue from the privatisation. The organisation for program implementation and reimbursement of costs was equally well conceived. It ensured coordination in the planning and implementation of investments and reduced the scope for corruption in tenders for construction, equipment and materials. The tender for the concessions obliged the concessionaire to construct the transmission lines, substations and distribution system for PER on a cost reimbursement basis. The transmission lines and substations built as part of the PER would be owned and operated by INDE, and Union Fenosa be reimbursed against incurred costs. Investments in new distribution lines and household connections made through PER become part of the asset base of the concessionaire. For these, the concessionaire is not reimbursed on a cost basis, but paid a grant per connection. Originally, in 1999 Union Fenosa was awarded US$649 per new connected customer, found by dividing the forecast US$182 million investment program for distribution with the targeted number of 281,000 household connections. The level was inflation-adjusted each year based on the US inflation-index. The subsidy is US$737 in 2007, and will be US$770 in 2008. INDE monitors progress to ensure that claims for the payment of the “per connected customer subsidy” only relate to new customers that de facto lived more than 200 meters from the grid. 23 Union Fenosa recovers the costs of connections through the general allowance for capital replacement in its tariff schedule.

34
From 1998 (pre-privatisation) to 2007, Union Fenosa more than doubled its number of customers from 632,000 to 1,300,000 clients.24 Of the increase in the number of clients, 468,000 came from the 200 meter connection obligation, 200,000 from PER. The delay in implementation compared with the year 2004-target was caused by the Government’s inability to get the national Parliament to ratify the loan agreements with development banks for the Rural Electrification Trust Fund. After a fast start up to 2003, the rate of annual connections fell drastically under PER.
24 EEGSA had 700,000 customers in 2007.

35
2.4 Comparison: Rural Electrification Diamonds under Centralised Electrification
The comparison in the chart about experiences with the centralized approach to rural electrification highlights the inherent superiority of “big-push/final electrification” over “incremental initial phase
electrification”. Planning for “100%” rural electrification within a few years makes it easier to get least-cost expansion planning implemented. Regional and ethnic policy considerations can be pushed aside. The only issue of contention is supply of solar PV-systems instead of grid connections. Being a mere technical-economic optimization challenge, RE planning can be taken out of the hands of the Ministry of Energy and concentrated into the hands of the distribution- and national transmission companies. RE planning and coordination of project
implementation is more efficient because of the short time lag between planning and implementation. One can identify with great certainty when a grid comes to a community, eliminating mini-grid or PV-systems as temporary solutions. In Morocco, ONE did a great job in data collection, grid planning and negotiating required agreements with local governments. In Guatemala, the joint investment planning of INDE and Union Fenosa worked well. Despite good technical quality of its RE planners, Côte d’Ivoire gets a low score because of national technical over-regulation. Planning in Ghana was, in principle, comprehensive and of good quality, but continuity was undermined by problems with finance. Long-term planning and implementation has positive consequences for the technical supply chain. Because suppliers can look forward to a large annual demand for their services during several years, they can afford to invest in increased capacity and better know-how. Morocco scores high due to its willingness to use region-wide contracting as a means for ensuring sufficient capacity and low prices. Guatemala scores high due to efficient integration and coordination of investments: the investments in transmission lines, substations and distribution system were all done by the concessionaire on a cost reimbursement basis, although he came to own only the latter. Côte d’Ivoire scores weakest, because fluctuating annual RE investment levels under-mined efforts to develop a strong supply chain, and because the introduction of SWER-technology was not supported by imports of single-phase motors – electricity for productive uses continued to be covered by individual diesel generators. Ghana had a higher stability in investment, but over-reliance on tied credits for RE-finance reduced the market for nationally produced equipment services. In project finance all countries have positive aspects. Ghana, Côte d’Ivoire and Morocco imposed a rural electrification charge on power consumption; Guatemala used proceeds from power sector
Comparison: RE Diamonds for Centralized
Electrification
Project Finance
Supply Chain
Organisation of Supply / Electricity Service to Consumers
RE planning and
national tariff policy
MoroccoGuatemala
Côte d’Ivoire
Ghana

36
privatization to raise finance for RE. Once again Morocco and Guatemala scored highest because planning for their final push electrification included the contracting of sufficient finance for the investment program. Although Guatemala ran into problems with parliamentary approval of the necessary loans from development banks, it gets a high score for the validity of its RE-Fund approach as such. The differences in scores for the organization of electricity service – power distribution and sales in the villages – are much lower. This was to be expected as all four countries have professional utilities operating in rural areas. The separation in Côte d’Ivoire between asset ownership and operation may not be ideal, but CIE gets credit, inter alia, for its efforts to outsource revenue collection. In Ghana, the user associations play a positive role.

37
3 DECENTRALISED RURAL ELECTRIFICATION DURING EARLY INCREMENTAL ELECTRIFICATION PHASE
3.1 Institutional and Regulatory Support Structures for Decentralised Rural Electrification
3.1.1 Power sector structure and role of REA/REF
The project portfolios of “REFs” in Burkina Faso, Ethiopia, Guinea, Mali, Mozambique, Nepal and Uganda differ with regard to the inclusion of (i) grid extension projects, (ii) energy services other than electricity and (iii) renewable energy generation for the national grid. Table 8: Energy Services supported by REA/REF by Country
BF ET GN ML MZ NP UG
Rural electrification through extension of the interconnected grid Y ¿ Y Y
Isolated grid projects Y Y Y Y Y Y1) Y
Renewable energy based electrification
- generation for national grid (plant size max 20-30 MW)
- generation for isolated grids
- stand-alone systems (PV, pico-hydro, etc)
Y
Y
Y
Y
Y
Y
Y
Y
Y
Y
Y
Y
Y
Y
Y
Energy services other than electricity Y Y
1) Only projects using generation based on renewable energy The REA/REFsin the sample perform two different roles in decentralised electrification:
(i) National agency responsible for rural electrification - Burkina Faso’s Rural Electrification Fund (Fonds de Développement de l’Electrification, FDE), Mali’s AMADER (Agence Malienne pour le Développement de l'Energie Domestique et l'Electrification Rurale), and Uganda’s Rural Electrification Agency (REA). These three all have grid extension projects in their support portfolio
(ii) Institution providing support to electrification projects outside the main grid -BERD,
REB/REES, FUNAE, AEPC, with latter distinguishing it from the others by promoting only projects making use of renewable energy technologies.
The involvement of REA/REFs in grid extension projects reflects the country’s power sector structure after liberalization, which is shaped by the country’s regulatory ideology: whether the main drivers for power sector efficiency are “economies of scale and scope” or “competition and private operation”?

38
The regulatory innovation of separating “commercial” from “non-commercial concessions” was adopted in some countries, but not in others. The state has ownership involvement in the power sector in all seven countries:
• Five countries - Burkina Faso, Ethiopia, Guinea, Mozambique and Nepal - have 100% state-owned vertically integrated national power companies; the national power company in Mali is majority owned by the state.
• In generation, no private IPPs have been established in Burkina Faso, Ethiopia25, Guinea and Mali; although they are permitted by law.
• All countries kept transmission in state hands. However, the separation between transmission and distribution is defined differently: In Uganda it is 66 kV, in other countries 33 kV.
• The state-owned transmission company is single buyer in all countries, except Mozambique, which is part of the Southern African power pool.
The industry and ownership structure in the sample of countries is summarised in the table below. Table 9: Involvement of state and private actors in the national power system
BF ET GN ML MZ NP UG
Generation for the national grid
- asset ownership
- operation
S/P1) S/P1) S/P1) S/P1) S/P S/P
S/P
P
State-owned company single buyer Y Y Y Y Y Y
Transmission HV & MV6) S S S S S S S
Distribution connected to national grid
- asset ownership: MV & LV
- operation
S/C4)
C/P5)
S
S/P3)
S/P
S
S/C4)
S/C4)
S/P
P
Isolated grids
- asset ownership
- operation
C
C/P5)
C P/C2) P M/C/P C/P S/P
Explanation: S = state-owned, P = private for profit utilities, C = community owned, M = municipality owned 1) Private ownership possible according to legal and regulatory framework, but does not yet exist in practice 2) Community ownership legally possible, but no examples; state-owned company for urban, private for rural LV 3) Private investment and ownership legally possible, but no examples yet. Guinea has three regional grids. 4) Community ownership of rural LV-grids attached to inter-connected grid, state-owned company for urban 5) Mixed responsibility: private management contract with community owned utility cooperative. 6) Defined as MV-lines from 33 kV and above; in Uganda defined as 66kV and above. The regulatory framework for distribution has the greatest influence on the role of a REA/REF:
• In all countries, the state-owned power companies are no longer expected to undertake investments in isolated grids.
• In Ethiopia and Mozambique distribution through extension of the national grid is a monopoly of the national power company both for MV and for LV-lines.
• In Burkina Faso and in Nepal, the national power company has the monopoly for rural MV-distribution lines, but the ownership of attached LV-grids is entrusted to community owned
25 Private IPPs are allowed in hydropower; and in thermal power below 25MW

39
electricity cooperatives. In Nepal, the cooperatives operate the LV-system, in Burkina Faso they must contract a private operator for its operation.
• In Uganda and Mali, investments in grid extensions are to be done by private investors; but in Uganda, slow progress in private investment forced the Ministry for Energy to invest.
• In Guinea, the responsibility issue is unsolved. Ethiopia has the sector structure with the lowest level of private sector participation26. The state-owned Ethiopian Corporation (EEPCo) is a vertically integrated company engaged in electricity generation, transmission, distribution and sales and is single buyer for power output from IPPs. No IPP has been set up. Only domestic investors can invest in isolated grid systems. With EEPCo taking care of all grid extensions projects, the role of Ethiopia’s “REA/REF” is to support isolated grids and solar PV-system projects. The “relief of regional tensions” role is reflected in the budgets for grid connected and off-main grid electrification. Ethiopia allocated US$120 million to rural electrification under the Universal Electrification Access Program (UEAP) that undertakes grid extension from the interconnected system; and US$10 million to off-grid electrification. In Nepal, the state-owned National Electricity Authority, (NEA) is responsible (i) for most of the country's generation, is single-buyer for all energy generated by Independent Power Producers (IPPs), and responsible for importing power from India to meet local demand; (ii) for national transmission and dispatch, and (iii) for most distribution of electricity. NEA expands the national grid to communities whenever it is the least cost solution. In the late 1990s, the Government introduced a mixed central-/de-centralised approach to RE by extension of the national grid, called community-based electrification. In this, the expansion of the national grid into rural areas is undertaken in partnership between NEA and rural electricity user cooperatives: NEA sets up the distribution grid and has operational responsibility for the 33/11 kV distribution lines, while a community organisation manages the 0.4 kV part of the distribution system and purchases power bulk from NEA. The attraction of the “community based electrification” model is that it combines economies of scale in finance and in construction (through NEA’s involvement in these) with the micro-economic cost advantages of local management of distribution and supply. Community responsibility for distribution and sales is expected to reduce non-technical power system losses as well as the costs of metering, billing and invoicing. Communities outside the economic reach of the interconnected grid are located in isolated mountain areas. In these, water resources often permit a microhydro power plant to be build, and PV-systems represent the least cost solution for communities outside the reach of micro-hydro plants. The Government’s decision in 1997 to create, the Alternative Energy Promotion Center (AEPC), to promote, inter alia, electrification by micro-hydro and PV-systems was therefore, a logical decision Uganda has the sector structure with the highest level of private sector participation. Uganda’s Electricity Act of 1999 set the legal basis for the restructuring of the power industry. An Electricity Regulatory Authority (ERA) was established and a Regulator appointed in April 2000. In April 2001, UEB was unbundled into three independent corporate entities, one each for generation, transmission and distribution, and most of UEB’s assets, liabilities and operations were transferred to these three state-owned companies. Uganda Electricity Transmission Company (UETCL) became owner, investor and operator of transmission power lines (66 kV lines and above), single buyer, and power expansion planner. Uganda Electricity Distribution Company (UEDCL) owns the
26 See Annex I.2 for details.

40
interconnected distribution assets owned by the state, and monitors the asset maintenance of the private distribution utility UMEME, which in March 2005 received the distribution concession.27 UEDCL operates three small isolated grid concessions and maintains the rural electrification schemes funded by SIDA and implemented by MEMD. (iii) Uganda Electricity Generation Company (UECGL) monitors the maintenance of state-owned generation assets leased to Eskom and the construction of Kakira hydropower plant until its completion.28 The “lease of state-owned assets” model for privatisation was chosen to reduce the investment risk for the private concession holder. Only the interconnected distribution grid was included; isolated grids were left in UEDCL’s hands with the intention to seek private investor-operators later. The UMEME concession area was a tight 100 meters from existing grids within which there was a connection obligation, no grid extension obligation was imposed. The concession period started with an initial trial period of 1½ years at the ends of which the concession holder could withdraw without penalty. During the initial period, the private investor in Umeme was required to invest US$5 million only; the investment program for later years was about US$400 million for upgrading investments. At the time of its privatisation, UEB had 170,000 customers (almost all serviced through the interconnected distribution system) of which 80,000 lived outside the urban Kampala-Jinja-Entebbe triangle. UEB had been adding new connections at a rate of roughly 8,500 a year mainly in urban and peri-urban areas, whilst the number of national households was growing at 100,000 every year, more than half of which in rural areas. The Government’s “Rural Electrification Strategy and Plan for the years 2001-2010” was ambitious. It aimed to raise the rural electrification rate from 2% of rural households to 10% by the year 2010. The year 2010 goal called for 40,000 new consumers being serviced each year in the rural areas alone. The strategy expected that 15% of the increase in serviced households would come from “intensification” (higher connections to Umeme’s grid outside the urban triangle), 40% through extension of the interconnected grid, 25% from isolated grids and 20% from photovoltaic solar systems. Due to Umeme’s narrow concession, REA/REF, created in 2001, was entrusted with the responsibility for all grid-based rural electrification. The promotion of solar PV-systems was done by a separate program; that is, for a staggering 85% of the total rural electrification goal. From the start, achieving the year 2010 goal was “mission impossible” for REA/REF. First, grid extension projects and isolated grid projects were affected by the length of time needed to get the private sector – developer-operators and banks - sufficiently involved. The policy paper foresaw three phases: a first institution-building period with few investments, then a second period of increasing investment, followed by large scale investments when the system had become fully operational. But, the development of new institutions, capacity and rules took longer than estimated by the advisors for the REA/REF set-up. Second, the bulk of the new connections were to come from private investments in grid extensions; but these were, de facto, blocked by the application by UMEME of a single concession-wide tariff schedule and a policy of lifeline tariffs:
27 UMEME, is 56% owned by Globaleq, a subsidiary of CDC, and 44% by Eskom 28 Its business plan proposed by management includes also the rehabilitation of small hydropower plants and the construction of new small hydropower plants. Funding would come from the financial surplus UEGCL makes on interest rate income for the lease fees it receives before they are passed on to the state budget

41
- Legally, the power sector regulator could authorise separate rural tariffs for Umeme extensions beyond the existing concession, but politically it is difficult: a population living 5 kms from a village being served by the existing grid will refuse to pay tariffs to Umeme that are higher than the tariffs charged by Umeme in a neighbouring village. Grid extensions by Umeme will, therefore, be authorized as additions to the existing area concession, not as a new rural concession with a separate tariff regime. Since this regime prevents Umeme from charging cost-covering tariffs for specific projects, Umeme’s cost of supply per kWh or per customer will always be higher in grid extension projects than its revenue per kWh or customer. Thus, investments in grid extensions are with payment of normal REA/REF grants not financially attractive for Umeme.
- The option to let other private operators charge cost-covering tariffs for grid extension projects from Umeme’s concession area is not realistic either. A community would not accept to pay a tariff that is a multiple of Umeme’s tariffs; it would insist on being serviced by Umeme.29
A third barrier to investments in grid extensions came from the unexpected power capacity shortage, which developed in Uganda. Falling water levels in Lake Victoria reduced generation capacity at the Jinja based hydropower facilities from 265MW in 2003 to 120MW during most of 2006. The 250 MW Bujagali hydropower project, whose 44 months construction period was due to start in 2001, failed to be implemented: the US-based utility AES handed back its authorisation for the project.30 Construction is to begin early 2008 with another investor. It made no sense for private investors to invest in grid extensions into rural areas when, during hours of load shedding, rural areas are the first to be shut off. Political necessity forced the Government to get investments in grid extensions done despite the power shortage. The way out for the Ministry of Energy and Mines (MEM) was to negotiate the terms with Umeme for its participation in grid extension projects. MEM was to finance the investment 100% and to undertake construction and supervision (Umeme claimed its engineers were fully occupied with normal tasks). In addition, Umeme’s operating losses in the new areas
29 The problem was identified by some analysts when power sector restructuring was discussed in 1998-2000. They proposed to sub-divide the concession for the interconnected distribution grid into one urban and one or two rural concessions, which could be held by the same utility but each be a separate tariff zone. In order to reduce the difference in tariff levels between the urban and rural concession(s), a rural electrification tax was to be imposed on the consumer tariffs in the urban concession. The proceeds of the tax were to be placed in the REF. The peri-urban grid extensions from the urban concession would not have access to funds from the REF, the rural(s) would. The proposed structure offered some advantages for future electrification projects. One was the price signal to future consumers of establishing differentiated tariffs for existing consumers: tariffs in the country differed according to the cost of supply in the concession. Another was the reduction in the difference between the tariffs charged in new concessions and the existing UMEME concession. As often in politics, short-term political difficulties overrode long-term benefits; the multiple concession proposal for the inter-connected grid was rejected. UEB had for a long time priced its tariffs below its cost of supply; therefore, before the privatisation of UEB, a tariff adjustment was a political necessity, as otherwise no private company would have dared to bid for the concession. To start off a concession with a huge tariff increase would associate private operation with tariff increases and lead to an increase in non-technical losses. The Government, therefore, approved a 74% increase in the distribution tariffs from June 2001. To superimpose an electrification tax on that first increase was considered too risky. 30 The economic cost to the economy and to the Government of the capacity shortfall is huge. The Government had to invest in 150 MW diesel generator capacity and felt forced to subsidize power tariffs as the share of high cost diesel powered generation rose to 50%. The Uganda Power Sector Development Operational Project Document, released in March 2007 projects that US$734 million will have been spent between 2005 and 2011 on subsidies to cushion consumers and the economy from the shock of end user tariffs that should in reality have been in the region of US$0.26 per kilowatt hour, as against the year 2007 domestic tariff of US$0.17.

42
were to be included as a cost component in the formula leading to its annual tariff adjustment. This meant that the REA/REF mode of operation was sidelined for grid extension projects. In Burkina Faso developments led to a disconnection between a sector structure dominated by the vertically integrated state-owned power utility SONABEL and the “national rural electrification agency” mode of operation, which was chosen for the Rural Electrification Fund (FDE). When the creation of FDE was decided, it was expected that SONABEL would be privatized.31 While awaiting the privatisation of SONABEL, the Ministry of Energy with donor finance started to implement decentralised rural electrification projects under its direct management. The dual purpose was to get some electrification going and to collect practical experience with modalities for decentralised rural electrification before FDE started. By the time FDE was created and started to operate, the Government had dropped its intentions to privatise SONABEL. Yet, the Government’s decision not to privatize SONABEL did not lead to a change in the role of FDE. FDE’s mode of operation is maintained although non-privatisation made it a second best choice. The alternative of letting SONABEL be responsible for extensions from the national grid with FDE giving assistance to isolated grid- and solar PV-projects would accelerate annual investment levels and make rural projects more sustainable. Guinea chose the “affermage” route for privatisation: the state’s power sector assets were leased to the mixed public-private power company, Société Guinéenne d’Electricité de Guinée (SOGEL). When the World Bank/IDA/GEF financed Decentralised Rural Electrification (ERD) project was set up in 2002, the division for rural electrification was to be divided. SOGEL was expected to take on grid extension, while the new Fund for Decentralized Rural Electrification (FERD) and the Unit for Decentralised Rural Electrification, (BERD) were to promote isolated grid and PV-system projects. SOGEL failed within a few years. A new state-owned power company called Electricité de Guinée (EDG) has been in charge of generation, transmission and distribution since 2003. Being weak, EDG is incapable of undertaking rural grid expansion projects. Therefore, at present, Guinea has a support structure for isolated grid projects only. One can conclude that there is a logical match between the ownership and industry structure of the power sectors and the assigned roles of the REA/REFsin Ethiopia, Mali, Mozambique and Nepal. The absence of SONABEL’s privatisation in Burkina Faso ought to lead to a re-thinking about FDE’s scope of involvement in rural electrification: reducing its role to that of giving support to “off-grid spontaneous” projects only. In Guinea, the opposite is the case: the reversal of privatisation ought to lead to discussions about expanding the role of BERD to include rural grid extension projects. In Uganda, privatisation outcomes that did not live up to expectations – the Bujagali fiasco in particular – prevented REA from performing the “total rural electrification” role foreseen in the national policy papers when the REA/REF set-up was approved.
31 SONABEL was a better performing utility than UEB and EDM, yet, pressured by donors, the Government had agreed to the privatisation of SONABEL in the late-1990s. The “national rural electrification agency” mode of operation for FDE was conceived because it was believed that a SONABEL not burdened with the task of rural electrification would attract more bids.

43
3.1.2 Organisation of REA/REF and costs of operation
Legal status
The table reveals huge differences in the legal status of the national agents that are entrusted with the direct responsibility for promoting decentralised rural electrification. Table 10: Legal status of REA/REFs
BF ET GN ML MZ NP UG
1. Project Management Unit - embedded within existing RE-institution - independent unit reporting to project Steering
Committee
REES
BERD
2. Agency reporting to Ministry FDE1) AEPC2)
3. Independent Statutory Body with Board Amader FUNAE REA3)
Supporting Institutions: - Board for RE policy setting composed of
appointed stakeholder representatives - “Passive-reactive” Rural Electrification Fund
REB
REF
FERD
FER
AEDPB
REF
REB
REF
1) Reporting to Ministry of Energy, 2) Reporting to Ministry of Science and Technology, 3) Reporting to REB In Ethiopia and Guinea the executing agents are organised as “project management units”. Ethiopia’s REES has no independent status. It is embedded within Ethiopia Rural Energy Development and Promotion Center (EREDPC), the national agency responsible for rural energy, that existed prior to the creation of the REES. Guinea’s BERD is established on a trial basis as executing unit for the World Bank financed “Decentralised Rural Electrification” (ERD)-project and reports to the Steering Committee (“Comité de Pilotage”), which supervises the project. Burkina Faso’s FDE and Nepal’s AEPC are Government agencies reporting to a ministry. FDE, which is fund and agency reports to the Ministry responsible for Energy. AEPC reports to the Ministry responsible for Science and Technology. The REF is a separate legal entity supervised by the Alternative Energy Promotion Development Board composed of stakeholder representatives; the Executive Director of AEPC is head of the executive committees that manage the individual budget lines (by donor) of the REF. Mali’s Amader and Mozambique’s Funae are independent statutory bodies reporting to a board. Uganda’s REA is semi-autonomous, reporting to an outside Rural Electrification Board (REB) and to the Ministry responsible for Energy. Two countries – Burkina Faso and Mozambique – have the “rural electrification fund” acting directly as executing agency, four countries – Ethiopia, Mali, Nepal and Uganda – have set up their REF as a “passive” fund32; Guinea is likely to do the same. 32 Ethiopia’s Rural Electrification Fund (REF) was established by law in 2003 and became operational from 2005. It is the primary source of loans for off-grid rural electrification and for the grant financing of technical assistance to agents involved in these. Decisions on the use of REF-funds are taken by the Rural Electrification Board (REB) based on

44
Ethiopia, Nepal and Uganda have set up a Board, the REB (AEDPB), composed of appointed stakeholders to set the operating policies and procedures for decentralised rural electrification.
Staffing levels and organisation of work The REA/REFsshow great differences in staff size. Mali’s AMADER with a staff of 41 is the largest, the smallest is Guinea’s BERD with a staff of 12. Table 11: Number of Staff in REA/REFs
BF ET GN ML MZ NP UG
Professional staff 71) + S 9 23 15
Secretaries and support staff S 3 18 19
TOTAL Staff 12 41 34
1) Consultants hired on 1-year renewable contracts; 2) S = Staff drawn ad hoc from other institutions according to needs The differences in number of staff do not reflect differences in total resource use for the administration of decentralised rural electrification; but differences in the scope of projects and different ways of horizontal organisation. Mali’s AMADER, Mozambique’s FUNAE and Nepal’s AEPC promote also rural energy projects other than rural electrification. AMADER’s household energy unit has a staff of 10, the rural electrification unit a staff of 8. Compared to the large number of project initiatives Nepal’s AEPC is involved in, its staff of 15 professionals may seem small. In its initial years of operation, AEPC was deeply involved in running donor financed TA-programs – partly in parallel with programs financed by other donors. But increasingly, AEPC tries to disengage itself from direct involvement in TA- and dissemination programs, operating instead as a “rural energy agency”, which defines rural energy policies and instruments, identifies priority rural energy programs, seeks national and donor finance for these, monitors and evaluates the performance of donor and government financed energy programs, coordinates activities across programs and projects, and provides grant support to investment projects through the Rural Electrification Fund, REF. Donors implement rural energy development and dissemination programs with own staff hired temporarily on a project basis; AEPC monitors these. When executing programs, AEPC works directly with entrepreneurs and private industry associations; therefore AEPC has limited need for interaction with the national establishment for rural electrification, except with the Village- and District Development Committees. Ethiopia’s REES employs the smallest number of persons: seven consultants hired through one-year renewable contracts. The REES can do with a small staff because REES is embedded within the general RE-establishment, making full use, whenever needed, of specialist technical and support staff from the whole range of government agencies that are involved in rural electrification one way or the other. REES is placed inside Ethiopia Rural Energy Development and Promotion Centre (EREDPC), the Director of which heads REES also. EREEDPC has about 130 employees and covers all rural energy issues: biomass, rational use of energy, capacity building of regions, etc. . In addition to technical and secretarial staff from EREDPC, REES draws on technical experts from proposals submitted by the Rural Electrification Executive Secretariat (REES). Uganda’s structure is similar; decisions are taken by the REB based on proposals by REA.

45
EEPCO, Ministry of Water Resources, Environmental Agency, and the Cooperative Agency according to specific technical resource needs. For the financial evaluation of projects The Development Bank of Ethiopia (DBE) - the contracted Trust Agent of the Rural Electrification Fund - performs the due diligence reviews of projects and of developers on behalf of REES/REF. At the project identification and implementation level, REES works with yet other institutions. The Woreda (district) administration is the main driver for getting projects off the ground at grass root level. The FDEeral Cooperative Agency, which serves all kinds of cooperatives: coffee, oil seeds, etc. is the main conduit for passing REF-information from the REEC to the Wereda administrations through its Regional Cooperative Bureaus and for providing management training and back-up to electricity cooperatives during operation. The Regional Energy Bureaus (that are part of the regional Government) assist local communities in preparing energy projects including projects for off-grid community electrification. The Regional Energy Bureaus receive advice and guidance from EREDPC and capacity building from REEC in business plan assessment; technical assessment and administration of electricity projects. Uganda’s REA has a staff of .. of which .. are university-educated. The staff is small because REA focuses on work directly related to grid-based electrification. Support to PV-system dealers is given by a private business support consultancy, the Private Sector Foundation (PSF) under separate contract with project sponsors. Productive use enhancement activities are coordinated by a program management unit (paid for by the sponsoring donor); the activities are carried out by the pertinent ministries and TA is given by the PSF. Mozambique’s FUNAE has a staff of .. of which .. are university-educated. Staff size is larger than in Uganda, because FUNAE administers “all” decentralized electrification, including promotion of solar PV systems, and a number of rural energy projects other than electrification. The review allows two observations. Because Ethiopia has the power sector structure with the lowest level of private sector participation, its REB/REES/REF set-up makes the most intensive use of existing public structures. Nepal’s AEPC, due to its specialisation in renewable energy technology, is the institution least embedded in the conventional electrification set-up. Its light-handed form of program administration fits Nepal’s commercial culture of dynamic private entrepreneurs; in Ethiopia it would have failed.
Costs of REF/REA operation in % of total budgets for rural electrification Building up a new high-calibre supporting infrastructure capable of operating in complex environments is costly. The example of Mozambique’s FUNAE underlines this point, although one should take note that FUNAE is bound to be the “high cost case”: FUNAE’s rural energy projects other than rural electrification are very manpower demanding in preparation and implementation. During the 2002-2006 period, FUNAE’s spending on operating costs was higher than its spending on hard investments in projects. The operating costs of US$5.7 million - salaries, capacity building of staff and other operating costs – amounted to a staggering 44% of FUNAE’s total budget during the period. The US$4.5 million used on hard investments in rural energy projects represented 35% of the total budget; the soft investments of US$2.9 million in consultant assistance accounted for the remaining 22% of total spending. The composition of spending will change in future years. The amount spend on capacity building will fall in absolute terms because FUNAE has developed good capacity. Spending on projects (if donors and the Government make funds available) can increase because the Provincial Governments have set up energy planning units and because the benefits
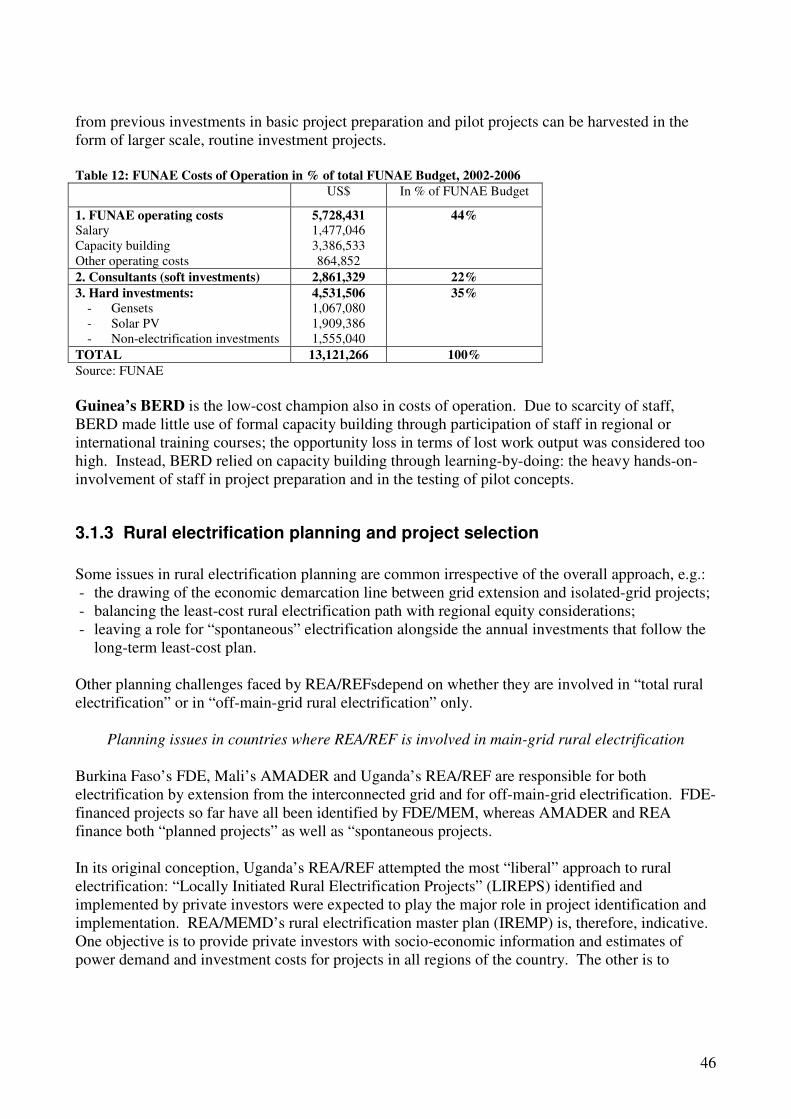
46
from previous investments in basic project preparation and pilot projects can be harvested in the form of larger scale, routine investment projects. Table 12: FUNAE Costs of Operation in % of total FUNAE Budget, 2002-2006 US$ In % of FUNAE Budget
1. FUNAE operating costs Salary Capacity building Other operating costs
5,728,431 1,477,046 3,386,533 864,852
44%
2. Consultants (soft investments) 2,861,329 22%
3. Hard investments: - Gensets - Solar PV - Non-electrification investments
4,531,506 1,067,080 1,909,386 1,555,040
35%
TOTAL 13,121,266 100% Source: FUNAE Guinea’s BERD is the low-cost champion also in costs of operation. Due to scarcity of staff, BERD made little use of formal capacity building through participation of staff in regional or international training courses; the opportunity loss in terms of lost work output was considered too high. Instead, BERD relied on capacity building through learning-by-doing: the heavy hands-on-involvement of staff in project preparation and in the testing of pilot concepts.
3.1.3 Rural electrification planning and project selection
Some issues in rural electrification planning are common irrespective of the overall approach, e.g.: - the drawing of the economic demarcation line between grid extension and isolated-grid projects; - balancing the least-cost rural electrification path with regional equity considerations; - leaving a role for “spontaneous” electrification alongside the annual investments that follow the
long-term least-cost plan. Other planning challenges faced by REA/REFsdepend on whether they are involved in “total rural electrification” or in “off-main-grid rural electrification” only.
Planning issues in countries where REA/REF is involved in main-grid rural electrification Burkina Faso’s FDE, Mali’s AMADER and Uganda’s REA/REF are responsible for both electrification by extension from the interconnected grid and for off-main-grid electrification. FDE-financed projects so far have all been identified by FDE/MEM, whereas AMADER and REA finance both “planned projects” as well as “spontaneous projects. In its original conception, Uganda’s REA/REF attempted the most “liberal” approach to rural electrification: “Locally Initiated Rural Electrification Projects” (LIREPS) identified and implemented by private investors were expected to play the major role in project identification and implementation. REA/MEMD’s rural electrification master plan (IREMP) is, therefore, indicative. One objective is to provide private investors with socio-economic information and estimates of power demand and investment costs for projects in all regions of the country. The other is to

47
provide the Government with a list of “Priority Rural Electrification Projects (PREPs)”33 that are to be tendered each year according to the time schedule outlined in IREMP.34 The PREPs make private initiative compatible with minimum requirements for least-cost and prioritized expansion planning. (i) Tendering of PREPs is thought to accelerate private investment in national priority projects compared to the alternative of letting projects evolve according to individual private initiative. (ii) The PREP concession reduces the scope for cherry picking by private investors: if an investor wants an electrification project in a PREP area, he must undertake the whole package. (iii) If no investor takes a tendered PREP, the Government undertakes the investment and contracts an operator afterwards. Although the TOR for the IREMP were written in 2001, the IREMP is still unfinished early 2008.35 One reason why IREMP took much longer time to prepare than the master plans in Ghana and Côte d’Ivoire during the 1980s is that master plans for decentralised electrification must provide more details. Private investors need reliable information if they are to bid for a PREP, or make “back-of-envelope calculation” for developing a LIREP. The Ministry of Energy and Mines (MEM) in Burkina Faso did not prepare a Rural Electrification Master Plan. Because of Burkina Faso’s rural electrification approach of small-scale distribution projects owned by community cooperatives, MEM financed studies to identify the most attractive projects based on available socio-economic data about the community (highest potential demand densities per km of LV line) and the nearness of communities to the grid. More than 50 feasibility studies were prepared for individual projects. AMADER has divided rural Mali into ten concessions areas, called ZEMs, that cover the total rural territory and are to be tendered. Unlike ASER’s 18 concessions in Senegal, the ZEMs do not follow regional administrative borders, their areas are defined by socio-economic criteria.36 The ZEMs were subject to detailed feasibility studies for AMADER’s ten-year rural electrification program. Each ZEM has a detailed “local electrification plan” for the first five year concession period, a list of projects to electrify specified villages and construct MT-lines and LV-lines, which will be the basis for the tender for the ZEM concession. Local initiatives can develop spontaneous project proposals within a ZEM, socalled PCASERs, and get grant finance from AMADER, if the ZEM concessionaire does not offer to undertaken them within the timeframe foreseen by the proposal. Planning issues in countries where REA/REF undertakes off-main-grid rural electrification only Ethiopia’s REES, Guinea’s BERD, Mozambique’s FUNAE and Nepal’s AEPC are responsible for “off-main grid electrification” only and must approve their projects with reference to the grid extension plans of the national power company.
33 In order to jump-start investments the TOR for the study also asked for the identification of five “fast track projects” which the Government could tender long before IREMP was completed. 34 Yet, even in this case the plan is indicative in the sense that a private investor can invest in a PREP in an earlier year than foreseen in the PREP and get the standard subsidies offered by REA/REF. But a “Swiss challenge” is published to verify that no other qualified investor offers better terms for the implementation of the PREP. 35 Interim products are finished: “five fast track projects” were identified and made public in 2004. 36 The “socio-economic concession concept” is that it allows the concession-holder to adjust his terms and operating modality to the local conditions in the concession: eg cotton area has seasonal income, mining has monthly income, immigration areas have often a lot of money leading to higher calls for capacity per connected customer.

48
The general rule of thumb is to implement off-main grid projects in areas which the national grid does not reach within the first five to ten years of operation. In reality, REA/REFs cannot rely on the published investment plants of the national power companies for compliance with the “5-10 years rule” because plans for individual projects can be changed at short notice. Two supplementary instruments are used for coordination. One is to approve only off-grid projects that are located at a minimum distance from the nearest grid; the other is to set up a coordination committee with representatives from REA/REF and the national power company, which meets yearly or half-yearly for mutual exchange of information about up-coming investment projects. In Ethiopia, off-grid electrification (isolated grids) is for communities located more than 50-100 km from the Ethiopian Electric Power Corporation (EEPCo) transmission lines, and which cannot be accessed by EEPCo service delivery within ten years. In Mozambique off-grid projects are for communities located more than 50 kms from EdM’s grid.37 Because the state-owned national power company had no finance for rural investments, coordination has not been an issue so far for BERD. Discussions on the preparation of a Rural Electrification Plan have started; but it would cover rural electrification by grid expansion only. AEPC’s specialisation in electrification of remote mountain communities through renewable energy technologies largely shields it from the risk of investing in projects that are made redundant soon afterwards by a connection of the community to the grid. FUNAE experienced problems when a new President upon taking office asked Government agencies to implement new investment projects within 100 days. A FUNAE investment in a village, which received solar PV-systems for homes, public buildings and water pumping was a month later connected to the national grid by EdM. REES has difficulties in getting adequate information from EEPCO about its investment plans despite the creation in 2006 of the Committee for Coordination of Rural Electrification Projects chaired by the Ministry of Mines and Energy (EEA, EEPCO, and REES are members).
Instruments for project identification In principle, all countries allow the funding of spontaneous project proposals submitted by private developers or communities, see the table below. Table 13: Modalities for project identification
BF ET GN ML MZ NP UG
Spontaneous project proposals Y1) Y1) Y Y Y Y Y
Rural Electrification Master Plan (identification of priority projects) Y2) Y
Plans for individual concessions, together covering national territory Y
National RE-feasibility studies Y
Ad-hoc project identification by REA/REF Y
Provincial & district energy planning Y Y Y Y1)
37 This distance is much longer than the economic cut-off point between electrification through grid connection and isolated grid of 15-20 km calculated by planners for Senegal’s ASER in the late 1990s and early 2000s. Electricity supply in Mozambique’s and Ethiopia’s main grid comes from hydropower, in Senegal from diesel generators.

49
Ad-hoc political dictates from ministry or President Y Y
1) No examples yet 2) Indicative off-grid rural electrification master plan But neither in Burkina Faso nor in Ethiopia examples are found yet of private initiatives. Mali’s PCASER “spontaneous project proposal” modality came about as an afterthought. It was not foreseen in the law text or in the implementing regulations. But since there was no legal basis obliging AMADER to exclude them, AMADER considers it legal to conclude such agreements. Uganda’s REA is unique in preparing a “total” rural electrification master plan, AMADER in dividing its rural territory into a number of geographic concessions, REES for preparing an indicative off-grid rural electrification master plan, FDE for its nation-wide feasibility studies, FUNAE for its ad-hoc feasibility studies. BERD and AEPC make no electrification plans nor undertake feasibility studies by own initiative.
Institutions involved in project identification The table below summarises the involvement of agents in project identification. Table 14: Agents involved in identification of decentralized power projects
BF ET GN ML MZ NP UG
Ministry of Energy Y Y
State power company Y1)
REA/REF Y Y Y Y
Provincial goverment Y Y1) Y1)
Local government/community Y Y Y1) Y Y1
Private project developer Y1 Y Y Y1) Y Y
1) No examples yet One objective of the REA/REF structure for decentralized electrification is to de-politicise the decision taking process for project identification and selection. But regional equity policy gets the Ministry of Energy involved in countries were REA/REF is responsible for “total rural electrification”. That explains the ministry’s involvement in Burkina Faso and Uganda. Mali is an exception because regional equity is addressed directly by the division of the countryside into a number of ZEM-concessions. Burkina Faso has the most centralised approach to project identification. The development of project proposals by the private sector is a theoretical possibility, but so far all financed projects were identified by DGE/MEM and FDE. The opposite situation is the case in Guinea, where project identification was done by private project developers. Ethiopia relies on provincial and district administrations to identify projects. Mozambique’s FUNAE has so far been the only actor in identification of its electrification projects. But the Ministry of Mineral Resources and Energy (MIREME) has assisted in the development of energy planning capacity at Provincial and some District Governments; these will in the future be involved increasingly in project identification. Uganda’s MEMD intends to place planning officials at district level. They would accelerate the identification of LIREPS. Because of the slow development of private investment, one may expect also the state-owned power companies to become involved in project identification.

50
Modalities for awarding projects
Some countries – e.g. Chile, see next chapter - used time-limited calls for project proposals to select the best projects for funding within a total budget for support. The seven REA/REFsallow developers to submit spontaneous project proposals year-round. That modality suits countries in the initial, incremental stages of rural electrification, when the main challenge is to get enough qualified project proposals! Choosing between qualified spontaneous project proposals within the constraints of a limited budget for support is an issue only when close to “100%” of the cost of projects is grant financed. Otherwise, “REF/REF” can bring the annual demand for grants and the annual budget for grants into balance by raising the minimum co-financing requirement. Table 15: Modalities for award of projects
BF ET GN ML MZ NP UG
Tender for specified concessions with a minimum package of obligations Y1) Y2) Y2)
Year-round approval of spontaneous project proposals Y3) Y Y Y Y3) Y Y
Projects identified and organised directly by REA/REF or ministry Y Y4) Y Y
1) Territorial concessions that together cover total national rural territory. 2) Individual “project type” concessions. 3) No examples yet. 4) Only used for specific disadvantaged regions Mali is the only country in the sample, which has divided the national rural territory into a number of geographic concessions for tendering. The tender for a private concession in Mozambique was a once-for-all pilot project. The intention was to follow up with tenders for other private concessions. But consultants failed to identify other candidate areas that were suitable for tendering.

51
3.1.4 Regulation of decentralised rural electrification concessions
Roles of ministries, power sector regulator and of REA/REF in rural regulation
Burkina Faso, Guinea and Nepal have not yet set up an independent regulator for the power sector. But the three countries foresee the creation of a regulator in the future. Table 16: Institutions involved in Regulation of Decentralized Electrification Projects
BF ET GN ML MZ NP UG
Issue of authorisations and concessions - Ministry responsible for energy - Independent Power Sector Regulator - REA/REF - Local governments by sub-delegation
Y
Y
Y
Y
Y
Y Y3)
Y
Tariff approval and monitoring of service quality - Ministry for energy / finance / trade - Independent National Power Sector Regulator - “REA/REF” - Local governments by sub-delegation
Y
Y
Y1)
Y2) Y2)
Y
Y Y4)
Technical regulation - Ministry responsible for energy - Independent Power Sector Regulator - Other
Y
Y
Y
1) BERD until national power regulator is established 2) AMADER regulates PCASER authorisations with power demands lower than 250 kVA, Commission de Régulation de l'Electricité et de l'Eau (CREE) all ZEM concessions and PCASERs larger than 250 kV. 3) Authorisation for use of local water resources in micro-hydro projects. 4) Legal option, but not yet made use of, Concessions and authorisations are issued by the ministry of Energy. The exception is Ethiopia, where the power sector regulator issues them.
Regulation by subsidy contract and by concession Overall the following picture emerges concerning the authority for tariff approval and monitoring of service quality and connections:
- In countries, where “REA/REF” undertakes “total rural electrification”, it is entrusted to the national power regulator. In Mali, responsibility is split - the Commission de Régulation de l'Electricité et de l'Eau (CREE) regulates rural electrification concessions with power demand higher than 250 kVA, AMADER concessions below that limit.
- In countries, where REA/REF undertakes “off-grid rural electrification” only, REA/REF is often given the regulatory authority for these. But Guinea’s BERD is to regulate its OPERD-concessions only until a power sector regulator has been set up.
The financing contract is the legal instrument for authorizing “REA/REF’s” involvement in regulation. Regulatory rules and obligations are imposed on the concession/authorization holder by the “concession document” and by the “financing contract” respectively. The dividing line between the content in concession documents and financing contracts differs by country. In Burkina Faso, for example, FDE’s “financing contract” includes the obligation of the COOPEL to connect all
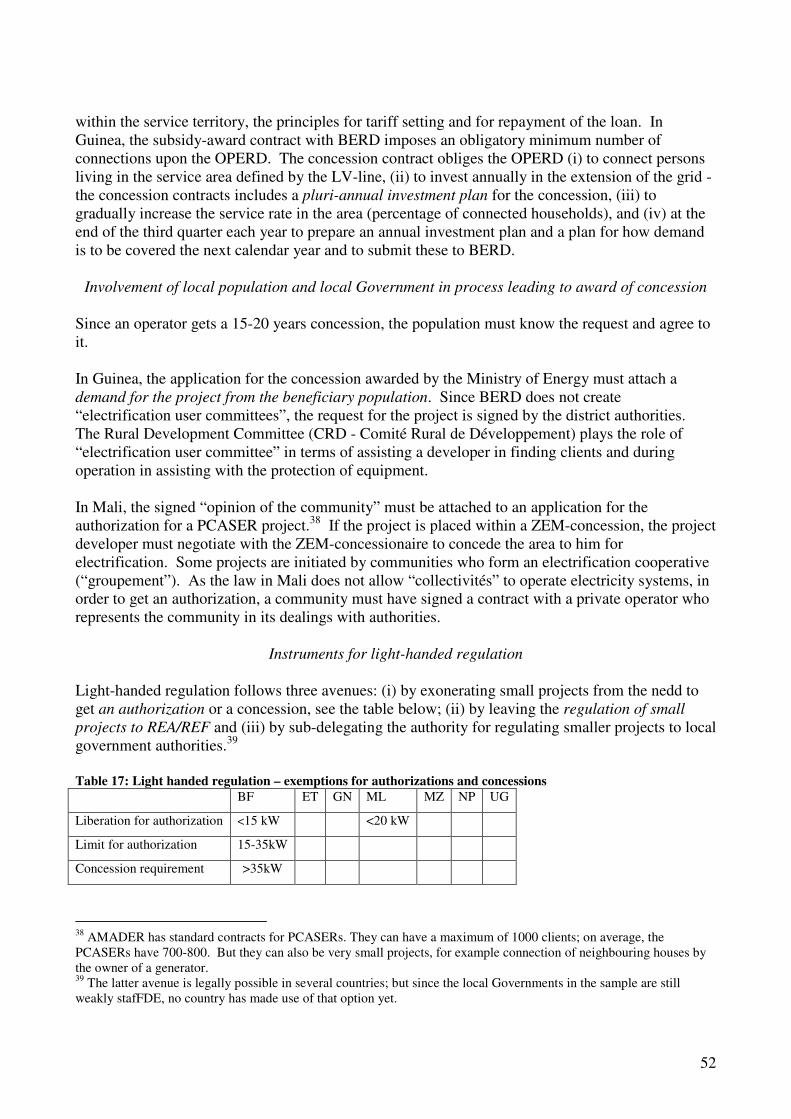
52
within the service territory, the principles for tariff setting and for repayment of the loan. In Guinea, the subsidy-award contract with BERD imposes an obligatory minimum number of connections upon the OPERD. The concession contract obliges the OPERD (i) to connect persons living in the service area defined by the LV-line, (ii) to invest annually in the extension of the grid - the concession contracts includes a pluri-annual investment plan for the concession, (iii) to gradually increase the service rate in the area (percentage of connected households), and (iv) at the end of the third quarter each year to prepare an annual investment plan and a plan for how demand is to be covered the next calendar year and to submit these to BERD.
Involvement of local population and local Government in process leading to award of concession Since an operator gets a 15-20 years concession, the population must know the request and agree to it. In Guinea, the application for the concession awarded by the Ministry of Energy must attach a demand for the project from the beneficiary population. Since BERD does not create “electrification user committees”, the request for the project is signed by the district authorities. The Rural Development Committee (CRD - Comité Rural de Développement) plays the role of “electrification user committee” in terms of assisting a developer in finding clients and during operation in assisting with the protection of equipment. In Mali, the signed “opinion of the community” must be attached to an application for the authorization for a PCASER project.38 If the project is placed within a ZEM-concession, the project developer must negotiate with the ZEM-concessionaire to concede the area to him for electrification. Some projects are initiated by communities who form an electrification cooperative (“groupement”). As the law in Mali does not allow “collectivités” to operate electricity systems, in order to get an authorization, a community must have signed a contract with a private operator who represents the community in its dealings with authorities.
Instruments for light-handed regulation Light-handed regulation follows three avenues: (i) by exonerating small projects from the nedd to get an authorization or a concession, see the table below; (ii) by leaving the regulation of small projects to REA/REF and (iii) by sub-delegating the authority for regulating smaller projects to local government authorities.39 Table 17: Light handed regulation – exemptions for authorizations and concessions
BF ET GN ML MZ NP UG
Liberation for authorization <15 kW <20 kW
Limit for authorization 15-35kW
Concession requirement >35kW
38 AMADER has standard contracts for PCASERs. They can have a maximum of 1000 clients; on average, the PCASERs have 700-800. But they can also be very small projects, for example connection of neighbouring houses by the owner of a generator. 39 The latter avenue is legally possible in several countries; but since the local Governments in the sample are still weakly stafFDE, no country has made use of that option yet.

53
Ethiopia´s Electricity law does not include provisions for light-handed regulation. The law requires any commercial power operation to be licensed and regulated, irrespective of size. The procedure is expensive for small undertakings: a feasibility study and an environmental impact assessment (EIA) must be produced; the intention to make a project must be advertised in the media for three consecutive days and has to wait for two months for objection to be lodged if any. The complex formal procedures prevent the formal engagement of small private entrepreneurs in rural electrification.40 To reduce the cost of red tape for electricity cooperatives, the Parliament issued a proclamation which relieves cooperatives from the need to procure a trade license once a cooperative is legally registered. Technically, electricity cooperatives are considered “generation for self-consumption”. Under this circumstance they just need to notify regulator and comply with safety regulations according to the electricity regulation.
Fixing and approving tariffs In Guinea, the level of the tarifs is fixed by the simulations for the business plan and agreed to by consumers in the service and finance contract signed with the OPERD. Tariffs are regulated semi-annually according to the formula fixed in the contract. If the automatic adjustment leads to an increase of more than 20%, or if one of the components in the adjustment formula has increased by more than 50% since the formula was fixed, a review is made of the tariff formula. Overall, this is the procedure followed in the other countries as well.
Monitoring service quality For monitoring of service quality, the OPERD (in Guinea) is requested to install equipment for measuring losses and to keep a register with complaints from consumers that are received.
40 Although in principle illegally, there are many private suppliers who have installed generators with capacities ranging from 5 kW to 50 kW and charge connected consumers.

54
Economic safeguards for operators of isolated grids
The legal and regulatory framework in place in most countries protects the investor-operators of isolated grid projects in case of grid connection of a community served by them: the investor-operator gets financial compensation for invested assets.
Length of time from initial preparation of project feasibility study to first supply of electricity The length of time from initial project idea to operation is very long in most countries. AMADER will within 20 working days issue a “preliminary rural electrification permit” to an applicant for a PCASER concession, which is published together with a call of interest for the project. During the next 2 months competing operators can announce their interest in the project. The project developer has then six months from the time of receiving the “preliminary permit” to conclude the detailed feasibility required for the request for the authorization and for the subsidy.

55
3.1.5 Subsidy policy for support to electrification projects
Subsidy instruments and levels
The table lists three categories of subsidies: (i) investment subsidies, (ii) subsidies to costs of operation and (iii) subsidies to renewable energy systems used for power generation (individual stand-along PV-systems and micro-hydro plants for isolated grid operation).41 Table 18: Subsidy instruments provided by REA/REFs
BF ET GN ML MZ NP UG
I. INVESTMENT SUPPORT
Grant to feasibility study 100% 100% 30% 100% ~50% 50%
Grant for grid extension (MV-lines) 100% 0% n.a. 60-80% 100% n.a. 70-100%3)
Grant for transformer + LV-grid 60-70% 0% 30% 60-80% 100% ~50% 70-80%3)
Subsidized loan, rate of interest 0% 7.5% 19.5%4)
Import duty exemption Y Y Y Y Y Y Y
Value add tax (VAT) exemption Y Y Y Y Y Y Y
Credit enhancement instruments Y
II. SUBSIDIES TO OPERATION
TVA exemption on fuels Y
Fuel subsidy Y Y
No VAT on sold electricity Y Y Y Y Y Y Y
Non income tax on profits from op. Y
SUBSIDIES TO PV-SYSTEMS
Grants to institutional PV-systems 100% 100% 75%
Solar PV water pumps 75%, Max 1kW
Grants to private PV-systems SS SS 100%5) +WpS6)
15-50% SS, €110,€88,€661)
WpS SS
Interest rate free loans to private PV 95%
Subsidies to fee-for-service N N
SUBSIDIES TO MICRO-HYDRO
Investment grant Y €110/hh2) , max €934/kW
Interest rate free loan 95%
Abbreviations: SS = system subsidy; WpS = per Wp subsidy, hh=household, n.a.=not applicable, Y=yes, N=no(ne) 1) Rates for very remote, remote, accessible areas, respectively, systems from 18 Wp and larger. 2) Plants from 5 kW-500 kW, remote villages get a transport-subsidy on top of that 3) Given as a fixed subsidy per customer + km MV-line, not as percentage. 4) Rate of inflation in Guinea is ~40% per year. 5) Village electrification. 6) Individual purchase.
41 All countries with decentralised approaches to rural electrification provide subsidized technical assistance to actors in the technical supply chain. These “indirect subsidies” to rural electrification are dealt with in the section on support to the supply chain. This section discusses only “direct subsidies” to rural electrification projects.

56
Ethiopia is unique in not giving direct investment grants to grid-based electrification; it finances 85% of the cost of investment with a soft loan, the community provides the rest. Guinea is next lowest with a 30% investment grant and a soft loan covering 50% of the cost of investment. Nepal gives investment grants of around 50%, but no soft loan finance. The investment grants in the other countries range from 60% to 100%, with the grant to MV-transport-lines (what one can call backbone infrastructure for rural electrification) normally being higher than for LV-distribution-lines. Thus, one notes that the reality of rural poverty (limited purchasing power) and low urban tariffs (making high rural-urban tariff differences a political impossibility) limits the share of private co-finance through investor equity, commercial bank-loans and community contributions to one third of the cost of investment in the best of circumstances. All countries exonerate investments in grid based power systems from payment of VAT and import duties. Governments have been hesitant to subsidize operational expenses. Whereas no country charges VAT on electricity in decentralised electrification, Mali is the only country which “subsidizes” operations through the exoneration of taxes and VAT on diesel fuel used for generation; all other countries deemed the administration of a TVA-exoneration scheme to be too complex. Mali also gives a direct fuel subsidy, Burkina Faso may introduce one. The rising cost of diesel fuels during the last four years poses a challenge for the sustainability of isolated grid systems using diesel generators; yet, the opposite policy: subsidies to diesel - would strain the state budget. A similar policy applies to fee-for-service charges for household PV-systems. In Mali, EdF operates a pilot fee-for-service project, which received not subsidies from the state; yet managed a 20% penetration rate in the service area.42 Mozambique’s FUNAE has implemented a couple of village PV-projects. In these PV-systems were handed over to households “free-of-charge”; but a small monthly fee is charged to cover the cost of after-sales-service and maintenance: thus, this is a form of fee-for-service.
Nepal is the only country with a comprehensive system for subsidies to renewable energy systems: AEPC gives subsidies to solar cookers and dryers, biogas systems, improved cooking stoves (except households mud improved cook stoves in Hills and Mid Hills of Nepal), solar PV (institutional and household systems), micro-hydro. Background reports for tariff and subsidy policy refer to the purchasing power of the rural population, normally using the cost of replaced kerosene consumption for lighting as reference figures for the rural population’s ability to pay. But although the purchasing power of the rural population in the seven countries is roughly similar, the difference in subsidy levels is huge. Only three countries – Nepal, Uganda and Mali – have defined an explicit policy for how to fix subsidy levels. Uganda, in principle, sets its subsidy rates at levels that equate the demand for subsidy funds (indirectly, the number of annual projects) with the supply of subsidy funds: if demand for subsidies exceeds the amount that is available, the tariff rates for the next year are reduced, and vice-versa. AMADER, in principle, fixes its subsidy levels with reference to two considerations: (i) to achieve connection rates of 30% (minimum for initial year) to 70% (after 15 years or more) in the service area; (ii) that the private project developer gets an 8% rate of return on his equity expressed in fixed prices; therefore, the tariffs and the subsidy per connected customer differ between projects. In practice, in both countries, the tariffs for individual projects are fixed by negotiation.
42 For EdF, the project is a loss-making operation. EdF’s high transaction costs are not covered by the project, only system financing costs and maintenance.

57
Some countries give the subsidy as a percentage of the cost of investment. Other countries fix subsidies with reference to objects: per connected customer, per km MV line, etc; in order to reduce the risk of corruption (price-manipulations in invoices). Some countries support individual purchases of solar home systems by a “$ per Wp” subsidy, others by a “$ per system” subsidy. The former allocates the highest subsidies in absolute and relative terms to the largest systems (most stop at between 55 to 100 Wp) that are purchased by the relatively rich households, Since one must assume that richer households have a lower price elasticity of demand than poorer households, the “$ per Wp” subsidy has a lower market expanding impact than the “$ per system”. Most countries, therefore, either change to a “$ per system”, or to a “$ per Wp” subsidy with declining scales. The differences in national subsidy rates and practices indicate that the principles for subsidy policy are rather vague.
3.1.6 Instruments for regional equity
Four instruments are used to promote regional equity in decentralised rural electrification.
1. Several countries give higher subsidy rates to projects in disadvantaged regions. 2. In some countries, the Ministry of Energy and or REA/REF identifies priority projects in
disadvantaged regions and acts directly as project developer for these; the concession for the operation of the project will later be out-sourced to the private sector by tender.
3. In some countries, the Ministry of Energy identifies priority projects in disadvantaged
regions, and gets the feasibility studies and draft business plans done for these. The concession for the electrification of the localities is then tendered defining the condition: number of connections, tariff and subsidy level. The bidder offering the best terms compared to the proposal is awarded the project.
4. The total rural territory in the country is divided into a number of concession areas, which
are all tendered within a one to three years period. This avoids competition between regions.
The effectiveness of the instruments depends on the specific circumstances. The policy of higher subsidy rates works well for isolated mountain communities in Nepal: entrepreneurship has a strong comparative advantage in getting these electrified. In Uganda, where spontaneous electrification has not yet taken off, MEMD uses direct investments and tenders as the means to satisfy regional equity policies. The ZEM concessions in Mali were probably not conceived as instruments for regional equity; rather it was the outcome (or side-effect) of a policy for introducing competition in rural electricity supply by having several concession areas being tendered.
3.1.7 Support by REA/REF to energy services other than electricity

58
Out of the seven decentralized structures included in the table, only two provide support also to non-electricity projects. Mali’s AMADER supports rural household energy supply and demand in general: woodfuel production, improved biomass stoves and LPG-promotion. Mozambique’s FUNAE supports the same plus improved rural kerosene and gasoline/diesel supply projects. Nepal’s Alternative Energy Promotion Centre (AEPC) / REF specializes in the promotion of renewable energy technologies for off-main grid applications: mini-grid projects using pico, micro-and minihydro, solar PV for households and public institutions, improved stoves, biogas plants for farmers and solar cookers if demand for that arises.43 Some conclusions can be drawn from Amader’s, Funae’s and AEPC’s experiences concerning the pros and cons of covering a broader range of energy products than electricity: - There are no synergy effects between electrification and non-electrification projects in the field
work of the institutions. - There are administrative synergies at headquarters. - The inclusion of household energy projects other than electricity in the portfolio of the three
institutions has probably lifted the profile of woodfuel projects in national energy policy and led to a continuity of effort.
- The strong performance of AEPC indicates that specialisation brings productivity and quality benefits.
- Funae’s involvement in a very broad range of project types shows the risks from lack of focus and spreading scarce manpower resources too thinly. The civil war in Mozambique delayed the build-up of administrative and commercial infrastructure in the rural countryside; there are wants everywhere, but few local administrations, NGOs and financial intermediaries that manage to undertake projects. Funae tries to cover perceived voids, a policy that frustrates donors who see lack of direction and priority setting: for example, that staff at FUNAE’s headquarter in Maputo give micro-credits to rural women 1000 kms away for the purchase of kerosene drums and pumpsets for hand-use.44
3.1.8 Involvement of co-financing donors in program management
Some donors try to micro-manage programs they finance. Because of World Bank procurement rules, this is often the case in World Bank financed projects and programs. In Uganda’s “Energy for Rural Transformation” program, the triangle of approval between consultants, ministries/REA and the WB (“no objection” requirement) has often delayed project implementation. For example, it took 2 years for the Ministry of Health and the World Bank to agree on the solar PV-energy packages for the different types of health clinics managed by the Ministry.
43 Outside the sample, examples of yet more specialised rural electrification funds can be found. Vietnam, for example, under a World Bank financed project tried to set up RARE, a fund for community driven micro-hydro projects for isolated communities located far from the inter-connected grid. The proposed structure proved to be too heavy on the side of involved institutions and got never off the ground. 44 There is hope for a more constructive division of labor in the future between Funae and the local Governments. The rural administrative situation is slowly improving and the Ministry of Energy is building energy planning capacity at the Provincial and District Governments, a process Funae assists. It will allow Funae to reduce its role in small-scale projects and lending to the development and implementation of pilot projects; while local Governments do the follow of assisting the larger scale implementation of project ideas that were proven to be valid.

59
3.2 Support to the Technical Supply Side The term technical supply side refers to consultants, electricians/installers and construction companies. All countries include training of actors on the supply side in their RE-programs, see the table. Table 19: Type of support provided by REA/REFs to technical supply side
BF ET GN ML MZ NP UG
Cost-sharing of capacity and training programs for private sector Y Y Y Y Y Y Y
Free-of-charge standard software for project appraisals Y
Loans to construction firms and installers Y Y Y Y Y Y
Nepal has a more than two-decade long history of systematic capacity building in renewable energy, starting with valuable technical assistance from Norway and Switzerland in the development of a national micro-hydro chain from manufacturing of turbines to O&M of these. Later, TA from the Netherlands in small biogas systems built a quality supply chain for biogas. The other six countries had to start more from the scratch; the technical supply chain was and is weak in these.45 The situation in Guinea, Burkina Faso and Ethiopia illustrates the challenge: - BERD’s data bank on the supply side early 2007 comprises 14 trained consultants (bureaux
d’études), 32 installers of which 8 are considered to de facto engage in rural electrification, and 20 equipment suppliers (not all of whom, however, supply price and other information to BERD’s data bank.
- Burkina Faso’s modality to the implementation of rural electrification projects calls for
consultants to prepare feasibility studies, engineers for supervision during construction and installers for construction and later management and operation of the installed system. The country has no tradition with supervising consultants; the capacity of site engineers is low.46 A consultant study in year 2001 concluded that only one consulting firm had the full know-how to prepare feasibility studies for rural electrification. The study identified only 15 installers and solar PV-dealers. Most firms had a staff of less than 10 persons; and only six had an annual turn-over of between €05-1.5 million. All had activities also outside the energy sector. None had prior experience in the operation of a distribution system or in generation. The study
45 The Inception Report in January 2008 of a consultant making an evaluation for MEMD of the REA/REF experience in Uganda wrote: ”Contractors cut costs mainly by hiring incompetent sub-contractors, which do not deliver. This is made possible by an unwritten principle that seems to be prevalent at the present in Uganda RE, that at the moment that you give the project away to the private sector, things will work out well. This is not the case, and calls for a stronger mandate of the REA, including instruments to control and enforce quality and for penalisation of companies in case of non-compliance.” 46 In the FDE-modality, the electricity cooperative (COOPEL) contracts a consulting engineer to assist during tendering, supervision of construction, commissioning. The engineer monitors that the works and services fixed in the contract are delivered by the contractor and that the pro-rata payments to the contractor stipulated in the contract are made according to work progress. The engineer also supports the COOPEL for a short period after the beginning of operation in its daily negotiations with the installer-operator.

60
concluded that only 2-4 of the firms were able to carry out a rural electrification project from conception to realisation. A consulting engineer is contracted by ….
- In Ethiopia, of 16 financed diesel-grid projects, six were put on hold because the cooperatives were unable to find professional technicians in the surrounding area to install the system. Getting technicians from other areas leads to 3-4 times higher installation cost than provided for in the business plan.
All countries will need to continue to support the technical supply chain for several years. The efforts of Guinea’s BERD are among the most comprehensive, which is why they are summarised below: - BERD made great efforts to expand the supply chain and increasing its productivity by offering
systematic training to all actors in the chain on a cost-shared basis - consultants, construction companies, project developers – and by making standardised software tools available to them free of charge: for the optimal dimensioning of power systems (diesel, micro-hydro and solar PV, respectively), for making the financial analysis of technology options, for preparing business plans, training in accounting (project developers) and a manual for the management of small concessions and a GIS,
- BERD closely monitors the prices for goods and services used in rural electrification, maintaining a data bank on the prices of materials and equipment, and fixing low prices for the standard services that are provided in the supply chain, e.g. by consultants and installers of connections.47 The monitoring (and capacity building) task is facilitated by BERD’s shortlist of trained, qualified consultants, equipment suppliers and installers that can participate in tenders for projects. The project developers must ask three installers for a price quotation.
47 The fee paid to an installer for installing a cupboard, for example, is 200 FG = 6 UScents

61
3.3 Project Finance for De-centralised Rural Electrification
3.3.1 Sources of Finance for REA/REFs
In the general concept for decentralised rural electrification REA/REF performs two fund raising functions: (i) To be the vehicle for channelling cross-subsidies from urban electricity consumers to rural consumers; (ii) To serve as the “basket” for donor funding of decentralised RE projects; eliminating the practice of each donor channelling funds to specific RE-projects identified in the national electrification plan and approved by the donor. A quick look at the table below reveals that none of the two functions is being fulfilled properly. Table 20: Sources of finance for REA/REFs
BF ET GN ML MZ NP UG
DOMESTIC SOURCES
REF levy on electricity consumption or generation Y1) Y Y
REF levy on electricity licences Y Y
REF levy on hydrocarbon fuels Y Y Y Y Y
Allocations from the general state budget Y2)
FOREIGN SOURCES
Single donor grants SIDA3) Danida SIDA
Multiple donor grants Danida UNDP4)
Danida NORAD
Dutch Aid EU
GEF grant Y Y Y Y Y Y Y
Soft loans from donors and development banks IDA5) IDA IDA IDA KfW
KfW IDA ADB
IDA
1) Foreseen by law but not yet levied 2) In kind only: free-of-charge offices and ad-hoc expertise from EREDPC and other Government institutions 3) For household energy 4) UNDP does not place funds in FDE, but collaborates with FDE in its multi-purpose platform project 5) Agreement in principle, but no implementation yet. Only three countries – Uganda, Mali, Burkina Faso - impose (or intend to impose) a rural electrification levy on national electricity consumption (it can be done by a levy per kWh on generation or on transmission or on retail sales. The other six countries do not use the cross-subsidisation tool. Since the RE-electricity-fee because of the rapid national growth in power demand, was to safeguard the long-term sustainability of rural electrification (be a safeguard against changing donor preferences), its absence is a serious blow to the REA/REF modality. But also in Uganda, the REF-levy plays a minor role. The 5% levy on the national transmission and single buyer company’s bulk purchases of electricity from generation plants transmission generated the

62
equivalent of US$ 750,000 per year since 2002. In 2007, the Parliament approved a one-time fund replenishment of UGX 20 billion (US$ 11.8 million) for RE. Pooling through a REA/REF need not be done through pooling of multiple donor funds in one general REF-account; a REA/REF can have specific budget lines allowing individual donors to finance specific parts of its investment and TA package. GEF has committed funds to REA/REF alongside the lead multi-lateral or bilateral donor earmarked for renewable energy projects – solar PV and micro-hydro. Yet, despite the flexibility option, only one REA/REF – Nepal’s AEPC - has managed to attract funding from multiple donors. One notes that few donors – Danida, Sida and IDA/World Bank – believed enough in the REA/REF concept to provide funding. KfW has played a small role. World Bank/IDA is clearly the strongest supporter. Weak Government commitment to the raising of cross-subsidy funds for REA/REF is one explanation for the low pooling of donor finance. In Mozambique, for example, the modest amounts from public fees and state budget funds which the Government transferred to FUNAE played a role in the loss of donor interest in FUNAE.
3.3.2 Composition of project finance
Mali and Nepal can boast of having the best presence of banks in rural areas. Mali has a well-developed system of “decentralised credit” under which the National Development Bank (“Caisse de Développement”) makes sub-contracts with banks located in rural areas for the management of credits. Nepal’s state-owned Agricultural Development Bank of Nepal has 670 branch offices; but the Maoist insurgency brought rural banking to a standstill between 2000 and 2006, otherwise, table 20 would have shown commercial bank finance of RE projects in Nepal. The weakness of rural financial intermediation is a major challenge for the REA/REF modality. It also makes the REA/REF modality interesting from a rural development point of view: because RE-projects are large by rural investment standards they offer, in principle, an interesting opening for commercial banks wishing to engage in rural finance. Table 21: Composition of Project Finance for REA/REF supported projects
BF ET GN ML MZ NP UG
Grant ~60-70% 30% 60-80% 95-100 ~70% 70-100%1)
Interest rate free loan ~30-40%
Subsidized loan 85% 50%
Commercial bank loans ~?% ~?% ~15%
Developer equity 20% ~30% ~30% ~15%
Community contribution 15% 0-5% ~30%
1) 100% when MEMD is project developer, 70% when a private company is investor Uganda has one example of “pure” commercial bank lending to RE. The West Nile Rural Electrification Company (Wenreco), owned by the Aga Khan Foundation won the 30 years concession for electrification supply in the West Nile districts of Arua and Nebbi. The investment was financed ~70% by a government grant, ~15% by Wenreco equity and ~15% by a loan to Wenreco from a commercial bank in Uganda – but first after the local bank got the green light from its headquarter office in London. The loan was given on the strength of the balance sheet of the

63
Aga Khan Foundation; it is not an example of “project finance”. The engagement of commercial banks in RE-finance faces the problem that rules imposed by the Central Bank (Bank of Uganda) limit the terms of loans to a maximum of seven years, which is too short for grid-based RE-projects. Uganda’s World Bank/IDA sponsored “energy for rural transformation” (ERT) program provided a refinancing facility at a bank account in the Bank of Uganda. It has been used in two grid based projects - mainly to extend the term of the loans provided by private banks to a period commensurate with the usual long payback time of RE investments48 - for micro financing institutions providing credits to rural consumers for the acquisition of SHS and for providing working capital for PV vendors. In Mali, banks have been involved in rural electrification projects giving loans with 5-6 years maturity with interest rates in the range of 12%-13% to PCASER projects. The strength of Mali’s financial sector is probably one reason for the ability of national firms to engage in the relatively large PCASER projects. The ZEM-concessions have a size that favours bids by foreign utilities, but local firms are participating in the pre-qualification for the first two ZEM tenders (Mopti and Ségou), early 2008. Once the ZEM concessions are being awarded, more commercial bank finance will be seen, but the co-financing involvement of local commercial banks will depend on the ability of national firms to win tenders.49 Nepal’s AEPC, Uganda’s REA/REF and Mali’s Amader collaborate with banks in general by making a refinancing facility available to qualified banks. The response of the REA/REFsof Burkina Faso, Ethiopia and Guinea to not having a local financial sector capable of providing finance for decentralised rural electrification is different: to contract a bank to manage the transfer of grants and loans to supported electrification projects and to collect the repayments on the loans from the rural utilities of behalf of the REF. The winning bank, selected by tender, is paid an annual fixed fee for its loan management service. Burkina Faso charges zero interest and gives a three years grace period, Ethiopia and Guinea charge positive rates of interest and have grace periods lower than one year. In Ethiopia and Guinea, the banks do also the financial due diligence of projects and of project developers on behalf of REF/REB and of BERD, respectively. Mozambique’s Funae has not yet defined a policy – nor modalities – for involving commercial banks in RE; but Funae tries to find MFIs (micro-finance-institutions) as collaboration partners for small energy projects. In the meantime, Funae gives and manages loans directly to project developers; not out of conviction that this is an appropriate task for Funae, but due to the difficulties encountered in finding qualified financial collaboration partners. The use of financing instruments is summarised in the table below. All, with Ethiopia being the exemption for grid-based electrification, give investment grants. Only Mozambique’s Funae administers loans to project developers directly. Ethiopia, Guinea and Burkina Faso give loans to project developers through a contracted bank. Uganda, Mali and Nepal make refinancing facilities available to qualified commercial banks. Several countries contemplate the introduction of partial
48 The ERT program introduced a credit enhancement facility specifically for helping banks extending their loans beyond the seven years. 49 Senegal attracted more private finance through its tender for ASER’s first concession, Dagana-Podor, in June 2006. The winning bidder, the state-owned Moroccan power utility Office National de l’Electricité (ONE) brings in $9.6 million in private financing, constituting about 60 percent of total financing. Some is equity, most is a loan from an Islamic Investment Bank; the Senegalese banking sector is not involved. Thus, also in this case, we see balance sheet finance, not project finance.

64
risk guarantee instruments; it is the complexity and fear of moral hazard which restrict their use. Uganda has attempted to introduce a novel credit enhancement facility.

65
Table 22: Financial instruments provided by REA/REFs
BF ET GN ML MZ NP UG
Investment grants Y Y1) Y Y Y Y Y
Long-term loans to project developers given directly Y
Loan finance for developers administered by contracted bank Y Y Y
Refinancing facility for banks Y Y2) Y
Loan / partial risk guarantee Y3) Y3) Y2) Y3)
Other credit enhancement instruments Y
1) Not to grid based electrification, only to institutional PV-systems. 2) Possible in principle but not yet used. 3) Under consideration.
3.3.3 Tariffs
The upfront connection charge has two functions in decentralised electrification. One is to co-finance the upfront cost of investment. The other is to test the ability of customers to pay. Fixing the connection charge involves trade-offs. A high charge reduces the connection rates in the service area, a low charge risks connecting households that cannot afford to pay the monthly electricity bill. The table indicates the range of the upfront connection charges: they range from €6.5 in Ethiopia (and maybe even lower in Guinea) to €192 for connection to Umeme’s “urban” grid in Uganda. Table 23: Tariff structures and levels early 2007 in Euro
BF ET GN ML MZ NP UG
UPFRONT CONNECTION COST
Internal wiring €0.5 0
Connection charge €18 €5 small €23 €1924)
Advance consumption deposit 1 m 2 m
Cooperative member fee €151) €1
CONSUMPTION TARIFFS
Fixed monthly charge for utility admin. €..
Per kWh tariff 60-70 €cents 23-30 €c €..
Fixed monthly total charge €.. €62) €..3) €7.24) €.. €..
Abbreviations: m = month (expected monthly consumption charge), €c = eurocents 1) Payment to social fund of the cooperative to finance “social extensions”. 2) For three 11 Wp lamps. 3) 8 different tariffs depending of number of appliances, levels vary by project. 4) For 300 Wp load limiter. 5) Within Umeme’s “urban” distribution system. In diesel-based generation, the debated issue for the charging of consumption tariffs is whether to charge per kWh of metered consumption or to save the costs of meters and metering. The low monthly consumption of rural consumers makes it economically rational to use load limiters; the high cost of diesel fuel, on the other hand, makes it rational to meter kWh-consumption. One could claim that the cooperative utility form, where members know that cheating by a neighbour means higher costs for oneself, facilitates use of load limiters compared to its use by a private utility.

66
In order to keep down the cost of electricity supply, the electricity cooperatives in Ethiopia use neither meter nor load limiters, only automatic circuit breakers for safety/protection. The clients pay per lamp and per appliance. For street lighting, households, including those who are not connected, paid €0.2 per month early 2007. In micro-hydro projects, which are mostly “run-of-river”, i.e. there is no water storage capacity, the trade-off does not exist: the economic optimisation issue for micro-hydro is to limit capacity, not consumption; therefore, only load limiters are used in projects supported by AEPC in Nepal. Due to the steady increase in diesel fuel prices during recent years, one must be cautious when comparing tariffs per kWh across countries: two prices quoted in the table may refer to different periods in time. But one can note that the tariffs in the FDE-supported isolated grid projects in Burkina Faso are high; reflecting the high cost of diesel fuel in rural Burkina Faso. The tariffs are more than twice as high as the tariffs charged by the state-owned utility Sonabel. They were so from the very beginning in 2004, when the social tariff of Sonabel was around 90 FCFA/kWh and COOPEL tariffs were around 250 FCFA.

67
3.4 Organisation of Electricity Supply in De-Centralised Electrification
3.4.1 Grid based electrification: on-main-grid and off-main-grid
The table below shows the huge national differences in institutional approaches to the organisation of electricity supply in decentralised rural electrification. Table 24: Organisation of Decentralised Electricity Supply – Legal and Institutional Solutions
BF ET GN ML MZ NP UG
Private utility as owner-operator Y Y Y1) Y Y
State ownership, private operator under management contract or concession Y2 Y
Municipal ownership, private operator with management contract Y1)
Municipal utility as owner-operator Y
Cooperative ownership, private operator with management contract Y Y2)
Cooperative as owner-operator Y Y2) Y
1) Only one example. 2) Possible, but not yet used. The long list of utility options in Mozambique reveals lack of decision making. Mozambique tested the private concession approach in the Vilanculos. The outcome there was overall positive, but no other sites were found that offered similar conditions for success, despite intensive search by a consultant contracted for that purpose.50 Mozambique tested a tender for private management of a municipal utility; the cost per sold kWh of the management contract turned out to be absurdly expensive. Funae, therefore, is still in search of the ideal ownership and management options for its rural electrification projects. Most of Nepal’s micro-hydro projects have community cooperatives as owner-operator; but private entrepreneur owned and managed schemes are also common. The former have slightly higher problems with sustainability during operation, the latter have bigger problems with water rights. Overall, both modalities work well. Many African countries have little faith in the cooperative power utility concept because of negative past experiences with rural cooperatives in general. Burkina Faso and Ethiopia are exceptions: in both countries the private sector is rather weak, and cooperative or public ownership solutions enjoy political support. Burkina Faso attempts to combine cooperative ownership of the distribution assets (by a socalled COOPEL) with management and operation by a technically qualified private firm. COOPELs tender a “construction and five-year operation and management” contract for the implementation of their project. On average, the COOPELs have 350 members. The COOPEL owns all assets in isolated grid projects, and the LV-distribution system and transformer in grid-connected projects. In the latter, the MV-line to connect the community with the inter-connected grid is included in the
50 Vilanculos is a high income area (tourism and agriculture), located on the coast, enjoying excellent roads – asphalted road all the way to Maputo, and generation is based on supply of locally produced low cost natural gas.

68
tendered contract. . But ownership and operation of the MV-line is handed over to the state-owned utility SONABEL upon construction. The construction & operation contract (BO – Build, Operate) is a good concept. It avoids the problem of high-cost management contracts because it is the construction business, which attracts private entrepreneurs to enter the business, not the management fee; and the COOPELs get access to the best available technical expertise: all firms that bid are installers. The private manager-operator is responsible for system operation, system safety, billing, securing payment of bills, connecting new customers to the LV-grid and extending the LV-grid. For this the operator is paid a monthly fee, which consists of one fixed amount and one amount per customer. The COOPEL has two committees that inter-act with the operator: the “grid committee” for decisions on grid extensions and connections; the “management and control committee” for management, tariff setting and accounting issues. A management consultant from the National FDEeration of Cooperatives provides assistance to the committees during the first two years of operation. Yet, although good in theory, in practice the concept encountered difficulties, reflecting the general weakness of the private sector in Burkina Faso. Of the six construction companies (installers) that won tenders for COOPEL projects, one was bankrupt and one was early 2007 about to go bankrupt. 4 COOPELs are problematic because the private entrepreneur went bankrupt. Ethiopia’s cooperative owner-and-operator modality showed strength in terms of getting projects of different sizes organised. The use of regional energy bureaus and regional cooperative offices and the provision of total debt-finance channelled through EDB (Ethiopia Development Bank) had early 2007 succeeded in getting more than 200 electricity cooperatives registered. The targeted connections in the registered cooperatives (with most investment applications still pending) range from 220 to 40,000! The cooperative modality, on the other hand, revealed weaknesses in terms of under-pricing of tariffs. In privately owned utilities the regulatory issue in tariff approval is to protect consumers against over-charging. In cooperatives, the regulatory issue is the opposite: to protect the sustainability of utility operations by preventing under-charging. Rising diesel prices caused tariffs in the first projects to fall below the cost of supply. EDB had to advise the cooperatives to double the monthly tariffs to €2 per 11 Wp light. Since the increase was too low to cover even the cost of diesel fuel, the operational hours of the diesel generators were reduced. Projects that had not yet reached the stage of implementation cut the size of planned generators in half by disallowing load-intensive productive uses of electricity. Low upfront connection charges attracted too many households with insufficient ability to pay the monthly service fee: about 25% of household consumers are unable to pay their monthly bills. Since the private sector approach in Uganda failed to implement sufficient “spontaneous projects” and tendered “Priority Projects” (PREPs)51, REA and MEMD felt compelled to experiment with other options also. One option are grid extension projects - from the inter-connected national concession area of the private distribution utility Umeme - that are co-financed by MEMD and by the beneficiary community. REA has identified a number of communities willing to finance at least 20% of the capital cost; those providing a higher contribution get higher priority. The schemes are upon completion taken over by Umeme which operates these on a commercial basis: to ensure that the operating and maintenance costs are fully covered, beneficiary communities pay a higher tariff
51 In 2004, MEMD/REA tendered five PREPs. Six firms asked for pre-qualification, three were accepted. Of the five areas, two failed to attract interest: they were located in the North and North-Eastern parts of the country in which rebel activities were a major factor hindering project sponsor interest. One area attracted the interest of all three pre-qualified firms, one attracted the interest of two, and the final one of one firm only. For various reasons, none of the three PREPs were implemented.

69
than conventional Umeme customers. Another option under investigation is the cooperative utility; a study tries to find a suitable candidate site for testing the cooperative model. Mali succeeded in getting national entrepreneurs and foreign utilities engaged in PCASER projects; several foreign utilities have expressed interest in the ZEM concessions. In view of the difficulties encountered in the private management contracts for the national power company EDM (see the Annex), this success is remarkable. Whereas PCASER projects have a maximum size of 1000 customers, with several PCASERs being close to that, the ZEMs are designed to provide at lest 10,000 customers each. Guinea’s BERD has so far succeeded in attracting only small scale entrepreneurs. The project developers of present OPEDs have diverse backgrounds: Minister of Commerce, energy equipment supplier, business women, farmers, engineers. But all originate from the district where they set up their OPED. Typically, the project idea originated with the “association of people from the district” living in the capital Conakry, who encouraged a successful businessman/woman originating from the community to engage in the electrification of their home community after hearing about ERD/BERD on television or from other media. The rate of applications per year for OPEDs is not going up. BERD, therefore, tries to encourage scaling up by getting a professional energy supplier with strong financial means into rural electrification: oil companies who have gasoline stations in rural areas with stand-alone generators and who could expand electrification from there. Contacts with TOTAL for that purpose seem to lead to a positive result. TOTAL’s Direction Développement Durable in Paris has so far paid 10 million GNF (€3000) for a socio-economic study to verify the potential.
3.4.2 Supply of solar PV-systems
All reviewed REA/REFs, except Uganda’s REA52, support the commercialization of PV-systems in rural areas, solar home systems (SHS) as well as so-called institutional systems, that is PV-systems for health clinics, water pumping and schools. The deployment strategies of the REA/REFs differ from country to country. The fee-for-service modality is the obvious deployment strategy for solar home systems for the final push-phase of RE of “100%” connection rates in service areas (e.g. Morocco). For countries in the initial RE-phases, promotion of retail sales is a logical approach; Nepal’s AEPC used a free market approach supported by a per system subsidy to install more than 70,000 SHS from 2000 to 2007. Yet, countries in the initial phase of RE, who use the area concessions approach to RE, e.g. Senegal and Mali, leave the choice of RE-technology and service modality to the concessionaires, who then use a mix of grid-based electrification and solar PV home systems on a fee-for-service basis to achieve the targeted “connection” rates. Bolivia, which is close to enter the final push phase of RE attempts an intermediate approach: tenders for subsidies to sales of SHS in designated areas, where the winner gets the monopoly not of sales, but of right to subsidies during a limited number of years.
52 Uganda’s MEMD chose to entrust the TA and grant administration of the SHS-program to the Private Sector Foundation, a business consultancy.

70
The deployment strategies for institutional systems show similar variations. Uganda deployed the systems directly through the concerned ministries of health, agriculture and education. Nepal’s AEPC entrusted ownership and operation to already established production cooperatives in the villages. Mozambique’s FUNAE issued a call for tender for the installment of 300 systems at institutions across the country. Overall, the promotion of SHS has witnessed the greatest success stories in Asia, particularly in China, Bangladesh, Nepal and Sri Lanka. In Africa hardly any success stories can be identified. In view of the large penetration of solar home PV-systems in Kenya, which succeeded largely without assistance from donor sponsored promotion programs, one can conclude that many donor-sponsored programs blocked market development rather than assisting it.

71
3.5 Results
3.5.1 Number of projects, connection rates and installed RET-capacity
The table below summarises the results achieved through decentralised approaches to electrification by end 2007. Due to heavy capacity building requirements, the upstart process in decentralised electrification is slow. Therefore, the table includes not only the projects in operation, but also projects under implementation as well as the additional number of project applications that had been received and were being processed. The experience in some countries is longer than in others (see footnotes to the table). Ethiopia’s REA/REF has the shortest experience: three years; the REA/REFsof Nepal and Mozambique have eight years of effective operating experience. Table 25: Projects under implementation or with applications being processed, end-2007
BF1) ET2) GN1) ML3) MZ4) NP4) UG7)
Grid extension projects - Projects in operation - Additional projects approved - Project applications in process
16 . .
n.a. n.a.
. . .
n.a. n.a. . . .
Isolated grid projects - Projects in operation - Additional projects approved - Project applications in process
7 . .
26 . .
11
36 . .
1 . .
. . .
3
Multi-purpose platforms - Projects in operation - Additional projects approved - Project applications in process
. .
. .
. .
20 .
.
. .
. .
. .
TOTAL INVESTMENT, €million - Projects in operation - Additional projects approved - Project applications in process
TOTAL
€. m €. m €. m €. M
€. m €. m €. m €. m
€. m €. m €. m €. m
€. m €. m €. m €. m
€. m €. m €. m €. m
€. m €. m €. m €. m
€. m €. m €. m €. m
TOTAL CONNECTIONS - Grid extensions - Isolated grids - Multi-purpose platforms TOTAL
8,000.
.
.
.
. . .
300,000
7,200
.
. 20,000
14,000
.
.
.
. . . .
. . . .
. . . .
1) 2003-2007. 2) 2005-2007. 3) 2005-2007 4) 2000-2007 5) 2002-2007 n.a.= not applicable

72
Table 26: Number of grid electrification projects, investment volume and connections, end 2007
BF1) ET2) GN1) ML3) MZ4) NP4) UG7)
Implemented projects - Grid extension projects - Isolated grid projects - Multi-purpose platforms - Solar PV concession TOTAL
. .
.
. . .
. . .
. . 1 ..
. . .
n.a.
. n.a. n.a.
.
. . .
Investment volume - Grid extension projects - Isolated grid projects - Multi-purpose platforms - Solar PV concessions TOTAL
. . .
. . .
. . .
. .
. . .
n.a.
. n.a. n.a.
.
. . . .
Achieved “connections” - Grid extension projects - Isolated grid projects - Multi-purpose platforms - Solar PV concessions - Solar PV retail sales TOTAL
. . .
. . .
. . .
6,900 9,500 5,000
21,400
. . .
n.a.
. n.a. n.a.
70,000 .
. . .
1) 2003-2007. 2) 2005-2007. 3) 2005-2007 4) 2000-2007 5) 2002-2007 n.a.= not applicable Ethiopia had February 2007, three years after the creation of REES, over 200 communities organized and registered as Electric Cooperatives. The size of investment per cooperative in the project portfolio ranges from US$26,000 to US$11 million, the number of forecast connections from 220 to 40,000. The total number of connections in the project portfolio amounts to 300,000. The REF’s technology neutral approach is reflected in the portfolio: 52% of the projects are micro/mini-hydro projects, 41% are diesel-generation based projects; 7% are projects using solar PV based systems. The numbers in the table for Burkina Faso refer only to projects under the responsibility of FDE. Prior to FDE’s creation in 2003, MEM started in 1999 to implement RE-projects making use of the decentralised project modality that later was continued by FDE. FDE had early 2007, 10 COOPELs operating (of which 4 were connected to the national grid) and another 13 about to be finalized (12 connected to the national grid). Only one “spontaneous project” had been implemented; the other are “national priority projects”. 15 multi-purpose platforms with grid had entered operation. Guinea had by May 2007, four years after the creation of BERD, 11 OPED-projects, all diesel-based, in operation with 7200 connections. Including all 56 applications for OPED-concessions that had been received, more than 20,000 connections will be reached. In Mali, by the end of 2007, AMADER had processed 144 project requests. 11 PCASER projects gave electricity service to 36 communities with 14,000 clients – a further 4 communities were about to get electricity. About 20% of connections were done by grid extension projects, the rest by isolated grid projects and PV-systems. Multifunctional platforms had been installed in 64 communities. The first two ZEMs (Mopti et Ségou) will be tendered early 2008; their implementation will add a further 10,000 new connections.

73
Mozambique’s FUNAE implemented from 2000 to 2007 … isolated grid projects, resulting in .. connections and representing an investment volume of €.. million. Nepal’s AEPC implemented from 2000 to 2007 … micro-hydro projects, resulting in .. connections and representing an investment volume of €.. million. Uganda’s REA/REF implemented from 2002 to 2007 … isolated grid projects and .. grid extension projects, resulting in .. connections and representing an investment volume of €.. million. The tariff policies – with regard to the level of upfront connection charges and monthly minimum payments – pursued by the countries, resulted in significantly different connection rates in the service areas of the local electricity companies, see the table below. Ethiopia has the highest connection rates in the service areas; but also, not surprising, the highest payment default rates. Table 27: Connection rates and payment default rates in projects supported by REA/REFs
BF ET GN ML MZ NP UG
Connection rate within one year 60-70% 60-70%
Connection rates within five years
Tariff payment default rate 25%
Promotion of solar PV-systems is part of the packages of all “REA/REFs”. Yet, as one can see in the table below, apart from Nepal, progress in the penetration of PV-systems in rural areas has been disappointingly slow. Table 28: Installed Solar PV-Systems, end 2007
BF1) ET2) GN1) ML3) MZ4) NP4) UG7)
Installed solar home PV-systems 300 70,000 5,000
Installed village PV mini-grid Diesel-PV mini-grid
.
. 1 (15 kW) .
. . .
.
. . .
.
.
Installed institutional systems - serviced schools - serviced health clinics - village water pumps
. . .
. . .
. . .
. . .
. . .
. . .
. . .
1) 2003-2007. 2) 2005-2007. 3) 2005-2007 4) 2000-2007 5) 2002-2007 Progress in the installation of micro-hydro plants and of power generation making use of biomass has been slow, as seen in the table below. Table 29: Installed generation capacity using renewable energy, end 2007
BF1) ET2) GN1) ML3) MZ4) NP4) UG7)
Hydropower for isolated grids - number of micro-hydro plants - installed capacity
n.a.
. 11
.kW
.
.
.
n.a. . . .
.
.
.
. 1
50 kW
Biomass plants selling to grid - number of plants - installed capacity
.
.
.
.
.
.
.
.
.
.
.
.
.
.
.
.
.
.
1
12 MW

74
1) 2003-2007. 2) 2005-2007. 3) 2005-2007 4) 2000-2007 5) 2002-2007 Due to 30 years of capacity building, which provided Nepal with a good turbine manufacturing and service industry for micro-hydro power plants, Nepal’s AEPC can show the largest number of implemented projects and of serviced customers during the 2000-2007 period. Ethiopia, which is equally well-endowed as Nepal with potential sites for micro- and mini-hydropower plants, has a large number of micro-hydro projects among its cooperative electricity utility projects.
Uganda’s tea and sugar-producing plants have a number of biomass-based generators installed for own-consumption of electricity. November 2007, the first expansion of biomass-based capacity exclusively for selling power to the national grid, went into operation. The sugar manufacturer, Kakira Sugar Works, started injecting 6MW of power generated by bagasse to the national grid. The capacity will be doubled to 12 MW in 2008.
3.5.2 Capacity building and costs
Table 30: Costs of REA/REF Operation, of capacity building TA and of RE-Investments, €million
BF1) ET2) GN1) ML3) MZ4) NP4) UG7)
REA/REF operating costs €4.5m
Cost of capacity building TA to actors on supply side €2.2m
Cost of subsidies and soft loans for RE-investments €3.6m6)
TOTAL: grants and soft-loans to rural electrification €10.3m
1) 2003-2007. 2) 2005-2007. 3) 2005-2007 4) 2000-2007 5) 2002-2007 6) Including investments in rural energy projects other than elecrification Table 31: Training of consultants, installers and operators, 1999 to 2007
BF1) ET2) GN1) ML3) MZ4) NP4) UG7)
Consultants trained in RE feasibility studies
Trained installers
Trained utility operators – private or cooperatives 6
PV-dealers and staff who received TA
1) 2003-2007. 2) 2005-2007. 3) 2005-2007 4) 2000-2007 5) 2002-2007
3.5.3 Cost of Investment and cost of subsidies per customer

75
Table 32: Cost of investment in € per serviced customer, excluding indirect subsidies, prices early 2007 in €
BF ET GN ML MZ NP UG
Investment per connected customer in isolated grids €870 €65-80 €600
Investment per connected customer in grid extension projects €870
Cost of solar home PV-systems (before deducting subsidies) - 20Wp systems - 40-50 Wp solar PV-systems
.
.
.
. €295
.
.
.
.
.
.
.
.
.
.
. €256 €370
.
.
.
3.5.4 Cost effectiveness of decentralised rural electrification
What conclusions can be drawn about the cost-effectiveness of the decentralised approach to rural electrification and of individual interventions? First, it certainly requires large capacity building investments upfront - in REA/REF institution building as well as in TA to the supply chain: technical supply chain, financial intermediation, utility operators. Circumstantial factors in some countries increase the share of institution building costs beyond expectations. The operating cost of Uganda’s REA/REF as a percentage of annual investments in electrification became high because potential electrification projects were blocked by the uncertainties surrounding the implementation of the Bujagali hydropower project: (i) Investments in grid connected SPPs using renewable energy – e.g. bagasse – as energy source were blocked by the expectation of the coming on stream of power from Bujagali. It made the national transmission company and single buyer disinterested in signing long-term PPAs with SPPs that involved “premium payments” compared with the future Bujagali tariffs. (ii) The national power capacity shortage caused by the delay of Bujagali, which was reinforced by falling water levels in lake Victoria, diminished the rational for grid expansion projects. Second, the cost of investment per connected customer (soft investments in project feasibility studies + investments in construction) seems not to be lower lower than in countries that use centralized approaches to rural electrification. The exceptions are Guinea, where the cost of investment in OPEDs is incredibly low, and ASER’s first concession won by ONE, where the required subsidy per connected customer turned out to be lower than expected. Thirdly, some interventions have a particularly high “soft investment/hard investment” ratio.
• The experience of Burkina Faso with multi-purpose platform projects showed high transaction costs during project preparation and implementation. 50% of the total budget was used for accompanying measures (awareness raising, mobilisation, education, etc), the cost of the hardware investment is only 40% of the total.
• The cost per beneficiary household of TA to and the promotion of solar home PV systems in all countries, except in Nepal seems to be almost absurdly high.
• Building up a capable national infrastructure for investments in micro-hydro requires a long-term effort.

76
3.6 Comparison: Rural Electrification Diamonds in De-Centralised Electrification
The comparative chart below includes only the five REA/REFs that are described in the Annexes. They provide the detailed information justifying the ranking. The chart illustrates the comparative
advantage of Nepal in decentralized rural electrification: due to decade long capacity building efforts, Nepal has the best supply chain! A reinforcing factor is the high quality of AEPC staff. Burkina Faso’s approach with community cooperative utilities signing construction plus operation and management contracts with local installers has been too difficult for the weak local supply base – in terms of numbers of firms, financial strength of firms and quality of engineering consultants - to handle. The
national RE-program is hurt twice by the weakness of its technical supply chain because the installers are used to manage and operate the installed systems as well; therefore, also the organization of supply receives a low rating. Due to its zero-rate-of-interest policy for loans, it has the least sustainable system for channeling loan finance to projects in the long term. Mali’s managed to attract foreign utilities as well as local firms with relative solid financial strength to engage in its RE program. Pushing smaller local projects while the ten country wide concessions are being prepared enabled a relatively important number of connections to be achieved. Amader’s multi-energy activities have shown interesting results, but its discretionary policies for calculating subsidy levels and charges of corruption that led to the retirement of its previous Executive Director reduce the ranking for its institutiuonal set-up. Ethiopia’s REA/REF set-up gets a high score for making excellent use of scarce specialized know-how by embedding its REA/REF within existing institutions and for having prepared a Master Plan for Off-Grid RE already by 2006. The strong set-up for organising projects and the use of 85% loan finance for projects drives the implementation rate of projects forward. The system of financial intermediation receives a positive rating because of the use of a professional bank for the administration of loans and the financial appraisal of applications. But the technical supply chain is weak in rural areas and the cooperative utilities charge tariffs below their costs of operation and low connection charges attract households to connect who are unable to pay the monthly electricity bills. Guinea manages to get results because of the quality of BERD’s TA to project developers (the supply chain as such is weak, but solid software and other TA support, including market monitoring by BERD, manages to solve many obstacles in practice) and of BERD’s collaboration with a local bank in providing loans to projects.
RE Diamonds for De-Centralized Electrification
FinancialIntermediation
Supply Chain
Organisation of Supply / Electricity Service to Consumers
REF/REA and
Subsidy Policy
Burkina Faso
Guinea
Nepal
Ethiopia
Mali

77

78
4 DECENTRALISED END-PHASE RURAL ELECTRIFICATION: CHILE’S PER
In Chile, the electric sector was privatised in the early 1980’s – before the process took off in the UK! In 1994, when 86 percent of the population was urban, the Government of Chile (GOC) initiated the the Programa de Electrificación Rural (PER) to increase rural electric coverage from approximately 53% to “100”% within ten years. 53 Based on the figures from the 1992 national census the number of unserved rural households was estimated at 240,000. Table 33: Chile Basic Data Year GDP (at PPP)/capita Rural Population in % National electrification rate Rural electrification rate
1995 US$95201) 14% 93% 53%
1) Source World Bank: “World Development Report 1997” Compared with the other country examples in this report, Chile had the highest per capita income and urbanisation rate when it embarked on “final rural electrification”. The rest-electrification challenge, therefore, was lower. The power sector situation in Chile was unique in two other aspects. First, in contrast to most countries, the Chilean electric code does not allow concessions for a distinct geographical service territory. In rural areas one can see two similar primary distribution lines parallel to each other, distinguishable by the particular company-specific design details. The situation meant that RE cannot be imposed by regulatory obligation. Secondly, investments in RE depended on financial support to projects by local utilities from Regional Governments, who drew money for that from the national Regional Development Fund, FNDR (Fondo Nacional de Desarrollo Regional). FNDR, which is financed by a mix of Government funds and loans from the Inter-American Development Bank, provides annual block grant funding to each region for a wide range of infrastructure activities, including water provision, health services, and road development in addition to electrification. The amount for each activity is figured for each region in accordance with the projected need in that region, as well as some basic measure of the regional government's demonstrated ability to utilise the funds cost-effectively. But in the end, the regional Government decides how the block grant is divided per sector. In 1995 the Government adopted PER within the framework of its national program against poverty and created a special fund for RE (FNDR-ER), which provided grant finance specifically for RE on top of FNDR funds. The investment cost of PER was estimated at US$500 million, that is at US$2100 per beneficiary household. PER set regional goals for electrification coverage. At the regional level, the local government receives project proposals from electric utilities and cooperatives active there, which compete for these limited sector-specific grant funds. The regional government forms a portfolio of potential projects, within which a prioritisation is done.
53 Main source for this section: Joseph Andrew McAllister: Renewables in the Electrification Mix: the Chilean Rural Electrification Programme, Berkeley, 1999 plus another study, unfortunately by unknown author.

79
The Ministry of Planning and Coordination (MIDEPLAN), a FDEeral agency based in Santiago, provided the evaluation methodology for the long-term benefit/cost analysis from both economic and financial perspectives, upon which the prioritisation of potential projects in each region is based. The methodology calculates the grant finance for the project needed to provide the utility with a normal rate of return for the project. An innovative characteristic of the methodology were efforts to include various technological options, including renewable energy technologies, within a single evaluation framework. Within each region, the methodology is applied by SERPLAC (Regional Secretariat of Planning and Coordination), which is effectively the local representative of MIDEPLAN. Once the construction phase of a given project is complete, a SERPLAC rural electrification specialist reviews the project and certifies compliance with the agreed-upon project indicators. In principle, PER is designed to promote competition between private electric utilities for access to government funds: - The projects that provide the greatest number of new electric connections with the lowest
FNDR subsidy per connection54 are funded in a progressive fashion, until the subsidy funds for that year are exhausted (competition between projects).55
- A utility prepares a feasibility study and presents its project proposal to SERPLAC, but other utilities can then bid for the project also (competition for projects).
Yet, real competition was limited. During a period of program implementation of 200 projects, 10 had been contested, of which 2 were won by a utility other than the one which submitted the proposal. Knowing that competition was limited, utilities systematically overestimated construction costs in their feasibility studies and underestimated load growth over time in attempts to maximise the grant for their projects. SERPLAC’s rural electrification specialists, who reviewed the project proposals, were forced into thorough discussions with utilities to bring estimates more in line with reality. Thus, the primary driver to reduce grant payments was not competition; it was the review process itself, similar to the process under “conventional utility regulation”. The methodology of approving projects by their individual benefit-cost ratio did not necessarily lead to an expansion path in line with least-cost grid expansion planning. That was also a subject of discussion between SERPLAC officials and utilities. What drove the utilities into rural electrification were not the profits of the distribution activity as such, but access to the construction business of the projects: all utilities had their own construction units. Overall, one can conclude that the PER-approach was well adapted to the specific Chilean regulatory and regional planning environment. The absence of territorial service concessions made the use of regulatory tools for enforcing rural investments virtually impossible. The established FNDR procedures for the planning and approval of regional infrastructure projects provided an avenue for getting rural electrification done through economic incentives. But compared to the results achieved in countries with centralised approaches to end-phase rural electrification, the PER approach looks cumbersome. 54 In theory, within the methodology, projects with the highest net present social value per subsidy are chosen. 55 In reality, a certain amount of political negotiation happens at the regional level resulting in some deviation from the strictly economic prioritisation.

80
ANNEX I: CASE STUDIES OF RURAL ELECTRIFICATION EXPERIENCES
I.1 Burkina Faso: Community Asset Ownership with outsourced Management & Operation
Specific Characteristics of Burkina Faso’s Approach
Burkina Faso’s Rural Electrification Fund, FDE, is responsible for rural electrification, whereas the state-owned power company SONABEL electrifies peri-urban areas around its grids. The Government expects that the majority of FDE’s funding for rural electrification during the next 25 years will be for electrification via extension of the integrated grid; next in expected importance are investments in multiple purpose platforms, third are isolated grid projects, and last solar PV-systems. FDE funds 100% of the cost of rural electrification projects through a mixture of upfront investment grants and interest rate free loans. Supported electrification projects are implemented by electricity cooperatives created by the beneficiary communities and operated by private firms under an “investment plus 5 year O&M” contract. Supported platform projects are owned and operated by the Women Associations.
General Information about Burkina Faso Burkina Faso has in year 2007 a population of 13m, growing 3.2% per year. The national population density is 48 persons per sq.km. with substantial regional variations in terms of rural population density. The Plateau Central, the Northern Region and Mouhoun are densely inhabited (>50 rural inhabitants ruraux/km2), whereas the Sahel, the East and certain parts of the Western and Southern regions have population densities below 20 rural inhabitants/km2). Gross national income (GNI) per capita in 2005 was US$400 (nominal) and US$1220 (at purchasing power parity).56 After many years with GDP growth being barely higher than the growth rate of the population, the economy has grown around 5% per year since 2002. The annual inflation rates are in the range of 2.5% to 5% per year.57 About 20% of the population lives in urban areas, defined as cities with more than 10,000 inhabitants, the rest is referred to as rural. Assuming that an average household consists of 8 persons, the national electrification rate in Burkina Faso in 2005 was about 17%, and mainly an urban phenomenon. Roughly 75% of the urban population was connected to an electricity system, versus 3% of the rural. Annual electricity consumption per capita was 46 kWh in 2007. With poverty being defined by incomes in 2003 of below 83,000 FCFA (€127) per adult household member per year, Burkina Faso’s poverty rate in 2005 was 46%, the national poverty eradication strategy aims to reduce that to 35% by 2015. 56 World Bank: “World Development Report 2007” 57 Burkina Faso shares its currency, the CFA franc, with other members of the West Africa Monetary Union (UEMOA). On January 1st 1999 the CFA franc became tied to the euro at a fixed exchange rate of CFA656:€1

81
Power Sector Restructuring and Privatisation in Burkina Faso In 2007, the vertically integrated state-owned power company SONABEL is outside the rural areas the only generation, transmission and distribution company, responsible for the electrification of the two “large” regional grids of Ouagadougou (CERCO) and of Bobo-Dioulasso (BOCO) and of 30 administrative centers. More than two thirds of SONABEL’s sales take place in the Ouagadougou grid, about one fourth in the Bobo-Dioulasso grid and less than one tenth in the “centres isolés”. In 2006, SONABEL, had a staff 1421 persons, 223 MW generation capacity (4 hydro and 29 thermal power plants), 1818 km HV lines and 5297 km of LV lines to serve 797 medium voltage clients and 284,000 low-voltage clients. SONABEL’s turnover in 2006 was 65 billion FCFA (€98 million). Burkina Faso is via the Ferkolasso - Bobo-Dioulasso – Ouagadougou transmission lines connected to the power system of Côte d’Ivoire, while a few minor locations close to the border with Ghana, are supplied by the power grid of Ghana. In 2006, when the transmission line to Ouagadougou was not yet completed, Burkina Faso imported 139 GWh, the thermal power plants (diesel) generated 468 GWh the hydropower plants 81 GWh.
At the technical level, SONABEL is one of the best managed power companies in Africa South of Sahara: the level of system losses (technical and non technical) is around 16% and the rate of collection on revenues around 96%.58 Yet, because the politically fixed power tariffs (unchanged between 1994 and 2004), were inadequate to cover SONABEL’s full costs of supply, SONABEL was unable to self-finance the minimum 20% of new investments in distribution, transmission and generation, which co-financing donors asked for. This forced the company to hold back on priority
58 The level of accounts receivable represented 5 months of turnover in 2004, mainly caused with difficulties in collecting money owed by public authorities.

82
investments with the result that ad-hoc investments in generation went from one “urgently” needed peak capacity investment to the next. Donors started to engage the Government in discussions about the possible de-monopolisation of the power sector and the privatisation of SONABEL. The “1998 Electricity Law” (loi n°060/98/AN du 17/12/1998) abolished its national monopoly on power supply, authorised the setting up of local distribution companies in unserved areas, asked for the creation of an “Electrification Development Fund” (“Fonds de Développement de l’Electrification, FDE) and of a power sector regulator, and introduced the single buyer model. A first attempt at private investment was made with a call for tender for a 15 MW diesel power plant in Ouagadougou to avoid an emerging capacity shortage. Yet, the “capacity cum kWh-price” offered by the winning bidder, the Aga Khan Foundation, was doomed by the government to be too costly and a donor (Danida) was found to finance a traditional project with SONABEL as investor-operator. The Energy Policy letter adopted by the Cabinet in December 2000 included the intent to privatise SONABEL and in 2001, the Parliament (Assemblée Nationale) passed Law 015-2001 on the “Privatisation of Public Companies” which authorised the Government to privatise, inter alia, SONABEL. A new Electricity Law adopted in 2005 (“loi 016-2005-AN ») replaced the 1998 Electricity Law. The law distinguishes between two electrification segments: segment 1 which comprises urban distribution and the national transmission system and segment 2 rural electrification. It authorises the Government to set up a state-owned power asset company (“Société de patrimoine”) to hold all existing state-owned power assets and invest in new power infrastructure and in the rehabilitation of worn out assets. The asset company is to seek donor loans for its investments. Its investment program, basically in transmission, will be guided by a performance contract (“contrat plan”) signed with the Minister of Energy. SONABEL is to be transformed into an operator company (“société fermière”) and get the operating contract (“contrat d’affermage”) for the assets held by the asset company. Distribution investments are undertaken by SONABEL, subject to approval by the asset company, and remain state property. SONABEL will also be system operator responsible for strategic investment planning and make recommendations to the asset company about these, including the preparation of annual demand forecasts. The majority shares of SONABEL are to be held by a private strategic investor. A regulator is to be created, but the Ministry of Commerce and the Tariff Commission continue their role in the approval of tariffs. By 2007 no privatisation of SONABEL had been attempted and the Government was re-evaluating the 2005 Electricity Law; a wise decision as the law created an inefficient structure of over-lapping responsibilities. Privatisation was never a Government agenda, it was donor driven and bad experiences with privatisation of power companies in Africa cooled its enthusiasm. Besides, SONABEL was, taking into account its financial situation, a quite effective company.
Expected Scope of Rural Electrification Strategy and supported Technologies SONABEL had added 16-17,000 new connections per year since 1998. The effort lifted the national electrification rate, but since the number of households nationwide increases by 50,000 a year, the number of unserved households expanded. The ”2004-06 National Plan to fight poverty”

83
fixed the objective of 20,000 electrified households per year, which amounts to an annual 1.2% progression in the national electrification rate.59 Burkina Faso’s rural electrification strategy is based on the premise that rural electrification by grid connection is the least cost option for communities located within 50-60 km from the nearest 33 kV-line, which Sonabel uses for its rural “backbone” grid. A discussion paper made by the Ministry of Energy based on the above hypothesis concluded that it would be possible to electrify 70% of the rural population via connection to the grid within the next 25 years.60 These 70% live on the 50% of the national territory which is relatively densely populated. The study estimates that 15% of the rural population can be reached by connecting their villages to the existing 520 km rural 33 kV backbone grid, while a further 30% of the rural population would come within reach of the backbone grid by constructing an additional 1050 km between 2007 and 2017 (“Zone 1”). The construction of 750 km MV-lines after the 10th year and before the 25th would bring an additional 25% of the rural population within reach of the grid (“Zone 2”). The population “in zone 2” lives in 1950 villages of which 200 have a population of more than 4000 inhabitants, the other 1750 have on average a population of 1000 inhabitants. Table 34: Burkina Faso, investment strategy
Km existing ”back-bone” grid
km to be constructed within next 10 years
to be constructed after 10 and before 25 years
km "back-bone" grid (mainly 33 kV) 520 km 1050 km 755 km % of rural territory than can be served from the "back-bone" grid 11% 22% 17% Percentage of rural population that can be served from "back-bone" grid 15% 30% 25% Number of villages (“localités”) in area 1950 Served households at 50% connection rate 281,000 The paper hypothesizes that the cost of investment per connected customer would be $650 (=€496 = 325,000 FCFA)61, and that the average connection rate (percentage of serviced population) in the electrified service areas would amount to 50%. The strategy proposed in the paper proposes a specific approach for each of the three zones:
• The zone 1 villages would be electrified by grid connection at a cost of €140 million; connecting 281,000 households (=€498/hh).
• In zone 2, the 200 largest villages would in the first instance be served by the interim solution of an isolated grid served by a diesel generator, connecting 50,000 households at a cost of investment of €21 million (=€420/hh). The other 1750 villages would be served by multipurpose platforms with a mini-grid attached; the cost of investment for the beneficiary 223,000 households (all households in the villages will directly or indirectly be beneficiary) would amount to €40 million (€179/hh). Connecting all 1950 villages at a later time to the
59 The priority areas of the CLSP are: basic education, health, water supply and rural development (including food security), private sector and SME development, protecting the environment, improving living conditions through sanitation and rural energy, combating HIV/AIDS, improving public safety, building national capacity and access to information technology. 60 “Esquisse et costing d'une approche stratégique ERD globale pour le Burkina Faso couvrant l'ensemble du territoire sur un horizon de 25 ans », by Jean-Paul Laude, adviser to the Minister of Energy. 61 According to the study, the US$650 estimate does not include the cost of the backbone grid. It would add less than 10% to the cost.

84
national grid would require addition investments of €46 million (€34 million for the feeder lines, €13 million for the backbone grid itself.
• Zone 3 comprises 2950 villages of which 250 are “larger”, 1300 average 1250 inhabitants and 1400 are “small”. The paper suggests that the 250 villages be served by isolated grids, at a cost of €23 million. The 1300 villages by multi-purpose platforms with attached mini-grid at a cost of €30 million. The 1400 villages are to be served by solar PV-systems: 44,000 individual and 2800 collective systems at a total cost of €31 million. Since the mini-grids are not short-term transitional solutions, the grids are preferably to be served by generation using renewable energy sources: mini/micro-hydro, bio-diesel or agricultural waste.
Table 35: Burkina Faso Investment 2007-2032 by Type of Region
Investment In % Population in %
Zone 1 €139 million 42% 45%
Zone 2 €108 million 33% 25%
Zone 3 €84 million 25% 30%
TOTAL €331 million 100% 100%
The discussion paper estimates that it should be possible to have 200 to 230 rural “localités” electrified by 2016, serving 270,000 rural households (=12% of national population) directly or indirectly. In terms of energy consumption, the rural consumption in 2016 would equal a little more than 5.3 % of the urban consumption. But it would help lifting the national electrification rate in 2016 to 40%. Being a discussion note, the political relevance of the strategy outlined in the paper should not be over-interpreted. But it shows the investment challenge in providing a cost-benefit justified service level to the rural population within a 25 years period: investments of €13 million per year would be called for. The regional balance shown in the table above is reasonable: most of the money is invested in the “least-cost-per-connected-customer” zone 1. The technology balance is reasonable: most funds are used for rural electrification by extension of the national grid, next are multi-purpose platforms with mini-grids, see table below.
Table 36: Burkina Faso Investment 2007-2032 by Type of Technology Technology Investment in %
Connection to national grid €186 million 56%
Interim isolated grids €21 million 6%
Long term isolated grids €23 million 7%
Platforms with mini-grid €70 million 21%
Solar PV-systems €32 million 9%
TOTAL €331 million 100%
A typical multi-purpose platform project has a cost of investment – not including the cost of project preparation and of TA - of €20,000-27,000. It comprises a diesel motor with 12-15 HP, two to three corn milling machines and grinders, a generator of 8-10 kVA which supplies a battery charger and a LV-distribution of 4 km. The distribution grid provides power to 50-100 households having a

85
demand of maximum 100-150 ampère; productive user demand comes from charging of mobile phones, welding, water pumping from a well, bars.
Institutional Responsibilities for Rural Electrification In the post-2003 institutional set up, SONABEL undertakes the electrification of peri-urban areas only; rural distribution projects are undertaken by FDE. Yet, one should note that the number of “electrified localités” served by SONABEL increased from 53 to 64 from 2003 to 2006. SONABEL continues to be involved in rural electrification by virtue of it being the national transmission company and supplier of bulk power to electricity cooperatives. Ownership and operation of 33 kV rural transmission lines constructed by decentralised rural electrification projects to connect new distribution systems to the national grid is handed over to SONABEL upon completion. The Energy Department (“Direction Générale de l’Energie, DGE”) of the Ministry of Energy and Mines (MEM, Ministère de l’Energie et des Mines) is responsible for the national electrification strategy and for monitoring its implementation. After the de-monopolization of electricity supply in 1998, DGE became directly involved in the implementation of some ten decentralised rural electrification projects. DGE tested the concept using different modalities to implement rural electrification projects that were financed by different donors (EU, France, Denmark, Spain). DGE, inter alia, implemented in 1999 the Spanish bilateral aid financed project for installing solar PV systems at 125 administrative centers (“chefs lieu de department”). The socio-economic studies and pre-feasibility studies of 30 communities (“localités”) made for DGE from 2000 to 2001 for the purpose of identifying high priority projects to implement are part of the data bank used by FDE. The Ministry of Agriculture implemented in 1998-1999 some IED/GERED financed decentralised rural electrification projects in the regions of Ganzourgou and the South-West. The decentralisation of public administration is still in its development stage in Burkina Faso. Some 300 “communes” are to be created. The Law for Decentralisation of Public Administration (“loi No 041/98/AN) defines in its articles 88 and 89 (about water and electricity) the competences of the provinces and of the communes in rural electrification as “giving an opinion about rural electrification plans”. The Communes are in addition responsible for the realisation of public lighting. The National FDEeration of Cooperatives gives courses to COOPELs in tariffs and gives advise in their relationship with the operator. The “Association for Capacity Building for Rural Development” (“Association Formation Développement Rurale, AFDR”) gives technical and management assistance to Women Groups that own and operate multipurpose platforms.
Fonds de Développement de l’Electrification (FDE) The Rural Electrification Fund (“Fonds de Développement de l’Electrification, FDE) was created by Presidential Decree (Décret 2003/089), established in 2004 and became operational in 2005. The objectives of the Fund are to facilitate the rural population’s access to electrification by providing loan guarantees and subsidies to rural electrification investments and preparatory studies.

86
According to its founding decree the sources of funding for FDE are: (i) a rural electrification fee to be levied on the kWh-consumption of all national consumers, (ii) fees from power sector concessions and revenue from penalties, (iii) donors, (iv) contributions from Ministry of Finance. FDE is a legal person which refers to the Ministry of Energy for technical supervision and to Ministry of Finance for financial supervision. The Minister of Energy signs a tri-annual performance contract with FDE. The “contrat plan” defines how many village electrification and platform projects the FDE is expected to implement per year. The governing structure comprises a General Assembly composed of stakeholders excluding donors and a Board composed of stakeholder representatives including a non-voting donor representative. The Chairman of the Board is appointed by the Cabinet upon proposal by the Minister of Energy. Upon proposals submitted by FDE’s Executive Director, the Board takes decisions on project eligibility criteria, subsidy levels and criteria, and the composition of FDE’s annual budget. FDE has in 2007 a staff of 11 persons, of which 8 are university educated. The Executive Director of FDE is appointed by the Cabinet. FDE is divided into three divisions: Administration, Accounting62, Technical; the latter subdivided into “planning and O&M”, “monitoring of investments” (“Service de Contrôle et de Réception des Ouvrages”), “legal affairs”, “communication and capacity building”. The FDE’s budget for the first three years from 2005-2007 amounted to €8.6 million. The largest source of finance was Danida (Danish bilateral aid) which had made €5.6 million available for the three years, the Burkinabe Government made €3 million available. FDE collaborates with UNDP in the $10.8 million project to install 400 multipurpose platforms between 2005 and 2008.
FDE project cycle and organisation of decentralised electricity service The founding decree authorizes FDE to finance (i) priority electrification projects identified at central level and (ii) “spontaneous projects” identified by local initiative either by a community or by a private entrepreneur. For priority project identification and preparation, FDE follows the procedure which DGE used for its decentralised rural electrification activities:
- The most attractive projects are identified based on available socio-economic data about the community and the nearness of communities to the grid.
- FDE next hires consultants to contact the identified priority communities and persuade the local population to form an electricity cooperative, in Burkinabe-terminology called COOPEL (Coopérative d’Électricité), and to send an application to FDE for the financing of the feasibility study for the electrification of their community.
- Upon completion of the feasibility study, the COOPEL submits an application for the required investment finance to FDE.
62 The « agent comptable » is seconded from the Ministry of Finance to monitor the handling of accounts in accordance with the rules for public funds.

87
The COOPEL (i) holds the concession for the distribution license for the project, (ii) is employer (“Maître d’Ouvrage”) for the construction works and (iii) owner of the distribution and generation infrastructure that is constructed with FDE-financial support. As FDE does not entrust the management of operation and maintenance to the COOPELs, the COOPEL must sign an O&M contract with a private operator. The tender for the rural electrification project of a COOPEL is, therefore, a “construction and five-year operation and management” contract, which only pre-qualified firms can bid on. Qualification criteria comprise financial soundness, technical know-how, to be registered at Chambers of Commerce and having paid taxes. All operators in Burkina Faso, therefore, are installers. The modality is logical as it is hardly likely that an operator’s contract without the construction part would be sufficient to attract qualified private entrepreneurs to enter the business. A consulting engineer, after tendering, is contracted by COOPEL under a socalled “Maître d’ouvrage et d’oeuvre délégué /Assistance conseil et accompagnement” (MOOD/ACA) contract to assist during tendering, supervision of construction, commissioning. The consulting engineer monitors that the works and services fixed in the contract are delivered by the contractor and that the pro-rata payments to the contractor stipulated in the contract are made according to work progress. The ACA also supports the COOPEL for a period after the beginning of operation. The consulting engineer and the President of the COOPEL have dual signature when accepting payment of a bill from the contractor. FDE’s accounting officer checks the management of funds according to Government rules. The technical unit of FDE controls the performance of the work undertaken by the consulting engineer. The “soft costs” per COOPEL project are around 45 million FCFA (=€69,000): 30 million FCFA (€46,000) for the preparation of the feasibility studies and the COOPEL business plan and 15 million FCFA (€23,000) for the MOOD/ACA contract (site engineer up to commissioning and short period after commissioning). FDE is optimistic that the time passing from the signing of an investment contract with a COOPEL to the start of operation can be brought down to 9 months. During the implementation of DNE’s pilot projects the time took much longer. An example: the result of the tenders for the Gayery and Seytenga projects was announced end of November 2002; in February 2003 the construction work started, operation started in May 2004 and the first electricity bills were sent out July 2004. For grid-connected projects, the MV-line to connect the community with the inter-connected grid is included in the contractor’s construction and management contract; but ownership and operation of the line upon construction is handed over to SONABEL.63 During operation, the operator (« fermier ») is responsible for system operation, system safety, billing, securing payment of bills, connecting new customers to the LV-grid and extending the LV-grid. Decisions on grid extensions and connections are made in agreement with the “grid committee” of the COOPEL. The operator receives for his services a monthly fee, which consists of a fixed fee and a fee per customer.
63 If a state asset company were to be created, ownerhip would be entrusted to the asset company and operation & maintenance to SONABEL.

88
The COOPEL’s “management and control” committee receives during the first two years of operation support from a management consultant provided through the National FDEeration of Cooperatives in relevant aspects of management, tariff setting and accounting. The loan from FDE to the COOPEL comprises 5 million FCFA (=€7,600) in working capital to allow a COOPEL to pay operating bills during the first two months. The working capital loan is repaid by households over the tariff; after repayment that portion of tariff revenue is paid into a reserve fund. COOPELs are required to open three accounts: one for their operating expenses, one for their fee payments to the operator and one for replacement of parts and equipment. The COOPEL is subject to an annual financial audit. The daily operating hours of generators in isolated grid projects depend on the size of the productive demand in the community. As for example, in Gayéri, operating hours are from 7.30-13.30 and from 15.30-23 on work days and from 8-14 and 16-24 on holidays; in Seytenga operating hours are from 18-22.30. Non-paying clients can be disconnected after one-month of non-payment; the financial penalty for re-connection is very low. The experience of the COOPELs so far has been that 15% of connected members are bad payers per month (not always the same people). The identification process for multi-purpose platform projects – where a platform is built around a simple diesel engine that can power various tools, such as a cereal mill, husker, alternator, battery charger, pump, welding and carpentry equipment, and generate electricity for lighting, and pumping water - is similar to the grid-based projects. Under the UNDP-financed initiative NGOs are used as consultants to take the initial contacts with the “Women Association”. Typically, a grid with a radius of maximum 600 meter from the platform and a length of 2-3 km is attached to the platform, connecting 80% of the households that live within its service area. The organization form for the platform was subject to debate. Two options were considered: (i) the local Women Association as owner-operator, (ii) Women Association as client to a community owned platform operated under a service contract, under which the WA purchases energy services from the platform (access to energy during specific hours for different uses). The first option was retained; the Women Association is owner operator and sells different services: milling/grinding, de-husking, battery charging, water pumping, electricity for households (load limiter), electricity for productive services (metered).64 The women are taught by the “Association Formation Développement Rurale (AFDR)” how to operate the platform, how to sell the services of the different modules and how to keep accounts.
Subsidy policy for SONABEL and for decentralised Rural Electrification In the design of power market structures with separated “urban” (often referred to as “commercial”) and “rural” (classified as “non-commercial”) distribution concessions, the concept of cross-subsidization is normally maintained: a small rural electrification fee is charged to the bills of electricity consumers. The cross-subsidization intention was included in the 1998 Electricity Law
64 The legal basis for the operation is governed by loi 10 (Association) and loi 14 (Groupement).

89
which listed a rural electrification fee on power consumption as one of the sources of revenue for the FDE. In policy implementation, the policy turned out different. Between 1994, when the devaluation of the FCFA made adjustments in tariffs necessary, and 2004, SONABEL’s tariff structure and level were kept unchanged by the Ministry of Trade. SONABEL (and in the end, electricity consumers) had traditionally benefited from a number of subsidies. Subsidies to electrification investments comprised soft loans from donors (some given as grants to Ministry of Finance which on-lend to SONABEL) with interest rates of 4% and 10-20 years maturities; exoneration of TVA payments on fuel consumption, imported material and equipment, and on the first 150 kWh of a household’s monthly consumption; zero dividend payments to the state on the value of equity in SONABEL. National regulations protected consumers against short term fluctuations in energy prices (incl. electricity tariffs) caused by fluctuations in international prices of diesel and fuel-oil (“péréquation” system).65 Due to the increase in international oil prices after 1998 and the state’s policy to keep SONABEL tariffs unchanged, direct subsidies from the state budget to SONABEL’s cost of diesel consumption became increasingly important.66 Already during the 2002 fiscal year when the price of crude oil was US$28, the diesel fuel subsidy cost the state budget 12 billion FCFA (=€18.3 million), an amount higher than the annual cost of investment of the Government’s rural electrification program for the next 25 years.67 Yet, even the fuel subsidy did not make SONABEL financially viable. 68 In the end, as the cost of the fuel subsidy increased in line with the price in the international price of oil, the Ministry of Finance was forced to put a lid of 95 FCFA per litre diesel on the subsidy paid by the state budget. The Government’s subsidy and tariff policies towards SONABEL have two consequences for FDE: (i) no FDE-fee is charged to SONABEL consumers, (ii) the difference between SONABEL’s household tariffs and the tariffs charged by the COOPEL’s is artificially increased. In April 2006, the COOPELs Sebba and Seytenga paid their local diesel fuel depots 717 and 800 FCFA/litre
65 In principle, the system is to be revenue neutral: losses during periods of high oil prices being recuperated by surpluses during periods of low international oil prices. But the seemingly permanent shift in oil prices since 2003 has destroyed the balance. 66 The fuel subsidy is a case example of the well-known phenomena in political economy of a “fossilized subsidy”, which has three phases. First, a subsidy is introduced in a spontaneous way in response to an ad-hoc issue that has come up (in this Burkinabe case it was to soften the impact of the 1994 devaluation of the FCFA on electricity prices). Second, within no time, the subsidy comes to be seen as a social right by the beneficiaries and by politicians, and neither consumers nor politicians can any longer imagine life without it. Third, without looking into the evidence, it is taken for granted that the subsidy has a positive equity impact, and that consumers cannot afford to pay more than the subsidized price. 67 The consortium of donors financing the transmission project made it condition for loan approval that the tariffs of Sonabel be raised. The Government informed donors in September 2004 that it had decided, as a first step, and before the end of 2004 to increase tariffs by 10%, and that the tariff structure would be changed: a zero increase in the social tariff and an adjustment in the tariff for industries to reinforce the motivation for operation outside peak hours. 68 The feasibility studies in 2003 for the construction of a 225 kV transmission line between Bobo-Diolasso and Ouagadougou to bring 70 MW of power from Côte d’Ivoire to Ouagadougou investigated what increase in the average tariffs was needed to enable SONABEL to debt-service its future loans for the project. The financial audit (Alain Waddell: “Analyse financière prospective de la SONABEL », Septembre 2003) concluded that an increase in the tariff of 18-25% was required to make SONABEL financially viable; enabling it to service its debt, get a 4% rate of return on assets, and self-finance 20% of future investments. The lower range 18% estimate depended on SONABEL’s ability to reduce production costs through internal measures. The report estimated the economic cost of production per kWh (without fuel subsidy) of SONABEL at 125.8 FCFA in 2002, while the financial price was 102.6 and the average tariff 90.3 per kWh.

90
respectively; while SONABEL paid 146 FCFA/l (net of taxes and subsidy).69 If one assumes that the average consumption of diesel fuel in a diesel generator is 0,4 l/l par kWh, then the cost of fuel was 58 FCFA per generated kWh for SONABEL and 278 FCFA/kWh for the COOPELs.70 SONABEL’s household consumers do not pay VAT on the first 150 kWh per month. Yet, although very few COOPEL consumers consume more than 150 kWh, grid connected COOPELs are treated by SONABEL as “large consumers” and charged TVA on their purchase of bulk power. FDE’s financial support by type of investment is summarised in the table below. Table 37: Burkina Faso FDE Subsidy Levels and Level of Soft Loan Finance in % of Total Cost Grant in % of cost % interest rate loan in % of cost
COOPEL feasibility studies 100% n.a.
COOPEL investments in distribution & transformer 60-70% 30-40% (10 year loan, 3 years grace)
COOPEL investment in 33 kV line to national grid 100% n.a.
Multiple platform 90% 10% (.. year loan)
Solar PV-systems … …
FDE pays 100% of the cost of COOPEL feasibility studies and of the 33 kV lines that connect communities to the interconnected grid. FDE gives a grant of 60-70% to the cost of investment of COOPEL electrification projects and finances the remaining 30-40% of the cost of investment via a 10-year loan with a zero percent rate of interest and a grace period of 3 years. Platforms for women associations receive an upfront grant of 90%; the rest in the form of a .. year loan. The table below compares the scope of the subsidies given to SONABEL and to COOPEL’s. COOPEL subsidies are heavy on the investment side, SONABEL subsidies are dominated by subsidies to costs of operation. Table 38: Burkina Faso Subsidies to Urban and to Rural Electricity Consumers
SONABEL FDE-Rural
Direct Investment Grant No Yes
Loans without rate of interest No Yes
Soft loans Yes n.a.
Liberation of TVA on fuel used for power generation Yes No
Subsidized state equity Yes n.a.
Liberation of TVA on equipment and materials used for electrification Yes Yes/No1)
State budget subsidy to reduce cost of fuel used in power generation Yes Yes/No2)
Liberation of TVA on electricity consumption of low-income households (lifeline) Yes No
1) Materials and equipment used for the COOPEL’s grid based electrification is exonerated from TVA and from import duties, imported PV-systems do not benefit from exoneration. 2) Diesel fuel used by COOPEL generators and by platforms is not subsidized, but COOPEL’s purchasing bulk power from SONABEL benefit from the state subsidy to diesel and fuel oil
69 Source: Powerpoint presentation 2006 of 70 As comparison: The average tariff of SONABEL early 2006 was 117 FCFA/kWh.

91
Tariffs
In 2004 when FDE started operation, the tariffs of COOPELs implemented by the “Electrification Rural Décentralise” (ERD) -program of DGE were 250 FCFA/kWh (=€0.4). This is substantially higher than the 86 FCFA/kWh which SONABEL consumers pay since 2005 for the first 50 kWh/month tranche of the “lifeline tariff/social tariff” (in addition to a fixed monthly tariff of 1.132 FCFA =€1.7). COOPEL consumers pay upfront (i) a connection fee of 12,000 CFA (=€18) plus (ii) the cost of internal wiring plus (iii) 10,000 FCFA (=€15) to the social fund of the cooperative, which finances “social extensions”. Originally, the connection charge was 35,000 FCFA (=€53), it was reduced as it blocked the goal of reaching 50% connection rates in the service areas of the COOPELs. The average tariff of the COOPEL is calculated to cover:
• the cost of O&M, • the cost of repayment on the 30-40% of the cost of investment which is financed by a loan, • depreciation of equipment.
FDE provides the COOPEL with a spreadsheet model to calculate the tariffs. The tariff schedule of the COOPELs has the following categories which consumers can chose between:
• fixed monthly rate irrespective of kWh consumption with “1A” power limiters (calculated consumption of 20 kWh/month), early 2007
• mono-phase connection with choice between 3A, 5A, 10A, 15A paying a fixed monthly charge (3 ampère: 1500 FCFA/month, 5 ampère 2,500; largest 10-15000 FCFA) plus a per kWh tariff of FCFA 150/kWh for grid connected COOPELs and of 240 FCFA for isolated grids.
• tri-phase connection with a fixed charge plus payment according to metered consumption It was expected in 2004 that the average tariff of COOPELs connected to Sonabel’s grid would be around 200 FCFA/kWh and of isolated grid CCOPELs around 300 FCFA/kWh. Yet, as the price of diesel continued to escalate it proved too low, in particular for isolated grid projects. Early 2007 the tariffs had to be 380-450 FCFA/kWh (€0.6-0.7) to cover the three cost categories in these.
Regulation The regulation of COOPELs is defined by several laws :
• The 1998 and 2005 Electricity Sector Laws, • Law 014/99 concerning the rules for cooperatives and groups (« groupements”) • Law 010/98 concerning the division of authority between state institutions and other
development actors • Law 040/98 concerning decentralisation in Burkina Faso, • A number of decrees: concerning the conditions for the grating of concessions; the Cabinet
decision concerning the segmentation of electrification into two sectors - SONABEL and FDE; concerning the implementation of multi-sectoral approaches in energy.

92
The Minister of Energy issues the authorisations and concessions to the COOPELs, SONABEL and independent generators.71 So far, 23 concessions had been issued to COOPELs for the construction and operation of decentralised electricity systems. Rules for light-handed regulation exist. Systems with capacities lower than 10 kW need no authorisation, systems with capacities between 10 and 35 kW need an authorisation, systems beyond 35 kW need a concession. The tariffs of SONABEL are adjusted very half year. The electricity tariffs charged to consumers by commercial distribution companies (SONABEL) need approval by the Minister responsible for Trade and Commerce after receipt of an opinion by the National Committee for Power Tariffs. According to law in Burkina Faso only COOPELs can receive a subsidy for rural electrification and the authorisation for a decentralized rural electrification project. The concession of a COOPEL is subject to rule- and tariff regulation by FDE. The financing contract is the main legal instrument for authorizing FDE’s involvement in regulation. It defines the obligations of the COOPEL such as the obligation to connect all within the service territory, the principles for tariff setting and for repayment of the loan. The technical regulation of COOPELs is performed by the Inspection Office of the Ministry of Energy72, which has the right to perform technical audits of installations. The 1998 and 2005 Electricity Laws authorise the creation of an Electricity Regulator (L’Organe de Régulation du Sous-secteur de l’Electricité, ORSE), without abolishing the present involvement of various state institutions in the regulation of the sector. The regulator has not been established yet. About 300 rural municipalities (« communes ») are to be created. The decentralisation law (“loi no 042/98/AN portant organisation et fonctionnement des collectivités locales”) foresees that the Government will transfer some competences to the communes in local electricity supply – beyond the two already stipulated in the law: (i) to give an opinion about local electrification projects and (ii) to take care of public lighting. Electricity supply will be part of their planning functions, and it may become possible to set up municipal electricity companies.
Quality of local Financial Intermediation for Rural Electrification FDE’s response to not having a local financial sector capable of providing finance tailored to the needs of decentralised rural electrification is to finance 100% of the cost of rural electrification projects through a mixture investment grants and loans. FDE contracted the commercial bank “Bank of Africa” to manage the transfer of grants and loans to FDE supported electrification projects and to collect the repayments on the loans by the COOPELs. The bank is paid an annual fixed fee for the service. The loans have a grace period of three years and COOPELs pay no rate of interest on the loan. Thus, part of FDE is operated as a revolving fund, but with a rapidly diminishing real value.
71 Article 35 of « la loi 016-2005-AN portant réglementation générale sur l’approvisionnement du Burkina Faso en énergie électrique ». 72 l'Inspection Générale des Activités Minières et Energétiques du Ministère des Mines, des Carrières et de L'Énergie

93
The commercial sector comprised in 2005 11 commercial banks and five financial institutions; in 2006 three new institutions were added.73 Major banks have varying degrees of foreign ownership. Commercial banks in Burkina Faso typically charge investment projects 10-13% as rate of interest and give loans with a maturity of 3-5 years. They require a minimum of 25% equity finance for co-financed investment and 100% guarantees for their loans. Private commercial banks do not operate in rural areas; but could give business loans to installers. The Caisse Nationale De Credit Agricole (CNCA), sees rural electrification as being within its mandate. The Caisse charges a rate of interest of 12% and gives loans with maturities of 3-5 years. The not-for-profit financial sector in Burkina Faso is comprised mostly of three types of institutions: 1) loan and deposit institutions, 2) a network of credit unions and deposit institutions (the Réseau de Caisses Populaires de Burkina), and 3) rural credit and women’s microfinance agencies. The “member credit institutions”, the Caisses Populaires and Caisses Villageoises d’Épargne et de Crédit Autogérées give only loans to members and charge 10% plus 2% at the moment of signature. They give loans of 2 years (consumer goods) to 3 years (investment goods) maturity. Microfinance institutions expanded rapidly over the past few years; according to the BCEAO, by 2005 almost 600,000 people used the services of the main networks. As example, in 2005 the Banque Régionale de Solidarité Burkina was created with the aim of financing individual projects and micro-enterprises. A study for the DGE in 2001 showed that 26 out of 61 NGO members of the « Secrétariat Permanent des Organisations Non Gouvernementales » indicated that financial assistance was their primary mode of intervention. 74
Technical Supply Side in Burkina Faso Due to the monopoly of SONABEL in the provision of electrification in Burkina Faso, the technical supply side for rural electrification is weak.75 Burkina Faso has no tradition with supervising consultants. The capacity of site engineers is low as they do not know their functions and role for the job. The local capabilities in terms of independent consulting firms that could prepare feasibility studies for rural electrification was equally weak. In 2001 only one firm was deemed to have the full know-how for that. A consultant study in year 2001 identified only 15 installers and solar PV-dealers. The firms were organised in the interest organisation “Syndicat des Entrepreneurs d’Electricité et Assimilés du Burkina (SEAB)”. Most firms had a staff lower of less than 10 persons and only six had an annual turn-over of between €05-1.5 million, none were higher. None had prior experience in the
73 Main sources of information are : « African Economic Outlook. Burkina Faso », 2007 74 T-Consult: “Les Operateurs Techniques : Identification, Recensement Et Classification Des Acteurs De L’electrification Rurale ». June 2001 and AdDB/OECD : 75 Main source of information : : T-Consult: “Les Operateurs Techniques : Identification, Recensement Et Classification Des Acteurs De L’electrification Rurale ». June 2001 and AdDB/OECD : and « Rapport de Synthese : Assistance Technique d’accompagnement a la Creation de l’Agence Burkinabe », 2001

94
operation of a distribution system or in generation. All firms had activities also outside the energy sector. The study concluded that only 2-4 of the firms were able to carry out a rural electrification project from the conception to the realisation. Only 3-4 of the firms had a financial strength making them capable of bidding for a “construction plus five year O&M contract” that is tendered by a COOPEL. The installers are the key agents for DGE/FDE’s approach to decentralised rural electrification: they are envisaged to install and the operate the financed systems for the community electrification cooperatives. An example is the firm EODA, which in 2004 became “managing operator” for two projects implemented by DGE and financed by Danida: Gayery with 128 initial clients and Seytenga with 103 initial clients.76 EODA’s staff at central company level comprised five persons: a Technical Director, a Commercial Director, two technicians for maintenance and one accountant/manager. In each village, EODA has three staff – of which two are technicians. The three staff are assisted by one unskilled labourer.
Promotion of low-cost technologies DGE and FDE made comprehensive efforts to introduce low-cost technologies into rural electrification in Burkina Faso. The attempts concerned the identification of appropriate cost-effective technologies and the upgrading of local know-how in the use of identified technologies. A key focus area was the introduction of SWER-technology in Burkina Faso.77 It was considered to be economically viable to connect groups of villages with a power demand below 400 kVA with SWER over distances of up to 40 km. For larger loads 34.4 mm triphase line were the recommended solution. 78 For household metering several concepts were tested. ….. A number of software tools were developed and made available free of charge to consultants, to operators and to COOPELs: preparation of feasibility studies and of business plans, calculation of tariffs, project management, client data base, billing and payment monitoring. No certification of consultants for decentralized rural electrification was introduced. But training courses for consultants were organized, inter alia in SWER technology. In the preparatory phase before the entry into operation of FDE, DGE provided training courses to 6 consulting firms specialised in decentralised rural electrification in the preparation of feasibility studies, business plans and project finance plans for the COOPELs. Other training courses were organised for installers with potential interest in becoming operators of the power systems owned by the COOPELs. The courses trained participants in the concepts of
76 Information from powerpoint presentation « Atelier du groupe de travail opérationel sur electrification rurale. Experience d’un ópérateur privé burkinabé : la société EODA », Ouagadougou, 2004 77 The introduction of the technology had to overcome deep-rooted suspicion of conventional power engineers in Burkina Faso and suffered set-backs and delays due to insufficient quality of the contracted Danish consulting firm. In the end, ESKOM was brought in to provide training in SWER. 78 Source: DGE : « Esquisse et costing d'une approche stratégique ERD globale pour le Burkina Faso couvrant l'ensemble du territoire sur un horizon de 25 ans. »

95
affermage-contracts and contracts for the management of infrastructure projects not only in electricity but also in water supply.
Integration of National Power Planning and Rural Electrification A National Electrification Plan was adopted by the Burkinabe Government in 2004. The plan concerns generation / power import planning for the interconnected system and the expansion of the high voltage and medium voltage transmission system connecting Burkina Faso with neighbouring countries and, inside the country, its towns and major villages. Decentralised rural electrification is only marginally discussed in the plan. FDE finances “planned” and “spontaneous” projects; the basic operating assumption for the long term is that 25% of supported projects will be “planned” and 75% “spontaneous. FDE/DGE expect a 50%/50% distribution per year between new COOPELs that are grid connected and those that are served by isolated grids. Grid connection is cheaper on average, but there are few 33 kV lines to hook up to in rural Burkina Faso. FDE in its three-year planning (which leads to the 3-year performance contract with the ministry) faces the problem that there is no plan indicating which communities are be connected within the next ten years: such a plan would help to define where solar PV-systems could be brought in and where isolated diesel generation is appropriate. AfD has in 2007 provided 0.5 billion FCFA (€760,000) to finance the preparation of a Rural Electrification Strategy. The difficulties of coordination are compounded by the institutional planning rivalry between SONABEL, FDE and DGE. In principle, DGE makes the strategic planning for the power sector; but SONABEL makes its own strategic planning and does not always follow DGE. Burkina Faso disposes, however, of a comprehensive data base of 7800 « localités » with facts about their administrative situation, demography, socio-economic infrastructure (health, education, religious centers, administration, entertainment), energy systems in place.
Key Problems encountered The upstart phase of decentralised rural electrification in Burkina Faso has been difficult.
• The impact of the high cost of investment on COOPEL tariffs was compounded by the increase in the cost of diesel. This affected grid connected COOPELs less than COOPELs served by isolated grids because SONABEL’s power supply portfolio is composed of domestic hydropower and imported power in addition to national diesel generators and because SONABEL’s cost of diesel is reduced by de-taxation and by direct subsidies from the Government. For households served by isolated grids, the impact was dramatic. Early February 2005 the variable tariff of these varied from 219 to 238 CFA/kWh, early 2007 a variable tariff of 364 to 413 FCFA/kWh was needed (€0.56-0.63).
• The average monthly consumption of consumers was lower than the 30 kWh per month that was expected.
• FDE-staff had to intervene much in work which should have been done supervising consultants.

96
• The operators have no scale economies: they need separate in-situ staff for each system. • Scaling up – in terms of increasing the number of yearly projects - is difficult, as it is limited
by the financial capacity of the local entrepreneurs. The strategic assumption of FDE was that the operators would reach a critical mass for scaling up after five years: that an operator would be able to cover a larger area serving a number of COOPELs. However, operators cannot expand their operations sufficiently as the banks will not accept to expand credits faster than their increase in own assets that can serve as collateral.
Use of funds and results achieved in Decentralised Rural Electrification
Despite efforts to promote low-cost technologies, the average cost of connection per connected household in the projects implemented by early 2007 was €870 per connected customer, including cost of consultants in project preparation and supervision. The cheapest investment (excluding cost of consultants) was around €600, the most expensive: €1500. Table 39: Use of DGE and FDE Funds for operating costs, TA and investments, 1999-2007 Cost in bio. FCFA (mEuro) in % of total
TA to FDE and preparation of “priority feasibility studies”
Cost of TA to supply chain
Finance for investments
- grants
- loans
TOTAL 100%
The decentralised rural electrification effort since 1999 can be divided into two phases: the first phase from 1999-2004 of DGE-projects and the second phase from 2004-2007 of FDE-projects. The electrification objective for FDE’s decentralised rural electrification is to provide electricity to 200,000 rural households within 10 years. The first three-year performance contract which DGE signed with FDE foresees the electrification of 15 to 20 villages per year; the COOPEL program is to have 137,000 households connected by year 10; the other 63,000 households are to be serviced by multi-purpose platforms and by solar PV-systems. The table below summarises the status of achievements of the two phases, early 2007.
Table 40: Decentralised RE Projects finished or in active Preparation Early 2007 Villages Connections Investment Annual GWh
DGE 1999-2004
- COOPEL-villages 18 Million FCFA (=€ m)
- Solar PV 145/301) Million FCFA(=€ m) n.a.
FDE
- COOPEL villages 19 million FCFA(=€ m)
- Platforms 15 million FCFA(=€ m) n.a.
TOTAL million FCFA(=€ m)

97
1) 145 villages served originally, 30 still operating in 2007 The calculations concerning connections assume that a COOPEL has on average 350 members. Of the 32 COOPEL, 22 are grid-connected, the other 10 are isolated grid systems served by diesel generators. FDE had early 2007, three years after it started operation:
• 10 COOPELs operating (4 grid-connected) and another 13 about to be finalized (12 connected).
• 6 platforms with grid had entered operation (villages in the Departement of Tangaye) • 9 other platforms with grid are about to be constructed within the framework of decentralized,
cofinancing by Swedes (the principle is that FDE takes the villages that Swedish SIDA does not finance – in Ballés,the rural commune of Yaho).
Only one spontaneous project has been implemented; the other are national priority projects. Outside the FDE framework, SONABEL will in 2007 finish the electrification of 11 villages near Ouahiguya (through grid connection); finance is provided by a Danida bilateral aid program that started several years ago, but which due to failures by Danish consultants and the bankruptcy of a Danish contractor had been delayed. Of the six construction companies (installers) that won tenders for COOPEL projects, one is bankrupt, one was early 2007 about to go bankrupt. 4 COOPELs are problematic because the private entrepreneur went bankrupt. DGE’s experience with the Spanish Aid financed solar energy project was negative. The project provided institutional PV-systems and household systems to 145 villages at a cost of €37,000 per village. Beneficiaries did not take care of their systems; the payment system for maintenance was not robust and there were problems with theft of panels. Early 2007, of the 145, only 30 were still operating. Safeguards against theft + more robust system for payment of maintenance solar PV in Burkina is a fiasco expect for water pumping The transaction costs for multi-purpose platform projects are very high. 50% of the total budget is used for accompanying measures (awareness raising, mobilisation, education, etc), the cost of the hardware investment is only 40% of the total. Another problem is the lack of elasticity of supply in the service. In a classical isolated grid project, increased electricity demand is met by adding another generator; in the platform concept, the motor is integrated. The role of FDE to serve as a centralizing source for donor finance is still emerging. Danish bilateral aid is moving out of the energy sector in its new five-year program, Danida’s support to FDE, therefore, stops. FDE has signed a collaboration agreement for the financing of 50 platforms by UNDP. The World Bank is in negotiations with the Government of Burkina Faso for a major IDA-loan to FDE for the financing of decentralized rural electrification.

98
Evaluation of Burkina Faso’s Approach to decentralised rural electrification
In the FDE-electrification modality, in line with the culture of the country, the Gvt takes all investment risk and initiative although they are by now many small associations and NGOs operating in the rural areas of the country. The “balanced score card”, as revealed by the shape of the rural electrification diamond for Burkina
Faso, reveals a strong need for a re-thinking of the chosen approach. The right side of the diamond – the supporting infrastructure for rural electrification composed of the institutions for rural electrification planning, TA and financial support, subsidy policy and regulatory regime – is the weakest of all investigated schemes. The Government’s annual subsidy support to SONABEL (served customers) was after 1999 much higher than for rural electrification (unserved customers). No rural electrification fee is charged. The supply chain is weak; there is a dearth of private consultants and
entrepreneurs/installers. SONABEL is a quality utility by African standards, has the best electrification experts in the country, and can take advantage of economies of scale and scope in planning, finance, investments and operation. Yet, the tiny private companies are to take on grid connected rural electrification as well as isolated grids and PV-systems. Financial intermediation for rural investments, is in general better than in most African countries. FDE’s use of a commercial bank as Trust Agent and provider of grants and loans to the recipients is good policy, except for the zero interest rate policy. Giving a higher investment grant and charging commercial interest rate could have given the recipients the same annual amortization burden. But the signals in terms of (i) the de facto size of the investment grant and (ii) the need to pay rates of interest when taking loans would have been stronger. The decision to give loans without rate of interest to COOPELs does not promote the development of commercial bank co-finance for rural electrification in the longer term. Since the installers are also the operators, the chosen modality for the organisation of electricity service is as weak as the supply chain. The concept of getting the installers involved in the operation of the power systems makes good logical sense. But in view of the weakness of the supply chain, the approach is too much of an uphill fight.
Burkina Faso Rural Electrification Diamond
FinancialIntermediation
Supply Chain
Organisation of Supply / Electricity Service to Consumers
REF/REA and
Subsidy Policy

99
I.2 Ethiopia REF: Loan-financed investment Subsidies and Village Electricity Cooperatives
Specific Characteristics of Ethiopia’s Approach
In Ethiopia, responsibility for rural electrification is split. The state-owned power corporation undertakes all national grid extension projects, the REF supports private off-grid electrification. The Ethiopian REF has five unique aspects: (i) there are no investment grants; (ii) village electricity cooperatives own and manage the isolated grid projects, (iii) the REF has no permanent staff, only consultants working on 1-year contracts while staff from existing institutions provide ad hoc assistance; (iv) off-grid is for communities located 100 km or more from the national grid, (v) Government staff - not private consultants - assist communities in project preparation and implementation.
General Information about Ethiopia Ethiopia has a population of 70m and a population density of 70 persons per sq.km. Ethiopia is one of the poorest countries in the world with a year 2005 gross national income (GNI) per capita of US$160 (nominal) and of US$1000 (at purchasing power parity).79 Population growth is around 2.9% per year, growth in GDP during the last four years has been 10-11% per year, the inflation rate is in the range of 2.5 to 5% per year. Annual electricity consumption per capita was 30 kWh in 2005. “Urban” is defined in Ethiopia as towns with more than 2000 households. There were 922 of these in 2001; and their population made up 15% the national total.80 The national electrification rate in 2006 was 8% when defined as the number of households connected to electricity; electricity coverage defined as persons living in electrified areas was 17%. The Government plan is to increase electricity coverage to 50% by 2010.
Power Sector Structure The power sector reform, implemented since 1997, combines the corporatisation and intensified commercialisation of the state power company with an opening of the power sector to private investment. The Government-owned Ethiopian Electric Power Corporation (EEPCo) was established in 1997 to take over management of the power system from the former Ethiopian Electric Light and Power Authority (EELPA). The vertically integrated company is engaged in electricity generation, transmission, distribution, sales and is single buyer. The change towards corporation status enhanced its managerial and financial autonomy. A decentralization of EEPCo's operations to eight regional offices, each operating as a profit center, is in progress.
79 World Bank: “World Development Report 2007” 80 Aklilu Dalelo: “Rural Electrification in Ethiopia: Opportunities and Bottlenecks”

100
Domestic and foreign IPPs can invest in hydropower, electricity power generation from thermal power sources of 25MW and above capacity is left to the state. Electricity generation, transmission and distribution are prioritised as investment activities in the newly introduced investment law. But due to the low cost of EEPCo's own generation, no IPP has been set up. Only domestic investors can invest in isolated grid systems. EEPCo, which in 2005 had a staff of 10,600, operates two power supply systems, the National Interconnected System (NIS) and the Self-Contained System (SCS). Of the 641 electrified towns in 2005, 567 were within the NIS, the remaining 47 within the SCS. Almost all electricity consumers in Ethiopia are supplied by EEPCo, which end 2006 had about 1.1 million customers, a 200,000 increase above the number of customers end 2004. 95% of EEPCo’s customers in 2005 were served through the NIS. The collection rate is around 99%. System losses in the NIS were 18%. The NIS had in 2005 an installed capacity of 782 MW: 8 hydropower plants with a capacity of 663 MW (sizes from 11 to 184 MW) that provided 99% of NIS-generation in 2005, 13 diesel totalling 113 MW and a 7 MW geothermal power plant.81 Based on an annual load growth of about 7%, the generation capacity requirement for the NIS is forecast to increase from 769 MW in 2005 to about 1,512 MW in 2012. The SCS has 3 hydropower plants with a total capacity of 6 MW and 24 MW of diesel power plants; the latter generate two thirds of SCS-power output, which accounts for 2% of EEPCo’s generation. The average tariff in 2005 was about US$0.056 per kWh, equivalent to about 62% of the long-run marginal cost of supply.
Scope of National Electrification and of Rural Electrification The Government has for the 2006-2012 period an annual budget of US$1 billion for the energy sector. US$120 million are used for rural electrification under the Universal Electrification Access Program (UEAP) that undertakes grid extension from the ICS. US$10 million are for off-grid electrification, that is, investments in isolated grids and PV-system projects. The Ministry of Mines and Energy’s year 2020 target for the UEAP is to extend the national electricity access through the grid to 6,000 villages, towns and irrigation sites. The power generating capacity would be increased to 4,000 MW, the high voltage transmission lines to 12,000 km and the medium and low voltage lines to 130,000 km. 82
Organisations involved in RE Ethiopia has a FDEeral Government, 9 autonomous Regional Governments and two charter-administrative cities.
81 Ethiopia has a technically feasible hydropower potential of at least 40,000 MW. 82 The power transmission network of 230, 132, 66 and 45 kV totaling more than 6304 km and a distribution system consisting of 4500 km of 15 kV lines and 8000 km of low (380 & 220) volt lines.

101
The Ministry of Mines and Energy (MME) is the top Government organisation for the power sector; relevant agencies referring to MME are EEPC, Ethiopia Rural Energy Development and Promotion Center (EREDPC), the Rural Electrification Fund (REF), Ethiopia Electricity Authority (EEA). The EREDPC, which has about 130 employees, covers all rural energy issues: biomass, rational use of energy, capacity building of regions, etc. The EREDPC prepared MME’s Rural Energy Strategy Paper, which synthesizes the policies for the rural energy sector in line with the Government’s Rural Development Strategy (RDS). Rural electrification by grid extension (the UEAP) is undertaken by EEPCO, which has set up a rural electrification office within its organisation. The Ministry of Agriculture and Rural Development (MOA) is involved in the income generation activities. The Ministry of Water Resources is involved in the approval procedure and technical evaluation of hydropower projects. The Regional Energy Bureaus (REBs) are part of the regional Government. The bureaus assist local communities in preparing energy projects including projects for off-grid community electrification. The Bureaus receive advice and guidance from EREDPC and capacity building from REES in business plan assessment; technical assessment and administration of electricity projects. The Head of a REB is head of the Regional Rural Electrification Executive Secretariat (RREES), which gives implementation support to off-grid rural electrification projects. The RREES get their budget from the regional Government. The Woreda (district) administration is the main driver for getting electrification projects off the ground at grass root level.
The REF-REB-REES Set-up
The REF was established by law in 2003 and became operational from 2005. It is the primary source of loans for off-grid rural electrification and for the grant financing of technical assistance to agents involved in these. Decisions on the use of REF-funds are taken by the Rural Electrification Board (REB) based on proposals submitted by the Rural Electrification Executive Secretariat (REES). The REB has 8 members appointed by the Minister of Mines and Energy: one representative each from MME, the Ministry of Water Resources, Ethiopian Environmental Authority, Ethiopian Electricity Agency, Cooperative Agency, a regional energy bureau, the Director of EREDPC. Plans are to include one private sector representative and one from EEPCo. The REES prepares an indicative rural electrification plan, provides information on potential project sites to prospective investors, reviews the proposals for investments including the environment and social management framework, prepares specific projects to solicit private sector interest, and provides technical support to interested investors.

102
The Development Bank of Ethiopia (DBE), selected by public tender, is contracted Trust Agent of the Rural Electrification Fund. The DBE has 31 branch offices in Ethiopia. For its services as Trust Agent, the REF pays the DBE a retainer fee to cover administrative costs during the take-off phase of the rural electrification port-folio and a 3% performance based commission on disbursements. The DBE performs the due diligence reviews of project proposals. The Government is careful not to create parallel organisations; but to strengthen existing institutions. The set-up of the REF reflects this policy:
• The REES has no permanent staff, only seven local consultants hired under one-year contracts that are renewable.
• The REES is institutionally embedded within the EREDPC: the Director of EREDPC also heads the REES and technical and secretarial staff from EREDPC work for REES also.
• REF is audited annually by the Audit Service Corporation and is prone to ad-hoc audits by the internal audit department of the EREDPC.
• The REES draws in addition to EREDPC staff also on technical experts from EEPCO, Ministry of Water Resources, Environmental Agency, and the Cooperative Agency according to specific technical resource needs.
The salary levels of REES consultants were decided with reference to the salary levels of NGOs and national experts working for international projects. The result are monthly salaries ranging from US$1200 to US$2000, which is roughly six to seven times the salary of a civil servant. REB board members are paid a meeting allowance. The first recruitment of REES-consultants was completed in 2005, whereby, the REF became operational. The expected composition of the REF-budget for the 2005-2011 period is shown below. Table 41: Ethiopia Estimated Breakdown of REF Budget for 2005-2011 Period US$ in % of total
REES operating budget incl. cost of capacity building and TA to related public institutions
3m ??
TA to private actors in rural electrification and to communities
Loans to off-grid projects
Grants and loans to PV-systems 5m
TOTAL 31m
Prioritization and Coordination of Rural Electrification Projects
Coordination between EEPCO’s grid extension investments and the REF’s off-grid investment projects is achieved through the preparation of long-term master plans and through the meetings of a coordination committee. In principle, off-grid electrification is to take place in communities that are located more than 50-100 km away from the Ethiopian Electric Power Corporation (EEPCo) transmission lines, and which cannot be accessed by EEPCo service delivery within ten years. EEPCO has prepared long term master plans for generation and for transmission; but no long term plan for distribution. The planning of distribution projects under the UEAP launched in 2005 (and associated transmission projects) is done on an annual basis based on proposals submitted by the

103
Energy Bureaus of the Regional Governments. It is a precondition for grid connection that a settlement has a population of at least 500 households in 2006. For the selection of projects, electrification of administrative centers is first priority; electrification of areas with population of 10,000 or more are second priority, since they having schools, small clinics, commercial activities. MME screens the lists of projects submitted by the regional Governments to confirm that the local equity co-financing requirement of 15% is met, that the selected towns are administrative centers and that the number of population in each is reasonable. The MME then hands over the approved list of towns to EEPCO, which, within the annual financial envelope selects to electrify those that make best economic-financial sense; but taking into account also a rational expansion of the transmission grid and the satisfaction of regional equity criteria. The final list of towns is then notified. REES has prepared an Indicative Off-Grid Rural Electrification Master Plan in 2006 that covers a 20 year planning horizon and identifies a range of least-cost projects with a high development impact. The plan shows 289 off-grid priority projects covering 255 Woredas (districts) and supplying electricity to 1,312 settlements with a population of 1.3 million in 2006, equal to 3 % of the total rural population in Ethiopia. 200 of these are diesel and 89 are mini-hydro projects. The Committee for Coordination of Rural Electrification Projects was established in 2006. It is chaired by the Ministry of Mines and Energy with EEA, EEPCO, and REES being members. Yet, in practice, coordination poses a problem. The 6,000 settlements targeted under the “UEAP” have not yet been identified and EEPCo is silent in giving data or information on future projects and extension programs. Even if given, EEPCo’s program might change due to political influence, including grid extension beyond the 100 km benchmark. The result is political uncertainty on where off-grid development will take place. Due to its larger funds and scale economies, EEPCO is fast placing electrification facts into rural areas where feasibility studies for off-grid electrification are underway.
Sources of Finance for Rural Electrification and the REF Donor finance is the single largest revenue stream to the Government overall, and donor finance is often seen as the most stable and secure source of income. The sources of finance for the capital intensive power sector are the conventional: World Bank, EIB, KfW, AfDB, JICA, Arab Fund, etc. Pooling of donor finance is done not through pooling of funding, but by individual donors agreeing to finance specific parts of the total investment and TA package. The structure of finance for the Energy Access Project approved in 2002 is typical: Of the total budget of US$ 199m (of which US$ 56m are for rural electrification), the Government self-financed US$ 46m (23%) mainly through EEPCO self-finance, a WB/IDA loan provided US$138m, an EIB-loan US$15m; while US$8 m in grant finance was provided by GEF (US$5 m subsidy support to solar PV and mini-hydro) and by bilateral donors (US$3 m for TA). Pooling of donor funding is one objective of the REF. Yet, so far, this has not been realized: the World Bank and GEF are the sole sources of funds for the REF. The total estimated off-grid electrification program cost for the 2005-11 period amounts to US$32m. US$13m from Energy

104
Access Project in the form of a US$8m WB/IDA loan and US$5 m in GEF grant finance.83 The follow-up “Energy Access Rural Electrification Project 2 (EAREP-2), expected to be approved by the WB in June 2007, is to provide US$19m: US$15.6m for mini grid and institutional solar PV investments and US$3.5m for pilot projects for productive uses (to be implemented together with Ministry of Agriculture) and for technical assistance. For the moment, the only Government contribution to the REF/ REES is in kind: free-of-charge offices and ad-hoc expertise from EREDPC and other Government institutions. Whereas EEPCo’s SCS-consumers are cross-subsidized through EEPCo’s uniform tariffs, the REF’s off-grid communities receive no cross-subsidy from EEPCo-consumers: no REF-levy is imposed on EEPCo’s tariffs. Other donors who assist in off-grid rural electrification include:
• Austria’s ADA – which used to assist in preparing feasibility studies for mini-hydro projects, but has now withdrawn from energy sector activities;
• GTZ is preparing an energy project especially for electrification in off-grid areas • The EUEI has proposed a PDF activity “Ethiopia local off-grid planning” to train regional and
local authorities and other stakeholders in the use of GIS-based planning tools for off-grid energy supplies.
National EEPCos Tariffs and Cooperative Tarifs
EEPCo has a policy of uniform national tariffs within which consumers with low levels of consumption are cross-subsidized by consumers with higher consumption levels (and income). A lifeline tariff of 0.27 birr/kWh is applied for the first 50 kWh of monthly consumption, the tariff for the next 50 kWh is 0.36 birr/kWh, after the tariff increases stepwise for each additional 100 kWh of monthly consumption to 0.49, 0.55, 0.56 and finally, 0.58 birr/kWh. The average household tariff is 0.40-0.45 birr/kWh, equal to 5 UScents. The connection charge ranges from 300 to 1000 birr (38-112 USdollar) according to distance and capacity. The upfront cost represents an obstacle to household connection rates, and EEPCo has from time to time offered households a 3 years credit for the connection charge – at 0% rate of interest – recovered over the monthly electricity bill.84 Without a credit for the connection charge, EEPCo achieves an initial 35-40% connection rate in its rural service areas. Arrears in consumers’ tariff payments are low. When an electricity cooperative is formed, a household member needs to pay 10 birr (US$1.1) as member fee; roughly 80% of community households join. The connection fee is 50 birr to the cooperative plus 5 birr for the technician who puts up the one socket outlet. The upfront cash cost of US$6 reduces the percentage of community households that connect to 60-70% on average. Unlike EEPCo, which has metered clients only, the electricity cooperatives use neither meter nor no load limiters, only automatic circuit breakers for safety/protection. The clients pay per appliance; present tariffs are around 20 birr per month and per 11 W lamp. Roughly 10% of clients have a TV; radio and cassette players are the norm. For street lighting, each household, including those who are not connected, must pay 2 birr per month.
83 An expected US$3m from EIB was not received; and US$2.5m from a promised US$10.5m WB/IDA was redirected to grid extension projects. 84 ”From time-to-time” because (i) it is a financial burden for EEPCo and (ii) because households who had paid the connection charge fully upfront before the implementation of the credit facility, protested for being discriminated.

105
The table shows that EEPCo’s connection fees are much higher and monthly consumption fees for typical low-income rural households much lower than REF’s fees. Table 42: Ethiopia EEPCO and REF fees and connection rates Connection fee Monthly Consumption fee Connection rate Tariff payment default rate
EEPCo’s UEAP 300 birr 6 birr (20 kWh); €0.5 35-40% 1-2%
Elec. cooperatives 65 birr 40 birr (two lamps); €3.5 60-70% 20%
The impact on the connection rates – the cooperatives’ connection rates are roughly twice as high – reconfirms that the upfront cost of connection is a stronger barrier for access than the monthly payments for consumption. However, an apparent negative side effect of the combination of low connection fees and “high monthly fees” – judging from the differences in payment arrears – is that households are tempted to connect, who can ill afford to pay for electricity service.
REF loans and subsidies to investments There is no strict correlation between distance from the ICS and the community’s average household income, but on average, communities assisted by the REF are likely to be poorer than communities that are connected under the UEAP. Yet, the Government decided that, except for institutional PV-systems which receive a 100% investment grant, the REF will not give direct investment grants to projects. Investment support to REF-financed projects is given in-kind in the form of free-of-charge assistance by Government staff to project preparation and implementation, and indirectly through total or partial grant-financing of technical assistance to actors involved in off-grid electrification. Since the preparation of the project document for Energy Access Project in 2002, talks have been ongoing between the Government and GEF about the subsidy policy for the targeted promotion of solar PV-home systems, solar PV-institutional systems and investments in micro-and mini-hydro. Originally, GEF wanted to apply its usual US$ per Wp subsidy to PV-systems – a very inefficient market expanding instrument for an individual consumer product – and to micro-and mini-hydros. In 2007, the issue is still not settled, except that the per Wp subsidy has been dropped. Present intention is to pay a 100% interest rate subsidy on loans given to PV-and hydro investments. The terms of REF project finance channelled through the Development Bank of Ethiopia (DBE), are summarised in the table below. Table 43: Ethiopia DBE/REF Loans Terms and Conditions Maturity Grace period Rate of interest Equity self-finance
Distribution system 7 years 1 year 7.5% 15%
Diesel power plant 6 years 0.5-1 year 7.5% 15%
Micro-hydro plant 10 years 1-3 years 0% 5%
PV-SHS 5 years 0.5 years 0% 5%
PV-grid system 10 years 1 year 7.5% 5%
Institutional PV-system n.a. n.a 100% grant 0%

106
DBE charges its standard 7.5% interest rate also on its REF-loans; the revenue from repayments on principle and payment of interest flows back into the REF-Trust Fund. Whereas DBE normally requires loan takers to equity-finance 30% of a funded investment, electricity cooperatives need to provide 15% equity only and no collateral other than the purchased equipment; please see the table. The loan terms of DBE (and/or of the REF) represent a small interest rate subsidy compared with the terms of commercial banks. Commercial banks in Ethiopia charge 7.5%-8.5% rates of interest and provide loans with maturities of up to 5 years only. The Cooperative Bank of Oromia (established in 2005) charges interest rates of 7.5% for short term loan (<1 year); 10% for long term loans (2 – 5 years); and has a 50-100% collateral requirement. Institutional PV-systems receive a 100% grant against a guarantee from the oversight ministry for the receiving institution (Ministry of Health / Ministry of Agriculture) that they provide money to pay for maintenance.
Involvement of local financing institutions Apart from the DBE as Trust Agent, REES/REF has not succeeded in getting any commercial bank, cooperative bank or MFI to join in the co-financing of an off-grid electrification project; except for some minor financial involvement by MFIs in activities undertaken by solar PV-dealers. Commercial banks have shown no interest in financing off-grid electrification projects. Most of their operations are in urban centers and there is limited appetite to extend to remote rural areas especially for relatively small loans. MFIs and cooperative banks are better positioned. All electricity cooperatives have a bank account with a local MFI or cooperative bank (their account at DBE is used only during the investment phase and later for the monthly amortisation payments on their DBE-loan). The experience with lending to cooperatives in general (electricity cooperatives are too recent to have a track record) is positive: collection ratios are high, the number of non-performing loans is low. Although MFIs and cooperative banks are interested in providing loans for off-grid operations, they are restrained by their liquidity situation and lack of longer term finance. To explore further collaboration, the REES has drafted a MoU with the MFI Association for the implementation of joint capacity building activities for MFIs in financing rural electrification projects.
Project Cycle and Organisation of Electricity Cooperative The FDEeral Cooperative Agency, which serves all kinds of cooperatives: coffee, oil seeds, etc. is the main conduit for passing REF-information from the REEC to the Wereda administrations through its Regional Cooperative Bureaus and for providing management training and back-up to electricity cooperatives during operation. The cycle for a electricity cooperative project starts at grass-root level with local community people asking the local cooperative bureau with help in organising them according to cooperative law. The bureau then produces the bylaws for them. The cooperative next writes an application for getting electricity to their village, which is submitted to the Regional Energy Bureau. The REB verifies that the village is not included in the interconnected grid expansion plan, and assists the electricity cooperative in producing a business plan for funding.

107
The cooperative submits the business plan together with an application for REF-Funding to the REES for r pre-appraisal. After pre-appraisal by REES the project is sent for final appraisal to the Trust Agent. The DBE checks the technical part and confirms that the project is bankable and “profitable”, then sends it to REES for approval by REB. A maximum 30 days are used for appraisal. After REB’s approval of the project, DBE prepares contract agreement between DBE and cooperative. During this time the cooperatives are requested to send the necessary documents, (memorandum of agreement, etc). Two adjustments to the approval process are being made. Up to 2007, REES conducted the technical appraisal of proposed projects; with the expansion of the program this should be accomplished by an independent authority available in the regions. This could be an accredited electrical inspector or an officer from the regional energy bureau. Similarly, the project promoters will be required to obtain clearance from the EEA or from one of the regional government bureaus to which the EEA has delegated its powers. A cooperative seeking a loan from the REF must have a bank account with DBE, a current account into which they deposit their 15% equity finance share, and their later repayments during operation. All disbursements by DBE are made into their current account. Two members appointed by General Assembly have the right to withdraw funds and to issue a letters of credit to a supplier. In principle, the cooperatives’ repay their REF/DBE-loans on a monthly period, but due to long distances of some cooperatives to the nearest DBE-branch office, DBE allows payments on a quarterly basis; and for very far located cooperatives on a semi-annually basis. There are micro-finance institutions, MFIs, in every village and some cooperatives have an account with them. But MFIs are not used to transfer the monthly instalments on the REF loan to DBE. The procurement process is divided into three phases:85 (i) The cooperative first has to invest in a building to house the generator and the cooperative’s office out of their own 15% co-financing contribution. (ii) All required material and generator is then procured by tender: the cooperative’s Chairperson comes to DBE and selects with the help of the procurement assistant from REES pro-forma invoices from three different suppliers. The tender is done jointly by REES and the cooperative’s committee; the evaluation is done by REES, which declares the winner of the bid. DBE’s electrical engineer appraises the equipment and qualifications of supplier and checks the capacity of generator and the prices for the materials against its own checklist. DBE pays the supplier directly, drawing down from the loan. (iii) The Cooperative’s Chairperson with assistance from the local Energy Bureau, the DBE’s power engineer and CEES’s procurement specialist, contracts professionals from the local area to install the distribution grid and generation system, based on past performance in the project area. The REES checks the installation process. After the
85 The loan procurement procedures agreed with IDA/World Bank foresee the following: (i) Investment projects over US$1 million on basis of International Competitive Bidding (ICB) requirements. (ii) Investment projects less than US$1 million on competitive procedures as set forth in POM. (iii) Works, goods, supply and installation over US$200k on basis of ICB requirements. (iv) Works between US$20k and US$200k on basis of National Competitive Bidding (NCB) requirements. (v) Works less than US$20k on basis of quotation obtained from three contractors. (vi) Goods, supply, installation between US$50k and US$200k on basis of NCB requirements., (vii) Goods, supply, installation less than US$50k on basis of (inter)national shopping. (viii) Prior review for: works >US$20k; goods >US$200k; and, (inter)national

108
installation is completed, DBE releases funds to cover the contracted payment to the chairperson, who pays the professional.86 The electricity cooperatives and DBE produce quarterly progress reports that are communicated to REES. DBE in addition provides monthly reports on the REF-balances. During operation, the Cooperatives Association through its regional offices provides back-stopping management assistance to the electricity cooperatives. The cooperatives can also draw on technical advice from the local Energy Bureau.
Regulatory Process and light handed regulation for off-grid rural electrification To strengthen regulatory capacity for the electricity sub-sector, in 1997 the Government established the Ethiopian Electric Agency (EEA), under Proclamation 86/97. The EEA is headed by a General Manager appointed by the Prime Minister on the recommendation of the Minister responsible for energy (currently the Minister of Mines and Energy). EEA is entrusted with regulating the ESI to ensure safe and efficient operation of the system, determine the quality and standard of electricity services, license operators, recommend tariffs and supervise their implementation. EEA licenses EEPCo's power generation business, power distribution business and the transmission business; and approves power purchase agreement before they are implemented between EEPCO and private power generators. EEA also participates at an earlier stages of negotiation on a Power Purchase Agreement /PPA/when invited by the parties to assist essentially on regulatory issues for private sector generation projects. The Electricity law did not include provisions for light-handed regulation for small scale off grid operators. The law requires any commercial power operation to be licensed and regulated irrespective of size. The procedure is expensive for small undertakings: a feasibility study and an environmental impact assessment (EIA) must be produced and the intention to make a project must be advertised in the media for three consecutive days and has to wait for two months for objection to be lodged if any. The complex formal procedures prevent the formal engagement of small private entrepreneurs in rural electrification. De facto, there are many private suppliers who have installed generators with capacities ranging from 5 kW to 50 kW and charge connected consumers around 10 to 15 Birr per bulb per month. To reduce the cost of red tape for electricity cooperatives, the Parliament issued a proclamation which relieves cooperatives from the need to procure a trade license once any cooperative is legally registered. Technically, electricity cooperatives are considered “generation for self-consumption”. Under this circumstance they just need to notify regulator and comply with safety regulations according to the electricity regulation. Clearance of project promoters by EEA will, however, become a requirement.
86 At the end of the project investment cycle, the electric cooperatives is requested to submit a self-certification letter to the REES indicating that they have obtained the necessary clearances and licenses. The self-certification letter confirms the availability of at least the following documents: (i) Business Plan approved by REES and Trust Agent, (ii) Cooperative License, (iii) Signed Minutes of Understanding of Establishing the Cooperative, (iv) Cooperative Ledgers, (v) Loan Agreement sign by Cooperative, Trust Agent and countersigned by the Woreda, (vi) Minutes of Procurement including all Pro-forma, (vii) Insurance Policy, (viii) Log Book of Operation, (ix) electrical inspector’s clearance of design and commissioning, (x) endorsement of regulator.

109
Control of tariff setting is the key regulatory challenge when regulating electricity cooperatives. When regulating the tariff of a private commercial service provider the issues are is: to prevent over-charging and also to enable the operator maintain adequate revenue to provide services in a continuing manner covering all acceptable expenses. That is easy: the regulator refuses to approve tariff increases beyond acceptable levels. When regulating the tariff of a cooperative, the issue is to prevent under-charging: the temptation of cooperatives, not least in very poor areas, is to keep tariffs too low to cover the long-term financial cost of maintenance. To protect consumers against the payment of tariffs that are too low is much more complex: how does a regulator enforce that? The EEA has under Ethiopian laws no means at its disposal to regulate the tariffs of electricity cooperatives. Quasi-regulation of their tariffs could, instead, be imposed by REES/DBE through the loan agreement for the investment by including a clause obliging the loan receiving cooperative to pay a fixed (but inflation adjusted) amount each month into a bank account that is used to pay for maintenance expenditures. Presently, this is not done; whereas the business plan of the cooperative includes the cost of maintenance as an item, cooperatives do not have a specific account for maintenance. The Rural Electrification Proclamation has provisions on what happens to existing structures once EEPCo’s grid arrives to a formerly isolated grid system. But the implementation directive has yet to be issued. The issue already appeared with the 170 kW Yaye hydropower plant, constructed with donor support from Ireland, and for two Austrian-financed hydropower projects for isolated grids (Aweto, Bonora) that were still in the preparation phase. Aweto was dropped after completion of its feasibility study because of the vicinity of the project site to the EEPCO’s grid; a fact which had failed to be noticed by the study team. Local communities organized in an electricity cooperative tried to raise finance for the construction of the Bonora project - Austrian development finance for the project did not cover hard investment – but fell short of raising the necessary capital. Both areas were early 2007 electrified by EEPCO, while the detailed design of the Bonora power station was still “ongoing”. EEA is considering to prepare standard PPA to augment small scale renewable power producers who want to supply to the grid.
REF financial assistance and TA to actors in the supply chain Technical assistance to actors in the rural electrification supply chain can be grant financed 100% when industry-wide barriers are addressed. The proposed TA needs to be endorsed by at least three key stakeholders acceptable to REF, and/or be ratified by a recognized industry association. When an individual project promoter requests co-financing support for TA to remove barriers that hinder accelerated business growth, a maximum 50% of project cost can be financed for local assignments, of 80% of project cost financed for international assignments. In all cases, the REF/REES contracts consultants, oversees implementation and pays based on agreed deliverables. During the concept phase of the REF, it was considered to introduce a U$8000 grant to individual businesses which successfully finance a business proposal for a power generation project making use of a renewable energy source and an extra $4000 if it includes a productive-use promotion plan. The amounts were fixed to provide a roughly 30% cost sharing contribution by the business towards the preparation of the plan: it takes about 3 to 6 person-months to prepare a solid business plan.

110
The capacity building activities have been of the “conventional” WB-REF type: training visits abroad and study tours to Bangladesh/Sri Lanka for officials from REES, Regional Energy Bureaus and Regional Cooperative Bureaus; assistance by national and international consultants:
Low cost solutions and technical standards EEPCo is updating its designs and standards for rural electrification in search of lower cost solutions. Former standards specified a three-phase distribution design; "new" standards proposed are a mixture of three-phase and single-phase distribution. EEPCo may also start using supply and install contracts for the major works, with only the secondary work, requiring close contact with customers, being done by EEPCo staff. The cost of investment in isolated grid projects (diesel of hydro) supported by REES/REF is around €200 per connected customer. Various means bring down the cost of investment to this level. Most projects are unable to get standard electric poles (height of 9 -11 meters, 200-300 mm diameter cross section) because they are located too far, raising the cost and leading to delays in installation. The cost of a standard pole is 300 birr and 15-20 years, the sub-standard poles being cost cost 50-75 birr and can last about 6-7 years. Usually, one 200-300 poles per cooperative are needed. Neither meters, nor load limiters are used.
Solar PV Like other African REFs, also REES/REF faced difficulties getting its solar PV-promotion activities off the ground. The solar PV-activities comprise three lines: isolated grids using solar PV, selling 6,000 individual solar home systems (SHS) during the first and second phases of the IDA-project, installing 300 PV-systems for public institutions: schools, clinics, and agricultural centers. REES supports the ministries of Education, Health and Water Resources with the preparation of energy guidelines for improving their services, after which the 300 institutional PV-systems with a capacity of 200 Wp each will be installed.87 The original plan of getting a private project developer to install the systems on a (standardized) lease-purchase basis has been dropped. REF will now give a 100% grant towards the “purchase” of the systems by the ministries, who will set aside funds in their annual budgets for institutions to finance service and maintenance of installed systems. The ministries have appointed contact persons for the project with REF/REES. Solar dealers for household systems need to comply with minimum technical specifications and be qualified by REES. The latter is dependent on a business plan and approval from a commercial bank or REF/DBE for debt financing.
Results By February 2007, over 200 communities have organized and registered themselves as Electric Cooperatives.
87 The bulk of financing for institutional systems comes from donor-supported investment programs in the education and health sectors, as well as from Government's budget for these sectors, the 300 systems financed by GEF funds given to REF are additional.

111
The size of investment per cooperative in the project portfolio ranges from US$26,000 to US$11 million, the number of forecast connections from 220 to 40,000 and the capacity of diesel generators from 14-70 kW. The total number of connections in the project portfolio amounts to 300,000, see the table. The REF’s technology neutral approach is reflected in the port-folio: 52% are hydro and 41% diesel based projects; while 7% are solar PV based systems. By April 2007, 11 projects are in operation, three have started repayment of their loans to DBE. 10
projects were diesel power based isolated, one was a SHS-project. An additional 15 projects had been appraised by the REES and awaiting appraisal by the Trust Agent. Of these eleven were small hydro based mini grids, one a 15 kW PV-based isolated grid system mini-grid system.88 The total estimated project cost is US$5.2 million and will provide electricity to 23,000 end users. The SHS-project concerns sales of 600
SHS – divided into two phases of 300 (only phase 1 has received a loan so far) in four areas approved by REES (they are not already electrified and REB confirms that the areas are not planned to be electrified within the next ten years). Customers can pay upfront or through a 2-4 years loan. The marketed system size is 20 Wp panel, a 70 ampere hour battery, a 5 ampére charge regulator and one 11 and one 5 Wp lamp. The cost of the system is 4300 birr (US$403). The SHS-retailer purchases the PV-systems from dealers in Ethiopia; by May 2007, the retailer had installed around 100 of these. Since 2005 Ethiopia has hugely accelerated its annual rural electrification program with the adoption of EEPCo’s UEAP and the REF’s off-grid program. Before 2005, Ethiopia got 100-150 new rural towns electrified per year. In 2007, EEPCo will electrify 815 towns, the REF probably an additional 50 towns. The UEAP program is much larger than the REF-program and provides 24 hours electricity service which is something only the micro-hydropower based grids provide in REF’s investment program. The diesel grids operate only 4-5 hours per day. The productive use impact of the REF-projects, therefore, is low. Basically, they are lighting projects; only 5% of connected households have access to TV. But the REF is important for regional equity (and thus political stability) by allowing far away communities to get access to electricity. The REF-projects with most productive use potential are the hydropower based mini-grids and the institutional solar PV-systems.
88 Installation cost of this is 5-6 times higher than for a diesel generator based system.

112
Difficulties and problems
By May 2007, the REF has 10 diesel-based mini-grids up and running. The increase in the cost of diesel since the preparation of their initial business plans, is giving households difficulties in paying their monthly tariffs and the cooperatives, in turn experience difficulties in paying back on their loans on time. On average, 25% of connected households cannot pay the agreed to monthly tariff; the percentage depends on the location of the community: in cash crop area up to 90% of connected households can pay. EDB was forced to recommend the cooperatives to double the monthly tariffs to 20 Birr per household per light. As even this increase was too low to cover the full financial cost of supply, other measures included to lower the operational hours of the diesel generators and to cut the size of the generators in half by disallowing load-intensive productive uses of electricity.89 In one project, for example, a 80 kW generator was foreseen to service 1200 households; instead a 40 kW generator was installed. It can provide lighting to 3500 households by using 11 WP compact fluorescent lamps. Of 16 financed diesel-grid projects; six were put on hold because the cooperatives were unable to find professional technicians in the surrounding area to install the system. Getting technicians from other areas leads to 3-4 times higher installation cost than provided for in the business plan. Minimum technical specifications/for generation and distribution need to be specified/that maintain low cost design incentives, yet facilitate interconnection when the main grid arrives. Several electricity cooperative find it impossible to raise the upfront 15% of total project cost.
Evaluation of Ethiopia’s REF concept The right side of the diamond – the supporting infrastructure for rural electrification composed of the institutions for rural electrification planning, TA and financial support, subsidy policy and
regulatory regime – gets a high score, because the REES-structure makes very cost-effective use of existing institutions. The implementing structure of REF’s program with its reliance on regional energy bureaus and regional cooperative offices and the provision of total debt-finance by the REF channelled through EDB has shown its strength in getting a large number of local cooperatives organised very fast. The reliance on use of existing organisations and their staff leads to low administrative costs. The supply chain is the Achilles heal of
Ethiopia’s program for decentralised rural electrification. Not because of insufficient efforts to 89 The first 2 projects were implemented as planned - the 20 birr tariff cannot pay even the monthly diesel costs. The remaining 8 projects reduced the capacity of diesel generators by half.
Ethiopia’s Rural Electrification Diamond
FinancialIntermediation
Supply Chain
Organisat ion of Supply / Electricity Service to Consumers
REF/REA and
Subsidy Policy

113
boost the supply side through technical and financial assistance, but because of the general technical backwardness of rural Ethiopia. Nor can the program rural poverty: it is not yet evident whether the large majority of the electricity cooperatives will be financially-institutionally viable – in particular those relying on diesel generators. There is a risk that an important number of supported projects will prove not to be financially viable, and that the REF has to bring in rescue finance at a later stage to pay for the rehabilitation of degraded systems. Already now, tariffs are too low to cover the long-term financial cost of supply; and the low upfront connection charge has attracted too many households with insufficient ability to pay the monthly service fee. In view of the de facto weakness of the existing electricity cooperatives, the 50% score for organisation of electricity supply may seem surprisingly high. The motivation is that the cooperative system as such may be viable in Ethiopian context; it is the weakness of the supply chain, which above all causes problems. Yet, it is necessary to improve the connection policy in order to reduce the number of non-paying households. Because the existing system for financial intermediation for rural investments is weak, the policy of choosing by tender a bank to act as multi-purpose financial agent for decentralised rural electrification is wise. The REF’s insistence on “zero investment grants (other than the interest rate subsidies provided by the “below-commercial interest rates” of its loans) allows a larger number of annual electrification projects to be financed with the available funding; at least in the short to medium term. The REF has not yet managed to attract donor finance other than from the original concept-starting donors: the World Bank/GEF/IDA.

114
I.3 Guinea’s BERD: the low-cost Champion
Specific Characteristics of Guinea’s Approach
Guinea’s approach is remarkable in three key aspects. (i) It works exclusively with mini-projects/concessions, at least at present. (ii) The approach is very low-cost: the cost of investment per connected customer in the isolated grid projects so far accepted by BERD – the “agency” in charge of rural electrification and the REF - is an incredible €85 (excluding the cost of project preparation); the daily hours of operation are normally 4 hours per day. (iii) BERD’s cofinance comprises both grant and loan. Loan administration is administered by the local bank acting as Trust Agent for the Fund; it is paid a fixed annual fee for that service. The bank performs due diligence of project applicants in accordance with its usual procedures for loan applicants. It charges on behalf of the REF its normal rate of interest. The idea is to build the bank’s confidence in the business of financing rural electrification projects, and, thereby, getting the bank over time to move into rural finance as a normal commercial activity.
General Information about Guinea Guinea had in 2005 a population of about 9.5 million. The capital city is Conakry, with 1.8 million inhabitants. Up to half a million refugees arrived during the ten years of civil war from neighboring countries. The land area of 246,000 sq.km provides the country with a population density of 25 persons per sq.km. Guinea is divided into four regions: the coast of lower Guinea; the central, mountainous Fouta Djallon; the savanna of upper Guinea; and the forest in the southeast. Guinea has abundant natural resources, including 50 percent of the world’s known bauxite reserves, along with diamonds, gold, and other metals; and great potential for hydroelectric power. Gross national income (GNI) per capita in 2003 was US$410 nominal and US$1,990 at purchasing power parity.90 The combination of budgetary pressures linked to the security situation and lax monetary policies undermined price stability, and sent the PGRF off track in December 2002. From 2003 to 2006, the exchange rate fell from 1 CFA for 3.5 FG to 13 FG, while the annual inflations rates were in the range of 30% per year. Severe electricity and water shortages in the capital and major cities, compounded by an increase in fuel, food (mainly rice), and other prices led to civil unrest in mid-2004. The continuous difficulties to contain inflation in 2005 and 2006 eroded the real value of income and contributed to two major strikes in early March and July 2006, which ended peacefully based on a negotiated agreement on wage increases and other government concessions. GDP grows during the last years averaged around 3% per year, In 2007 about 30% of the population lives in urban, 70% in rural areas. Guinea’s poverty rate - meaning an average monthly household income less than US$49 - in 2002 was estimated at 54% of
90 World Bank: “World Development Report 2004”

115
the population, or 6 million inhabitants91. The rural poverty rate was 75%. The national electrification rate is around 6%, about 35% in urban areas and 1% in rural areas.
Privatisation and Restructuring of the Power Sector in Guinea At the end of the 1980s, some 24 cities in Guinea had some electricity supply. Guinea had three separate grids: (i) the hydropower plants at Samou in Lower Guinea supplied Conakry and its suburbs via 110 kV and 60 kV lines, while a 30 kV line supplied Kindia; (ii) the Dabola hydropower site in Higher Guinea supplied Dinguiraye et Faranah via a 30 kV line; the Kinkon hydropower site supplied Labé, Pita et Dalaba via a 30 kV line. The other cities were served by isolated grids, almost all supplied by diesel generators. Total installed capacity was 148 MW out of which 47 MW were hydropower, 40 MW steam turbine and the rest diesels. Annual power generation was 400 GWh. Three enterprises supplied generation: the state enterprise Société Nationale d'Electricité S.N.E. generated 185 GWh, the two industrials/mining complexes Friguia and CBG 140 GWh and 75 GWh respectively. Privatisation of state enterprises was a necessity but also an uphill fight in Guinea. The 26 years of the “revolutionary” President Sékou Touré from 1958 to 1984 left the state enterprises in a dilapidated state. A comprehensive structural adjustment program was launched to redress the situation; the state-owned national state enterprise S.N.E. was liquidated in 1988 and replaced by the state-owned company Enelgui with an independent Board. As this did not change the management failures of the utility, the Government entrusted in 1990 the management of the company to an international consortium composed of Hydro Quebec and Price Waterhouse Canada. In 1992, in the Government’s power sector policy letter to the World Bank and IMF92 the Government committed itself to disengage from direct involvement in the power sector. A first follow-up was the 1993 Electricity Law, which, inter alia, created the Conseil National de l'Electricité (CNE). In 1994, the Government chose the “affermage” route under which the assets continue to be property of the state with a private company leasing and operating them. A new mixed public-private power company was formed, the Société Guinéenne d’Electricité de Guinée (SOGEL) in which ENELGUI, on behalf of the Government of Guinea, held one third of the shares, the other two thirds were held by the French-Canadian consortium HQI /DESAU /EDF /SAUR. SOGEL received the concession for power distribution in Conakry and 24 other urban centres in the interior of the country. ENELGUI was turned into « Société de Patrimoine par l'Etat Guinéen », that is, asset holder for Government owned property in the power sector. The 1998 Electricity Law allowed direct private investments in power generation and introduced the BOO-concept also for distribution Yet, the events went backwards: the contract with HQI /DESAU /EDF /SAUR was terminated in 2001, three years ahead of schedule in a total state of 91 The Office of National Statistics of Guatemala considers that the USD 48.62 amount is the minimum required to cover the necessary requirements for survival 92 Lettre de Politique de Développement du Secteur de l'Electricité datée du 26 juin 1992. The Policy Letter from 1992 is still in 2007 the only valid general policy document for the power sector although the affermage approach has failed in the meantime. The Government is preparing a new policy letter. The original plan was to use a consultant to prepare a draft. That was changed. The draft is now prepared by the Ministry of Energy with inputs from sector institutions, including BERD. A consultant will be contracted to provide comments and help in the detailing. The letter will contain a proposal for a new Electricity Law and guidelines for the institutional reform of energy sector.

116
confusion. A key point of contention had been the inability of the company to reduce the non-technical losses in the distribution system. SOGEL was dissolved and replaced by a new state-owned power company called Electricité de Guinée (EDG), which started operating in 2003. EDG has not made much progress so far. New connections are added, but service quality is poor even in Conakry: voltage fluctuations, brown outs, black-outs and power cuts are a daily feature; costing the country an estimated 2% of GDP per year. Workshops work in the evenings, as there often is no electricity during the day. Auto-generation remains a very important source of power.
BERD’s legal status and staff What survived, despite the sector’s political and the general economic difficulties in the country, was the “privatisation of rural electrification” which started in 2002 with the approval by the Government and by the World Bank/IDA/GEF of the Decentralised Rural Electrification project (ERD).93 ERD was introduced as a supplement to electrification by grid extension through SOGEL. ERD was to promote small scale isolated grid projects and sales of solar PV-systems by private project developers. The World Bank/IDA made a US$5m loan and GEF a US$2m grant94 available to establish the Fund for Decentralized Rural Electrification (FERD) and to finance ERD activities for the first phase up to 2006, later, during implementation, the first phase was extended to 2008. In 2001 a decree by the Ministry of Energy95 created the Unit for Decentralised Rural Electrification, BERD (Bureau d'Electrification Rurale Décentralisée). BERD does not have status of Rural Energy Agency; it is established on a trial basis as executing unit for the ERD-project reporting to the Steering Committee (“Comité de Pilotage”) that supervises the project. The intention is to upgrade BERD to agency status once the concept has proven its worth in practice and a National Decentralised Rural Electrification Program is implemented. A study to develop the concept for the Agency with its global objectives, resources, etc. will be launched in 2007 with the envisaged next step being the legal creation of the agency.96 BERD has a staff of 12 (excluding drivers and guards). The Director is assisted by an advisor, a communication officer and a secretary; the Head of the Financial and Administrative Department97
is in charge of a secretary-accountant and a tender-specialist and the Head of Project Department supervises two engineers, one economist-analyst, one secretary-dcoumentalist.98 The team of technical assistance experts was composed of one resident international expert during three years, who was assisted by short-term national and international experts on an ad-hoc basis. The recruitment of staff was done in a transparent manner through a national call for applications to the positions in the newspapers. A private consulting firm invited the most qualified 10-20 candidates per position for a written examination and interviews. Of the chosen staff only one came from Public Administration (from Ministry of Energy), who therefore needed to be relieved from 93 Projet Electrification Rurale Décentralisée 94 More specifically : special drawing rights of 1.6m, of which 1.2m for project finance, 0.2m for consultant services and 0.2m unallocated. 95 Le Ministère de l’Hydraulique et de l’Énergie. 96 In the meantime some minor confusion has been created by the creation of an entity within the Ministry of Energy called ANER (Agence Nacional Electrification Rural). Basically it is an empty box with a single person being appointed to it; a precise content for ANER has not been defined. 97 « le Service Administration et finances (SAF) » 98 « le Service Ingénierie et Travaux (SIT) »

117
his “Statut de Fonctionnaire”. The salary of staff is in the range of US$400-600 per month; the level was fixed as being in between the salaries for staff in World Bank/IDA financed projects in Guinea and the salaries for public civil servants; but closer to the former than to the latter.99 Early 2003 BERD had recruited its staff and became operational. The operating budget of BERD had a generous provision for training; inter alia to courses abroad. The latter component, however, was dropped. The Director of BERD decided that it made little sense to send staff abroad to participate in a “7 months long training program” since the unit was too small to sustain such loss of daily staff. Capacity building was done through: (i) learning by doing (“sur la tâche”); (ii) learning through exchange of experiences by sending staff to international seminars and visiting other rural electrification agencies such as Senegal’s ASER; (iii) pragmatic training linked to expected results: a one-week course in Canada to be trained in RET-Screen, courses in project planning, utilization of GPS, etc. The learning-by-doing capacity building started off with BERD’s tender for four pilot projects for rural electrification – one for each of the four major regions in Guinea. These were used to learn about dimensioning, testing and refining the software tools and operating concepts, and to learn about what problems operators have with suppliers and installers. BERD staff participated in all aspects of the work and learned through this an in-depth understanding of the ERD concepts and their potential pitfalls.100 Learning-by-doing proved to be an efficient tool in developing a first class team of staff.
BERD Involvement in Project Cycle BERD is actively involved in the project cycle from the initial beginning to the operation phase. A project developer prepares the feasibility study and the business plan with the assistance of consultant bureaus that have been trained by BERD. Once the studies are completed, the project developer submits the business plan to BERD together with the application for the financing of the project by FERD and the application for being granted a concession for the project. BERD checks that the feasibility study and business plans are according to standards and verifies that the tariff and the forecast development in demand allow the investor an IRR on equity in fixed prices of around 30%. BERD submits its conclusions to BICIGUI, which manages the FERD and takes the decision on providing the credit and subsidy to the project. BERD informs the Steering Committee about the approved project. BERD next assists the developer with being granted the investment incentives (tax advantages) that are available under the Investment Code and which have to be authorized by the Office for the
99 A public official with 20 years of experience has a monthly salary of 300,000 GNF (US$87) per month not including bonus payments; in a project, a person with level of experience would received 1.5 million GNF (US$433). 100 The learning by doing extended to analytical-conceptual issues. The Government decided late 2006 that time was due for a new energy policy letter, to replace the 1992 policy letter. The first idea to contract an international consultant to prepare a draft was discarded. In stead it was decided that BERD in collaboration with MEM would prepare a ndraft and that an international consultant would be invited to comment on it.

118
Promotion of Private Investment101 under the Ministry of Commerce. In parallel BERD assists the developer with being granted the concession for the project by the Ministry of Energy. During the initial operation phase, an operator – in ERD terminology called an OPERD (“Opérateurs Privés d’Electrification Rurale”) - can get technical assistance in management.
Low Cost Concepts BERD’s low-cost approach to rural electrification aims to get maximum connections per invested euro; the productive uses of electricity are assumed to develop spontaneously in a community once the productive infrastructure is there. The low cost approach has led to costs of investment in diesel-powered isolated grid projects of €65-80 per connected household for the project developer; including all other costs, including for BERD operation and project management the cost doubles. The low cost emphasis has seven dimensions.
1. To keep down the cost of operation, ERD/BERD focuses on the satisfaction of the basic needs for electricity: diesel generators in the isolated grids operate normally only four hours per day.
2. When it comes to choice of technical options, BERD systematically chooses the lowest cost
solution in particular with regard to the upfront cost of investment. Locally produced wooden poles are used that have a short lifetime of 5-6 years but cost 40,000 FG (US$10) only. Household connections have neither meters nor load limiters; payment is according to used lamps and appliances, compliance is enforced through inspections. Powerhouses – normally financed by investor equity - are simple constructions costing €1500-2000 a piece. An exception is the exclusive use of three-phase technology, but that can be justified with reference to the difficulty of finding single-phase motors.
3. BERD made great efforts to expand the supply chain and increasing its productivity by
offering on a cost-shared basis systematic training to all actors in the chain - consultants, construction companies, project developers – and by making standardised software tools available to them free of charge: for the optimal dimensioning of power systems (diesel, micro-hydro and solar PV, respectively), for making the financial analysis of technology options, for preparing business plans, training in accounting (project developers) and a manual for the management of small concessions and a GIS.
4. Fourth, BERD closely monitors the prices for goods and services used in rural
electrification, maintaining a data bank on the prices of materials and equipment, and fixing low prices for the standard services that are provided in the supply chain, e.g. by consultants and installers of connections.102 The monitoring (and capacity building) task is facilitated by BERD’s shortlist of trained, qualified consultants, equipment suppliers and installers that can participate in tenders for projects. The project developers must ask three installers for a price quotation.
5. In order to benefit from economies of scale (and to avoid the risk of manipulation of
invoices in a collusion between suppliers and project promoters) BERD centralises the 101 l’Office de Promotion des Investissements Privée (OPIP) 102 The fee paid to an installer for installing a cupboard, for example, is 200 FG = 6 UScents

119
purchases of equipment for the projects, pooling the demand from several projects into a single tender.
6. The costs of transaction for project applications are kept low by the built- in coordination of
procedures. There is one single package of application forms (for the concession, grant finance, loan finance, etc.), each institution involved in the processing of the request has established one focal point to handle it, and BERD follows the process from beginning to end.
7. BERD monitors the quality of financed work and of the equipment. When the material is
handed over to project developers/installers, BERD controls by inspection that it corresponds to the specifications in the tender. Upon termination of the instalment of the system, BERD performs quality control by own staff or by consultants from the shortlist.
Rural Electrification Fund (FERD) and Involvement of local Financial Community
The ERD works with the local financial sector at two levels: (i) the FERD is managed by the commercial bank BICIGUI to provide grant and debt finance to project developers, (ii) the Crédit Rural de Guinée, a micro-finance institution, which is represented places where BICIGUI is not present, assists BICIGUI in the collection of 4% of the monthly collection. The financial community in Guinea seems to be awash in liquidity; yet the willingness to engage commercially in lending to rural electrification is close to zero. The lending process is not easy, as political environment is unsafe. Banks prefer to give loans to businesses involved in commerce as repayment is faster. Loans have a maximum duration of 3-5 years. Banks asks as a minimum 40-80% in assets / security and an equity-financing level of 20-30%, which for important projects (loans higher than 1.000.000.000 GNF = 200,000 euro) increases to 50%. BICIGUI’s interest rate on deposits in 2007 is 14%, its lending rate 19.5%. Commercial bank lending rates of more than 20% are found, yet in view of the inflation rate of 40% in 2006, the real rate of interest is negative. BERD’s response to the debt-finance challenge is the ERD formula for project finance: 20% developer equity, 30% subsidy and 50% through a ten-year loan (with a 19.5% rate of interest); the credit and the grant are both funded by FERD and provided through BICIGUI. BICIGUI, which won the tender for the management of FERD, is paid a fixed annual management fee for the job: under the present contract 46 millions GNF (= US$12000) per year. Repayments on the loans flow back to FERD. Thus, the debt-finance part of FERD functions like a rotating fund. BICIGUI performs two financing functions: (i) to make project finance available, (ii) to safeguard OPERD-equity payments and consumer tariff payments. As soon as an OPERD orders equipment for a project the OPERD must open an account at BICIGUI into which the 30%-equity contribution is paid. Part of or all equity can be provided in kind in the form of buildings or equipment to be used in the project; but that needs verification and valuation. During the investment phase, the loan-subsidy contract is adjusted automatically according to the exchange rate of the GNF: amounts are fixed in dollar, the loan is adjusted in GNF. During operation an OPERD keeps three accounts at BECIGUI: (i) operator free disposal, (ii) renewal of equipment, (iii) repayment of debt. BICIGUI performs the due diligence function of appraising the credit worthiness of the OPERD and the financial soundness of the project according to its normal criteria. Once the dossier arrives,

120
it takes BICIGUI from 1-2 weeks to process the request; one week is normal, but one more week can be needed if BICIGUI has doubts about the dimensioning. The combined grant & debt finance approach of ERD is a short-term solution to the financing bottleneck posed by the absence of long-term commercial loan finance for rural electrification investments. But as BICIGUI builds up know-how in the finance of rural electrification and in establishing a work relationship with and confidence in the reliability and credit-worthiness of individual OPERDs, it simultaneously opens the long-term perspective that BICIGUI may engage in commercial lending to rural electrification projects; followed by imitators. The procedure avoids the moral hazard problem of the alternative solution of creating a guarantee fund for rural electrification loans. A previous experience in Guinea with a €10m guarantee fund for agricultural projects, which made a deposit in each participating bank, had not worked in practice – the loans were not reimbursed and political pressure entered.
Subsidy and Tariff Policy ERD finances three basic technical options for power supply: (i) diesel generators with a capacity less than or up to 250 kW, (ii) mini- and micro-hydropower with capacity lower than or up to 250 kW, (iii) solar PV-systems for households and for institutions. FERD pays a 30% investment subsidy to diesel power isolated grid projects. According to BERD, for the micro-hydro power plants for isolated grid operation to be competitive with diesel generated power on a per used kWh basis, a subsidy of at least 85% is required. FERD’s subsidy policy for solar PV-systems has not yet been decided; the original intention of a “$ per Wp” subsidy was dropped. During the preparations of ERD it was considered whether OPERDs should make use of existing investment incentives, or a separate incentive code/regime be established for rural electrification investments. The latter option was rejected. OPERDs can avail themselves of the general tax incentives that are offered by the Investment Regime for Small and Medium Enterprises or by the Regime for Investments in Disadvantaged Regions. The authorization by OPIT under the Ministry of Commerce takes only 3 days to acquire under the collaboration procedures established by BERD. Subsidies during operation are limited to non-taxation of revenue from rural electrification: VAT is not levied on sales of power and income from rural electrification is not taxed.103 The State does not have the means to finance direct subsidies and to administer a system of de-taxed diesel fuels - at the pump the price is around 180% of the import price – was rejected for being too difficult to administer. In ERD-theory, electricity tariffs are negotiated by the OPERDs and the served community based on the results of socio-economic studies that are done locally; with the 20%/30%/50% formula being adjusted according the outcome of the feasibility study and the simulations of the business plan. In practice, the financing formula is fixed, whereas the tariffs are the residual outcome of the
103 In the Energy Policy Letter from 1998, Guinea had promised to “de-tax” (“dé-fiscaliser” ) the electrification activities of ERD. The main argument to support the request was that electricity service in rural areas is more expensive than in urban areas, and poverty is higher. It took one-and-a half-year to get the défiscalisation accepted by the Ministry of Finance, and it still required to define the “area” and the “length” of detaxation.

121
simulations for the business plan to give the investor the target return on equity. Once the tariff has been fixed, the sale of connections begins. If at the start of operations, the number of connections are lower than the expected number, negotiations take place between BERD and the OPERD about what adjustments can be made either in the tariffs or in the financial conditions. BERD had undertaken socio-economic surveys to establish the tariffs in the four pilot projects based on the ability and willingness to pay for electricity by calculating present energy expenses that would be replaced by an electricity service that operates from 19-23 hours. The results showed that in all four areas replaced expenses amount on average to around 3000 GNF per month (=US$1.6 at the year 2003 exchange rate of 1900).104 BERD’s software for the business plans offers customers the choice of 8 different tariffs depending on the capacity that they want and can pay – expressed in $ per low-voltage bulb and different combinations of lamps and appliances. The total demand for capacity that results from these requests is used to design the capacity of the system. Basic internal wiring is done by the OPERD during the investment phase. The upfront payment by clients is limited to a small connection fee and a 1-month advance payment on consumption.
Sensibilisation Campaigns Since October 2003 BERD has carried out a large number of awareness-raising information workshops at local communities to make sure that local decision takers and local administrators (the partners for ERD) are acquainted with the concepts and rules of ERD. Radio and TV spots and newspaper articles are other means of communication.
Planning for Grid Extension and Isolated Grid Projects A national long-term power expansion plan (Plan Directeur d’Électrification) has been prepared for generation and transmission, which also takes connections with other countries into account. The plan includes neither distribution nor isolated grid electrification. Discussion on the preparation of a Rural Electrification Plan have started. It would cover rural electrification by grid expansion. Electrification through isolated grids will proceed through bottom-up approaches.
Project Developers, Scaling-up Potential and Implementation Problems Local communities cannot take on electrification projects as owner-developers-operators. A clause in the ERD/BERD agreements allows this possibility, but use of the option has been rejected. The reason is that the legal status of community ownership is not clarified with regard to civil responsibilities and possibilities for sanctions. The project developers have different backgrounds: farmers, engineers, Minister of Commerce, energy equipment supplier, business woman. But all originate from the district they serve. The project initiative for the project has up to now either originated in the “associations of people from
104 The replaced energy costs in rural areas are “daily”; introducing “monthly costs” by electricity is something new.

122
the district” who live in the capital Conakry and encourage a businessman/woman who originated from the community to engage in the electrification of their community. Or, a local businessman/woman decided to go into electrification after hearing about ERD/BERD on television or other channels. One would expect the implementation record of a new scheme to increase over time. Yet, the table below shows that the number of applications for new concessions per year is not increasing. In early 2007 no applications were received; one should take note though that this was a time of political turmoil: strikes were organised against the President to force him to implement more responsible policies. Table 44: Guinea BERD Evolution in Applications for Concessions
Year Applications Accumulated
2003 7 7 2004 25 32 2005 12 44 2006 12 56 2007 0 56
BERD tries to encourage scaling up by getting a professional energy supplier with strong financial means into rural electrification: oil companies who have gasoline stations in rural areas with stand-alone generators and who could expand electrification from there. Contacts with TOTAL for that purpose seem to lead to a positive result. TOTAL’s Direction Développement Durable in Paris has so far paid 10 million GNF (€3000) for a socio-economic study to verify the potential. Overall, the operators have high praise for the assistance by BERD who is regarded as an efficient facilitator. But the length of the processing procedures from the first contacts with the community to first operation of the project poses a problem for operators. Before the operator can apply, the population in the community has pay the small upfront charge. The population then has to wait impatiently for 5-6 months before getting the promised electricity supply.105 . Rumours about the unreliability of supply in areas served by EDG undermine consumer confidence in electrification promises also by others:” even if we pay the monthly charge, we may not get electricity service!” Developers found problems with the demand forecast. (i) There is a large difference between the number of connections in the community that is estimated in the feasibility study and the actual number once the project enters into operation. May 2007 examples are: 350 instead of 850, 100 instead of 588 (however that number was for the end of year 3), 280 instead of 400. (ii) Demand per connection is also lower: people who originally wanted to have 5-6 lamps, want only 1 by the time they are connected. The hope and expectation of the developers is that demand will pick up once the local population sees that the power supply works. Others experienced problems with the cost of investment forecast. The estimated length of cabling for an average household connection of 20 meters is largely surpassed in practice: some turn out to live more than 50 meters away from the LV distribution line. This increases the cost of investment beyond that foreseen in the business plan.
105 For the first four pilot project the period was particularly long: 1.5 years. It lead to the normal BERD application process being started almost simultaneously without awaiting the results of the pilot projects.

123
Regulation The OPERD concession is given for a duration of 15 years from the date of approval of the business plan. The concession concerns electricity service for a specified district(s) giving the operator exclusivity within these. The concessions follow the BOO (Build-Own and Operate) model of the Electricity law of 1998 (loi L97/012/DN): after 15 years, the operator is to hand over the system in good conditions to the state. The concession, however, is renewable. Since the operator gets a 15 years concession, the population must know the request and agree to it. The application for the concession awarded by the Ministry of Energy must therefore have attached a demand for the project from the beneficiary population. Since ERD/BERD does not create “electrification user committees”, the request for the project is signed by the district authorities. The Rural Development Committee (CRD - Comité Rural de Développement) plays the role of “electrification user committee” in terms of assisting a developer in finding clients and during operation in assisting with the protection of equipment. 106 The concession of the national power company EDG is not a territorial concession, it is a list of localities. Therefore there is no issue at present about OPERDs entering into a concession area. The problem for the future – if the ERD scheme blossoms and the EDG starts engaging actively in rural grid-extension projects is handled by the “clause de reprise” in the contracts. The concession document does not fix an obligatory number of connections – that is fixed in the subsidy-award contract with BERD. The concession obliges the OPERD (i) to connect persons living in the service area defined by the LV-line, (ii) to invest annually in the extension of the grid, and (iii) to gradually increase the service rate in the area (percentage of connected households). An independent power sector regulator has not been set up in Guinea. The OPERD concession designates BERD as regulator for tariffs and quality of service until such an entity is established. The level of the tariffs is fixed by the simulations for the business plan and agreed to by consumers in the service contract signed with the OPERD. They are regulated semi-annually according to the formula fixed in the contract. If the automatic adjustment leads to an increase of more than 20%, or if one of the components in the adjustment formula has increased by more than 50% since the formula was fixed, a review is made of the tariff formula. The concession contracts includes a pluri-annual investment plan for the concession. The OPERD is obliged at the end of the third quarter each year to prepare an annual investment plan and a plan for how demand is to be covered the next calendar year and to submit these to BERD. For monitoring of service quality the OPERD is requested to install equipment for measuring losses and to keep a register with complaints from consumers that are received.
Program Objectives and Results The year 2006 targets (first 5 years) for the ERD-project fixed in the appraisal document were by then to have: (i) trained 25 consultants and 50 electricity system installers, (ii) provided PV-systems 106 The “Prefectures” are headed by prefects appointed by the Central Government. The authorities at sous-prefectural level – CRDs and districts - are elected.

124
to 5100 families, (iii) 15 concessions based on micro-hydros (capacity below 50 kW) serving a minimum of 1500 households, (iv) 36 concessions using diesel and serving a minimum of 3600 households. Guinea has 303 rural municipalities (Communautés Rurales de Développement, CRD) with an average population of 22,000. In 2006, the electrification target was reformulated to electrify 75 CRDs by 2008 (the first phase of ERD was extended to that year), meaning a 25% CRD-penetration level and to serve at least 20,000 households. BERD’s data bank on the supply side early 2007 comprises 14 trained consultants (bureaux d’études), 32 installers of which 8 are considered to de facto engage in rural electrification, and 20 equipment suppliers (not all of whom, however, supply price and other information to BERD’s data bank. 20 OPERDs have received training in OPERD procedures and management. In May 2007, 11 OPED-projects, all diesel-based, were in operation with 7200 connections. Including all 56 applications for concessions that have been received until now, more than 20,000 connections will be reached. BERD will then have managed to electrify more communities than Guinea managed during previous 40 years. One will note that the policy of BERD to get maximum connections per € of invested FERD-money is partly in contradiction to the wishes of IDA/GEF to include a sizeable renewable energy component. The GEF grant funds for FERD are earmarked for hydropower plants and solar PV-systems. Progress with regard to micro-hydro plants has been delayed due to a de facto shortage of appropriate sites for micro-hydro power: being located close to community and attracting the interest of an OPED. Progress in the penetration of PV-systems has been delayed. The TA review mission in October 2006 suggested the use of funds for the proposed investment program shown in the table below. Table 45: Suggested ERD Investment Program 2006-2008
Number of projects
Customers / Connections
€-Cost per connection
€ Cost of Investment
Share of total investment
Isolated diesels 49 19,600 87 1,703,093 40%
Micro-hydros 5 2,000 341 682,500 16%
Solar PV 10 4,000 468 1,870,000 44%
S/total 64 25,600 4,255,593
BERD’s focus on electricity supply from 19-23 hours in the evening does not prevent a project developer from investing in power supply for productive purposes, or to offer power supply to productive users of electricity during the day. That can be achieved by direct power lines to productive consumers, who receive power also during the day. Typical businesses that the project developers invest in or supply are: video-club, multi-platform, cold storage for frozen fish, mills, TV, de-culling of grain or coffee, welding. The cost-effectiveness of BERD’s approach can be deducted from the same mission report, since it indicates the required level of financial support, see table below.

125
Table 46: Cost of FERD-Finance and Cost of BERD-Assistance per expected serviced Customer Costs in € In % of total Cost in € per customer
Investment in OPEDS, PV1) 4,255,593 77% 166
Capacity building, coordination, management 1,244,407 23% 49
TOTAL 5,500,000 100% 215
1) It is assumed (to be checked) that the investment refers to total investment including 30% developer equity The table indicates that the split of total investment cost between direct investments (individual projects) and indirect investments (cost of support programs) foreseen in the mission report is 77% / 23% and the cost per serviced customer is €215 in total and €166 in terms of investment finance and €49 in terms of support to capacity building and cost of program management. The investment per customer – before including support costs – of €166 per customer is much high than the cost of around €85 in previous investments. One possibility is mis-interpretation of figures (see footnote 1 to the table), another is the inclusion of PV-systems, which are much more expensive than the cost of the isolated grid systems up to now.
Evaluation of Guinea’s approach to Decentralized Rural Electrification BERD achieved results in a difficult political-economic environment. The “balanced score-card” is,
therefore, largely positive. The high score for institutional-regulatory set-up reflects the quality of BERD management and staff and the cost-effectiveness of the set-up. The combined costs of transaction (BERD operating costs + costs of regulation) and of indirect subsidies (support to the supply side) per connected customer are probably among lowest of the investigated REA/REFs. The regulatory framework, on the one hand, is simple – as BERD regulates. On the other hand, it is comprehensive: operators must submit annual reports on tariffs, service quality and pluri-annual investments plans for service expansion. Seen from
the individual small project’s point of view, the regulation seems over-ambitious and automatic-bureaucratic. But, more benevolently, it can be interpreted as an instrument to train OPEDS into becoming professional service providers, preparing them for larger-scale engagements in the future. In any case, interviewed project developers did not find the regulatory reporting requirements burdensome. The high score given to the supply chain is derived partly from the outcome: very low costs of investment, partly from the comprehensive software systems and TA which BERD has made available to the actors in the chain. The score to financial intermediation does not reflect the quality of existing financial intermediaries that operate in rural areas; it is due to the multiple roles of BICIGUI and use of the 50/30/20 loan-subsidy-equity formula for project finance. The lowest score is given to the organisation of electricity supply: the OPEDs are small, weak companies. If BERD succeeds in getting some professional energy companies involved (the gasoline station initiative), the score will increase.
Guinea Rural Electrification Diamond
FinancialIntermediation
Supply Chain
Organisation of Supply / Electricity Service to Consumers
REF/REA and
Subsidy Policy

126
I.4 Mali: Combining Rural Electrification & Household Energy, Small & Large Concessions
Specific Characteristics of Mali’s Approach
Mali’s AMADER is a rural energy agency engaged in rural electrification and biomass household energy projects. AMADER’s electrification strategy is flexible, allowing both major “planned” rural electrification concessions – ten for the country – and smaller “spontaneous” concessions within these. The Rural Electrification Fund managed by AMADER gives grant finance in the order of 60-80%; project developers are expected to raise the rest-finance through own-equity. Isolated grid projects represent the majority of supported projects, grid extension and solar PV-projects are financed as well.
General Information about Mali Mali had in 2004 a population of 12 m and a population density of 10 persons per sq.km. 80% of the population lives in rural areas. Year 2005 gross national income (GNI) per capita was US$380 (nominal) and US$1000 (purchasing power parity).107 Mali has one of the highest illiteracy rates in the world. Based on 2006 figures, about 16 percent of the population has access to electricity in the country. In urban areas the access rate is about 30 percent and less than 5 percent in rural areas. Mali has 12,000 villages (“localités”) with less than 2000 inhabitants of which only around 100 are electrified. The 9.6 million unserved rural inhabitants represent a connection target of 1 to 1.4 million depending on whether a 1:7 or 1:10 ratio is used per household. Less than 50% of households live close to a water point.
Privatisation and Restructuring of the Power Sector in Mali The majority state-owned Société Energie du Mali (EDM) supplies electricity and water to the urban centers of Mali. EDM had in 2004 154,000 electricity customers and 91,000 water supply points, a staff of 1620 persons and a turn-over of 64 billion FCFA (€102 million). EDM generated 0.72 TWh in 2004. Total installed capacity in 2004 was 153 MW, half of which in hydropower capacity, the other in the form of three diesel power plants in size ranging from 12-20 MW. The HV-grid had a length of 400 km and the MV/LV grid of 3900 km. System losses in the interconnected grid were 23% and in the isolated grid 19%. As the economic and financial status of EDM continued to deteriorate during the 1980s and 1990s, two major attempts were made to improve its situation:
• In 1993, the Government agreed with donors to consolidate all electricity generation, transmission and distribution activities within EDM and to entrust the management of EDM via a time limited management contract108 to a foreign partner. The management contract was
107 World Bank: “World Development Report 2007” 108 Contrat de Délégation Globale et Temporaire de Gestion

127
entrusted to the “Groupement SHEC” composed of SAUR International, EDF International, HYDROQUEBEC International, et CRC-SOGEMA.
• In December 2000, after a call for tender for the purchase of 60% of the shares in the company, EDM was privatised with SAUR International acquiring 39% and Industrial Promotion Services (West Africa) - the West-African branch of the Aga Khan Fund for Economic Development (AKFDE) - 21% of the shares; the State kept ownership of the other 40%.
The electrification target of the Government for the year 2010, adopted in year 2000, is very ambitious. It foresees an increase in the urban electrification to 63%, and in the rural electrification rate to 16 % with the electrification of 2,000 communities; leading to an overall national electricity service rate of 25%. The 20 years concessions contract of EDM/SAUR defined a €600 million water and electrification investment program to be fulfilled by the concessionaire. The latter comprised the electrification of 97 urban communities and the construction of HV-lines and MV/LV lines, mainly around the towns. Rural electrification was to be opened up for private project developers of any kind with a rural electrification agency to promote projects and a rural electrification fund to co-fund projects. The privatisation of EDM never had a chance to become successful. It was violently resisted by EDM staff during the 1990s, and collaboration between the Government and the concessionaire during the post-2000 period was characterized by mutual misunderstandings and distrust. Following the presidential address to the nation in January 2003, the national electricity and water regulator CREE took the decision to lower tariff levels for water and electricity with compensation to SAUR/IPS the operator. In 2004 another decision was taken again to lower tariffs and this time without compensations. At that point, renegotiations of the contracts started. The renegotiations did not succeed and in October 2005, the contracts collapsed with Saur’s departure: Saur sold its 39% share back to the Government. The Government passed a 13% share on to AKFDE (against a PPP commitment to invest in some specified projects). This left the Government with an ownership share of 66%, while the Aga Khan group remained as minority shareholder with 34 percent of the shares in EDM.
Agencies involved in Rural Electrification and Rural Energy Several private initiatives had been started in rural electrification during the late 1990s. In 2003 the development received a strong boost with the creation by law of AMADER (L’Agence Malienne pour le Développement de l’Énergie Domestique et de l’Electrification Rurale) and the “Rural Electrification Fund”. The Ministère des Mines de l'Energie et de l'Eau (MMEE) is involved through the granting of rural concessions and negotiating funds for rural electrification with donors and Ministry of Finance. The Direction Nationale de l'Energie (DNE) prepares national energy plans. The Commission de Régulation de l'Electricité et de l'Eau (CREE) regulates rural electrification concessions with power demand higher than 250 kVA.

128
The Direction Nationale de la Conservation de la Nature (DNCN) is implementing agency for the “natural forestry management” and “rural forestry markets” initiatives, assisted by AMADER.
AMADER as Rural Energy Agency AMADER became operational in 2004. In 2007, its staff comprised 41 persons. 11 worked in the General Directorate, 13 in the Administrative and Financial Department, 8 in the Rural Electrification Unit and 10 in the Household Energy Unit.
The Board of AMADER has nine members, appointed by the Minister responsible for energy, and is composed of one representative each from the Ministry of Finance, Ministry of Energy, Forestry Ministry, Association of Municipalities in Mali (AMM), of the rural electricity consumer organisations, of the private electricity operators in rural areas, a representative of the financial institutions giving loans to rural projects, and one AMADER staff representative. In the active preparation and implementation of rural electrification projects AMADER is the only state actor. AMADER has a monopoly position, being a mixture of finance and TA-provider, planner and regulator: AMADER has the authority to approve also rural electrification projects that do not seek financial assistance from the REF. In household energy, a number of state agencies assist with the implementation of projects, the most important being the national forestry directorate; AMADER performs a key role as planner/think-tank and as the centralising source of information. The inclusion of the household energy unit within AMADER provided a continuity of effort to the activities undertaken by the World Bank financed Household Energy project, which took place from 1996-2002. The unit implements on the demand side energy efficiency and fuel switching projects and promotes on the supply side biomass briquetting and natural forest resource management projects. The inclusion of household energy activities within the framework of a high-profile organisation such as AMADER ensures that household energy activities are not marginalized. This is underlined by the ambitious quantitative

129
objectives that were adopted by AMADER’s Household Energy Unit for the first five year plan 2005-09: increase in LPG consumption from 3,000 tons to 20,000 tonnes, sales of 510,000 improved stoves and ovens, of 61,000 kerosene stoves; of 20,000 low-energy lamps, of 2,000 refrigerators by evaporation; the production of 10,000 tons of fuel-briquettes; updating of 10 existing and preparation of 5 new fuelwood supply schemes; bringing 1,4 million natural forests under management, creation of 1,000 rural fuelwood markets. Synergies between the household and rural electrification activities come mainly through from savings through the joint use of management-administrative-financial staff. In field operations, synergies are basically absent. But in connection with assistance to “rural fuelwood markets”, some of the village organisations asked to get electrification also.
The Rural Electrification Fund AMADER selected by tender the Banque Nationale de Développement Agricole (BNDA) as Trust Agent to hold and manage the rural electrification funds which the Government has secured from World Bank /IDA and GEF. The Fund has four basic budget lines:
• One for financing rural electrification investments • One for financing the budget of AMADER, including the cost of supporting measures • One for loans
The Fund can also finance guarantee schemes. For the first five years period from 2005-09, the Fund disposes of €38.9 million of which 34.7 million are for rural electrification activities, including AMADER’s operating costs. IDA provided a loan of US$35.7, GEF a grant of US$3.5 million, while the Government provided US$5.3 million in counterpart funds. Later, KfW engaged with a loan of €4.5 million for the electrification of two ZEM-concessions, while the Government of Sweden (SIDA) provided €4.2 million for household energy projects. AMADER expects that the equity contributions from private business and communities will amount to US$9 million for the first five year period from 2005-09.
Multi-layered approach to Rural Electrification AMADER is very flexible in its acceptance of support to projects. Projects are identified and selected through four different modalities:
• Tender for concessions for the 10 socalled ZEM (“Zone d’Electrification Multisectorielle) » • Tender for project proposals (criteria: number of clients, expected tariff, requested subsidy) • Spontaneous project proposals, the socalled PCASER (“Projet de Candidature Spontanée
d’Electrification Rurale ») • Pre-electrification projects (solar PV and multi-purpose platforms)
The ZEM-concessions represent the core of AMADER’s rural electrification approach in the sense that they are to deliver the majority of connections in the long run. The other modalities represent interim or complementary electrification modalities that accelerate the implementation of rural

130
electrification projects while the studies for the ZEM are undertaken and the tenders are being prepared. AMADER has divided the country into ten concessions areas, according to socio-economic criteria, not following the regional administrative borders: The ZEM “EBAN” is a zone of high commercial activity and large emigration, AKOU is a cotton zone, AKIT a peanut and cotton zone, EKAY an emigration zone, MKAY a mining area, NORD covers the Northern regions and BAMA the preriphery of the capital Bamako. The idea was that the socio-economic concessions would allow the concession-holder to adjust his terms and operating modality to the local conditions in the concession: eg cotton area has seasonal income, mining has monthly income, emigration areas have often a lot of money leading to higher calls for capacity per connected customer.
The ZEMs have been subject to detailed feasibility studies for AMADER’s ten-year rural electrification program. The first ZEMs are expected to be tendered end of 2007. The implementation of electrification in the ZEM concessions is to take place in successive five year phases, the first starting in 2007, the second in 2012 and the third in 2017. AMADER has prepared detailed “local electrification plans” for each ZEM for the first five year period. The first phase plan for the ZEM De Sikasso, for example, has 13 electrification projects to electrify 13 villages and construct 14 km MT-lines and 132 km LV-lines. The plans are to achieve a minimum of 45,000 connections in the first full year of operation which is 2008: a minimum of 5,000 connections per ZEM, except for the “zone periphery of Bamako”, where the minimum goal is 10,000 connections. The tender for proposals are intended for the electrification of disadvantaged localities for which AMAADER undertakes the feasibility study and draft business plan. AMADER proposes conditions for the electrification of a locality: number of clients, tariff and subsidy level. The bidder offering the best terms compared to AMADER’s proposal is awarded the authorization for the project.

131
The PCASER “spontaneous proposal” modality was not foreseen in the original law text. But since there was no legal basis to exclude them, the modality came up in the implementing regulations: in the document “Cadre de Reference de l’Electrification Rurale” of 2003. But since there was no legal basis obliging AMADER to exclude them, it was considered legal to conclude agreements with themit was considered legal to conclude agreements with them. AMADER has standard contracts for these small projects. A PCASER can have a maximum of 1000 clients only. On average, the PCASERs have 700-800. But they can also be very small projects, for example connection of neighbouring houses by the owner of a generator. A project developer who makes an application for getting the authorization for a PCASER project must attach the signed “opinion of the community” to his application. If the project is placed within a ZEM-concession, the project developer must negotiate with the ZEM-concessionaire to concede the area to him for electrification. Some projects are initiated by communities who form an electrification cooperative (“groupement”). As the law in Mali does not allow “collectivités” to operate electricity systems, in order to get an authorization, a community must have signed a contract with a private operator who represents the community in its dealings with authorities. AMADER will within 20 working days issue a “preliminary rural electrification permit”, which is published together with a call of interest for the project. During the next 2 months competing operators can announce their interest in the project. The project developer has six months from the time of receiving the “preliminary permit” to conclude the detailed feasibility required for the request for the authorization and for the subsidy. To be eligible for authorization and subsidy funding, a PCASER project must get a minimum of 75 points according to the schedules listed below.
Notation
1. Service 40 points
Total number of clients within first two years of authorization 60%
Number of productive, social, community clients 40%
2. Average Tarif 30 points
3. Requested Subsidy 30 points
Subsidy per client 75%
Subsidy per weigthed client 25%
Total 100 points
Category of Client Relative weight
Household 1
Productive 4
Water pumping 5
Ccommunity and social 6
If an application is rejected, a project developer can re-apply after one year.

132
The basic objective for all grid-based electrification projects is to provide 24 hours electricity service, the minimum hours of daily operation are 10 hours. The multifunctional platform projects are for communities with less than 1000 inhabitants. They are implemented by the “women association” in the community. The basic module is a 8 kVA motor (which allows 12 horsepower machinery to operate on it) with a milling machine and a battery charger; in addition a small electric grid is attached to it. The cost is €3,000, to which AMADER can give a maximum subsidy of 80%. Other equipment such as de-shelling machinery is introduced over time as the team acquires the capacity to operate a multi-purpose platform and to finance new equipment. It is expected that a multifunctional platform generates during 10 hours per day and has a lifetime of 3-4 years. SA multi-functional platform project takes three months of preparation and training - three persons for operation, one for accounting - and 2 years of monitoring.
Approach to diffusion of PV-Systems Before AMADER started its operation in 2005, several PV-system dealers were already in the market, selling PV-systems to clients. EdF had a fee-for-service PV-project servicing almost 2,000 clients. The project was implemented without subsidies – except for loss-making input of manpower time by EdF, and managed to achieve service rates of around 20% in its areas of service. AMADER gives subsidy support to fee-for-service PV-projects using 50-100 Wp systems for households and 200 Wp systems for institutional system (community services). Some PRECASER projects are mixed isolated grid / PV fee for service projects. Subsidized PV-systems are property of AMADER until the end of the fee-for-service contract.
Subsidy Levels The Government gives investment subsidies to rural grid electrification projects in the form of: (i) direct investment subsidies from AMADER and (ii) exoneration from import duty and TVA on equipment and materials used for investments. The Government subsidizes operations through the exoneration of taxes and VAT on diesel fuel used for generation, cutting down the price of the fuel early in the year 2007 from 500 FCFA/litre to 250 FCFA/litre
AMADER has signed a convention with the Ministry of Finance for the detaxation (VAT and import duties) of materials and equipment used for rural electrification projects supported by AMADER and for the exoneration of taxes and VAT on diesel consumption used in diesel generators. AMADER has one staff member who is occupied exclusively with helping project developers getting their applications papers through the customs and tax office. AMADER can give investment subsidies varying from 60-80% of the cost of investment. In principle, AMADER fixes its subsidy levels with reference to two considerations:

133
(i) the ability to pay of the target population: the target is to achieve connection rates of 30% (minimum for initial year) to 70% (after 15 years or more) in the service areas of supported projects;
(ii) that the private project developer gets an 8% rate of return on his equity expressed in fixed prices.
Studies financed by AMADER show that rural households on average spend per month 10,500 FCFA (=€16) on non-fuelwood sources of energy, that is, on kerosene, candles, batteries, etc.; but only 6,000 in the ZEM NORD and 7,000 FCFA in the ZEM MKAY. The highest willingness to pay for the electricity connection charge was found in the ZEM SIKA, where 42% of interviewed households were willing to pay 20,000 FCFA. The average willingness-to-pay for monthly electricity bills amounted to 7,400 FCFA (=€11.1), with the average per ZEM ranging from 11, 000 FCFA in ZEM SIKA to 5,400 in the ZEM MKAY.109 The 8% rate-of-return-on-equity allowance excludes normal commercial operators from entering the rural electrification market; they look for a 15-20% rate of return as a minimum. In practice, AMADER applies the same subsidy level – expressed in percent of the calculated cost of the investment program - to all ZEM investment programs and projects; in 2007: 70%. The tariffs, therefore, differ between the projects as well as the subsidy per connected customer, as some projects have higher investment costs per connected customer than others. Higher investment subsidies are given to solar PV-projects, where GEF provides grant finance. AMADER's subsidy mechanism for energy efficient stoves falls outside the TOR for this study. But it has been criticised by GTZ in evaluation reports.
Tariff Levels Since ADAMER applies the same subsidy rate per project (in percent of project cost), the consumer tariffs vary, depending on the specific cost of supply in the concessions. The upfront cost of electricity connection for a household consumer consists of (i) two months advance payment on consumption deposit, (ii) cost of internal wiring, (iii) 15,000 FCFA (€23) for connection charge. The tariffs for metered consumption ranged early 2007 from 175-200 FCFA/kWh (26-30 eurocents). For households paying a fixed monthly capacitycum consumption charge, the tariff for 300 Wp would be around 5,000 FCFA/month (€7.2).
Communication Policy AMADER has managed to attract strong interest in the private sector and in communities thanks to the implementation of a comprehensive communication policy composed of the creation of an internet site - www.amadermali.org – public weekly briefings held at AMADER, briefing communiques to newspapers, multiples community forums in villages, advertising spots in radio
109 92% of interviewed households found monthly billing appropriate for them.

134
and television, as well as actions towards NGOs represented in Mali and towards potential international investors.
Rural Banks and Micro-Credit Institutions Mali has a well-developed system of “decentralised credit” under which the National Development Bank (“Caisse de Développement”) makes sub-contracts with banks located in rural areas for the management of credits. Banks have been involved in rural electrification projects giving loans with 5-6 years maturity with interest rates in the range of 12%-13%.
Regulation of Rural Energy Electrification Concessions No authorization is required for isolated grid projects involving less than 20 kW-generation. The authorization for rural electrification (Autorisations d’Electrification Rurale, AER) covers generation, transmission and distribution/sales for a period of 15 years. AMADER has the lead role in analysing requests for authorizations, the authorization is awarded by decision by the minister in charge of energy. Generation above 250 kVA is entrusted to EdM only. AMADER regulates the PCASER authorizations, the ZEM concessions will be regulated by the electricity regulator, Commission de Régulation de l'Electricité et de l'Eau (CREE). Tariffs are adjusted whenever the price of petroleum has changed more than 20%.
Low Cost Concepts The cost of investment per connected customer for PRECASER (including investments in cars, offices, and other infrastructure for operation) is around €600.110 The cost of a connection from the LV-grid is €40-50. Load limiters from 50 W and upwards are used in the isolated grid projects. Load limiters with energy limitation have been tested, but are discarded for the present. Diesel operation is 12 hours per day.
Experience with World Bank procurement procedures AMADER management staff has the opinion that the process of getting approval is long: “one needs to apply in December in order to have activities in May.”
110 In the socalled “dense areas” one can have 30 clients per km distribution line, in other areas it is lower.

135
Results The Government rural electrification goal is by 2010 to reach a 12% rural electrification rate. Depending on whether the average rural household has 7 or 10 members, the goal translates into the provision of electricity service to 120,000-170,000 households/businesses. AMADER adopted in 2005 the rural electrification goal to provide within five years electricity to 70,000 new customers in rural and peri-urban areas; and to install 72 multi-functional platforms within 3 years. But the end of 2007, PCASER projects provided electricity service to 36 communities with 14,000 clients. AMADER had processed 144 project requests (“preliminary permissions”-“demandes de permis preliminaries”) representing an investment volume of …. billion FCFA (€ million) and … potential connections. About 20% of connections were done by grid extension projects, the rest by isolated grid projects and PV-systems. One project combines diesel generation for a small grid with individual solar PV household systems, another combines diesel generation with electricity generated by wind turbines. AMADER subsidized the instalment of … PV-systems. The share of productive demand in supported projects ranges from 10% to 40%. AMADER’s target from 2005-2007 was to install 72 multifunctional platforms. By the end of 2007, multifunctional platforms had been installed in 64 communities, 5 of these were associated with a local rural fuelwood market. … of the platforms have a small electricity grid attached; their lines connect …. clients (commercial clients, community institutions and households). EdF/NUON created in 1999 a “Société de Service Décentralisé”, which is the largest operator with 10,000 clients spread over 19 concessions/authorizations. EdF has 5 PCASER in each ZEM, that is 10 projects. The investment amounted to 2 billion FCFA (€3 million), of which EdF-Total-Nuon paid 0.7 billion FCFA (€1.6 million). The ability to implement relatively small-sized PCASER projects allowed local businesses to engage in rural electrification: Most PCASER projects were prepared and implemented by local Malian business(wo)men and communities were born in the electrified community (“originaires”). 15-20% of the project developers were already engaged in the energy sector either as PV-dealers or as importers of electrification equipment and materials, others were businessmen who wanted to add value to ongoing operations. Some local project developers have already three projects. Of the 44 projects that are in implementation, seven were initiated by communities. The largest project has a generation capacity of 700 kVA.111 The first tender for a ZEM is expected to be launched 2007. The Moroccan utility ONE and the Tunisian STEG are among the foreign utilities that have expressed an interest in the tender. In household energy, AMADER can late 2007 point to the creation of 80 “rural fuelwood markets” and to 180,000 hectares of natural forests that are brought under management. 421,000 improved
111 The author of this report has no idea how this information can be reconciled with the 250 kW “monopoly” of EdM.

136
fuelwood stoves and 24,000 gas stoves had been disseminated. The dissemination effort in energy efficient appliances comprised 30,000 energy efficient lamps and 440 evaporated air refrigerators.
Lessons of general interest from Mali’s electrification approach AMADER has several features of interest to other African countries that are engaged in rural electrification. Combining rural electrification with household energy activities within one organisation provides synergies and savings in administration and financial reporting but only small synergies in the field. More important, it gives household energy a higher and more permanent profile thereby ensuring continuity of effort in household energy activities. The flexibility of AMADER’s approach - to finance small “local concessions” and multifunctional platform projects within the “larger socio-economic concessions, ZEM” - allowed fast progress to be achieved in terms of connections. Yet, the PCASER-modality is clearly an interim measure only: it is not possible within the country to find sufficient local investors with the financial capacity to engage “large scale” in rural electrification. The success of AMADER with regard to achieving targeted connection rates will be decided by the reaction of professional utilities to the tenders for ZEMs. First then can rural electrification begin to benefit from economies of scale.
The dual role of AMADER as rural electrification agency and regulator of small concessions – leaving the regulation of EDM to the power sector regulator – has two advantages. One is reduction of red tape in the administration of applications, the other is avoidance of heavy handed regulation by the large regulator applying the norms for large scale concessions to small concessions. The number of applications greatly surpassed AMADER's annual financing possibilities. Since its procedures for fixing subsidy rates and for approving projects (allocating concessions) are
rather flexible – setting tariffs and subsidy levels for individual projects based on feasibility studies leaves scope for individual judgement – there is a risk for corruption in program administration. The AMADER section in the Malian Government's year 2006 annual anti-corruption report is the largest of all institutions audited (1 billion FCFA lost). The first CEO of AMADER had to be replaced as a consequence. AMADER’s rural electrification program has the highest cost of investment per connection among the REF/REAs sampled in this report. Part of it may reflect insufficient downward cost pressure by AMADER’s subsidy administration. Part it must also reflect the relative weakness of the technical supply chain.
Mali Rural Electrification Diamond
FinancialIntermediation
Supply Chain
Organisation of Supply / Electricity Service to Consumers
REF/REA and
Subsidy Policy

137
Financial intermediation (debt finance) is largely absent, unless entrepreneurs succeed themselves in getting loans from banks. The organisation of power supply has several small financially weak players, and some observers doubt that the approved tariffs are cost-covering, given that the operators have no freedom to set them and Mali’s previous record of heavy handed political fixing of prices.

138
I.5 Nepal: Successful Promotion of Renewable Energy for Decentralised Electricity Service
Specific Characteristics of Nepal’s Approach
Nepal uses a multilayered approach in rural electrification. (i) Investments in rural electrification by extension of the national grid are undertaken by the state power company, but part-financed by local community cooperatives for power distribution which lease or own the constructed LV-system. (ii) Decentralised investments in rural electrification are almost all based on renewable energy and developed by local project developers who can draw on financial support and TA from the Alternative Energy Promotion Centre (AEPC) both for project preparation and for investment. (iii) AEPC supports rural energy overall and is technology neutral as long as renewable energy is used. (iv) AEPC gives through the collaborating Rural Electrification Fund financial support according to transparent procedures and at rates fixed by national subsidy policy.
General Information about Nepal Nepal had in year 2005 a population of 27m, growing 2.1% per year, and a population density of 190 persons per sq.km. Less than 20% of the population lived in urban – defined as population centers with more than 10,000 inhabitants - and more than 80% in rural areas. Gross national income (GNI) per capita in 2005 was US$270 (nominal) and US$1530 (at purchasing power parity).112 Growth in GDP from 1995-2005 averaged 3.9 percent per year, despite a negative growth rate in 2002 caused by civil war.113 Annual inflation rates from 2000 to 2005 were in the 4% to 4.5% range. Despite a very difficult political situation throughout the period, poverty in Nepal fell from 42% to 31% between 1996 and 2004. The decline in poverty was caused by five drivers:114 (i) increase in remittances which between 1996 and 2004 soared from 3% of GDP (US$203 million) to 12% of GDP (US$794 million)115, (ii) increase in wages116, (iii) improved connectivity and access to markets117, (iv) urbanization118, and (v) falling birth rates119.
112 World Bank: “World Development Report 2004” 113 World Bank: “Nepal at a glance”, 2006 114 World Bank: “Resilience amidst conflict”, 2007 115 In 2004, 32% of households receiving remittances as one million Nepalese (every 11th adult male) worked abroad. 116 Wages Increased: As more people migrated abroad, local employers started competing for a shrinking pool of workers, which helped wages to increase. As a result, wages for farm workers, who tend to be the poorest, rose by 25%, wages for non-agricultural unskilled workers rose by 20%, while wages for skilled labor more than doubled. 117 Connectivity: The country’s road network grew 6.7% a year between 1996 and 2004, while rural and district roads grew 11% a year. Road improvements rural areas stimulated entrepreneurial activities raising incomes of those working in non-agricultural jobs. 118 Urban population doubled. In 2004, 15% of the Nepalese lives in urban areas compared to 7% in 1996. 119 The dependency ratio (the number of non-working family members per working adult) decreased.

139
Power Sector in Nepal
In 2005 Nepal had 614 MW installed capacity connected to the national grid of which 558 MW came from hydropower. The total capacity serving isolated grids amounted to … MW. The Tenth Plan aims at increasing national generation capacity to 800 MW by 2008. National demand for power in 2005 reached a peak of 580 MW, annual consumption of electricity was 2000 GWh, which is equal to 74 kWh per inhabitant. Demand for power increased with an annual average growth rate of 8.5% over the past decade, and is forecast to grow at an annual rate of 7.6% until 2020. The dominant power company is the state-owned National Electricity Authority, (NEA). NEA is responsible for national transmission and dispatch and for most of the country's generation and distribution of electricity, and is the single-buyer for all energy generated by Independent Power Producers (IPPs) supplying the Integrated Nepal Power System and for importing power from India to meet local demands. NEA had in 2005 almost 1.2 million customers, 96% of which were households. NEA owned 10 large hydropower with a capacity of 389 MW and one 70 MW plant under construction, as well as 10 small hydropower plants with a total capacity of 13 MW connected to the mina grid. Off-main grid, NEA owned 31 small hydropower schemes, totalling a capacity of 5.51 MW120 and two village solar PV schemes totalling 100 kW. The Hydropower Development Policy of 1992 (reinforced by the Hydropower Development Policy of 2001), Electricity Act of 1992 and Electricity Regulations of 1993 opened large hydropower generation for investments by private capital. The policy was confirmed by, which envisages an increased involvement of private investors in the production, distribution, and management of electricity. By 2005 there were 11 IPPs (having contracts with NEA) with an installed a capacity of 149 MW, and with plants ranging in size from 189 kW to 60 MW. Three other IPP-plants with a total capacity of 5 MW were under construction. Some small power companies and some non-government organizations account for a marginal portion of distribution. The economically viable hydropower potential in Nepal is estimated at 40,000 MW. The under-development of this potential is due to lack of domestic finance - NEA’s tariff structure does not generate sufficient revenue for investing in new projects - and the significant reduction in funding for hydropower projects from multi-lateral financial institutions (MFI) during the 1990s.
Institutional Responsibilities for Power Sector Planning and Rural Electrification The Government has established a number of Councils and Commissions to bring coordination to sector planning, including energy. The most important Councils with interest in the energy sector include the “National Development Council (NDC)”, chaired by the Prime Minister, the “Environment Protection Council (IPC)”; and the “Water Resources Development Council”.
120 from NEA’s Annual Report 2002/03, p. 50

140
Three Commissions have direct jurisdiction in the energy sector. The National Planning Commission (NPC) is the key policy advisory body in the country, reporting to the NDC. The main purpose is plan formulation, most importantly the national five year plans, and evaluation of the effectiveness of programmes and policy measures. The annual plans are prepared by the Ministries and submitted to the NPC for approval before they are submitted to the Ministry of Finance. The Water and Energy Commission (WEC) with its secretariat, the WECS, coordinates water and energy planning activities. WECS makes studies and analytical work for providing inputs to the policy in energy and the water sectors. The studies are submitted to the NPC. WECS also provides inputs to inter-ministerial seminars. The Electricity Tariff Commission (ETC) has regulatory oversight over electricity tariffs, which, however, are submitted to the Cabinet for approval. Two ministries have jurisdiction over electrification policies. The Ministry of Water Resources (MWR) is the line ministry with primary jurisdiction and authority over the power sector and is responsible for the development and protection of Nepal's water resources, including its use for hydropower. The Ministry of Science and Technology (MST) has the mandate to promote national science and technology and oversees the Alternative Energy Promotion Centre (AEPC). AEPC was founded in 1996 by Government Cabinet as an autonomous agency121 under MST with the task to promote the use of renewable energy technologies - solar PV home systems, PV systems for institutions and water pumping, biogas, pico- micro- and mini-hydropower, improved fuelwood stoves and others - to meet the energy needs in rural areas of Nepal. Since off-main grid electrification in Nepal supported by public money relies exclusively on micro-/mini-hydropower and solar PV-technology for electricity generation, AEPC is the key player in the electrification of areas that will not be reached by the national grid within the next five years, being the only organisation with a nation-wide mandate. Other organisations have responsibilities for off-grid rural electrification but only in specific areas. An example is the Remote Area Development Committee, RADC, which has been given the task of establishing micro-hydro plants at selected sites in 25 districts at or near the border of Tibet, designated Very Remote Areas. The Board of AEPC is composed of 7 Government representatives and 2 private sector (industry/NGO) representatives. In its initial years of operation, AEPC was deeply involved in running donor financed TA-programs – partly in parallel with programs financed by other donors. But increasingly, AEPC tries to disengage itself from direct involvement in TA- and dissemination programs, operating instead as a “rural energy agency”, which defines rural energy policies and instruments, identifies priority rural energy programs, seeks national and donor finance for these, monitors and evaluates the performance of donor and government financed energy programs, coordinates activities across programs and projects, and provides grant support to investment projects through the Rural Electrification Fund, REF. Donors implement rural energy development and dissemination programs with own staff hired temporarily on a project basis.
121 The government amended the structure of AEPC Board by the Cabinet decision dated 20 December 2004 which included two additional members from MoEST and added a new clause, which is regressive from the view point of autonomy: “HMGN can give necessary instruction with regards to the Boards activities and it shall be the Boards duty to follow such instruction”.

141
AEPC is organized around functional entities, its four divisions are (i) policy, planning and resource mobilisation; (ii) energy promotion122, (iii) monitoring, evaluation & quality control123 and (iv) support services, accounting and administration124. AEPC has a staff of 19 professionals, including the Executive Director, and a support staff of 15. The salaries for professional staff range from € … to € …. per month, which is roughly … as much as a public servant of similar category working in a ministry or in a commission (taking into account all extras). The reference benchmark for fixing the salary levels were the salary levels of professional staff in donor financed projects. The Rural Energy Fund for rural electrification subsidies is under the direct supervision of the Executive Director; final supervision of REF rests with the AEPC Board.125 The REF replaced the Interim-REF created under the Danida-funded ESAP-program. IREF was a fund to provide investment subsidies to rural energy projects; the funding of “indirect subsidies” in the form of TA, resource studies, etc. was given through the budgets of ESAP’s TA-support programs for micro-hydro, solar PV and improved fuelwood stoves. In the year 2003, Norad joined in the funding of IREF. When in 2005 IREF was transformed into a full-fledged and autonomous Rural Energy Fund (REF), the World Bank joined with its investment funds for micro-hydro under the REDP. KfW is likely to provide its investment funds for biogas directly through REF as well.126 In principle, plans for Government inputs to local development projects are made at Village Development Committees (VDCs)127 level and consolidated at Development Committees (DDCs)128 level. Plans are then sent to the central level for funding.129 At the community level, there are a number of different kinds of ad-hoc development related user groups; these were formally recognised by the 1991 Constitution. Local Governments are given a role in energy infrastructure planning in the Local Self-Governance Act 2055 (1998) which, inter alia, allows Municipalities, District and to develop small and micro hydropower projects. The local energy
122 The “Energy Promotion Division” organises workshops, seminars for the dissemination of information on different RE technologies to stakeholders, prepares promotional material and handles the library, information database and other information materials publication. 123 Apart from M&E the division coordinates standardization and quality assurance like the Solar Energy Test Station. 124 The division is responsible for the day-to-day administration and financial management of the AEPC. 125 The forerunner to the REF was the “Interim Rural Electrification Fund (IREF)” established in 2001 under the Danida-financed Energy Sector Assistance Program (a rural energy cooperation program with AEPC). ESAP was split into a number “components”: separate TA programs for building up AEPC and promoting microhydro, biogas, improved stoves, solar projects respectively and one “investment component” - the IREF - to provide grants to rural energy investment projects (micro hydropower projects, in solar home systems, rural grid extension projects). Norway/NORAD joined IREF in December 2003. AEPC was Executing Agency. IREF funds were jointly financed by HMG/N (10%) and Danida (90%), and approved and channelled in accordance with the HMG/N Subsidy Policy and Delivery Mechanisms. 126 A step towards this was taken already in 2001 when AEPC signed agreement with KfW to undertake a role as a 2nd floor financial institution administering a Biogas Revolving Fund of 5 million DM. For this purpose AEPC created a separate credit unit to screen and select credit retail organisations, channel and administer credit funds to these credit retail organisations, train, coach and supervise involved credit retailers, account for proper use of funds and their repayment. 127 The VDC is elected, but has a secretary appointed by Ministry of Local Development. 128 The DDC is an elected institution. Its administrative wing, the Local Development Office, which is part of the Ministry of Local Development. The LDO is headed by the local Development Officer, who is a civil servant. 129 Each DDC gets an annual “block grant” from the Ministry of Finance. Under the “self-reliance scheme”, each VDC gets an annual grant for its own use. Implementation is usually done by the line departments at district level. In some cases, funds are provided by the line agencies concerned (from government allocations or external sources.

142
planning structure starts with bottom-up project identification by VDCs through their subsidiary bodies the Wards (which are a collection of village quarters or of villages). Project proposals are prioritised by the District Energy Council (DEC) in a draft Annual Energy plan and programme which is submitted to the District Council through DDC for approval. Once the District Council approves the draft programme, it becomes the Annual Energy Plan and Programme of the district, which is forwarded to national planning. The DDCs are also involved in monitoring and evaluation of development activities during and after implementation of district-level programmes. NEA carries out system planning studies, including demand forecasting and generation planning. NEA is responsible for rural electrification through extension from the national grid, and off-grid for constructing and operating isolated, small hydroelectric schemes with a capacity of 1 MW and above. Although NPC acts as the final coordination agent, the plethora of institutions and responsibilities in the energy sector complicates the formulation of coherent energy policies. The positive aspect is that the structure allows many innovative experiments to be implemented. But the weaknesses are recognized in the Government’s draft Rural Energy Policy 2062 which envisages the creation of a Rural Energy Central Coordination Committee under the chairmanship of the NPC.
Regulatory framework for power sector and rural electrification The Electricity Act of 1992 made it possible for independent power producers (IPPs) to operate in the country and to sell their power to the national grid. For hydroelectric projects up to 1 MW, the Act eliminated the license requirements for surveys and operation, established free pricing by the entrepreneurs and liberation from royalty and income tax. Protection to entrepreneurs includes compensation for their investments, in case the national grid is extended to their area. The regulatory system for the power sector gives raise to potential conflicts of interest:
• MOWR supervises NEA directly: the Minister for Water Resources is chairman of NEA’s Board of Directors and appoints NEA's directors; the Secretary of the MOWR is member of the Board.
• The Secretary of MOWR issues licenses to develop and operate hydropower projects with an
installed capacity greater than 1,000 kilowatts (kW).
• Department of Electricity Development (DOED) established in January 2000 within MOWR is responsible to work with Government agencies through a streamlined “one-window” operation for promoting and assisting private and public sector entities in licensing the development of hydropower generation, transmission and distribution projects, preparing guidelines to conduct studies and designs for hydropower projects, for inspection and monitoring of projects during construction and operation, and for collecting royalties due to GON and local agencies from operating hydropower plants.
• The Electricity Tariff Fixation Commission (ETFC) is a tariff regulatory body set up to review
and approve tariff filings by NEA and other licensed entities. ETFC does not have technical capability for assessing tariff applications of the licensed entities and relies on these entities

143
themselves. DOED's Director General serves as an ex-officio secretary of ETFC, and DOED provides the technical secretariat of the Commission where possible.
• According to the Local Self-Governance Act, local government is responsible for the
utilisation of natural resources, such as rivers and streams within their jurisdiction, giving these a role in the authorization of use of local water resources for power generation..
The structure is under revision. A draft Ordinance for the establishment and management of National Electricity Regulatory Commission (NERC) proposes to transform the TFC into an autonomous body with the “classical” modern regulatory functions of promotion of competition and power sector efficiency, tariff approval, protection of consumers’ and investors’ interests, inspection and monitoring of licensee, dispute resolution and policy advice to the government.
National Electrification Rates and Electrification Strategy The national electrification strategy is laid out in the “Hydropower Development Policy 2001”, the “Water Resources Strategy 2002” and in the 10th Five-Year Plan 2002 to 2007. By end of 2001, NEA had around 750,000 consumers – with more than 100,000 new connections being added the next year, the number of households getting electricity from decentralised power systems was small. The target of the 10th Five-Year Plan 2002 to 2007 is to expand the national electrification rate from 39% to 55% and the rural from 33% to 39% (the urban is almost 100%) calls for the electrification of 1,000,000 rural households. 700,000 are to be electrified by extension of the national grid, the other 300,000 by decentralised electrification in the form of isolated micro-hydro grids or individually owned solar photovoltaic systems. The “Hydropower Development Policy 2001” divides the institutional responsibility for rural electrification between NEA for grid-extensions and AEPC for off-main grid electrification. Both are expected to follow a community-driven approach to project identification with local asset ownership and operational management. Investment finance for both types of electrification is secured mainly from foreign donor governments and multinational development banks. But the law foresees a rural electrification fee to be charged on the revenue from new large hydropower projects.130 Each organisation manages a separate rural electrification fund for project finance. The details of the strategy - the implementing modalities - are defined at micro-level by donor-financed rural electrification programs, where the Government shows substantial flexibility in its approvals of new modalities, and by Government ad-hoc policy decisions and planning. A key national policy issue is the subject of regional equity. The rural electrification rate is highest in the accessible lowland regions (Terai), where roughly 40% of the national population lives, and lowest in mountain communities that take from 2 hours to four days to reach by foot. The regional differences in the cost of investment per connected customer are huge, see the table below: depending on how the cost of ADB’s is calculated, the cost of electrification in the mountainous regions is 3-6 times as high as in the valley highland regions.
130 In addition, 1% of the royalty received by the government from hydroelectric projects will be provided to VDCs that are directly affected by the structures of such projects, to be utilized for rural electrification in the project area.

144
Table 47: Nepal Costs of Rural Electrification
Investment US$million
Number of connections
US$ per connection
No. of VDCs
SIDA: Mid and Far-Western Rural Electrification Project 20 17,600 1163 145
ADB: Central, Eastern, Western Nepal Electrification 531)/252) 123,000 4303/2034 277
1) Total cost of investment. 2) Cost of specific rural electrification part. 3) With reference to total cost 4) With reference to specific RE cost
Electrification by Extension of the Grid: NEA and the Community Rural Electrification Fund Rural electrification was for NEA a very costly engagement. The average monthly consumption of rural households in a typical project was a mere 18 kWh. The load factor in rural communities was typically 18% off-peak and 80-98% during peak periods. In 2003, NEA’s total system losses (technical and non-technical) were 24%; a key factor being that system losses in rural distribution were from 30-70%. The relation between NEA and serviced communities was often tense. The Government’s response to the situation was the adoption of a decentralized approach to grid-based electrification, called community-based electrification¸ which could build on the experience with community operated isolated micro-hydro grids. In community-based electrification, the expansion of the national grid into rural areas is undertaken in partnership between NEA and rural electricity user cooperatives: NEA sets up the distribution grid and keeps operational responsibility for the 33/11 kV distribution lines, a community organisation manages the 0.4 kV part of the distribution system, purchasing power bulk from NEA. The objective is to reduce the costs of rural power supply and thereby, together with the co-financing contribution of the community, also increase the pace of rural electrification. The attraction of the “community based electrification” model is that it combines economies of scale in finance and in construction through NEA’s involvement in investments and finance with the micro-economic cost advantages of local management of distribution and supply: making a community organisation responsible for the distribution and sales functions is expected to reduce non-technical power system losses as well as the costs of metering, billing and invoicing.131 The introduction of “Community based Electrification” allows the government to draw a clear line of distinction between “commercial power investments” by NEA in urban electrification and its “social investments” in rural electrification. Both investments are largely financed by grants and soft-loans from bilateral donors and multilateral international finance organisations. But whereas for “urban” investments, the Government charges a 10.25% rate of interest on its on-lending to NEA; finance for “rural” investments is passed on as a grant to NEA: fhe formal procedure is that assets financed by government grants to NEA are converted into Government equity in NEA. In financial year 2003/04 the Government allocated a grant budget of NPR 580 Million (about $8 million) to NEA for “community based electrification” of 25,000 households through 150-200 projects.
131 The negative trade-off is the bigger risk of corruption in the award of construction contracts, NEA does not have the self-interest of communities in keeping costs of construction low (meaning lower repayments on debt).

145
Within NEA, the Community Rural Electrification Department (CRED) implements “community-based electrification” program; investments in mini-hydro projects are undertaken by the Small Hydro and Rural Electrification Department. NEA’s Bylaws for Community-based Rural Electrification (2060) adopted by the Board of NEA outline the terms and conditions for community-based RE. The rules envisage three community based rural electrification schemes/models: (i) “Community Based Operation and Maintenance” for existing networks; (ii) “Community Based Rural Electrification” for un-electrified area”; and “Community Based Generation” for communities located far from the nearest national grid. The distributing institution shall establish a separate repair and maintenance fund for the regular repair and maintenance of distribution lines and pay a monthly deposit equal to at least 10 percent of monthly sales income in the fund. The Community Based Operation and Maintenance (CBOM) approach allows a community to take over the management of an existing distribution network serving the community. The property of the distribution system and the substation remains with NEA, which leases the LV-system to a newly created local electricity distribution cooperative132 at a token price. The lease payment is added to the monthly bill for the bulk supply of electricity to distribution utility which invoices and bills electricity consumers and pays NEA for the electricity delivered ex substation. Under the contract with NEA the distribution company is responsible for the administrative and technical management of the system, its regular routine maintenance (e.g. tree cutting) and the extension of the distribution network and connection of new consumers at its own cost. NEA is responsible for major repairs on the network as and when necessary. The modality suffers from the classical problem in leased infrastructure of in-optimal routine maintenance (responsibility of the lessee, the cooperative) which leads to excessive costs of rehabilitation (responsibility of the leaser, NEA). The other design problem is that the cooperatives is not allowed to charge cost-based tariffs higher than NEA’s retail tariffs. As this protects consumers against tariff increases caused by high system losses in the distribution system, the cooperative has limited incentives for proper performance. The purpose of NEA’s isolated small hydro schemes was the electrification of district headquarters. Some of the smaller schemes were shut down following grid extension to the area; 11 small hydro schemes were leased to the private sector with the expectation that this would reduce overall cost. Experience with the leased plants appears to be mixed and it seems not certain that the objective is being achieved. The “Community based generation” approach for greenfield projects relies instead on community based organisations to manage generation and LV-distribution after the system has been set up by NEA. A “Community Based Rural Electrification (CBRE)” scheme is not physically launched until the community has paid its financial contribution equal to 20% of the project cost upfront to NEA, where it is kept in the “Community Rural Electrification Fund (CREF)”. The Government then releases its 80% contribution into the CREF. The community raises its 20% contribution through a mixture of in-kind contributions such as labour provided for transportation and erecting of poles, upfront connections fees raised on households who sign up as consumers and financial support from the VDCs and DDCs.
132 Or a distribution-NGO; the Lamjung Electricity Users Association (LEUA), for example, is registered as a NGO.

146
A modified form of the “Community Based Rural Electrification” modality is applied in the DANIDA supported “Kailali – Kanchipur distribution line” program which provides 220 rural load centers with electricity distribution infrastructure in the districts of Kailali and Kanchanpur, targeting the connection of 30,000 households by 2005/06. The program establishes rural “Electricity User Cooperatives” for each load centre, consisting of a transformer and a 400/230 Volt distribution system serving one to three villages. The cooperative buys power from NEA at an agreed bulk rate. The modality differs from the conventional CBRE-approach in four aspects. The incentives for operating efficiency are reinforced by (i) giving the cooperatives ownership of the system - after completion of the construction works, the distribution system is handed over to the Electricity Users’ Cooperative as property and (ii) setting their retail tariffs according to the local cost of supply (not to NEA’s retail tariffs). The approach to project finance is different: (iii) the 80 percent investment subsidy is replaced by a fixed per household subsidy of NRP 7,200 (=€86); (iv) the rest-finance for the investment in the low voltage distribution system including the transformer and the cost of household connections with meters and load limiters is provided by the Ministry of Finance as an index loan at a 2% real rate of interest over 20 years.133 The loan is administered by NEA, which collects the monthly amortization payment from each cooperative together with the monthly invoice for NEA’s wholesale supply of electricity. The physical work for the electrical installations is outsourced to certified private sector entities. A joint umbrella organization, responsible to the district-based Union of Cooperatives will be formed under the Cooperative Act to provide managerial, administrative and technical services to the load centre cooperatives. Its fulltime professional staff will assist with the review of business plans of the individual groups, power purchase agreements, for assisting with administrative services and preparation of contracts for technical services related to O&M. The attractive features of the modality are its combination of: (i) economies of scale in project finance and administration (loan secured by the Ministry of
Finance and administered by NEA) (ii) economies of scale in technical-operational-management know-how (Union of
Cooperatives) (iii) full local responsibility for the economic consequences of bad management; (iv) all community members are co-owners of the infrastructure (v) management capability during operation is strengthened by the technical back-stopping and
monitoring though the umbrella organization (vi) long-term technical performance is ensured through service contracts with outside private
companies. The weak point is the speed of creation and absence of local community co-finance: it is difficult to create full “local ownership” of a local organisation that is externally imposed by a donor. It requires program staff with strong social mobilization skills. Under the “Community Based Generation (CBG)” model, communities operating distribution network and desirous of setting up micro-hydro generation facilities to supply power distribution in
133 An Index loan is a loan, where the annual payment of interest and repayment on principal is inflation adjusted with the inflation rate during the previous 12 months. Due to the low interest rate, the annual payments compared to a normal loan are lower in initial years, but, due to the inflation adjustment higher in later years. This lowers the tariff during initial years; but increases it in the later years.

147
their community get a maximum subsidy (excluding transportation subsidy) per kW installed capacity of NPR 65,000 for systems up to 5 kW and and NPR 85,000 for system above 5 kW.
Off-Grid electrification by AEPC/REF: Micro-Hydros and Solar PV-Systems All Nepal’s various dissemination modalities for isolated grid systems using micro-hydropower (systems in the 5-100 kW range) and for solar PV-systems put emphasis on quality control, on the building of an after sales service and on capacity building assistance to the supply chain, to final users and to community electricity cooperatives. The Government has supported the development of micro-hydro through various technical and financial support programmes. With the help of international NGOs (Norwegian and Swiss) since the 1970s, Nepal had by the end of the 1990s build up a manufacturing capacity capable of manufacturing micro-turbines up to 300 kW. During the 1990s top-down developments such as projects by NEA and the Remote Area Development Committee (RADC)134, existed alongside bottom-up project development within the facilitating framework provided by the Agricultural Development Bank’s (ADB/N) financial and technical assistance.135 As a result, several ownership models were tested136. The experience confirmed what had been learned in other countries: that the organisation of micro-hydro projects is a matter more of social engineering than of technical engineering. Despite TA
134 RADC’s approach is in principle bottom up. The Government allocates a budget each year for energy projects to be channelled through RADC. Applications for funding come from rural communities who identify their energy needs, select feasible technology, and submit application for the preferred energy technology to VDC through their respective wards. VDC screens all local applications, prioritises the projects, and allocates its own financial resources as available. Screened projects are forwarded to DEC. The DDC forwards projects approved for funding to RADC for detailed feasibility study. RADC, based on the information supplied in the application, selects projects for further investigation. These selected projects are submitted to the Board meeting for the approval for funding.; the Board approves projects within that limit. Then a Users’ Committee is formed by the beneficiaries of the energy project and registered in the government office concerned. The Users’ Committee takes responsibility of providing local services (unskilled labour) at the time of construction and maintaining and operating the plant after installation. The construction of the plant is contracted by RADC to contractors through a bidding process. 135 ADB/N had pre-qualified 13 indigenous turbine manufacturers for surveying, manufacturing and installation of micro-hydro projects, and provided long-term loans plus Government subsidies. 136 Four ownership-developer models for micro-hydro electrification had been tested by the late 1990s: (i) project development, ownership and management by national power company NEA; (ii) local entrepreneur builds, owns and manages the micro-hydro plant primarily for agro-processing purposes and sells electricity to community households; (iii) project development by outside NGO (sometimes assisted by the DDC), ownership and management by local community; (iv) project development by outside NGO, a joint NGO / local Government / local community owned limited liability company owns and manages the plant. No ownership model came out as a clear winner. But a clear lesson was that power companies such as NEA are not geared to handle micro-hydro projects: they think to big and too quality standard conscious during the design stage and their staff is too costly during the operation phase. Individual entrepreneur ownership had the advantage of providing a productive demand for power with household electricity demand being an add-on. But it experienced more problems about water use rights and makes it more difficult to organise "free labour" for civil construction and for major repairs. Furnishing lighting to a larger group of customers must involve the engagement of the community in some manner, and a strong agent must be present to enforce rules. Community ownership calls for a long, intensive period of community awareness building (one to two years) before any infrastructure investment is made. Only one corporate model had been implemented - a mini-hydro project, which received massive Swiss bilateral support to succeed.

148
support, progress by the mid-1990s was not satisfactory: investment in new micro-hydro plants was stagnating or falling and existing plants experienced operational and institutional problems.137 Micro-hydro development since the mid-1990s has been dominated by two programs: the World Bank/UNDP financed Rural Energy Development Program (REDP) and the “Mini Grid Support Programme” under the Energy Sector Assistance Programme (ESAP) financed by Danida. Both programs are performed under the oversight umbrella of AEPC and draw since 2006 on the Rural Energy Fund (REF) for their investment grants to electrification projects, applying subsidy rates fixed by the national subsidy policy for rural energy. The programs differ in their approach to the identification and organization of projects: REDP works through the DDC-VDC structure, ESAP through individual entrepreneurial economic self-interest: often the original initiative for an ESAP-supported project comes from a turbine manufacturer interested in selling equipment. ESAP provides TA support to rural communities, to entrepreneurs and to manufacturers and installers through its outreach service centres, the Regional Renewable Energy Service Centres (RRESC). Quality assurance is materialised through the implementation of various technical and non-technical standards and guidelines. The step-by-step project cycle and assistance from ESAP is described below:
a) A micro hydro project starts with the lodging by the project developer (community/entrepreneur) of a formal request for support to a RRESC. The prescribed format provides sufficient information for a reality check by RRESC on whether the requested project is technically possible. The promoter pays a request fee of NPR 1000 (€12).
b) ESAP has with the help of GIS tools and field checks made an inventory by district of potential projects that pass pre-feasibility criteria. The information is made available to communities and developers through the RRESCs and other means. The RRESC checks whether the submitted project proposal is on the list, otherwise, The RRESC fields a consultant (paid by ESAP-funds) to conduct a pre-feasibility study.
c) Project developers are informed that they may go ahead with detail feasibility study (detailed design) through pre-qualified consulting firms that are paid a fixed grant per study from ESAP upon completion of the study, the project developer pays the balance. Typically, a detailed design costs about NPR 100,000 (€1200) of which ESAP pays NPR 50,000 (€600).
d) ESAP conducts the appraisal of the feasibility study and corrects minor shortcomings as far as the design is concerned. The Technical Review Committee in AEPC must confirm that the project fulfils the feasibility criteria; if it does, it is forwarded to REF for processing the subsidy award.138
137 A study on the functional status of MH showed: (i) 75%-80% of the plants had loans overdue, (ii) some 30% were not operating for a variety of reasons, (iii) poor site selection, inadequate/inaccurate surveys, wrong size, poor installation, faulty equipment. The annual cost of O&M in micro-hydro projects averaged 10% of the initial cost of investment and varied from 5% to 20%. Lack of knowledge in book-keeping and accounting is a problem encountered in almost all micro-hydro projects, whether the plant is for agro-processing only or is used for household electrification: revenue above the cost of O&M is regarded as profit and treated so. 138 The Technical Review Committee looks at all micro hydro projects of all programs under AEPC.

149
e) The Executive Committee of the REF takes the final decision on the award of the subsidy. It gives the developer a conditional subsidy approval/project commitment based upon which he can pursue the remaining funds from financial institutions and fulfil other legal requirements such as registration for water rights, rights on land for project development, project agreement between REF and developer, contract between contractor and developer, establishing a project bank account, etc. Final Subsidy approval is granted on submission of documents as prescribed by the conditional approval letter.
f) The schedule of disbursement is linked to quality control: (i) 50 percent of the subsidy is disbursed upfront to the project’s account against a bank guarantee submitted by the installer/contractor. (ii) 30 percent of the subsidy is paid against bank guarantee upon completion and approval of testing and commissioning of the project; the previous Bank guarantee is released. (iii) 10 percent of the subsidy is released after field verification of the project account (power output and household connections). Advances are converted to grants, outstanding Bank Guarantees are released. (iv) 10 percent of the subsidy is released after the end-of-one-year guarantee check. It can also be paid in advance against performance guarantee at the commissioning stage.
The approach has proven to be dynamic in terms of getting projects implemented: many projects that are implemented or under preparation were driven by the economic self-interest of turbine manufacturers who marketed the idea of a micro-hydro power plant to the community. REDP, which was created in 1996 to work in 5 districts, operates now through its own parallel implementation structure in 25 of Nepal’s 75 districts. In the REDP concept, micro-hydropower plants (MHPs) and other energy technologies are installed by community people in equity partnership with the District Development Committees (DDCs) and the Village Development Committees (VDCs). A local NGO, a micro-hydro functional group (MHFG), is developed and nurtured as the support organisation for the implementation of the community mobilisation at community level. The MHFG deposits revenue (grant, subsidy, charity, loan, equity, and tariff) in its Community Energy Fund (CEF) and makes payments for the MHP system’s operation management, repairs and maintenance. The installation, operation and management of the MHP and other energy interventions (such as biogas, improved cooking stove, solar PV) is done entirely by the community themselves taking full ownership based on transparency, participation, inclusion and consensus decision making process. The REDP project support units provide project implementation support and technical assistance to the participating communities and to the private sector providers. The micro-hydro plants are installed by pre-qualified private sector companies. For sustained repair, maintenance and technical support systems, the local entrepreneurs are encouraged to establish Rural Energy Service Centres (RESCs). REDP provides initial support for training and skill enhancement both on business management and technology development, subsidy and credit support. The program’s high ambitions reach beyond the provision of energy supply. The micro-hydro project and its participatory funding mechanism as an entry point for holistic community development. The goal is to empower the local population by improving its capability to set up and manage cooperation organisations to achieve economic goals. REDP’s mobilisation and capacity

150
building effort takes place at two levels: community and local Government. In the beneficiary community, REDP gives capacity building in cooperative organisation forms ending in the creation of the MHFG and the CEF., that finances it. At VDC and DDC level, REDP gives TA in energy planning and energy finance to local government administrations, in particular to the DDC’s Rural Energy Development Section (REDS) and to the District Energy Fund (DEF) managed by the DDC for the financing of approved energy projects. REDP’s project cycle is as follows:
• REDP promotes the active participation of the local population in the micro hydro-projects; the cycle, therefore, starts with the community mobilisation process. REDP’s approach is from the bottom-up to create and nurture a Community Organisation for micro-hydro operation. REDP encourages local people to form a Community Organisation to initiate development work through the self-help approach and to mobilize resources within and outside the community. Creating a Community Organisation is an important end for REDP as a means to empower local communities through self-organisation. REDP builds the capacity of the COs through direct training, workshops and counselling. Normally, a CO consists of minimum 10 members, but the number can vary depending upon the local situations. In each settlement, there are separate COs for male and female.
• Once the COs mature, they form functional groups to undertake specific activities like operation of micro hydro. A CO is considered mature when its members start conducting regular meetings, saving regularly, making consensus decisions and recording the decisions in the minute book. Normally, two representatives are chosen from each participating CO to be a part of the executive committee of the functional group. The REDP assists the local community in the creation of a Micro Hydro Functional Group (MHFG) responsible for planning, implementation, operation and management of a Micro Hydro Scheme.
• The MHFG submits an application for the implementation of micro hydro scheme to REDP. REDP conducts the feasibility study for the scheme to determine its viability, ascertain the plant capacity, prepare necessary designs and make detailed cost estimations.
• Identified projects from the community, are forwarded to the Ward and from there to the Rural Energy Development Section (REDS) of the DDC. The REDS scrutinises it and forwards it to VDC. The projects identified by the decentralised energy planning process are prioritised on technical, financial and socio-economic merits; taking into consideration the commitment of VDCs and the concerned communities.
• With the endorsement of DDC, REDS carries out pre-feasibility studies of projects in its short list of VDCs and identifies the best sites for implementation.
• A micro-hydro project approved by DDC is forwarded to REDP for co-funding. REDP’s Technical Review Committee, which reviews each scheme to ensure that it is technically and financially viable, recommends modifications if necessary and approves projects.
• Once a project is approved, REDP channels its support funds to the District Energy Fund (DEF) of the DDC. DEFs get their funds from DDC’s own annual funds, from donor grants, and from returns from investments in rural energy projects. Funds are released from the DEF to a micro-hydro project only after the acquisition of land for the power house, securitization of the right of way for the canal and distribution lines, and the collection of collateral for any required local loans. Investment grants are released based on output verification. Other costs such as for social mobilization, training, etc. are paid on an actual cost basis. Expenditure statements are submitted through the DDCs to AEPC, who confirms eligibility of expenditures.

151
• For the construction of Micro-hydro Schemes, the MHFG mobilizes different sources of financing; and signs separate agreements with REDP, DDC and VDC for this. REDP provides a grant of Rs.65,000 (€774) to 85,000 per kW (€1012) through the DEF.139 DDC/VDC give their financial support to the project in the form of equity investment in the plant; once the scheme runs profitably, DDC/VDC receive a return on their respective investments. The community contributes mainly in the form of labor, land etc, but is encouraged to make cash contributions also.
• At the individual micro-hydro project level, a Community Energy Fund (CEF) is set up, which is managed by the Micro-hydro Functional Group, and in which the finance from REDP, DDC, VDC and the community is deposited. The MHFG also mobilises government subsidy and loans from banks. All purchases and payments related to construction and installation are made through CEF. CEF continues during operation: revenue generated from the MHP is deposited in CEF and used for sustainable operations of the plant and its associated distribution system.
• MHFG directly or through DDC/REDS calls for quotations for the supply and installations of electro-mechanical parts as approved by Technical Review Committee.
• REDP gives technical assistance for completing the procurement and construction process. • Upon successful testing and commissioning all well performing plants are handed over to the
community. MHFG completes the formal auditing and carries out the public audit. • MHFG is fully responsible for operation and management of the plant and the distribution
network. MHFG determines the tariff based on loan repayment, depreciation, operating and maintenance costs, development fund etc.
The attractive features of the modality from a sustainability point of view are (i) the slow and gradual social mobilization process towards the creation of a MHFG, (ii) the involvement of the DDC and VDC as shareholders in the project, enabling these to perform a direct monitoring and regulatory role. The weak point is the rather undefined legal status of the MHFG: the MHFG is a kind of Shareholding Company, but not registered under company law. This should, at least in principle, have a negative affect on its ability to get loans from banks. A further weak point of REDP’s modality was revealed during the 2000-2006 period, when a Maoist insurgency largely controlled the countryside in Nepal. As the DDC and VDC structure was seen as being the extended arm of the Central Government, the REDP modality became non-functional. The free-market/entrepreneur driven ESAP modality for both micro-hydro and for solar PV-home systems was unaffected by the political situation. The Government – the AEPC program was the only program with effective outreach in all corners of Nepal – and the Maoists – who wanted improved energy service for “their local population” – both wanted the program to succeed.
Modalities for promotion of solar home systems AEPC’s design of the modality for the promotion of solar home PV-systems drew on the successful experience of Nepal’s biogas program which received bilateral support from the Netherlands’ SNV and Germany’s KfW since 1992. The biogas support program is implemented by BSP-Nepal, a local NGO. The program promotes use of biogas for cooking and lighting and has installed more than 100,000 biogas reactors. The funding mechanism applied by the BSP is simple. All farmers planning to install a biogas plant are eligible for subsidy. When no loan is needed, the farmer
139 The subsidy policy has been revised, see the section on subsidy policy.

152
contacts a biogas supplier for installation, deducts the published subsidy from the price and pays the remaining part to the supplier. The supplier then receives the subsidy from BSP. If a loan is needed, the biogas supplier assists the farmer with the application to the bank for a loan. The supplier then receives the self-finance from the farmer, the loan amount from the bank, and the subsidy through the BSP. A control mechanism in the form of a Biogas Plant Completion Report is established for verification of the quality of the work of suppliers, in addition a percentage of the subsidy payment is paid first at the end of the two years warranty period to ensure that the supplier makes the two annual maintenance visits as stipulated in the supply contract. Under AEPC’s solar promotion schemes, around 26 pre-qualified solar PV-dealers operate in Nepal who sell their systems through retailers trained in the basics of system maintenance and after sales service. AEPC’s gives a per system subsidy to solar home PV-systems in sizes ranging from 3Wp (small subsidy) to 10-55 Wp (standard subsidy) using the disbursement procedure described below:
1. PV-system dealers market their systems through local agents/dealers or directly. 2. When a household buys a system, a subsidy application form is filled up by the households
with assistance from seller along with a copy of the buyer's citizenship certificate and two photographs of the installed system.
3. The PV-dealers collect and submit application forms at periodic intervals duly filled by investor to AEPC’s/ESAP’s Solar Energy Support Programme (SSP).
4. AEPC/SSP verifies the application form for correctness of information and forwards the payment request to REF for approval by the Board and subsequent subsidy disbursement.
5. If approved, REF pays the subsidy to the PV-dealer, with 10% retained until expiry of the guarantee period. The 10% payment can at this stage also be released as advance against bank guarantee.
6. AEPC/SSP undertakes a verification process based on random sampling procedure of installed systems and of provided after-sales service. Non-compliance is fined.
The program succeeded within five years to install 65,000 solar PV-systems ranging in sizes from 10 Wp to 55 Wp. Key success factors were the well designed subsidy modality and continuous efforts in quality control and local private sector development.
Deployment strategy for institutional solar PV-systems Yet another modality for community based organization of energy supply is tested in the “Renewable Energy Project (REP)” a joint initiative of the Commission of European Communities (EC) and the Government of Nepal which is executed by AEPC. The objective of the REP is to fight poverty by installing solar PV-systems in health posts, schools, as well as for water pumping and productive uses such as milling, ITC, computer literacy and audio-video entertainment in rural communities without access to grid electricity. The systems are handed over to 168 so-called “Community Energy Service Providers (CESPs)”, legal entities located in the serviced communities, who operate the systems similarly to a conventional “Energy Service Company (ESCO)” - providing energy, water pumping and milling services on a "fee-for-service" basis to end-users. REP is active in 276 VDCs of 21 districts in Nepal; more than 900,000 people are expected to benefit from improved social services and increased income due to availability of electricity.

153
The agreement for the €15.7 million project, signed between the European Commission and the Government of Nepal allocates €10 million to the financing of solar PV systems sensu lato, €150,000 to solar thermal systems and €5.675 million to program administration, capacity building and other supporting activities. REP provides eight standardised solar PV packages that were designed on the basis of extensive interaction with end-users: i) Health post (600 Wp), ii) School I (1000 Wp), iii) School II (1900 Wp), iv) Computer literacy (700 Wp), v) Community entertainment (200 Wp), vi) Community telecom center (900 Wp), vii) Mill (1500 Wp), and viii) Water pumping (size varies based upon the site conditions). Solar PV milling and PV water pumping packages are inclusive of all components necessary for the complete operation (e.g. pumps, motors, etc) in order to guarantee the high quality output. The REP’s CESP approach was designed to sustain the solar PV systems during a period of twenty years, through a number of measures: Firstly, only well-functioning local community organizations (COs) that are already involved in productive activities are approved by the REP as CESPs. The identification of qualified COs was done by the REP regional offices in collaboration with the local District Development Committees, (DDCs). Of the 738 COs that expressed their interest to become CESP, 168 were finally approved as future CESPs. Some of the approved COs have “legal person” status: such as “cooperatives”, “forest user groups” and “conservation area management committees”. Others are “groups without legal person status”, such as “savings”-, “women”-, and “agriculture groups”. Since legal person status is a condition sine qua non for the handover of REP-financed, valuable equipment into the ownership of a local organization, the informal groups are required to transform into a cooperative that includes energy service provision as an activity. The legal requirement for existing cooperatives, forest user groups and conservation area management committees are simple: they should add the CESP-activity to their existing businesses by appropriate text changes in their founding charters. Secondly, each pre-qualified CO undertook a detailed local energy demand analysis in order to establish the local priorities among the eight system packages supported by the REP. The affordability of the institutional systems depends on the capacity of the DDC and the health and school administrations to finance the cost of a) electrical appliances, such as computers, printers, lamps, vaccine fridge, etc and b) operation and maintenance of the solar PV systems (i.e. annual operating budgets of beneficiary institutions must include a budget line for paying the CESP service fee). Both requirements were checked in the energy demand collection process prior to REP’s approval of a CO as CESP. Thirdly, the CESPs get, in particular before the upstart of CESP-operation, intensive TA for energy demand collection and community mobilization as well as a training in basic CESP management issues such as administration, accounting, tariff setting, solar PV-system operation and maintenance, business development; etc. Fourthly, the 100% investment grant facilitates the alignment of local “ability to pay” with the local service provider’s “full cost of service tariffs”. The grant eliminates the payment of interest on investment from the tariff schedule, and since REP aims at a 20 year operation only, the depreciation on PV-modules is not included either. Nevertheless, the tariff schedules include depreciation of items having a lifetime lower than 20 years - batteries, inverters, charge controllers,

154
etc., the costs of maintenance& service contracts with solar PV-specialists, routine maintenance and the costs of CESP management, administration and system operation. Fifthly, the CO will have separate bank account and ledger for CESP related transactions. Regulation of a CESP is simple. The terms and conditions of operation are specified in the memorandum of understanding signed between the CESP, DDC (+/- VDC) and AEPC, as well as in the contract between the CESP and end-users, and in the CESP charter and regulations. Formally, AEPC and the Local Government Organizations: DDC and VDC are the regulatory organizations that monitor and supervise the performance of the CESP and control against misuse of CESP property. However, because the COs are intricately imbedded in the local community, in practice, REP’s CESP approach relies on social or peer pressure to ensure that the CESPs operate in the best interests of the community as a whole. Tariff control is hardly necessary: the private organization status of the CESP’s protects against undercharging (a risk for consumer owned electricity cooperatives), local integration against overcharging (a risk associated with private for profit service providers). Formal control will be concerned mainly with ensuring that separate accounts are kept and that funds are used for the endorsed purposes. The arrival of the national or regional electricity grid to the beneficiary community does not necessarily mean the end of the CESP’s activity. The CESP may continue its operations by transferring its equipment to schools, clinics and water users not served by the grid.
Subsidy policy Before the introduction of the “new” Subsidy Policy and Delivery Mechanisms approved by HMG/N in October and November 2000, and the subsequent establishment of the Interim Rural Energy Fund (IREF), there were no uniform Government policies for subsidies and funding mechanisms. Modalities and levels of subsidy could vary from donor to donor, from technology to technology, and in some cases even from project to project within the same technology. The two primary design principles for the national subsidy for rural energy developed by NREA were: (i) transparency in fixing subsidy payments to projects as a means to reduce the scope for deviation of funds; and (ii) fixing subsides in a way that minimized free rider effects.140 The outcome were subsidy rates given against objectively verifiable criteria. Micro-hydro projects received a fixed per kW installed capacity subsidy (later replaced by a per connected customer subsidy). Solar home PV-systems in the 10 Wp to 55 Wp range received the same US$/system subsidy. The objective was to achieve maximum market expansion per invested subsidy-dollar; but as a side benefit it was socially more equitable than the US$/Wp subsidy which at that time was standard practice in GEF-support PV-projects in other countries.141
140 The subsidy to sales of SHS was originally in 2000 conceived as a market pump priming subsidy: a temporary, time limited subsidy to lift market demand to a size sufficiently large to permit commercial delivery structures to be developed. In line with the market pump priming objective, the recommendation was to end the subsidy scheme after five years, and to use declining subsidy rates over time: one rate for the first two years, a lower rate for the next two, and a yet lower rate during the fifth year. The for %% Wp was reduced; but the lifetime was extended “indefinitely”. 141 A US$/Wp subsidy gives the highest subsidy in absolute and relative terms to 55 Wp systems that are purchased by households that want to see television. The small 10-20 Wp systems are purchased by households that are too for that; it must be assumed that the price elasticity of demand of these poor households is higher than of the 55 Wp-households.

155
The subsidy policy adopted in 2001 focused on maximum expansion of the market. Regional equity was taken into account by varying the fixed subsidy rates by region (solar home PV-systems) or by distance from the nearest road (micro-hydro power projects): a distance dependent premium (days of walking to nearest road) was added to the fixed subsidy rates. The equity impact was assumed to come from two factors: (i) from the reduction in the difference between the cost of energy systems in “accessible areas” and in remote areas; of the energy systems; (ii) it was assumed that average household income was negatively correlated with remoteness. The subsidy policy for off-grid rural energy gives investment subsidies in the form of tax subsidies and in the form of direct investment subsidies:
• Equipment used in rural electrification projects is exempted from import duty and VAT • No royalty is imposed on the electricity power generated by micro-hydro projects, and the
revenue is not taxed • MHP projects get a subsidy closely to 50% in an average project case:142
o projects up to 5 kW capacities get a subsidy of NPR 8,000 (€95) per household, subject to a total limit of NPR 65,000 (€774) per installed kW143;
o projects from above 5 kW to 500 kW are paid a subsidy of NPR 10,000 (€119) per household, subject to a total limit of NPR 85,000 (€1012) per installed kW.
o In addition, projects get a transportation subsidy the size of which depends on plant-site remoteness.
• Biogas plants in the 4 cubic meters to 20 cubic meters category get a per system subsidy (varying by size) of around 30% of capital cost.
• Solar home PV-systems in the 10 Wp-55 Wp range received a per system subsidy of NPR 8,000 (€95) in the accessible regions and NPR 12,000 (€143) in all other regions. The amount was subject to one limitation: the subsidy paid by AEPC could not surpass 50% of the retail price of the SHS. The policy was adjusted in 2006, when a subsidy was introduced also for the very small 3 Wp systems.
• Institutional PV-systems got a subsidy equal to 75% of the cost of the installed equipment. Consumers in on-grid electrification, get investment subsidies as well as subsidies to the cost of operation:
• NEA subsidises community based electrification through the bulk tariff rate of NPR 3.5/kWh (4.2 eurocents) that it is allowed to the communities by the Tariff Commission. NEA’s cost of supply is twice that rate.144
• The investment subsidy depends on the type of community electrification. In NEA’s standard approach, the community utility gets a 80% subsidy towards the cost of investment. In the “ESAP approach”, communities get a NPR 50,000 (€600) subsidy towards the cost of the feasibility study plus a NPR 7,200 (€86) subsidy per connected household. The experience of implemented projects shows that this subsidy leads to a subsidy level of … to … percent.
A review of subsidy policy, leading to the new subsidy policy for off-grid electrification approved in 2006, looked at lessons learned and what adjustments could be introduced. In micro-hydro the 142 During the early existence of IREF from 2001 to 2003 the subsidy levels were higher. Investment costs were in the range of NPR 80.000 to 145.000 per kW of installed capacity; on a per household basis, costs ranged from 7.000 to 15.000. The subsidy rates then of NPR 55,000-70,000 covered 65 to 85% of cost. 143 A household connection is typically between 70W and 120W 144 Source: Govind Nepal, “An Analytical Report on Determinants of Renewable/Rural Energy Subsidy Policy in Nepal”, 2006

156
per kW subsidy (which had the risk of over-investment in capacity) was replaced by a per connected household customer subsidy, which included a lid on the maximum subsidy that could be paid per kW (to avoid that projects offered only 50 Wp load limiters). The high cost of transactions for AEPC’s administration of the subsidy award system and for the solar PV dealers was looked into. But in the end AEPC’s system of procedures was maintained due to the high credibility it gives donors against deviation of funds. An interesting finding was that the highest value of the subsidy for PV-dealers was to reduce their credit risk vis-à-vis their retailers when providing PV-systems to them against minimum down payment.
Tariff Policy In conventional NEA projects, households are charged a connection fee of NPR …. (€ ..), in community based rural electrification, the connection fees differ by project, but are typically in the range of NPR …. (€ ..). Households pay for internal wiring in conventional NEA-electrification projects, and have to contract the electrician themselves. In community based rural electrification, internal wiring is undertaken as part of the overall investment in distribution. The differences in policies for connection rates are reflected in the differences in connection rates (the percentage of households living in a service area who connect to the distribution system): In NEA’s projects, typical connection rates are around … %, in communit based electriciation around … %. In NEA’s rural electrification projects, all consumption by retail consumers is metered. For households NEA uses incremental block tariffs: residential consumers pay NPR 4/kWh (4.8 eurocents) for the first 20 kWh per month, NPR 7.3/kWh (8.7 eurocents) for consumption between 21 and 250 kWh per month and NPR 9.9/kWh (11.8 eurocents) for consumption above 250 kWh/month.145 The lifeline tariff of NPR 80/month for a 5 ampère connection is the minimum monthly payment; it allows consuming up to 20 units of electricity “free-of-charge”. The monthly tariffs in the ESAP/Danida supported “Kailali – Kanchipur distribution line” program (which provides 220 rural load centers with electricity distribution infrastructure in the districts of Kailali and Kanchanpur) vary from NPR … to NPR.. /kWh (… to .. eurocents). For a household consumption of 18 kWh (average rural consumption in NEA’s service areas), this results in a monthly payment of between NPR … to NPR.. (€ ..). In the private or community owned isolated grid systems, consumption is not metered in most projects. Households pay according to the number of light bulbs they use or according to their demand for capacity - a fuse will typically limit the maximum demand of a household to 100 W.146 The isolated grid projects under the ESAP- and under the REDP modality of local organisation are encountering the “classical” problem of electricity cooperatives under-charging their clients.147 REDP and ESAP both produced and disseminated guidelines to local community utilities for how to determine tariffs. The AEPC approval procedure checks that the tariffs in the feasibility reports
145 Tariff rates effective since 2001. 146 This is equivalent to a monthly consumption of around 15 kWh. 147 During the 1990s, monthly household charges were typically NPR 0.5-2 per W capacity, or NPR 50-200 per month (US$0.74-2.94). Although projects received substantial investment subsidies, this was far from enough to cover the cost of supply, the revenue was insufficient to cover the cost of O&M and repairs and to repay loans received from ADB/N. In several projects, households refused to pay agreed monthly charges, once the investment had been made. The project promoters then felt forced to accept lower and loss-making monthly rates rather than no revenues.

157
are calculated in accordance with the guidelines. But in practice, the approved/agreed to tariff rate may not be implemented. Financial evaluations of MHP schemes show that a rate of NPR 1 per watt per month is not adequate to keep a scheme at break even point. But a survey by AEPC/ESAP in 2005 showed that more than 80 percent of the 38 schemes using wattage based tariffs set their tariff equal or below NPR 1/Watt/Month. The regulatory issue making it difficult to change the situation is simple: whereas it is “easy” for regulators to force a privately owned utilities to reduce tariffs; the opposite, to force a consumer owned utility to increase its tariffs, is almost impossible. Judging from the monthly tariffs of completed projects in micro-hydro based rural electrification, REDP’s gradual step-by-step approach to capacity building in how to create and manage a collective economic undertaking does not lead to better responsibilities as far as tariff setting is concerned:
• in ESAP-supported projects tariffs vary from NPR … to NPR .. /W (… to .. eurocents) • in REDP-projects tariffs range from NPR … to NPR .. /W (… to .. eurocents).
Presumably, the under-pricing in community electrification is linked to NEA’s low lifeline tariff rates, in the sense that the communities use NEA’s rates as reference when fixing tariffs. A household paying for 100 W has a monthly kWh consumption roughly similar to the average 18 kWh consumption of NEA’s rural household consumers. The monthly payment for 100W at a rate of NPR1/W is NPR 100, higher than NEA’s lifeline tariff of NPR 80.
Collaboration with financial institutions Ideally, the commercial and semi-commercial financial sector is involved at three levels in rural electrification finance:
• at the supply chain level (operating credits to micro-hydropower manufacturers and solar PV-system vendors)
• at project finance level (debt finance portion of grid-based investments) • at final consumer level (co-financing internal wiring and cost of connection, purchase of solar
home PV-systems) Overall, the potential and de facto capacity of the financial sector in Nepal to engage in rural electrification is far better than in other countries with similar per capita incomes. The bank lending rates, that used to be in 12-21% range, declined in recent years as the huge inflow of remittances flushed the banking sector in Nepal with liquidity. In 2006-2007 wholesale lending rates are in the range 4 to 6% and the retail and commercial loans in the 7-12% range averaging around 9%. The inflation rate for the year 2003/04 was 4.0% and 8% in 2005/06. The real rates of interest to depositors at the wholesale level are –2 to 2% range and at the retail level around -4%.148 Nepal’s national bank, Nepal Rastra Bank launched in 1974 a Priority Sector Credit Programme to channel a part of banks’ total lending to small and micro enterprises and rural sectors with the aim of improving living conditions of the people. According to directives issued by Nepal Rastra Bank all banks have to invest 12% of their loan portfolio in the priority sectors, of which 3% to deprived
148 V. B. Amatya: ” Catalysing growth in Renewable Energy Sector in Nepal by Enhancing Access to Finance”, 2007

158
sectors. In case the directives are not followed, the banks are subject to fines. The priority portfolio includes the rural/renewable energy sector.149 Three banks have an outreach enabling them to make considerable impact in the rural regions and districts, and thus participate directly in financing of rural/renewable energy, viz. Agricultural Development Bank of Nepal (ADB/N) with 670 offices, and the two commercial banks: Nepal Bank Limited (NBL) and Rastriya Banijya Bank (RBB) that both have around 100 branch offices in rural areas. Of the three, ADB/N is the old-timer in rural energy “project finance” giving during the 1990s to micro-hydro, biogas and solar PV projects.150 Since 2001 under agreement with AEPC, ADB/N provides credit up to the 30 percent of project cost charging a 12 % rate of interest; collateral from the borrower is needed. The loan period is 5 years for micro-hydro and 3 years for solar energy.151 From 1995, NBL and RBB became involved as financial intermediaries for biogas plants by participating in the SNV/BSP programme. Some of the other banks, not serving rural areas could, in principle, fulfil the 12% directive of Nepal Rastra Bank by pooling their contribution in ADB/N, letting ADB/N solve the issue of geographical outreach, and avoid payment of penalties, or on-lend money to MFIs. An ongoing reform of the financial sector may, however, lead to the elimination of the 12% rule. A considerable number of Micro Finance Institutions (MFIs) operate in rural areas, some of them operating under the umbrella of Rural Microfinance Development Centre (RMDC). Some of these could develop into potential participants in financing smaller renewable energy investments. Yet, so far, AEPC has been unable to establish a workable MFI-model with the participation of a key NGO.152 The World Bank/IFC assisted with the establishment in 2005 of the “Clean Energy and Infrastructure Development Bank (CEIDB)” to finance small hydro-power projects, but with the mandate also to finance decentralised renewable energy projects that are above 50 KW. Several banks in Nepal have clients who are involved in the supply chain for rural electrification: solar PV-system dealers, manufacturers of biogas systems or of micro-hydro turbines. Yet, despite the presence of relatively strong financial intermediaries and several years of involvement by
149 In practice, banks are more interested in financing consumer good purchases – cars, house construction, etc. – as this is faster and seen as less risky. 150 Before the introduction of new subsidy policy by the Government, ADB/N had a unique system for financing the development of micro-hydro projects. Prospective owners could choose one of the ADB/N pre-qualified turbine manufacturers for survey of the site. With the survey report, the prospective owner would apply for the loans and subsidy. After scrutiny of the survey report, ADB/N would issue supply orders to the supplier for supply and installation of electrical, mechanical and other necessary equipment. ADB/N, on behalf of the owner, would make final payment to the supplier upon clearance from the owner. Depending on the remoteness of the project location, 50-75% of the subsidy was provided to the cost of electricity generating equipment and transmission system. The prospective owner had to get the site surveyed, and then apply for loan and subsidy. After approval of loan and subsidy, ADB/N would issue supply order to the company selected by the owner for the installation of plant. Upon successful installation, ADB/N would make the payment to the supplier on behalf of the owner. 151 The borrower can apply through district based ADB/N branch and get the loan approved from ADB/N regional offices if the loan amount fall within the regional office’s lending limits. Interest is paid on monthly basis. 152 Unlike the World Bank/GEF supported ESD-project in Sri Lanka, where the establishment of the model was a key factor for the success of the solar PV-component (sales of more than 1200 PV-systems per month).

159
ADB/N, RBB and NBL in the financing of rural energy systems, the involvement of financial intermediaries in lending to rural energy projects was rather marginal between 2000 and 2005:
• in on-grid electrification, the financial sector is by-passed totally in the DANIDA supported “Kailali – Kanchipur distribution line” project, which uses an index loan for debt-finance, which is provided by the Ministry of Finance, with NEA collecting the loan amortizations from the community utilities in connection with the monthly invoicing for bulk-supply of power; in NEA’s 80% subsidy scheme, the 20% co-financing contribution is provided largely in kind by communities without recourse to bank loans;
• only .. % of biogas plants were part-financed by bank loans; • only 41 out of the 91 micro-hydro power plants that were installed from 2001 to 2005 with
financial help from the ESAP-program, took credit (from 7 different financial institutions); • less than 20 % of solar home PV-systems were part-financed by bank loans.
For the banks, the involvement in lending to rural energy projects was a disappointing experience, except in biogas. The repayment rate in micro-hydro projects is as low as 30 to 35 percent; the repayment status of loans to purchases of solar PV-systems is not satisfactory either. Banks have therefore been compelled to reject loan applications from geographical areas with high arrears. In order to expand the role of financial intermediaries in rural energy, AEPC has looked into the convenience of establishing a “credit guarantee facility” covering a proportion of the last credit risk, after repayment possibilities have been exhausted, and after realisation of security and collateral. That instrument has not been put in place yet. Agricultural Development Bank (ADB/N), Rastriya Banijya Bank (RRB) and Nepal Bank Limited (NBL) were identified as collaborating financial intermediaries by REF/AEPC, providing loans to REF-grant supported projects. Other financial intermediaries can join. As an incentive to participating FIs, REF deposits its subsidy funds in non-interest bearing accounts on a pro-rated basis according the amount of credits from the banks to renewable energy projects supported by REF. REF provides assistance to train the human resources of FIs. The marginal involvement of banks in lending and the encountered repayment problems were partly caused by the Maoist insurgency, which made it difficult for ADB/N and commercial banks to operate in rural areas. Two factors allowed quite an impressive investment volume in rural electrification to be achieved despite the near absence of commercial bank and MFI-lending. One was finance through remittances: either directly or because they allowed informal lending through loans from relative. The other was the reliance on micro-hydro power. Whereas mini-hydro power investment needs bank finance to go ahead, the smaller capital requirements for micro-hydros makes it easier to finance these without recourse to “project finance” (bank loan to community). Manufacturers, who had access to bank loans for operating capital, could give short-term loans.
Efforts to promote low-cost technology and high quality In the conventional rural electrification by grid extension practiced by NEA, the introduction of low-cost concepts during the 1990s was limited to …. .. In isolated grid electrification the major low-cost strategy of the Government was the strong reliance on micro-hydro, which compared to mini-hydro has lower costs of upfront investment. The trade-off are of that are higher costs of operation (annual costs of O&M averaged 10% of the initial

160
cost of investment versus 4% or less for mini-hydros that have stronger concrete structures) and loss of 20 days of production during the year for maintenance. The most important Government effort since 2000 to reduce the cost of rural electrification was the institutional-organizational change towards decentralized electrification in grid extension projects. The change allows the “automatic transfer” of low-cost investment concepts such as load limiters instead of metering and low-cost poles manufactured in and by the community which had been in use for many years in isolated grid projects. The approach to ensure quality comprised ex-ante (before investment) as well as ex-post (after investment) quality control. AEPC’s quality control system for solar PV-systems comprises the following ex-ante measures: (i) a system of pre-qualification of manufacturing and installing companies, consulting firms and research institutions/organisations; (ii) adoption of the Nepal Interim Photovoltaic Quality Assurance (NIPQA) standards; imported SHS-components must fulfil these; (iii) establishment of a solar energy test station for technical quality monitoring. Ex-post quality control is performed by random on-site inspections. Irregularities that are found lead to compulsory repayment of a part of AEPC’s subsidy payments to the vendor plus a fine. The quality control systems are similar for micro-hydro and for biogas systems (the latter largely inspired the design of the others).
Coordination of national electrification planning with rural electrification and local planning One of the tasks of AEPC’s “Policy, Planning and Resource Mobilisation Division” is to network with local governments to get national plans for renewable energy integrated into regional/ local planning and proper resource mobilisation.
Specific Problems In Nepal’s micro-hydro projects, there has been a tendency for skilled and trained technicians to migrate after their training to cities where their incomes are higher. This creates a shortage of engineers-technicians to solve minor repairs at the MHP. As a consequence, work at the MHP sites and surrounding dependant communities comes to a standstill for up to several weeks whilst awaiting the arrival of a trained technician.

161
Results
The results are impressive in two areas: the supply chain for decentralized rural electrification is
comprehensive in terms of scope, quantity and quality; an efficient national subsidy policy and administration has been build up around AEPC/REF, capable of attracting finance from multiple donors . Financial intermediation, the participation of the banking sector in project finance, is basically absent. Some interesting concepts for the organization of supply have and are being tested; but the medium- to long-term sustainability of the community owned utilities is still in doubt: insufficient tariff levels give reasons for concern. In the solar energy sector, there are 28 private
solar PV companies; 5 consulting firms; 4 academic centers, 54 INGOs and NGOs and 15 rural service center. Out of the total 1298 technical and marketing manpower, 600 are solar home system installers/technicians with level I certification. Of the 15 AEPC/ESAP pre-qualified companies, five are involved in manufacturing some components locally while others integrate imported system or simply trade them. In 2004 there were 27 turbine manufacturers/ installers in the micro-hydro sector, of which 20 were qualified by AEPC/ESAP to carry out activities financed by AEPC.153 Out of the 41 consulting firms in the micro-hydro sector, 34 were pre-qualified by AEPC/ESAP. 40 biogas plant construction companies operate in Nepal. AEPC, which started off with two persons in 1996, has evolved into a highly effective organization for the promotion of decentralized power supply. The quality of staff is superb, the organization is lean (only 15 professional staff) and flexible. AEPC’s small core staff defines policies and new areas in need of intervention, processes applications for investment grants through REF, monitors programs and evaluates results. The management of TA-programs is “outsourced” to ad-hoc donor-financed program staff, a procedure, that allows to accommodate specific donor preferences concerning areas of intervention. National subsidy policy for off-main grid electrification is well-designed and implemented; the design attempts to minimize: (i) free-rider effects, (ii) distortion of the market, (iii) risk of deviation of funds. A national subsidy policy for electrification by grid extension is not yet defined, different rates are applied in different projects. The organization of electricity supply to final consumers has several positive achievements. The identification of areas for solar PV-service, isolated micro-hydro projects and grid extension projects seems to give no raise to problems in terms of duplication of investments. Light-handed regulation is applied to project development and to the operation and management of local distribution projects. Interesting concepts have been tested for the involvement of local Governments in the planning and implementation of community electrification projects. The switch to community based electrification promotes use of low-cost technologies and promises to lead to important efficiency gains in day-to-day operation and management of distribution, whilst the 153 The manufacturing companies employ, on average, about 8 people per company fully. That means that the micro-hydro sector provides employment to about 216 people in manufacturing/installation companies.
Nepal Rural Electrification Diamond
FinancialIntermediation
Supply Chain
Organisation of Supply / Electricity Service to Consumers
REF/REA and
Subsidy Policy

162
involvement of NEA provides cost-advantages from economies of scale and of scope in investment and in finance. Reasonably effective after sales service has been established for solar home PV-systems and supporting structures for maintenance services are under development in community based electrification. The weak point in the organization of community based electrification is tariff policy and how to regulate it. The CESP concept for institutional PV-systems is interesting but not yet tested in practice. Lack of progress in establishing a structure of financial intermediation for rural electrification with the involvement of commercial banks in project finance and of MFIs in consumer finance can be excused with reference to the unstable political situation in rural Nepal during the last six to seven years. The results in terms of serviced rural consumers are below the expectations of the 10th National Development Plan, which targeted the provision of electricity service to a minimum 150,000 households per year. From 2000 to 2007, Nepal succeeded in providing electricity service to … previously unserved rural consumers, see the table below, which means a rate of electrification of … households consumers per year. The achievement is impressive compared with the rate of electrification in other countries with similar levels of income per capita. The annual sales of 12,000 PV-systems per year were higher than expected at the beginning of 2000, and was achieved despite the temporary suspension in 2005 of the planned extension of Danida assistance to rural electrification and to AEPC. The number of micro-hydro projects and number fo connections are slightly lower than hoped for in 2000. But, together off-main-grid electrification accounted for … % of new “connections” (includes solar home PV-systems); whereas the 10th Plan had expected that two thirds of new rural connections would come through the extension of the national grid.
Table 48: Rural Electrification Investments in Nepal 2000 – mid 2007 No. of
communities Connections MW Investment Investment/
connection Investment grant
TA grants
Subsidy per connection
NEA conventional
n.a.
NEA community based
n.a.
ESAP Kailali – Kanchipur
n.a.
ESAP isolate. micro-hydro
REDP isolate. micro-hydro
Solar PV n.a. n.a.
TOTAL n.a.
As of 2006, 9.5 MW of micro hydropower has been developed, giving electricity to … communities and covering around 95,000 households; 84,000 solar home systems have been installed; 350,000 households are using improved cook stoves, and 160,000 biogas plants have been installed. About 7% of the population uses renewable energy resources. (to be replaced by mid-2007 numbers)

163
By mid-2007, … communities had applied for the community based rural electrification scheme; … schemes with .. connection had been implemented, while … schemes with … connections are under implementation.

164
I.6 Guatemala: Rural Electrification Financed by State and Implemented by Private Utility
Specific Characteristics of Guatemala’s Approach
Guatemala is probably the only country in the world that can claim to have made promotion of rural electrification an integrated part of its power sector reform. Proceeds from the privatisation of the “rural distribution concessions” were placed into a Rural Electrification Trust Fund, the state was to double the amount through own funds and loans taken from development banks. The Trust Fund 100% grant finances all transmission and distribution investments for the rural electrification program “PER”. The PER-investments are undertaken by the private distribution company that won the two rural concessions, while the state-owned transmission company monitors the investments and takes ownership and operating responsibility of completed transmission assets.
General Information about Guatemala Guatemala had in year 2002 a population of 12m, growing 2.6% per year, and a population density of 111 persons per sq.km. Gross national income (GNI) per capita was US$1750 (nominal) and US$3880 (at purchasing power parity).154 Following a four-year period of negative per-capita growth, real GDP growth recovered to 2.7 percent in 2004 and 3.2 percent in 2005, despite high international oil prices and the damage from tropical storm Stan. GDP growth since 2006 is around 5% per year, while the annual inflations rates are in the range of 2.5% to 5% per year. In 2002, 46% of the population lived in areas classified as urban, 54% in rural areas. Guatemala’s poverty rate in 2002 was estimated at 54% of the population, or 6 million inhabitants, meaning that their average monthly household income was less than US$49155. The poverty rate in the rural areas was 75%. In 2006, annual electricity consumption per capita was 30 kWh.
Privatisation and Restructuring of the Power Sector in Guatemala Before the enactment of the new Electricity Law in November 1996, four actors operated on the power market in Guatemala: (i) the state-owned distribution company Empresa Eléctrica de Guatemala S.A. (EEGSA), a which served the urban consumers in Guatemala City and surrounding departments; (ii) the state-owned Instituto Nacional de Electrificación (INDE), a vertically integrated utility, which, was the dominant generator, and responsible for transmission and system operation as well as for rural electrification, pushing the distribution grid into the areas not served by EEGSA, (iii) 18 municipal distribution companies serviced the 18 “major” rural cities; (iv) independent power producers, which had entered the power market in the early 1990s signed long-term PPAs with INE and EEGSA.
154 World Bank: “World Development Report 2004” 155 The Office of National Statistics of Guatemala considers that the USD 48.62 amount is the minimum required to cover the necessary requirements for survival

165
Rural electrification got a boost when the main Guatemalan social fund increased its activities in electrification after the peace accords ending the civil war were signed in 1996. The new Electricity Law, adopted in November 1996, broke up the sector and implemented a competitive market modeled on the Chilean power sector. EEGSA was tendered and purchased by a US-company. The assets of INDE were split vertically and horizontally into a number of independent companies. INDE was transformed into a state-owned holding company, owning
Empresa de Generación de Energía Eléctrica (“EGEE”), into which all state-owned hydro-power plants were placed and Empresa de Transporte y Control de Energía Eléctrica, a public company which retained the transmission lines forming the National Interconnected System. INDE’s non-hydro generation plants were privatized. INDE’s rural distribution assets were split into two electricity distribution companies: Distribuidora Eléctrica de Oriente, S.A. (DEORSA) with 222,000 customers covering the Eastern regions and Distribuidora Eléctrica de Occidente, S.A.
(DEOCSA) with 410,000 customers covering the Western rural parts of the country, see the chart. The two companies with a 50-year concession to operate the distribution assets were privatized by tender in 1998, both concessions were won by the Spanish power utility Union Fenosa; paying US$101 million for an 80 percent stake in the two.156
The Rural Electrification Program “PER” The national electrification rate in 1998 was 64 percent. The electrification objective for the reform of the power sector was to increase the national electrification rate to 85% by 2004. As the urban electrification rate (EEGSA’s-concession area) was 90% already, the outcome was to be achieved mainly by raising the 41% rural electrification rate. The DEORSA and DEOCSA concessions were designed to achieve that. The 1996 Electrification Law obliges distribution concessionaires to connect anybody who requests a connection and who lives within 200 meters of the distribution grid. The concession contract stipulates that apart from a two months’ consumption deposit, the connection charge is zero. Union Fenosa recovers the costs of connections through the general allowance for capital replacement in its tariff schedule. 156 MIGA issued a political risk guarantee to Union Fenosa International, specifically for breach of Government’s obligations to fund the PER Trust Account.

166
The electrification of consumers living beyond the 200 meter concession area fell under the Rural Electrification Program “PER” developed by INDE. PER is a detailed plan for the 1999-2004 period to electrify 2,633 communities and reach 280,000 new connections, which was incorporated into the concession agreement for the two rural companies. The agreement stipulated that the PER program would be fully funded by INDE, but implemented by the concessionaire:
• The Government was to set aside US$333 million to fund PER: US$151 million for investments in transmission lines (1290 km of 69 kV lines and 380 km of 230 kV lines) and 28 substations, and US$182 million for the distribution networks (up to about 18,000 km of low tension distribution lines - 34.5 kV, 13.8 kV and below) and consumer connections. That is, the expected average cost per connected customer was expected to be US$1190.
• The concessionaire was expected to construct, on a reimbursement basis, the transmission lines, substations and distribution system for PER. The transmission lines and substations built as part of the PER would be owned and operated by INDE, and Union Fenosa be reimbursed against incurred costs. For its investments in new electrical distribution lines and household connections, Union Fenosa would be reimbursed on a fixed cost basis for each connection made through PER.
Apart from promoting new investments in rural transmission and distribution, a separate goal of PER was to make the two concessions more attractive to private bidders. The Government had been concerned about lack of interest of private distribution companies in bidding for rural concessions.
The Rural Electrification Trust Fund To ensure that funds are not diverted to other uses, the tender for DEOCSA / DEORSA established that the US$333 million for PER were to be placed in a foreign Trust Fund with INDE as trustee, responsible for contributing the required US$333 million to the trust, a Bank as the fiduciary agent, and the distribution companies (Union Fenosa) as the beneficiaries. Banco Agrícola Mercantil de Guatemala administers the fund, while the Bank of New York holds the funds offshore. The funds for PER were to come partly from Union Fenosa’s US$101 million payment for its 80% equity share in DEOCSA / DEORSA, partly from Government own funds, partly from loans which the Government was to get from development banks,. The Government, however, failed to provide its US$231 million share: by 2006 only US$106 million had been placed into the Fund on top of Union Fenosa’s payment.157 First in 2007 substantial new funds came in. INDE signed a US$ 41million loan with the BCEI for PER investments in rural transmission. The Global Partnership on Output-Based Aid (GPOBA) provided a US$6.7 million grant to co-finance per connected customer subsidies for Union Fenosa’s distribution investments from 2007-09. The fund is managed by a technical committee consisting of one representative from the Ministry of Energy and Mines, one from INDE, and one from the private concessionaires DEORSA-DEOCSA. Each year, the Management of INDE and DEOCSA-DEORSA revise the global PER plan and rural electrification requests, and produce the annual PER electrification plan, which identifies the
157 The main reason for this was GoG’s budgetary restrictions and delays in securing external funding. Negotiations with the Inter American Development Bank for a loan of up to US$90 m collapsed in 2004 because the Government and Union Fenosa at that time were in disagreement about the audited accounts of assets and liabilities for Union Fenosa´s take over of the two distribution companies. IDB has the policy not to give loans destined for institutions that have an ongoing legal dispute with the Government.

167
communities to be identified as well as the number of households to be electrified in each community. The Ministry of Energy and Mines (MEM) carries out the socio-economic study for the plan. The committee approves the annual work plan and authorizes the release of 20 percent of estimated costs up-front by Trust Fund Bank. Construction contractors are required to have 40% employment from the local community. Union Fenosa executes the works related to the rural
connection and produces the certificate of completion for verification by the Technical Committee. The technical committee hires independent supervisors (which include representatives of Union Fenosa) to verify that the connections made by DEOCSA and DEORSA are eligible for reimbursement under the PER. The supervisors visit communities to check whether the new connections are outside the 200-meter zone and are in residential dwellings. They report to INDE, which sometimes performs additional checks; in addition, INDE monitors the quality of ongoing work for the transmission investments. INDE then submits a final report to the technical
committee, which authorizes payment of the other 80 percent.
Ownership of PER-financed Assets
Transmission assets go to the balance sheet of INDE at the price paid to the concessionaires for the related PER projects. Distribution assets related to the PER project are owned by the concessionaire. But they enter into the depreciation cost schedule for the distribution tariff with only a fraction of the investment cost.
Subsidies to rural electrification The tariffs for rural consumers are subsidized from three sources. First, Union Fenosa receives a per connected customer subsidy, which is supposed to cover the full average cost of the distribution investments under PER. The historic US$649 level of the subsidy in 1999 was found by dividing the forecast US$182 million investment program with the targeted number of 281,000 household connections. It was to be inflation-adjusted each year based on the US inflation-index. The subsidy is US$737 in 2007, and will be US$770 in 2008. Two criteria define eligibility: (i) the connection must be for a residential dwelling (or health clinics, schools, churches, community centers,) and (ii) the dwelling must be more than 200 meters from the existing network. For the 2007-2009 investment program a slight change was introduced: US$51 (7%) of the average unit cost of US$763 per household is to be pre-funded by DEOCSA/DEORSA and recovered from the users through their tariffs over time. Since the distribution investment program makes up 55% of the total rural investment program, the investment subsidy to rural electrification amounts to 55%. Secondly, INDE’s transmission company, Empresa de Transporte y Control de Energía Eléctrica, takes the loans for the transmission part of the investment (the other 45% of the investment

168
program). Since INDE applies a national postage stamp tariff for its transmission charge, rural consumers are implicitly subsidized by this policy (less load per km of transmission). Thirdly, the Government introduced by law a social tariff for consumption levels below 300 kWh per month: households within that consumption level pay for the first 100 kWh per month a low social tariff (see next section). The price of the tariff is subsidized by INDE’s generation company EGEE, which provides the 80 MW of social-tariff consumption at below wholesale market price to DEOCSA-DEORSA and EEGSA.
Tariffs The power sector regulator CNEE sets tariff every five years with quarterly updates on tariffs for ‘pass through’ items included in the tariff formula such as cost of fuels, exchange rate and inflation rate. DEOCSA-DEORSA’s retail tariffs have two components: a fixed tariff component158 of US$1.22 per month and a variable/consumption cost159 of US$0.15/kWh. For customers whose consumption is lower than 100 kWh/month, the variable tariff is US$0.09 /kWh (“social tariff”). The subsidy in the social tariff is poorly targeted, benefiting more than 80 percent of DEOCSA-DEORSA’s consumers. Below is the cost of supply tariff for the first quarter of 2007.
Variable tariff Fixed tariff
US$ / kWh
Cost of energy purchased (generation) 0.10446 0
Operations & Maintenance 0.02192 1.03891
Cost of capital 0.02966 0.18365
0.156 1.222
The pass-through of the cost of generation in the tariff schedule led, in the light of increasing international oil prices, and increasing reliance in Guatemala on thermal power plants to a steady increase in the tariffs, see the chart. Yet, the cost of the substitution energies (kerosene and batteries) increased as well. The monthly electricity tariff early 2007 for 30 KWh consumption is US$4.0, which represents 8% of a monthly rural household income. The
current alternative energy cost is approximately USD 5.75 per family per month.
158 The fixed portion of the tariff covers costs associated with billing and collection, administration of accounts, etc and an allowance for capital replacement. 159 The variable or consumption tariff covers some elements of operation & maintenance, the cost of purchasing energy and capacity from the generators.

169
Results From 2000 to 2002, the PER program showed rapid progress, some 60,000 new connections were made per year.160 From 2003 it ran into difficulties due to INDE not being able to meet its financial contribution commitments: between 2003 and 2005 only 4,048 connections were made. As result, end 2006, the rate of progress towards the end-year 2004 target in transmission was 53% in
transmission lines161 and 68% in substations, while in distribution the target rate was 68% of household connections and 73% of electrified communities. 162 The PER-program was only one arm of the Government’s rural (and national) electrification program; the other was Union Fenosa´s obligatory connection obligation for households living within 200 meters of an existing distribution grid. From 1998 (pre-privatisation) to 2007, Union Fenosa more than doubled its number of customers from 632,000 to
1,300,000 clients.163 Of the increase in the number of clients, 468,000 came from the 200 meter connection obligation, 200,000 from PER.
EEGSA’s “urban” efforts added to the outcome; yet, as one can see in the year 2004 statistics, the rural consumers were now more numerous than the urban. The result was a doubling of annual connections compared to the pre-privatisation period. From 1991 to 1998, the number of connected customers in Guatemala increased from 735,000 to 1,284,000, that is, by half a million. Eight years later, an additional 1 million were connected, and the national electrification rate had increased from 65% to 85%. By province (“departamento”) Guatemala has end
160 May 2002 PER funding was verified for 122,000 connections in 1,100 communities. Another 12,000 connections were made but not certified as eligible for funding, most because they turned out to be inside the 200-meter zone. 161 Difficulties in obtaining the right-of-way for lines are also a reason for the delays. 162 During implementation of the PER it became clear that the original number of target communities was inaccurate: PER’s total beneficiaries were overestimated by 13,004 connections. According to the adjusted PER Plan for 2007-09, 76,369 users remain to be connected with a required investment of US$ 57.7 million. 163 EEGSA in 2007 has only 700,000 customers

170
2006, 6 with an electrification rate above 90%, 10 with an electrification rate between 80 and 89%, 4 with a rate between 61and 79%, and 2 with a rate below 60%: Petén (53%) and Alta Verapaz (45%). The consumer payment rates are very higher. The payment discipline (on bills) of low-income households in Guatemala is known to be high in general, and the Electricity Law allows distribution companies to disconnect non-paying consumers who two months in a row have not paid their bills.164 The terms of the PER program and of the regulated distribution tariff made rural electrification a commercially profitable activity. The per connected customer subsidy was, during the early successful years of the program, around 7 percent higher than the average cost of connections. The financial account on Dec 31 2005 showed gross profit on sales of 19% for DEORSA and 25% for DEOCSA, while the net profit (with tax reduction) on sales was 13% and 17% respectively.
Lessons learned from the Guatemalan Electrification Concept Guatemala like Morocco (US$1190 nominal, US$3690 PPP) had passed the two thresholds for the undertaking of final rural electrification: a national electrification rate above 50% and a per capita income higher than US$3000 on a PPP basis, these two factors together allow “complete rural electrification” to be financially feasible. Guatemala confirms the general lesson of international rural electrification experience: if enough funds are made available and a strong organisation is put in charge of rural electrification, one gets a large number of rural connections and sustainable rural electricity supply. Guatemala has several features of interest.
• The Trust Fund as a means to “guarantee” funding for the rural electrification program turned out to be efficient only for Union Fenosa’s US$101 million payment, the Government secured less than half of its share. What’s important is the idea to use proceeds from privatisation to finance new rural electrification projects.
• The per connected customer subsidy for the investments in distribution are a useful feature when investments are 100% grant financed: they give rhe private concessionaire a strong incentive to search or cost efficient solutions. In the end, it turned out that the negotiated fee “overpaid” Union Fenosa by 7%; but that might be an efficiency premium. The alternative procedure of 100% reimbursement of approved costs, which was applied for the transmission investments, is less efficient in the case of distribution investments: whereas transmission projects are implemented through turn key tenders, a mix of contractors and concessionaire own personnel is used for distribution projects. However, one also notes the limitations of the per connected customer subsidy: as soon as the cost per connection is equal to or superior to the subsidy, the concessionaire balks at implementing further investments.
• Letting the distribution company implement the rural transmission projects on behalf of the the national transmission company, is an instrument to ensure coordination of investments in transmission and in distribution, which in addition provides economies of scope and reduces the risk of corruption in the awarding of contracts won through tender.
• Putting a private “distribution monopolist” in charge of the rural electrification investments - the municipally owned electricity companies that account for less than 10 percent of sales and
164 The opposite is the case for very high income households.

171
connections in Guatemala, had no access to PER funds – provides economies of scale, Evidence suggests that bulk purchases of equipment have reduced costs below those in earlier rural programs in Guatemala.

172
I.7 Côte d’Ivoire: The basic Infrastructure Approach to RE
Introduction
In 1997, Côte d’Ivoire, a country of the 15.5 million inhabitants, had one of the highest urbanisation rates and one of the highest GDPs per capita in Sub-Saharan Africa. The national electrification rate of 25% and the rural of 8% were high by African standards.
Table 49: Basic Statistics Côte d’Ivoire, 1997 Year GDP(at PPP)
/capita Rural Population
in % National electrification
rate Urban electrification
rate Rural electrification
rate
1997 US$1640 50% 25% 43% 8%
Côte d’Ivoire pursued a “basic infrastructure” approach to rural electrification in which the primary goal is progress in “electrification coverage” - the number of electrified rural communities.165 In Côte d’Ivoire’s approach LV-lines (and street lights) follow only streets that are laid out in the town plan of the village, and due to national safety regulations allow only buildings made of solid material, such as bricks and concrete, are connected to the grid.166.
Power Sector Structure The Power Sector Law of 1985 allows private investment in generation, whereas transmission and distribution is a monopoly of the state, which is delegated in the form of concessions. The power sector reform of 1990 gave the management and operation of state-owned power generation, transmission and distribution assets as concession until 2002 to CIE167, who pays a leasing fee. The power company EECI168, which is majority owned by the State169, monitors CIE’s performance with regard to maintenance of the state’s property and is responsible for the planning and implementation of investments in transmission and distribution. The monopoly in transmission and distribution makes the state the sole responsible for rural electrification. In 1998, the institutional division between investment and operation made EECI responsible for the investments in rural transmission and distribution (approved by the Ministry’s Direction de l'Energie Electrique et des Energies Nouvelle), whereas CIE was responsible for connecting rural consumers to the distribution grid and for the operation of rural grids and generation. BNETD (Bureau National d’Études Techniques et de Développement) controls on behalf of the State the investment program performed by EECI. All tenders, bid selection and
165 The information in this annex is based on Wolfgang Mostert:” Lessons from Rural Electrification. The Case of Côte d’Ivoire”, ESMAP 1998 166 This requirement has a safety dimension (prevention of accidents such as fires), and an economic dimension (avoid that the building is torn down after connection). 167
The joint stock company is owned by EDF, Bouygues, private Ivorian investors and the state (20%). 168 EECI received in 1965 the exclusive concession for the development of transmission and distribution in Côte d’Ivoire. It was until 1990 an integrated power company involved in the whole chain from power production to power supply to final consumers. 169 The state owns 92 %, EDF (France) 3.5%. The rest is owned by the Caisse Française des Dépôts et Consignations and some private investors.

173
contracts had to be approved by BNETD; and BNEDT inspected the internal wiring of new applicants for grid connection to verify their compliance with safety regulations before CIE undertakes a connection.
Planning of investments The national power and rural electrification master plan from 1982 identified the rural electrification priorities. Donors financed different sections of the plan in the “Ivoinoir” program, which ran from 1983 to 1988. The concept of the “centres-araignées” (center-spider) program was to electrify villages within a region from a diesel generator plant located in a major rural village from which a number of 33 kV lines were spread to connect neighbouring villages. The program constructed 2000 km of MV lines between 1984 to 1988 for the electrification of 262 villages. The drawback of the “spider” approach was that the location of the MV lines was not ideal from the point of view of a national integrated system. Already the “Ivoinoir” program started to connect several "spider” villages to the interconnected grid. The rural electrification program got to a cross-road at the end of the 1990s, entering the difficult phase of rural electrification. The remaining unserved 7,000 rural “localités” were smaller than the 1750 that had been electrified, their population poorer and fewer of their basic infrastructure needs had been satisfied by the state. The Master Plan for Rural Electrification prepared by Tractebel in 1998 identified 1700 non-electrified “localités” with more than 800 inhabitants; these are the main targets for grid connection. For the other 5,300 “localités” off-grid solutions were sought for which innovative delivery mechanisms needed to be developed. A solar energy program financed by the Spanish Government installed solar energy systems in 1500 villages having a population of less than 400 inhabitants. The selection of villages for electrification is defined first at the political level by the Government and after that, at the technical planning level by EECI. During implementation an additional factor influences the outcome: pressure by local villages and settlements to be electrified in order to accept “right of way” for the transmission line.170 Within the politically fixed framework, planning for rural electrification is, in principle, decided on a technical basis. EECI distinguishes between technical, socio-economic, cost, and administrative criteria. The technical criteria comprise (i) the level of modernization of the buildings - the number (and percentage) of brick-houses in a village is an important parameter for the estimation of customers - and (ii) the existence of a town plan (“plan de lotissement”) that provides a division of the village into quarters with streets having the minimum dimensions for modern streets.171 The economic cost criteria comprise the distance of the village from the MV-grid; distance between villages that need to be electrified; and the level of concentration of population.172 The socio-economic criteria comprise the level of commercial activity in the village: cooperatives, workshops, mills, boutiques; autoproducers of electricity; social infrastructure: schools, health centers; number 170 Local opposition was not a major problem as long as only the major towns and villages were electrified. But by moving to the lower sizes of villages, the difference in the characteristics of villages who are in and who are out, became smaller, which increased dissatisfaction. 171 The “town-plan policy” is linked to the “public lighting” focus of rural electrification. The policy avoids that investments in distribution lines and in public lighting have to be redone once the town plan is made and changes are introduced. But it leads to the “automatic” establishment of a basic grid in the town plan area, although some of the distribution lines will have few consumers during the first years. 172 This is not translated into a hard cut-off criteria such as level of investment per beneficiary household.

174
of households. The administrative criteria comprise the classification as sous-préfecture, commune; village centers; replaced settlements for reasons of national interest (due to construction of dams).
Sources of Finance and Subsidy Policy Subsidy funds for rural electrification came from three sources: • From cross-subsidies within the tariff structure in the form of lifeline tariffs 173 and a rural
electrification consumption tax. • From the state budget in form of grant investment funds and the payment of the cost of public
lighting in rural villages and towns. • From grants and soft loans from donors. The rural electrification charge generated around 1 billion FCFA per year during the 1980s and about 2 billion FCFA (US$3.7 million) per year since the mid-1990s. As the average cost of investment per electrified village under the 1995-98 rural electrification program was around US$200,000, the annual revenue from the rural electrification tax equalled the cost of investment of 19 villages or 13% of the electrification of 150 villages per year, which was achieved by the 1995-98 rural electrification program. Compared to the Government’s goal in 1995 of connecting 250 villages per year to the national grid, the revenue amounted to 8% of financing needs. A decision of the Ministry of Mines and of Energy publicized in November 1998 requires villages to co-finance 3 percent of the cost of their electrification. The village authorities submitted requests to FRAR – a rural infrastructure fund - for co-funding the 3 percent contribution. The remaining gap in funding was covered in kind by “free” local labor during construction and by asking affected households to come up with a financial contribution. The decision of November 1998 introduced another novelty in rural electrification: it expanded the level of publicly financed investment to include the cost of household connection and of basic internal wiring - the cost of the internal electric installations varies from 70,000 to 380,000 FCFA (US$172-690) depending on the size and the modernity of the house. The measure compensates for the lack of rural household credits and will increase the connection rates inside the villages. But it is also a means to reduce costs: it is too expensive for EECI/CIE staff to return to a village several months later to connect customers that did not sign up at the time of the original investment.
Consumer tariffs The average rural household consumed 225 kWh per year in 1997 for which CIE charged 9800 FCFA (US$18 = 8 UScents/kWh), including the cost of fixed tariff elements. According to first year results of the 1995-98 rural electrification program, the consumption of public lighting accounts for about 50 percent of electricity consumption in newly electrified villages. That the state budget paid CIE for public lighting, therefore, was an important means to improve the commercial feasibility of rural electrification.
173 “Lifeline tariff” = below cost tariffs for monthly electricity consumption below 15-30 kWhs.

175
Causes and Implications of Fluctuating Investment Levels Despite the attempts at rational RE planning, the rate of electrification depended on donor finance:
• during the 1970s 20 villages were connected per year; • between 1979 and 1990, EECI, supported by donor loans and grants, invested 115 billion
FCFA in rural electrification - roughly US$20 million per year – allowing 49 villages per year to be connected;
• between 1988 and 1993, the electrification rate dropped to 10-15 villages per year, as only the revenue from the rural electrification tax was used to fund rural investments;174
• in 1993, the Government adopted the goal of electrifying 250 new villages per year. In that year, the Government decided to electrify 233 villages, 150 through Government funds, the rest through donor funding, yet, due to, inter alia, the turmoil of the 1994 devaluation crisis, only 27 villages were electrified.
• the 1995-99 investment program electrified 150 villages per year; phase 1 completed in 1998 comprised the electrification of 355 villages with an investment of 20 billion FCFA (US$ 37 million = US$104,000 per village); phase 2 to be completed in 1999 was to electrify 410 villages for an investment of 57 billion FCFA (US$ 105 million = US$256,000) 175.
• in November 1998, the Government approved the “1998-2000 social electrification program” comprising (i) a “rural electrification component” of 664 villages for an investment of 75 billion FCFA (US$138 million or $209,000 per village) and (ii) an “urban and peri-urban component“ to electrify 957 settlements at a cost of 48 billion FCFA (US$106 million, or US$107,000 per settlement).
The jump in the level of annual electrification by the 1995 new rural electrification program to connect 648 villages was expected to put heavy pressure on the available manpower and financial resources in the public and private sector. Two measures were introduced to confront the situation: (i) GSPER, the “Special Group for the 1995-96 Rural Electrification Program” was created to monitor the progress of the program and to advise on initiatives, and (ii) a special training program was started for private construction and electricity companies. Yet, the implementation of investments under the 1995-96 program fell behind schedule. Inexperienced companies, which underestimated costs in their tender bids won most of the contracts for the works. During construction, many had to give up leaving the work unfinished 176.
Introduction of low cost technologies and operational procedures Both EECI in investments and CIE in operations have tried to introduce novelties in order to reduce the cost of rural electrification. For major regional grids, EECI experimented with the introduction of SWER-technology in CIDA-financed rural electrification projects. The experiment was a demi-success only, because in the
174 The economic crisis from 1984 to 1994 limited the self-financing capacity of EECI and of the state budget to undertake rural electrification investments. But loans signed with donors until 1982 permitted a high level of investment in rural electrification until 1988, when the Ivoinoir program ended. 175 The higher investment cost per village for phase 2 is mainly due to longer MT lines At the end of 1998 it was still uncertain how many villages will be electrified during phase 2 - a ministerial communication in November 1998 referred to 306 villages; also the financial globe was not known with precision. 176 A side effect was theft of equipment and materials as financially weak entrepreneurs stole from the construction sites of other entrepreneurs.

176
absence of single-phase electric motors on the national market, the electrification projects did not replace the use of diesel generators for productive applications. For small isolated village grids, tested the GECO-concept. It keeps down the cost of initial investment and of fuel consumption by offering an integrated low-cost technology package from the level of consumer installations through distribution to generation. The household installation comprises energy efficient lighting in the form of 8-13 W fluorescent lamps, one of which is placed outside the house, and one or more current outlets. Each house is protected by a fuse of 0.2 A, 0.5 A or 1 A depending on the number of lamps and outlets. Power is supplied by “domestic gensets” (gasoline or diesel) with a capacity of 1.5 to 5 kVA to consumers via a simple monophase grid. Public lighting at the poles is provided by 18 W or 36 W fluorescent lamps. The cost of a GECO system for a village including interior cabling and public lighting is about 150,000 to 250,000 FCFA (US$280-470) per house; which compares favorably with the more than 1.2 million FCFA (US$2,250) per household in EECI “conventional” rural electrification projects. But operation revealed great durability problems with the small gensets. The technical and financial management of the system is assumed by a consumer cooperative formed by the village consumers. The cooperative hires a person on a part time basis to operate the gensets and to perform simple maintenance. Consumers pay a monthly tariff based on the number of lamps and electric appliances. CIE handed the collection of payments in rural villages over to a local person, typically a teacher, who collects the payments from consumers and receives a percentage fee from CIE; billing continues to be done by CIE staff.
Impacts and Issues
Progress in rural electrification, when expressed as the “percentage of the national population living in electrified communities”, was more impressive than indicated by the 8% rural electrification rate. Since mud houses make up 70% of rural houses, connection rates in rural communities are 8% -30% only. Yet, in 1998 only one third of the national population lived in settlements without an electric grid; while one third of national households, almost two thirds of urban and one twelfth of rural households were connected to the grid. Table 50: Côte d’Ivoire Urban and Rural Electrification Rates, 1998 Category Number
of loc. 1993 population
Average Size
% total 1998 LV-customers
Conn. Rate
Urban: Abidjan Other cities Other urban Unserved urban
1 7 216 6
2,450,000 1,210,000 3,090,0002)
2,450,000
173,000 14,310
18%
9% 23%
%
300,000
117,0002) 153,0002)
0
75% 65% 33% 0%
Total urban 230 6,750,0003) 29,350 50% 570,000 57% Rural: Electrified Non-electrified
1,500 6,830
2,160,000 4,590,000
1,440
672
16% 34%
80,0002)
25% 0%
Total rural 8,3301) 6,750,0003) 810 50% 8% National total 8,5601) 13,500,000 1,577 100 650,000 32% 1) This figures does not include the 83,500 socalled “campements”, which are settlements without independent
administrative status.

177
The policy of connecting solid buildings only has its cons. It keeps the connection rate within a village lower than in the absence of such criteria and explains partly the high cost of investment per connected rural consumer: US$4000 for the 1995-98 rural electrification program.

178
ANNEX II: LITTERATURE LIST Amader: “Note de Synthese sur l’etat d’avancement des Projets PCASER et PTF », (2007) Claus, Burghard & Mostert, Wolfgang:“MENA Center for Renewable Energy and Energy Efficiency. Demand Study”, (May 2007) (unpublished report for KfW). Dalelo, Aklilu: “Rural Electrification in Ethiopia: Opportunities and Bottlenecks”, (2005) Gbeddy, Francis: “Rural Electrification in Ghana: The Self-Help Electrification Programme (SHEP) Experience”, (2005) Mostert, Wolfgang & Sitoula, Mahendra: “Community Energy Service Providers, Nepal Renewable Energy Project, REP”, (2008) World Bank: “World Development Report 2007” World Bank: “Ghana Energy Development and Access Project, Project Information Document”, (2006) Information from websites: AEPC Nepal, www.aepc.np AMADER Mali, www.amadermali.org FUNAE Mozambique, www.funae.co.mz REA Uganda, www.rea.or.ug
Related Documents