Aidspan: TB Expenditure in High Burden Countries (October 2014) Introduction Strong investment cases and improving value-for-money in public health programs are key priorities for donors - none more so than the Global Fund to Fight AIDS, TB and Malaria: the world's largest health financing mechanism for the three diseases. Aidspan has conducted a simple analysis of expenditure by national tuberculosis programs as reported by governments, excluding contributions by the US government*, relative to the burden of disease. The analysis assesses the proportional contribution by the Global Fund to other sources of funding in 22 countries classified as high-burden. Their classification as high-burden countries (HBC) is given because together they constitute about 80% of the total burden of disease, and over 1 million of the deaths reported annually from TB**. Expenditure reported by national Tuberculosis programs in 22 high burden countries between 2010 – 2012: what is the Global Fund’s contribution? www.aidspan.org Kate Macintyre and Brian Mwangi This paper contributes to discussions around value-for-money in health programs by analyzing the costs of treatment and prevention of tuberculosis as reported to WHO each year by 22 countries designated as "high-burden": contributing to 80% of the overall burden of tuberculosis. The study is a cross-national comparison across three years (2010-2012) of reported expenditure. The authors used an average annual cost, taken over the three years, to estimate the cost per notified cases. Five countries were included in the BRICS grouping; the remaining 17 were classified separately. A proportion of funding provided by the Global Fund was compared with funding from domestic and other sources. Findings show that between 2010 and 2012, the national TB programs (NTP) in all 22 high-burden countries reported $ 6.37 billion in total expenditure for 14 million reported cases of TB. The number declines to $2.7 billion when the Russian Federation is excluded. For the 17 non-BRIC countries the cost per notified case ranges from $30 per case in Myanmar to $289 in Thailand, with an average of $89 per case per year. For BRICS countries excluding Russia, the average spend per case was $118 per year. For the non-BRICS countries the average spend was $31 per notified case per year. Again, for the non BRICS countries, the Global Fund grants money met between 9% and 76% of the total expenditure for these countries programs, with an average of 40%. Average total cost per case notified, which varies considerably across the countries, appears relatively modest given the scale of the epidemics. Among the 17 non-BRICS countries, the Global Fund's contributions are substantial. The risks of relying on one granting organization for a high proportion of funds are discussed, particularly for these non-BRICS countries. The implications of this, in the context of the roll-out of the Fund's new funding model (NFM), are briefly discussed. * An estimation of the United States Government funds spent in the HBC countries 2010 - 2012 is given in Appendix A. ** Afghanistan, Bangladesh, Brazil, Burma, Cambodia, China, Democratic Republic of Congo, Ethiopia, India, Indonesia, Kenya, Mozambique, Nigeria, Pakistan, the Philippines, Russia, South Africa, Tanzania, Thailand, Uganda, Vietnam, and Zimbabwe. The BRICS are Brazil, Russia, India, China and South Africa.

Welcome message from author
This document is posted to help you gain knowledge. Please leave a comment to let me know what you think about it! Share it to your friends and learn new things together.
Transcript

Aidspan: TB Expenditure in High Burden Countries (October 2014)
Introduction Strong investment cases and
improving value-for-money in public health
programs are key priorities for donors - none
more so than the Global Fund to Fight AIDS, TB
and Malaria: the world's largest health
financing mechanism for the three diseases.
Aidspan has conducted a simple analysis of
expenditure by national tuberculosis programs
as reported by governments, excluding
contributions by the US government*, relative
to the burden of disease. The analysis assesses
the proportional contribution by the Global
Fund to other sources of funding in 22
countries classified as high-burden. Their
classification as high-burden countries (HBC) is
given because together they constitute
about 80% of the total burden of disease, and
over 1 million of the deaths reported annually
from TB**.
Expenditure reported by national Tuberculosis
programs in 22 high burden countries
between 2010 – 2012: what is the Global
Fund’s contribution?
www.aidspan.org Kate Macintyre and Brian Mwangi
This paper contributes to discussions around value-for-money in health programs by analyzing the costs
of treatment and prevention of tuberculosis as reported to WHO each year by 22 countries designated
as "high-burden": contributing to 80% of the overall burden of tuberculosis. The study is a cross-national
comparison across three years (2010-2012) of reported expenditure. The authors used an average
annual cost, taken over the three years, to estimate the cost per notified cases. Five countries were
included in the BRICS grouping; the remaining 17 were classified separately. A proportion of funding
provided by the Global Fund was compared with funding from domestic and other sources.
Findings show that between 2010 and 2012, the national TB programs (NTP) in all 22 high-burden
countries reported $ 6.37 billion in total expenditure for 14 million reported cases of TB. The number
declines to $2.7 billion when the Russian Federation is excluded. For the 17 non-BRIC countries the cost
per notified case ranges from $30 per case in Myanmar to $289 in Thailand, with an average of $89 per
case per year. For BRICS countries excluding Russia, the average spend per case was $118 per year.
For the non-BRICS countries the average spend was $31 per notified case per year. Again, for the non
BRICS countries, the Global Fund grants money met between 9% and 76% of the total expenditure for
these countries programs, with an average of 40%.
Average total cost per case notified, which varies considerably across the countries, appears relatively
modest given the scale of the epidemics. Among the 17 non-BRICS countries, the Global Fund's
contributions are substantial. The risks of relying on one granting organization for a high proportion of
funds are discussed, particularly for these non-BRICS countries. The implications of this, in the context of
the roll-out of the Fund's new funding model (NFM), are briefly discussed.
* An estimation of the United States Government funds spent in the HBC countries 2010 - 2012 is given in Appendix A.
** Afghanistan, Bangladesh, Brazil, Burma, Cambodia, China, Democratic Republic of Congo, Ethiopia, India, Indonesia, Kenya,
Mozambique, Nigeria, Pakistan, the Philippines, Russia, South Africa, Tanzania, Thailand, Uganda, Vietnam, and Zimbabwe. The
BRICS are Brazil, Russia, India, China and South Africa.
Page 2 Aidspan: TB Expenditure in High Burden Countries (October 2014)
During the three-year period 2010-2012, just
over 14 million cases were reported by
national TB programs (NTP) in those 22
countries to the World Health Organization
(WHO). More than 3.5 million of those people
died.
At a global level, the high rates of morbidity
and mortality appear to be slowly declining in
most countries, but not all (WHO Global TB
Reports, 2011 and 2012). Indeed, joint
infection with HIV, as well as the rising
incidence of MDR-TB, remains twin threats to
many populations, despite the considerable
investment of domestic and foreign resources
in controlling TB.
The analysis sought to ascertain the
proportion of support from the Global Fund
per notified case in HBC. Then it went deeper,
to calculate whether there were significant
cost-per-case differences between countries,
and between the BRICS and non-BRICS within
the HBCs. These comparisons are likely to be
useful at country and regional level, as part of
the push to make every dollar spent on health
count. By comparing the proportion spent by
the Global Fund with that of other sources of
income, the risk of relying on a single donor
was also highlighted.
The analysis was based on three years of
existing data for the 22 HBC and looked at
basic descriptors and relationships among
three variables: total cost of national
programs (as reported by the NTPs to WHO),
the Global Fund contribution to those national
programs as recorded by disbursements
(reported on the Global Fund website)* and
the total number of notified cases of TB**.
Totals were disaggregated by BRICS and non
-BRICS high burden countries, as followed by
other TB analysts (Floyd et al, 2013). This was
done to allow for the much bigger population
of several of the BRICS, and the fact that
although they have all received grants from
the Global Fund, in relative terms (next to their
burden of disease) those grants have not
been large.
The classification of these 22 countries as high-
burden, responsible for 82% of the disease
burden, has remained consistent in the period
under review. This helps ensure consistency in
data extraction and analysis. Nearly all of the
countries were recipients of Global Fund
grants during the period. Focusing on only 22
countries might be considered a limitation of
the analysis, but given the proportion of the
global TB burden that these countries carry
this can also be interpreted as a strength of
the paper.
Background Tuberculosis continues to have a
very high rate of disease in many countries,
despite signs in the last decade of the
epidemic beginning to fall globally (Global TB
Report, 2012). Some HBC are still experiencing
rates between 300 and 400/100,000 (Global TB
Report, 2013). In 2012, for example, an
estimated 8.6 million people developed TB,
and of these about 1.3 million died of the
disease. Of the 8.6 million who developed TB,
6.2 million were “notified cases” (and the
breakdown within this group is that 5.7 million
were new cases, and 400,000 were relapse or
previously diagnosed cases. A further 3 million
cases are estimated as being missed globally.
* NTPs report the Global Fund contributions in the summary reports to WHO each year, but because some countries do not count
the amount given by the Fund in their disbursement to pay for technical assistance and some other costs, we decided to use the
Global Fund disbursement records as reported by the Fund on their website.
** A tuberculosis notified case is a new or relapse case, or a case who has had their treatment changed in that year.
Page 3 Aidspan: TB Expenditure in High Burden Countries (October 2014)
These are patients who are not diagnosed or
treated by the national programs, but are
“missed” for a number of reasons. Those
reasons include: clinical misdiagnoses, or
death before diagnosis of TB, but are
subsequently thought to have died of the
disease. Or these are patients who have no
access to health services (live in hard to reach
areas) or they may be patients who get care
and treatment in private facilities, who do not
then report to the NTPs.
The cost of this burden is large. The total
expenditure by TB programs globally has
been documented for the period 2002 to
2011 by Floyd and colleagues (Floyd et al
2013). The total reported as spent by NTPs
grew from $1.7 billion in 2002 to $4.4 billion in
2011. By 2013, this had grown to over $6
billion (Global TB Report 2013), contributed in
the form of national budget allocations,
foreign loans to governments, grants from
donors -- either agencies or in bilateral
contributions from governments -- and grants
through the Global Fund. Again, by 2013, the
Global Fund was the largest external investor
in TB case management, responsible for
about 80% of the total international spending
on TB, with over $700 million in disbursements
were sent to countries that year.
In the first paper of its kind, Floyd et al (2013)
looked at the trends in funding and spending
around TB between 2002 and 2011 across 104
countries including all HBC. They also
examined the cost per patient successfully
treated, measuring the value for money in
each of the programs. This money mostly paid
for diagnosis and treatment for drug-
susceptible TB. Between 2002 and 2012, more
than 43 million cases had been successfully
treated.
Cost for treatment in low- and lower middle-
income countries ranged between $100 and
$500 per patient. Other research in this area is
lacking, beyond a recent paper by Diel and
colleagues that shows the average per TB
patient cost within the 27 European Union
member states ranging between $4,386 and
$13,263 for drug-susceptible TB, to between
$30,960 and $73,500 for MDR TB, and up to
$220,200 for XDRTB patients in some countries
(Diel et al, 2014). These totals include both
direct and indirect costs of treating TB in these
countries.
As TB is a notifiable disease, there is now a
substantial body of data available on rates of
disease, treatment completion and the
demography of those affected. Most of these
data are open-source. Financial data are also
increasingly available although they remains
harder to interpret often due to the variability
in what is reported and when.
There are a number of current approaches to
estimating the total costs of the TB burden.
Generally, analysts separate direct and
indirect costs. Direct costs are identified as
program costs, such as human and lab-based
or medical resources, administration,
supervision, lab or associated costs with
running the programs, and patient costs
including access to care and maintaining
treatment for as long as is necessary.
Indirect costs to patients include lost
productivity costs due to disease and lost
opportunity to families who have to spend
scarce resources caring for the patient
instead of on other essential needs.
Methods currently in use by most NTPs do not
usually report the cost of treatment during
outpatient visits or in-patient costs (ie the cost
of staying in hospital or treatment facilities
once diagnosed).
Another area of research beyond the scope
of this paper is estimation of the economic
burden of TB care for patients and their
families and households, including indirect
and opportunity costs (Tanimura et al, 2014).
Page 4 Aidspan: TB Expenditure in High Burden Countries (October 2014)
Such research has also sought to estimate the
costs of disease to national economies and
the total financial / economic burden of
disease. This is of particular interest to those
trying to measure the contribution of TB to
poverty of households (Ukwaja et al, 2012).
This paper uses data from WHO’s global TB
database as well as the Global Fund’s own
data services. The question asked is: what is
the Global Fund’s contribution to the cost per
notified case of TB in the high burden
countries? To answer this question the authors
also answer the wider question: what is the
cost reported by NTPs per TB case notified to
WHO?
Methods and Data This study was designed
to measure the contribution by the Global
Fund to the cost per notified case as
measured by the NTP’s in the Global TB
Reports (2010 – 2012). It is a descriptive study
using secondary data from several sources
(described below). Three variables were
extracted and three additional variables
were created for analysis. The three extracted
variables are: total notified new and relapse
cases of TB; total disbursed Global Fund
money; and total government or domestic
expenditure plus other loans and grants.
Data sources: All TB notified cases from 2010-
2012 from 22 HBC were gathered and
extracted from the WHO Global TB Reports.
The records and reports used can be found
here and here. This extraction included all
new and relapsed* cases of TB (smear
positive and smear negative, pulmonary, and
extra-pulmonary TB) that occurred during
those three years. [Note: the notified patients
are only a proportion of all patients treated
for drug sensitive TB and the retreatment or
relapse cases can be up to 20 per cent of all
cases treated]. Costs are aggregated into an
annual total. The reports also provide a
breakdown of the sources of funding for these
expenditures: government, Global Fund,
loans and other grants.
The analysis compared the sum total of
funding from government, loan and other
grant contributions -- called 'domestic and
other grants totals' -- with the funding
provided by the Global Fund.
Global Fund Disbursements: Disbursements to
countries as reported by the Global Fund
provided the best-quality data for the Fund's
own grants. The Fund has been publicly
reporting disbursement data by grants since
2002. Global Fund reports of disbursements to
HBC were extracted for each of the three
years and summarized. The reason we relied
on the Global Fund disbursement data rather
than the NTP reports is that we believe that
the former are more complete than the latter.
According to the WHO Global TB Program,
some countries split their disbursements by
whether they were spent on core NTP costs or
were spent on technical assistance. We note
that the NTPs only report on Global Fund
money that comes through their channels.
What this means is that PRs that are non-
governmental (either CSOs, or UN
organizations), who also receive funds for TB,
do not necessarily channel the funds onwards
to the NTPs but also use them for TB-related
work. These are outside the reporting
channels of the NTPs. We captured the total
disbursement amounts, via the Global Fund
website, within the Aidspan platform on
grants (see here).
* Relapse cases are: people who have been previously been treated for TB and for whom there was bacteriological confirmation
of cure and/or documentation that treatment was completed. Relapse cases may be true relapses or a subsequent episode of TB
caused by reinfection and for this reason they are added to the new cases.

Page 5 Aidspan: TB Expenditure in High Burden Countries (October 2014)
To reduce the likely “float and bounce” of the
financial data we took the sum of three year
totals, and then took averages of those totals
to get yearly rates, rather than try and look at
these data by year. This is because reporting
on expenditure by these programs can vary
considerably and since our aim was to
measure the proportion that the Global Fund
has been contributing per case notified, and
not look specifically at the costs, we decided
that using an average for three years of data
would ease interpretation.
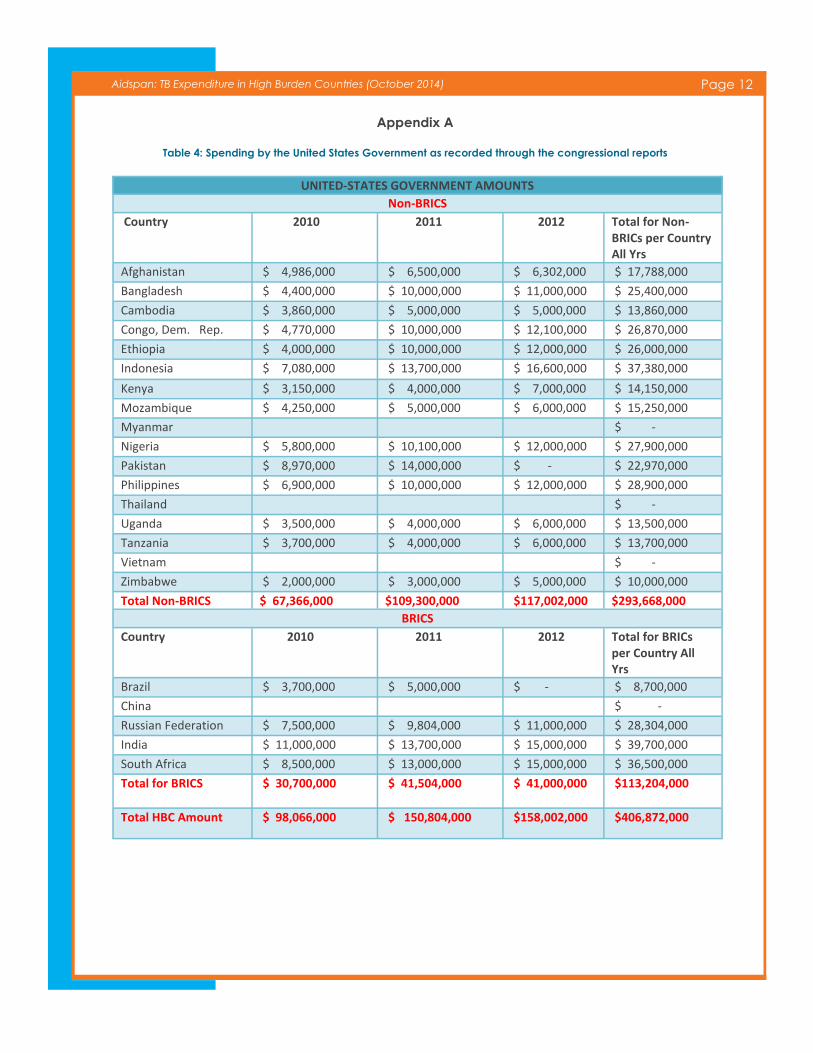
The US government (USG) invests a lot of
funds in TB control in these high-burden
countries, but relatively small amounts of
these funds go through the national
governments. Instead the funds tend to be
programmed through large civil society
organizations. Typically, those organizations
are the international NGOs and companies
that USAID and CDC work with at country
level. Because these funds are not handled
by the NTPs, they are not counted in their
reporting of expenditure to WHO. In Appendix
A, we provide the totals for each of the HBCs
that the US provided funds to, as reported in
the Congressional Budget Justifications in the
years 2010, 2011 and 2012.
It must also be acknowledged that USG also
gives about one-third of all the funds used by
the Global Fund, and has done since its
inception.
Results As described above, our results are
split by non-BRICS and BRICS countries. We
also removed Russia as its reported
expenditure was more than half the total
global expenditure, and using it in this analysis
strongly biases the results upwards (on
average). In addition, we understand that
Russia includes in its reporting all in-patient
and out-patient health system costs that are
not included by other countries. Its extreme
outlier status makes it certainly worthy of
analysis but we decided that this was not the
place to do it.
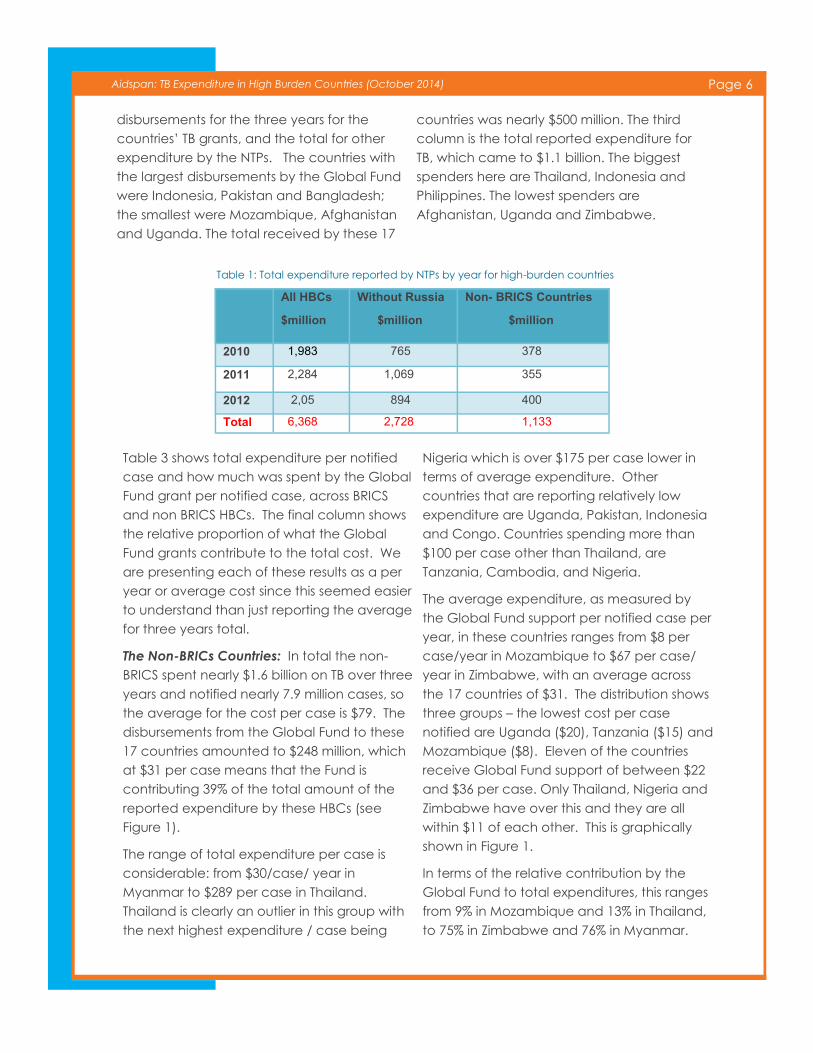
Expenditure Analysis: Table 1 shows the total
expenditure per year by national TB
programs. Between 2010 and 2012, NTPs in all
HBC report a total of $ 6.37 billion spent.
Without Russia, this total is $2.73 billion. For the
17 non-BRICS countries, the total is $1.13
billion. Table 1 presents this by year, showing
the peak of expenditure over the period in
2011.
Table 2 shows the total expenditure as
reported by the NTPs across non BRICS and
BRICS high-burden countries for the three
years 2010 to 2012. It shows the Global Fund
Note: This is not a full economic evaluation of the
cost of TB. We have not attempted to measure all the
direct and indirect costs to households and individuals
affected by the disease, nor can we estimate the
economic development costs of the disease. We are
limited by the data in the WHO TB Reports collected
from all countries with a significant burden of TB but
which do not include the full costs borne by the na-
tional programs or the governments in question. For
example, the majority of the countries we have
looked at do not report the in-patient costs of treating
patients with the disease, nor do they report the out-
patient staff costs. In every country included in this
analysis, there are many civil societies or faith-based
organizations (eg mission hospitals and private facili-
ties) that spend a lot on the diagnosis, treatment and
follow up on TB patients and their families. Spending
by these groups is not reported globally or even na-
tionally in many places. Finally, there are some do-
nors who provide support to the national TB program
via other routes. For example, many PEPFAR-
supported countries received money for TB or joint
HIV/TB work but the funds for these activities mostly do
not flow through the government, but via their large
INGO partners or the local implementing partners. As
a result the total amount of money spent in HBC is
larger than that reported by the NTPs annually
through the WHO TB databases. Despite these cave-
ats, this analysis remains useful as a starting point.
Page 6 Aidspan: TB Expenditure in High Burden Countries (October 2014)
disbursements for the three years for the
countries’ TB grants, and the total for other
expenditure by the NTPs. The countries with
the largest disbursements by the Global Fund
were Indonesia, Pakistan and Bangladesh;
the smallest were Mozambique, Afghanistan
and Uganda. The total received by these 17
countries was nearly $500 million. The third
column is the total reported expenditure for
TB, which came to $1.1 billion. The biggest
spenders here are Thailand, Indonesia and
Philippines. The lowest spenders are
Afghanistan, Uganda and Zimbabwe.
Table 3 shows total expenditure per notified
case and how much was spent by the Global
Fund grant per notified case, across BRICS
and non BRICS HBCs. The final column shows
the relative proportion of what the Global
Fund grants contribute to the total cost. We
are presenting each of these results as a per
year or average cost since this seemed easier
to understand than just reporting the average
for three years total.
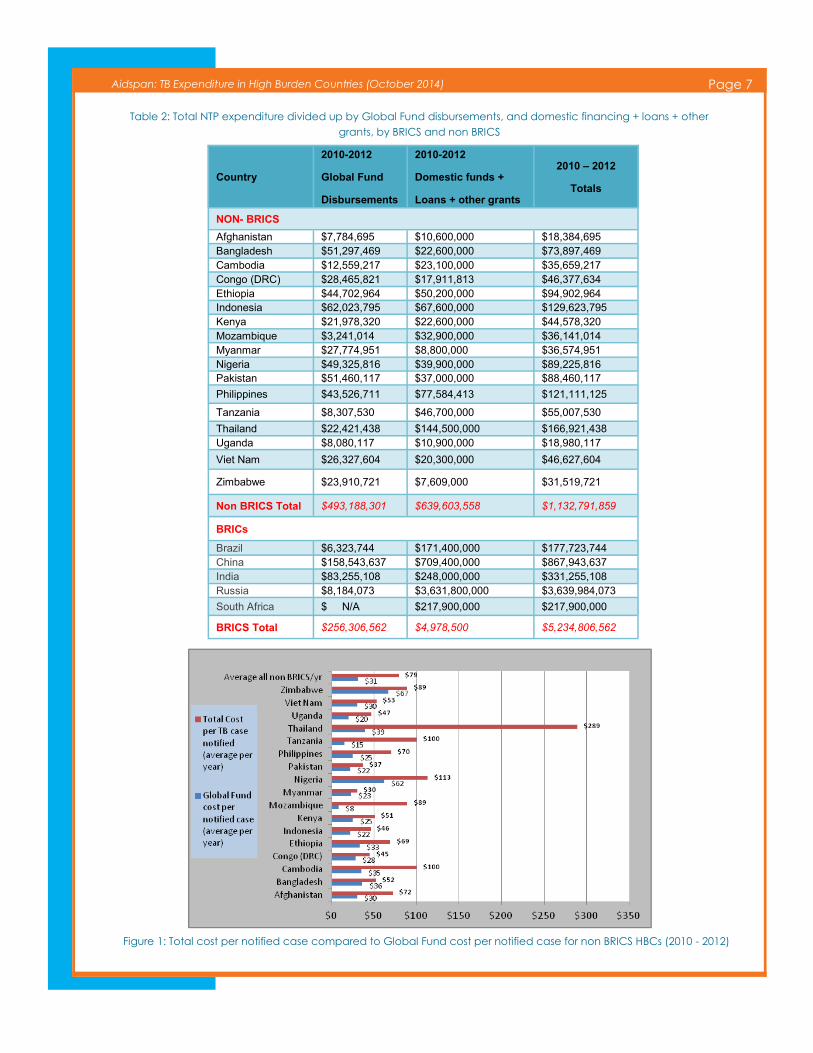
The Non-BRICs Countries: In total the non-
BRICS spent nearly $1.6 billion on TB over three
years and notified nearly 7.9 million cases, so
the average for the cost per case is $79. The
disbursements from the Global Fund to these
17 countries amounted to $248 million, which
at $31 per case means that the Fund is
contributing 39% of the total amount of the
reported expenditure by these HBCs (see
Figure 1).
The range of total expenditure per case is
considerable: from $30/case/ year in
Myanmar to $289 per case in Thailand.
Thailand is clearly an outlier in this group with
the next highest expenditure / case being
Nigeria which is over $175 per case lower in
terms of average expenditure. Other
countries that are reporting relatively low
expenditure are Uganda, Pakistan, Indonesia
and Congo. Countries spending more than
$100 per case other than Thailand, are
Tanzania, Cambodia, and Nigeria.
The average expenditure, as measured by
the Global Fund support per notified case per
year, in these countries ranges from $8 per
case/year in Mozambique to $67 per case/
year in Zimbabwe, with an average across
the 17 countries of $31. The distribution shows
three groups – the lowest cost per case
notified are Uganda ($20), Tanzania ($15) and
Mozambique ($8). Eleven of the countries
receive Global Fund support of between $22
and $36 per case. Only Thailand, Nigeria and
Zimbabwe have over this and they are all
within $11 of each other. This is graphically
shown in Figure 1.
In terms of the relative contribution by the
Global Fund to total expenditures, this ranges
from 9% in Mozambique and 13% in Thailand,
to 75% in Zimbabwe and 76% in Myanmar.
Table 1: Total expenditure reported by NTPs by year for high-burden countries
All HBCs
$million
Without Russia
$million
Non- BRICS Countries
$million
2010 1,983 765 378
2011 2,284 1,069 355
2012 2,05 894 400
Total 6,368 2,728 1,133
Page 7 Aidspan: TB Expenditure in High Burden Countries (October 2014)
Country
2010-2012
Global Fund
Disbursements
2010-2012
Domestic funds +
Loans + other grants
2010 – 2012
Totals
NON- BRICS
Afghanistan $7,784,695 $10,600,000 $18,384,695 Bangladesh $51,297,469 $22,600,000 $73,897,469 Cambodia $12,559,217 $23,100,000 $35,659,217 Congo (DRC) $28,465,821 $17,911,813 $46,377,634 Ethiopia $44,702,964 $50,200,000 $94,902,964 Indonesia $62,023,795 $67,600,000 $129,623,795 Kenya $21,978,320 $22,600,000 $44,578,320 Mozambique $3,241,014 $32,900,000 $36,141,014 Myanmar $27,774,951 $8,800,000 $36,574,951 Nigeria $49,325,816 $39,900,000 $89,225,816 Pakistan $51,460,117 $37,000,000 $88,460,117
Philippines $43,526,711 $77,584,413 $121,111,125
Tanzania $8,307,530 $46,700,000 $55,007,530
Thailand $22,421,438 $144,500,000 $166,921,438 Uganda $8,080,117 $10,900,000 $18,980,117
Viet Nam $26,327,604 $20,300,000 $46,627,604
Zimbabwe $23,910,721 $7,609,000 $31,519,721
Non BRICS Total $493,188,301 $639,603,558 $1,132,791,859
BRICs
Brazil $6,323,744 $171,400,000 $177,723,744 China $158,543,637 $709,400,000 $867,943,637 India $83,255,108 $248,000,000 $331,255,108 Russia $8,184,073 $3,631,800,000 $3,639,984,073
South Africa $ N/A $217,900,000 $217,900,000
BRICS Total $256,306,562 $4,978,500 $5,234,806,562
Table 2: Total NTP expenditure divided up by Global Fund disbursements, and domestic financing + loans + other
grants, by BRICS and non BRICS
Figure 1: Total cost per notified case compared to Global Fund cost per notified case for non BRICS HBCs (2010 - 2012)
Page 8 Aidspan: TB Expenditure in High Burden Countries (October 2014)
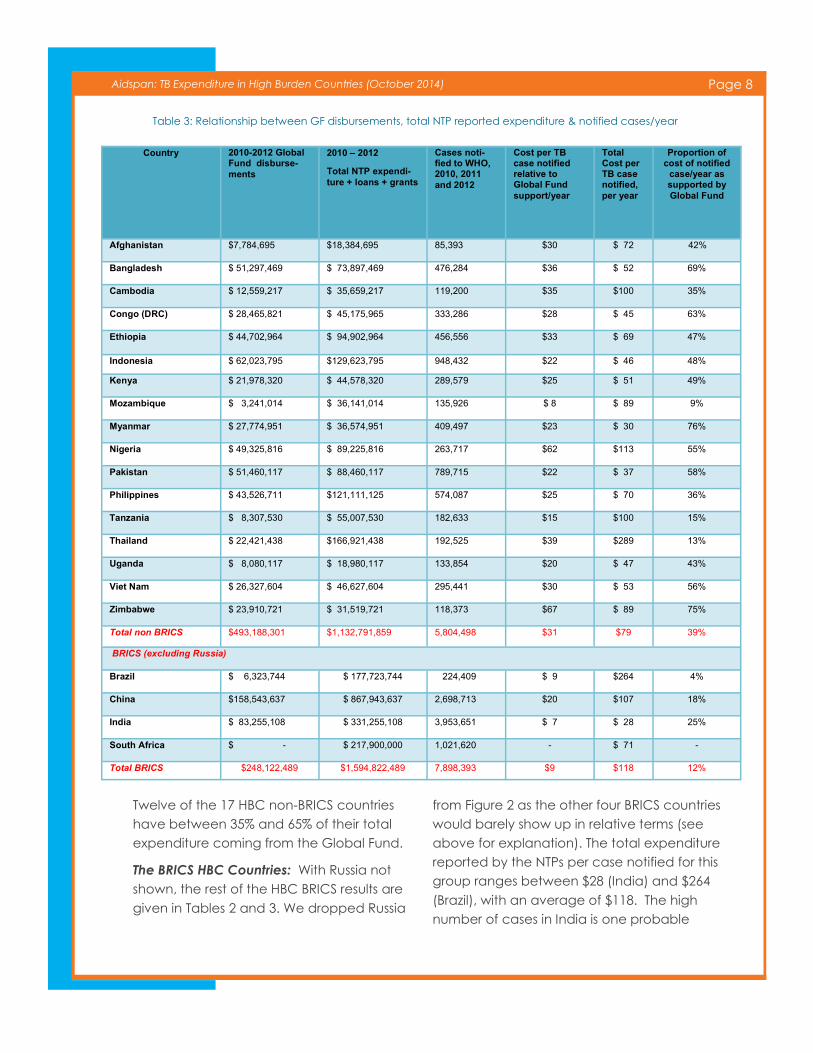
Twelve of the 17 HBC non-BRICS countries
have between 35% and 65% of their total
expenditure coming from the Global Fund.
The BRICS HBC Countries: With Russia not
shown, the rest of the HBC BRICS results are
given in Tables 2 and 3. We dropped Russia
from Figure 2 as the other four BRICS countries
would barely show up in relative terms (see
above for explanation). The total expenditure
reported by the NTPs per case notified for this
group ranges between $28 (India) and $264
(Brazil), with an average of $118. The high
number of cases in India is one probable
Table 3: Relationship between GF disbursements, total NTP reported expenditure & notified cases/year
Country 2010-2012 Global Fund disburse-
ments
2010 – 2012 Total NTP expendi-
ture + loans + grants
Cases noti-fied to WHO, 2010, 2011
and 2012
Cost per TB case notified relative to Global Fund
support/year
Total Cost per TB case notified,
per year
Proportion of cost of notified
case/year as supported by
Global Fund
Afghanistan $7,784,695 $18,384,695 85,393 $30 $ 72 42%
Bangladesh $ 51,297,469 $ 73,897,469 476,284 $36 $ 52 69%
Cambodia $ 12,559,217 $ 35,659,217 119,200 $35 $100 35%
Congo (DRC) $ 28,465,821 $ 45,175,965 333,286 $28 $ 45 63%
Ethiopia $ 44,702,964 $ 94,902,964 456,556 $33 $ 69 47%
Indonesia $ 62,023,795 $129,623,795 948,432 $22 $ 46 48%
Kenya $ 21,978,320 $ 44,578,320 289,579 $25 $ 51 49%
Mozambique $ 3,241,014 $ 36,141,014 135,926 $ 8 $ 89 9%
Myanmar $ 27,774,951 $ 36,574,951 409,497 $23 $ 30 76%
Nigeria $ 49,325,816 $ 89,225,816 263,717 $62 $113 55%
Pakistan $ 51,460,117 $ 88,460,117 789,715 $22 $ 37 58%
Philippines $ 43,526,711 $121,111,125 574,087 $25 $ 70 36%
Tanzania $ 8,307,530 $ 55,007,530 182,633 $15 $100 15%
Thailand $ 22,421,438 $166,921,438 192,525 $39 $289 13%
Uganda $ 8,080,117 $ 18,980,117 133,854 $20 $ 47 43%
Viet Nam $ 26,327,604 $ 46,627,604 295,441 $30 $ 53 56%
Zimbabwe $ 23,910,721 $ 31,519,721 118,373 $67 $ 89 75%
Total non BRICS $493,188,301 $1,132,791,859 5,804,498 $31 $79 39%
BRICS (excluding Russia)
Brazil $ 6,323,744 $ 177,723,744 224,409 $ 9 $264 4%
China $158,543,637 $ 867,943,637 2,698,713 $20 $107 18%
India $ 83,255,108 $ 331,255,108 3,953,651 $ 7 $ 28 25%
South Africa $ - $ 217,900,000 1,021,620 - $ 71 -
Total BRICS $248,122,489 $1,594,822,489 7,898,393 $9 $118 12%
Page 9 Aidspan: TB Expenditure in High Burden Countries (October 2014)
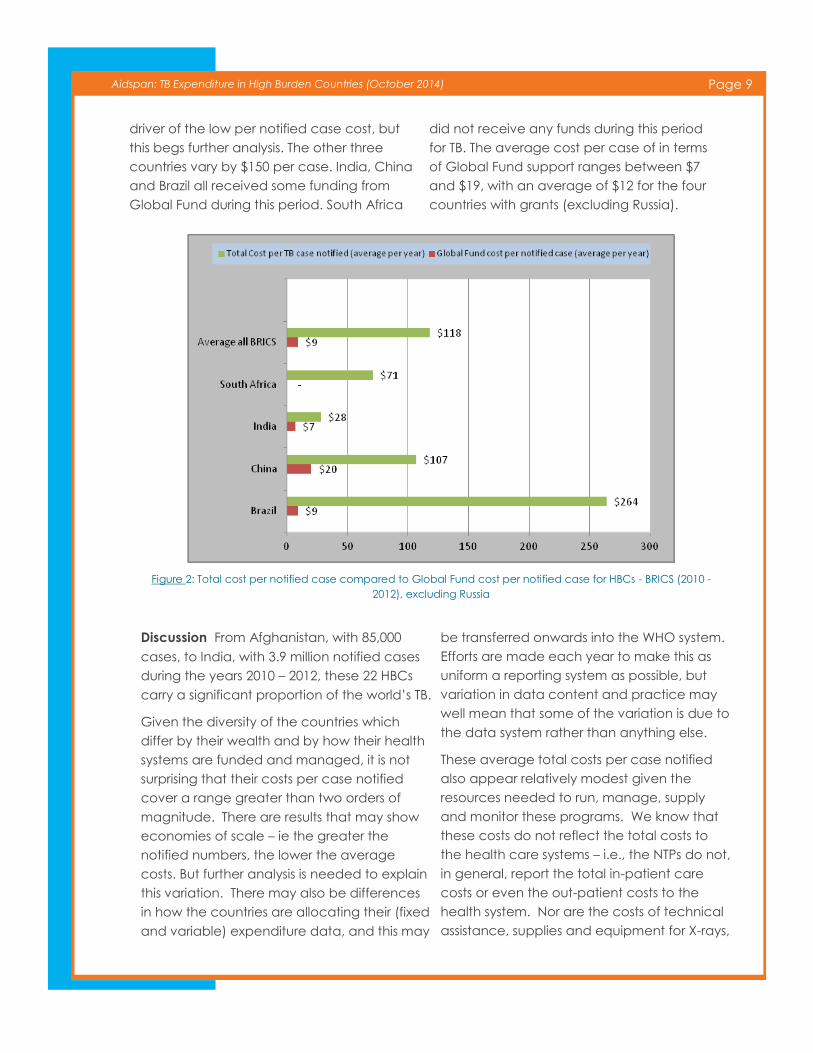
driver of the low per notified case cost, but
this begs further analysis. The other three
countries vary by $150 per case. India, China
and Brazil all received some funding from
Global Fund during this period. South Africa
did not receive any funds during this period
for TB. The average cost per case of in terms
of Global Fund support ranges between $7
and $19, with an average of $12 for the four
countries with grants (excluding Russia).
Figure 2: Total cost per notified case compared to Global Fund cost per notified case for HBCs - BRICS (2010 -
2012), excluding Russia
Discussion From Afghanistan, with 85,000
cases, to India, with 3.9 million notified cases
during the years 2010 – 2012, these 22 HBCs
carry a significant proportion of the world’s TB.
Given the diversity of the countries which
differ by their wealth and by how their health
systems are funded and managed, it is not
surprising that their costs per case notified
cover a range greater than two orders of
magnitude. There are results that may show
economies of scale – ie the greater the
notified numbers, the lower the average
costs. But further analysis is needed to explain
this variation. There may also be differences
in how the countries are allocating their (fixed
and variable) expenditure data, and this may
be transferred onwards into the WHO system.
Efforts are made each year to make this as
uniform a reporting system as possible, but
variation in data content and practice may
well mean that some of the variation is due to
the data system rather than anything else.
These average total costs per case notified
also appear relatively modest given the
resources needed to run, manage, supply
and monitor these programs. We know that
these costs do not reflect the total costs to
the health care systems – i.e., the NTPs do not,
in general, report the total in-patient care
costs or even the out-patient costs to the
health system. Nor are the costs of technical
assistance, supplies and equipment for X-rays,
Page 10 Aidspan: TB Expenditure in High Burden Countries (October 2014)
budget for high-risk groups, infection control
and childhood TB reported by most countries.
Finally, this basic estimate of costs does not
take into account household or indirect costs
as borne by patients and their families.
But we also know that the notified cases are
not the whole burden of TB. In 2012, there
were an estimated further 3 million cases
globally that were not reported for several
reasons: they died before being diagnosed,
they are lost to follow up, they are
misdiagnosed or they are treated outside of
the NTP and data not captured by the
progamme.
In this basic expenditure estimation, where we
use total cost in the numerator and patients
presenting for treatment in the denominator,
we believe that there should be higher
numbers on both sides of the equation, but
probably much higher numbers in the
numerator (the cost component) relative to
the cases missed. Overall, we believe that
these results may indicate an under-
estimation of the average cost per TB case
notified that these countries bear.
The proportion that the Global Fund is
contributing to these NTPs, particularly in the
17 non-BRICS countries, is large. But one of the
limitations of our study is that we have
assumed that the total disbursements from
the Global Fund are largely “spent” by the
NTPs either as PRs or as SRs who eventually
receive the funding. Some PRs are CSOs who
both receive and spend funds on TB, and
while this is not a large figure, it is worth noting
that we have probably overestimated the
Global Fund proportion.
On average, therefore, approximately a third
to a half of the costs of the NTPs’ programs
are the responsibility of a single agency – the
Global Fund. From the perspective of a
planner or policymaker, this is a high-risk
scenario. The finance flows have been
disrupted and delayed for many reasons and
in many countries over the past few years. In
several instances, the Global Drug Facility has
had to step in, and purchase medicines to
prevent major disruptions to programmes.
Should anything happen to the Global Fund,
TB programs in these high burdened countries
would be at risk of collapse, or they would
become a significant drain on domestic
budgets.
In several of the HBCs, the amounts allocated
to TB by the Global Fund under its new
funding model (NFM) increased. Of the $14.8
billion allocated to the 16 eligible HBCs,
excluding Brazil, China and Russia, $1.3 billion
was allocated to TB for the period 2014-2017.
If there is no significant change in the
notification rates of disease among the 19
eligible HBCs over the next Global Fund
allocation period, they will be responsible for
diagnosing, treating and caring for
approximately 10 million cases in the next
three years. Global Fund support per case will
hover around a $43 per case per year. This is
a relatively small increase from the period of
analysis of this paper. If one compares the
non BRICS average cost for 2010 – 2012 of $31
per case then this is an increase of $12 per
case for the period 2014 – 2017: or an
average of 38% increase.
Recommendations Will this increase in
funding bring down the numbers infected by
TB in the short- or even medium-term? It is
beyond the scope of this paper to analyze
the trends of TB disease in these countries, but
while some programmes appear to have
slowed their epidemics, many are still
experiencing stubbornly high disease rates.
What these results suggest is that at many
areas of the TB support system, both domestic
and foreign, more resources in total may be
needed to bring these epidemics under
Page 11 Aidspan: TB Expenditure in High Burden Countries (October 2014)
control.
At global and national levels: The data
used in this report are available, free and
public. It is somewhat surprising that these
data are not better used and better
publicized. They should be.
At national levels: Many others have said
this, but alternative sources of money to
the Global Fund may be needed for two
reasons. They could be necessary as
alternate to the Fund, should the Global
Fund not be able to raise the resources in
the next replenishment cycle. But other
sources may also be needed now to
supplement / fully fund the national
programs.
Given the size of Fund’s role in financing
of these TB programs, one might expect
the Fund to have a bit more leverage with
other players and stakeholders.
References
Aidspan – grant portfolio pages for Global Fund data for
grant portfolio data on Tuberculosis – June 2014 http://
www.aidspan.org/page/global-fund-overview
Barter DM, Agboola SO, Murray MB, Bärnighausen T. ,
2012, Tuberculosis and poverty: the contribution of
patient costs in sub-Saharan Africa--a systematic review.
BMC Public Health. 2012 Nov 14;12:980.
Floyd, K, C Fitzpatrick , A Pantoja, M Raviglione, 2013,
Domestic and donor financing for tuberculosis care and
control in low-income and middle-income countries: an
analysis of trends, 2002—11, and requirements to meet
2015 targets, Lancet, Vol 1, Issue 2, pp e105 - e115,
Floyd K, Blanc L, Raviglione M, Lee JW. Resources
required for global TB control. Science 2002; 295: 2040-
2041.
Floyd K, Pantoja A, Dye C. Financing tuberculosis
control: the role of a global financial monitoring system.
Bull World Health Organ 2007; 85: 334-340.
Fitzpatrick C, Floyd K. A systematic review of the cost
and cost-effectiveness of treatment for multi-drug
resistant tuberculosis. Pharmacoeconomics 2012; 30: 63-
80.
Glassman A and V Fan, Does the Money match the
message: current practice in allocation of aid for TB and
implications for the US Government, Working paper Feb
2014, Center for Global Development, Washington DC.
WHO. Planning and budgeting for TB control activities.
www.who.int/tb/dots/planning_budgeting_tool/
(accessed May 1, 2014).
Revised National TB Control Programme (RNTCP), India,
Summary of national programme, 2003 – 2009 http://
www.tbcindia.nic.in/rntcp.html , accessed 18.06.14.
Tanimura T, Jaramillo E1, Weil D, Raviglione M, Lönnroth
K. 2014, Financial burden for tuberculosis patients in low-
and middle-income countries: a systematic review. Eur
Respir J. 2014 Jun;43(6):1763-74.
The London TB Plan, 2012, a case for change and
model of care, http://www.londonhp.nhs.uk/services/
tuberculosis/ accessed 18.06.14.
Ukwaja KN, Modebe O, Igwenyi C, Alobu I, 2012, The
economic burden of tuberculosis care for patients and
households in Africa: a systematic review. Int J Tuberc
Lung Dis. 2012 Jun;16(6):733-9.
United States Government (USG): Congressional Budget
Justification and Reports, 2010, 2011 and 2012,
Washington DC. USA.
Vassall A, M Remme, 2013, Financing TB control:
promising trends and remaining challenges, comment,
Lancet Global Health, vol 1, e62-63
2014: WHO TB data collection form and variables v1.0
2014-05-13
WHO. Global tuberculosis control 2012. Geneva: World
Health Organization, 2013
WHO. Global tuberculosis control 2011. Geneva: World
Health Organization, 2012
WHO. Global tuberculosis control 2010. Geneva: World
Health Organization, 2011
Page 12 Aidspan: TB Expenditure in High Burden Countries (October 2014)
Appendix A
Table 4: Spending by the United States Government as recorded through the congressional reports
UNITED-STATES GOVERNMENT AMOUNTS Non-BRICS
Country 2010 2011 2012 Total for Non-BRICs per Country All Yrs
Afghanistan $ 4,986,000 $ 6,500,000 $ 6,302,000 $ 17,788,000
Bangladesh $ 4,400,000 $ 10,000,000 $ 11,000,000 $ 25,400,000
Cambodia $ 3,860,000 $ 5,000,000 $ 5,000,000 $ 13,860,000
Congo, Dem. Rep. $ 4,770,000 $ 10,000,000 $ 12,100,000 $ 26,870,000
Ethiopia $ 4,000,000 $ 10,000,000 $ 12,000,000 $ 26,000,000
Indonesia $ 7,080,000 $ 13,700,000 $ 16,600,000 $ 37,380,000
Kenya $ 3,150,000 $ 4,000,000 $ 7,000,000 $ 14,150,000
Mozambique $ 4,250,000 $ 5,000,000 $ 6,000,000 $ 15,250,000
Myanmar $ -
Nigeria $ 5,800,000 $ 10,100,000 $ 12,000,000 $ 27,900,000
Pakistan $ 8,970,000 $ 14,000,000 $ - $ 22,970,000
Philippines $ 6,900,000 $ 10,000,000 $ 12,000,000 $ 28,900,000
Thailand $ -
Uganda $ 3,500,000 $ 4,000,000 $ 6,000,000 $ 13,500,000
Tanzania $ 3,700,000 $ 4,000,000 $ 6,000,000 $ 13,700,000
Vietnam $ -
Zimbabwe $ 2,000,000 $ 3,000,000 $ 5,000,000 $ 10,000,000
Total Non-BRICS $ 67,366,000 $109,300,000 $117,002,000 $293,668,000 BRICS
Country 2010 2011 2012 Total for BRICs per Country All Yrs
Brazil $ 3,700,000 $ 5,000,000 $ - $ 8,700,000
China $ -
Russian Federation $ 7,500,000 $ 9,804,000 $ 11,000,000 $ 28,304,000
India $ 11,000,000 $ 13,700,000 $ 15,000,000 $ 39,700,000
South Africa $ 8,500,000 $ 13,000,000 $ 15,000,000 $ 36,500,000
Total for BRICS $ 30,700,000 $ 41,504,000 $ 41,000,000 $113,204,000
Total HBC Amount $ 98,066,000 $ 150,804,000 $158,002,000 $406,872,000
Page 13 Aidspan: TB Expenditure in High Burden Countries (October 2014)
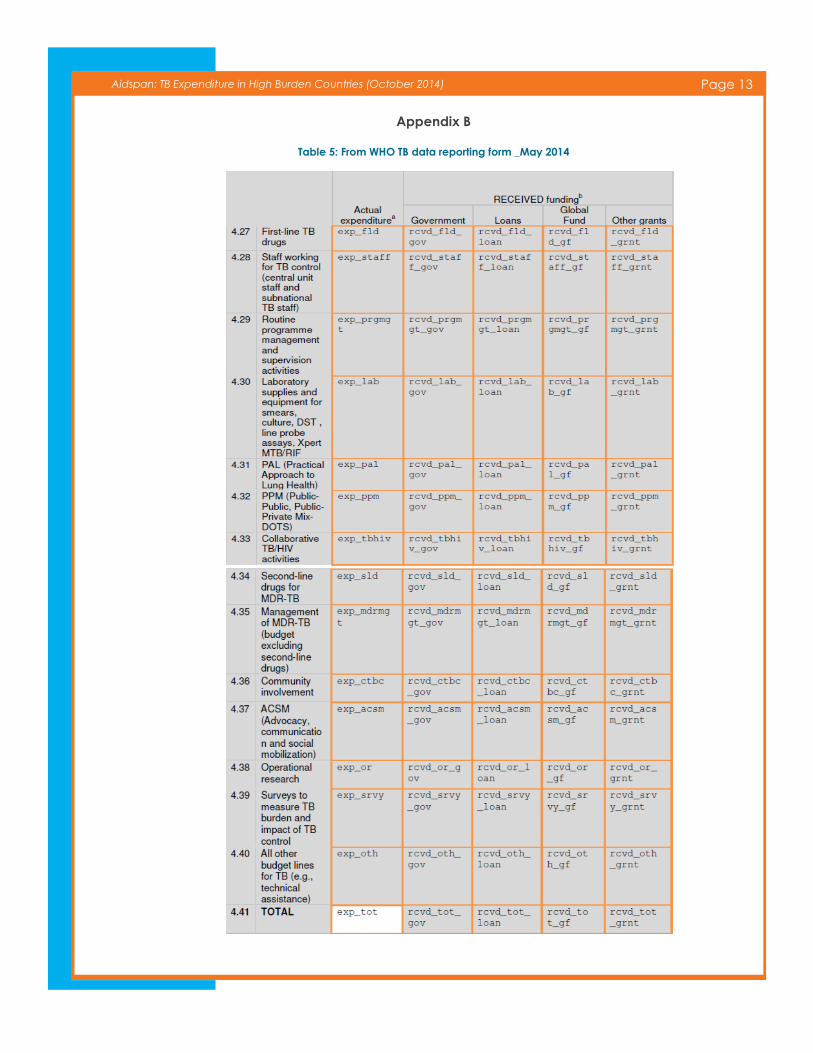
Appendix B
Table 5: From WHO TB data reporting form _May 2014
Page 14 Aidspan: TB Expenditure in High Burden Countries (October 2014)
Aidspan (www.aidspan.org) is an international NGO based in Nairobi, Kenya, whose mission is to reinforce the ef-
fectiveness of the Global Fund. Aidspan performs this mission by serving as an independent watchdog of the Fund,
and by providing services that can benefit all countries wishing to obtain and make effective use of Global Fund
financing.
Aidspan also publishes news, analysis and commentary articles about the Global Fund in its Global Fund Observer
(GFO) newsletter and on GFO Live. To receive GFO Newsletter, send an email to receive-gfo-
[email protected]. The subject line and text area can be left blank. To see articles on GFO Live, go to
www.aidspan.org/page/gfo-live.
Aidspan finances its work primarily through grants from governments and foundations. Aidspan does not accept
funding of any kind from the Global Fund.
For more information contact Kate Macintyre at [email protected]
or Cleopatra Mugyenyi at [email protected]
Aidspan
P.O. Box 66869-00800, Nairobi, Kenya
Tel (+254) 744 135984
www.aidspan.org
Related Documents


![Case report Open Access Two-stage treatment of acetabular bone defect in tuberculosis ... · 2017-04-11 · tuberculosis infections has been reported worldwide [1]. In approximately](https://static.cupdf.com/doc/110x72/5fb4344be1654e11140edc24/case-report-open-access-two-stage-treatment-of-acetabular-bone-defect-in-tuberculosis.jpg)
