EXPEDITION REPORT Expedition dates: 4 – 16 October 2015 Report published: May 2016 Carnivores of the Cape Floral Kingdom: Surveying Cape leopards, caracals and other species in the fynbos mountains of South Africa Cover image © Craig Turner

Welcome message from author
This document is posted to help you gain knowledge. Please leave a comment to let me know what you think about it! Share it to your friends and learn new things together.
Transcript

EXPEDITION REPORTExpedition dates: 4 – 16 October 2015
Report published: May 2016
Carnivores of the Cape Floral Kingdom:Surveying Cape leopards, caracals andother species in the fynbos mountains
of South Africa
Cover image © Craig Turner

© Biosphere Expeditions, an international not-for-profit conservation organisation registered in England, Germany, France, Australia and the USAOfficially accredited member of the United Nations Environment Programme's Governing Council & Global Ministerial Environment ForumOfficially accredited member of the International Union for the Conservation of Nature
1
EXPEDITION REPORT
Carnivores of the Cape Floral Kingdom:Surveying Cape leopards, caracals and other species
in the fynbos mountains of South Africa
Expedition dates:4 – 16 October 2015
Report published:May 2016
Authors:Alan T. K. Lee
University of Cape Town
Craig TurnerBiosphere Expeditions &
Wychwood Environmental Ltd
Matthias Hammer (editor)Biosphere Expeditions

© Biosphere Expeditions, an international not-for-profit conservation organisation registered in England, Germany, France, Australia and the USAOfficially accredited member of the United Nations Environment Programme's Governing Council & Global Ministerial Environment ForumOfficially accredited member of the International Union for the Conservation of Nature
2
Abstract
The fynbos biome of South Africa is a biodiversity hotspot renowned for its very high plantspecies richness, endemic birds and the presence of the Cape mountain leopard(Panthera pardus). Biodiversity monitoring across a range of faunal taxa was conducted inmountain fynbos habitat in the context of determining prey availability for leopard, caracal(Caracal caracal) and African wildcat (Felis silvestris lybica). Studies were conducted, withthe help of international volunteers recruited by Biosphere Expeditions, at Blue Hill NatureReserve, a recently established protected area where land management changed fromagriculture to biodiversity conservation in 2009.
We examined prey availability at a spatial and temporal scale, using transects, Shermantraps and camera trap monitoring. Mammal density across all three measures suggestslow mammal abundance and thus food availability for the predators in the fynbosecosystem, which is known to have low carrying capacity.
Camera trap photos from fixed monitoring points were used to examine the recovery ofmedium to large mammal species at the study site. Trends were positive for most commonspecies (with the exception of African wildcat), with significant increases in standardisedcapture rate indices reported for caracal, greater kudu (Tragelaphus strepsiceros) andgrey rhebok (Pelea capreolus).
Transects to monitor wildlife also fed into a biome-wide survey to assess the status ofthe endangered Hottentot buttonquail (Turnix hottentottus), a bird endemic to the fynbos.
We also conducted the first bat survey undertaken at Blue Hill Nature Reserve usingAnabat Express recording devices and report the presence of five bat species.
Opsomming
Die fynbos bioom van Suid Afrika is wel bekend vir sy uitstekende biodiversiteit, met ngroot aantal plante sorte, inheemse voels, en ook die Kaapse Berg Luiperd (Pantherapardus). Ons het biodiversiteit monitering onderneem oor n groot verskeidenheid faunavanaf klein tot groot om te bepaal die beskikbaarheid van prooi vir luiperd, rooikat (Caracalcaracal) en wildekat (Felis silvestris lybica). Hierdie studier was deur BiosphereExpeditions onderneem, wie vrywillige werkers gevind het om die monitering op die BlueHill Natuur Reservaat en omgewings te implementeer. Blue Hill Natuur Reservaat is nnuwe beskermde gebied geïmplementeer in 2009 wat tevore n landbou gebied was.
Ons het prooi beskikbaarheid ondersoek op n ruimtelik en temporale skaal met gebruikvan transects, Sherman-traps en automatiese kameras. Die aantal soogdiere oor al drievan die statistieke was baie laag, wat beteken min beskikbaarheid van kos vir die roofdierein die fynbos sisteem, al hoewel daar alreeds kennis daarvan is.
Automaties kameras op konstante moniteering plekke was gebruik om te sien of daarherstel was van die aantal gemiddelde tot groot soogdiere nommers op Blue Hill. Oor diealgemeen (behalwe wildekat) was die aantal fotos meer oor tyd, wat aandei herstel van diewild. Daar was beduidende verhogings vir rooikat, kudu (Tragelaphus strepsiceros) envaal rhebok (Pelea capreolus).
Transects om wild oor die hele bioom te moniteer om die populasie van die bedreigde,inheemse Kaapse kwarteltjie (Turnix hottentotus) te ondervind was ook deur die expedisiegehelp. Die expedisie het ook die eerste vlermuis opmeeting onderneem met gebruik vanAnabat recording devices, wat vyf spesies gevind het.
© Biosphere Expeditions, an international not-for-profit conservation organisation registered in England, Germany, France, Australia and the USAOfficially accredited member of the United Nations Environment Programme's Governing Council & Global Ministerial Environment ForumOfficially accredited member of the International Union for the Conservation of Nature
3
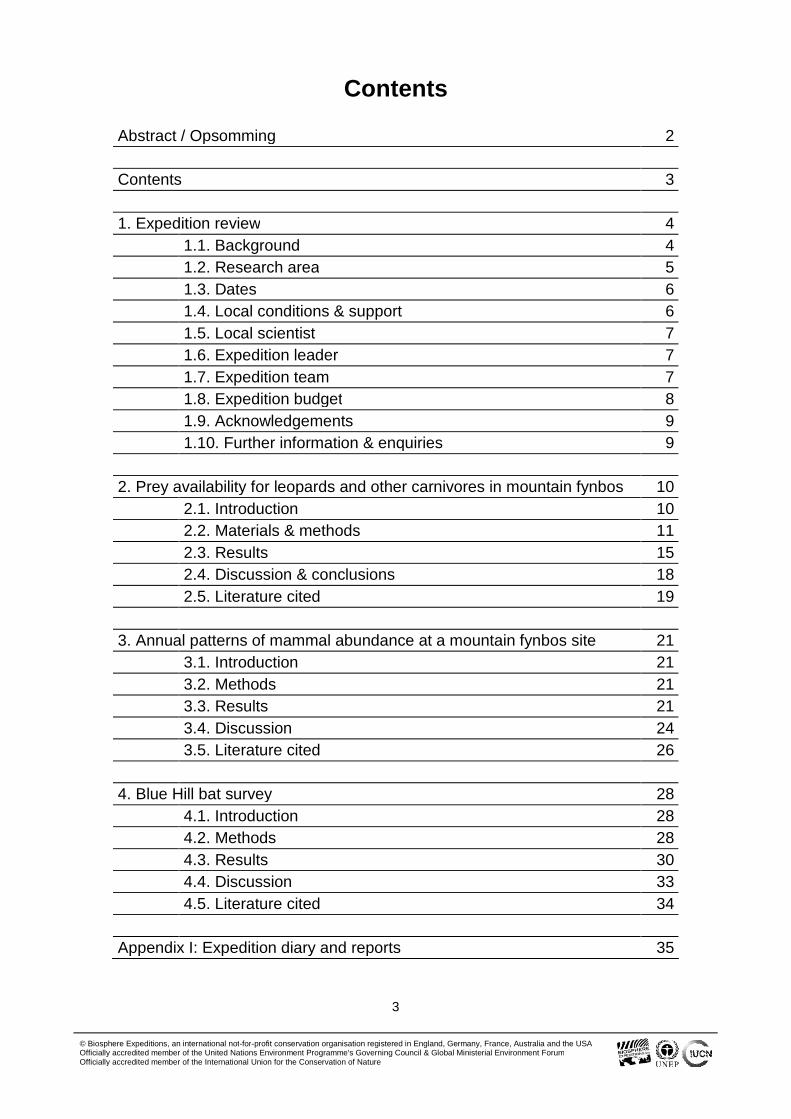
Contents
Abstract / Opsomming 2
Contents 3
1. Expedition review 4
1.1. Background 4
1.2. Research area 5
1.3. Dates 6
1.4. Local conditions & support 6
1.5. Local scientist 7
1.6. Expedition leader 7
1.7. Expedition team 7
1.8. Expedition budget 8
1.9. Acknowledgements 9
1.10. Further information & enquiries 9
2. Prey availability for leopards and other carnivores in mountain fynbos 10
2.1. Introduction 10
2.2. Materials & methods 11
2.3. Results 15
2.4. Discussion & conclusions 18
2.5. Literature cited 19
3. Annual patterns of mammal abundance at a mountain fynbos site 21
3.1. Introduction 21
3.2. Methods 21
3.3. Results 21
3.4. Discussion 24
3.5. Literature cited 26
4. Blue Hill bat survey 28
4.1. Introduction 28
4.2. Methods 28
4.3. Results 30
4.4. Discussion 33
4.5. Literature cited 34
Appendix I: Expedition diary and reports 35

© Biosphere Expeditions, an international not-for-profit conservation organisation registered in England, Germany, France, Australia and the USAOfficially accredited member of the United Nations Environment Programme's Governing Council & Global Ministerial Environment ForumOfficially accredited member of the International Union for the Conservation of Nature
4
1. Expedition review
M. Hammer (editor)Biosphere Expeditions
1.1. Background
Biosphere Expeditions runs wildlife conservation research expeditions to all corners of theEarth. Our projects are not tours, photographic safaris or excursions, but genuine researchexpeditions placing ordinary people with no research experience alongside scientists whoare at the forefront of conservation work. Our expeditions are open to all and there are nospecial skills (biological or otherwise) required to join. Our expedition team members arepeople from all walks of life, of all ages, looking for an adventure with a conscience and asense of purpose. More information about Biosphere Expeditions and its researchexpeditions can be found at www.biosphere-expeditions.org.
This report deals with an expedition to South Africa’s Cape Floral Kingdom that ran from 4to 16 October 2015 and focused on monitoring two of Africa’s iconic cats: the threatenedCape mountain leopard (Panthera pardus) and the caracal (Caracal caracal), in an effort tomitigate conflict with farmers and thereby contribute significantly to cat survival and theirconservation. Working in the unique biome of South Africa’s Cape Floral Kingdom (fynbos)– a UNESCO World Heritage Site and the world’s only biome contained within one country– the expedition also conducted a larger biodiversity survey, focusing on cat prey speciessuch as antelopes, as well as small mammals. The ultimate goal is to develop a remotemonitoring technique that will better inform landowners of the status of their prey wildlifeand predatory cats, identify potential conflict areas, and use the knowledge gained tomitigate conflicts. To this end the project’s overall aim is to develop camera trap andtransect monitoring techniques that will enable landowners to determine predator and preydensities on their land. The project also wants to contribute to the biodiversity monitoringof the area through the contribution to citizen science projects. To achieve all this, theexpedition monitored the density, abundance, spatial distribution, home range size andhabitat preferences of a known population of wildlife on a nature reserve using transectand camera trap techniques. It also monitored small mammal and cat prey species, suchas antelopes, by trapping, camera trapping and flush survey efforts.
Almost all of Africa is under some sort of human impact and the Cape Floral Kingdom(fynbos) is no exception. Much wildlife roams on understaffed, underfinanced, remote,mountainous nature reserves where monitoring is difficult; or on private farmland wherelandowners have mixed attitudes to perceived problem animals such as leopard, caracal,jackal, baboon and bushpig. The Cape mountain leopard is one of South Africa’s TOPS(Threatened Or Protected Species), which restricts legal hunting, but the laws are nearimpossible to enforce. There is a strong farmer lobby pushing for greater control of ‘pest’species and anecdotal evidence suggests control by legal and illegal methods iswidespread across the country.
Wherever humans and wildlife come together, conflicts tend to appear, and human–wildlifeconflict has been identified as one of the biggest threats to biodiversity worldwide. Soundscientific knowledge is key to mitigating this conflict and to making wise managementdecisions that balance the need of humans, wildlife and the environment. We believe thatknowledge is the key to conservation and the most effective way to mitigate human–wildlife conflict.

© Biosphere Expeditions, an international not-for-profit conservation organisation registered in England, Germany, France, Australia and the USAOfficially accredited member of the United Nations Environment Programme's Governing Council & Global Ministerial Environment ForumOfficially accredited member of the International Union for the Conservation of Nature
5
The Cape Floral Kingdom is one of the world’s biodiversity hotspots and as such is aUNESCO World Heritage Site. It is dominated by a fire-driven ecosystem – the fynbosbiome with unsurpassed botanical richness: 7,000 of 9,000 plant species that are foundhere are endemic. It is in the flower-filled Cape Fold Mountains of South Africa that theCape mountain leopard is found – a leopard half the size of the savannah leopards ofAfrica, but with home ranges twice the size. In 2008 the IUCN (International Union forConservation of Nature) classified leopards as Near Threatened, stating that they maysoon qualify for the Vulnerable status due to habitat loss and fragmentation. Indeed, theyare becoming increasingly rare outside protected areas.
1.2. Research area
At 1.2 million km2 South Africa is the world's 25th largest country. It is incredibly biodiverse,with habitats ranging from forest to savannah, grassland, thicket, karoo, desert and fynbos.South Africa is also very rich in wildlife, and is a favoured Big Five safari destination.
The core of the study site is the Blue Hill Nature Reserve, a 2,300 ha CapeNaturestewardship nature reserve with mountains ranging from 1,000 to just under 2,000 m andunder the care of the Lee Family Trust. CapeNature is the Western Cape provincialconservation department in charge of the network of nature reserves of the Western Cape.The property was purchased in 2009 by Chris Lee, a retired geologist who has beenawarded the Draper Memorial Award for contributions to South African geology. The landwas previously used for cattle ranching. It was incorporated into the local communityconservancy in 2010 and officially declared a nature reserve in 2013. The trust has anobligation to manage the land for biodiversity under a management plan administered byEastern Cape Parks and Tourism, the state organisation charged with managing theBaviaanskloof Mega Reserve.
Figure 1.2a. Flag and location of South Africaand study site.
An overview of Biosphere Expeditions’ researchsites, assembly points, base camp and office
locations is at Google Maps.

© Biosphere Expeditions, an international not-for-profit conservation organisation registered in England, Germany, France, Australia and the USAOfficially accredited member of the United Nations Environment Programme's Governing Council & Global Ministerial Environment ForumOfficially accredited member of the International Union for the Conservation of Nature
6
Blue Hill lies on the western side of the massive Baviaanskloof Mega Reserve and wildlifeis free to move between these protected areas. The Baviaanskloof area is one ofoutstanding natural beauty, owing to its spectacular landforms, a diverse array of plantsand a wide variety of animals. The area is also part of the Cape Floristic Region WorldHeritage Site as of 2004.
1.3. Dates
The project ran for one two-week slot, composed of a team of international researchassistants, scientists and an expedition leader. Slot dates were 4 – 16 October 2015.
Team members could join for multiple slots (within the periods specified). Dates werechosen to coincide with spring and the period associated with the mildest climate in termsof temperature extremes.
1.4. Local conditions & support
Expedition base
The expedition team was based at Blue Hill, a former farmstead in a remote part of themountains. Team members shared, on a twin bed basis, comfortable rooms with beds,linen and all modern amenities such as mains power, hot showers and WCs. There is alsoa communal building with a dining room and a lounge with sofas and a fireplace. All mealswere prepared for the team and special diets could be catered for by prior arrangement.
Weather
The weather during the expedition was mild to warm, with a cold front arriving on the lastfew days. The average daytime temperature was 19 ± 6ºC, while temperatures at nightaveraged 16 ± 5ºC. Rainfall recorded was 4.4 mm. Temperature data were taken from anon-site Davis Vantage-Vue weather station that recorded weather every 30 minutes duringthe month of October.
Field communications
There was a landline telephone for receiving calls and (slow) internet/email access atbase. Mobile phones were used for communication between teams and around the studysite. The expedition leader posted a diary with multimedia content on Wordpress andexcerpts of this were mirrored on Biosphere Expeditions’ social media sites such asFacebook and Google+.
Transport & vehicles
Team members made their own way to the assembly point in the city of George, WesternCape, in time. From there onwards and back to George, all transport (4WD vehicles andmountain bikes) was provided for the expedition team. Expedition participants were trainedin the use of the 4WD vehicles and thereafter drove them around the study site.

© Biosphere Expeditions, an international not-for-profit conservation organisation registered in England, Germany, France, Australia and the USAOfficially accredited member of the United Nations Environment Programme's Governing Council & Global Ministerial Environment ForumOfficially accredited member of the International Union for the Conservation of Nature
7
Medical support and incidents
The expedition leader was a trained first aider, and the expedition carried acomprehensive medical kit. South Africa’s healthcare system is of an excellent standardand the nearest doctor and public hospital are in Uniondale (45 km/45 minutes). Thenearest private clinic is in George (200 km/2 hours). Safety and emergency procedureswere in place, but did not have to be invoked as there were no serious medical or otherincidents.
1.5. Local scientist
Dr Alan Lee, the expedition’s field scientist, was born in Zimbabwe and educated in pre-and post-apartheid South Africa. He graduated from the University of Witwatersrand withan Honour’s Bachelor’s Degree in Botany and Zoology in 1996. While working andtravelling from London he obtained a Diploma in Computing in 2001. He then commenceda period of seven years in Peru, first working for a volunteer project investigating impactsof tourism on Amazonian wildlife, and then from 2005 to 2010 undertaking a Ph.D. on theparrots of the Peruvian Amazon. Biosphere Expeditions part-financed and contributed datato the Ph.D. resulting in three peer-reviewed publications. In 2011 Alan set up the Blue HillEscape guest establishment on the Blue Hill Nature Reserve with his wife, Anja, andparents Chris and Elaine Lee. In 2012 he was accepted as a postdoctoral research fellowat the Percy FitzPatrick Institute of African Ornithology at the University of Cape Town toundertake an assessment of the status of the endemic birds of the fynbos.
1.6. Expedition leader
Craig Turner was born in Oxford, England. He studied biology, ecology and environmentalmanagement at Southampton, Aberdeen and London universities. Soon after graduatingfrom his first degree, he left the UK for expedition life in Tanzania. Since then, he hascontinued to combine his interest in travel and passion for conservation, working with awide range of organisations on projects and expedition sites in the Americas, Africa, Asiaand the Pacific. He has managed expedition grant programmes for the Zoological Societyof London, been a frequent contributor to the ‘Explore’ conference held by the RoyalGeographical Society, and is an active member of the British Ecological Society ReviewCollege. Having visited and/or worked in more countries than years have passed, he isever keen to share his exploits, writing for several magazines, and is a publishedphotographer.
1.7. Expedition team
The expedition team was recruited by Biosphere Expeditions and consisted of a mixture ofall ages, nationalities and backgrounds. They were (in alphabetical order and with countryof residence): Martha Anderson (USA), Bill Caudwell (UK), David Glossop (UK), GeorgKeller (Switzerland), Christine Marklow (UK), Andrew (Prasadu) Porritt (UK), KhomotsoRammala* (South Africa).
*Placement kindly supported by the Friends of Biosphere Expeditions. The BiosphereExpeditions placement programme seeks to identify, train and encourage the nextgeneration of local conservationists.

© Biosphere Expeditions, an international not-for-profit conservation organisation registered in England, Germany, France, Australia and the USAOfficially accredited member of the United Nations Environment Programme's Governing Council & Global Ministerial Environment ForumOfficially accredited member of the International Union for the Conservation of Nature
8
1.8. Expedition budget
Each team member paid towards expedition costs a contribution of £1,790 per person pertwo-week slot. The contribution covered accommodation and meals, supervision andinduction, special research equipment and all transport from and to the team assemblypoint. It did not cover excess luggage charges, travel insurance, personal expenses suchas telephone bills, souvenirs etc., or visa and other travel expenses to and from theassembly point (e.g. international flights). Details on how this contribution was spent aregiven below.
Income £
Expedition contributions 11,825
Expenditure
Expedition baseincludes all board & lodging
1,412
Transportincludes transfers, car hire, fuel
1,870
Equipment and hardwareincludes research materials & gear etc. purchased in South Africa & elsewhere
3,876
Staffincludes local and Biosphere Expeditions staff salaries and travel expenses
4,992
Administrationincludes miscellaneous fees & sundries
540
Team recruitment South Africaas estimated % of annual PR costs for Biosphere Expeditions
4,186
Income – Expenditure -5,051
Total percentage spent directly on project 143%*
*This means that in 2015, the expedition ran at a loss and was supported over and above theincome from the expedition contributions by Biosphere Expeditions.

© Biosphere Expeditions, an international not-for-profit conservation organisation registered in England, Germany, France, Australia and the USAOfficially accredited member of the United Nations Environment Programme's Governing Council & Global Ministerial Environment ForumOfficially accredited member of the International Union for the Conservation of Nature
9
1.9. Acknowledgements
We are grateful to the volunteers, who not only dedicated their spare time to helping butalso, through their expedition contributions, funded the research. Thank you also to BoolSmuts and the staff of the Landmark Foundation, and to all those who provided assistanceand information. Biosphere Expeditions would also like to thank members of the Friends ofBiosphere Expeditions and donors for their sponsorship. Finally, thank you to Chris, Elaineand Anja Lee for being such excellent hosts and making us feel at home at the expeditionbase.
1.10. Further information & enquiries
More background information on Biosphere Expeditions in general and on this expeditionin particular including pictures, diary excerpts and a copy of this report can be found on theBiosphere Expeditions website www.biosphere-expeditions.org.
Enquires should be addressed to Biosphere Expeditions at the address given on thewebsite.

© Biosphere Expeditions, an international not-for-profit conservation organisation registered in England, Germany, France, Australia and the USAOfficially accredited member of the United Nations Environment Programme's Governing Council & Global Ministerial Environment ForumOfficially accredited member of the International Union for the Conservation of Nature
10
2. Prey availability for leopards andother carnivores in mountain fynbos
Alan Tristram Kenneth LeeUniversity of Cape Town
2.1. Introduction
The African leopard (Panthera pardus pardus) is a leopard subspecies occurring acrossmost of sub-Saharan Africa. In 2008, the IUCN classified leopards as Near Threatened,stating that they may soon qualify for the Vulnerable status due to habitat loss andfragmentation. They are becoming increasingly rare outside protected areas and leopardsin southernmost populations exist in the Eastern and Western Cape, South Africa, in afragmented population structure with lower than expected genetic diversity (McManus etal. 2015). The author believes leopard population may become isolated within a fewgenerations and management actions that increase habitat connectivity and reducehuman–carnivore conflict are needed.
The ecology and activity patterns of leopards have been studied intensively in savannahand forest habitats (e.g. Braczkowski et al., 2012, Balme et al., 2007, Balme et al., 2012),but little information is available from the rugged mountain areas of the Cape FoldMountains. These mountains are dominated by the fynbos habitat type of the CapeFloristic Region, a nutrient-poor and fire-driven ecosystem. Historical accounts indicatethat a high and diverse number of large (>20 kg) indigenous herbivores occurred here,especially in lowland areas (Boshoff and Kerley, 2001), but avoided nutrient-poorsandstone fynbos in favour of more nutrient-rich renosterveld (a term used for one of themajor plant communities and vegetation types of the Cape Floristic Region) (Radloff,2008). In association with these large herbivores, all the members of the large carnivoreguild including lion were found (Skead et al., 2011).
Now leopards are the only remaining top predator in the Western Cape and Eastern Cape(Martins and Martins, 2006). They play a critical role in ecosystem structure; for instance,control of other species such as the black-backed jackal (Canis mesomelas). Male Capemountain leopards average 35 kg (in stark contrast to savannah leopards, where males ofup to 90 kg have been recorded) and females average 21 kg, which is slightly more thanthe smallest leopard subspecies, the Arabian leopard (Panthera pardus nimr) at 17 kg.Male leopard home ranges from the Baviaanskloof, South Africa, have been recorded inexcess of 600 sq km and are amongst the largest known territories ever recorded(McManus, unpublished data). An estimate is that there are fewer than 1,000 Capemountain leopards in total (Martins and Martins, 2006).
Dietary studies suggest different dietary preferences depending on area, but favoured preyinclude klipspringer (Oreotragus oreotragus), dassie (rock hyrax, Procavia capensis),porcupine (Hystrix africaeaustralis) and mice for mountain leopards (Martins et al., 2011).By contrast, leopards from forested areas in this region eat more locally abundant preysuch as bushbuck (Tragelaphus scriptus), while very few baboons (Papio ursinus) areeaten as these group living animals can be very dangerous (Braczkowski et al., 2012b).Leopards do predate livestock, which can constitute a significant part of their diet forindividuals whose territory overlaps with agricultural areas, and this leads to conflict withlivestock farmers (Inskip and Zimmermann, 2009).

© Biosphere Expeditions, an international not-for-profit conservation organisation registered in England, Germany, France, Australia and the USAOfficially accredited member of the United Nations Environment Programme's Governing Council & Global Ministerial Environment ForumOfficially accredited member of the International Union for the Conservation of Nature
11
Due to the small size of the Cape mountain leopard, it is likely that there is a degree ofcompetition with the second largest feline in the area, the caracal (Caracal caracal). Amale caracal at 20 kg weighs nearly as much as a female leopard. The caracal isconsidered a generalist and very adaptable predator, recorded taking a diverse array ofprey items ranging from small birds and reptiles to antelope many times their own size(Avenant and Nel, 2002, Melville et al., 2004, Braczkowski et al., 2012a). They also appearto display a wider habitat tolerance than Cape mountain leopard, occurring from moistmountain fynbos to arid karoo habitats in the region. It is likely they are more tolerant ofhuman landscape modification and therefore cause much damage to small livestockacross South Africa (Thorn et al., 2012). They are therefore much despised amongst thelocal farming community and frequently the target of problem animal control measures.
In this first step of our broader study aim to describe predator diets in relation to availableprey items in order to identify dietary partitioning in a predator community, we aim todocument potential prey availability at a mountain fynbos site. We do this through cameratrapping for medium to large mammals, Sherman trapping for small mammals, and flushtransects for small to medium mammals, as well as game bird species.
2.2. Materials and methods
Study area
The fynbos biome (fynbos, also known as the Cape Floral Kingdom/Cape Floristic Region)comprises one of only six floral kingdoms in the world and is contained entirely within thepolitical boundaries of South Africa, where it is mostly restricted to the Western andEastern Cape provinces of the Cape Fold Belt. Owing to its exceptional plant speciesrichness and high level of endemism, as well as high levels of animal diversity andendemism, it is recognised as one of the world’s 25 biodiversity ‘hotspots’ (Myers et al.,2000). The biome takes its name from ‘fynbos’, the dominant vegetation type. The othertwo main vegetation types are ‘renosterveld’ and ‘strandveld’. Vegetation is dominated bythree characteristic families: Proteaceae, Ericaceae and Restionaceae. The regionexperiences significant winter rainfall, although summer rainfall can predominate in theeastern regions. The fynbos is a fire-driven ecosystem, with most plant species adapted toan intermittent fire regime (6–40 years). Conversion to agriculture, urbanisation and theinvasion of a variety of alien plant types pose major conservation threats to the area.
Transects were conducted across the biome, although we report on camera trapping andsmall mammal trapping from the Blue Hill Nature Reserve only here (BHNR; -33.56 to -33.62; 23.40 to 23.43E; Figure 2.1a). BHNR is situated on the western border of theBaviaanskloof Nature Reserve, Western Cape, South Africa. The greater BaviaanskloofNature Reserve encompasses a range of biomes including savannah, afromontane forest,thicket, fynbos, nama and succulent karoo. The 2,230 ha BHNR lies between 1,000 and1,530 m above sea level (m asl) in fynbos. The reserve falls into an aseasonal rainfallregion, with annual informal records from the closest town, Uniondale (40 km distant, 730m asl), for the 1965–1997 period 344 ± 102mm (Lee and Barnard, 2013). The propertythat forms the reserve was acquired by the Lee Family Trust in 2009 who initiated apartnership with CapeNature, the Western Cape provincial agency in charge of protectedareas, to convert the land to a stewardship nature reserve. This process was completed in2013 with the land now managed for biodiversity.

© Biosphere Expeditions, an international not-for-profit conservation organisation registered in England, Germany, France, Australia and the USAOfficially accredited member of the United Nations Environment Programme's Governing Council & Global Ministerial Environment ForumOfficially accredited member of the International Union for the Conservation of Nature
12
Prior to this, recent use of the land had been for agricultural purposes, mostly stockfarming of cattle and sheep. Rifle cartridges are frequently found even in remote areas,indicating widespread hunting activities. The area has been influenced by Europeanheritage settlers for approximately two to three hundred years, and native inhabitant rockart in cave shelters indicates Khoi-San presence prior to this, although the scope andscale of any settlement is unknown.
Figure 2.1a. Study area map, with fynbos biome (green), location of BHNR (blue circle)and sites where flush surveys were conducted (black circles).
Medium to large mammal relative abundance from camera traps
To quantify relative abundance of medium to large mammals at BHNR, we considered adatabase of photos from camera traps placed both randomly and at fixed point monitoringpositions across the reserve. In most cases, camera placement was non-random, withfixed point monitoring conducted at old gate positions along vehicle tracks. This is likely tobias results for species, such as leopards, which make frequent use of man-made tracks.We also did not correct for size, although size is known to influence probability of captureby remote cameras. Camera placement was typically low – from ground level to 50 cm –due to the expected dominance of small to medium mammals. Number of active cameratraps ranged from 4 to 10, depending on resources available. All cameras were set to takephotographs, and in some cases additional video footage was also recorded after theinitial photograph. All cameras were set with an inactive period of 30 seconds, i.e.minimum time between sequential photographs.

© Biosphere Expeditions, an international not-for-profit conservation organisation registered in England, Germany, France, Australia and the USAOfficially accredited member of the United Nations Environment Programme's Governing Council & Global Ministerial Environment ForumOfficially accredited member of the International Union for the Conservation of Nature
13
The first camera traps were placed on 11 May 2010, and we analysed data from 6,703photos taken over 3,455 trap nights (sum of nights when camera traps were active) until16 June 2016. Sampling was effectively conducted over 1,192 unique dates. BiosphereExpeditions team members in October 2016 entered much of the data (>3,000) aftertraining on mammal identification.
We present two indices of abundance:
1. Relative Abundance Index (RAI): total number of individuals observed in allphotographs/trap nights. This index will be ranked higher for species in larger groups(more individuals and photos per time interval, e.g. baboons).
2. Occupancy Rate Index (ORI): sum of unique capture dates/sampling period (1,192).This is a broader index that simply records the presence or absence of a species and islikely to be higher for more mobile or widespread species (leopard, aardvark) and lessinfluenced by local group size.
We tested the correlation between these metrics at the species level using Spearman’sranked correlation coefficients in R (R Core Team, 2015).
Small mammal abundance from Sherman traps
In order to sample small mammal abundance, we created two Sherman trapping arrays atBHNR based on guidelines from Manley et al. (2006, Chapter 5: Small MammalMonitoring). Fifty Sherman LFA folding traps (3 x 3.5 x 9" or 7.62 x 8.89 x 22.86 cm) wereplaced along four routes (two routes in each array with 25 traps each spaced at approx. 25metre intervals), with sampling on the first array over three nights, and then moved to thesecond array for a further three nights. Arrays were positioned along an altitudinalgradient, on north- and south-facing slopes in fynbos approximately 16 years since the lastfire. Traps were baited with peanut butter and a commercial mixed bird food. Traps wereplaced in sheltered locations near rocks or under bushes and checked twice a day.Trapped animals were photographed if necessary for identification, weighed and thenreleased. Sampling was conducted from 8 October 2015 to 14 October 2015.
Due to low species diversity, we pooled all captures to examine the influence of aspectand altitude. We used binomial logistic modelling for capture vs non-capture from eachtrap check, keeping the individual trap location as a random effect. For modelling we usedthe lme4 package (Bates et al., 2013) and obtained p values using the lmerTest package(Kuznetsova et al., 2013) in R. We also used logistic regression to test for differences incapture rates between arrays and between morning and afternoon trap checks.
Terrestrial bird and mammal abundance from flush surveys
In order to determine encounter rates and densities of potential prey items, we conducted‘flush’ surveys at BHNR and further sites across the fynbos biome. A flush survey is amultiple observer survey with observers spaced ideally at 5-metre intervals. The length ofthe survey line is noted, and area calculated as the number of observers x 5 (for sphere ofinfluence) x length. We recorded all encounters with a target set of terrestrial birds andmammals of adult size >2 kg.

© Biosphere Expeditions, an international not-for-profit conservation organisation registered in England, Germany, France, Australia and the USAOfficially accredited member of the United Nations Environment Programme's Governing Council & Global Ministerial Environment ForumOfficially accredited member of the International Union for the Conservation of Nature
14
We present an index of relative abundance as total number of individuals observed perkilometre with mean and standard deviation presented as the sum of all individualsobserved per kilometre of transect walked, using each transect as the sampling unit. Wealso calculate density (individuals/ha) as the subset of all individuals observed within thetransect line. Angle and distance were also recorded to groups outside the line of thetransect for considered use of distance-sampling techniques (Buckland et al., 2005).However, we did not receive the minimum number of group encounters with thisinformation (20) for any of our target species to use this technique for the sample periodpresented here (October 2015 – February 2016).
It is important to note that our surveys were centred around attempts to document thepresence and local density of the endangered and endemic Hottentot buttonquail (Turnixhottentottus). Survey routes were placed to optimise encounter rates with this species andhence transect placement does not follow a truly randomised design to allow unbiasedestimates for all the species recorded. Transects were preferentially aligned throughhabitat with gentle slopes and in younger fynbos (time since last fire). The estimates thusonly describe encounter rates and density estimates for fynbos fitting the following slopeand fire descriptions (Fig. 2.2).
Figure 2.2. Histograms of mean time since fire (left) and slope (right) for 96 transects conducted across the fynbosbiome indicating sampling bias towards young veld (<10 years since fire) and gentle terrain (<10 degree slope).

© Biosphere Expeditions, an international not-for-profit conservation organisation registered in England, Germany, France, Australia and the USAOfficially accredited member of the United Nations Environment Programme's Governing Council & Global Ministerial Environment ForumOfficially accredited member of the International Union for the Conservation of Nature
15
2.3. Results
Medium to large mammal relative abundance from camera traps
We recorded at least 27 different species of mammal from camera trap photos at BHNR(Table 2.3a), ranging in size from the greater kudu to an unidentified rodent species.Baboons were the most numerous (RAI = 61%), while a variety of species were recordedonly once, including Cape genet, vervet monkey and black-backed jackal. Baboons wereonly third on the Occupancy Rate Index (ORI = 21%), with common duiker the highest(49%), followed by Cape grysbok (ORI = 39%). Humans were frequently recorded oncamera (ORI = 19%), as were vehicles (ORI = 21%). By contrast, leopard and caracal bothhad ORI = 4%, twice that of African wildcat at 2%. In other words, on any given night therewas a 4% chance that a leopard or caracal would be recorded by the camera trapsdeployed at BHNR.
Table 2.3a. Medium to large mammals recorded by camera traps at BHNR for the 2010–2015 period. n = total number ofindividuals in photos; RAI = Relative Abundance Index (n/3517); Freq = number of days a species was recorded; ORI =Occupancy Rate Index (Freq/1192); mean and SD are mean and standard deviation of the number of individualsrecorded in each photo (group size).
Species n RAI Freq ORI Mean SD
Chacma baboon Papio ursinus 2142 0.61 250 0.21 1.56 1.09
Common duiker Sylvicapra grimmia 1118 0.32 582 0.49 1.01 0.12
Cape grysbok Raphicerus melanotis 894 0.25 460 0.39 1.03 0.16
Grey rhebok Pelea capreolus 319 0.09 160 0.13 1.12 0.41
Greater kudu Tragelaphus strepsiceros 225 0.06 101 0.08 1.07 0.38
Aardvark Orycteropus afer 133 0.04 116 0.1 1.01 0.09
Rock hyrax Procavia capensis 101 0.03 19 0.02 1.06 0.24
Honey badger Mellivora capensis 73 0.02 47 0.04 1.11 0.31
Cape porcupine Hystrix africaeaustralis 72 0.02 48 0.04 1.11 0.31
Leopard Panthera pardus 66 0.02 53 0.04 1.03 0.18
Caracal Caracal caracal 64 0.02 47 0.04 1.02 0.13
Bushpig Potamochoerus larvatus 61 0.02 34 0.03 1.05 0.29
Klipspringer Oreotragus oreotragus 54 0.02 30 0.03 1 0
Hare Lepus sp. 42 0.01 31 0.03 1 0
Gemsbok Oryx gazella 33 0.01 28 0.02 1 0
Grey mongoose Galerella pulverulenta 29 0.01 18 0.02 1 0
African wildcat Felis silvestris lybica 26 0.01 24 0.02 1 0
Water mongoose Atilax paludinosus 11 0 8 0.01 1 0
Meerkat Suricata suricatta 7 0 6 0.01 1 0
Mountain reedbuck Redunca fulvorufula 4 0 4 0 1 0
Aardwolf Proteles cristata 3 0 3 0 1 0
Cape clawless otter Aonyx capensis 2 0 2 0 1 0
Cape genet Genetta tigrina 1 0 1 0 1 NA
Jackal Canis mesomelas 1 0 1 0 1 NA
Mouse (unidentified) 1 0 1 0 1 NA
Red-tailed rock rabbit Pronolagus sp. 1 0 1 0 1 NA
Vervet monkey Chlorocebus pygerythrus 1 0 1 0 1 NA

© Biosphere Expeditions, an international not-for-profit conservation organisation registered in England, Germany, France, Australia and the USAOfficially accredited member of the United Nations Environment Programme's Governing Council & Global Ministerial Environment ForumOfficially accredited member of the International Union for the Conservation of Nature
16
In addition, a variety of other species or taxa were included, including domestic cat, dog,sheep and cow from neighbouring properties, as well as leopard tortoise (Stigmochelyspardalis), the only reptile. Twenty species of bird were identified ranging in size from thelarge black-headed heron (Ardea melanocephala) to the much smaller Cape weaver(Ploceus capensis). Medium-sized game birds including Cape spurfowl (Pternistiscapensis), red-necked spurfowl (Francolinus afer) and grey-winged francolin (Francolinusafricanus) were most common. Elevent percent of photographs were classified as blank,with no animals present, while 3% could not be identified to a useful taxonomic group.
As expected, baboons appeared to have the largest group sizes in terms of numbers ofindividuals per photo frame, although the mean of 1.5 ± 1 is by no means a realistic metricof actual group size since it would be practically impossible to capture an entire group inone photo frame.
Small mammal abundance from Sherman traps
Capture success along the Sherman trap arrays was low: 4% (21 captures of 500 checks),with at least one confirmed recapture and one suspected recapture. Identifiable specieswere: striped field mouse Rhabdomys pumilio (n = 3); Cape elephant shrew Elephantulusedwardii (2); Namaqua rock mouse Aethomys namaquensis (6); and African pygmy mouseMus minutoides (1). There was uncertainty regarding the identification for nine individuals,which most closely resembled Namaqua rock mouse, but differed in weight perhaps due toage (Table 2.3b).
Table 2.3b. Rodent species capture totals from Sherman traps, together with mean and standard deviation (SD) ofmass.
Species n Mean mass (g) SD
Striped field mouse Rhabdomys pumilio 3 32.7 20.4
Cape elephant shrew Elephantulus edwardii 2 61.4 1.5
Namaqua rock mouse Aethomys namaquensis 6 55.8 5.0
African pygmy mouse Mus minutoides 1 21.1 NA
Unidentified 9 41.3 15.9
Capture rates were significantly higher during morning trap checks (z = -3.4, p < 0.01),suggesting strong nocturnal behaviour among this community of small mammals. Neitheraltitude nor aspect were significant predictors in a model of capture probability (Table2.3c). No other small mammals or other taxa were captured. There was no differencebetween the two array locations (z = -0.87, p = 0.38).
Table 2.3c. Model results of probability of capture in Sherman traps as a function of altitude and aspect (N or S).
Estimate SE z value Pr(>|z|)
(Intercept) 3.364 4.516 0.745 0.456
Altitude -0.006 0.004 -1.399 0.162
Aspect S -0.258 0.452 -0.570 0.569

© Biosphere Expeditions, an international not-for-profit conservation organisation registered in England, Germany, France, Australia and the USAOfficially accredited member of the United Nations Environment Programme's Governing Council & Global Ministerial Environment ForumOfficially accredited member of the International Union for the Conservation of Nature
17
Terrestrial bird and mammal abundance from flush surveys
The 96 flush surveys conducted to date were conducted over 214 km covering a combined sample area of 565 ha. While nominally animpressive effort, only nine species of mammal were recorded (Table 2.3d), compared to the 28 for camera trap surveys (see above). Wealso recorded information for nine target bird species. While clapper lark was most frequently encountered, biomass per hectare washighest for the mammal species baboon (1 kg/ha), grey rhebok (0.33 kg/ha) and duiker (0.29 kg/ha).
Table 2.3d. Encounter rates (ind/km), densities (ind/ha) and resulting biomass/ha (mean of density x mass) for terrestrial birds and mammals in young fynbos of gentle terrain.Results are from 96 surveys from across the fynbos biome. Mass is the average of mass ranges identified from a variety of internet resources.
Ind/km Ind/haSpecies
Mass(kg)
Individuals GroupsMean
SDMean
SDBiomass/
ha
Clapper lark Mirafra apiata 0.04 60 49 0.344 0.832 0.074 0.232 0.0030
Grey-winged francolin Francolinus africanus 1.5 36 10 0.144 0.575 0.037 0.211 0.0555
Hottentot buttonquail Turnix hottentottus 0.03 34 28 0.159 0.634 0.034 0.137 0.0010
Baboon Papio ursinus 30 49 5 0.265 1.488 0.033 0.327 0.9900
Cape spurfowl Pternistis capensis 1.35 35 10 0.125 0.726 0.03 0.257 0.0405
Long-billed pipit Anthus similis 0.03 17 16 0.078 0.309 0.024 0.092 0.0007
Common quail Coturnix coturnix 0.5 25 21 0.084 0.275 0.021 0.077 0.0105
Common duiker Sylvicapra grimmia 18 9 9 0.064 0.303 0.016 0.128 0.2880
Grey rhebok Pelea capreolus 25 14 5 0.052 0.393 0.013 0.11 0.3250
Cape rockjumper Chaetops frenatus 0.05 31 26 0.123 0.435 0.011 0.068 0.0006
Red-tailed rock rabbit Pronolagus sp. 2 8 8 0.019 0.111 0.007 0.041 0.0140
Cape Grysbok Raphicerus melanotis 10 4 4 0.016 0.081 0.003 0.017 0.0300
Steenbok Raphicerus campestris 11 5 4 0.025 0.125 0.002 0.018 0.0220
Unknown francolin 0.6 3 3 0.016 0.117 0.002 0.014 0.0012
Red-necked spurfowl Francolinus afer 0.6 1 1 0.002 0.015 0.001 0.005 0.0006
Dassie rock hyrax, Procavia capensis 4 4 2 0.024 0.164 0 0 0.0000
Klipspringer Oreotragus oreotragus 12 7 5 0.028 0.135 0 0 0.0000
Mountain reedbuck Redunca fulvorufula 30 1 1 0.01 0.102 0 0 0.0000

© Biosphere Expeditions, an international not-for-profit conservation organisation registered in England, Germany, France, Australia and the USAOfficially accredited member of the United Nations Environment Programme's Governing Council & Global Ministerial Environment ForumOfficially accredited member of the International Union for the Conservation of Nature
18
2.4. Discussion & conclusions
Medium to large mammal relative abundance from camera traps
Overall, the presence of potential medium to large prey species for caracal and leopard atBHNR appears healthy, with a variety of small to medium antelope and game bird speciesthat are more common than the predators. Baboon and duiker were noted as beingespecially common, with support for this coming from the flush survey conducted on awider scale. It is interesting to note the very low encounter rate with black-backed jackal, aspecies confirmed to cause stock losses on neighbouring farms. Whether this is due to thepresence of leopard can only be speculated upon.
Small mammal abundance from Sherman traps
The results presented in this report represent the first formal small mammal survey atBHNR. While three of the species recorded were known to be present, the capture ofseveral Namaqua rock mice presented a novel species for the BHNR list.
Capture rates were low given that the veld condition was perceived to be good after aboveaverage winter rainfall. However, the previous summer had been unseasonably hot anddry, with very low capture rates of birds at the study site. Capture rates of birds have beenshown to be correlated with actual density (Lee et al., 2015). In addition, local crop failuresat BHNR were noted during that season, partly attributed to a late spring frost. It ispossible that the capture rates were low as a consequence of unfavourable conditions inthe previous breeding season and it is likely that capture rates in forthcoming years will bedifferent, especially since rodents are known to react and breed quickly in response tofavourable environmental conditions.
It is also likely that this set of mammals is a food source for caracal and certainly forAfrican wildcat. Low African wildcat ORI may be linked to low food resources as well asthe presence of the larger, competitor felids. It will certainly be of interest to conduct follow-up surveys at these sites in coming years and relate small mammal capture rates towildcat and other predator species presence.
Terrestrial bird and mammal abundance from flush surveys
Given the fairly substantial survey effort involving many people, all of which was conductedon foot, the species richness and density estimates from the biome-wide survey ofterrestrial birds and mammals were surprisingly low. Some species were likely notdetected due to their nocturnal habits when shelter is sought in burrows: aardvark,bushpig, porcupine and to a lesser degree honey badger, otter and water mongoose. Nofelids were encountered, although this may well be due to flight before detection. Certainly,it may be additional evidence for the rarity of these species.
In terms of potential prey items, biomass of mammals per hectare is much higher than thatof game birds. This would indicate that energy expended in hunting efforts would be farmore valuably spent on hunts of available mammals, likely accounting for the relatively lowabundance of birds in previous dietary studies of leopard and caracal (Melville et al., 2004,Braczkowski et al., 2012b).

© Biosphere Expeditions, an international not-for-profit conservation organisation registered in England, Germany, France, Australia and the USAOfficially accredited member of the United Nations Environment Programme's Governing Council & Global Ministerial Environment ForumOfficially accredited member of the International Union for the Conservation of Nature
19
Conclusions and future research
The information collected by the participants of one South African expedition is veryimpressive, and we have a far better understanding of the species richness and relativeabundance of mammals both at BHNR and for the wider fynbos biome. Generally, thisstudy confirms that encounter rates at all levels of potential prey for the carnivores that livein mountain fynbos are low. It has been postulated that the low density and large ranges ofmountain leopard are to a degree a function of low prey availability (Martins et al., 2011).This study corroborates these findings. In addition, most potential prey items are small andthus there would be selective pressure against large individuals forced to hunt morefrequently or to hunt the more scarce large prey items. We postulate that this, rather thanany physiological adaptation to the harsh fynbos climate, is the mechanism resulting in themuch smaller body size of the Cape mountain leopard.
There is much that can be considered for future avenues of research that need to berealised. For example, comparative measures of prey abundance on stock land couldinform land management decisions that result in decreased conflict. Dietary analysis ofscat would provide information on prey preference given abundance in the landscape,where sampling is also ideally undertaken across the biome with analysis conductedthrough modern genomic sampling techniques. The failure of research to address therange-wide conservation needs of leopards in South Africa has been noted as a casestudy (Balme et al., 2014) and we feel that our research here has contributed tounderstanding a little bit more about why the Cape mountain leopards are the way theyare and why they do what they do.
2.5. Literature cited
AVENANT, N. & NEL, J. 2002. Among habitat variation in prey availability and use by caracal Feliscaracal. Mammalian Biology-Zeitschrift für Säugetierkunde, 67, 18–33.
BALME, G., HUNTER, L. & SLOTOW, R. 2007. Feeding habitat selection by huntingleopards Panthera pardus in a woodland savanna: prey catchability versus abundance.Animal Behaviour, 74, 589-598.
BALME, G. A., HUNTER, L. & BRACZKOWSKI, A. R. 2012. Applicability of age-basedhunting regulations for African leopards. PloS one, 7, e35209.
BALME, G. A., LINDSEY, P. A., SWANEPOEL, L. H. & HUNTER, L. T. 2014. Failure of researchto address the rangewide conservation needs of large carnivores: leopards in South Africa as acase study. Conservation Letters, 7, 3–11.
BATES, D., MAECHLER, M., BOLKER, B. & WALKER, S. 2013. lme4: Linear mixed-effectsmodels using Eigen and S4. R package version, 1.
BOSHOFF, A. & KERLEY, L. 2001. Potential distributions of the medium-to large-sized mammalsin the Cape Floristic Region, based on historical accounts and habitat requirements. AfricanZoology, 36, 245–273.
BRACZKOWSKI, A., WATSON, L., COULSON, D., LUCAS, J., PEISER, B. & ROSSI, M. 2012.The diet of caracal, Caracal caracal, in two areas of the southern Cape, South Africa asdetermined by scat analysis. South African Journal of Wildlife Research, 42, 111–116.

© Biosphere Expeditions, an international not-for-profit conservation organisation registered in England, Germany, France, Australia and the USAOfficially accredited member of the United Nations Environment Programme's Governing Council & Global Ministerial Environment ForumOfficially accredited member of the International Union for the Conservation of Nature
20
BRACZKOWSKI, A., WATSON, L., COULSON, D. & RANDALL, R. 2012b. Diet of leopards in thesouthern Cape, South Africa. African Journal of Ecology, 50, 377–380.
BUCKLAND, S. T., ANDERSON, D. R., BURNHAM, K. P. & LAAKE, J. L. 2005. DistanceSampling. Encyclopedia of Biostatistics. John Wiley & Sons, Ltd.
INSKIP, C. & ZIMMERMANN, A. 2009. Human-felid conflict: a review of patterns and prioritiesworldwide. Oryx, 43, 18–34.
KUZNETSOVA, A., BROCKHOFF, P. B. & CHRISTENSEN, R. H. B. 2013. lmerTest: Tests forrandom and fixed effects for linear mixed effect models (lmer objects of lme4 package). R packageversion, 2.
LEE, A. T. K. & BARNARD, P. 2013. The birds of Blue Hill Nature Reserve: The Fynbos EndemicBird Survey. Afring News, 42, 21–28.
LEE, A. T., BARNARD, P. & HOCKEY, P. A. 2015. Population metrics for fynbos birds, SouthAfrica: densities, and detection and capture rates from a Mediterranean-type ecosystem. Ostrich,86, 1-9.
MANLEY, P. N., VAN HORNE, B., ROTH, J. K., ZIELINSKI, W. J., MCKENZIE, M. M., WELLER,T. J., WECKERLY, F. W. & VOJTA, C. 2006. Multiple species inventory and monitoring technicalguide. Gen. Tech. Rep. WO-73. U.S. Department of Agriculture, Forest Service, Washington D.C.
MARTINS, Q., HORSNELL, W., TITUS, W., RAUTENBACH, T. & HARRIS, S. 2011. Dietdetermination of the Cape Mountain leopards using global positioning system location clusters andscat analysis. Journal of Zoology, 283, 81–87.
MARTINS, Q. & MARTINS, N. 2006. Leopards of the Cape: conservation and conservationconcerns. International Journal of Environmental Studies, 63, 579–585.
MCMANUS, J. S., DALTON, D. L., KOTZÉ, A., SMUTS, B., DICKMAN, A., MARSHAL, J. P. &KEITH, M. 2015. Gene flow and population structure of a solitary top carnivore in a human-dominated landscape. Ecology and Evolution, 5, 335–344.
MELVILLE, H., BOTHMA, J. D. P. & MILLS, M. 2004. Prey selection by caracal in the KgalagadiTransfrontier Park. South African Journal of Wildlife Research, 34, 67–75.
MYERS, N., MITTERMEIER, R. A., MITTERMEIER, C. G., DA FONSECA, G. A. B. & KENT, J.2000. Biodiversity hotspots for conservation priorities. Nature, 403, 853.
R CORE TEAM 2015. R: A language and environment for statistical computing. R Foundation forStatistical Computing, Vienna, Austria. URL http://www.R-project.org/.
RADLOFF, F. G. T. 2008. The ecology of large herbivores native to the coastal lowlands of theFynbos Biome in the Western Cape, South Africa. MSc, Stellenbosch University.
SKEAD, C. J., BOSHOFF, A., KERLEY, G. I. H. & LLOYD, P. 2011. Historical Incidence of theLarger Land Mammals in the Broader Northern and Western Cape. Port Elizabeth, South Africa,Centre for African Conservation Ecology, Nelson Mandela Metropolitan University.
THORN, M., GREEN, M., DALERUM, F., BATEMAN, P. W. & SCOTT, D. M. 2012. What driveshuman–carnivore conflict in the North West Province of South Africa? Biological Conservation,150, 23–32.

© Biosphere Expeditions, an international not-for-profit conservation organisation registered in England, Germany, France, Australia and the USAOfficially accredited member of the United Nations Environment Programme's Governing Council & Global Ministerial Environment ForumOfficially accredited member of the International Union for the Conservation of Nature
21
3. Annual patterns of mammal abundanceat a mountain fynbos site
Alan Tristram Kenneth LeeUniversity of Cape Town
3.1. Introduction
Changing land use may result in profound changes in biodiversity (DeFries et al., 2004).These changes are normally described in terms of environmental degradation as a resultof greater human influence (Kerr and Currie, 1995). Fewer studies examine the result ofbiodiversity change in the face of land management change designed for biodiversity withreduced human impact. Here we report on the changes observed in species encounterrates from camera traps placed at Blue Hill Nature Reserve (BHNR), Western Cape, SouthAfrica. With the cessation of hunting plus reduced competition for browse and grazeresources, we expect increases in the frequency of capture of medium to large mammalspecies as recorded by camera traps.
3.2. Methods
We examined the camera trap database described in Chapter 2 of this report, whichcontains data for the period 11 May 2010 to 14 July 2015. For each of the most commonspecies we created a relative reporting rate index based on the total number of individualsobserved in all camera trap photos divided by the number of active camera trapping nightsfor each year (Table 3.2a). We explored the resulting relative abundance index per year asa function of year (time since land use change to conservation) using standard linearmodelling functions in R.
Table 3.2a. Effort table of trap nights per year.
Year Trap nights
2010 526
2011 713
2012 344
2013 563
2014 1172
2015 137
3.3. Results
The four most common antelope groups all displayed a positive slope with time, and thiswas significant for grey rhebok and kudu (Figure 3.3a, Table 3.3a). Grysbok also showed anear significant increase (p = 0.07). Caracal was the only one of the three feline predatorsto show a significant positive increase with time across the six year intervals consideredhere (p = 0.04). There were no significant increases for any of the other major taxa groups,which generally showed no change. Encouragingly, no species showed significantdeclines in encounter rates.

© Biosphere Expeditions, an international not-for-profit conservation organisation registered in England, Germany, France, Australia and the USAOfficially accredited member of the United Nations Environment Programme's Governing Council & Global Ministerial Environment ForumOfficially accredited member of the International Union for the Conservation of Nature
22

© Biosphere Expeditions, an international not-for-profit conservation organisation registered in England, Germany, France, Australia and the USAOfficially accredited member of the United Nations Environment Programme's Governing Council & Global Ministerial Environment ForumOfficially accredited member of the International Union for the Conservation of Nature
23
Figure 3.3a. Charts of relative abundance from camera trap photos plotted against year for a variety of mammals atBHNR. The thin blue line indicates the slope of the regression of relative abundance as a function of year, with the greyerror shading indicating standard error. The adjusted R squared score for each model is indicated in each panel.
Table 3.3a. Summary output table of regression analysis of relative encounter rates per year as a function of year (timesince recovery). Estimate is the slope of the regression line with its standard error (SE), and Statistic is the t value uponwhich the P value is calculated. P values < 0.05 are indicated in bold font.
Species Estimate SE Statistic P value
Caracal Caracal caracal 0.005 0.002 2.946 0.042
Leopard Panthera pardus 0.007 0.006 1.288 0.267
Wildcat Felis silvestris -0.003 0.002 -1.95 0.123
Common Duiker Sylvicapra grimmia 0.048 0.034 1.41 0.231
Cape Grysbok Raphicerus melanotis 0.145 0.06 2.417 0.073
Klipspringer Oreotragus oreotragus -0.006 0.004 -1.467 0.216
Greater Kudu Tragelaphus strepsiceros 0.03 0.01 3.143 0.035
Grey Rhebok Pelea capreolus 0.043 0.015 2.839 0.047
Aardvark Orycteropus afer -0.005 0.006 -0.835 0.45
Bushpig Potamochoerus larvatus 0.035 0.02 1.778 0.15
Honey badger Mellivora capensis -0.001 0.003 -0.496 0.646
Cape porcupine Hystrix africaeaustralis -0.001 0.001 -1.205 0.294

© Biosphere Expeditions, an international not-for-profit conservation organisation registered in England, Germany, France, Australia and the USAOfficially accredited member of the United Nations Environment Programme's Governing Council & Global Ministerial Environment ForumOfficially accredited member of the International Union for the Conservation of Nature
24
3.4. Discussion
Year on year, there are encouraging signs of increased activity recorded through cameratraps for a variety of taxa at BHNR, which we interpret as a recovery in local populations.There are certainly complicating effects, for example the widespread fire that occurred in2012. In addition, rainfall is unpredictable both in terms of seasonality and quantity, andthe influence on rapidly breeding species such as rock hyrax or even grysbok areunknown.
For leopards, relative abundance between years is very erratic. This is certainly to adegree a result of the loss of leopards due to persecution. Even if leopards are notspecifically targeted by predator control measures, they are likely to fall victim to any trapdeployed for species such as caracal. The use of gin traps, baited cage traps and huntingwith dogs all takes place on the farms surrounding BHNR. A male leopard, known to beresident during 2011 and 2012, was found dead at the beginning of 2014 on a farm only afew kilometres south of BHNR. He was possibly killed in 2013. Death was known to behuman-related, because the GPS collar the animal carried was vandalised. It is likely thata second resident female suffered the same fate, and the fate of two more leopardscaught on camera frequently during 2012/2013 can only be speculated upon. The dearthof leopard activity on cameras during 2014 is cause for concern. Two males were recordedon camera during 2015, including one male collared by the Landmark Foundation deep inthe Baviaanskloof (>50 km linear distance, Figure 3.4a). The second individual appears tobe a young male, who has frequented BHNR for much of 2015 and has so far eludedextensive capture efforts (Figure 3.4b). No females were confirmed during 2015.
Figure 3.4a. The male leopard known as Scarface was collared by the Landmark Foundation in the Baviaanskloof.

© Biosphere Expeditions, an international not-for-profit conservation organisation registered in England, Germany, France, Australia and the USAOfficially accredited member of the United Nations Environment Programme's Governing Council & Global Ministerial Environment ForumOfficially accredited member of the International Union for the Conservation of Nature
25
Figure 3.4b. An uncollared male includes Blue Hill Nature Reserve as part of his regular territory patrols.
Figure 3.4c. Caracal are more frequently recorded on camera than leopards at BHNR,but the number of individuals has been impossible to determine.

© Biosphere Expeditions, an international not-for-profit conservation organisation registered in England, Germany, France, Australia and the USAOfficially accredited member of the United Nations Environment Programme's Governing Council & Global Ministerial Environment ForumOfficially accredited member of the International Union for the Conservation of Nature
26
By contrast, caracal showed a significant increase in relative abundance over the samplingperiod. It is impossible to tell whether caracal were responding to changes in persecutionlevels or to increased prey availability. However, we suspect the former as alternative preyin the form of goats, sheep and calves were previously available. Caracal have smallerterritories than leopard, and the resident individuals are perhaps less likely to encounterpredator control measures compared to the more wide-ranging leopards. We have noinformation on individual survival for the caracal as no individuals had distinctive markings(Figure 3.4c). By contrast, we were able to identify most leopards due to their unique coatmarkings.
This section of the report is simply an overview of current trends. At this stage there arestill many more photographs to be analysed and more data entry to do before concretepatterns in recovery or decline can be confirmed.
3.5. Literature cited
AVENANT, N. & NEL, J. 2002. Among habitat variation in prey availability and use by caracal Feliscaracal. Mammalian Biology-Zeitschrift für Säugetierkunde, 67, 18–33.
BALME, G., HUNTER, L. & SLOTOW, R. 2007. Feeding habitat selection by hunting leopardsPanthera pardus in a woodland savanna: prey catchability versus abundance. Animal Behaviour,74, 589–598.
BALME, G. A., HUNTER, L. & BRACZKOWSKI, A. R. 2012. Applicability of age-based huntingregulations for African leopards. PloS ONE, 7, e35209.
BALME, G. A., LINDSEY, P. A., SWANEPOEL, L. H. & HUNTER, L. T. 2014. Failure of researchto address the rangewide conservation needs of large carnivores: leopards in South Africa as acase study. Conservation Letters, 7, 3–11.
BATES, D., MAECHLER, M., BOLKER, B. & WALKER, S. 2013. lme4: Linear mixed-effectsmodels using Eigen and S4. R package version, 1.
BOSHOFF, A. & KERLEY, L. 2001. Potential distributions of the medium-to large-sized mammalsin the Cape Floristic Region, based on historical accounts and habitat requirements. AfricanZoology, 36, 245–273.
BRACZKOWSKI, A., WATSON, L., COULSON, D., LUCAS, J., PEISER, B. & ROSSI, M. 2012a.The diet of caracal, Caracal caracal, in two areas of the southern Cape, South Africa asdetermined by scat analysis. South African Journal of Wildlife Research, 42, 111–116.
BRACZKOWSKI, A., WATSON, L., COULSON, D. & RANDALL, R. 2012b. Diet of leopards in thesouthern Cape, South Africa. African Journal of Ecology, 50, 377–380.
BUCKLAND, S. T., ANDERSON, D. R., BURNHAM, K. P. & LAAKE, J. L. 2005. DistanceSampling. Encyclopedia of Biostatistics. John Wiley & Sons, Ltd.
DEFRIES, R. S., FOLEY, J. A. & ASNER, G. P. 2004. Land-use choices: balancing human needsand ecosystem function. Frontiers in Ecology and the Environment, 2, 249–257.
INSKIP, C. & ZIMMERMANN, A. 2009. Human-felid conflict: a review of patterns and prioritiesworldwide. Oryx, 43, 18–34.

© Biosphere Expeditions, an international not-for-profit conservation organisation registered in England, Germany, France, Australia and the USAOfficially accredited member of the United Nations Environment Programme's Governing Council & Global Ministerial Environment ForumOfficially accredited member of the International Union for the Conservation of Nature
27
KERR, J. T. & CURRIE, D. J. 1995. Effects of human activity on global extinction risk.Conservation Biology, 9, 1528–1538.
KUZNETSOVA, A., BROCKHOFF, P. B. & CHRISTENSEN, R. H. B. 2013. lmerTest: Tests forrandom and fixed effects for linear mixed effect models (lmer objects of lme4 package). R packageversion, 2.
LEE, A. T. K. & BARNARD, P. 2013. The birds of Blue Hill Nature Reserve: The Fynbos EndemicBird Survey. Afring News, 42, 21–28.
LEE, A. T., BARNARD, P. & HOCKEY, P. A. 2015. Population metrics for fynbos birds, SouthAfrica: densities, and detection and capture rates from a Mediterranean-type ecosystem. Ostrich,86, 1–9.
MANLEY, P. N., VAN HORNE, B., ROTH, J. K., ZIELINSKI, W. J., MCKENZIE, M. M., WELLER,T. J., WECKERLY, F. W. & VOJTA, C. 2006. Multiple species inventory and monitoring technicalguide. Gen. Tech. Rep. WO-73. U.S. Department of Agriculture, Forest Service, Washington D.C.
MARTINS, Q., HORSNELL, W., TITUS, W., RAUTENBACH, T. & HARRIS, S. 2011. Dietdetermination of the Cape Mountain leopards using global positioning system location clusters andscat analysis. Journal of Zoology, 283, 81–87.
MARTINS, Q. & MARTINS, N. 2006. Leopards of the Cape: conservation and conservationconcerns. International Journal of Environmental Studies, 63, 579–585.
MCMANUS, J. S., DALTON, D. L., KOTZÉ, A., SMUTS, B., DICKMAN, A., MARSHAL, J. P. &KEITH, M. 2015. Gene flow and population structure of a solitary top carnivore in a human-dominated landscape. Ecology and Evolution, 5, 335–344.
MELVILLE, H., BOTHMA, J. D. P. & MILLS, M. 2004. Prey selection by caracal in the KgalagadiTransfrontier Park. South African Journal of Wildlife Research, 34, 67–75.
MYERS, N., MITTERMEIER, R. A., MITTERMEIER, C. G., DA FONSECA, G. A. B. & KENT, J.2000. Biodiversity hotspots for conservation priorities. Nature, 403, 853.
R CORE TEAM 2015. R: A language and environment for statistical computing. R Foundation forStatistical Computing, Vienna, Austria. URL http://www.R-project.org/.
RADLOFF, F. G. T. 2008. The ecology of large herbivores native to the coastal lowlands of theFynbos Biome in the Western Cape, South Africa. MSc, Stellenbosch University.
SKEAD, C. J., BOSHOFF, A., KERLEY, G. I. H. & LLOYD, P. 2011. Historical Incidence of theLarger Land Mammals in the Broader Northern and Western Cape. Port Elizabeth, South Africa,Centre for African Conservation Ecology, Nelson Mandela Metropolitan University.
THORN, M., GREEN, M., DALERUM, F., BATEMAN, P. W. & SCOTT, D. M. 2012. What driveshuman–carnivore conflict in South Africa? Biological Conservation, 150, 23–32.

© Biosphere Expeditions, an international not-for-profit conservation organisation registered in England, Germany, France, Australia and the USAOfficially accredited member of the United Nations Environment Programme's Governing Council & Global Ministerial Environment ForumOfficially accredited member of the International Union for the Conservation of Nature
28
4. Blue Hill bat survey
Craig TurnerBiosphere Expeditions &
Wychwood Environmental Ltd
4.1 Introduction
Bats are a vital component of any ecological community providing vital ecosystem servicesincluding insect control, seed dispersal and pollination. Bats are often overlooked duringsimple biodiversity surveys due to their nocturnal habits and the specialised equipmentneeded to record or identify them.
During the Biosphere Expeditions South Africa expedition in 2015 a pilot bat survey usingultrasonic acoustic detectors was undertaken to assess what species were present in asmall area of the Blue Hill Nature Reserve area (BHNR).
The principle aim of the bat study was to provide baseline information with respect to batspecies and activity within the site, with the following specific objectives: (1) confirm thelikely presence or absence of any bat roosts and assess their likely usage and (2) identifywhich bat species are present within or adjacent to the site, and levels of activity.
4.2 Methods
Bat detector activity surveys were conducted in October 2015. These were either run as‘dusk’ surveys or ‘overnight’ surveys. Dusk surveys commenced 30 minutes before sunsetand finished two hours after sunset. Dawn surveys commenced 30 mins before dawn until1 hr after sunrise. Surveys were completed using a single Anabat Express detector torecord bat echolocations as ‘bat passes’ (where a bat pass is defined as a sequence ofgreater than two echolocation calls made as a single bat flies past the microphone1).
The surveys were carried out in accordance with the standard methodology (BCT, 2012),and bat calls were analysed according to standard parameters (Parsons and Jones, 2000,Monadjem et al., 2010, Russ 2012). The surveys and analyses were conducted by theauthor2. Details of survey locations are given below (Table 4.2a, Figures 4.2a & 4.2b).
Table 4.2a. Survey types and locations.
Site Description Survey type Figure
1 Front garden between houses Dusk 4.2a & b
2 North of vehicle shed Dusk 4.2a & b
3 Leopard cage trap Overnight 4.2a
4 Entrance gate to BHNR Overnight 4.2a
Data analysis
The data collected from Anabat bat detectors were analysed and interpreted usingAnalookW software. Calls were also compared to a known library of calls2, to facilitateaccurate identification.
1 http://www.bats.org.uk/nbmp_tutorials/tutorial26.html2 The author is grateful for the assistance of Dr Sandie Sowler, who amongst other things provided a call library.

© Biosphere Expeditions, an international not-for-profit conservation organisation registered in England, Germany, France, Australia and the USAOfficially accredited member of the United Nations Environment Programme's Governing Council & Global Ministerial Environment ForumOfficially accredited member of the International Union for the Conservation of Nature
29
Figure 4.2a. Location of bat surveys (1–4) around BHNR.
Figure 4.2b. Location of the two survey points nearest the properties at BHNR.

© Biosphere Expeditions, an international not-for-profit conservation organisation registered in England, Germany, France, Australia and the USAOfficially accredited member of the United Nations Environment Programme's Governing Council & Global Ministerial Environment ForumOfficially accredited member of the International Union for the Conservation of Nature
30
Constraints and limitations
It should be noted that lack of evidence of a particular bat does not necessarily preclude itfrom being present at a later date. In relation to use of habitats or roost sites by batspecies, use of a particular area of land can vary not only on a seasonal basis, but alsofrom day to day. Whilst activity surveys are used to provide an estimate of the likelyimportance of a given area of land for bats, due to the highly mobile nature of bats it is notpossible to determine accurately the exact numbers of bats using standard non-intrusivesurvey methods.
Other constraints to be aware of are: (1) the echolocation used by some bats is very quietand difficult to detect. Some species may have been present without registering on the batdetectors used during the activity survey due to the nature of their echolocation; (2) therecording system employed by Anabats can only respond to the signal with the highestintensity at any time. As the signal from some bat species (such as pipistrelles) will nearlyalways be more intense than that of other bat species (such as Myotis bats), it is possiblethat some bat signals were not recorded. As a result, some bat activity may have beenunder-recorded; (3) the height at which Anabats were positioned may have limited therecording of some bat activity across all stations; (4) the identification of bats in the genusMyotis to species level based on recorded echolocations is not always possible3 with ahigh degree of confidence. This is due to the similarity and overlap in characteristicsbetween myotid bats and the calls they make, together with the ability of these bats to emitdifferent calls in different habitats and situations. Techniques are being developed to assistwith the identification of these bats from recordings, such as the use of ‘slope’ in theAnalookW programme designed for use with Anabat CF detectors. Comparison of slopebetween myotids and a library of known calls was used to assist with identification; (5) dueto variation in the time spans for which the detector was deployed at the differentlocations, and the limited survey effort, only species presence is presented in the results,rather than a comparison of relative abundance.
4.3. Results
At least five species of bat were identified during the surveys (Table 4.3a, Figures 4.3a–e).Two species, the Egyptian free-tailed bat and the African pipistrelle, were recorded at all ofthe sites, whereas the Hottentot serotine was recorded at just one location.
Table 4.3a. Species records by site.
Egyptian free-tailed African pipistrelle Cape serotine Cape horseshoe Hottentot serotine
SiteTadarida
aegyptiacaPipistrellushesperidus
Neoromiciacapensis
Rhinolophuscapensis
Eptesicushottentotus
1 Y Y Y Y N
2 Y Y Y Y Y
3 Y Y N Y N
4 Y Y Y N N
3 BCT guidelines recognise that Myotis bats can only be identified with a low degree of confidence to species level, as set out in section6.4.3 of the guidelines.

© Biosphere Expeditions, an international not-for-profit conservation organisation registered in England, Germany, France, Australia and the USAOfficially accredited member of the United Nations Environment Programme's Governing Council & Global Ministerial Environment ForumOfficially accredited member of the International Union for the Conservation of Nature
31
Example sonograms
Figure 4.3a. Egyptian free-tailed bat (Tadarida aegyptiaca).
Figure 4.3b. African pipistrelle (Pipistrellus hesperidus), with Egyptian free-tailed below.

© Biosphere Expeditions, an international not-for-profit conservation organisation registered in England, Germany, France, Australia and the USAOfficially accredited member of the United Nations Environment Programme's Governing Council & Global Ministerial Environment ForumOfficially accredited member of the International Union for the Conservation of Nature
32
Figure 4.3c. Cape serotine (Neoromicia capensis).
Figure 4.3d. Cape horsehoe bat (Rhinolophus capensis).

© Biosphere Expeditions, an international not-for-profit conservation organisation registered in England, Germany, France, Australia and the USAOfficially accredited member of the United Nations Environment Programme's Governing Council & Global Ministerial Environment ForumOfficially accredited member of the International Union for the Conservation of Nature
33
Figure 4.3e. Hottentot serotine (Eptesicus hottentotus), with Egyptian free-tailed bat.
The surveys also led to the exploration of one cave (-33.596S, 23.405E) known to supportroosting bats. Upon visual inspection and documentation of further acoustic records, thespecies present are believed to be Cape horseshoe bats. The roost size at this stage isunknown.
4.4. Discussion
Literature indicates at least 30 species of bat in southern Africa and at least 12 speciesfrom the Western Cape. This short pilot study has confirmed the presence of at least fivespecies within a small area of the BHNR.
A brief summary for each species recorded is given below.
Egyptian free-tailed bat (Tadarida aegyptiaca): A broadly distributed species, with a rangethat extends throughout Africa and the Arabian Peninsula, to India, Sri Lanka andBangladesh. Classified as Least Concern (LC) on the IUCN Red List.
African pipistrelle (Pipistrellus hesperidus): This species has been recorded over much ofsub-Saharan Africa. It ranges from the Cape Verde Islands, to Liberia and Côte d'Ivoire,Nigeria, Cameroon and Equatorial Guinea (Bioko), western Democratic Republic of theCongo, southern Sudan, Ethiopia, Eritrea and Somalia, into Kenya and Uganda, Rwanda,Burundi, Tanzania, Malawi, Mozambique, Zambia, Zimbabwe and Angola, and is found asfar south as eastern and southern South Africa and possibly Swaziland. It is listed asLeast Concern on the IUCN Red List in view of its wide distribution, presumed largepopulation, and because it is unlikely to be declining fast enough to qualify for listing in amore threatened category.

© Biosphere Expeditions, an international not-for-profit conservation organisation registered in England, Germany, France, Australia and the USAOfficially accredited member of the United Nations Environment Programme's Governing Council & Global Ministerial Environment ForumOfficially accredited member of the International Union for the Conservation of Nature
34
Cape serotine (Neoromicia capensis): This species is widespread over much of sub-Saharan Africa. It has been recorded from Guinea Bissau in the west, to Somalia,southern Sudan and Eritrea in the east, ranging south to most of South Africa. It is listedas Least Concern on the IUCN Red List in view of its wide distribution, presumed largepopulation, and because it is unlikely to be declining fast enough to qualify for listing in amore threatened category.
Cape horseshoe bat (Rhinolophus capensis): This species is restricted to the coastal beltof the Northern Cape, the Western Cape and the Eastern Cape of South Africa, as far eastalong the coast as the vicinity of East London. Listed as Least Concern on the IUCN RedList.
Hottentot serotine (Eptesicus hottentotus): This largely Southern African species rangesfrom southern Angola in the west, through parts of Namibia, South Africa, southernLesotho, Botswana, Zimbabwe, Mozambique, Malawi and Zambia, with a single record asfar north as southwestern Kenya. Although the species is considered to be sparselydistributed, it is locally common in parts of the range, such as Zimbabwe, but is though tobe rarer elsewhere (e.g. South Africa). Listed as Least Concern on the IUCN Red List.
Clearly additional surveys in multiple locations, following standardised protocols, are likelyto reveal yet more species, and begin to better illustrate bat usage of the wider landscapeand habitat features.
Anabat Express detectors can be deployed in a similar way to camera traps, whereby theycan be stationed in one location for several days and programmed to record data over setdays or hours. If these are then moved around several locations, a data-driven ‘picture’ ofbat activity in time and space emerges. Detectors could also be deployed to known cavesto better assess probable or actual roosts. Finally, the detectors have inbuilt GPS, andthus can also be used for walked or driven transect surveys, either post-dusk or pre-dawn.
Future surveys are proposed: Multi-day static surveys at multiple locations, covering a range of habitats, altitudes
and times of year. Cave entrance surveys, using static (daytime) deployment to assess roost locations
and level of activity. Transect surveys along existing tracts.
4.5. Literature cited
Bat Conservation Trust (BCT). 2012. Bat Surveys – Good Practice Guidelines. Bat ConservationTrust, London.
Parsons, S. & Jones, G. 2000. Acoustic identification of twelve species of echolocating bat bydiscriminant function analysis and artificial neural networks. Journal of Experimental Biology, 203,2641–2656.
Russ. J. 2012. British Bat Calls: A Guide to Species Identification. Pelagic Publishing.
Monadjem, A., P.J. Taylor, F. P. D. Cotterill & M.C. Schoeman 2010. Bats of Southern and CentralAfrica: A Biogeographic and Taxonomic Synthesis. Wits University Press, Johannesburg, SouthAfrica, 596 pp. ISBN 978-1-86814-508-9.

© Biosphere Expeditions, an international not-for-profit conservation organisation registered in England, Germany, France, Australia and the USAOfficially accredited member of the United Nations Environment Programme's Governing Council & Global Ministerial Environment ForumOfficially accredited member of the International Union for the Conservation of Nature
35
Appendix I: Expedition diary and reports
A multimedia expedition diary is available athttps://biosphereexpeditions.wordpress.com/category/expedition-blogs/south-africa-2015/.
All expedition reports, including this and previous expedition reports,are available at www.biosphere-expeditions.org/reports.
Related Documents