Expanding the Measurement of Culture with a Sample of Two Billion Humans Nick Obradovich * , Ömer Özak † , Ignacio Martín ‡ , Ignacio Ortuño-Ortín § , Edmond Awad ¶ , Manuel Cebrián , Rubén Cuevas ** , Klaus Desmet †† , Iyad Rahwan ‡‡ and Ángel Cuevas §§ September 8, 2020 Abstract Culture has played a pivotal role in human evolution. Yet, the ability of social scientists to study culture is limited by the currently available measurement instruments. Scholars of culture must regularly choose between scalable but sparse survey-based methods or restricted but rich ethnographic methods. Here, we demonstrate that massive online social networks can advance the study of human culture by providing quan- titative, scalable, and high-resolution measurement of behaviorally revealed cultural values and preferences. We employ publicly available data across nearly 60,000 topic dimensions drawn from two billion Facebook users across 225 countries and territories. We first validate that cultural distances calculated from this mea- surement instrument correspond to traditional survey-based and objective measures of cross-national cultural differences. We then demonstrate that this expanded measure enables rich insight into the cultural landscape globally at previously impossible resolution. We analyze the importance of national borders in shaping cul- ture, explore unique cultural markers that identify subnational population groups, and compare subnational divisiveness to gender divisiveness across countries. The global collection of massive data on human behav- ior provides a high-dimensional complement to traditional cultural metrics. Further, the granularity of the measure presents enormous promise to advance scholars’ understanding of additional fundamental questions in the social sciences. The measure enables detailed investigation into the geopolitical stability of countries, social cleavages within both small and large-scale human groups, the integration of migrant populations, and the disaffection of certain population groups from the political process, among myriad other potential future applications. Keywords: Culture, Cultural Distance, Identity, Regional Culture, Gender Differences. JEL Classification: C80, F1, J1, O10, R10, Z10 * Center for Humans and Machines, Max Planck Institute for Human Development, Berlin. E-mail: obradovich@mpib- berlin.mpg.de. † Department of Economics and Center for Scientific Computing, Southern Methodist University, Dallas, TX, IZA and GLO. E-mail: [email protected]. ‡ Nommon Solutions and Technologies, Madrid, and Department of Telematic Engineering, Universidad Carlos III, Madrid. Email: [email protected]. § Department of Economics, Universidad Carlos III, Madrid. Email: [email protected]. ¶ Department of Economics, University of Exeter Business School, Exeter. Email: [email protected]. Center for Humans and Machines, Max Planck Institute for Human Development, Berlin. Email: [email protected] ** Department of Telematic Engineering and UC3M-Santander Big Data institute, Universidad Carlos III, Madrid. Email: [email protected]. †† Department of Economics and Cox School of Business, Southern Methodist University, Dallas, TX, NBER and CEPR. Email: [email protected]. ‡‡ Center for Humans and Machines, Max Planck Institute for Human Development, Berlin. Email: [email protected]. §§ Department of Telematic Engineering and UC3M-Santander Big Data institute, Universidad Carlos III, Madrid. Email: acru- [email protected].

Welcome message from author
This document is posted to help you gain knowledge. Please leave a comment to let me know what you think about it! Share it to your friends and learn new things together.
Transcript
Expanding the Measurement of Culturewith a Sample of Two Billion Humans
Nick Obradovich*, Ömer Özak†, Ignacio Martín‡, Ignacio Ortuño-Ortín§,
Edmond Awad¶, Manuel Cebrián‖, Rubén Cuevas**, Klaus Desmet††, Iyad Rahwan‡‡
and Ángel Cuevas§§
September 8, 2020
AbstractCulture has played a pivotal role in human evolution. Yet, the ability of social scientists to study culture
is limited by the currently available measurement instruments. Scholars of culture must regularly choosebetween scalable but sparse survey-based methods or restricted but rich ethnographic methods. Here, wedemonstrate that massive online social networks can advance the study of human culture by providing quan-titative, scalable, and high-resolution measurement of behaviorally revealed cultural values and preferences.We employ publicly available data across nearly 60,000 topic dimensions drawn from two billion Facebookusers across 225 countries and territories. We first validate that cultural distances calculated from this mea-surement instrument correspond to traditional survey-based and objective measures of cross-national culturaldifferences. We then demonstrate that this expanded measure enables rich insight into the cultural landscapeglobally at previously impossible resolution. We analyze the importance of national borders in shaping cul-ture, explore unique cultural markers that identify subnational population groups, and compare subnationaldivisiveness to gender divisiveness across countries. The global collection of massive data on human behav-ior provides a high-dimensional complement to traditional cultural metrics. Further, the granularity of themeasure presents enormous promise to advance scholars’ understanding of additional fundamental questionsin the social sciences. The measure enables detailed investigation into the geopolitical stability of countries,social cleavages within both small and large-scale human groups, the integration of migrant populations,and the disaffection of certain population groups from the political process, among myriad other potentialfuture applications.
Keywords: Culture, Cultural Distance, Identity, Regional Culture, Gender Differences.
JEL Classification: C80, F1, J1, O10, R10, Z10
*Center for Humans and Machines, Max Planck Institute for Human Development, Berlin. E-mail: [email protected].
†Department of Economics and Center for Scientific Computing, Southern Methodist University, Dallas, TX, IZA and GLO. E-mail:[email protected].
‡Nommon Solutions and Technologies, Madrid, and Department of Telematic Engineering, Universidad Carlos III, Madrid. Email:[email protected].
§Department of Economics, Universidad Carlos III, Madrid. Email: [email protected].¶Department of Economics, University of Exeter Business School, Exeter. Email: [email protected].‖Center for Humans and Machines, Max Planck Institute for Human Development, Berlin. Email: [email protected]
**Department of Telematic Engineering and UC3M-Santander Big Data institute, Universidad Carlos III, Madrid. Email:[email protected].
††Department of Economics and Cox School of Business, Southern Methodist University, Dallas, TX, NBER and CEPR. Email:[email protected].
‡‡Center for Humans and Machines, Max Planck Institute for Human Development, Berlin. Email: [email protected].§§Department of Telematic Engineering and UC3M-Santander Big Data institute, Universidad Carlos III, Madrid. Email: acru-
Culture has played a pivotal role in human evolution1−4, setting our species apart from the rest of the
animal world. As a result, the study of human culture is one of the core endeavors of the social sciences. Tens
of thousands of scientists around the world study culture5, with disciplines ranging from anthropology6,7 to
sociology8, from political science9−11 to economics,12−14 and from psychology15−19 to philosophy20. Their
work has enabled the understanding of many human social, economic, and political phenomena12,21−28, and
serves as a bedrock of knowledge in the social sciences.
The traditional quantitative approach to the study of culture has been shaped by the historical availability
of data29. For most of the history of the study of culture, collecting empirical data on humans has been costly,
time consuming, and in many instances impossible30. As a result, scholars tend inductively to distill their broad
theoretical definitions of culture from the top down29, producing a set of cultural constructs measurable via
surveys in data constrained environments. Cultural dimensions that result from this process tend to be a select
few salient and measurable features of human groups such as artistic and culinary practices31, language32,33 and
literature34, political ideologies35 and institutions23, and religions and religious practices36.
Whereas a scholar of culture historically would often need to directly observe individuals in the field to
produce a rich description of their cultural attributes37, the information age has enabled measuring certain
aspects of human life at high resolution globally and unobtrusively30,38. Humans today spend an ever increasing
amount of time on devices that continuously track and record users’ interests, beliefs, preferences, behaviors,
locations and interactions. The data produced from this process are massive in size, extensive in coverage, and
high in resolution.
This changing information environment enables supplementing and expanding the scientific approach to
the measurement of culture. Here we propose new methods for the bottom-up measurement of culture globally.
We first explore the strengths and weaknesses of traditional quantitative approaches to the measurement of
culture and show their relation to our method. We then measure culture from the bottom up and examine
our measure’s performance against traditional quantitative measures. Finally, we investigate cultural questions
previously impossible to examine without the combined resolution and scope our method enables. Ultimately,
high-resolution granular data are essential for our understanding of many cultural phenomena, ranging from
wars and the formation of identity to the integration of immigrants and the fragmentation of societies.
Traditional quantitative approaches to the study of culture benefit from numerous strengths. For example,
these studies of culture are often relatively low in dimension and therefore readily measurable via quantitative
surveys. This parsimony has enabled excellent studies of certain cultural features in highly data constrained
settings27,39,40. Traditional approaches also provide substantial face validity: they focus on many of the concepts
typically associated with culture. These traditional approaches, as a result, likely encapsulate many important
constituent cultural constructs. A final benefit of the parsimony of traditional approaches is that scholars from
a wide variety of fields can measure and study different aspects of culture.
Yet while the traditional approach to culture has a number of benefits, it also has various weaknesses.
First, a critical question when attempting to construct a broad measure of human culture from the top down is:
where do we draw the line in terms of what to measure? Surely religion should be considered part of culture.
But is group-level support for a football team part of culture? What about preferences for video games41 or
television shows? What about group-level appreciation of cat videos or the color of socks that we choose to
wear? A scholar may determine religion – but not preference for a television show – to be the more theoretically
1

important constituent of culture to measure based on the argument that television preferences are not central to
the human experience. However, another scholar with a differing opinion could argue that, given the amount
of time humans in the developed world spend watching television42, the choice of particular show reflects an
important implicit value of the humans that watch it. If a line about what to measure must be drawn from the
top down, scholars will very likely reasonably disagree on where, precisely, it should fall. However, the very
attempt to narrow cultural constructs from the top down highlights the second weakness of this measurement
strategy. The justification for excluding any particular construct is necessarily endogenous to the particular
culture (and cultural bias) of the scientist(s) doing the theorizing. Crucially, where to draw this line is a direct
function of the cultural preferences of each scholar’s particular human group. This endogeneity problem arises
for every supervised attempt to include or exclude a concept from the measurement of culture.
Third, the parsimonious nature of top-down approaches presents its own limitations. Implicitly, traditional
quantitative approaches to the study of culture tend to focus on features that provide insight into differences
among human groups43−49. Yet, human groups may be similar in many more dimensions than they are dissimi-
lar. Top-down definitions tend to occlude these dimensions of similarity with an implicit focus on those features
– the arts, language, politics, religion, and distinct traditions – that differentiate human groups.
Finally, traditional quantitative measures of culture commonly rely on self-reported answers to survey
questions50 or subjective evaluations of the particular scientists conducting the study51. These pose measure-
ment challenges. Questions such as: “Is religion important to you?” or “Do you think adultery is immoral?”
pose substantial risks of social desirability bias52 and direct observation of subjects induces risk of Hawthorne
and experimenter demand effects53, among other related methodological concerns.
Here we expand the measurement of culture from the bottom up, enabling a rich, unobtrusive, quantitative
description of global cultural factors. Inspired by ethnographic methods54, we take culture as the set of infor-
mation and attributes that characterizes a human group at a point in time. We can conceive of the culture of a
human group at a point in time as a complex, high-dimensional hypersurface (the black surface in Figure 1A).
This surface is not narrowed from the top down. Conceptually, it includes art and Angry Birds appreciation,
ethics and email enjoyment, formalities and football fans, language and loungewear likes, religion and running
routines, politics and potluck preferences, and social structures and sockwear, among every other feature of
human life.
Our approach enables measuring culture from the bottom up (the blue surface in Figure 1A), providing a
complement to traditional top-down approaches (the red surface in Figure 1A). Importantly, it prioritizes no
features over others and enables the data to reveal important dimensions among observed human groups. This
allows our method to be general, flexible, and unsupervised. And it does not selectively exclude constructs,
reducing the biases in the measurement of culture encountered by top-down methods.
But how does one go about measuring the high-dimensional hypersurface of culture? Private firms have
– perhaps unintentionally – led the way. Effectively and precisely targeting products and services to indi-
viduals requires gathering massive amounts of information about those individuals’ beliefs, behaviors, and
preferences55−57. For online companies like Google and Facebook, the gathering, storing, and selling of this
information has itself become a multi-billion dollar enterprise. As a result, the platforms have become adroit
at measuring myriad features of human lives via activities that occur during the large amount of time modern
humans spend both online and offline in proximity to connected devices58.
2

Figure 1: Measurement of the cultural landscape and methods of classification of values, behaviors, prefer-ences, and interests on Facebook.Panel A illustrates how the bottom-up quantitative study of culture is enabled by informationtechnology advances and the broad measurement of humans across the globe. Paradigm shifting technologies such as the Internet,the advent of social media and big data, the introduction of the Internet of Things (IoT) and smart cities all shape the availability ofinformation with which to measure previously unstudied dimensions of culture. We anticipate a hypothetical future in which traditionaltop-down concepts of culture are encompassed by and integrated into a bottom-up approach to the measurement of culture. Panel Billustrates how Facebook classifies users’ interests via users’ self reporting, via users’ observed behavior which includes the totality ofusers’ clicks on the platform and on ads served elsewhere by the platform, via users’ ‘likes’ and software downloads, and via broadinference based on users’ overall behavior on and off the platform. The interests Facebook infers span hundreds of thousands of dimen-sions and include topics that both fall within more traditional measures of culture – such as religion, politics, and the arts – as well asthose that tend to fall outside of traditional measures – such as interests in video games, physical activity preferences, and recreationaldrug interests.
3

Facebook places particular importance in classifying the interests of its users59. As a result, the company
has inadvertently built the largest platform for the measurement of culture in existence (see Figure 1B). For-
tunately for scholars, Facebook makes this information accessible to prospective marketers via a marketing
Application Programming Interface (API). Using information drawn from users’ self-reported interests, click-
ing behaviors on Facebook, likes on Facebook, software downloads, GPS location, behavior on other sites that
employ Facebook ads (Figure 1B), this API provides the ability to create and analyze social groups of interest
along hundreds of thousands of interest dimensions and down to very fine spatial and temporal resolution (the
zip code-by-day level in the US). Table S4 illustrates examples of cultural categories along with corresponding
Facebook interests both for traditional and non-traditional cultural elements. By making its platform open to
those interested in marketing to its users, Facebook has enabled scholars to interrogate its measures of global
human interests and construct freely available measures of culture.
We use data gleaned from scraping the Facebook Marketing API to construct a high-dimensional measure
of culture. We gathered nearly 60,000 diverse interests by sequentially interrogating Facebook’s platform and
then constructed – for each administrative unit in our analysis – a vector of the share of individuals in that unit
that held each interest (see Methods for added detail). Importantly, each interest on the platform is indexed by
a unique identifier, allowing for consistency across languages globally. We use these data to investigate culture
at the country, subnational, and local levels.
Employing data on these interest shares drawn from over two billion individual users around the world,
we first validate our measure of culture derived from Facebook interests employing country differences from
traditional means of measuring cultural distance60. If our Facebook measure captures important components of
traditional top-down measures, we should expect to observe a positive correspondence between our bottom-up
measure and traditional top-down measures (see Methods for a description of distance and correlation mea-
sures).
Figure 2A presents the results of these comparisons. Our bottom-up measure of inter-country cultural
distance corresponds positively and significantly to a wide variety of typical measures of cultural distance
between countries. We observe small positive correlations between our measure and measures of linguistic,
geographic, religious, and genetic distance between country populations61−70 (see Methods). However, between
more direct measures of traditional notions of culture – provided via the World Values Survey (WVS)51,71 – we
observe a more marked positive correspondence with a correlation coefficient of approximately 0.5 (coefficient:
0.54 , p-value: 0.0001). Thus our bottom-up measure of cultural distance corresponds positively but imperfectly
to traditional measures.
Does this imperfect correspondence result from the measurement of additional components of cultural
distance between countries? At face value, Figure 2B shows that the number of Facebook interests are several
orders of magnitude larger than the number of questions in the WVS. To further investigate whether this also
translates into capturing more dimensions of culture, we perform principal component analysis on Facebook
interests and WVS questions, using the common sample of 69 countries covered by both data sources (see
Methods). Our goal is to reduce the dimensionality of interests and questions and to assess how many unique
principal components are able to explain a large share (80%) of the variance in our Facebook measure of culture
and in the WVS questions across countries.
Figure 2C plots the share of the overall variance in questions and interests that is explained by principal
4

0.0 0.1 0.2 0.3 0.4 0.5 0.6Pearson Correlation
Cultural 1Cultural 2Cultural 3Cultural 4
Linguistic 1Linguistic 2Linguistic 3Linguistic 4
Geog. 1Geog. 2Geog. 3Geog. 4
Religious 1Religious 2Religious 3Religious 4
Genetic 1Genetic 2Genetic 3Genetic 4
Dis
tanc
e Ty
pes
CulturalLinguisticGeographicalReligiousGenetic
(a) Correlation between Facebook and Traditional Measures
Facebook WVS101
102
103
104
105
Num
ber o
f Dim
ensi
ons
(b) Number of Dimensions
0 10 20 30Number of components
0.0
0.1
0.2
0.3
0.4
0.5
0.6
0.7
0.8
Cum
ulat
ive
expl
aine
d va
rianc
e
FacebookWVS
(c) Principal Component Analysis
Figure 2: Bottom-up measurement of culture correlates with traditional top-down measures, enables the useof orders of magnitude more features, and explains additional variance. (A) Correlation between our bottom-upFacebook inter-country cultural distance measure and inter-country cultural distances based on traditional proxies (see Methods forfull list). Bars show the Pearson correlation coefficient between our measure and the four most highly correlated measures within eachtype of conventional proxy (genetic, geographical, linguistic, religious, values). Black lines depict the 95% confidence interval for thecorrelation coefficient based on Mantel tests. Results are based on the common sample of 69 countries for which all measures areavailable. (B) Bars show the number of Facebook interests and the number of common questions included in all waves of the WorldValues Survey. (C) Lines depict the number of principal components and their cumulative explained variance for each measure. Toexplain 80% of the variation underlying the Facebook interests data across countries 29 principal components are required, as opposedto the 11 principal components necessary to explain the same level of variation in the WVS.
5
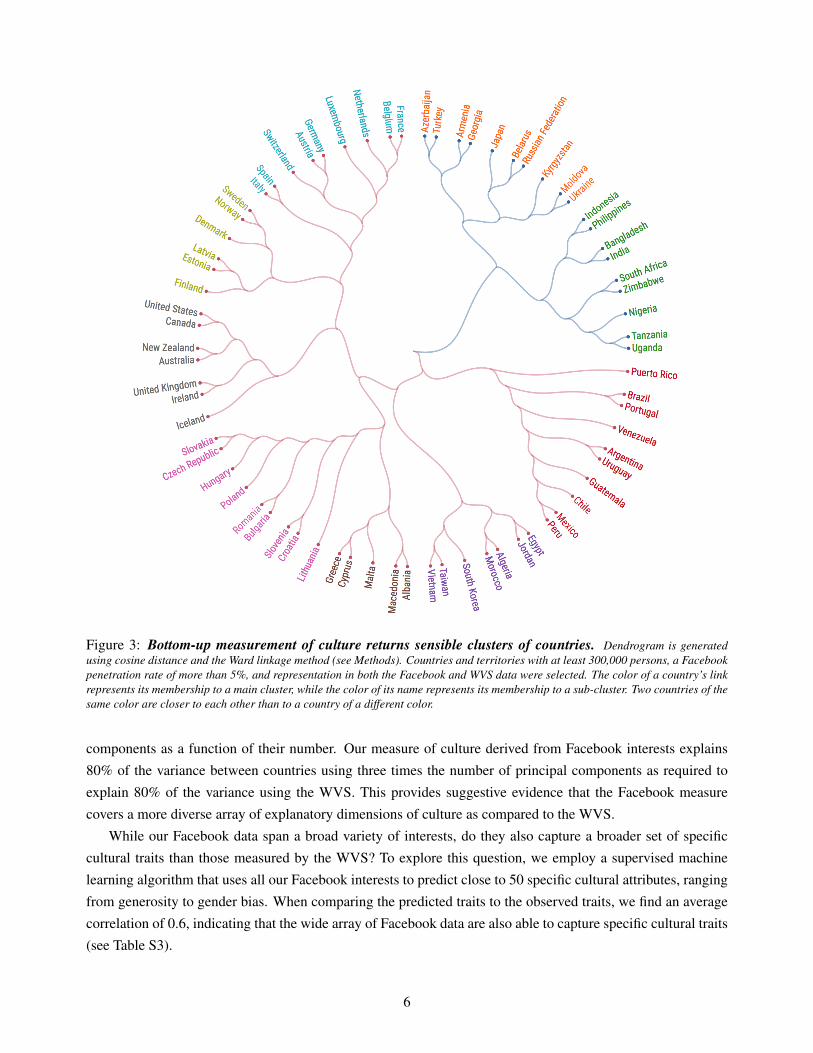
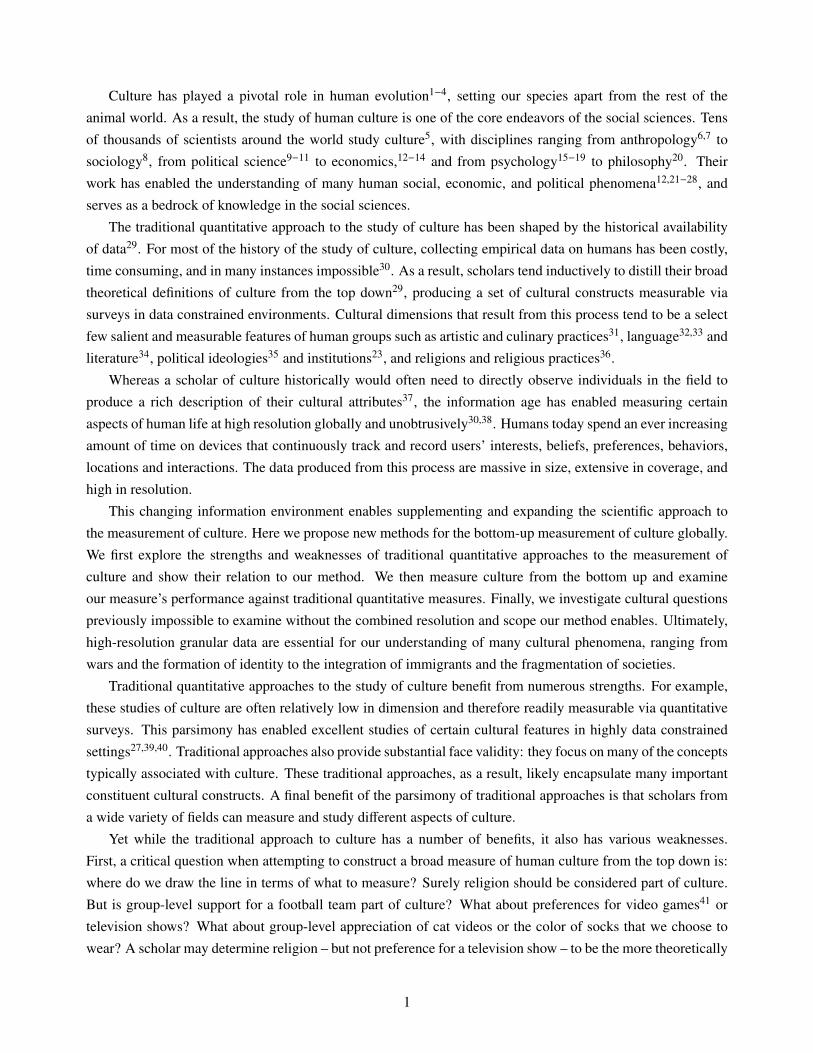
Figure 3: Bottom-up measurement of culture returns sensible clusters of countries. Dendrogram is generatedusing cosine distance and the Ward linkage method (see Methods). Countries and territories with at least 300,000 persons, a Facebookpenetration rate of more than 5%, and representation in both the Facebook and WVS data were selected. The color of a country’s linkrepresents its membership to a main cluster, while the color of its name represents its membership to a sub-cluster. Two countries of thesame color are closer to each other than to a country of a different color.
components as a function of their number. Our measure of culture derived from Facebook interests explains
80% of the variance between countries using three times the number of principal components as required to
explain 80% of the variance using the WVS. This provides suggestive evidence that the Facebook measure
covers a more diverse array of explanatory dimensions of culture as compared to the WVS.
While our Facebook data span a broad variety of interests, do they also capture a broader set of specific
cultural traits than those measured by the WVS? To explore this question, we employ a supervised machine
learning algorithm that uses all our Facebook interests to predict close to 50 specific cultural attributes, ranging
from generosity to gender bias. When comparing the predicted traits to the observed traits, we find an average
correlation of 0.6, indicating that the wide array of Facebook data are also able to capture specific cultural traits
(see Table S3).
6

Next we examine whether clusters of countries returned via our Facebook measure of culture mirror com-
mon conceptions of cultural similarity, providing a measure of face validity. Figure 3 presents a dendrogram of
countries, based on the cosine distance between culture vectors constructed from our Facebook data employing
the Ward linkage method. The sample of countries consists of those that overlap with the WVS, have a pop-
ulation of more than 300,000, and have a Facebook penetration rate of more than 5% (see Methods). As can
be seen, the unsupervised clustering of countries within our sample provides substantial validity to our mea-
sure. Countries that typically are culturally or historically associated with one another – the United States and
Canada, India and Bangladesh, Germany and Austria – are placed directly next to one another in the clusters.
Our approach also reveals novel features in the data that go beyond obvious geographic clustering. For example,
Puerto Rico is closer to the Latin American cluster than it is to the United States, despite being a U.S. territory.
Furthermore, linguistically similar but geographically disparate countries – such as the U.S. and Australia and
Brazil and Portugal – cluster together. It is important to mention that clustering algorithms have some difficulty
dealing with “outliers”. This explains the maybe surprising location of Japan in Figure 3. However, when
we extend the dendrogram to include all 225 countries, Japan is no longer special, appearing alongside China
(Figure ). The Supplementary Information provides extensive robustness checks, exploring different ways of
measuring distances and analyzing different samples of countries and interests.
Figures 2 and 3 provide evidence for the validity of our method. However, cultural variation is not relegated
solely to nation-level groupings. Cultural differences at the subnational level are essential to understand nation-
building efforts as well as geopolitical and secessionist threats around the globe. Unfortunately, traditional
quantitative measures are highly costly to conduct and thus provide little representative insight into subnational
cultures. Conducting representative surveys at high resolution globally would be cost prohibitive (in the limit,
the costs would approach those of the Facebook platform itself). Might our Facebook measure be able to
provide improved, scalable insight into novel subnational cultural variations?
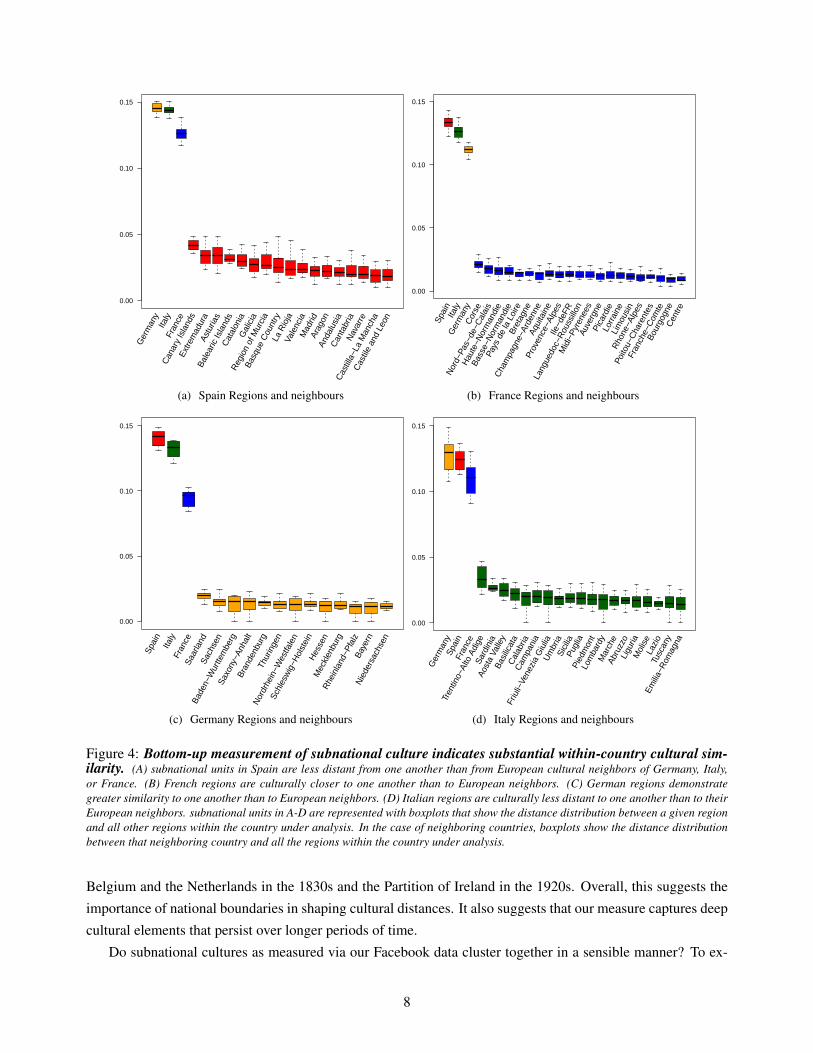
To investigate this question, we gather vectors of Facebook interests for subnational regions in the United
States and Europe and compute cosine distances between each region within the country and all the other
regions within the same country (see Methods). One question is whether subnational regions are less distant to
other regions within their own country than to closeby countries. Figure 4 investigates this for the regions of
Spain (red), France (blue), Germany (yellow), and Italy (green). For example, panel A depicts the distribution
of the cultural distances of Spanish regions to other European countries and to each other. The subnational
regions within Spain are much less distant to one other than to neighboring European countries. For example,
Catalonia is culturally markedly closer to any other Spanish region than to either Italy or France. This same
pattern holds for regions in the other countries (Panels B-D).
Before concluding that national borders demarcate sharp cultural boundaries, we also compare cultural
distances between sub-national regions in different countries. While sub-national regions are culturally closer
to each other than to other countries (Paris is closer to other regions of France than to Spain), we might expect
capital cities to resemble each other (Paris might be closer to Madrid than to rural regions of France). We
observe the opposite. Almost all sub-regions in our data are closest to sub-regions within their own national
borders. Only two sub-regions in our European data – Flanders in Belgium and Donegal County in Ireland –
are closer to regions in a separate country than they are to other regions in their own nation. Both exceptions
can be traced back to fairly recent changes in country borders: the splitting of the province of Limburg between
7
0.00
0.05
0.10
0.15
Ger
man
yIta
lyFr
ance
Can
ary
Isla
nds
Extre
mad
ura
Astu
rias
Bale
aric
Isla
nds
Cat
alon
iaG
alic
ia
Reg
ion
of M
urci
a
Basq
ue C
ount
ryLa
Rio
jaVa
lenc
iaM
adrid
Arag
onAn
dalu
sia
Can
tabr
iaN
avar
re
Cas
tilla
−La
Man
cha
Cas
tile
and
Leon
(a) Spain Regions and neighbours
0.00
0.05
0.10
0.15
Spai
nIta
lyG
erm
any
Cor
se
Nor
d−Pa
s−de
−Cal
ais
Hau
te−N
orm
andi
e
Bass
e−N
orm
andi
e
Pays
de
la L
oire
Bret
agne
Cha
mpa
gne−
Arde
nne
Aqui
tain
e
Prov
ence
−Alp
esIle
−deF
R
Lang
uedo
c−R
ouss
illon
Mid
i−Py
rene
esAu
verg
nePi
card
ieLo
rrain
eLi
mou
sin
Rho
ne−A
lpes
Poito
u−C
hare
ntes
Fran
che−
Com
teBo
urgo
gne
Cen
tre
(b) France Regions and neighbours
0.00
0.05
0.10
0.15
Spai
nIta
lyFr
ance
Saar
land
Sach
sen
Bade
n−W
urtte
mbe
rgSa
xony
−Anh
alt
Bran
denb
urg
Thur
inge
n
Nor
drhe
in−W
estfa
len
Schl
esw
ig−H
olst
ein
Hes
sen
Mec
klen
burg
Rhe
inla
nd−P
falz
Baye
rnN
iede
rsac
hsen
(c) Germany Regions and neighbours
0.00
0.05
0.10
0.15G
erm
any
Spai
nFr
ance
Tren
tino−
Alto
Adi
geSa
rdin
iaAo
sta
Valle
yBa
silic
ata
Cal
abria
Cam
pani
a
Friu
li−Ve
nezi
a G
iulia
Um
bria
Sici
liaPu
glia
Pied
mon
tLo
mba
rdy
Mar
che
Abru
zzo
Ligu
riaM
olis
eLa
zio
Tusc
any
Emilia
−Rom
agna
(d) Italy Regions and neighbours
Figure 4: Bottom-up measurement of subnational culture indicates substantial within-country cultural sim-ilarity. (A) subnational units in Spain are less distant from one another than from European cultural neighbors of Germany, Italy,or France. (B) French regions are culturally closer to one another than to European neighbors. (C) German regions demonstrategreater similarity to one another than to European neighbors. (D) Italian regions are culturally less distant to one another than to theirEuropean neighbors. subnational units in A-D are represented with boxplots that show the distance distribution between a given regionand all other regions within the country under analysis. In the case of neighboring countries, boxplots show the distance distributionbetween that neighboring country and all the regions within the country under analysis.
Belgium and the Netherlands in the 1830s and the Partition of Ireland in the 1920s. Overall, this suggests the
importance of national boundaries in shaping cultural distances. It also suggests that our measure captures deep
cultural elements that persist over longer periods of time.
Do subnational cultures as measured via our Facebook data cluster together in a sensible manner? To ex-
8

Figure 5: Bottom-up measurement of subnational culture returns sensible clustering of subnational units.Facebook culture vectors drawn from the states of the United States cluster together in an unsupervised manner into traditional regionaland cultural groupings. South Carolina bears similarity to North Carolina, Montana to Wyoming, New Jersey to New York, and WestVirginia to Kentucky. Similarities are not strictly geographic, with Alaska bearing similarity to New Hampshire and North Dakota, forexample.
amine this question we calculate cosine distances for U.S. states and perform unsupervised clustering using
the Ward linkage method (see Methods). Figure 5 presents the resulting dendrogram. The clusters return tra-
ditional regional and cultural groupings. For example, states in the U.S. Midwest are placed in proximity to
one another, as are the states in the U.S. South. Interestingly, mountainous and more rural states also cluster
together, with Alaska being closest to states like North Dakota, Idaho, and New Hampshire, despite the sub-
stantial geographic distances between them. This supports the idea that important cultural features are shaped
by the physical environment67.
Figure 4 demonstrates that regions within countries can bear substantial similarity to one another. However,
not all countries are likely have the same amount of within-nation cultural similarity. Do some countries
have more regional cultural variation within them than do others? Figure 6 examines countries according to
their interregional cultural divisiveness, or the average cultural distance between regions within a country (see
Methods). Figure 6A ranks 18 selected countries in increasing order of interregional divisiveness. Two findings
stand out in Figure 6A. First, developed countries exhibit smaller interregional divisiveness as compared to
developing countries, suggesting they benefit from greater cohesiveness between regions. Second, within the
9

Germany
India
0.00
0.05
0.10
0.15
0.20
GB PT IE FR IT NL DE TH US BR BE SV ES KE MUNGMX INCountry
Divisiveness
(a) Population-weighted regional divisiveness
Baden−WürttembergBayern
Hessen
Niedersachsen
Nordrhein−Westfalen
Rheinland−Pfalz
Saarland
Schleswig−Holstein
Brandenburg
Mecklenburg−Vorpommern
Sachsen
Saxony−Anhalt
Thüringen
Baden−WürttembergBayern
Hessen Niedersachsen
Nordrhein−Westfalen
Rheinland−Pfalz
Saarland
Schleswig−Holstein
Brandenburg
Mecklenburg−Vorpommern
Sachsen
Saxony−Anhalt
Thüringen
(b) Germany
Andhra Pradesh
Assam
Chandigarh
Dadra and Nagar Haveli
Delhi
Gujarat
Haryana
Himachal Pradesh
Jammu and Kashmir
Kerala
Maharashtra
ManipurMeghalaya
Karnataka
Nagaland
Puducherry
Rajasthan
Tamil Nadu
TripuraWest Bengal
SikkimArunachal Pradesh
Mizoram
Daman and Diu
Bihar
Madhya Pradesh
Uttar Pradesh
Chhattisgarh
Jharkhand
Uttarakhand
Andhra Pradesh
Assam
Kerala
Manipur
Meghalaya
Karnataka
NagalandOdisha
Puducherry
Tamil Nadu
Tripura
Sikkim
Arunachal Pradesh
Mizoram
Goa
Telangana
(c) India
Figure 6: Regional divisiveness. (A) Population-weighted regional divisiveness for 18 countries (range for number of regions:[3, 76]). Countries included are: BE: Belgium, BR: Brazil, DE: Germany, ES: Spain, FR: France, GB: Great Britain, IE: IN: India,Ireland, IT: Italy, KE: Kenya, MU: Mauritius, MX: Mexico, NG: Nigeria, NL: Netherlands, PT: Portugal, SV: El Salvador, TH:Thailand, US: United States. We chose these 18 countries to have a mix of developed countries and developing countries, as wellas a mix of large and small countries. (B) Geographical map and network of regions in Germany (13 regions). Two communitiesof regions are detected. (C) Geographical map and network of regions in India (34 regions). Three communities of regions aredetected. Networks are constructed from nodes as regions, and links are weighted by standardized cosine similarity between regions.Communities are detected using a multi-level modularity optimization algorithm (Louvain method)72. Nodes are resized proportionallyto region population, and are colored according to community affiliation. Links are colored according to adjacent nodes, with lowertransparency applied to higher weight links. Map regions are colored according to communities calculated from the correspondingnetwork.
10
group of developed countries, the three countries with the least interregional cohesiveness are Belgium, Spain
and the United States. The first two have well-known regional issues, with threats of secession, whereas the
third is a large geographic nation.
Figure 6B-C displays the geographical maps and networks of regions in Germany (13 regions) and regions
in India (34 regions), respectively. We detect two communities of regions in Germany (see Methods), which
map closely to the historical east-west divide in the country, suggesting this cultural divide still persists to this
day. We detect three regional communities in India, which correspond roughly geographically with linguistic
regions defined by the language families spoken within the country.
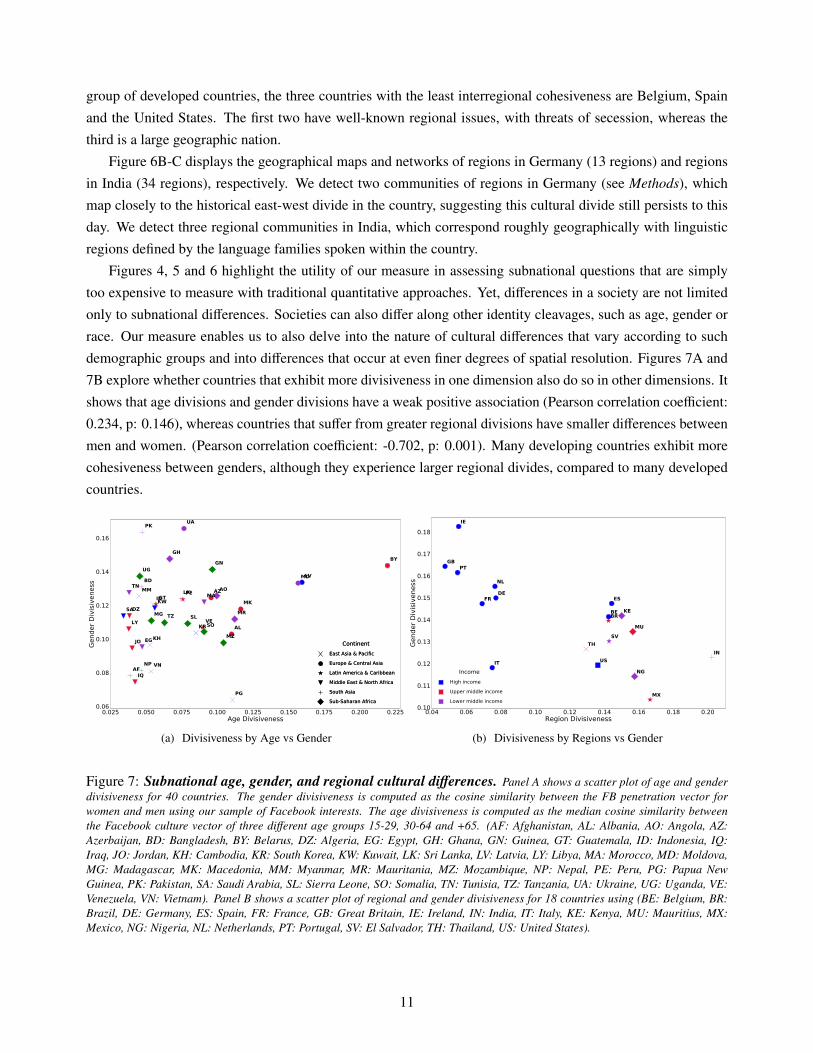
Figures 4, 5 and 6 highlight the utility of our measure in assessing subnational questions that are simply
too expensive to measure with traditional quantitative approaches. Yet, differences in a society are not limited
only to subnational differences. Societies can also differ along other identity cleavages, such as age, gender or
race. Our measure enables us to also delve into the nature of cultural differences that vary according to such
demographic groups and into differences that occur at even finer degrees of spatial resolution. Figures 7A and
7B explore whether countries that exhibit more divisiveness in one dimension also do so in other dimensions. It
shows that age divisions and gender divisions have a weak positive association (Pearson correlation coefficient:
0.234, p: 0.146), whereas countries that suffer from greater regional divisions have smaller differences between
men and women. (Pearson correlation coefficient: -0.702, p: 0.001). Many developing countries exhibit more
cohesiveness between genders, although they experience larger regional divides, compared to many developed
countries.
0.025 0.050 0.075 0.100 0.125 0.150 0.175 0.200 0.225Age Divisiveness
0.06
0.08
0.10
0.12
0.14
0.16
Gend
er D
ivisi
vene
ss
AF
AL
AOAZ
BD
BY
DZ
EG
GH
GN
GTID
IQ
JO KH
KR
KWLK
LV
LY
MA
MD
MG
MK
MM
MR
MZ
NP
PE
PG
PK
SASL
SO
TN
TZ
UA
UG
VE
VN
ContinentEast Asia & PacificEurope & Central AsiaLatin America & Caribbean Middle East & North AfricaSouth AsiaSub-Saharan Africa
ContinentEast Asia & PacificEurope & Central AsiaLatin America & Caribbean Middle East & North AfricaSouth AsiaSub-Saharan Africa
(a) Divisiveness by Age vs Gender
0.04 0.06 0.08 0.10 0.12 0.14 0.16 0.18 0.20Region Divisiveness
0.10
0.11
0.12
0.13
0.14
0.15
0.16
0.17
0.18
Gend
er D
ivisi
vene
ss
IE
GB
FR
PT
DE
NL
IT
BE
THSV
KE
ES
US
BR
MU
NG
MX
IN
IncomeHigh incomeUpper middle incomeLower middle income
(b) Divisiveness by Regions vs Gender
Figure 7: Subnational age, gender, and regional cultural differences. Panel A shows a scatter plot of age and genderdivisiveness for 40 countries. The gender divisiveness is computed as the cosine similarity between the FB penetration vector forwomen and men using our sample of Facebook interests. The age divisiveness is computed as the median cosine similarity betweenthe Facebook culture vector of three different age groups 15-29, 30-64 and +65. (AF: Afghanistan, AL: Albania, AO: Angola, AZ:Azerbaijan, BD: Bangladesh, BY: Belarus, DZ: Algeria, EG: Egypt, GH: Ghana, GN: Guinea, GT: Guatemala, ID: Indonesia, IQ:Iraq, JO: Jordan, KH: Cambodia, KR: South Korea, KW: Kuwait, LK: Sri Lanka, LV: Latvia, LY: Libya, MA: Morocco, MD: Moldova,MG: Madagascar, MK: Macedonia, MM: Myanmar, MR: Mauritania, MZ: Mozambique, NP: Nepal, PE: Peru, PG: Papua NewGuinea, PK: Pakistan, SA: Saudi Arabia, SL: Sierra Leone, SO: Somalia, TN: Tunisia, TZ: Tanzania, UA: Ukraine, UG: Uganda, VE:Venezuela, VN: Vietnam). Panel B shows a scatter plot of regional and gender divisiveness for 18 countries using (BE: Belgium, BR:Brazil, DE: Germany, ES: Spain, FR: France, GB: Great Britain, IE: Ireland, IN: India, IT: Italy, KE: Kenya, MU: Mauritius, MX:Mexico, NG: Nigeria, NL: Netherlands, PT: Portugal, SV: El Salvador, TH: Thailand, US: United States).
11

Figure 8: Local cultural similarities of California counties. Figure represents a dendrogram for California counties,based on cosine distances and Ward linkage method. In this figure we examine interests with at least 20,000 users in the state, and incounties with a population of more than 75,000 users. Our unsupervised clustering returns clusters that are culturally sensible. LosAngeles County is closest to Orange County, Tulare County is most similar to Stanislaus County, Santa Cruz County is proximal to SanLuis Obispo County, and San Francisco County is nearest Marin County.
Further, our data enables us to investigate cultural similarities and differences at even higher spatial res-
olution. Figure 8 depicts the dendrogram of the cultural clustering of the most populous California counties.
Geographically disparate but culturally similar counties – such as coastal surfing communities of San Luis
Obispo and Santa Cruz as well as the rural inland counties of Imperial and Butte – are located next to one
another in the dendrogram. Generalizing this approach would allow us to identify which local areas culturally
diverge from the rest of the nation in which they are located, a phenomenon that might provide insight into
regional political disaffection.
12
AL Frou Frou, United States Department of Commerce, GameZone, UAB Blazers men’s basketball, Harvard Crimson football,Indoor soccer, Traffic, Talladega Superspeedway, Hans Zimmer, Milo (drink), Shoal, Crow’s feet, Nick Saban, University ofAlabama at Birmingham, Gulf Shores, Auburn Tigers, Auburn Tigers football, NCAA Football Division 1 championship,Mobile, Auburn University, al.com, Alabama Crimson Tide, Alabama Crimson Tide football, University of Alabama
AK Excursion, Maccabi Tel Aviv Basketball Club, Systems engineering, Shockwave (Transformers), Nissan H engine, HospitalCorporation of America, Liquified Natural Gas„ Sinergia, Beauty Shop, Pyrotechnics , Ravex, Bryan Adams, Sustainabledevelopment, Meal, Hydrographics (printing), Advanced Micro Devices, Magnetic field, Law and order (politics), Poorposture, Palete (paint), Outlook.com, Small appliance, Sebastian, Bass Guitar, Baby, Paul Simon, Shareholder, Cephalopodink, Air freshener, Cervical vertebrae, True Colors (song), Sourdough, Popular Mechanics, Arctic Ocean, BP, Elopement(marriage), Alaska Aces (PBA), Dividend, Lifejacket, Conglomerate (company), Gold Miner, Air force, Medical imaging,Cigna, Homer, Valdez, Ocimum basilicum, Monopoly, African National Congress, Matsu Islands, Rangifer tarandus, Sleddog, Jack White, Club, North Pole, Raven, Denali National Park and Preserve, Alaska Natives, GCI (company), Salmon,Alaska Airlines, Arctic
AZ Monsoon, Laser lighting display, Foreign language, Super Bowl XLVIII, Spritzer, Saguaro National Park, Super BowlXXX, Barrett-Jackson, Kodi, Super Bowl LI, John Madden, Steve Nash, Hot 98.3, American Physical Society, AnthonyMackie, Karl Urban, Superstition, Arizona Coyotes, Surprise, The Phoenix (newspaper), Northern Arizona University,sonoran desert, Larry Fitzgerald, Phoenix International Raceway, Arizona Diamondbacks, University of Arizona, PhoenixSuns, State University of Arizona, FOX 10 Phoenix, ABC15 Arizona
AR Catholic University Sports Club, Canis rufus, FINA, The Rev, asa, Eureka (U.S. TV series), John 3:16, Mallard, MountainHome, The Call (2013 film), National Education Association, White River (Arkansas), Eureka, Tom Cotton, Colton, Hi-bachi, Channel 7 (Thailand), Sus scrofa domestica, N.W.A., Arkansas State University, Arkansas Razorbacks, University ofArkansas
CA University of California, San Diego Zoo Safari Park, California Academy of Sciences, Palm Desert, Univision 34 Los Ange-les, Oakland Athletics, Algeria, Los Angeles Kings, California State Assembly, NBC Bay Area, Tea house, Staples Center,Placer County, KRON-TV, San Jose Sharks, Six Flags Magic Mountain, Golden Gate Bridge, San Francisco Chronicle, BigBear Lake, KGO-TV, Monterey Bay Aquarium, City manager, ABC7 News, Gavin Newsom, La Jolla, Fox 11 Los Angeles,KTVU, University of California Berkeley, California Lottery, Universal Studios Hollywood, KTLA, abc7, KABC-TV, LosAngeles Times
CO Christian Social Union in Bavaria, Belly dance, Zeds Dead, Shire of Noosa, Check It Out! (Canadian TV series), TheGazette (Montreal), Regenerative medicine, Polis, The Wild Animal Sanctuary, Blockbuster LLC, The Thin Blue Line(emblem), Masterpiece (TV series), Miguel de Cervantes, New Belgium Brewing Company, Bad Influence (professionalwrestling), University of Denver, Bassnectar, Anschutz Entertainment Group, Energy supply, Pepsi Center, Rocky Moun-tain National Park, Colorado Avalanche, University of Colorado Boulder, Denver International Airport, Denver Nuggets,Colorado Rockies, Red Rocks Amphitheatre, KUSA (TV)
CT Metro-North Railroad, Bomba (radio), Subsidy, First grade, Hebron, Chris Murphy (politician), Crossing level, SacredHeart University, Newsroom editorial, Dimension stone, Cava (Spanish wine), Connecticut Huskies men’s basketball, TheBig E, Women’s basketball, UConn Huskies, Yale University, University of Connecticut, NBC Connecticut
DE Mustela putorius furo, El Diablo (comic), Jack Russell terrier, Nemours, Apostolos Andreas, Half Baked, Crowdsourcing,Joiner, Fire, Terracotta Army, Community gardening, Marine salvage, Roman legion, Free public transport, Betn, Oslo,Women’s National Basketball Association, Harvest (wine), Cold Case, Hammocks, Joe Biden, Leader (2010 film), TheNews Journal
FL Airline ticket, Enrique Santos Discepolo, Dunedin, Greyhound Race, Aventura Mall, Cuban cuisine, Bureau of LaborStatistics, Miami Marlins, World Baseball Classic, The Pichy Boys, Pincho, Tampa International Airport, JacksonvilleJaguars, Agustin of Hippo, Lake Worth, Fox 35 WOFL, WPLG, Downtown Disney (Walt Disney World), Tampa Bay Rays,Disney’s Hollywood Studios, WESH, Wikipedia, Orlando International Airport, Busch Gardens Tampa, Hialeah, WOFL,Marco Rubio, Florida State Seminoles football, SeaWorld Orlando, WTSP, Tampa Bay Buccaneers, Natural Circus„ SpaceCoast, Cruise line, Miami Dolphins, Epcot, Republican Party of Florida, University of South Florida, Hollywood, Universityof Miami, Havana, ABC Action News - WFTS/TV, Florida Gators, Mysterious Client, Florida Gators football, Universityof Central Florida, FOX13 & myfoxtampabay.com, WFTS-TV, WFLA News Channel 8, WFTV, Florida State University,Miami Beach, The Bahamas, Universal Studios Orlando, University of Florida, Cuba
GA 5FM, Dress Up, Ray Charles, Angels Among Us Pet Rescue, Settler, Georgia Institute of Technology, Food court, AtlantaHawks, AJC, Atlanta Braves, 11Alive, Georgia Bulldogs football, Atlanta Falcons, Georgia Bulldogs, WAGA-TV, TheAtlanta Journal-Constitution
HI Sashimi, Ginza, Macadamia, Philippine cuisine, YG Entertainment, Inertia, Windsurf, Palaos, Mick Fanning, Billabong,American Wrestling Association, Red Bull Racing, Line Camera, Ryan Higa, Gheorghe Hagi, Kapuso Mo, Lexus NX,Anne Curtis, Hokkaid, Economy class, Jollibee, Avex Group, Nepeta cataria, Toni Gonzaga, Bodyboarding, Nissan 350Z,Iration, The Nice, Roots reggae, LINE, Rip Curl, Disney Tsum Tsum, Bruni, Sarah Geronimo, Driver, All Nippon Airways,Blue Planet (role-playing game), Lion Dance, Kia Rio, Uplifting trance, TV Patrol, Kitesurfing, Yellowfin tuna, ProfessionalAssociation of Diving Instructors, Mai Tai, Kia Soul, Soldiers of Jah Army, Cebu, The Filipino Channel, Surfing Magazine,Angel Locsin, Stain removal, Major Lazer, Kilusang Bagong Lipunan, Taro, Nanoparticle, Philippine Airlines, Hit and run,Aloha shirt, Canterbury, Osaka, Itsjudytime, Pearl Harbour Attack, Damian Marley, Barangay
13
ID Tommy, Master formula, Sugar beet, Jim Rohn, Mendoza City, Black Swan (film), McCain Foods, Lip liner, Bengala, Rigby,Axiom, Organic Horticulture, Idaho Republican Party, Albin, Mosc, Melaleuca, Democratic Call, McCall, K12 (education),Broncos, Idaho State University
IL Uptown, Pilsen, History of the Chicago Bears, University of Illinois at Chicago, Luis Gutiérrez, Kankakee, MillenniumPark, Lollapalooza, Jimmy Butler, Goose Island Brewery, University of Chicago, Express mail, Chicago Transit Authority,Chicago (band), Chicago Sun-Times, The Art Institute of Chicago, Allstate Arena, United Center, O’Hare InternationalAirport, Chicago Fire (TV series), Consumer protection, Canada Goose (clothing), Wrigley Field, Chicagoland Speed-way, University of Illinois Urbana-Champaign, Portillo’s Restaurants, Chicago Loop, Chicago White Sox, Chicago PoliceDepartment, WFLD, WGN-TV, Chicago Tribune, Chicago Blackhawks, ABC 7 Chicago, Chicago Bulls
IN john mellencamp, SpongeBob SquarePants (character), 8 Seconds, College soccer, Victor Oladipo, Network 18, Marketingresearch, Notre Dame Fighting Irish, Butler University, Carmel-by-the-Sea, Indianapolis 500, Notre Dame Fighting Irishfootball, Joe Donnelly, University of Notre Dame, Indiana Hoosiers men’s basketball, Purdue University, Indiana Pacers,Indianapolis Colts, WXIN, Indiana University
IA Electrical oven, Australian rules football positions, Cash and carry, Conference hall, Diagnostic and Statistical Manual ofMental Disorders, Chewable candy, Shawn Johnson, Rock Island (Illinois), Ashley Furniture Industries, Community school(England and Wales), Iowa Hawkeyes, Iowa State University, University of Iowa
KS Pillar, Massage chair, Martina McBride, Information and communications technology, Auditorium, Wichita State Shockers,Helianthus, Kansas Speedway, Kansas Jayhawks, Kansas Jayhawks men’s basketball, Kansas State University, Kansas CityChiefs, Kansas (band)
KY Lakewood Church Central Campus, Sandalwood, Ashley Judd, Maker’s Mark, Lutjanidae, Eden Hazard, House of Bourbon,Bruce Willis, Folk music of England, Buffalo Trace Bourbon, Wildcat, Lazy river, Epinephelinae, Jim Beam, DeMarcusCousins, Woodford Reserve, Buffalo Trace Distillery, Medical assistant, Dental assistant, Mitch McConnell, Derby ofKentucky, Felis silvestris, Bourbon Whiskey, Kentucky Wildcats, University of Kentucky
LA Watts, Serbian Radical Party, Bourgeois , Concrete slab, Tubular bells, Pyhimys, Emeril Lagasse, Treme (TV series), Lour-des, Society of Jesus, Aretha Franklin, Ante Christum Natum, Ulm, Zeus, West Bank, Nine Network, Swamp pop, Gonzales,Basketball Hall of Fame, Hemline, French language, Iberia, Bowfishing, Street furniture, Tabasco, Float (parade), Minden,Housing association, Roux, Orleans, Tabasco sauce, Jambalaya, Channel 5 (UK), Parish, Smoothie King, Lily flower, NewOrleans Jazz & Heritage Festival, Raising Cane’s Chicken Fingers, Daiquiri, Po’ boy, United States Department of Home-land Security, WTHI-TV, French Quarter New Orleans, New Orleans Pelicans, Carnival, Drew Brees, Cajun cuisine, lsutigers, King cake, Lake Charles, lsu, Bayou, Mardi Gras, Cajun
ME Gramofon, Silly, MultiMediaCard, Swordfish, Per diem, Otto Waalkes, Mase, otto, Powiat, Turmaline, Ja Rule, Cover letter,JCB (company), Vaccinium, Closer (2004 film), Spose, Dragonfly, Adult education, Synchronization, Paranormal Activity,Freeport (Bahamas), Arlington National Cemetery, Haddock, Aura (parapsychology), Sustainable energy, Automated tellermachine, Patrick Dempsey, The Crown, Great Apple, Aura Dione, Park ranger, Savings Bank, Propane, Sugarloaf Mountain,Bob Marley, Fishery exploitation, University of Maine
MD Signature dish, United States Naval Academy, Egg white, Madonna fashion brands, Johns Hopkins University, Ray Lewis(track and field athlete), WBFF, Baltimore Orioles, The Baltimore Sun, University of Maryland, History of the BaltimoreRavens, Baltimore Ravens
MA Rede Globo, Life annuity, Greater Sudbury, Primark, Harvard Medical School, Norma (technology), Berklee College ofMusic, Commuter rail, Boston Marathon, Master of Fine Arts, National Lottery United Kingdom, University of Boston,Massachusetts Institute of Technology, WHDH (TV), Mass, The Boston Globe, WCVB Channel 5 Boston, WCVB-TV
MI Kontinental Hockey League, Rosa Parks, Miguel Cabrera, Sparty, Machine shop, Grand Hotel (Mackinac Island), UnitedAutomobile Workers, Pontiac, Water polo, Michigan International Speedway, Chuck, North American International AutoShow, Michigan Wolverines, Gant, TV8 (Turkey), Nassar, Henry Ford, Michigan State Spartans football, Novi, MichiganWolverines men’s basketball, Kalamazoo, Michigan State Spartans, WDIV-TV, Lansing, Detroit Free Press, WXYZ-TV,Detroit Pistons, Detroit Red Wings, Michigan Wolverines football, Detroit Lions, Meijer, University of Michigan, MichiganState University, Detroit Tigers, Pure Michigan, Great Lakes
MN Sirius, Purple Rain (album), Punter (football), Bauhaus, Martin Luther, Hells kitchen, Red Digital Cinema Camera Com-pany, Caucus, Skol, Current TV, Target Center, First Avenue (nightclub), Minneapolis Saint Paul International Airport,Minnesota Golden Gophers football, Fortification, Al Franken, Minnetonka, Minnesota Timberwolves, KMSP-TV, KARE,University of Minnesota
MS Australian Defence Force, Merit (Buddhism), Saint Dominic, Free area of the Republic of China, Kicker (sports magazine),Bertrand Russell, Skybox (video games), Juju (singer), Nationalist Movement Party, Acadiana, Big K.R.I.T., Pier (architec-ture), Dionysus, anna, Second base, Treasure hunting, Cowbell (instrument), Casabella, Wicker, Hideaway, University ofMississippi, Mississippi State University
MO Hannibal (TV series), Drury University, St. Peter’s Basilica, George Soros, The Fugitive (1993 film), KTVI, Fiscal, ForestPark (St. Louis), St. louis blues, Fox2Now, University of Missouri, St. Louis Cardinals
MT Wine and food matching, The Jam, Bracket (tournament), Lucca, Escapology, Buddhahood, Kroger 250, Crocus sativus,Bill Pullman, Twisted Sister, Calgary, Talib Kweli, Goldsmith, Gareth Bale, Pasty, Crow Nation, Onsen, Mission Valley,Mint.com, Alberta, Mike Will Made It, Top hat, Lewis and Clark Expedition, Grizzly bear, Glacier National Park, Crosscountry running, Great Falls, Big Sky Conference
14

NE Emporium, Vega, Oneworld, Clock tower, Jake Olson Studios, Pork steak, Spareribs, Kolache, Strip steak, Take-Two Inter-active, UANL Tigers, Pinewood Studios, Old Market (Omaha, The Good Life (band)), Nippon Television, Airport lounge,Cornell University, Scooter (band), Abraham Lincoln, WOWT, University of Nebraska-Lincoln
NV Glazier, Pereira, Los Angeles Sparks, Sportsbook, Just Do It, Green Man, Mexico’s beers, Tao, Country blues, Paris LasVegas, William Hill (bets), Law empire, Mac Mini, Rick Harrison, Gene Simmons, MGM Grand Garden Arena, Sin City(film), Circus Circus Las Vegas, Dean Martin, Absinthe, Panasonic Corp, List of mayors of Las Vegas, Sahara Desert, PlanetHollywood Resort and Casino, Hakkasan, Palace, LVH Las Vegas Hotel & Casino, IMac, Truckee, The Mirage, PalmsCasino Resort, ARIA Resort & Casino, Nen, Cineplex Entertainment, Sierra Nevada (U.S.), Ol’ Dirty Bastard, CaesarsPalace, Flamingo Las Vegas, Las Vegas Motor Speedway, MacBook, Encore Las Vegas, Bellagio (resort), Mandalay Bay,Wynn Las Vegas, Sparks (Nevada), Fremont Street Experience, MGM Grand Las Vegas, The Venetian Las Vegas, LagoTahoe, Las Vegas Strip, Judi
NH Focus, SIG Sauer P239, LaBelle, Social studies, Millennium, Keno, White Mountain, Market basket, Treasurer, Weighingscale, Alfred Hitchcock
NJ Holiday Magic, Narendra Modi, Caesars Atlantic City, Open Rights Group, Epic Vines, Empanada, Tropicana Casino &Resort Atlantic City, New Jersey Devils, Bruce Springsteen, Six Flags Great Adventure, Rutgers University, ShopRite(United States), Jersey Shore
NM Concerto, Jinja (Uganda), Cuauhtemoc, Makeup Artist, Opel Mokka, Chihuahua, Montreal Expos, Roadrunner Records,Apodaca, Lil Rob, Artist collective, Horse harness, Palette, Saddle blanket, Río Grande, Benito Juarez, Forest, Grupo of15, Triple J, Better Call Saul, Baby Bash, Los Alamos National Lab, New Mexican cuisine, Launchpad, Daily Times (Pak-istan), Gallup survey, Blood In Blood Out, Adobe, Wyndham, Martinez, New Spain, Navajo Nation, Argentina provinces,Independiente Santa Fe (soccer), Sandia National Laboratories, Holly Holm, Chile
NY Guyana, Chelsea (Manhattan), Lower East Side, Moovit, New York Major, Tribeca, Upper East Side, Renminbi, BuffaloSabres, Syracuse University, New York University, Newsday, State University of New York, The Citizen, History of theBuffalo Bills, Emergency status, Juno
NC Davidson College, The Orange Peel, Bastion, DeAngelo Williams, SouthPark (Charlotte neighborhood), Carolina Hurri-canes, Charlotte Motor Speedway, Wake Forest University, Charlotte Hornets, FOX8, Duke University, North Carolina TarHeels, WSOC-TV, North Carolina Tar Heels men’s basketball, Research Triangle, University of North Carolina at ChapelHill
ND Fargo (TV series), Minotaur, Sloppy Joe, Radiating Floor, Iron Cross (band), Miniature horse, Toronto Blue Jays, Airbrushmakeup, Bully (2011 film), Sweet onion, Cherry tomato, Environmental protection, Blow, Kiwifruit, Cutter (wrestling),Diamond cutting, Desmonte, Antonn Dvok, Next plc, Bowling (cricket), Verizon VIP Tour, Hanson, Kudos (productioncompany), Noodle Soup, Warehouse club, Vendor, Asparagus, The Big One (NASCAR), Winnipeg, Tutti frutti (food),Fergie, Canadian Pacific Railway, Human resources, Railroad classes, Teppanyaki, Roadhouse (facility), Board certification,Contemporary hit radio, Rooster, Food cooperative, Manitoba, Thermostat, Stove (heater), Josh Duhamel
OH Kilimanjaro, Epiphone, JR Smith, 3 Austria Top 40, Biodiesel, Kettering, Lebron James 23, Morning glory, UniversityHospital, Developmental disability awareness, Kevin Love, University of Ohio, Cleveland Cavaliers on 247Sports, LGBTsocial movements, Ohio State Buckeyes men’s basketball, The Plain Dealer, Cleveland Browns, Buckeye, 200708 ClevelandCavaliers season, Cleveland Indians, Lake Erie, WJW (TV), Ohio State Buckeyes, Cleveland Cavaliers, Ohio State Buckeyesfootball, Ohio State University
OK Silversea, Austin Metro, Cushing, WFXT, Television South, Twister, Rhema, Enes Kanter, Corporate identity, Altus, TexasLonghorn, Dren, Oklahoma State Cowboys baseball, Aeroelasticity, Fallin, Serge Ibaka, Hollyoaks, OKC Thunder on247Sports, Sharpe (TV series), Velociraptor, Kevin Durant, Petting zoo, Outlaw country, Stillwater, Cuff, Red Dirt (music),Russell Westbrook, Oklahoma Sooners, Oklahoma State UniversityStillwater, Oklahoma Sooners football, University ofOklahoma
OR Kiefer Sutherland, Seaside, Clog, Food trucks, Wilco, Portlandia (TV series), Damian Lillard, Le Figaro, Portland Timbers,Jerry Brown, Moda Center, Oregon State University, Oregon Ducks football, Willamette River, Portland Trail Blazers,KPTV, University of Oregon, Portland International Airport
PA The Bon-Ton, Blue Bell, Edgar Winter, Pittsburgh Panthers, Pittsburgh Panthers football, University of Temple, Penn StateNittany Lions, University of Pittsburgh, Pennsylvania State University
RI Barranquilla, Cable car, Teatro Colón, Awakenings, Venda, Immersion (virtual reality), Anti-aircraft warfare, Supernova,Bologna, Virtual Private Network, Austrian Hockey League, Tilly’s, Siena, Colosseum, Prosecco, Kids club, Swansea,Department of Health (United Kingdom), The Andes, Providence Bruins, Edible Arrangements, Tulip, Strand, Paul vanDyk, Brown University, Oyster bar, NBC10 Philadelphia, WJAR
SC Sem, Solicitor, Darlington Raceway, Windows Vista, Okra, The Citadel, Car Town, Fencing, WACH, Dropkick Murphys,Home appliance, Moon, Clemson Tigers, Clemson Tigers football, South Carolina Gamecocks, University of Columbia,Clemson University, University of South Carolina
SD Geographic information system, Crazy Horse, Hitch, Sun News (India), Broasting, Chipmunk, Rosebud, Cantons ofSwitzerland, Food marketing, Karisma Kapoor, Personal Integrity, Say Anything, Milky Way, Giovanni Sio, Maxwell(soccer player), Box Lacrosse, Jonas Bjrkman, Hypnosis, Pepper, Pheasant, Agricultural show, San Diego State University,Storm chasing, Lakota people, Mount Rushmore, Kota, Black Hills
15
TN Samsung Galaxy Note II, Google Nexus, Samsung Galaxy Note 3, Johann Heinrich Friedrich Link, Samsung Galaxy Note4, Samsung Galaxy S4, Samsung Galaxy S5, Samsung Galaxy S6, Samsung Galaxy S III, IPad 2, Bodyguard, Populus,Mobile Bank, Seedling, Bonnaroo, TriStar Pictures, Brentwood, Dollywood, Memphis Grizzlies, Vanderbilt University,History of the Tennessee Titans, Tennessee Titans, Network Ten, Tennessee Volunteers football, University of Tennessee
TX Alicia Villarreal, Telemundo Houston, Election day, Monterrey Football Club, Cantera (soccer), Chow Chow, Jeweler, SanAntonio Spurs on 247Sports, Lamar University, Texas Longhorns men’s basketball, Central Market (Texas), UK Inde-pendence Party (UKIP), Texas A&M Aggies, The Island (2005 film), Texas A&M Aggies football, South by Southwest,Tamaulipas, Baylor University, San Antonio RiverWalk, Quest, University of Houston, Bimbo Group, Center, South PadreIsland, Texas Tech University, Texas State University, Local H, Alamo Mission in San Antonio, University of North Texas,University of Texas System, The Dallas Morning News, Texas Longhorns, Texas Longhorns football, La Mafia, WFAA,Ram Gopal Varma, FOX 26 Houston, Sugar Land, Gallery Furniture, Houston Livestock Show and Rodeo, Houston As-tros, Houston Chronicle, FOX 4 News, Texas Parks and Wildlife Department, KHOU, 5miles, KTRK-TV, Houston Texans,Texas Hill Country, San Antonio Spurs, Greg Abbott, University of Texas at Austin, Dallas-Fort Worth International Airport,Whataburger, H-E-B
UT Deron Williams, Amanda Miguel, Short Selling, Good Charlotte, La La Land (film), Holi, Task force, Elektra Records,Mission (LDS Church), Gordon Hayward, Hyundai Accent, Fairy godmother, Star Trek II: The Wrath of Khan, Zermatt,Forecasting, Stake, Donny Osmond, Transformers (toy line), Leandro & Leonardo, Jordan river, Elevate, Temple (SUD),Homie, Ward (LDS Church), Drainage, Roy, Cotopaxi, Draper, Zion National Park, Best Friends Animal Society, DavidArchuleta, Scottish League Cup, Price, This Morning (TV programme), The Piano Guys, Temple (SUD), Real Salt Lake,FamilySearch, Mitt Romney, Southland Conference, Mormon Channel, Cafe Rio, Book of Mormon, Joseph Smith, BrighamYoung University, Utah Jazz, Mormon, University of Utah, The Church of Jesus Christ of Latter-day Saints in Hawaii,History of The Church of Jesus Christ of Latter-day Saints, Latter Day Saint movement, KSL-TV
VT Cray Inc., ECCO, Australia and New Zealand Banking Group, Shopping bag, George Orwell, Fancy-Dress Party, Carina,350.org, Political movement, Bureau of Alcohol, Berna, Shawarma, The Wood, Mountain Equipment Co-op, Ethan Allen(furniture company), City Market (US grocery store chain), Compost, Eye (cyclone), Charcuterie, Prohibition in the UnitedStates, Water supply, New York City Police Department, The Alchemist (novel), Phish, BTV (Bulgaria), RT (TV net-work), Alderman, Montreal, Seventh Generation, Burton Snowboards, Lockheed Martin F-35 Lightning II, Hilton Hotels,Irish pub, The Nature Conservancy, Green Mountain, King Arthur Flour, Sheraton Hotels and Resorts, Oktoberfest, Localconsumption, Ben & Jerry’s, Cider, Maple syrup, U.S. Senator Bernie Sanders, University of Vermont
VA Apple cider, George Mason University, Squash, The National, Tim Kaine, Rayo Vallecano, University of Virginia, VirginiaPolytechnic Institute and State University, Newport News, Virginia is for Lovers
WA Swan Lake, Vancouver Island, Habanero, Container garden, Mini-bar, Bill and Melinda Gates Foundation, Noise pollu-tion, Whistler, Epicureanism, The News Tribune, The Stranger, Melinda Gates, Millwork (building material), WashingtonHuskies football, Road Violence, Macklemore, Evergreen, 12th man (football), Washington Huskies, Pete Carroll, Wash-ington State University, Pike Place Market, Seattle Sounders FC, Rowing, Seattle Seahawks on 247Sports, MarshawnLynch, Mount Rainier, Seattle Mariners, University of Washington, Richard Sherman, KCPQ, Richard Sherman (americanfootball), KING-TV, KIRO 7 News, Russell Wilson, KIRO-TV, Puget Sound, The Seattle Times
WV Reproductive rights, ABP News, Clutch, SuperCity, Andrew McCutchen, Naloxona, Boxing ring, Snuff (tobacco), Canaan,Delegate, Civil service, Mitsubishi Outlander, Modem, The Ring, Metroxpress, Jennifer Garner, Telegram, County commis-sion, Marshall Thundering Herd football, WCW Monday Nitro, Pepperoni, Political geography, Big Buck’s, Coal mining,Marshall University, Brad Paisley, Appalachian, Hiking, West Virginia University
WI Dizzy Gillespie, Road America, Gastroenterology, Milwaukee Admirals, Giannis Antetokounmpo, Bay View, WAXX, MadCity (film), Carl Maria von Weber, Miller Brewing Company, Lake Geneva, Orange Bowl, Marquette University, Fish fry,Charles Woodson, Pabst Blue Ribbon, The Rave / Eagles Club, Eddie Lacy, Clay Matthews III, Brett Favre, Summerfest,Supper club, Pro Bowl, Green Bay Packers on 247Sports, Wisconsin Badgers football, Wisconsin Badgers men’s basketball,Wisconsin Badgers, University of Wisconsin-Madison, Green Bay Packers
WY Chapters, Table Mountain, Maternal bond, Quill, Sore (band), Excalibur (film), Benchmarking, Sapporo, Public service,Polydor Records, Garter (stockings), Casper the Friendly Ghost, Bring It On, All That Remains, Green River (band), ColdStone Creamery, Ribs (food), Grand Teton National Park, Gillette (brand), Cod, Air medical services, Fremont (California),Cartridge (firearms), Medical emergency, Mountain range, Casper (film), Fish and chips, Mountain West Conference, Diving
Table 1: Cultural outliers for U.S. states. This table shows for each US state the cultural outliers computed as an interest thatpresents a penetration in that state that is at least twice higher than that interest’s share in any other U.S. state. Any interest referringto a geographical city, town, or county located within the state under analysis has been filtered from the list of cultural outliers.
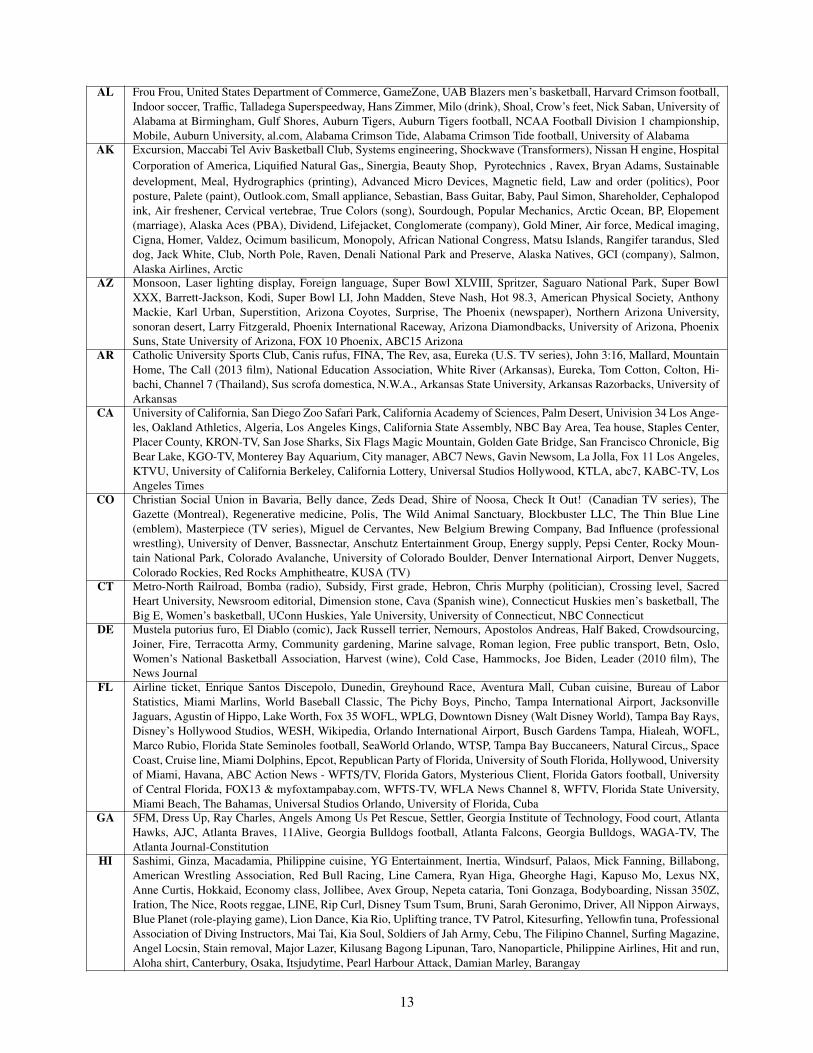
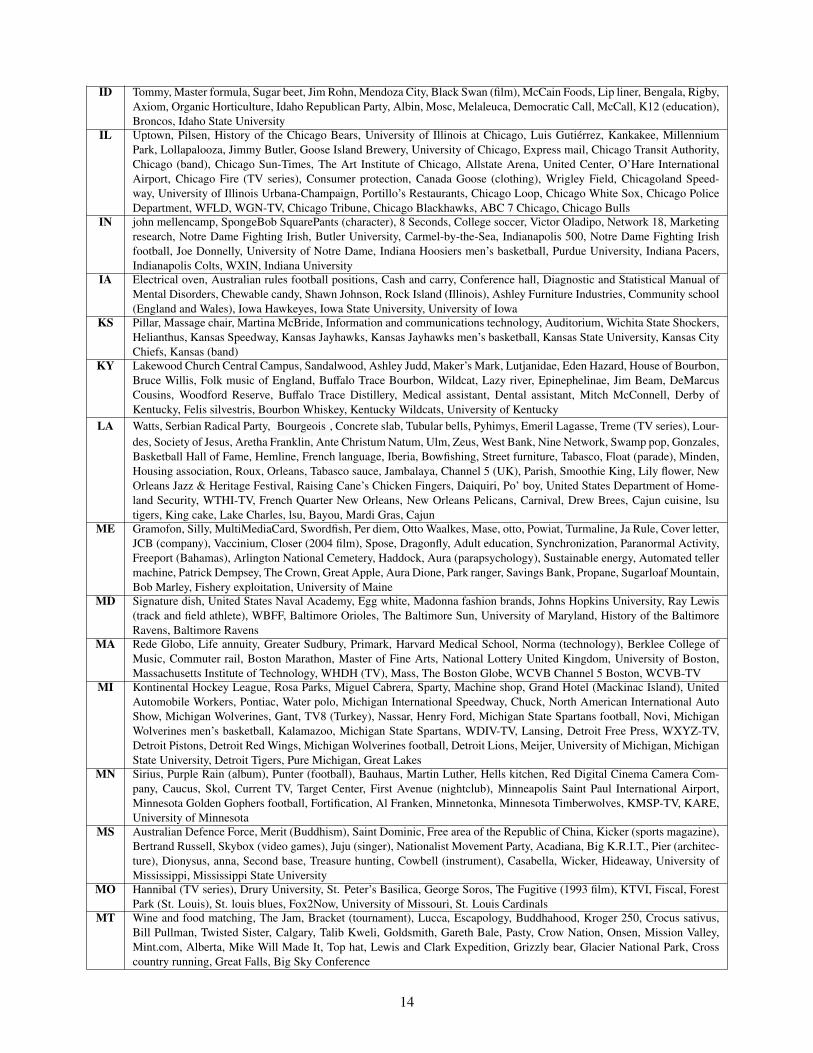
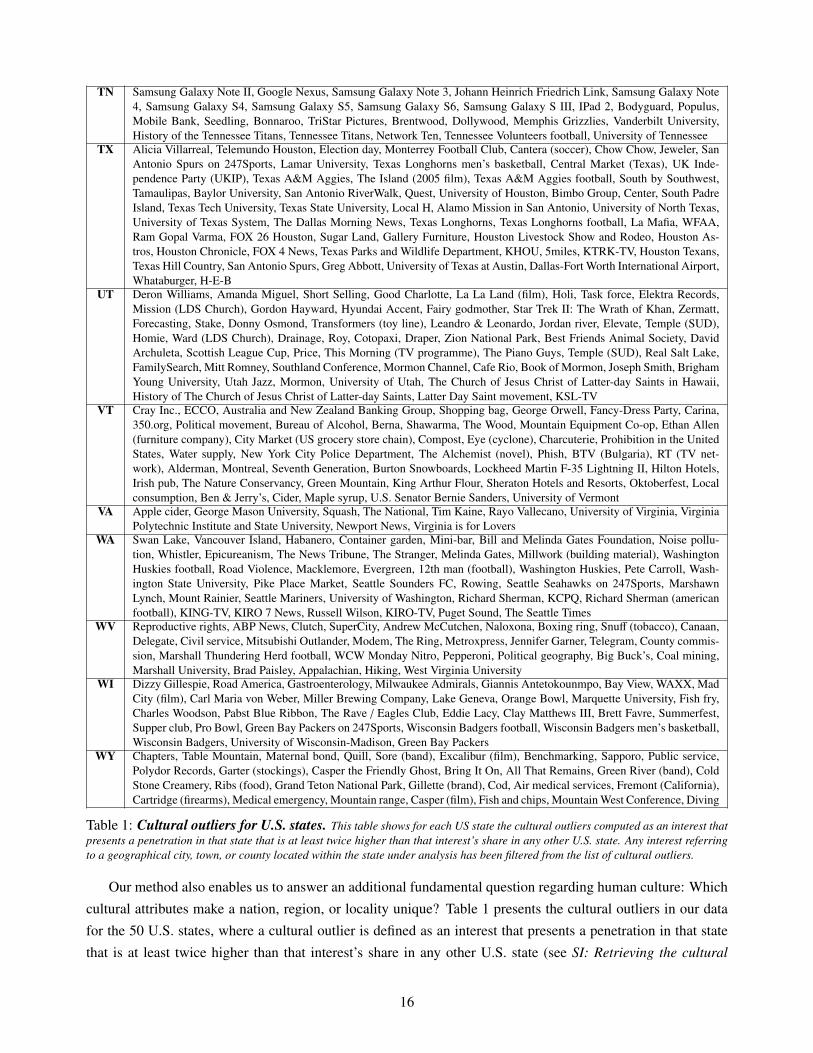
Our method also enables us to answer an additional fundamental question regarding human culture: Which
cultural attributes make a nation, region, or locality unique? Table 1 presents the cultural outliers in our data
for the 50 U.S. states, where a cultural outlier is defined as an interest that presents a penetration in that state
that is at least twice higher than that interest’s share in any other U.S. state (see SI: Retrieving the cultural
16

outliers of US regions). Cultural outliers include sports teams, television shows, and cuisines particular to a
state that are likely relatively common knowledge among U.S. residents. However, the cultural outliers also
include information that would be very difficult and costly to traditionally quantify: New Hampshire has the
highest penetration of Alfred Hitchcock fans, Delaware has the highest penetration of interest in the Jack Russell
terrier, and Montana has the highest rate of interest in the Lewis and Clark Expedition, among hundreds of other
previously unobservable cultural outlier interests.
Our method lays out a complementary approach to the study of culture that is increasingly able to be mea-
sured via the application of computational social science to the ever larger portion of human lives that are
unobtrusively and observationally measured online and offline. Doing so with our sample of Facebook inter-
ests for countries and subnational and local regions around the world indicates that our bottom-up measure
of culture corresponds positively to traditional quantitative measures, contains a greater amount of explana-
tory dimensions, enables the clustering of countries, subnational units, and localities into sensible groupings,
and provides insight into cultural variation at unprecedented spatial, demographic, and topic-based resolution.
While our approach here expands dramatically on traditional methods and uncovers novel insights into cultural
variation, a further strength of our approach is its ability to enable answering questions about human culture
that have been – up to this point – impossible to investigate at scale using traditional quantitative methods. For
example, our method and data can enable investigating questions such as: ‘Which country is the cultural center
of the world?’ (see SI: Cultural center of the world) and ‘Which is the global ‘sister region’ of a particular
region within a country?’ (see SI: Cultural sister regions).
Discussion
The high spatial (zip code-level) and temporal (daily) resolution of Facebook’s available data, coupled with
the more than 200 million individuals on the platform in the United States and the more than two billion on
the platform around the world, enable measuring cultural differences with remarkable precision. Computing
cultural differences between subnational regions (Figures 4, 5 and 6), cities, counties (Figure 8), or any dif-
ferent subgroups of any country (Figure 7), cost prohibitive when using traditional surveys, now becomes a
straightforward endeavor. These studies are possible to conduct freely via the publicly available data provided
by the Facebook Marketing API. Even so, this API is limited relative to what is theoretically possible, given the
magnitude of human behavioral data that firms are currently collecting globally.
While we believe our conception and measurement of culture provides numerous complementary benefits
to traditional measures, a number of considerations are worth noting. For one, that our approach does not
inductively distill culture into parsimonious concepts means that the constellations of interests and behaviors
that might diverge between two cultures may not always lend themselves to ease of conceptual interpretation.
A few of the cultural outliers in Table 1 highlight this consideration.
Further, while our Facebook measure of culture represents a marked improvement in terms of its ability
to measure the surface of culture as compared to traditional surveys with high rates of non-response and rela-
tively few questions52, it is still far from perfect. Not all individuals in every country around the world are on
Facebook. Our an alysis only generalizes to differences among those that use Facebook (however, our validity
results persist even when looking at countries with lower penetration of Facebook use, see SI: Robustness to
17

alternative samples). Additionally, while nearly 60,000 dimensions represent a dramatic increase over tradi-
tional top-down methods (of three orders of magnitude, see Figure 2A), they still measure only a fraction of
the full dimensionality of culture. Moreover, these dimensions themselves suffer from a certain endogeneity
of measurement: Facebook does not have an interest listed for every possible feature of culture. The ones it
chooses to classify are endogenous to the platform itself. For example, these interests exclude certain topics
– like sex and hate speech – banned from the platform. A more ideal computational system would classify all
interests at an even finer scale of demarcation.
Finally, while we believe our measure possesses numerous complementary benefits to traditional quanti-
tative and qualitative approaches to culture – unobtrusiveness, scale, resolution, richness and breadth of con-
structs, and the ability to freely peer into the lives of billions of people – our measure emphatically cannot
substitute for traditionally employed approaches to culture73. If we observe that individuals in a place spend
substantial time looking at religious websites, we cannot know to what degree they personally hold religion as
important: traditional approaches are needed to investigate further. And while our method is useful in providing
a culturomic74,75 barcoding76,77 of global culture, the classification and interpretation of culturally important
factors still necessitates in depth and careful study of features uncovered by our approach – as well as of those
features of culture our measure omits.
Humans around the world share many cultural similarities but also have many differences. Until very
recently, quantitatively measuring vast portions of culture was impossible. However, as we collect data on
humanity it becomes increasingly possible to measure the surface of human culture in manners that approach
cultures’ full underlying dimensionality. Doing so – in addition to furthering traditional quantitative and quali-
tative approaches to culture – will aid in a richer understanding of global human culture.
This improved ability to measure cultural differences between population groups at a more granular level
enables a dramatic advance in the evaluation of some of the most pressing questions in the social sciences, such
as: Do national borders shape cultures? Are societies more likely to fracture along gender lines, racial lines,
or regional lines? Which specific locations on the globe are more prone to civil conflict and violence? Does a
lack of cultural cohesiveness contribute to political extremism? Are certain immigrant cultures more adept at
integrating than others? Some of these questions have been touched upon in this paper; others have not. All
have one element in common: answering them requires cultural measurement at previously unavailable scales
and resolutions.
AcknowledgementsA.C. acknowledges funding from the European Union’s Horizon 2020 innovation action program under grant
agreement No 786741 (SMOOTH project); and the Ministerio de Economía, Industria y Competitividad, Spain,
and the European Social Fund (EU), under the Ramón y Cajal program (Grant RyC-2015-17732). R.C. ac-
knowledges funding from H2020 EU Project PIMCITY (Grant 871370 ) and the Taptap Digital-UC3M Chair
in Advanced AI and Data Science applied to Advertising and Marketing. I.O. acknowledges funding from
ECO2013-42710-P, MDM 2014-0431 and Fundacion BBVA. I.M. acknowledges funding from Spanish Min-
istry of education with the FPU programme (FPU15/03518). The authors thank Niccolo Pescetelli and Alex
Rutherford for their helpful comments.
18
Methods
This section starts by providing details on the process of collecting Facebook interests and on the calculation of
Facebook distances. We then discuss the data sources for our other distance measures (genetic, linguistic, ge-
ographic, religious, WVS). In addition, we explain the methodology for creating dendrograms, for conducting
principal component analysis, and for calculating and analyzing our regional divisiveness.
Facebook Marketing API
We collect data on nearly 60,000 Facebook interests across countries and territories, European subnational re-
gions, U.S. states, California counties, and various demographic subgroups between 2017 and 2018 using Face-
book’s Marketing API (see https://developers.facebook.com/docs/marketing-apis, last accessed:
April 2019). Note that for some experiments, such as the gender-region analysis or the US counties analysis, we
used a subset of interests, since some interests in the original set did not have enough users when considering
smaller user groups. This collection process yields a vector of the number of Facebook users in each entity that
holds each interest, which in turn serves to create a vector containing entity-interest shares. Using this vector
of interest shares, we compute distances between each group of interest.
Advertisers configure their ad campaigns on Facebook through Facebook Ads Manager which can be ac-
cessed through a dashboard that queries the Facebook Marketing API. This interface, which is also accessible
to the public, allows advertisers to define the group they want to target with their advertising campaigns, i.e.,
the population of interest. The group specifications can include geographic location (country, region, city, zip
code, latitude/longitude...), demographics (gender, age, language, education,...), behaviors (mobile device, op-
erating system, browser,...), and interests (sports, food, cars, art,...). For a given set of group specifications, the
Facebook Marketing API provides the number of monthly active users (MAU), daily active users (DAU), and
different advertising costs (per click, per thousand visualizations, etc.).
For our analysis, we gather information on the number of users in each group who hold different interests.
It is therefore important to clarify how Facebook assigns interests to individuals. A user is identified as having
a particular interest based on their data and activity on Facebook, as well as on external websites, apps, and
online services where Facebook has a presence. (Facebook has been estimated to have a presence on over 30%
of popular websites)78. As individuals spend an increasing share of their time in the proximity of devices that
track their location, Facebook also knows many dimensions of its users’ offline activity, such as whether they
go to football games, spend times downtown, or attend religious services.
Once a user is identified as being interested in “cars”, she will be included as a potential target of any ad-
vertising campaign configured to reach users interested in cars. There are hundreds of thousands of interests,
spanning huge swaths of human preferences. To give an idea of the breadth and comprehensiveness, Face-
book organizes interests in a multi-level hierarchical structure, with 14 categories in the first level: business
and industry, education, family and relationships, fitness and wellness, food and drink, hobbies and activities,
lifestyle and culture, news and entertainment, people, shopping and fashion, sports and outdoors, technology,
travel places and events, and null.
The interest extraction process done by Facebook relies on the information each user directly reveals as well
as on proprietary inference on and off the platform. Users’ interests are highly influenced by page likes and
interests from other users with similar interests. In previous work, we have found six reasons for the assignment
19
of interests and ad preferences79: (i) “This is a preference you added”, (ii) “You have this preference because
we think it may be relevant to you based on what you do on Facebook, such as pages you’ve liked or ads
you’ve clicked”, (iii) “You have this preference because you clicked on an ad related to. . . ”, (iv) “You have this
preference because you installed the app. . . ”, (v) “You have this preference because you liked a page related
to. . . ”, (vi) “You have this preference because of comments, posts, shares or reactions you made related to. . . ”.
In order to define and query groups, location is the only field mandatory in the API. Other parameters are
accepted and may be combined to obtain a more specific group. Facebook offers in all their APIs (including
the Marketing API) unique identifiers for most parameter values, so values are language-independent. To help
advertisers, the Marketing API also provides a search function to retrieve interests by string matching: given
some string, it returns a list of full and partial matching name items, typically containing the unique interest ID,
name, total number of users worldwide (reach within Facebook) and, sometimes, a brief description.
Defining and downloading interests by populations
To collect the data for our analysis we queried the Facebook Marketing API more than 75M times across the
following geographical areas: 225 countries and territories, 413 subnational regions and 58 California counties.
In addition, for some countries and regions we also obtained information by gender and age groups. When
querying the Facebook Marketing API, we obtain the number of Monthly Active Users (MAU) and the number
of Daily Active Users (DAU) for each interest and geographical location. To avoid daily fluctuations, we prefer
to employ MAU over DAU. However, for privacy reasons, Facebook imposes a lower bound of 1,000 users for
its MAU measure, so any unit with less than 1,000 users will be reported as 1,000. To mitigate this problem,
whenever we have a unit of interest that is at its lower bound, we substitute MAU by DAU.
To obtain a comprehensive list of interests, we use the Marketing API’s targeting search function that returns
partially or fully matched interests by name when given a string query. To feed this function with meaningful
and representative interests, we use all article titles in the English Wikipedia and all entries in the English
dictionary. The Wikipedia titles are obtained from the DBpedia project (see https://wiki.dbpedia.org,
last accessed August 1, 2017), and the dictionary is the one contained in Ubuntu OS (Linux). This process yields
200 million records, including duplicates and non-interest parameters, such as demographics. After cleaning,
the final number of unique interests is 399,182. From that collection, we select all those with a potential reach of
at least 500,000 users worldwide. While we employ this process for purposes of cross-national comparability,
there is no theoretical reason why other scholars couldn’t employ the list of all 400,000 interests, if they were
interested in examining interests that were unique to particular populations. Our method leaves us with nearly
60,000 unique interest identifiers.
Representativeness
While most countries impose almost no restrictions on what content is available nor on how each citizen relates
online, a few countries do limit the use of Facebook or the Internet. In the cases of Iran, Sudan and Cuba, the
Marketing API does not provide information on people residing in these countries, returning a 2641 error with
the following message: “By law, we cannot serve ads to the following countries.” Another special case is China.
Although it is possible to obtain user counts for China, Internet access to sites outside the country is severely
restricted, making the figures reported by Facebook unrealistic. Hence, we do not include these countries in our
analysis.
20
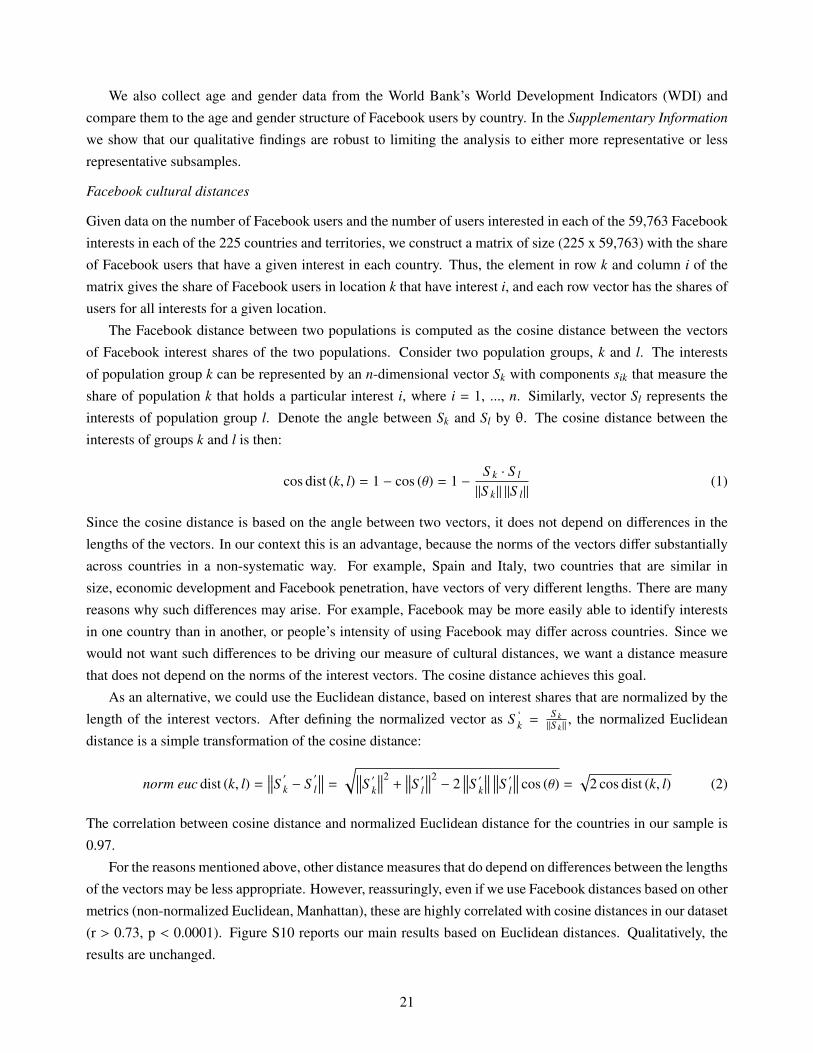
We also collect age and gender data from the World Bank’s World Development Indicators (WDI) and
compare them to the age and gender structure of Facebook users by country. In the Supplementary Information
we show that our qualitative findings are robust to limiting the analysis to either more representative or less
representative subsamples.
Facebook cultural distances
Given data on the number of Facebook users and the number of users interested in each of the 59,763 Facebook
interests in each of the 225 countries and territories, we construct a matrix of size (225 x 59,763) with the share
of Facebook users that have a given interest in each country. Thus, the element in row k and column i of the
matrix gives the share of Facebook users in location k that have interest i, and each row vector has the shares of
users for all interests for a given location.
The Facebook distance between two populations is computed as the cosine distance between the vectors
of Facebook interest shares of the two populations. Consider two population groups, k and l. The interests
of population group k can be represented by an n-dimensional vector Sk with components sik that measure the
share of population k that holds a particular interest i, where i = 1, ..., n. Similarly, vector Sl represents the
interests of population group l. Denote the angle between Sk and Sl by θ. The cosine distance between the
interests of groups k and l is then:
cos dist (k, l) = 1 − cos (θ) = 1 −S k · S l
||S k|| ||S l||(1)
Since the cosine distance is based on the angle between two vectors, it does not depend on differences in the
lengths of the vectors. In our context this is an advantage, because the norms of the vectors differ substantially
across countries in a non-systematic way. For example, Spain and Italy, two countries that are similar in
size, economic development and Facebook penetration, have vectors of very different lengths. There are many
reasons why such differences may arise. For example, Facebook may be more easily able to identify interests
in one country than in another, or people’s intensity of using Facebook may differ across countries. Since we
would not want such differences to be driving our measure of cultural distances, we want a distance measure
that does not depend on the norms of the interest vectors. The cosine distance achieves this goal.
As an alternative, we could use the Euclidean distance, based on interest shares that are normalized by the
length of the interest vectors. After defining the normalized vector as S ‘k =
S k||S k ||
, the normalized Euclidean
distance is a simple transformation of the cosine distance:
norm euc dist (k, l) =∥∥∥S
′
k − S′
l
∥∥∥ =
√∥∥∥S ′k∥∥∥2
+∥∥∥S ′l
∥∥∥2− 2
∥∥∥S ′k∥∥∥ ∥∥∥S ′l
∥∥∥ cos (θ) =√
2 cos dist (k, l) (2)
The correlation between cosine distance and normalized Euclidean distance for the countries in our sample is
0.97.
For the reasons mentioned above, other distance measures that do depend on differences between the lengths
of the vectors may be less appropriate. However, reassuringly, even if we use Facebook distances based on other
metrics (non-normalized Euclidean, Manhattan), these are highly correlated with cosine distances in our dataset
(r > 0.73, p < 0.0001). Figure S10 reports our main results based on Euclidean distances. Qualitatively, the
results are unchanged.
21

As is usual with correlations between distance matrices, all confidence intervals in this paper are based on
Mantel tests80. All computations were done in Python 3.5 using distance measures implemented in scikits-learn
version 0.19.281. In addition to calculating distances between countries, we also build matrices of Facebook
distances for sub-national regions, age and gender groups within countries, as well as California counties.
Other distance measures
Cultural distances based on the World Values Survey are derived from 98 questions across 74 countries, span-
ning the period 1981-2010. Specifically, we follow Spoloare and Wacziarg12 and use the set of questions that
is most common across countries and years, but unlike these authors we use cosine distance as the benchmark
distance measure (the correlations among the various distances measures based on this set of questions for dif-
ferent metrics – cosine, Euclidean, Manhattan – is also very high: r > 0.97, p < 0.0001). In addition to distances
based on all 98 questions, we also include a number of alternative measures of cultural distances, based on sub-
sets of questions. These include measures for different macro-categories of questions (such as perceptions of
life, family, work, etc.), as well as for binary and non-binary questions.
Genetic distances come from Spolaore and Wacziarg82 and are based on genetic data from Creanza et al.83.
They measure population-weighted FS T genetic distances between countries. As additional measures, we also
include FS T genetic distances between the plurality groups and genetic distances as they were in the year 1500,
as well as additional distance measures based on Spoloare and Wacziarg12.
Geographic distances measure distances between capitals. We also include a number of alternative mea-
sures: distances between the most populated cities, population-weighted distances, and population-weighted
distances that account for the sensitivity of trade flows to distance. All these measures come from the CEPII
GeoDist database84.
Linguistic distances measure the distance between two randomly drawn individuals of two different coun-
tries, where the linguistic distance is based on the Ethnologue language tree and uses the formula by Desmet,
Ortuño-Ortín and Wacziarg26. We also include alternative measures of linguistic distances taken from Spolaore
and Wacziarg82: 15 additional measures where languages are defined at 15 different levels of aggregation (e.g.,
at aggregation level 1 all Indo-European languages are taken to be the same), and two distance measures based
on cognates, one for plurality languages and another weighted by the language shares.
The measure for religious distances is based on population-weighted distances of religions using a religion
tree from the World Christian Database12. We also include alternative measures: a distance measure based on
plurality groups, and two measures based on an alternative religion tree from Mecham, Fearon and Laitin85.
Principal component analysis
We perform principal component analysis on Facebook interests and on WVS questions, using the common
sample of countries covered by both data sources. The goal is to reduce the dimensionality of interests and
questions, and assess whether a limited number of principal components are able to explain a large share of
the variance in Facebook interests across countries and a large share of the variance of WVS questions across
countries. When conducting principal component analysis, we use the covariance matrix, since our variables
are population shares, measured on the same scale, from 0 to 1. In the Supplementary Information we show
that the results are similar when using the correlation matrix instead.
22
Dendrograms
To generate the dendrograms, we use an implementation of hierarchical agglomerative clustering (HAC) that
is provided by the python package scipy.cluster.hierarchy. This implementation of HAC allows for a choice of
a distance method and a linkage criterion. We use cosine distance for consistency across other analyses and
employ the Ward variance minimization linkage criterion. The input is the interest share vector of each country.
Hierarchical clustering algorithms are a general family of clustering algorithms that build nested clusters
by merging or splitting the clusters successively in iterations. The nested structure can be represented as a
dendrogram, in which the root of the tree is the highest level cluster that includes all data, while the leaf of the
tree represents the lowest level cluster that includes a single data point.
Hierarchical clustering can be performed through a bottom-up (agglomerative) strategy or a top-down (di-
visive) strategy. In the agglomerative strategy, hierarchical clustering is performed via a bottom-up process in
which every data point starts as its own cluster. The algorithm builds nested clusters by merging or splitting the
clusters successively in multiple iterations and represents the nested structure as a dendrogram.
Adopting notations from Arbelaitz et al.86, a data set DS is defined as a set of N data points, each of which
is a vector of F dimensions. A clustering of DS is a set of disjoint clusters that partitions DS into K groups
C = {c1, c2, . . . , cK} where ∀K > 1 ∪ck∈C ck = DS and ∩ck∈C ck = ∅
In the first iteration,(
K2
)distance values between base K clusters are computed using a distance metric. After
the distance values have been evaluated, a linkage criteria is used to determine two clusters ci and c j to combine
to form a new cluster ck. The Ward variance minimization linkage criterion is given by the following formula:
d (ck, cl) =
√|cl| + |ci|
Td (cl, ci)2 +
|cl| + |c j|
Td(cl, c j
)2−|cl|
Td(ci, c j
)2
where ck is a newly formed cluster consisting of clusters ci and c j, cl is an unused cluster, T = |cl| + |ci| + |c j|
and | · | is the cardinality of its argument.
Dendrogram of full set of countries
Figure 3 depicts a dendrogram based on the set of 72 countries common to both the WVS and Facebook
sample. Supplemental Material Figure S13 shows a dendrogram for the full set of 225 countries for which we
have Facebook interest shares.
Regional, gender, and age divisiveness
Our measure of regional divisiveness is as follows. Consider a country c with a number of regions indexed
by k or l. Denote the Facebook cosine distance between any two regions k and l by cos dist (k, l), and denote
the population shares of k and l by sk and sl. We then measure the regional divisiveness of country c as the
population-weighted Facebook cosine distance between its different subnational regions:∑k,l
∑l cos dist (k, l) sksl∑
k,l∑
l sksl(3)
One way of interpreting (3) is as the expected Facebook distance between two randomly drawn individuals from
23
different regions. If there are only two regions in a country, then (3) would simplify to the bilateral distance
between them, i.e., cos dist(k, l). More simply, (3) is an average interregional distance measure. Gender and
age divisiveness are measured similarly.
Country networks and maps
From the 18 countries for we downloaded regional data, we chose Germany and India to show network and
map, given their rank according to divisiveness in Figure 6A. For each country, we first constructed a network
in which each node represents a region, and we used links to connect every pair of regions. Links are weighted
by the cosine similarity between regions (1 - cosine distance). Link weights are rescaled using standardization
and then shifted by a constant value as to have only non-negative weights (a condition on the input for the
community detection method). Then, to detect communities, we used an igraph (from R) implementation of
multi-level modularity optimization algorithm (also known as Louvain method)72, which is based on the modu-
larity measure and a hierarchical approach. Modularity is a measure of a quality of a partition (codomain: [-1,
1]), which measures the density of links inside communities as compared to links between communities87,88.
Then, we colored nodes according to community affiliation, and links according to their adjacent nodes. To plot
country maps, we used R package rnaturalearth to access geometry of regions’ layout from Natural Earth map
data89. We colored map regions according to the communities detected from the corresponding network.
References
1. Boyd, R. & Richerson, P. J. The Origin and Evolution of Cultures. (Oxford University Press, 2005).
2. Kempe, M., Lycett, S. J. & Mesoudi, A. From cultural traditions to cumulative culture: parameterizing the
differences between human and nonhuman culture. J. Theor. Biol. 359, 29-36 (2014).
3. Mesoudi, A. & Thornton, A. What is cumulative cultural evolution? Proc. Biol. Sci. 285, (2018).
4. Dean, L. G., Kendal, R. L., Schapiro, S. J., Thierry, B. & Laland, K. N. Identification of the social and
cognitive processes underlying human cumulative culture. Science 335, 1114-1118 (2012).
5. Baldwin, J. R., Faulkner, S. L., Hecht, M. L. & Lindsley, S. L. Redefining Culture: Perspectives Across the
Disciplines. (Routledge, 2006).
6. Harris, M. & University of Florida. Cultural Materialism: The Struggle for a Science of Culture. (AltaMira
Press, 2001).
7. Goldstein, L. J. On Defining Culture. Am. Anthropol. 59, 1075-1081 (1957).
8. Swidler, A. Culture in Action: Symbols and Strategies. Am. Sociol. Rev. 51, 273-286 (1986).
9. Chilton, S. Defining Political Culture. West. Polit. Q. 41, 419-445 (1988).
10. Ross, M. H. Culture in Comparative Political Analysis. In: Comparative Politics: Rationality, Culture, and
Structure 134-161 (Cambridge University Press, 2009). doi:10.1017/CBO9780511804007.007.
24
11. Huntington, S. P. The Clash of Civilizations and the Remaking of World Order. (Penguin Books India,
1997).
12. Spolaore, E. & Wacziarg, R. Ancestry, language and culture. in The Palgrave handbook of economics and
language 174-211 (Springer, 2016).
13. Oosterbeek, H., Sloof, R. & van de Kuilen, G. Cultural Differences in Ultimatum Game Experiments:
Evidence from a Meta-Analysis. (2001) doi:10.2139/ssrn.286428.
14. Ottaviano, G. I. P. & Peri, G. The Economic Value of Cultural Diversity: Evidence from US Cities. NBER
WP 10904, (2004) doi:10.3386/w10904.
15. Tomasello, M. The Cultural Origins of Human Cognition.(Harvard University Press, 2009).
16. Cohen, A. B. Many forms of culture. Am. Psychol. 64, 194-204 (2009).
17. Betancourt, H. & López, S. R. The study of culture, ethnicity, and race in American psychology. Am.
Psychol. 48, 629-637 (1993).
18. Mesoudi, A. Cultural evolution: integrating psychology, evolution and culture. Current Opinion in Psy-
chology 7, 17-22 (2016).
19. Ekman, P., Friesen, W. V., O’Sullivan, M. & Chan, A. Universals and cultural differences in the judgments
of facial expressions of emotion. J. Pers. Soc. Psychol. 53, 712-717 (1987).
20. Moore, O. K. Nominal Definitions of ‘Culture’. Philos. Sci. 19, 245-256 (1952).
21. Alesina, A. & Spolaore, E. On the number and size of nations. Q. J. Econ. 112, 1027-1056 (1997).
22. Alesina, A., Spolaore, E. & Wacziarg, R. Economic integration and political disintegration. Am. Econ.
Rev. 90, 1276-1296 (2000).
23. Desmet, K., Le Breton, M., Ortuño-Ortín, I. & Weber, S. The stability and breakup of nations: a quantitative
analysis. J. Econ. Growth 16, 183 (2011).
24. Fearon, J. D. & Laitin, D. D. Ethnicity, insurgency, and civil war. Am. Polit. Sci. Rev. 97, 75-90 (2003).
25. Fearon, J. D. Ethnic and cultural diversity by country. J. Econ. Growth 8, 195-222 (2003).
26. Desmet, K., Ortuño-Ortín, I. & Wacziarg, R. Culture, ethnicity, and diversity. Am. Econ. Rev. 107,
2479-2513 (2017).
27. Alesina, A. & Ferrara, E. L. Ethnic diversity and economic performance. J. Econ. Lit. 43, 762-800 (2005).
28. Thomson, R. et al. Relational mobility predicts social behaviors in 39 countries and is tied to historical
farming and threat. Proc. Natl. Acad. Sci. U. S. A. 115, 7521-7526 (2018).
29. Taras, V., Rowney, J. & Steel, P. Half a century of measuring culture: Review of approaches, challenges,
and limitations based on the analysis of 121 instruments for quantifying culture. Journal of International
Management 15, 357-373 (2009).
25
30. Lazer, D. et al. Life in the network: the coming age of computational social science. Science 323, 721
(2009).
31. van der Post, D. J. & Hogeweg, P. Diet traditions and cumulative cultural processes as side-effects of
grouping. Anim. Behav. 75, 133-144 (2008).
32. Tamariz, M. & Kirby, S. The cultural evolution of language. Curr Opin Psychol 8, 37-43 (2016).
33. Kirby, S., Dowman, M. & Griffiths, T. L. Innateness and culture in the evolution of language. Proc. Natl.
Acad. Sci. U. S. A. 104, 5241-5245 (2007).
34. Arendt, H. Reflections on literature and culture. (Stanford University Press, 2007).
35. Acerbi, A., Enquist, M. & Ghirlanda, S. Cultural evolution and individual development of openness and
conservatism. Proc. Natl. Acad. Sci. U. S. A. 106, 18931-18935 (2009).
36. Atran, S. & Henrich, J. The Evolution of Religion: How Cognitive By-Products, Adaptive Learning Heuris-
tics, Ritual Displays, and Group Competition Generate Deep Commitments to Prosocial Religions. Biol.
Theory 5, 18-30 (2010).
37. Geertz, C. The Interpretation Of Cultures. (Basic Books, 1973).
38. Murthy, D. Digital Ethnography: An Examination of the Use of New Technologies for Social Research.
Sociology 42, 837-855 (2008).
39. Henrich, J. Demography and Cultural Evolution: How Adaptive Cultural Processes Can Produce Maladap-
tive Losses—The Tasmanian Case. Am. Antiq. 69, 197-214 (2004).
40. Posner, D. N. The Political Salience of Cultural Difference: Why Chewas and Tumbukas are Allies in
Zambia and Adversaries in Malawi. Am. Polit. Sci. Rev. 98, 529-545 (2004).
41. Murray, J. H. Toward a Cultural Theory of Gaming: Digital Games and the Co-Evolution of Media, Mind,
and Culture. Popular Communication 4, 185-202 (2006).
42. Center, P. R. Social media fact sheet. Pew Research Center: Internet, Science & Tech (2017).
43. Bontempo, R. N., Bottom, W. P. & Weber, E. U. Cross-Cultural Differences in Risk Perception: A Model-
Based Approach. Risk Anal. 17, 479-488 (1997).
44. Yuki, M., Maddux, W. W., Brewer, M. B. & Takemura, K. Cross-cultural differences in relationship- and
group-based trust. Pers. Soc. Psychol. Bull. 31, 48-62 (2005).
45. Schimmack, U., Oishi, S. & Diener, E. Individualism: a valid and important dimension of cultural differ-
ences between nations. Pers. Soc. Psychol. Rev. 9, 17-31 (2005).
46. Archer, J. Cross-cultural differences in physical aggression between partners: a social-role analysis. Pers.
Soc. Psychol. Rev. 10, 133-153 (2006).
26
47. Segall, M. H., Campbell, D. T. & Herskovits, M. J. Cultural Differences in the Perception of Geometric
Illusions. Science 139, 769-771 (1963).
48. Shenkar, O. Cultural Distance Revisited: Towards a More Rigorous Conceptualization and Measurement
of Cultural Differences. Journal of International Business Studies 32, 519-535 (2001).
49. Hofstede, G. National Cultures in Four Dimensions: A Research-Based Theory of Cultural Differences
among Nations. International Studies of Management & Organization 13, 46-74 (1983).
50. Inglehart, R. et al. World Values Survey: All Rounds - Country-Pooled Datafile Version: http://www.worldvaluessurvey.org/WVSDocumentationWVL.jsp.
(JD Systems Institute, 2014).
51. Geertz, C. Thick description: Toward an interpretive theory of culture. in The Cultural Geography Reader
41-51 (Routledge, 2008).
52. Fisher, R. J. Social Desirability Bias and the Validity of Indirect Questioning. J. Consum. Res. 20, 303-315
(1993).
53. McCambridge, J., Witton, J. & Elbourne, D. R. Systematic review of the Hawthorne effect: new concepts
are needed to study research participation effects. J. Clin. Epidemiol. 67, 267-277 (2014).
54. Brewer & John. Ethnography. (McGraw-Hill Education (UK), 2000).
55. Zhang, Y. & Neelankavil, J. P. The influence of culture on advertising effectiveness in China and the USA.
Eur. J. Mark. 31, 134-149 (1997).
56. Hong, J. W., Muderrisoglu, A. & Zinkhan, G. M. Cultural Differences and Advertising Expression: A
Comparative Content Analysis of Japanese and U.S. Magazine Advertising. J. Advert. 16, 55-68 (1987).
57. Chau, P. Y. K., Cole, M., Massey, A. P., Montoya-Weiss, M. & O’Keefe, R. M. Cultural differences in the
online behavior of consumers. Commun. ACM 45, 138-143 (2002).
58. Kosinski, M., Stillwell, D. & Graepel, T. Private traits and attributes are predictable from digital records of
human behavior. Proc. Natl. Acad. Sci. U. S. A. 110, 5802-5805 (2013).
59. Kosinski, M., Matz, S. C., Gosling, S. D., Popov, V. & Stillwell, D. Facebook as a research tool for the
social sciences: Opportunities, challenges, ethical considerations, and practical guidelines. Am. Psychol.
70, 543-556 (2015).
60. Muthukrishna, M. et al. Beyond WEIRD Psychology: Measuring and Mapping Scales of Cultural and
Psychological Distance. Psychological Science (2020) doi:10.2139/ssrn.3259613.
61. Cavalli-Sforza, L. L. & Feldman, M. W. Cultural transmission and evolution: a quantitative approach.
(Princeton University Press, 1981).
62. Cavalli-Sforza, L. L., Menozzi, P. & Piazza, A. The history and geography of human genes. (Princeton
University Press, 1994).
27

63. Cavalli-Sforza, L. L. Genes, peoples, and languages. (North Point Press, 2000).
64. Atkinson, Q. D. Phonemic diversity supports a serial founder effect model of language expansion from
Africa. Science 332, 346-349 (2011).
65. Rogers, D. S., Feldman, M. W. & Ehrlich, P. R. Inferring population histories using cultural data. Proceed-
ings of the Royal Society of London B: Biological Sciences 276, 3835-3843 (2009).
66. Ramachandran, S. et al. Support from the relationship of genetic and geographic distance in human popu-
lations for a serial founder effect originating in Africa. Proc. Natl. Acad. Sci. U. S. A. 102, 15942-15947
(2005).
67. Diamond, J. M. Guns, germs, and steel: the fates of human societies. (W.W. Norton & Co., 1997).
68. Henrich, J. P. The secret of our success: how culture is driving human evolution, domesticating our species,
and making us smarter. (Princeton University Press, 2016).
69. Richerson, P. J. & Christiansen, M. H. Cultural evolution: society, technology, language, and religion.
(MIT Press, 2013).
70. Galor, O. & Özak, Ö. The Agricultural Origins of Time Preference. Am. Econ. Rev. 106, (2016).
71. Inglehart, R. et al. World Values Survey: Round Six - Country-Pooled Datafile Version: http://www.worldvaluessurvey.org/WVSDocumentationWV6.jsp.
(JD Systems Institute, 2014).
72. Blondel, V. D., Guillaume, J.-L., Lambiotte, R. & Lefebvre, E. Fast unfolding of communities in large
networks. Journal of Statistical Mechanics: Theory and Experiment vol. 2008 P10008 (2008).
73. Bail, C. A. The cultural environment: measuring culture with big data. Theory Soc. 43, 465-482 (2014).
74. Michel, J.-B. et al. Quantitative analysis of culture using millions of digitized books. Science 331, 176-182
(2011).
75. Reeves, B., Robinson, T. & Ram, N. Time for the Human Screenome Project. Nature 577, 314-317 (2020).
76. Mesoudi, A. Pursuing Darwin’s curious parallel: Prospects for a science of cultural evolution. Proc. Natl.
Acad. Sci. U. S. A. 114, 7853-7860 (2017).
77. Hebert, P. D. N., Cywinska, A., Ball, S. L. & deWaard, J. R. Biological identifications through DNA
barcodes. Proc. Biol. Sci. 270, 313-321 (2003).
78. Englehardt, S. & Narayanan, A. Online Tracking. Proceedings of the 2016 ACM SIGSAC Conference on
Computer and Communications Security - CCS’16 (2016) doi:10.1145/2976749.2978313.
79. Cabañas, J. G., Cuevas, Á. & Cuevas, R. Unveiling and Quantifying Facebook Exploitation of Sensitive
Personal Data for Advertising Purposes. (2018).
80. Legendre, P. & Legendre, L. Numerical ecology. vol. 24 (Elsevier, 2012).
28

81. Pedregosa, F. et al. Scikit-learn: Machine learning in Python. J. Mach. Learn. Res. 12, 2825-2830 (2011).
82. Spolaore, E. & Wacziarg, R. Ancestry and development: New evidence. J. Appl. Econometrics 33, 748-762
(2018).
83. Creanza, N. et al. A comparison of worldwide phonemic and genetic variation in human populations.
Proceedings of the National Academy of Sciences 112, 1265-1272 (2015).
84. Mayer, T. & Zignago, S. Notes on CEPII’s distances measures: The GeoDist database. (2011).
85. Mecham, R. Q., Fearon, J. & Laitin, D. Religious classification and data on shares of major world religions.
unpublished, Stanford University 1, 18 (2006).
86. Arbelaitz, O., Gurrutxaga, I., Muguerza, J., Pérez, J. M. & Perona, I. An extensive comparative study of
cluster validity indices. Pattern Recognit. 46, 243-256 (2013).
87. Girvan, M. & Newman, M. E. J. Community structure in social and biological networks. Proceedings of
the National Academy of Sciences vol. 99 7821-7826 (2002).
88. Newman, M. E. J. Modularity and community structure in networks. Proceedings of the National Academy
of Sciences vol. 103 8577-8582 (2006).
89. Natural Earth. http://www.naturalearthdata.com.
90. World Bank. World Development Indicators.
91. United Nations. Department of Economic and Social Affairs, Population Division. World Marriage Data
2015, POP/DB/Marr/Rev2015, (2015).
92. World Health Organization. Global Health Observatory data repository.
93. United Nations Food and Agricultural Organization (FAO). FAOSTAT.
94. Georgetown Institute for Women, Peace and Security Contact (GIWPS). WPSIndex.
95. United Nations Development Programme (UNDP). Human Development Report 2019.
96. World Economic Forum. Global Gender Gap Report 2020.
97. Helliwell, J., Layard, R., & Sachs, J. World Happiness Report 2019. (New York: Sustainable Development
Solutions Network, 2019).
98. World Health Organization. Global Health Observatory (GHO) data.
99. World Economic Forum. Global Competitiveness Index.
100. Enke, B. Kinship, cooperation, and the evolution of moral systems. Quarterly Journal of Economics 134,
953-1019 (2019).
29

101. Falk, A., Becker, A., Dohmen, T., Enke, B., Huffman, D., & Sunde, U. Global evidence on economic
preferences. Quarterly Journal of Economics 133, 1645-1692 (2018).
102. Falk, A., Becker, A., Dohmen, T., Huffman, D., & Sunde, U. The preference survey module: A validated
instrument for measuring risk, time, and social preferences. IZA Discussion Paper No. 9674 (2016).
103. Hofstede, G., Hofstede, G. J. & Minkov, M. Cultures and organizations: software of the mind. (New
York: McGraw-Hill USA, 2010).
30

Supplementary Information
Partial correlations of distance measures
To further explore whether Facebook distances capture cultural distances, we look at various partial correlations.
That is, we analyze the correlation between one distance measure (e.g., WVS distances) and the Facebook
distance measure, controlling for all other distance measures (e.g., genetic, geographic, linguistic and religious
distances). The goal is to discover which type of distance measure correlates most strongly with FB distances.
We start by focusing on one measure for each type of distance proxy. That is, rather than using different
ways of measuring each distance proxy, we choose one measure for each one of the five distance proxies (values,
genetic, geographic, linguistic, and religious).1 Before looking at partial correlations, Figure S1(a) plots the
correlations between Facebook distances and each one of the distance measures, not controlling for any other
distance. The correlations of Facebook distances with genetic, geographic, linguistic and religious distances are
all positive and statistically significant at the 95% confidence level, but the strongest correlation continues to be
with the most direct survey-based measure of cultural distances.2 This confirms that our bottom-up Facebook
measure of cultural distance corresponds well to the standard top-down measure of cultural distance.
Figure S1(b) plots the partial correlations between Facebook distances and each one of the distance mea-
sures. To give a specific example, consider the partial correlation between Facebook distances and value-based
cultural distances (slightly above 0.35). This number represents the correlation between the residuals of a re-
gression of Facebook distances on all other distances (genetic, geographic, linguistic and religious) and the
residuals of a regression of value-based cultural distances on all other distances (genetic, geographic, linguistic
and religious). It hence tells us how correlated Facebook and value-based cultural distances are, after control-
ling for all other distances. The same partial correlations with other distances are all lower: for example, the
partial correlation between Facebook and geographic distances is below 0.1, and not statistically significant at
the 95% confidence level. Hence, when controlling for all other distances, the strongest partial correlation is
between Facebook distances and value-based cultural distances. This shows that Facebook distances are not
just picking up geographic, genetic, linguistic or religious distances.
The other two panels of Figure S1 confirm this finding. Panel (c) shows the semi-partial correlations be-
tween Facebook distances and each one of the distance measures. This represents the correlations between
Facebook distances and the residuals of a regression of one of the distance measures on all other distance mea-
sures. Once again, we find that the strongest semi-partial correlation is with survey-based cultural distances.
Panel (d) reports the semi-partial R2 of Facebook distances on each one of the distance measures, after con-
trolling for all others. For example, the semi-partial R2 of 0.085 between Facebook and value-based cultural
distances means that a regression of Facebook distances on all other distance measures (including value-based
cultural distances) explains 8.5% more of the variation in Facebook distances than a regression that excludes
value-based cultural distances.1In particular, value distances are based on 98 questions from the World Values Survey, spanning the period 1981- 2000, as in
12, with the only difference that we use cosine distance; genetic distances come from 82 and measure population-weighted FST geneticdistances between countries using genetic data by 83; geographic distances are between country capitals; linguistic distances are basedon the Ethnologue database and use the formula by 26 to measure the linguistic distance between two randomly drawn individuals oftwo different countries; and religious distances are based on the population-weighted distance using a religion tree from the WorldChristian Database 12.
2As is usual with correlations between distance matrices, all confidence intervals are based on Mantel tests80.
31
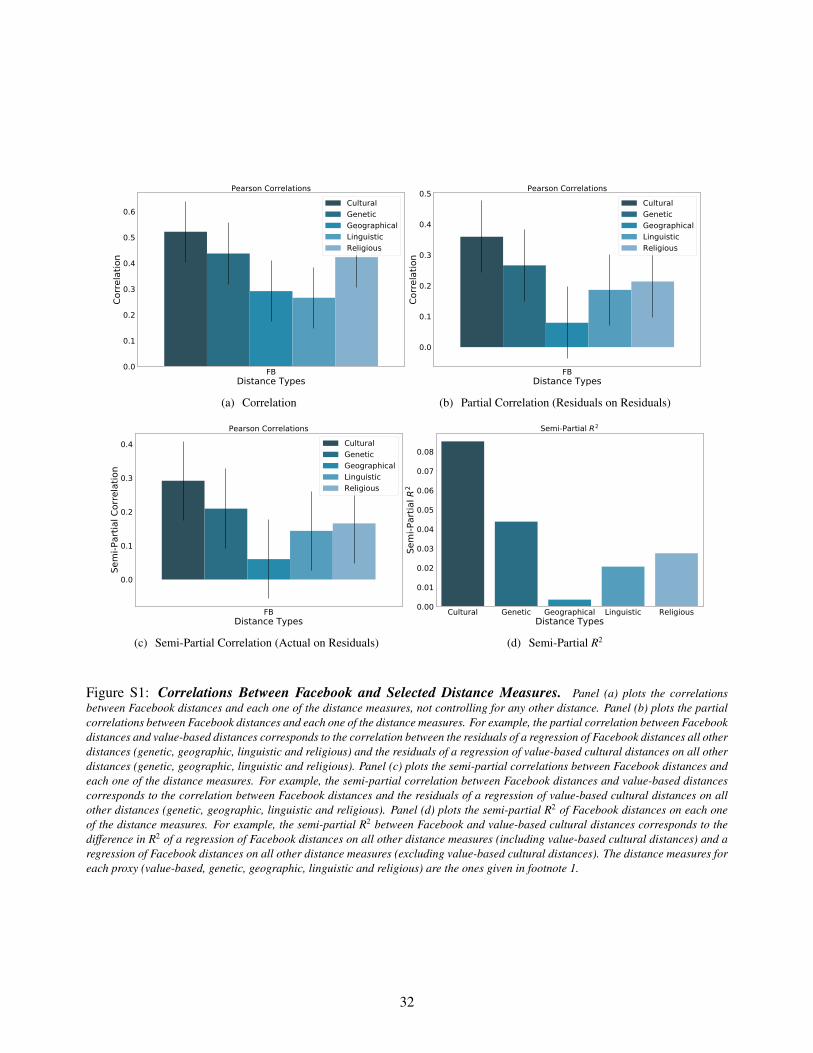
FBDistance Types
0.0
0.1
0.2
0.3
0.4
0.5
0.6
Corre
latio
n
Pearson CorrelationsCulturalGeneticGeographicalLinguisticReligious
(a) Correlation
FBDistance Types
0.0
0.1
0.2
0.3
0.4
0.5
Corre
latio
n
Pearson CorrelationsCulturalGeneticGeographicalLinguisticReligious
(b) Partial Correlation (Residuals on Residuals)
FBDistance Types
0.0
0.1
0.2
0.3
0.4
Sem
i-Par
tial C
orre
latio
n
Pearson CorrelationsCulturalGeneticGeographicalLinguisticReligious
(c) Semi-Partial Correlation (Actual on Residuals)
Cultural Genetic Geographical Linguistic ReligiousDistance Types
0.00
0.01
0.02
0.03
0.04
0.05
0.06
0.07
0.08
Sem
i-Par
tial R
2
Semi-Partial R2
(d) Semi-Partial R2
Figure S1: Correlations Between Facebook and Selected Distance Measures. Panel (a) plots the correlationsbetween Facebook distances and each one of the distance measures, not controlling for any other distance. Panel (b) plots the partialcorrelations between Facebook distances and each one of the distance measures. For example, the partial correlation between Facebookdistances and value-based distances corresponds to the correlation between the residuals of a regression of Facebook distances all otherdistances (genetic, geographic, linguistic and religious) and the residuals of a regression of value-based cultural distances on all otherdistances (genetic, geographic, linguistic and religious). Panel (c) plots the semi-partial correlations between Facebook distances andeach one of the distance measures. For example, the semi-partial correlation between Facebook distances and value-based distancescorresponds to the correlation between Facebook distances and the residuals of a regression of value-based cultural distances on allother distances (genetic, geographic, linguistic and religious). Panel (d) plots the semi-partial R2 of Facebook distances on each oneof the distance measures. For example, the semi-partial R2 between Facebook and value-based cultural distances corresponds to thedifference in R2 of a regression of Facebook distances on all other distance measures (including value-based cultural distances) and aregression of Facebook distances on all other distance measures (excluding value-based cultural distances). The distance measures foreach proxy (value-based, genetic, geographic, linguistic and religious) are the ones given in footnote 1.
32
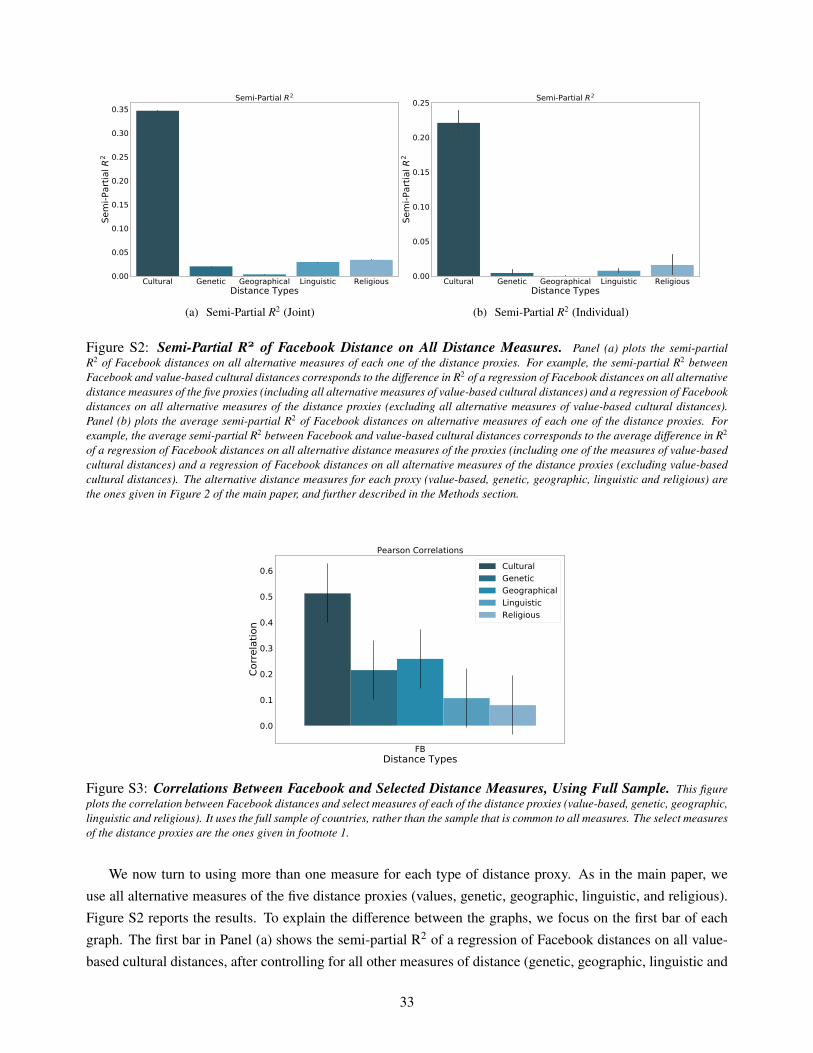
Cultural Genetic Geographical Linguistic ReligiousDistance Types
0.00
0.05
0.10
0.15
0.20
0.25
0.30
0.35Se
mi-P
artia
l R2
Semi-Partial R2
(a) Semi-Partial R2 (Joint)
Cultural Genetic Geographical Linguistic ReligiousDistance Types
0.00
0.05
0.10
0.15
0.20
0.25
Sem
i-Par
tial R
2
Semi-Partial R2
(b) Semi-Partial R2 (Individual)
Figure S2: Semi-Partial R of Facebook Distance on All Distance Measures. Panel (a) plots the semi-partialR2 of Facebook distances on all alternative measures of each one of the distance proxies. For example, the semi-partial R2 betweenFacebook and value-based cultural distances corresponds to the difference in R2 of a regression of Facebook distances on all alternativedistance measures of the five proxies (including all alternative measures of value-based cultural distances) and a regression of Facebookdistances on all alternative measures of the distance proxies (excluding all alternative measures of value-based cultural distances).Panel (b) plots the average semi-partial R2 of Facebook distances on alternative measures of each one of the distance proxies. Forexample, the average semi-partial R2 between Facebook and value-based cultural distances corresponds to the average difference in R2
of a regression of Facebook distances on all alternative distance measures of the proxies (including one of the measures of value-basedcultural distances) and a regression of Facebook distances on all alternative measures of the distance proxies (excluding value-basedcultural distances). The alternative distance measures for each proxy (value-based, genetic, geographic, linguistic and religious) arethe ones given in Figure 2 of the main paper, and further described in the Methods section.
FBDistance Types
0.0
0.1
0.2
0.3
0.4
0.5
0.6
Corre
latio
n
Pearson CorrelationsCulturalGeneticGeographicalLinguisticReligious
Figure S3: Correlations Between Facebook and Selected Distance Measures, Using Full Sample. This figureplots the correlation between Facebook distances and select measures of each of the distance proxies (value-based, genetic, geographic,linguistic and religious). It uses the full sample of countries, rather than the sample that is common to all measures. The select measuresof the distance proxies are the ones given in footnote 1.
We now turn to using more than one measure for each type of distance proxy. As in the main paper, we
use all alternative measures of the five distance proxies (values, genetic, geographic, linguistic, and religious).
Figure S2 reports the results. To explain the difference between the graphs, we focus on the first bar of each
graph. The first bar in Panel (a) shows the semi-partial R2 of a regression of Facebook distances on all value-
based cultural distances, after controlling for all other measures of distance (genetic, geographic, linguistic and
33

religious). The first bar in Panel (b) shows the average semi-partial R2 of a regression of Facebook distances on
each value-based cultural distance separately, after controlling for all other measures of distance (genetic, geo-
graphic, linguistic and religious). All other bars in the two panels show the same information, but for genetic,
geographic, linguistic and religious distances. These graphs confirm our main finding: although all distance
measures partly explain Facebook distances, survey-based cultural distances have the strongest explanatory
power.
Robustness to alternative samples
In this section we explore the robustness of our analysis to various samples. First, Figure S3 plots the correlation
between Facebook distances and select measures of each of the distance proxies, using the full sample of
countries rather than the common sample. The results confirm that the strongest correlation with Facebook
distances are value-based distances from the WVS. Second, Figure S4 shows the results of replicating the main
analysis when we constrain the sample to countries with more than 300,000 people and a Facebook penetration
above 5%. This decreases the number of countries for which we have Facebook distances from 225 to 161. The
results are quantitatively and qualitatively very similar. This is not surprising: most of the countries that drop
out were not in the common sample.
Third, we explore to what extent the representativity of Facebook users affects our findings. For this anal-
ysis, we start by comparing, for each country, its Facebook user composition in terms of gender to the com-
position of its actual gender composition using data from the World Development Indicators in 2017. Starting
from the common sample, we create two groups of countries: a first group of countries that are above the me-
dian difference in gender composition when comparing Facebook users and the actual population, and a second
group of countries that are below the median difference in age composition. In the first group Facebook is less
representative of the population than in the second group. Figures S5 and S6 show the results of splitting the
sample based on gender composition. Reassuringly the results are similar to the main analysis.
Next, we explore the representativity in terms of age composition. Focusing on the population aged 15-64,
we compare the share of FB users aged 15-29 to the share of the actual population aged 15-29. We select this
age split because on average about half of the Facebook users aged 15-64 are in the group 15-29. As before, we
create two groups of countries: a less representative group of countries that are above the median difference in
age composition when comparing Facebook users and the actual population, and a more representative group of
countries that are below the median difference in age composition. Figures S7 and S8 show that similar results
are obtained if we split the sample based on age composition.
In addition to exploring robustness to different samples of countries, we also analyze robustness to different
samples of interest categories. Figure S9 plots the correlation between Facebook distances and each one of the
distance measures for each one of the 14 macro-categories of interests: people; lifestyle and culture; travel,
places and events; empty; hobbies and activities; news and entertainment; shopping and fashion; business
and industry; food and drink; sports and outdoors; education; technology; fitness and wellness; and family
and relationships. Quite a few interests are marked by Facebook as a local business. To ensure differences
between countries are not driven by such local businesses, we add one additional robustness check that focuses
exclusively on interests that are not marked as local businesses. As can be seen in Figure S9, the results do not
differ substantially across these different sub-samples of interests.
34

FBDistance Types
0.0
0.1
0.2
0.3
0.4
0.5
0.6
Corre
latio
nPearson Correlations
CulturalGeneticGeographicalLinguisticReligious
(a) Full Sample
FBDistance Types
0.0
0.1
0.2
0.3
0.4
0.5
0.6
Corre
latio
n
Pearson CorrelationsCulturalGeneticGeographicalLinguisticReligious
(b) Common Sample
FBDistance Types
0.0
0.1
0.2
0.3
0.4
0.5
Corre
latio
n
Pearson CorrelationsCulturalGeneticGeographicalLinguisticReligious
(c) Partial Correlation (Residuals on Residuals)
FBDistance Types
0.0
0.1
0.2
0.3
0.4
Sem
i-Par
tial C
orre
latio
n
Pearson CorrelationsCulturalGeneticGeographicalLinguisticReligious
(d) Semi-Partial Correlation (Actual on Residuals)
Cultural Genetic Geographical Linguistic ReligiousDistance Types
0.00
0.02
0.04
0.06
0.08
Sem
i-Par
tial R
2
Semi-Partial R2
(e) Semi-Partial R2
Figure S4: Correlations Between Facebook and Selected Distance Measures, Robustness to Population Sizeand Facebook Penetration. This figure shows the same information as Figure S1 and S2, with one difference: it does not includethe countries with a population of less than 300,000 and a Facebook penetration of less than 5%. For that different sample, Panel (a)corresponds to Panel (a) of Figure S2, and Panels (b) through (e) correspond to Panels (a) through (d) of Figure S1.
35

FBDistance Types
0.0
0.1
0.2
0.3
0.4
0.5
0.6Co
rrela
tion
Pearson CorrelationsCulturalGeneticGeographicalLinguisticReligious
(a) Full Sample
FBDistance Types
0.0
0.1
0.2
0.3
0.4
0.5
0.6
Corre
latio
n
Pearson CorrelationsCulturalGeneticGeographicalLinguisticReligious
(b) Common Sample
FBDistance Types
0.2
0.1
0.0
0.1
0.2
0.3
0.4
0.5
Corre
latio
n
Pearson CorrelationsCulturalGeneticGeographicalLinguisticReligious
(c) Partial Correlation (Residuals on Residuals)
FBDistance Types
0.2
0.1
0.0
0.1
0.2
0.3
0.4
Sem
i-Par
tial C
orre
latio
n
Pearson CorrelationsCulturalGeneticGeographicalLinguisticReligious
(d) Semi-Partial Correlation (Actual on Residuals)
Cultural Genetic Geographical Linguistic ReligiousDistance Types
0.00
0.01
0.02
0.03
0.04
0.05
0.06
0.07
Sem
i-Par
tial R
2
Semi-Partial R2
(e) Semi-Partial R2
Figure S5: Correlations Between Facebook and Selected Distance Measures, Robustness to Representativity(Gender Difference above Median). This figure shows the same information as Figure S1 and S2, with one difference: using thecommon sample, it only retains the countries where the difference in gender composition of Facebook users and the actual populationis above the median. Hence, it focuses on the subset of countries where Facebook users are least representative of the actual populationin terms of gender. For that sample, Panel (a) corresponds to Panel (a) of Figure S2, and Panels (b) through (e) correspond to Panels(a) through (d) of Figure S1.
36

FBDistance Types
0.0
0.1
0.2
0.3
0.4
0.5
0.6
Corre
latio
nPearson Correlations
CulturalGeneticGeographicalLinguisticReligious
(a) Full Sample
FBDistance Types
0.0
0.1
0.2
0.3
0.4
0.5
0.6
Corre
latio
n
Pearson CorrelationsCulturalGeneticGeographicalLinguisticReligious
(b) Common Sample
FBDistance Types
0.1
0.0
0.1
0.2
0.3
0.4
0.5
Corre
latio
n
Pearson CorrelationsCulturalGeneticGeographicalLinguisticReligious
(c) Partial Correlation (Residuals on Residuals)
FBDistance Types
0.1
0.0
0.1
0.2
0.3
0.4
Sem
i-Par
tial C
orre
latio
n
Pearson CorrelationsCulturalGeneticGeographicalLinguisticReligious
(d) Semi-Partial Correlation (Actual on Residuals)
Cultural Genetic Geographical Linguistic ReligiousDistance Types
0.00
0.01
0.02
0.03
0.04
0.05
0.06
0.07
Sem
i-Par
tial R
2
Semi-Partial R2
(e) Semi-Partial R2
Figure S6: Correlations Between Facebook and Selected Distance Measures, Robustness to Representativity(Gender Difference below Median). This figure shows the same information as Figure S1 and S2, with one difference: using thecommon sample, it only retains the countries where the difference in gender composition of Facebook users and the actual populationis below the median. Hence, it focuses on the subset of countries where Facebook users are most representative of the actual populationin terms of gender. For that sample, Panel (a) corresponds to Panel (a) of Figure S2, and Panels (b) through (e) correspond to Panels(a) through (d) of Figure S1.
37

FBDistance Types
0.0
0.1
0.2
0.3
0.4
0.5
0.6
0.7
0.8Co
rrela
tion
Pearson CorrelationsCulturalGeneticGeographicalLinguisticReligious
(a) Full Sample
FBDistance Types
0.0
0.1
0.2
0.3
0.4
0.5
0.6
0.7
0.8
Corre
latio
n
Pearson CorrelationsCulturalGeneticGeographicalLinguisticReligious
(b) Common Sample
FBDistance Types
0.1
0.0
0.1
0.2
0.3
0.4
0.5
0.6
Corre
latio
n
Pearson CorrelationsCulturalGeneticGeographicalLinguisticReligious
(c) Partial Correlation (Residuals on Residuals)
FBDistance Types
0.1
0.0
0.1
0.2
0.3
0.4
0.5
Sem
i-Par
tial C
orre
latio
n
Pearson CorrelationsCulturalGeneticGeographicalLinguisticReligious
(d) Semi-Partial Correlation (Actual on Residuals)
Cultural Genetic Geographical Linguistic ReligiousDistance Types
0.00
0.02
0.04
0.06
0.08
0.10
0.12
Sem
i-Par
tial R
2
Semi-Partial R2
(e) Semi-Partial R2
Figure S7: Correlations Between Facebook and Selected Distance Measures, Robustness to Representativity(Age Difference Above Median). This figure shows the same information as Figure S1 and S2, with one difference: using thecommon sample, it only retains the countries where the difference in age composition of Facebook users and the actual population isabove the median. Hence, it focuses on the subset of countries where Facebook users are least representative of the actual populationin terms of age. For that sample, Panel (a) corresponds to Panel (a) of Figure S2, and Panels (b) through (e) correspond to Panels (a)through (d) of Figure S1.
38

FBDistance Types
0.1
0.0
0.1
0.2
0.3
0.4
0.5
0.6
0.7
Corre
latio
nPearson Correlations
CulturalGeneticGeographicalLinguisticReligious
(a) Full Sample
FBDistance Types
0.0
0.1
0.2
0.3
0.4
0.5
0.6
0.7
Corre
latio
n
Pearson CorrelationsCulturalGeneticGeographicalLinguisticReligious
(b) Common Sample
FBDistance Types
0.2
0.1
0.0
0.1
0.2
0.3
0.4
0.5
Corre
latio
n
Pearson CorrelationsCulturalGeneticGeographicalLinguisticReligious
(c) Partial Correlation (Residuals on Residuals)
FBDistance Types
0.2
0.1
0.0
0.1
0.2
0.3
0.4
Sem
i-Par
tial C
orre
latio
n
Pearson CorrelationsCulturalGeneticGeographicalLinguisticReligious
(d) Semi-Partial Correlation (Actual on Residuals)
Cultural Genetic Geographical Linguistic ReligiousDistance Types
0.00
0.01
0.02
0.03
0.04
0.05
0.06
0.07
0.08
Sem
i-Par
tial R
2
Semi-Partial R2
(e) Semi-Partial R2
Figure S8: Correlations Between Facebook and Selected Distance Measures, Robustness to Representativity(Age Difference Below Median). This figure shows the same information as Figure S1 and S2, with one difference: using thecommon sample, it only retains the countries where the difference in age composition of Facebook users and the actual population isbelow the median. Hence, it focuses on the subset of countries where Facebook users are most representative of the actual populationin terms of age. For that sample, Panel (a) corresponds to Panel (a) of Figure S2, and Panels (b) through (e) correspond to Panels (a)through (d) of Figure S1.
39
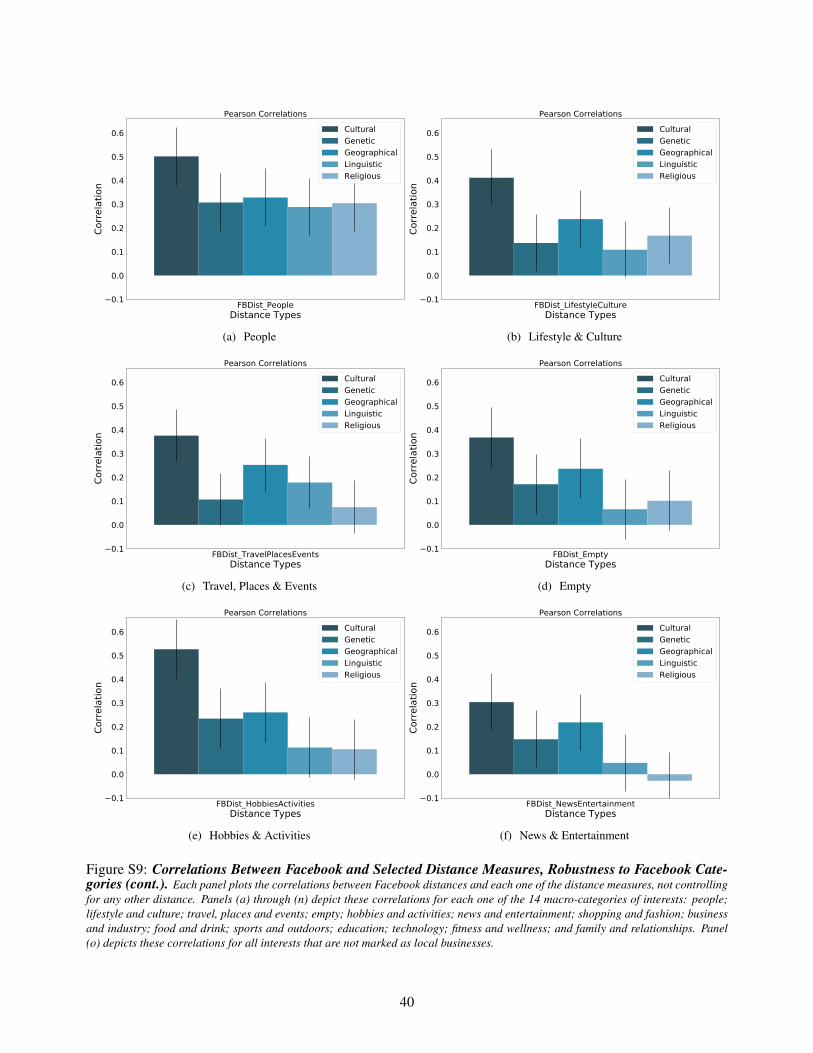
FBDist_PeopleDistance Types
0.1
0.0
0.1
0.2
0.3
0.4
0.5
0.6
Corre
latio
nPearson Correlations
CulturalGeneticGeographicalLinguisticReligious
(a) People
FBDist_LifestyleCultureDistance Types
0.1
0.0
0.1
0.2
0.3
0.4
0.5
0.6
Corre
latio
n
Pearson CorrelationsCulturalGeneticGeographicalLinguisticReligious
(b) Lifestyle & Culture
FBDist_TravelPlacesEventsDistance Types
0.1
0.0
0.1
0.2
0.3
0.4
0.5
0.6
Corre
latio
n
Pearson CorrelationsCulturalGeneticGeographicalLinguisticReligious
(c) Travel, Places & Events
FBDist_EmptyDistance Types
0.1
0.0
0.1
0.2
0.3
0.4
0.5
0.6
Corre
latio
n
Pearson CorrelationsCulturalGeneticGeographicalLinguisticReligious
(d) Empty
FBDist_HobbiesActivitiesDistance Types
0.1
0.0
0.1
0.2
0.3
0.4
0.5
0.6
Corre
latio
n
Pearson CorrelationsCulturalGeneticGeographicalLinguisticReligious
(e) Hobbies & Activities
FBDist_NewsEntertainmentDistance Types
0.1
0.0
0.1
0.2
0.3
0.4
0.5
0.6
Corre
latio
n
Pearson CorrelationsCulturalGeneticGeographicalLinguisticReligious
(f) News & Entertainment
Figure S9: Correlations Between Facebook and Selected Distance Measures, Robustness to Facebook Cate-gories (cont.). Each panel plots the correlations between Facebook distances and each one of the distance measures, not controllingfor any other distance. Panels (a) through (n) depict these correlations for each one of the 14 macro-categories of interests: people;lifestyle and culture; travel, places and events; empty; hobbies and activities; news and entertainment; shopping and fashion; businessand industry; food and drink; sports and outdoors; education; technology; fitness and wellness; and family and relationships. Panel(o) depicts these correlations for all interests that are not marked as local businesses.
40

FBDist_ShoppingFashionDistance Types
0.1
0.0
0.1
0.2
0.3
0.4
0.5
0.6
Corre
latio
nPearson Correlations
CulturalGeneticGeographicalLinguisticReligious
(a) Shopping & Fashion
FBDist_BusinessIndustryDistance Types
0.1
0.0
0.1
0.2
0.3
0.4
0.5
0.6
Corre
latio
n
Pearson CorrelationsCulturalGeneticGeographicalLinguisticReligious
(b) Business & Industry
FBDist_FoodDrinkDistance Types
0.1
0.0
0.1
0.2
0.3
0.4
0.5
0.6
Corre
latio
n
Pearson CorrelationsCulturalGeneticGeographicalLinguisticReligious
(c) Food & Drink
FBDist_SportsOutdoorsDistance Types
0.1
0.0
0.1
0.2
0.3
0.4
0.5
0.6
Corre
latio
n
Pearson CorrelationsCulturalGeneticGeographicalLinguisticReligious
(d) Sports & Outdoors
FBDist_EducationDistance Types
0.1
0.0
0.1
0.2
0.3
0.4
0.5
0.6
Corre
latio
n
Pearson CorrelationsCulturalGeneticGeographicalLinguisticReligious
(e) Education
FBDist_TechnologyDistance Types
0.1
0.0
0.1
0.2
0.3
0.4
0.5
0.6
Corre
latio
n
Pearson CorrelationsCulturalGeneticGeographicalLinguisticReligious
(f) Technology
Figure S9: Correlations Between Facebook and Selected Distance Measures, Robustness to Facebook Cate-gories (cont.). Each panel plots the correlations between Facebook distances and each one of the distance measures, not controllingfor any other distance. Panels (a) through (n) depict these correlations for each one of the 14 macro-categories of interests: people;lifestyle and culture; travel, places and events; empty; hobbies and activities; news and entertainment; shopping and fashion; businessand industry; food and drink; sports and outdoors; education; technology; fitness and wellness; and family and relationships. Panel(o) depicts these correlations for all interests that are not marked as local businesses.
41

FBDist_FitnessWellnessDistance Types
0.1
0.0
0.1
0.2
0.3
0.4
0.5
0.6
Corre
latio
n
Pearson CorrelationsCulturalGeneticGeographicalLinguisticReligious
(g) Fitness & Wellness
FBDist_FamilyRelationshipsDistance Types
0.1
0.0
0.1
0.2
0.3
0.4
0.5
0.6
Corre
latio
n
Pearson CorrelationsCulturalGeneticGeographicalLinguisticReligious
(h) Family & Relationships
FBDist_NonLocalBusDistance Types
0.1
0.0
0.1
0.2
0.3
0.4
0.5
0.6
Corre
latio
n
Pearson CorrelationsCulturalGeneticGeographicalLinguisticReligious
(i) Non Local Business
Figure S9: Correlations Between Facebook and Selected Distance Measures, Robustness to Facebook Cate-gories (cont.). Each panel plots the correlations between Facebook distances and each one of the distance measures, not controllingfor any other distance. Panels (a) through (n) depict these correlations for each one of the 14 macro-categories of interests: people;lifestyle and culture; travel, places and events; empty; hobbies and activities; news and entertainment; shopping and fashion; businessand industry; food and drink; sports and outdoors; education; technology; fitness and wellness; and family and relationships. Panel(o) depicts these correlations for all interests that are not marked as local businesses.
42
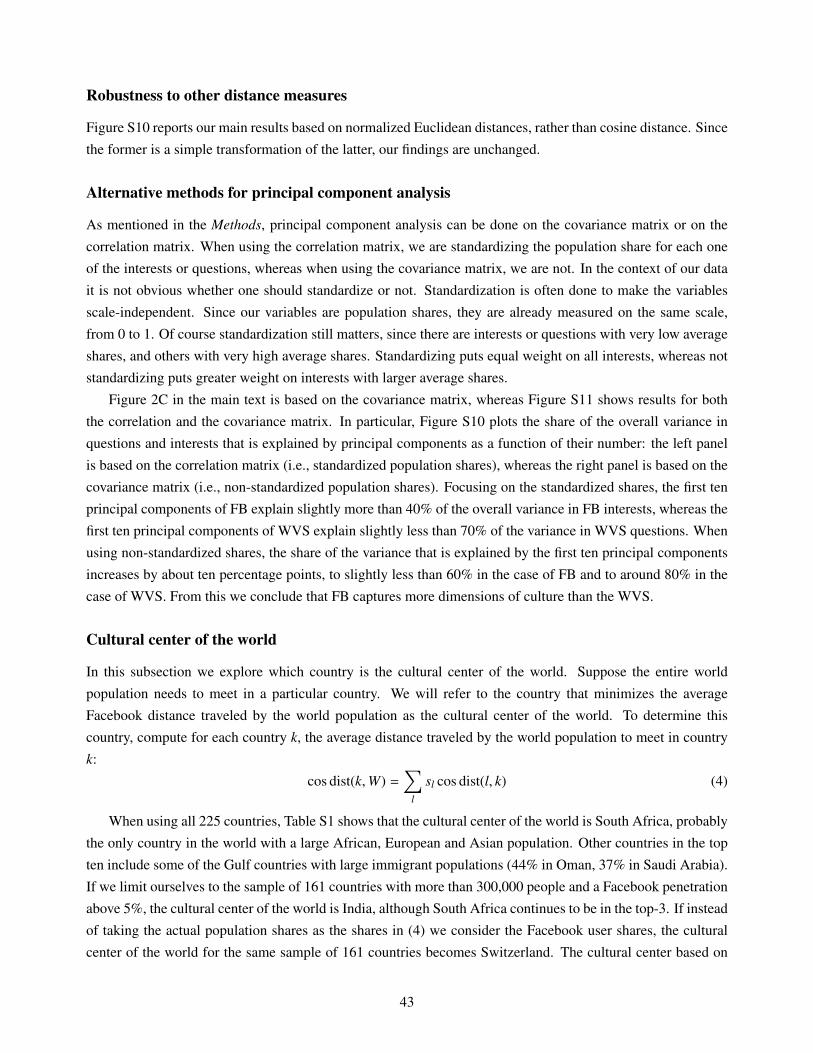
Robustness to other distance measures
Figure S10 reports our main results based on normalized Euclidean distances, rather than cosine distance. Since
the former is a simple transformation of the latter, our findings are unchanged.
Alternative methods for principal component analysis
As mentioned in the Methods, principal component analysis can be done on the covariance matrix or on the
correlation matrix. When using the correlation matrix, we are standardizing the population share for each one
of the interests or questions, whereas when using the covariance matrix, we are not. In the context of our data
it is not obvious whether one should standardize or not. Standardization is often done to make the variables
scale-independent. Since our variables are population shares, they are already measured on the same scale,
from 0 to 1. Of course standardization still matters, since there are interests or questions with very low average
shares, and others with very high average shares. Standardizing puts equal weight on all interests, whereas not
standardizing puts greater weight on interests with larger average shares.
Figure 2C in the main text is based on the covariance matrix, whereas Figure S11 shows results for both
the correlation and the covariance matrix. In particular, Figure S10 plots the share of the overall variance in
questions and interests that is explained by principal components as a function of their number: the left panel
is based on the correlation matrix (i.e., standardized population shares), whereas the right panel is based on the
covariance matrix (i.e., non-standardized population shares). Focusing on the standardized shares, the first ten
principal components of FB explain slightly more than 40% of the overall variance in FB interests, whereas the
first ten principal components of WVS explain slightly less than 70% of the variance in WVS questions. When
using non-standardized shares, the share of the variance that is explained by the first ten principal components
increases by about ten percentage points, to slightly less than 60% in the case of FB and to around 80% in the
case of WVS. From this we conclude that FB captures more dimensions of culture than the WVS.
Cultural center of the world
In this subsection we explore which country is the cultural center of the world. Suppose the entire world
population needs to meet in a particular country. We will refer to the country that minimizes the average
Facebook distance traveled by the world population as the cultural center of the world. To determine this
country, compute for each country k, the average distance traveled by the world population to meet in country
k:
cos dist(k,W) =∑
l
sl cos dist(l, k) (4)
When using all 225 countries, Table S1 shows that the cultural center of the world is South Africa, probably
the only country in the world with a large African, European and Asian population. Other countries in the top
ten include some of the Gulf countries with large immigrant populations (44% in Oman, 37% in Saudi Arabia).
If we limit ourselves to the sample of 161 countries with more than 300,000 people and a Facebook penetration
above 5%, the cultural center of the world is India, although South Africa continues to be in the top-3. If instead
of taking the actual population shares as the shares in (4) we consider the Facebook user shares, the cultural
center of the world for the same sample of 161 countries becomes Switzerland. The cultural center based on
43

FBDistance Types
0.1
0.0
0.1
0.2
0.3
0.4
Corre
latio
nPearson Correlations
CulturalGeneticGeographicalLinguisticReligious
(j) Full Sample
FBDistance Types
0.0
0.1
0.2
0.3
0.4
Corre
latio
n
Pearson CorrelationsCulturalGeneticGeographicalLinguisticReligious
(k) Common Sample
FBDistance Types
0.1
0.0
0.1
0.2
0.3
Corre
latio
n
Pearson CorrelationsCulturalGeneticGeographicalLinguisticReligious
(l) Partial Correlation (Residuals on Residuals)
FBDistance Types
0.1
0.0
0.1
0.2
0.3
Sem
i-Par
tial C
orre
latio
n
Pearson CorrelationsCulturalGeneticGeographicalLinguisticReligious
(m) Semi-Partial Correlation (Actual on Residuals)
Cultural Genetic Geographical Linguistic ReligiousDistance Types
0.000
0.005
0.010
0.015
0.020
0.025
0.030
0.035
0.040
Sem
i-Par
tial R
2
Semi-Partial R2
(n) Semi-Partial R2
Figure S10: Correlations Between Facebook and Selected Distance Measures, Euclidean Distances. Thisfigure shows the same information as Figure S1 and S2, with one difference: it uses Euclidean, rather than cosine distances. UsingEuclidean distances, Panel (a) corresponds to Panel (a) of Figure S2, and Panels (b) through (e) correspond to Panels (a) through (d)of Figure S1.
44

0 10 20 30 40 50 60 70Number of components
0.2
0.4
0.6
0.8
1.0C
umul
ativ
e ex
plai
ned
varia
nce
FacebookWVS
(a) Variance explained by PC (correlation)
0 10 20 30 40 50 60 70Number of components
0.0
0.2
0.4
0.6
0.8
1.0
Cum
ulat
ive
expl
aine
d va
rianc
e
FacebookWVS
(b) Variance explained by PC (covariance)
Figure S11: Variance explained by principal components. This figure shows the number of independent underlyingfactors behind the variation in our Facebook measure and compares it to the traditional values-based measure. Specifically, it showsthe cumulative share of total variation in our Facebook measure and the values-based measure explained by principal components.Panel (a) plots explained variance after standardizing, i.e. using the correlation matrix. Panel (b) plots explained variance withoutstandardizing, i.e. using the covariance matrix.
Facebook users benefits either countries with large Facebook populations (such as the US) or countries that are
culturally close to the bulk of world Facebook users (such as Switzerland or Belgium).
One advantage of using Facebook data to determine the cultural center of the world is its global coverage.
For example, standard values surveys often undersample certain regions of the world. Needless to say, this
introduces important distortions.
1. Top-10, weighted by actual populations, sample of 225 countries:South Africa, India, China, Oman, Russia, Benin, France, Tajikistan, Central African Republic, Saudi Arabia
2. Top-10, weighted by actual populations, sample of 161 countries:India, Oman, South Africa, Saudi Arabia, Germany, Qatar, France, Kyrgyzstan, Bahrain, Switzerland
3. Top-10, weighted by Facebook users, sample of 225 countries:South Africa, France, Switzerland, Canada, US, Belgium, Germany, Great Britain, Guyana, Panama
4. Top-10, weighted by Facebook users, sample of 161 countries:Switzerland, France, Germany, Belgium, Canada, South Africa, Great Britain, Panama, US, Guyana
Table S1: Cultural center of the world. This table reports the top-10 countries that minimize the average distance the worldpopulation (or the world Facebook users) would need to travel if they were to meet in the same location. Calculations are based on(4), and differ depending on samples and weights. The sample can either be all 225 countries for which Facebook data are available(cases 1 and 3) or the subsample of 161 countries with a population of more than 300,000 and a Facebook penetration of more than5% (cases 2 and 4). The distance can either be weighted by actual populations (case 1 and 2) or by Facebook users (cases 3 and 4).
45

Cultural sister regions
In this subsection we identify for each subnational region of ten countries the “sister region”, defined as the
closest foreign region according to Facebook distances. Table S2 shows the results for the subnational regions
of ten countries: United States (US), Spain (ES), France (FR), Germany (DE), Italy (IT), Portugal (PT), Great
Britain (GB), Belgium (BE), Netherlands (NL) and Ireland (IE). For each subnational region, the cultural sister
has to be in one of the other nine countries.
Table S2: “Sister region” for each region in a sample of ten countries: the United States (US), Spain (ES), France(FR), Germany (DE), Italy (IT), Portugal (PT), Great Britain (GB), Belgium (BE), Netherlands (NL) and Ireland (IE). A sister regionis defined as the foreign region in one of the other nine countries that is closest according to Facebook distances.
Several results stand out. First, the sister regions tend to be located in the countries that are closest in the
dendrogram in Figure 3. For example, the sister regions of U.S. states are in Great Britain, the sister regions of
France are in Belgium, and the sister regions of the German Länder are in the Netherlands. Second, subnational
regions sometimes have sister regions in different countries, depending on linguistic or geographic proximity.
46

For example, most regions in Spain have sister regions in Italy. However, Galicia, a region in northwest Spain
that speaks a language closely related to Portuguese, has as sister region Lisbon. Likewise, the Dutch-speaking
region of Belgium has as sister region Limburg in the southern Netherlands, whereas the French-speaking
region of Belgium has as sister region Lorraine in France. As another example, England has as sister region the
state of New York, whereas Scotland has as sister region County Louth on the eastern coast of Ireland. Italy
also shows some interesting patterns: while most of its regions are paired to Corsica, a French island with an
Italian dialect, the region of Trentino-Alto Adige with a large German-speaking population is paired to Bavaria.
Third, the urban nature of regions also sometimes matters. For example, the Paris region of Ile-de-France has
as sister region Brussels, the capital of Belgium. The same is true for the French region of Rhône-Alpes, home
to the second-largest metropolitan area Lyon.
Regional divisiveness and gender divisiveness
Given their importance, it is interesting to compare regional differences and gender differences. Broadly speak-
ing, our findings suggest that in most developed countries the gender divide is larger than the regional divide,
whereas in many developing countries the regional divide continues to be important (Figure 7).
Rather than comparing the average interregional distance with the gender distance, we could also compare
all bilateral distances between regions in a given country to the bilateral distance between genders in that same
country. Figure S12 displays for each country a kernel density plot of the bilateral distances between regions as
well as the bilateral distance between genders. Two observations stand out. First, interregional distances vary
widely, both in their variance across countries and in some cases in their variance within countries. Second, in
comparison, gender differences are relatively similar across countries.
In some countries, such as France and Germany, the distance between genders is greater than the bilateral
distance between any two regions. For many other countries, the picture is more complex. Take, for instance,
the United States. There, the gender difference is greater than many, but not all, interstate differences. As a com-
parison: while the average distance between Texas and California residents is larger than the average distance
between men and women in the U.S., the opposite is true for the average distance between Massachusetts and
Connecticut residents or between New Mexico and Colorado residents. As another example, consider Kenya.
There, the average gender divide is similar to the average regional divide. However, the regional divide between
the North Eastern Province, inhabited by Somalis, and the rest of the country is huge. As a last example, take
India. In that country, the regional differences are on average much larger than the gender difference, but there
are exceptions, such as the distance between Uttar Pradesh and Madhya Pradesh, two neighboring northern
states.
Specific cultural traits
While our results suggest that the broad set of Facebook interests are able to provide an overall measure of
culture, this section explores whether they can also capture specific cultural traits of interest to social scientists.
To that end, we use a supervised machine learning algorithm that uses Facebook interests to predict close to 50
specific cultural traits or attributes, ranging from generosity to kinship tightness, from uncertainty avoidance
to son bias, and from beef consumption to contraceptive use. The second column of Table S3 then reports
47

0.0 0.1 0.2 0.3 0.4 0.5Facebook Distance
0
1
2
3
4
5
6
Dens
ity
RegionalGender
(a) Belgium
0.0 0.1 0.2 0.3 0.4 0.5Facebook Distance
0
2
4
6
8
10
12
14
16
Dens
ity
RegionalGender
(b) France
0.0 0.1 0.2 0.3 0.4 0.5Facebook Distance
0.0
2.5
5.0
7.5
10.0
12.5
15.0
17.5
Dens
ity
RegionalGender
(c) Germany
0.0 0.1 0.2 0.3 0.4 0.5Facebook Distance
0
5
10
15
20De
nsity
RegionalGender
(d) Ireland
0.0 0.1 0.2 0.3 0.4 0.5Facebook Distance
0
2
4
6
8
10
12
14
Dens
ity
RegionalGender
(e) Italy
0.0 0.1 0.2 0.3 0.4 0.5Facebook Distance
0
2
4
6
8
10
12
Dens
ity
RegionalGender
(f) Netherlands
Figure S12: Kernel density plots of interregional bilateral distances (blue) and gender distances (red). Thisfigure displays histograms of bilateral distances between regions and bilateral distances between genders for 18 countries (BE: Belgium,BR: Brazil, DE: Germany, ES: Spain, FR: France, GB: Great Britain, IE: IN: India, Ireland, IT: Italy, KE: Kenya, MU: Mauritius, MX:Mexico, NG: Nigeria, NL: Netherlands, PT: Portugal, SV: El Salvador, TH: Thailand, US: United States). All figures have the samehorizontal scale.
48
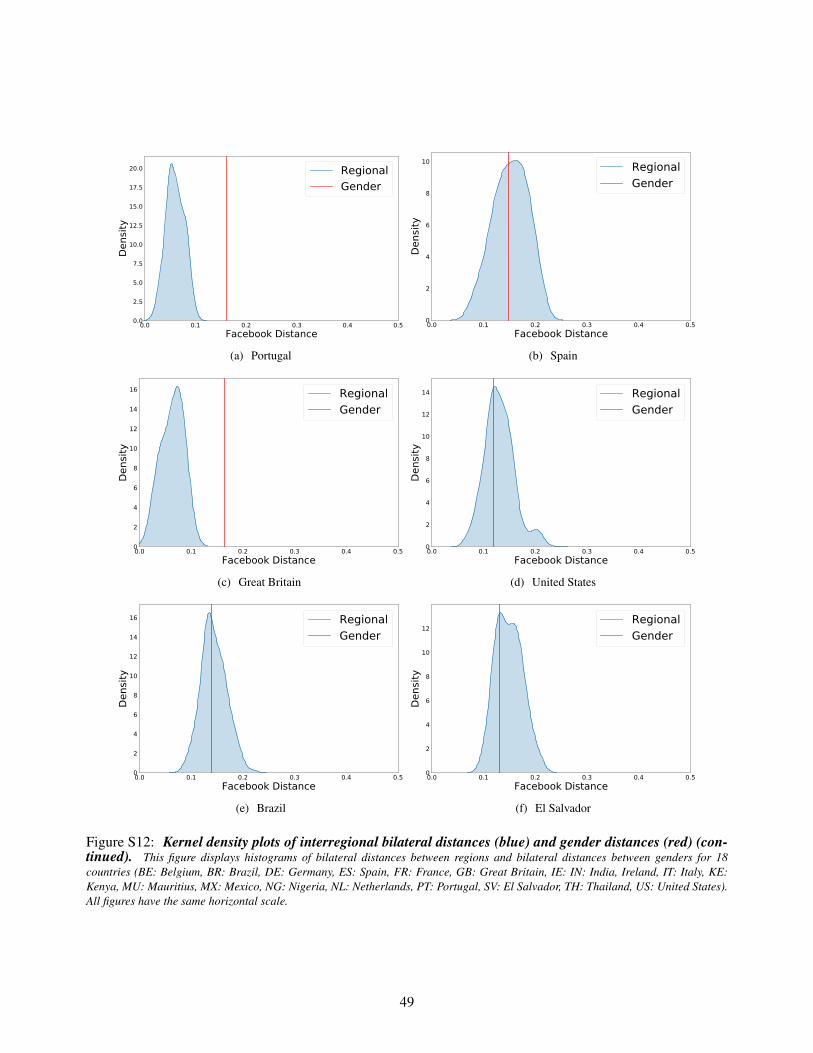
0.0 0.1 0.2 0.3 0.4 0.5Facebook Distance
0.0
2.5
5.0
7.5
10.0
12.5
15.0
17.5
20.0
Dens
ity
RegionalGender
(a) Portugal
0.0 0.1 0.2 0.3 0.4 0.5Facebook Distance
0
2
4
6
8
10
Dens
ity
RegionalGender
(b) Spain
0.0 0.1 0.2 0.3 0.4 0.5Facebook Distance
0
2
4
6
8
10
12
14
16
Dens
ity
RegionalGender
(c) Great Britain
0.0 0.1 0.2 0.3 0.4 0.5Facebook Distance
0
2
4
6
8
10
12
14
Dens
ityRegionalGender
(d) United States
0.0 0.1 0.2 0.3 0.4 0.5Facebook Distance
0
2
4
6
8
10
12
14
16
Dens
ity
RegionalGender
(e) Brazil
0.0 0.1 0.2 0.3 0.4 0.5Facebook Distance
0
2
4
6
8
10
12
Dens
ity
RegionalGender
(f) El Salvador
Figure S12: Kernel density plots of interregional bilateral distances (blue) and gender distances (red) (con-tinued). This figure displays histograms of bilateral distances between regions and bilateral distances between genders for 18countries (BE: Belgium, BR: Brazil, DE: Germany, ES: Spain, FR: France, GB: Great Britain, IE: IN: India, Ireland, IT: Italy, KE:Kenya, MU: Mauritius, MX: Mexico, NG: Nigeria, NL: Netherlands, PT: Portugal, SV: El Salvador, TH: Thailand, US: United States).All figures have the same horizontal scale.
49

0.0 0.1 0.2 0.3 0.4 0.5Facebook Distance
0
2
4
6
8
10
12
14
16
Dens
ity
RegionalGender
(g) Mexico
0.0 0.1 0.2 0.3 0.4 0.5Facebook Distance
0
1
2
3
4
5
6
Dens
ity
RegionalGender
(h) Kenya
0.0 0.1 0.2 0.3 0.4 0.5Facebook Distance
0
1
2
3
4
5
6
7
Dens
ity
RegionalGender
(i) Mauritius
0.0 0.1 0.2 0.3 0.4 0.5Facebook Distance
0
1
2
3
4
5
6
7
8
Dens
ity
RegionalGender
(j) Nigeria
0.0 0.1 0.2 0.3 0.4 0.5Facebook Distance
0
1
2
3
4
5
Dens
ity
RegionalGender
(k) India
0.0 0.1 0.2 0.3 0.4 0.5Facebook Distance
0
5
10
15
20
25
Dens
ity
RegionalGender
(l) Thailand
Figure S12: Kernel density plots of interregional bilateral distances (blue) and gender distances (red) (contin-ued). This figure displays histograms of bilateral distances between regions and bilateral distances between genders for 18 countries(BE: Belgium, BR: Brazil, DE: Germany, ES: Spain, FR: France, GB: Great Britain, IE: IN: India, Ireland, IT: Italy, KE: Kenya, MU:Mauritius, MX: Mexico, NG: Nigeria, NL: Netherlands, PT: Portugal, SV: El Salvador, TH: Thailand, US: United States). All figureshave the same horizontal scale.
50
the correlations between the predicted cultural attributes and the observed cultural attributes. We find an av-
erage correlation of 0.59, suggesting that the broad set of Facebook interests is able to capture specific, more
traditional cultural traits, providing further validation of our measure.
To describe our approach in more detail, suppose we want to predict a country’s degree of generosity.
As inputs, we use the matrix of all Facebook interests and a vector of the degree of generosity from another
data source (in this case, from the World Happiness Report). Using a training sample that consists of 90% of
the countries, the Mathematica command “predict” then chooses among a set of standard supervised machine
learning algorithms and predicts the degree of generosity in the test sample that consists of the 10% remaining
countries. By running this algorithm 100 times on varying training samples,we obtain values for the average
predicted generosity by country. We then correlate the generosity as predicted by Facebook to the generosity
as observed in the data.
Alternatively, instead of using all Facebook interests to predict cultural traits, we can also use the principal
components of the Facebook interests. The third column in Table S3 reports the correlations between predicted
and observed cultural traits, based on the first 20 principal components. The correlations are slightly higher, at
an average of 0.64.
Retrieving the cultural outliers of US regions
This section provides added detail on Table 1 in the main text. Interestingly, Hawaii is the state with the most
cultural outliers (147), over 2.5 times the number of outliers of the second highest state, Alaska (62). Further,
the three states tied for third most cultural outliers (56) are Florida, Louisiana, and Texas. In contrast, the state
with least cultural outliers is Pennsylvania (9) followed by Virginia (10) and Missouri (12).
Hawaii, the state with most cultural outliers, is the only state which is fully separated from continental North
America. Further, Hawaii has strong cultural influence from other Pacific and Asian countries. There are several
outlier cultural interests that show the clear influence of surf in the Hawaiian culture. We can find interests such
as “Surf”, “Windsurf”, “Big Wave Surfing”, “Surfer (magazine)” or “Surfline”, as well as clothing brands using
the surf concept as a marketing strategy: “Rip Curl”, “QuickSilver”, “Billabong”. In the case of Alaska, a key
cultural element is its relation with the Arctic, which makes Alaska different from other US states. We find
explicit items such as “Arctic” and “Arctic Ocean”, and other indirect items like “Magnetic Field” or “North
Pole” among its cultural outliers. Looking at Louisiana, we discover multiple cultural outliers that are very
related to one of the main fingerprints of this state: its Cajun cuisine. We find explicit interests such as “Cajun
Cuisine”, “Tabasco”, and “Tabasco sauce” as cultural outliers of Louisiana. Furthermore, another important
cultural element in New Orleans (the largest city) is Mardi Gras. Both “Mardi Gras” and “Carnival” appears as
cultural outliers for Louisiana. In Utah, we find a cultural element highly linked to this state. Utah has more
than two million Mormons, which is about one-third of the total number of Mormons in the United States. The
cultural outliers of Utah capture this phenomenon and list several elements related to the Mormons: “Mormon”,
“Book of Mormon” and “Mormon Channel”.
Dendrogram with full sample of countries
Figure S13 depicts the dendrogram from the main text, employing the full sample of Facebook countries.
51

Cultural Dimension /
Sub-DimensionFB In-terests
20PC
Obs Source
DemographicFertility rate 0.85 0.88 156 Fertility rate 2017, WDI, World Bank90
Age first marriage, men 0.66 0.72 131 Age first marriage men 2005-2014 (United Nations)91
Age first marriage, women 0.73 0.79 147 Age first marriage women 2005-2014 (United Nations)91
Food and DrinksAlcohol, both sexes 0.77 0.83 150 Alcohol per capita, both sexes 2010-2016 (WHO)92
Alcohol, women 0.79 0.85 150 Alcohol per capita, female 2010-2016 (WHO)92
Alcohol, men 0.78 0.83 150 Alcohol per capita, male 2010-2016 (WHO)92
Beef consumption 0.53 0.63 142 Beef and buffalo consumption kg per capita 2013 (FAO)93
Pork consumption 0.84 0.88 138 Pig consumption kg per capita 2013 (FAO)93
Poultry consumption 0.62 0.72 142 Poultry consumption kg per capita 2013 (FAO)93
Mutton and goat consumption 0.52 0.55 142 Mutton and goat consumption kg per capita 2013 (FAO)93
Other meat consumption 0.38 0.49 142 Other meat consumption kg per capita 2013 (FAO)93
Gender issuesContraceptive use, women 0.78 0.78 118 Contraceptive use, women ages 15-49, 2010-2019, UNICEF90
Discriminatory work normsagainst women
0.78 0.81 148 Males 15+ who agree it is unacceptable for women to work, 2016,Georgetown GIWPS94
Gender inequality index, UN 0.80 0.93 141 Gender inequality index UN 201895
Female employment 0.67 0.62 149 Employment women ages 25+, 2018, Georgetown GIWPS94
Gender gap 0.72 0.73 134 World Economic Forum Global Gender Gap, 2017-202096
Community safety, women 0.57 0.60 148 Perception community safety among women ages 15+, 2010-16,Georgetown GIWPS94
Intimate partner violence 0.66 0.66 147 Intimate partner violence experienced by women, 2000-2017,Georgetown GIWPS94
Son bias 0.58 0.61 149 Male to female ratio at birth, 2015-20, Georgetown GIWPS94
Women in parliament 0.45 0.48 148 Parliamentary seats held by women, 2019, Georgetown GIWPS94
WellbeingSubjective well-being 0.76 0.84 126 Life ladder 2018 (World Happiness Report)97
Healthy life expectancy 0.83 0.90 123 Healthy life expectancy at birth 2018 (World Happiness Report)97
Insufficient physical exercise 0.44 0.52 128 Insufficient physical activity adults (%), 2016 (WHO)92
Freedom to make life choices 0.44 0.55 126 Freedom to make life choices 2018 (World Happiness Report)97
Generosity 0.42 0.40 117 Generosity 2018 (World Happiness Report)97
Social support 0.75 0.78 126 Social support 2018 (World Happiness Report)97
Suicide rate 0.56 0.61 148 Crude suicide rates (per 100 000 population) 2016, WHO98
SocietySocial capital 0.75 0.77 129 Social capital 2018-2019 (World Economic Forum)99
Relational mobility 0.70 0.65 39 Relational mobility Thomson et al PNAS28
Nepotism in business 0.68 0.85 106 Nepotism in business (Enke, based on Van de Vliert)100
Kinship tightness 0.72 0.73 149 Kinship tightness score (Enke)100
Nuclear family 0.56 0.53 147 Nuclear family (Enke, based on Ethnographic Atlas andGiuliano)100
Perception of corruption 0.62 0.72 121 Perception of corruption 2018 (World Happiness Report)97
Ethnolinguistic fractionalization 0.48 0.44 153 ELF6 (Desmet, Ortuño and Wacziarg)26
Global Preferences SurveyAltruism -0.15 0.12 72 Altruism (Global Preferences Survey)101,102
Trust 0.41 0.43 72 Trust (Global Preferences Survey)101,102
Negative reciprocity 0.04 0.06 72 Negative reciprocity Global Preferences Survey)101,102
Positive reciprocity 0.08 0.09 72 Positive reciprocity (Global Preferences Survey)101,102
Risk taking 0.33 0.37 72 Willingness to take risks (Global Preferences Survey)101,102
Patience 0.63 0.71 72 Patience (Global Preferences Survey)101,102
Hofstede valuesIndulgence vs restraint 0.68 0.66 88 Indulgence vs restraint (Hofstede)103
Uncertainty avoidance 0.56 0.65 69 Uncertainty avoidance index (Hofstede)103
Long-term orientation 0.77 0.82 89 Long-term orientation vs short-term orientation (Hofstede)103
Masculinity vs femininity 0.44 0.50 69 Masculinity vs femininity (Hofstede)103
Individualism vs collectivism 0.82 0.81 69 Individualism vs collectivism (Hofstede)103
Power distance 0.48 0.66 69 Power distance index (Hofstede)103
Table S3: Correlations between observed cultural traits and those same cultural traits as predicted by FBinterests using a machine learning algorithm. Column 2 uses all FB interests in predicting, Column 3 uses the first 20principal components of FB interests in predicting, and Column 4 gives the number of observations.
52

Figure S13: Hierarchical clustering of all in-sample countries based on Facebook distances. Dendrogram isgenerated using the cosine distance and Ward linkage method. All countries in the Facebook data are included. The color of a country’slink represents its membership to a main cluster, while the color of its name represents its membership to a sub-cluster. Two countriesof the same name color (respectively link color) are closer to each other than to a country of a different name (respectively link) color.
53

Examples of FB interests associated with different traditional and non-traditional cultural traits
Cultural trait Category Examples of FB InterestsArts Traditional Abstract Art, African Art, Art Deco, Art museum, Art history, Art rock, Body art, Byzan-
tine Art, Ceramic Art, Conceptual art, Contemporary Art Gallery, Cooking art, Cover art,Digital art, Fine-art photography, Folk art, Glass art, Gothic art, History of art, Interac-tive art, Japanese art, Louvre Art Museum, Make Up Art, Medieval art, MetropolitanMuseum of Art, Mexican art, Modern art, Museum of Contemporary Art, Museum ofModern Art, Nail Art, National Gallery of Art, New media art, Performance art, Pixelart, Pop art, Public art, Red Ted Art, Sound art, Tattoos and Tattoo art, Thai Temple artand architecture, Van Gogh Museum Art Museum. Video art, Visionary art, Wearableart, Wood art, Latte art.
Formalities Traditional Arranged Marriage, Civil Marriage, Marriage (Catholic Church), Marriage in Islam,Marriage license, Marriage vows, Civil procedure, Criminal procedure, Ritual, Ritualpurification, Rite, Rite Aid, Rite of passage, Prenuptial Agreement, Vehicle RegistrationPlate.
Religion Traditional Religion, Afro-american Religion, Confession (religion), Glory (religion), Transcen-dence (religion), Yoruba religion, Islam, Abraham in Islam, David in Islam, Five Pillarsof Islam, God in Islam, Jesus in Islam, Intimate parts (Islam), Islam is Beautiful, Islamin the United States, Islam in India, Islam in Malaysia, Marriage in Islam, Shia Islam,Shirk (Islam), Studying Islam, Sunni Islam, Women in Islam, Born again (Christian-ity), Christianity, Disciple (Christianity), Early Christianity, Eastern Christianity, Eter-nal life (Christianity), God in Christianity, Grace (Christianity), Heaven (Christianity),Holy Spirit (Christianity), Minister (Christianity), Mission (Christianity), Passion (Chris-tianity), Western Christianity, Judaism, Jewish culture, Jewish prayer, Conservative Ju-daism, Messianic Judaism, Orthodox Judaism, Reform Judaism, Christian prayer, Mass(liturgy).
Politics Traditional Politics, Centre-right politics, Far-left politics, Far-right politics, Gun politics in theUnited States, Green politics, Law and order (politics), Left-wing politics, Opposition(politics), Politics and Social Issues, Right-wing politics, Speaker (politics), Whip (pol-itics), Brazilian Republican Party, Idaho Republican Party, Republican National Con-vention, Republican National Committee, Republican Left of Catalonia, RepublicanParty of Florida, Republican Party of Texas, Republican People’s Party (Turkey), Re-publican Party (United States), Democrat Party (Thailand), Brazilian Democratic Move-ment Party, Christian Democratic Party (Chile), Christian Democratic People’s Partyof Switzerland, Christian Democratic Union (Germany), Idaho Democratic Party, Lib-eral Democratic Party (Japan), Liberal Democracy, Democratic Party (United States),Democratic Socialism, Socialism, Communism, Brazilian Socialist Party, Italian Social-ist Party, Spanish Socialist Worker’s Party, Barack Obama, Donald Trump, Bill Clinton,Hillary Clinton.
SocialStructures
Traditional Family, Marriage, Town hall, Municipality, State, Government, Executive (government),Church service, Social Security, Police, Army, Non-Governmental Organisation.
Angry Birds Non-Traditional Angry Birds, Angry Birds (video game), Angry Birds 2 Angry Birds Epic, Angry BirdsPOP! -Bubble Shooter, angry birds friends
Soccer fans Non-Traditional Real Madrid C.F, History of Real Madrid C.F., Real Madrid Fans, Real Madrid FansClub, FC Barcelona, FC Barcelona Fans Club, F.C. United of Manchester, ManchesterCity F.C, Manchester City F.C. Supporters.
Loungewear Non-Traditional Tracksuit, Shorts, Bermuda shorts, Boxer shorts, T-shirt, Sports bra.Running Non-Traditional Running, Barefoot running, Cross country running, Long-distance running, Middle-
distance running, Mizuno running North America, Road running, Sprint (running), Sta-dion (running race), Trail running, Women’s Running Magazine, Adidas running, Brooksrunning, Ironman Triathlon, Half marathon, Marathon
Table S4: Table mapping FB interests to cultural traits both used in traditional measures of culture and non-traditional ones. This table illustrates actual FB interests included in the interest set used in the paper that can be mapped intospecific cultural traits. We have selected nine cultural traits in this table divided into two groups. First, cultural traits that are usuallyemployed in traditional measures of culture (arts, formalities, religion, politics and social structures). Second, traits that our measureof culture also captures but are not used in traditional measures of culture (angry birds, football fans, loungewear and running).
54
Related Documents