Exotic Spartina alterniflora invasion alters ecosystem– atmosphere exchange of CH 4 and N 2 O and carbon sequestration in a coastal salt marsh in China JUNJI YUAN 1,2 , WEIXIN DING 1 , DEYAN LIU 1 , HOJEONG KANG 3 , CHRIS FREEMAN 4 , JIAN XIANG 1,2 andYONGXIN LIN 1,2 1 State Key Laboratory of Soil and Sustainable Agriculture, Institute of Soil Science, Chinese Academy of Sciences, Nanjing 210008, China, 2 University of Chinese Academy of Sciences, Beijing 10049, China, 3 School of Civil and Environmental Engineering, Yonsei University, Seoul 120–749, Korea, 4 School of Biological Sciences, Bangor University, Gwynedd LL57 2UW, UK Abstract Coastal salt marshes are sensitive to global climate change and may play an important role in mitigating global warming. To evaluate the impacts of Spartina alterniflora invasion on global warming potential (GWP) in Chinese coastal areas, we measured CH 4 and N 2 O fluxes and soil organic carbon sequestration rates along a transect of coastal wetlands in Jiangsu province, China, including open water; bare tidal flat; and invasive S. alterniflora, native Suaeda salsa, and Phragmites australis marshes. Annual CH 4 emissions were estimated as 2.81, 4.16, 4.88, 10.79, and 16.98 kg CH 4 ha 1 for open water, bare tidal flat, and P. australis, S. salsa, and S. alterniflora marshes, respectively, indicating that S. alterniflora invasion increased CH 4 emissions by 57–505%. In contrast, negative N 2 O fluxes were found to be significantly and negatively correlated (P < 0.001) with net ecosystem CO 2 exchange during the growing season in S. alterniflora and P. australis marshes. Annual N 2 O emissions were 0.24, 0.38, and 0.56 kg N 2 O ha 1 in open water, bare tidal flat and S. salsa marsh, respectively, compared with -0.51 kg N 2 O ha 1 for S. alterniflora marsh and 0.25 kg N 2 O ha 1 for P. australis marsh. The carbon sequestration rate of S. alterniflora marsh amounted to 3.16 Mg C ha 1 yr 1 in the top 100 cm soil profile, a value that was 2.63- to 8.78-fold higher than in native plant marshes. The estimated GWP was 1.78, 0.60, 4.09, and 1.14 Mg CO 2 eq ha 1 yr 1 in open water, bare tidal flat, P. australis marsh and S. salsa marsh, respectively, but dropped to 11.30 Mg CO 2 eq ha 1 yr 1 in S. alterniflora marsh. Our results indicate that although S. alterniflora invasion stimulates CH 4 emissions, it can efficiently mitigate increases in atmospheric CO 2 and N 2 O along the coast of China. Keywords: atmospheric N 2 O consumption, carbon sequestration, GWP, N-limit, Spartina alterniflora invasion, sulfate Received 31 May 2014 and accepted 30 September 2014 Introduction The steady increase in atmospheric concentrations of greenhouse gases (GHGs) has led to a warming of Earth’s surface and other climate changes since the pre- industrial era (IPCC (Intergovernmental Panel on Cli- mate Change), 2007). Natural wetlands play a critically important role in governing the rate of increase of GHG concentrations because of their large soil carbon (C) and nitrogen (N) pools, high CH 4 and considerable N 2 O emissions (Song et al., 2009). Like freshwater wet- lands, tidal salt marshes, and other coastal wetlands have high primary productivity (Liao et al., 2008) and contain ~10% of the global soil C (Schlesinger, 1995). Tidal salt marshes show higher C sequestration poten- tials compared with terrestrial forests and peatlands due to their ability to bury locally produced organic C, and trap sediment and associated organic C (Chmura, 2011). Unlike other wetlands, salt marshes have been suggested to be more valuable C sinks than other eco- systems because of their relatively low CH 4 and N 2 O emissions (Livesley & Andrusiak, 2012). Despite their importance, salt marshes are among the ecosystems that are most threatened by and vulnerable to human activities and climate change, including sea-level rise, eutrophication, and exotic plant invasion (Kirwan et al., 2010; Deegan et al., 2012). As two significant elements of global change, exotic plant invasion and climate change are major pressing environmental problems that may threaten the sustain- ability of global ecosystems (Tamura & Tharayil, 2014). Furthermore, these two global changes are predicted to interact, with climate change facilitating a massive range expansion of many exotic species over the com- ing decades (Dawson et al., 2012). However, the poten- tial for plant invasions to participate in feedback loops that affect climate change by regulating sequestration of soil organic C (SOC), and CH 4 and N 2 O emissions in invaded ecosystems has not been extensively studied. Correspondence: Weixin Ding, tel. +86 25 8688 1527, fax +86 25 8688 1000, e-mail: [email protected] 1 © 2014 John Wiley & Sons Ltd Global Change Biology (2014), doi: 10.1111/gcb.12797 Global Change Biology

Welcome message from author
This document is posted to help you gain knowledge. Please leave a comment to let me know what you think about it! Share it to your friends and learn new things together.
Transcript

Exotic Spartina alterniflora invasion alters ecosystem–atmosphere exchange of CH4 and N2O and carbonsequestration in a coastal salt marsh in ChinaJUN J I YUAN1 , 2 , WE IX IN D ING 1 , DEYAN L IU 1 , HO JEONG KANG3 , CHR I S FREEMAN4 ,
J IAN X IANG 1 , 2 and YONGXIN LIN1 , 2
1State Key Laboratory of Soil and Sustainable Agriculture, Institute of Soil Science, Chinese Academy of Sciences, Nanjing 210008,
China, 2University of Chinese Academy of Sciences, Beijing 10049, China, 3School of Civil and Environmental Engineering, Yonsei
University, Seoul 120–749, Korea, 4School of Biological Sciences, Bangor University, Gwynedd LL57 2UW, UK
Abstract
Coastal salt marshes are sensitive to global climate change and may play an important role in mitigating global
warming. To evaluate the impacts of Spartina alterniflora invasion on global warming potential (GWP) in Chinese
coastal areas, we measured CH4 and N2O fluxes and soil organic carbon sequestration rates along a transect of coastal
wetlands in Jiangsu province, China, including open water; bare tidal flat; and invasive S. alterniflora, native Suaeda
salsa, and Phragmites australis marshes. Annual CH4 emissions were estimated as 2.81, 4.16, 4.88, 10.79, and 16.98 kg
CH4 ha�1 for open water, bare tidal flat, and P. australis, S. salsa, and S. alterniflora marshes, respectively, indicating
that S. alterniflora invasion increased CH4 emissions by 57–505%. In contrast, negative N2O fluxes were found to be
significantly and negatively correlated (P < 0.001) with net ecosystem CO2 exchange during the growing season in S.
alterniflora and P. australis marshes. Annual N2O emissions were 0.24, 0.38, and 0.56 kg N2O ha�1 in open water, bare
tidal flat and S. salsa marsh, respectively, compared with -0.51 kg N2O ha�1 for S. alterniflora marsh and �0.25 kg
N2O ha�1 for P. australis marsh. The carbon sequestration rate of S. alterniflora marsh amounted to 3.16 Mg
C ha�1 yr�1 in the top 100 cm soil profile, a value that was 2.63- to 8.78-fold higher than in native plant marshes. The
estimated GWP was 1.78, �0.60, �4.09, and �1.14 Mg CO2eq ha�1 yr�1 in open water, bare tidal flat, P. australis
marsh and S. salsa marsh, respectively, but dropped to �11.30 Mg CO2eq ha�1 yr�1 in S. alterniflora marsh. Our
results indicate that although S. alterniflora invasion stimulates CH4 emissions, it can efficiently mitigate increases in
atmospheric CO2 and N2O along the coast of China.
Keywords: atmospheric N2O consumption, carbon sequestration, GWP, N-limit, Spartina alterniflora invasion, sulfate
Received 31 May 2014 and accepted 30 September 2014
Introduction
The steady increase in atmospheric concentrations of
greenhouse gases (GHGs) has led to a warming of
Earth’s surface and other climate changes since the pre-
industrial era (IPCC (Intergovernmental Panel on Cli-
mate Change), 2007). Natural wetlands play a critically
important role in governing the rate of increase of GHG
concentrations because of their large soil carbon (C)
and nitrogen (N) pools, high CH4 and considerable
N2O emissions (Song et al., 2009). Like freshwater wet-
lands, tidal salt marshes, and other coastal wetlands
have high primary productivity (Liao et al., 2008) and
contain ~10% of the global soil C (Schlesinger, 1995).
Tidal salt marshes show higher C sequestration poten-
tials compared with terrestrial forests and peatlands
due to their ability to bury locally produced organic C,
and trap sediment and associated organic C (Chmura,
2011). Unlike other wetlands, salt marshes have been
suggested to be more valuable C sinks than other eco-
systems because of their relatively low CH4 and N2O
emissions (Livesley & Andrusiak, 2012). Despite their
importance, salt marshes are among the ecosystems
that are most threatened by and vulnerable to human
activities and climate change, including sea-level rise,
eutrophication, and exotic plant invasion (Kirwan et al.,
2010; Deegan et al., 2012).
As two significant elements of global change, exotic
plant invasion and climate change are major pressing
environmental problems that may threaten the sustain-
ability of global ecosystems (Tamura & Tharayil, 2014).
Furthermore, these two global changes are predicted to
interact, with climate change facilitating a massive
range expansion of many exotic species over the com-
ing decades (Dawson et al., 2012). However, the poten-
tial for plant invasions to participate in feedback loops
that affect climate change by regulating sequestration
of soil organic C (SOC), and CH4 and N2O emissions in
invaded ecosystems has not been extensively studied.Correspondence: Weixin Ding, tel. +86 25 8688 1527,
fax +86 25 8688 1000, e-mail: [email protected]
1© 2014 John Wiley & Sons Ltd
Global Change Biology (2014), doi: 10.1111/gcb.12797
Global Change Biology
In natural ecosystems, the dominant plant species
regulate net primary production, litter quantity and
chemistries, and the timing of the litter inputs (Ehren-
feld et al., 2001; Allison & Vitousek, 2004). The physical
and physiological traits of the primary producers that
regulate the initial C assimilation directly and indirectly
influence the abundance and metabolism of soil biota
that conduct C and N cycles (Hawkes et al., 2005; De
Deyn et al., 2008). In general, most invasive plants have
higher resource acquisition (Tharayil et al., 2009) and
resource-use efficiencies (Funk & Vitousek, 2007), and
thus have higher net primary productivity compared
with native plants (Liao et al., 2008). This in turn
increases soil C stock in the invaded ecosystems (Wol-
kovich et al., 2010), despite the potential destabilization
of native soil C stocks (Tamura & Tharayil, 2014). In
most wetlands, the photosynthetically fixed C serves as
the source of substrates for methanogenesis (Kuzyakov,
2002; Str€om et al., 2012). There is a direct species-depen-
dent linkage between plant production and substrate
availability for CH4 production (Joabsson & Christen-
sen, 2001), and plant invasion has the potential to affect
CH4 emission rates. Additionally, most invasive plants
exhibit distinct litter chemistries from those of native
species. These chemically different inputs alter the C
cycling and methanogen community composition, and
could have disproportionate impacts on CH4 emissions
in wetlands (Yuan et al., 2014). Plant invasion can also
alter the various components of ecosystem N cycles.
Hawkes et al. (2005) showed that exotic grasses dou-
bled gross nitrification rates in part by increasing the
abundance and changing the composition of ammonia-
oxidizing bacteria in soil, and subsequently altered eco-
system N budgets. Therefore, the N2O fluxes associated
with invaded ecotypes could also be distinct from those
associated with native ecotypes.
Spartina alterniflora is a C4 plant native to North
America and was intentionally introduced to China in
1979 for coastal erosion control and sediment stabiliza-
tion (Qin & Zhong, 1992). Spartina alterniflora can prop-
agate via seed, rhizomes or vegetative fragments, and
thus has rapidly expanded by replacing native species
such as Suaeda salsa and Phragmites australis, becoming
one of the dominant plants in the land-water ecotone
(An et al., 2007). Invasive S. alterniflora has a higher net
primary productivity than native plants, and leads to
increased C stocks in biomass and soils (Liao et al.,
2008). This change in marsh ecosystem structure may
potentially stimulate CH4 emissions. In mesocosm
experiments, Zhang et al. (2010a) reported a 63%
increase in CH4 emissions following S. alterniflora inva-
sion mainly due to the higher biomass and density
compared with native plants (Cheng et al., 2007). How-
ever, there is little information on the invasive effects of
S. alterniflora on in situ CH4 emissions. Spartina alternifl-
ora invasion also increased N stocks and accelerated N
cycling in a salt marsh (Liao et al., 2008); however, the
response of N2O emissions to such a N increase
remains unexplored. In particular, anthropogenic N
inputs (e.g., fertilization, N deposition, and aquacul-
ture) have caused eutrophication of Chinese coastal
waters (Cui et al., 2013). Exotic plant species are sug-
gested to be better able to capitalize on increased avail-
ability of resources. Thus, it could be postulated that
invasive S. alterniflora could exert an undue influence
on CH4 and N2O emissions because of the continuous
availability of high-reactivity N (primarily as NO3�) in
the water (Deegan et al., 2012).
In this study, we carried out field measurements of
CH4 and N2O emissions from a coastal salt marsh
undergoing rapid S. alterniflora invasion in Jiangsu
Province, China. We also estimated the net soil C bal-
ance based on changes in SOC storage in the top
100 cm soil profile over the period 1995–2011. The
objectives of this study were (i) to determine the
patterns and magnitudes of CH4 and N2O fluxes; (ii)
to assess the effect of exotic S. alterniflora invasion on
GHG exchange rates; and (iii) to understand whether
the coastal marsh is a net C sink or source, and
gain insight into the complete GHG accounting of
the global warming potential (GWP) along the coast
of China.
Materials and methods
Study site and long-term experimental design
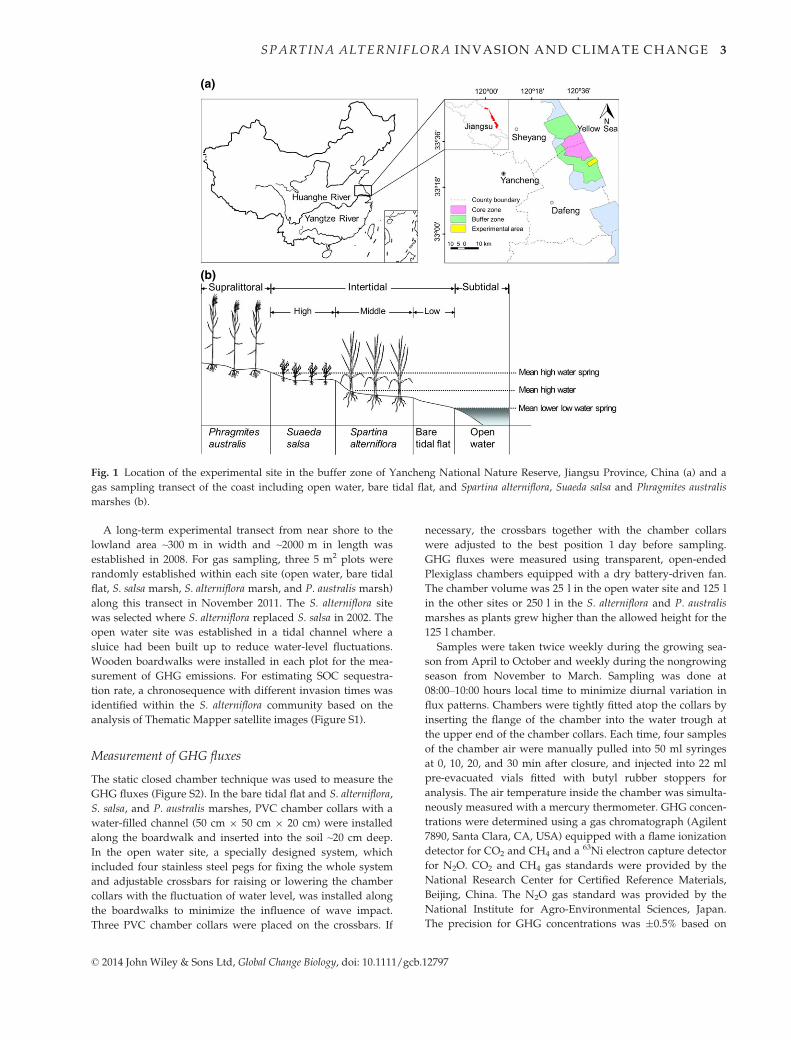
The study site is located in a coastal salt marsh in the buffer
zone of Yancheng National Nature Reserve (33°220N,
120°420E), Yancheng city, Jiangsu Province, China (Fig. 1a).
The climate is warm temperate, with a mean annual air tem-
perature of 12.6 °C and a mean annual precipitation of
1040 mm. Tides in this region are semidiurnal with an ampli-
tude of 2–3 m and the sea water salinity ranges from 30.0& to
32.0&. S. alterniflora was intentionally introduced in 1982 from
the United States (Qin & Zhong, 1992) and has rapidly spread
by replacing native P. australis and S. salsa, resulting in a sub-
stantial shift in plant zonation across the marsh landscape.
Coastal wetlands in the area are composed of five zones
(Fig. 1b). Open water is located on the lowest part, namely,
the subtidal zone and tidal channels, and exposed only during
extreme low tides or full moon events. The bare tidal flat and
S. alterniflora marsh are located on the lower and middle
regions of the intertidal zone, respectively, which is regularly
inundated semidiurnally. S. salsa marsh is in the irregularly
flooded high intertidal zone and is inundated only when the
tidal level is higher than the mean high water spring tide. P.
australis marsh is in the rarely flooded supralittoral zone and
is inundated only when storm and heavy rainfall events
occur.
© 2014 John Wiley & Sons Ltd, Global Change Biology, doi: 10.1111/gcb.12797
2 J . YUAN et al.
A long-term experimental transect from near shore to the
lowland area ~300 m in width and ~2000 m in length was
established in 2008. For gas sampling, three 5 m2 plots were
randomly established within each site (open water, bare tidal
flat, S. salsa marsh, S. alterniflora marsh, and P. australis marsh)
along this transect in November 2011. The S. alterniflora site
was selected where S. alterniflora replaced S. salsa in 2002. The
open water site was established in a tidal channel where a
sluice had been built up to reduce water-level fluctuations.
Wooden boardwalks were installed in each plot for the mea-
surement of GHG emissions. For estimating SOC sequestra-
tion rate, a chronosequence with different invasion times was
identified within the S. alterniflora community based on the
analysis of Thematic Mapper satellite images (Figure S1).
Measurement of GHG fluxes
The static closed chamber technique was used to measure the
GHG fluxes (Figure S2). In the bare tidal flat and S. alterniflora,
S. salsa, and P. australis marshes, PVC chamber collars with a
water-filled channel (50 cm 9 50 cm 9 20 cm) were installed
along the boardwalk and inserted into the soil ~20 cm deep.
In the open water site, a specially designed system, which
included four stainless steel pegs for fixing the whole system
and adjustable crossbars for raising or lowering the chamber
collars with the fluctuation of water level, was installed along
the boardwalks to minimize the influence of wave impact.
Three PVC chamber collars were placed on the crossbars. If
necessary, the crossbars together with the chamber collars
were adjusted to the best position 1 day before sampling.
GHG fluxes were measured using transparent, open-ended
Plexiglass chambers equipped with a dry battery-driven fan.
The chamber volume was 25 l in the open water site and 125 l
in the other sites or 250 l in the S. alterniflora and P. australis
marshes as plants grew higher than the allowed height for the
125 l chamber.
Samples were taken twice weekly during the growing sea-
son from April to October and weekly during the nongrowing
season from November to March. Sampling was done at
08:00–10:00 hours local time to minimize diurnal variation in
flux patterns. Chambers were tightly fitted atop the collars by
inserting the flange of the chamber into the water trough at
the upper end of the chamber collars. Each time, four samples
of the chamber air were manually pulled into 50 ml syringes
at 0, 10, 20, and 30 min after closure, and injected into 22 ml
pre-evacuated vials fitted with butyl rubber stoppers for
analysis. The air temperature inside the chamber was simulta-
neously measured with a mercury thermometer. GHG concen-
trations were determined using a gas chromatograph (Agilent
7890, Santa Clara, CA, USA) equipped with a flame ionization
detector for CO2 and CH4 and a 63Ni electron capture detector
for N2O. CO2 and CH4 gas standards were provided by the
National Research Center for Certified Reference Materials,
Beijing, China. The N2O gas standard was provided by the
National Institute for Agro-Environmental Sciences, Japan.
The precision for GHG concentrations was �0.5% based on
(a)
(b)
Fig. 1 Location of the experimental site in the buffer zone of Yancheng National Nature Reserve, Jiangsu Province, China (a) and a
gas sampling transect of the coast including open water, bare tidal flat, and Spartina alterniflora, Suaeda salsa and Phragmites australis
marshes (b).
© 2014 John Wiley & Sons Ltd, Global Change Biology, doi: 10.1111/gcb.12797
SPARTINA ALTERNIFLORA INVASION AND CLIMATE CHANGE 3
repeated measurements of standard samples. GHG fluxes
were calculated using a linear least squares fit to the four
points in the time series of concentration for each plot (Dataset
see Tables S1, S2, and S3). Net ecosystem CO2 exchange (NEE)
was equivalent to the inverse of CO2 flux (Figure S3). Fluxes
were omitted if the slope of the linear fitting had R2 < 0.90.
The minimum detectable fluxes for CO2, CH4, and N2O
were � 6.06 mg CO2 m�2 h�1, �0.06 mg CH4 m�2 h�1, and
�3.25 lg N2O m�2 h�1, respectively, for samples taken using
the 125 L chamber. Cumulative CH4 and N2O emissions in
the entire year and during the growing and nongrowing sea-
sons were calculated from the emissions between every two
adjacent measurements.
Auxiliary measurements
The water table and the soil and water temperature at 10 cm
depth were measured simultaneously with gas sampling at
each plot. A perforated PVC pipe 6 cm in diameter was
installed in each plot down to 70 cm depth, and a pressure
sensor (TS203, Danrui Sensor, Kunshan, China) was built
inside the PVC pipe to monitor the fluctuation of the water
table. The water table in the open water site was directly
measured by a straightedge. The temperature of the sea
water and soil at 10 cm depth was measured using a portable
digital thermometer (JM624, Jinming Instrument, Tianjin,
China).
Measurement of plant and soil characteristics
Aboveground biomass, height, and stem density of plants
were monitored on 22 September 2012. Three 50 cm2 sampling
quadrats were randomly established in each site. Plants in
each quadrat were clipped at the soil surface, washed care-
fully with distilled water and oven dried for 24 h at 70 °C.Height and stem density were determined.
Soil samples from the gas sampling sites were taken from
the 0–20 cm layer in each quadrat using a 2.5-cm-diameter
stainless steel sampler and stored at 4 °C in a cool box for
transport. A subsample (~200 g) was air dried for analysis of
soil properties. Concentrations of SOC and total nitrogen (TN)
were determined by the wet oxidation redox titration method
and micro-Kjeldahl method, respectively (Carter, 1993). To
measure dissolved organic carbon (DOC), 50 g fresh soil (on
an oven-dried basis) was incubated with 100 mL deionized
water for 30 min on an end-over-end shaker at 25 °C, andthen centrifuged at 4 000 rpm for 25 min at 4 °C (Yuan et al.,
2014). Supernatants were filtered through a 0.45 lm mem-
brane filter (Whatman, Clifton, NJ, USA) and analyzed on a
Shimadzu C analyzer (TOC Vcph, Shimadzu, Kyoto, Japan).
Sulfate (SO42�) in extracts was analyzed using a DX-120 Ion
Chromatograph (Dionex, Camberley, UK) fitted with a Dionex
IonPac AS19 separation column (4 mm 9 250 mm) with its
corresponding AG19 (4 mm 9 50 mm) guard column and a
conductivity detector. A 5 g fresh soil subsample (on an oven
dried basis) from each sample was extracted with 50 mL 2 M
KCl, shaken at 200 c.p.m. for 60 min and then filtered. Soil
NH4+ and NO3
� concentrations in the filtrate were determined
colorimetrically with a Segmented Flow Analyser (SAN++,Skalar, Breda, the Netherlands) (Ma et al., 2010).
Estimates of SOC sequestration rate and net GWP
Soil organic C sequestration rate was calculated based on the
rate of increase of SOC density in the top 100 cm soil profile.
Profile soils in the S. alterniflora marsh were collected in tripli-
cate in June 2011 along a chronosequence that S. alterniflora
invaded in 2011, 2010, 2007, 1999, and 1995. Soil profiles for
the bare tidal flat, and S. salsa and P. australis marshes were
collected in triplicate in 2003, 2007, and 2011. The soil profiles
were divided into 10-cm-thick horizontal layers for sampling.
Bulk density was measured simultaneously by the core
method (Culley, 1993).
Soil organic C density (SOCD, Mg C ha�1) in the 100 cm
profile was calculated by bulk density and SOC concentration
(Tables S4 and S5):
SOCD ¼X
ðSOCi � BDi �HiÞ � 10�1 ð1Þ
where SOCi, BDi, and Hi are the SOC concentration (g C kg�1),
bulk density (g cm�3), and the thickness (10 cm) of the soil
layer i, respectively. The rate of increase of SOC density
(SOCSR, Mg C ha�1 yr�1) was calculated as follows:
SOCSR ¼ ðSOCD0 � SOCDtÞ=t ð2Þwhere SOCD0 and SOCDt are the SOC densities in the bare
tidal flat, and S. salsa and P. australis marshes measured in
2003 and 2011, respectively, or in the marsh invaded by S. alt-
erniflora in 2011 and 1995, respectively; t is the difference in
the invasion time or interval between two measurement times
(year).
The global warming potential over a 100-year time horizon
(GWP, Mg CO2eq ha�1 yr�1) in the bare tidal flat, and S. al-
terniflora, S. salsa, and P. australis marshes was calculated by
the following equation (IPCC (Intergovernmental Panel on
Climate Change), 2007):
GWP ¼ CH4 � 25þN2O� 298� SOCSR� 44=12 ð3Þand for the open water:
GWP ¼ CH4 � 25þN2O�þCO2 � 1 ð4Þwhere CH4, N2O, and CO2 denote emission rates of CH4 (Mg
CH4 ha�1 yr�1), N2O (Mg N2O ha�1 yr�1) and CO2 (Mg
CO2 ha�1 yr�1), respectively.
Statistical analysis
Statistical analyses were conducted using SPSS 11.0 (SPSS Inc,
Chicago, IL, USA) unless otherwise stated. Analysis of vari-
ance (ANOVA) with a Tukey’s honestly significant difference test
was used to compare soil properties, plant characteristics, and
CH4 and N2O emissions among the sites. All dependent vari-
ables were evaluated for normality and were log-transformed
to normalize the distributions if necessary prior to statistical
analysis. Multiple regressions were used to identify the key
drivers of GHG fluxes in each site. Spearman’s nonparametric
rank correlation was used to describe relationships between
© 2014 John Wiley & Sons Ltd, Global Change Biology, doi: 10.1111/gcb.12797
4 J . YUAN et al.
annual GHG emissions and soil or plant characteristics. The
quality of fit of the linear equations was judged statistically by
the coefficient of determination, R2, and its statistical signifi-
cance was determined by Fisher’s F test. The significance of
the regression coefficients was tested by Student’s t-test.
Results
Plant and soil characteristics
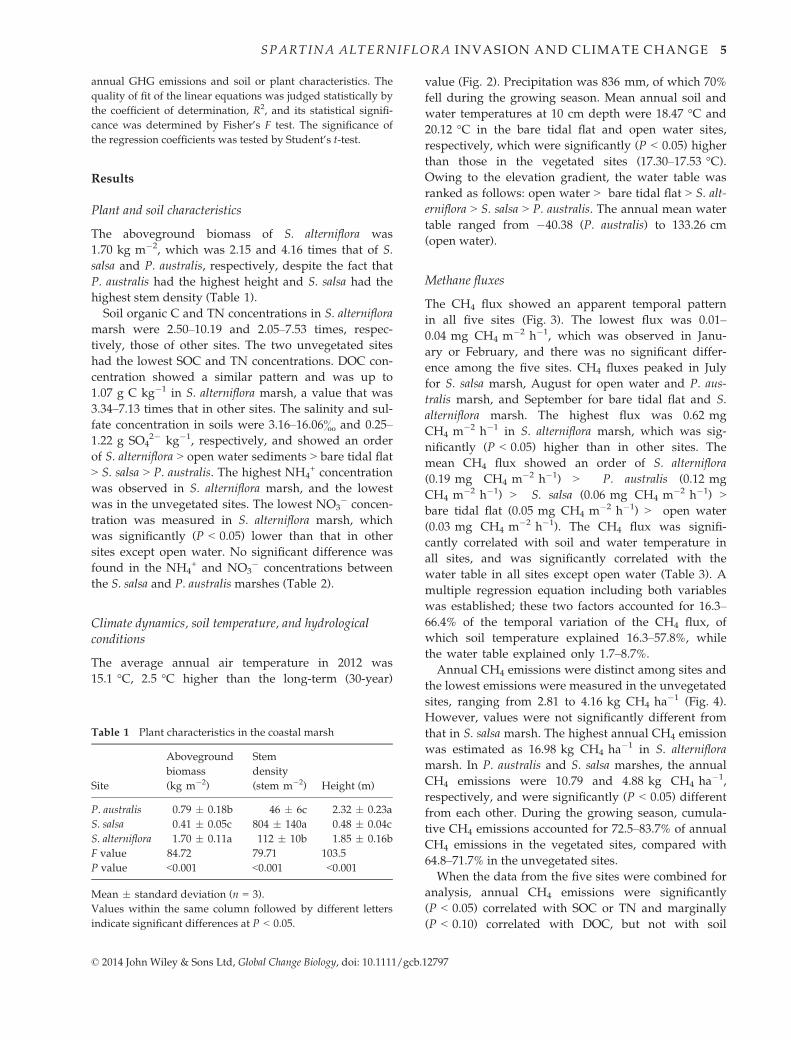
The aboveground biomass of S. alterniflora was
1.70 kg m�2, which was 2.15 and 4.16 times that of S.
salsa and P. australis, respectively, despite the fact that
P. australis had the highest height and S. salsa had the
highest stem density (Table 1).
Soil organic C and TN concentrations in S. alterniflora
marsh were 2.50–10.19 and 2.05–7.53 times, respec-
tively, those of other sites. The two unvegetated sites
had the lowest SOC and TN concentrations. DOC con-
centration showed a similar pattern and was up to
1.07 g C kg�1 in S. alterniflora marsh, a value that was
3.34–7.13 times that in other sites. The salinity and sul-
fate concentration in soils were 3.16–16.06& and 0.25–1.22 g SO4
2� kg�1, respectively, and showed an order
of S. alterniflora > open water sediments > bare tidal flat
> S. salsa > P. australis. The highest NH4+ concentration
was observed in S. alterniflora marsh, and the lowest
was in the unvegetated sites. The lowest NO3� concen-
tration was measured in S. alterniflora marsh, which
was significantly (P < 0.05) lower than that in other
sites except open water. No significant difference was
found in the NH4+ and NO3
� concentrations between
the S. salsa and P. australis marshes (Table 2).
Climate dynamics, soil temperature, and hydrologicalconditions
The average annual air temperature in 2012 was
15.1 °C, 2.5 °C higher than the long-term (30-year)
value (Fig. 2). Precipitation was 836 mm, of which 70%
fell during the growing season. Mean annual soil and
water temperatures at 10 cm depth were 18.47 °C and
20.12 °C in the bare tidal flat and open water sites,
respectively, which were significantly (P < 0.05) higher
than those in the vegetated sites (17.30–17.53 °C).Owing to the elevation gradient, the water table was
ranked as follows: open water > bare tidal flat > S. alt-
erniflora > S. salsa > P. australis. The annual mean water
table ranged from �40.38 (P. australis) to 133.26 cm
(open water).
Methane fluxes
The CH4 flux showed an apparent temporal pattern
in all five sites (Fig. 3). The lowest flux was 0.01–0.04 mg CH4 m�2 h�1, which was observed in Janu-
ary or February, and there was no significant differ-
ence among the five sites. CH4 fluxes peaked in July
for S. salsa marsh, August for open water and P. aus-
tralis marsh, and September for bare tidal flat and S.
alterniflora marsh. The highest flux was 0.62 mg
CH4 m�2 h�1 in S. alterniflora marsh, which was sig-
nificantly (P < 0.05) higher than in other sites. The
mean CH4 flux showed an order of S. alterniflora
(0.19 mg CH4 m�2 h�1) > P. australis (0.12 mg
CH4 m�2 h�1) > S. salsa (0.06 mg CH4 m�2 h�1) >bare tidal flat (0.05 mg CH4 m�2 h�1) > open water
(0.03 mg CH4 m�2 h�1). The CH4 flux was signifi-
cantly correlated with soil and water temperature in
all sites, and was significantly correlated with the
water table in all sites except open water (Table 3). A
multiple regression equation including both variables
was established; these two factors accounted for 16.3–66.4% of the temporal variation of the CH4 flux, of
which soil temperature explained 16.3–57.8%, while
the water table explained only 1.7–8.7%.
Annual CH4 emissions were distinct among sites and
the lowest emissions were measured in the unvegetated
sites, ranging from 2.81 to 4.16 kg CH4 ha�1 (Fig. 4).
However, values were not significantly different from
that in S. salsa marsh. The highest annual CH4 emission
was estimated as 16.98 kg CH4 ha�1 in S. alterniflora
marsh. In P. australis and S. salsa marshes, the annual
CH4 emissions were 10.79 and 4.88 kg CH4 ha�1,
respectively, and were significantly (P < 0.05) different
from each other. During the growing season, cumula-
tive CH4 emissions accounted for 72.5–83.7% of annual
CH4 emissions in the vegetated sites, compared with
64.8–71.7% in the unvegetated sites.
When the data from the five sites were combined for
analysis, annual CH4 emissions were significantly
(P < 0.05) correlated with SOC or TN and marginally
(P < 0.10) correlated with DOC, but not with soil
Table 1 Plant characteristics in the coastal marsh
Site
Aboveground
biomass
(kg m�2)
Stem
density
(stem m�2) Height (m)
P. australis 0.79 � 0.18b 46 � 6c 2.32 � 0.23a
S. salsa 0.41 � 0.05c 804 � 140a 0.48 � 0.04c
S. alterniflora 1.70 � 0.11a 112 � 10b 1.85 � 0.16b
F value 84.72 79.71 103.5
P value <0.001 <0.001 <0.001
Mean � standard deviation (n = 3).
Values within the same column followed by different letters
indicate significant differences at P < 0.05.
© 2014 John Wiley & Sons Ltd, Global Change Biology, doi: 10.1111/gcb.12797
SPARTINA ALTERNIFLORA INVASION AND CLIMATE CHANGE 5

Table 2 Soil characteristics in the coastal salt marsh
Site
SOC
(g C kg�1) TN (g N kg�1)
DOC
(g C kg�1) Salinity (&)
Sulfate
(g SO42� kg�1)
NH4+
(mg N kg�1)
NO3�
(mg N kg�1)
P. australis 5.42 � 0.50b 0.55 � 0.04b 0.23 � 0.01bc 3.16 � 0.64d 0.25 � 0.09bc 3.61 � 0.59b 0.86 � 0.19a
S. salsa 3.95 � 0.25c 0.40 � 0.02c 0.32 � 0.02b 7.75 � 0.94c 0.47 � 0.07b 3.18 � 0.25bc 1.14 � 0.35a
S.
alterniflora
13.55 � 0.42a 1.13 � 0.03a 1.07 � 0.12a 16.06 � 0.67a 1.22 � 0.25a 6.12 � 0.53a 0.27 � 0.07b
Bare tidal
flat
1.88 � 0.33d 0.20 � 0.01d 0.15 � 0.04c 9.96 � 0.33c 0.51 � 0.05bc 1.81 � 0.57c 0.86 � 0.10a
Open water 1.33 � 0.17d 0.15 � 0.04d 0.18 � 0.02bc 13.49 � 1.43b 0.57 � 0.02c 1.83 � 0.59c 0.25 � 0.00b
F value 586.41 629.8 143.8 97.36 26.44 34.37 13.32
P value <0.001 <0.001 <0.001 <0.001 <0.001 <0.001 <0.001
Mean � standard deviation (n = 3).
Values within the same column followed by different letters indicate significant differences at P < 0.05.
SOC, soil organic carbon; TN, total nitrogen; DOC, dissolved organic carbon.
(a)
(b)
(c)
(d)
Fig. 2 Temporal variation of air temperature and precipitation (a), highest tidal level and tidal level at 9:00 am (b), soil or water tem-
perature at 10 cm depth (c), and water table (d) in the coastal salt marsh. Standard deviations are not shown for figure clarity.
© 2014 John Wiley & Sons Ltd, Global Change Biology, doi: 10.1111/gcb.12797
6 J . YUAN et al.

salinity, sulfate concentration, mean soil and water
temperature, or water table (Table 4). Furthermore,
annual CH4 emissions decreased exponentially with
the ratio of SO42� to DOC when the data measured in
the 15 plots of the five sites was integrated for analysis
(Fig. 5). In the vegetated sites, annual CH4 emissions
were also marginally (P < 0.10) correlated with above-
ground biomass, but not with stem density.
Table 3 Multiple linear regressions of CH4 flux (FCH4, mg CH4 m�2 h�1) and N2O flux (FN2O, lg N2O m�2 h�1) against water
table (WT) and soil and water temperature at 10 cm depth (T) in the coastal salt marshes
Gas Site Regression Equation R2
Partial R2
Temperature (°C) Water table (cm)
CH4 P. australis FCH4 = 0.0070T + 0.0013WT + 0.0723 0.664*** 0.578*** 0.087***
S. salsa FCH4 = 0.0019T + 0.0005WT + 0.0410 0.483*** 0.424*** 0.059**
S. alterniflora FCH4 = 0.0127T + 0.0024WT + 0.0408 0.592*** 0.554*** 0.017*
Bare tidal flat FCH4 = 0.0014T + 0.0005WT + 0.0331 0.416*** 0.346*** 0.069**
Open water FCH4 = 0.0007T + 0.0202 0.163*** 0.163*** 0.004
N2O P. australis FN2O = �0.834T + 10.159 0.588*** 0.588*** –
S. salsa FN2O = 0.105T + 4.765 0.088* 0.088* –
S. alterniflora FN2O = �0.953T + 8.393 0.517*** 0.517*** –
Bare tidal flat FN2O = 0.096T + 2.693 0.236*** 0.236*** –
Open water FN2O = 0.073T + 1.405 0.222*** 0.222*** –
*P < 0.05, **P < 0.01 and ***P < 0.001.
Fig. 3 Temporal variation of CH4 and N2O fluxes in the coastal
salt marsh. Standard deviations are not shown for figure clarity.
Fig. 4 Cumulative CH4 and N2O emissions from the coastal salt
marsh over the entire year and during the growing or non-
growing season. Different letters indicate significant differences
among the sites at P < 0.05. The growing season and non-grow-
ing season denoted the period from April to October and
November to March, respectively.
© 2014 John Wiley & Sons Ltd, Global Change Biology, doi: 10.1111/gcb.12797
SPARTINA ALTERNIFLORA INVASION AND CLIMATE CHANGE 7

Nitrous oxide fluxes
N2O fluxes were at a low level throughout the year,
ranging from 0.89 to 7.80, 0.83 to 8.52, �29.24 to
14.81, 0.68 to 14.09, and �26.43 to 9.48 lg N2O
m�2 h�1 for open water, bare tidal flat, and S. alter-
niflora, S. salsa and P. australis marshes, respectively
(Fig. 3). Open water, bare tidal flat, and S. salsa
marsh showed weak emissions; however, mean N2O
fluxes during the growing season were significantly
(P < 0.05) higher than during the nongrowing season.
In contrast, although S. alterniflora and P. australis
marshes were also a source of N2O during the non-
growing season, they showed consumption of atmo-
spheric N2O during the growing season. The N2O
flux was positively (P < 0.05) correlated with soil and
water temperature in open water, bare tidal flat, and
S. salsa marsh; in contrast, there was a negative corre-
lation in S. alterniflora and P. australis marshes
(Table 3). It should be noted that N2O flux was sig-
nificantly (P < 0.05) negatively correlated with NEE
in S. alterniflora and P. australis marshes (Fig. 6).
During the growing season, cumulative N2O emis-
sions in S. alterniflora and P. australis marshes was
�0.57 and �0.38 kg N2O ha�1, respectively, which
resulted in these marshes becoming a sink of atmo-
spheric N2O, with annual N2O sink of �0.51 and
�0.25 kg N2O ha�1, respectively. Significant (P < 0.05)
differences in annual N2O emissions were ranked as S.
salsa > bare tidal flat ≥ open water > P. australis > S. alt-
erniflora (Fig. 4). Annual N2O emissions were margin-
ally (P < 0.10) and negatively correlated with SOC and
TN, but not with NH4+ or NO3
� (Table 4).
Carbon sequestration and net GWP
The SOC density in the top 100 cm soil profile mea-
sured in 2011 was estimated as 18.2 Mg C ha�1 for bare
tidal flat, 37.1 Mg C ha�1 for S. salsa marsh and 29.0 Mg
C ha�1 for P. australis marsh, and varied from 16.2 to
66.7 Mg C ha�1 in S. alterniflora marsh with 0–16 years
colonization. The highest SOC density in the marsh
invaded by S. alterniflora in 1995 was 1.80–3.67 times
that in bare tidal flat, S. salsa marsh and P. australis
marsh. The estimated SOC sequestration rate was 0.22,
Table 4 Correlation coefficients between annual CH4 or N2O emission and soil or plant characteristics in the coastal marsh
Gas SOC TN DOC Salinity Sulfate NH4+ NO3
�Soil/water
temperature
Water
table
Aboveground
biomass†
Stem
density†
CH4 0.963** 0.973** 0.866 0.205 0.642 0.957* �0.326 �0.683 �0.484 0.976 �0.816
N2O �0.816 �0.824 �0.705 �0.206 �0.527 �0.792 0.545 0.393 0.225 �0.867 0.951
*P < 0.05 and **P < 0.01.
†Data in the unvegetated sites were not included for analysis (n = 3).
Fig. 6 Relationship between N2O flux and net ecosystem CO2
exchange (NEE) in the S. alterniflora and P. australis marshes.Fig. 5 Relationship between annual CH4 emission and ratio of
SO2�4 to DOC in the fifteen plots of five measurement sites.
© 2014 John Wiley & Sons Ltd, Global Change Biology, doi: 10.1111/gcb.12797
8 J . YUAN et al.

1.19, and 0.36 Mg C ha�1 yr�1 in bare tidal flat, S. salsa
marsh, and P. australis marsh during the period 2003–2011, respectively, whereas it was up to 3.16 Mg
C ha�1 yr�1 in S. alterniflora marsh (Fig. 7).
The estimated GWP in bare tidal flat, and S. alternifl-
ora, S. salsa, and P. australis marshes was �0.60, �11.30,
�4.09, and �1.14 Mg CO2eq ha�1 yr�1, respectively
(Fig. 8), indicating that the coastal marsh ecosystem,
regardless of the presence of plants, has a negative
GWP. S. alterniflora marsh showed the largest negative
GWP, primarily due to the high SOC sequestration rate
and, to a lesser extent, the uptake of atmospheric N2O.
In contrast, the GWP of open water site was 1.78 Mg
CO2eq ha�1 yr�1, and CH4, N2O, and CO2 emissions
contributed 3.9, 4.1, and 92.0%, respectively.
Discussion
Effect of S. alterniflora invasion on CH4 emissions
The 1.57- to 6.05-fold higher annual CH4 emissions in S.
alterniflora marsh compared with open water, bare tidal
flat, and native plant marshes indicate that S. alterniflora
invasion has dramatically stimulated CH4 emissions
along the coast of China. Our finding is consistent with
Cheng et al. (2007) and Zhang et al. (2010a) who
observed higher CH4 emissions from S. alterniflora
marsh than from P. australis and S. salsa marshes in
mesocosm studies. However, the CH4 emissions mea-
sured in this study were approximately half those mea-
sured in their studies and were substantially lower
than emissions reported previously for freshwater wet-
lands (Kang & Freeman, 2002; Chen et al., 2013). We
found that annual CH4 emissions were significantly
related to SOC and marginally related to DOC, which
accounted for 92.7% and 74.9%, respectively, of the spa-
tial variation of CH4 emissions among the five sites. Mi-
namikawa et al. (2005) also attributed differences in
CH4 emissions from five paddy fields to variations in
SOC. In this study, however, the 3.65-fold higher DOC
concentration in S. alterniflora marsh increased CH4
emissions only by 67% compared with P. australis
marsh, indicating that increased DOC in S. alterniflora
marsh was not efficiently converted into CH4 and the
marked accumulation of SOC did not induce large CH4
emissions. Interestingly, European P. australis haplo-
type invasion on the east coast of the United States has
not stimulated CH4 emissions compared with native S.
alterniflora, despite having more than double the above-
ground biomass, because of the similarity in below-
ground biomass and SOC storage for both species
(Emery & Fulweiler, 2014).
The concentration and quality of SOC or DOC can
affect CH4 emissions by changing both the supply of
methanogenic substrates and the abundance and com-
munity structure of methanogenic archaea in wetlands
(Wagner et al., 2005). Many researchers have noted that
labile organic compounds in the form of plant exudates
act as substrates for methanogenesis (e.g., Freeman
et al., 2002). Str€om et al. (2005, 2012), for example, found
Fig. 7 Relationship between SOC density in the top 100 cm soil
profile and the S. alterniflora invasion time or interval of the
measurement time in bare tidal flat, S. salsa marsh and P. aus-
tralis marsh.
Fig. 8 Global warming potential (GWP) estimated by annual
CH4 and N2O emissions as well as SOC sequestration potential
in bare tidal flat, S. alterniflora marsh, S. salsa marsh and P. aus-
tralis marsh, or annual CO2 emission in open water site.
© 2014 John Wiley & Sons Ltd, Global Change Biology, doi: 10.1111/gcb.12797
SPARTINA ALTERNIFLORA INVASION AND CLIMATE CHANGE 9

that root exudates were the major source of substrate
(mainly acetate) for methanogens in peatlands,
although organic compounds from exudates accounted
for approximately 10% of total DOC in soil (Fischer
et al., 2007). Ding et al. (2002) and Liu et al. (2014) sug-
gest that the source of substrates for methanogenesis
depends on the species specific to a given wetland.
They found that substrates were derived primarily
from plant litters in Carex lasiocarpa marsh, but from ex-
udates in Calamagrostis angustifolia marsh. Yuan et al.
(2014) demonstrated that CH4 was primarily produced
by obligate acetotrophic methanogens in bare tidal flat,
but by facultative methanogens using ‘noncompetitive’
substrates such as trimethylamine in S. alterniflora
marsh. S. alterniflora absorbs sulfate from tidal water to
achieve osmoregulation (Cavalieri & Huang, 1981),
resulting in the synchronous accumulation of sulfate
and SOC after senescing. Sulfate-reducing bacteria have
been noted to outcompete acetotrophic or facultative
methanogens for acetate unless sulfate concentrations
are depleted to lower than 1 mM (King, 1984), an effect
widely observed in peatlands (Dowrick et al., 2006). In
this study, the sulfate concentration in S. alterniflora
marsh amounted to 12.71 mM, and CH4 emissions
were negatively related to the ratio of SO42� to DOC.
Thus, it is likely that the low increase in CH4 emissions
in S. alterniflora marsh was primarily due to a limited
increase of ‘noncompetitive’ substrates.
CH4 fluxes were significantly correlated with soil and
water temperature in all sites. Previous studies have
shown that high temperatures increase CH4 production
due to increased substrate supply following a stimula-
tion of SOC degradation and plant growth, and/or an
increased abundance of methanogenic archaea (Gan
et al., 2012; Kim et al., 2012). However, we found that
the CH4 flux peak in S. alterniflora marsh was not com-
pletely consistent with the maximum soil temperature
and occurred in September. Wang & Lee (1994) demon-
strated that the highest concentrations of aliphatic
amines in soils appeared when S. alterniflora began to
senesce. The coincidence of the CH4 flux peak at the
time of S. alterniflora senescence further suggests that
‘noncompetitive’ substrates play a key role in CH4
emissions in S. alterniflora marsh. It should be noted
that, the hydrologic setting of S. alternifora is different
than S. salsa and P. australis, with S. alternifora located
in sediments with higher mean water (Fig. 1b). So the
greater CH4 emissions from S. alternifora could also be
(partly) explained by their being located in a more satu-
rated soil environment.
The annual CH4 emissions from S. alterniflora marsh
were close to the value (12.5 kg CH4 ha�1) measured
for a Virginia coastal salt marsh (Bartlett et al., 1985),
but much lower than those measured for many estuar-
ies (Poffenbarger et al., 2011). For example, Tong et al.
(2012) reported annual emissions of 956.5 kg CH4 ha�1
from the estuary of Mingjiang River, China where tidal
water salinity was 4.2& and pore water sulfate concen-
tration was as low as 2.60 mM. Poffenbarger et al.
(2011) attributed spatial differences in CH4 emissions to
the discrepancy of tidal water salinity and sulfate con-
centration. However, Keller et al. (2009) found CH4
emissions from brackish marshes were not greatly dif-
ferent from those from freshwater marshes, if not
higher, despite sulfate concentrations in brackish
marshes being generally higher than the threshold for
suppressing hydrogenotrophic and acetotrophic metha-
nogenesis. Clearly, further study is required to evaluate
differences in substrate type and the dominant species
of methanogens in S. alterniflora estuarine marshes with
low salinity.
Annual CH4 emissions from open sea water
amounted to 2.81 kg CH4 ha�1, which is greater than
the value (0.09 kg CH4 ha�1) for open ocean (Holmes
et al., 2000), but only slightly higher than the 0.56–1.22 kg CH4 ha�1 for European shelf areas (Bange,
2006) and close to the data (1.87–3.10 kg CH4 ha�1) for
shelf regions of the Black Sea (Amouroux et al., 2002).
These findings indicate that CH4 emissions from coastal
waters do not differ significantly around the world.
CH4 in the marine environment mainly originates from
organic matter in sediments at shallow depths (Shakh-
ova & Semiletov, 2007). Zhang et al. (2004) measured
higher CH4 concentrations in benthic waters and high
CH4 fluxes from the organic C-rich sediments in the
North East China Sea. Jayakumar et al. (2001) attributed
high CH4 saturations in the coastal waters of the Ara-
bian Sea to the copious supply of organic C from land
as well as direct CH4 inputs from coastal wetlands
through runoff. Therefore, the increased C inputs due
to S. alterniflora invasion might stimulate CH4 emissions
in open water.
Effect of S. alterniflora invasion on N2O emissions
Coastal areas have been recognized as a major marine
contributor to atmospheric N2O (Nevison et al., 1995;
Bange, 2006). Seitzinger & Kroeze (1998) reported that
~1.00% of the N input was converted to N2O in estuar-
ies, similar to the current default emission factor of
1.00% per unit N input defined by IPCC (Intergovern-
mental Panel on Climate Change) (2006) in agricultural
soils. In this study, however, P. australis and particu-
larly S. alterniflora marshes consumed atmospheric
N2O, as observed in the Scirpus mariqueter estuarine
marsh of Yangtze River (Yu et al., 2012) and in a Japa-
nese lagoon marsh (Hirota et al., 2007). In general, salt
marshes are recognized as N-limited ecosystems for the
© 2014 John Wiley & Sons Ltd, Global Change Biology, doi: 10.1111/gcb.12797
10 J . YUAN et al.

growth of microorganisms and plants, and such a con-
straint would be more severe for S. alterniflora and P.
australis with larger primary production due to their
larger N demand (Delaune et al., 1989). Wetland plants
outcompete microorganisms such as nitrifiers and den-
itrifiers for mineral N; thus denitrifiers have to use N2O
as the only electron acceptor when soil NO3� is below
the threshold of ~1 mg N kg�1 (Ryden, 1983). Although
NO3‒ concentration in coastal waters of the study region
increased 3.54 times from 1997 to 2006 (Song, 2010) and
annual N loading was estimated as 68.4 kg N ha�1
(Wan et al., 2003), NO3� concentration in soils was close
to or below the threshold for denitrifers. Our findings
suggest that salt marshes could efficiently lower
anthropogenic N loading without stimulating N2O
emissions.
It has been found that ammonia-oxidizing bacteria
and archaea can utilize NH4+ at concentrations as low
as 1 lM and 130 nM, respectively (Bollmann et al.,
2002; Martens-Habbena et al., 2009). These values are
much lower than the concentrations measured in this
study. Thus, we infer that the extremely low NO3� con-
centrations were primarily derived from low nitrifica-
tion rates in marsh soils probably due to anaerobic
condition (Jenkins & Kemp, 1984). Coupled nitrifica-
tion-denitrification has been suggested to be the major
pathway for N loss in wetlands (Moseman-Valtierra
et al., 2011). The photosynthesis of S. alterniflora and P.
australis could stimulate coupled nitrification-denitrifi-
cation by supplying O2 to nitrifiers in the rhizosphere
via aerenchymateous tissue, thereby stimulating nitrifi-
cation and providing NO3� to denitriers (An & Joye,
2001). In turn, the stimulated denitrifiers would con-
sume N2O during hypoxic conditions due to the NO3�
limitation. In this study, the negative relationship
between NEE and N2O flux in S. alterniflora and P. aus-
tralis marshes indicated that plant photosynthates as
root exudates and debris might play a key role in N2O
consumption by facilitating the activities of denitrifiers.
Jørgensen et al. (2012) showed that the N2O consump-
tion rate in the root layer soil was 5- to 6-fold greater
than that in the soil below the main root zone in a Dan-
ish Phalaris arundinacea wetland. Further study is
required to understand the actual mechanism of N2O
consumption in coastal marshes.
The net N2O emissions in open water, bare tidal flat,
and S. salsa marsh were in contrast with those in S. alt-
erniflora and P. australis marshes. These were close to
the reported emission (0.48 kg N2O ha�1) for Louisi-
ana’s gulf coastal marsh (Smith et al., 1983), and were
slightly higher than the reported annual sea-to-air
value (0.06–0.16 kg N2O ha�1) for the North Pacific
(Popp et al., 2002), but were lower than the emission
(19.64–40.68 kg N2O ha�1) from the open water area of
various European estuaries (Bange, 2006). Clearly, the
current eutrophication status does not appear to
increase N2O emissions along the coast of China. A sig-
nificant relationship between N2O flux and soil temper-
ature indicates that higher temperatures are conducive
to N2O emissions (Chapuis-Lardy et al., 2007). The sur-
face seawater columns and top layer of the sandy bare
tidal flat are generally oxic (Rosenkranz et al., 2006),
while macrobenthic (e.g., crabs) activities in S. salsa
marsh have been suggested to enhance O2 transport
into the sediment by bioturbation (Dollhopf et al.,
2005). Hence, aerobic water and soil surfaces and
higher temperatures could accelerate soil organic N
mineralization and stimulate N2O production through
nitrification. Interestingly, the highest NO3� concentra-
tion was in S. salsa marsh and was slightly higher than
the threshold for net N2O consumption. It is likely that
the denitrification potential in open water, bare tidal
flat and S. salsa marsh was low due to low SOC concen-
trations and a low or absent supply of plant photosyn-
thates (Wang et al., 2007; Sun et al., 2013).
Effect of S. alterniflora invasion on C sequestration andGWP
Our results showed that S. alterniflora invasion effec-
tively increased C sequestration. The estimated SOC
sequestration rate in S. alterniflora marsh was 2.63- to
8.78-fold higher than in native plant marshes (Fig. 7),
and was higher than the value (0.08–0.38 Mg
C ha�1 yr�1) for peat ecosystems (Belyea & Warner,
1996) and the global average (2.10 Mg C ha�1 yr�1) in
mangrove and salt marshes (Choi et al., 2001; Chmura
et al., 2003). It was also higher than those in other eco-
systems, such as farmland (0.15 Mg C ha�1 yr�1) and
preserved old-growth forest of China (0.06 Mg
C ha�1 yr�1) (Xie et al., 2007).
The accumulation of SOC has been suggested to
result from either higher primary production and less
decomposition, and/or an input of residues with high
chemical resistance to decay (Baldock & Skjemstad,
2000). The highest SOC sequestration rate in S. alternifl-
ora marsh was primarily the result of greater inputs of
C through plant litters and roots, and their being
located in a more saturated and presumably more
anaerobic environment. Our results showed that the
aboveground biomass of S. alterniflora was 1.15- to 3.16-
fold greater than that of native plants, while the root
biomass of S. alterniflora was about fivefold greater than
S. salsa (Zhang et al., 2010b). As belowground biomass
(roots and rhizomes) of S. alterniflora was three- to
five-fold greater than aboveground biomass (Roman &
Daiber, 1984; Liao et al., 2008), Zhang et al. (2010b) con-
cluded that belowground biomass has a more impor-
© 2014 John Wiley & Sons Ltd, Global Change Biology, doi: 10.1111/gcb.12797
SPARTINA ALTERNIFLORA INVASION AND CLIMATE CHANGE 11

tant role in SOC accumulation. Meanwhile, S. alternifl-
ora litter has a high C/N ratio and a high Na content
relative to S. salsa, and is thought to be resistant to
decay and facilitate higher SOC sequestration (Yang
et al., 2009). Although the aboveground biomass of P.
australis was only second to that of S. alterniflora, SOC
sequestration rate was lowest among the vegetated
sites. Therefore, the differences in primary productivity
could not fully explain this variability. P. australis
marsh was located in the highest region and was less
flooded by tides. In contrast, S. salsa and particularly S.
alterniflora were situated in the lower region where tidal
flooding frequently occurred. Therefore, the sediment
deposition rates were distinct among the sites. Liu et al.
(2010) estimated that the sediment deposition rate was
2.20 and 3.00 cm yr�1 in S. salsa and S. alterniflora
marshes, respectively, but only 1.00 cm yr�1 in bare
tidal flat and 1.50 cm yr�1 in P. australis marsh over the
period 1986–2007. Sediment deposition not only input-
ted organic C directly, but also, more importantly, bur-
ied plant-derived organic materials, resulting in the fast
accumulation of SOC by slowing their turnover
(Chmura et al., 2003; Choi & Wang, 2004).
A positive GWP value for open sea water indicated
that seawater-flooded coast is a potential GHG source.
In contrast, the intertidal and supralittoral zones effec-
tively suppress the increase of atmospheric GHGs
mainly by sequestering C in soils. S. alterniflora showed
the highest potential for mitigating climate warming,
which was 2.76–9.94 times that for native plants. In
China, S. alterniflora had spread to an area of 34 451 ha
by 2007 (Zuo et al., 2012), which accounted for 3.54% of
the national coastal wetlands (Niu et al., 2012). The esti-
mated net consumption of atmospheric GHGs could
reach 0.39 Tg CO2eq yr�1 in S. alterniflora marsh ecosys-
tem of China.
In conclusion, despite sulfate-accumulation-sup-
pressed CH4 production, S. alterniflora invasion along
the coast of China still stimulated CH4 emissions com-
pared with open water, bare tidal flat, and native P. aus-
tralis and S. salsa marshes. This is because higher
primary productivity and the consequent elevation of
SOC supplied more substrates for methanogensis. Low
N2O emissions were also observed in open water, bare
tidal flat and native S. salsa marsh, and in contrast, net
consumption of atmospheric N2O occurred in S. alter-
niflora and P. australis marshes. This indicated that salt
marshes, especially under S. alterniflora invasion, could
efficiently cut down anthropogenic N loading without
stimulating N2O emissions. SOC sequestration rate
amounted to 3.16 Mg C ha�1 yr�1 in S. alterniflora
marsh, which was 2.63 to 8.78 times that of native plant
marshes. Our results suggest that S. alterniflora invasion
along the coast of China could efficiently mitigate GHG
emissions by strongly sequestering atmospheric CO2
and, to a lesser extent, consuming atmospheric N2O
compared with native plants.
Acknowledgements
This work was supported by the strategic priority research pro-gram of the Chinese Academy of Sciences (XDA05020501),National Basic Research Program of China (2012CB417102), andNatural Science Foundation of China (41171190, 40725003). H.Kang is grateful to ERC (2013-067218).
References
Allison SD, Vitousek PM (2004) Rapid nutrient cycling in leaf litter from invasive
plants in Hawaii. Oecologia, 141, 612–619.
Amouroux D, Roberts G, Rapsomanikis S et al. (2002) Biogenic gas (CH4, N2O, DMS)
emission to the atmosphere from near-shore and shelf waters of the north-western
Black Sea. Estuarine, Coastal and Shelf Science, 54, 575–587.
An S, Joye SB (2001) Enhancement of coupled nitrification-denitrification by benthic
photosynthesis in shallow estuarine sediments. Limnology and Oceanography, 46,
62–74.
An SQ, Gu BH, Zhou CF et al. (2007) Spartina invasion in China: implications for inva-
sive species management and future research. Weed Research, 47, 183–191.
Baldock JA, Skjemstad JO (2000) Role of the soil matrix and minerals in protecting
organic materials against biological attack. Organic Geochemistry, 31, 697–710.
Bange HW (2006) Nitrous oxide and methane in European coastal waters. Estuarine,
Coastal and Shelf Science, 70, 361–374.
Bartlett KB, Harriss RC, Sebacher DI (1985) Methane flux from coastal salt marshes.
Journal of Geophysical Research, 90, 5710–5720.
Belyea LR, Warner BG (1996) Temporal scale and the accumulation of peat in a Sphag-
num bog. Canadian Journal of Botany, 74, 366–377.
Bollmann A, B€ar-Gilissen MJ, Laanbroek HJ (2002) Growth at low ammonium con-
centrations and starvation response as potential factors involved in niche differen-
tiation among ammonia-oxidizing bacteria. Applied and Environmental Microbiology,
68, 4751–4757.
CarterMR (1993) Soil Sampling andMethods of Analysis. Lewis Publishers, Boca Raton, FL.
Cavalieri AJ, Huang AH (1981) Accumulation of proline and glycinebetaine in Sparti-
na alterniflora Loisel. in response to NaCl and nitrogen in the marsh. Oecologia, 49,
224–228.
Chapuis-Lardy L, Wrage N, Metay A et al. (2007) Soils, a sink for N2O? A review. Glo-
bal Change Biology, 13, 1–17.
Chen H, Zhu QA, Peng CH et al. (2013) Methane emissions from rice paddies, natural
wetlands, lakes in China: synthesis new estimate. Global Change Biology, 19, 19–32.
Cheng XL, Peng RH, Chen JQ et al. (2007) CH4 and N2O emissions from Spartina alter-
niflora and Phragmites australis in experimental mesocosms. Chemosphere, 68, 420–
427.
Chmura GL (2011) What do we need to assess the sustainability of the tidal salt
marsh carbon sink? Ocean & Coastal Management, 83, 25–31.
Chmura GL, Anisfeld SC, Cahoon DR et al. (2003) Global carbon sequestration in
tidal, saline wetland soils. Global Biogeochemical Cycles, 17, GB1111.
Choi Y, Wang Y (2004) Dynamics of carbon sequestration in a coastal wetland using
radiocarbon measurements. Global Biogeochemical Cycles, 18, GB4016.
Choi Y, Wang Y, Hsieh YP et al. (2001) Vegetation succession and carbon sequestra-
tion in a coastal wetland in northwest Florida: evidence from carbon isotopes. Glo-
bal Biogeochemical Cycles, 15, 311–319.
Cui SH, Shi YL, Groffman PM et al. (2013) Centennialvscale analysis of the creation
and fate of reactive nitrogen in China (1910–2010). Proceedings of the National Acad-
emy of Sciences of USA, 110, 2052–2057.
Culley JLB (1993) Density and compressibility. In: Soil Sampling and Methods of Analy-
sis (ed. Carter MR), pp. 529–539. Lewis Publishers, Boca Raton, FL.
Dawson W, Rohr RP, Van Kleunen M et al. (2012) Alien plant species with a wider
global distribution are better able to capitalize on increased resource availability.
New Phytologist, 194, 859–867.
De Deyn GB, Cornelissen JH, Bardgett RD (2008) Plant functional traits and soil car-
bon sequestration in contrasting biomes. Ecology Letters, 11, 516–531.
Deegan LA, Johnson DS, Warren RS et al. (2012) Coastal eutrophication as a driver of
salt marsh loss. Nature, 490, 388–392.
© 2014 John Wiley & Sons Ltd, Global Change Biology, doi: 10.1111/gcb.12797
12 J . YUAN et al.
Delaune R, Feijtel T, Patrick W Jr (1989) Nitrogen flows in Louisiana Gulf Coast salt
marsh: spatial considerations. Biogeochemistry, 8, 25–37.
Ding WX, Cai ZC, Tsuruta H et al. (2002) Effect of standing water depth on methane
emissions from freshwater marshes in northeast China. Atmospheric Environment,
36, 5149–5157.
Dollhopf SL, Hyun JH, Smith AC et al. (2005) Quantification of ammonia-oxidizing
bacteria and factors controlling nitrification in salt marsh sediments. Applied and
Environmental Microbiology, 71, 240–246.
Dowrick DJ, Freeman C, Lock MA et al. (2006) Sulphate reduction and the suppres-
sion of peatland methane emissions following summer drought. Geoderma, 132,
384–390.
Ehrenfeld JG, Kourtev P, Huang W (2001) Changes in soil functions following inva-
sions of exotic understory plants in deciduous forests. Ecological Applications, 11,
1287–1300.
Emery HE, Fulweiler RW (2014) Spartina alterniflora and invasive Phragmites australis
stands have similar greenhouse gas emissions in a New England marsh. Aquatic
Botany, 116, 83–92.
Fischer H, Meyer A, Fischer K et al. (2007) Carbohydrate and amino acid composition
of dissolved organic matter leached from soil. Soil Biology and Biochemistry, 39,
2926–2935.
Freeman C, Nevison GB, Kang H et al. (2002) Contrasted effects of simulated drought
on the production and oxidation of methane in a mid-Wales wetland. Soil Biology
and Biochemistry, 34, 61–67.
Funk JL, Vitousek PM (2007) Resource use efficiency and plant invasion in
low-resource systems. Nature, 446, 1079–1081.
Gan YL, Qiu QF, Liu PF et al. (2012) Syntrophic oxidation of propionate in rice field
soil at 15 and 30°C under methanogenic conditions. Applied and Environmental
Microbiology, 78, 4923–4932.
Hawkes CV, Wren IF, Herman DJ et al. (2005) Plant invasion alters nitrogen cycling
by modifying the soil nitrifying community. Ecology Letters, 8, 976–985.
Hirota M, Senga Y, Seike Y et al. (2007) Fluxes of carbon dioxide, methane and nitrous
oxide in two contrastive fringing zones of coastal lagoon, Lake Nakaumi, Japan.
Chemosphere, 68, 597–603.
Holmes ME, Sansone FJ, Rust TM et al. (2000) Methane production, consumption,
and air-sea exchange in the open ocean: an evaluation based on carbon isotopic
ratios. Global Biogeochemical Cycles, 14, 1–10.
IPCC (Intergovernmental Panel on Climate Change) (2006) 2006 IPCC Guidelines for
National Greenhouse Gas Inventories, Prepared by the National Greenhouse Gas Invento-
ries Programme. IGES, Japan.
IPCC (Intergovernmental Panel on Climate Change) (2007) Climate Change 2007: The
Physical Science Basis. Contribution of Working Group I to the Fourth Assessment
Report of the Intergovernmental Panel on Climate Change. Cambridge University
Press, Cambrige, UK.
Jayakumar DA, Naqvi SWA, Narvekar PV et al. (2001) Methane in coastal and off-
shore waters of the Arabian Sea. Marine Chemistry, 74, 1–13.
Jenkins MC, Kemp WM (1984) The coupling of nitrification and denitrification in two
estuarine sediments. Limnology and Oceanography, 29, 609–619.
Joabsson A, Christensen TR (2001) Methane emissions from wetlands and their
relationship with vascular plants: an Arctic example. Global Change Biology, 7,
919–932.
Jørgensen CJ, Struwe S, Elberling B (2012) Temporal trends in N2O flux dynamics in
a Danish wetland-effects of plant-mediated gas transport of N2O and O2 follow-
ing changes in water level and soil mineral-N availability. Global Change Biology,
18, 210–222.
Kang H, Freeman C (2002) The influence of hydrochemistry on methane emissions
from two contrasting northern wetlands. Water, Air, and Soil Pollution, 141, 263–
272.
Keller JK, Wolf AA, Weisenhorn PB et al. (2009) Elevated CO2 affects porewater
chemistry in a brackish marsh. Biogeochemistry, 96, 101–117.
Kim SY, Freeman C, Fenner N et al. (2012) Functional and structural responses of bac-
terial and methanogen communities to 3-year warming incubation in different
depths of peat mire. Applied Soil Ecology, 57, 23–30.
King GM (1984) Utilization of hydrogen, acetate, and ‘noncompetitive’; substrates
by methanogenic bacteria in marine sediments. Geomicrobiology Journal, 3, 275–
306.
Kirwan ML, Guntenspergen GR, D’Alpaos A et al. (2010) Limits on the adaptability
of coastal marshes to rising sea level. Geophysical Research Letters, 37, L23401.
Kuzyakov Y (2002) Review: factors affecting rhizosphere priming effects. Journal of
Plant Nutrition and Soil Science, 165, 382–396.
Liao CZ, Peng RH, Luo YQ et al. (2008) Altered ecosystem carbon and nitrogen cycles
by plant invasion: a meta-analysis. New Phytologist, 177, 706–714.
Liu ZY, Pan SM, Liu XY et al. (2010) Distribution of 137Cs and 210Pb in sediments of
tidal flats in north Jiangsu Province. Journal of Geographical Sciences, 20, 91–108.
Liu DY, Ding WX, Yuan JJ et al. (2014) Substrate and/or substrate-driven changes in
the abundance of methanogenic archaea cause seasonal variation of methane pro-
duction potential in species-specific freshwater wetlands. Applied Microbiology and
Biotechnology, 98, 4711–4721.
Livesley SJ, Andrusiak SM (2012) Temperate mangrove and salt marsh sediments are
a small methane and nitrous oxide source but important carbon store. Estuarine,
Coastal and Shelf Science, 97, 19–27.
Ma BL, Wu TY, Tremblay N et al. (2010) Nitrous oxide fluxes from corn fields: on-
farm assessment of the amount and timing of nitrogen fertilizer. Global Change
Biology, 16, 156–170.
Martens-Habbena W, Berube PM, Urakawa H et al. (2009) Ammonia oxidation kinet-
ics determine niche separation of nitrifying Archaea and Bacteria. Nature, 461,
976–979.
Minamikawa K, Sakai N, Hayashi H (2005) The effects of ammonium sulfate applica-
tion on methane emission and soil carbon content of a paddy field in Japan. Agri-
culture, Ecosystems & Environment, 107, 371–379.
Moseman-Valtierra S, Gonzalez R, Kroeger KD et al. (2011) Short-term nitrogen addi-
tions can shift a coastal wetland from a sink to a source of N2O. Atmospheric Envi-
ronment, 45, 4390–4397.
Nevison CD, Weiss RF, Erickson DJ (1995) Global oceanic emissions of nitrous oxide.
Journal of Geophysical Research, 100, 15809–15820.
Niu Z, Zhang H, Wang X et al. (2012) Mapping wetland changes in China between
1978 and 2008. Chinese Science Bulletin, 57, 2813–2823.
Poffenbarger HJ, Needelman BA, Megonigal JP (2011) Salinity influence on methane
emissions from tidal marshes. Wetlands, 31, 831–842.
Popp BN, Westley MB, Toyoda S et al. (2002) Nitrogen and oxygen isotopomeric con-
straints on the origins and sea-to-air flux of N2O in the oligotrophic subtropical
North Pacific gyre. Global Biogeochemical Cycles, 16, GB1064.
Qin P, Zhong CX (1992) Applied Studies on Spartina. Ocean Press, Beijing, China.
Roman CT, Daiber FC (1984) Aboveground and belowground primary production
dynamics of two Delaware Bay tidal marshes. Bulletin of the Torrey Botanical Club,
111, 34–41.
Rosenkranz P, Br€uggemann N, Papen H et al. (2006) N2O, NO and CH4 exchange,
and microbial N turnover over a Mediterranean pine forest soil. Biogeosciences, 3,
121–133.
Ryden J (1983) Denitrification loss from a grassland soil in the field receiving different
rates of nitrogen as ammonium nitrate. Journal of Soil Science, 34, 355–365.
Schlesinger WH (1995) An overview of the carbon cycle. In: Soils and Global Change
(eds Lal R, Kimble J, Levine E, Stewart BA), pp. 9–27. CRC. Press, Boca Raton, FL.
Seitzinger SP, Kroeze C (1998) Global distribution of nitrous oxide production and N
inputs in freshwater and coastal marine ecosystems. Global Biogeochemical Cycles,
12, 93–113.
Shakhova N, Semiletov I (2007) Methane release and coastal environment in the East
Siberian Arctic shelf. Journal of Marine Systems, 66, 227–243.
Smith C, Delaune R, Patrick W Jr (1983) Nitrous oxide emission from Gulf Coast wet-
lands. Geochimica et Cosmochimica Acta, 47, 1805–1814.
Song JM (2010) Biogeochemical Processes of Biogenic Elements in China Marginal Seas.
Springer-Verlag, GmbH & Zhejiang University Press, Dordrecht, London New
York & Hangzhou.
Song CC, Xu XF, Tian HQ et al. (2009) Ecosystem-atmosphere exchange of CH4 and
N2O and ecosystem respiration in wetlands in the Sanjiang Plain, Northeastern
China. Global Change Biology, 15, 692–705.
Str€om L, Mastepanov M, Christensen TR (2005) Species-specific effects of vascular
plants on carbon turnover and methane emissions from wetlands. Biogeochemistry,
75, 65–82.
Str€om L, Tagesson T, Mastepanov M et al. (2012) Presence of Eriophorum scheuchzeri
enhances substrate availability and methane emission in an Arctic wetland. Soil
Biology and Biochemistry, 45, 61–70.
Sun ZG, Wang LL, Tian HQ et al. (2013) Fluxes of nitrous oxide and methane in dif-
ferent coastal Suaeda salsa marshes of the Yellow River estuary, China. Chemo-
sphere, 90, 856–865.
Tamura M, Tharayil N (2014) Plant litter chemistry and microbial priming regulate
the accrual, composition and stability of soil carbon in invaded ecosystems. New
Phytologist, 203, 110–124.
Tharayil N, Bhowmik P, Alpert P et al. (2009) Dual purpose secondary compounds:
phytotoxin of Centaurea diffusa also facilitates nutrient uptake. New Phytologist,
181, 424–434.
Tong C, Wang WQ, Huang JF et al. (2012) Invasive alien plants increase CH4 emis-
sions from a subtropical tidal estuarine wetland. Biogeochemistry, 111, 677–693.
© 2014 John Wiley & Sons Ltd, Global Change Biology, doi: 10.1111/gcb.12797
SPARTINA ALTERNIFLORA INVASION AND CLIMATE CHANGE 13

Wagner D, Lipski A, Embacher A et al. (2005) Methane fluxes in permafrost habitats
of the Lena Delta: effects of microbial community structure and organic matter
quality. Environmental Microbiology, 7, 1582–1592.
Wan XF, Wu ZM, Chang ZQ (2003) Reanalysis of the atmospheric flux of nutrient ele-
ments to the southern Yellow Sea and the East China Sea. Marine Science Bulletin,
5, 45–51.
Wang XC, Lee C (1994) Sources and distribution of aliphatic-amines in salt-marsh
sediment. Organic Geochemistry, 22, 1005–1021.
Wang DQ, Chen ZL, Wang J et al. (2007) Summer-time denitrification and nitrous
oxide exchange in the intertidal zone of the Yangtze Estuary. Estuarine, Coastal and
Shelf Science, 73, 43–53.
Wolkovich EM, Lipson DA, Virginia RA et al. (2010) Grass invasion causes rapid
increases in ecosystem carbon and nitrogen storage in a semiarid shrubland. Global
Change Biology, 16, 1351–1365.
Xie ZB, Zhu JG, Liu G et al. (2007) Soil organic carbon stocks in China and changes
from 1980s to 2000s. Global Change Biology, 13, 1989–2007.
Yang SG, Li JH, Zheng Z et al. (2009) Characterization of Spartina alterniflora as feed-
stock for anaerobic digestion. Biomass and Bioenergy, 33, 597–602.
Yu ZJ, Li YJ, Deng HG et al. (2012) Effect of Scirpus mariqueteron nitrous oxide emis-
sions from a subtropical monsoon estuarine wetland. Journal of Geophysical
Research, 117, G02017.
Yuan JJ, Ding WX, Liu DY et al. (2014) Methane production potential and methano-
genic archaea community dynamics along the Spartina alterniflora invasion
chronosequence in a coastal salt marsh. Applied Microbiology and Biotechnology, 98,
1817–1829.
Zhang GL, Zhang J, Kang YB et al. (2004) Distributions and fluxes of methane in the
East China Sea and the Yellow Sea in spring. Journal of Geophysical Research, 109,
G07011.
Zhang YH, Ding WX, Cai ZC et al. (2010a) Response of methane emission to invasion
of Spartina alterniflora and exogenous N deposition in the coastal salt marsh. Atmo-
spheric Environment, 44, 4588–4594.
Zhang YH, Ding WX, Luo JF et al. (2010b) Changes in soil organic carbon dynamics
in an Eastern Chinese coastal wetland following invasion by a C4 plant Spartina
alterniflora. Soil Biology and Biochemistry, 42, 1712–1720.
Zuo P, Zhao S, Liu CA et al. (2012) Distribution of Spartina spp. along China’s coast.
Ecological Engineering, 40, 160–166.
Supporting Information
Additional Supporting Information may be found in theonline version of this article:
Figure S1. Sampling sites for measurement of SOC seques-tration rate in the coastal wetlands.Figure S2. Closed chamber systems for measurement ofgreenhouse gases from salt marshes (a) and the open water(b). 1 - marsh soil or sediment, 2 - PVC chamber collar, 3 -water-filled channel, 4 - plant, 5 - plexiglass cylindricalchamber, 6 - fan, 7 - thermometer, 8 - silicon septum, 9 -stainless steel pegs, 10 - locking recess, 11 - crossbar and 12 -water column.Figure S3. Temporal variation of carbon dioxide (CO2)fluxes in a coastal salt marsh measured by the transparentchamber.Table S1. Dataset of the CH4 fluxes (mg CH4 m�2 h�1) inthe coastal salt marsh measured in 2012.Table S2. Dataset of the N2O fluxes (µg N2O m�2 h�1) inthe coastal salt marsh measured in 2012.Table S3. Dataset of the CO2 fluxes (mg CO2 m�2 h�1) inthe coastal salt marsh measured in 2012.Table S4. Soil bulk density (g cm�3) in the top 100 cm pro-file of a coastal salt marsh.Table S5. Soil organic carbon concentration (g C kg�1) inthe top 100 cm profile of a coastal salt marsh.
© 2014 John Wiley & Sons Ltd, Global Change Biology, doi: 10.1111/gcb.12797
14 J . YUAN et al.
Related Documents