1 Exceptional floods in the Prut basin, Romania, in the context of 1 heavy rains in the summer of 2010 2 3 Gheorghe Romanescu 1 , Cristian Constantin Stoleriu 4 Alexandru Ioan Cuza, University of Iasi, Faculty of Geography and Geology, Department of 5 Geography, Bd. Carol I, 20 A, 700505 Iasi, Romania 6 7 Abstract. The year 2010 was characterized by devastating flooding in Central and Eastern 8 Europe, including Romania, the Czech Republic, Slovakia, and Bosnia-Herzegovina. This 9 study focuses on floods that occurred during the summer of 2010 in the Prut River basin, 10 which has a high percentage of hydrotechnical infrastructure. Strong floods occurred in 11 eastern Romania on the Prut River, which borders the Republic of Moldova and Ukraine, and 12 the Siret River. Atmospheric instability from 21 June-1 July 2010 caused significant amounts 13 of rain, with rates of 51.2 mm/50 min and 42.0 mm/30 min. In the middle Prut basin, there are 14 numerous ponds that help mitigate floods as well as provide water for animals, irrigation, and 15 so forth. The peak discharge of the Prut River during the summer of 2010 was 2,310 m 3 /s at 16 the Radauti Prut gauging station. High discharges were also recorded on downstream 17 tributaries, including the Baseu, Jijia, and Miletin. High discharges downstream occurred 18 because of water from the middle basin and the backwater from the Danube (a historic 19 discharge of 16,300 m 3 /s). The floods that occurred in the Prut basin in the summer of 2010 20 could not be controlled completely because the discharges far exceeded foreseen values. 21 22 1 Introduction 23 24 Catastrophic floods occurred during the summer of 2010 in Central and Eastern Europe. 25 Strong flooding usually occurs at the end of spring and the beginning of summer. Among the 26 most heavily affected countries were Poland, Romania, the Czech Republic, Austria, 27 Germania, Slovakia, Hungary, Ukraine, Serbia, Slovenia, Croatia, Bosnia and Herzegovina, 28 and Montenegro (Bissolli et al., 2011; Szalinska et al., 2014) (Fig. 1). The strongest floods 29 from 2010 were registered in the Danube basin (see Table 1). For Romania, we underlined the 30 floods from the basins of Prut, Siret, Moldova and Bistrita rivers.Cele mai puternice inundații 31 din anul 2010 s-au înregistrat în bazinul Dunării (Tabel 1). Pentru România sunt subliniate 32 inundațiile din bazinele hidrografice Prut, Siret, Moldova și Bistrița. The most devastating 33 floods in Romania occurred in Moldavia (Prut, Siret) and Transylvania (Tisa, Somes, 34 Tarnave, Olt). The most deaths were recorded in Poland (25), Romania (six on the Buhai 35 River, a tributary of the Jijia), Slovakia (three), Serbia (two), Hungary (two), and the Czech 36 Republic (two) (Romanescu and Stoleriu, 2013a,b). 37 Floods are one of the most important natural hazards in Europe (Thieken et al., 2016) 38 and on earth as well (Merz et al., 2010; Riegger et al., 2009). They generate major losses in 39 human lives, and also property damage (Wijkman and Timberlake, 1984).Floods are one of 40 the most important natural hazards în Europa (Thieken et al., 2016) dar și pe Terra (Merz et 41 al., 2010; Riegger et al., 2009). Ele se soldează cu cele mai mari pierderi de vieți omenești și 42 cele mai importante pagube materiale (Wijkman and Timberlake, 1984). For this reason, they 43 have been subject to intense research, and significant funds have been allocated to mitigating 44 or stopping them. According to Merz et al. (2010) “the European Flood Directive on the 45 assessment and management of flood risks (European Commission, 2007) requires developing 46 1 Corresponding author: [email protected]

Welcome message from author
This document is posted to help you gain knowledge. Please leave a comment to let me know what you think about it! Share it to your friends and learn new things together.
Transcript
1
Exceptional floods in the Prut basin, Romania, in the context of 1
heavy rains in the summer of 2010 2
3 Gheorghe Romanescu1, Cristian Constantin Stoleriu 4
Alexandru Ioan Cuza, University of Iasi, Faculty of Geography and Geology, Department of 5
Geography, Bd. Carol I, 20 A, 700505 Iasi, Romania 6
7
Abstract. The year 2010 was characterized by devastating flooding in Central and Eastern 8
Europe, including Romania, the Czech Republic, Slovakia, and Bosnia-Herzegovina. This 9
study focuses on floods that occurred during the summer of 2010 in the Prut River basin, 10
which has a high percentage of hydrotechnical infrastructure. Strong floods occurred in 11
eastern Romania on the Prut River, which borders the Republic of Moldova and Ukraine, and 12
the Siret River. Atmospheric instability from 21 June-1 July 2010 caused significant amounts 13
of rain, with rates of 51.2 mm/50 min and 42.0 mm/30 min. In the middle Prut basin, there are 14
numerous ponds that help mitigate floods as well as provide water for animals, irrigation, and 15
so forth. The peak discharge of the Prut River during the summer of 2010 was 2,310 m3/s at 16
the Radauti Prut gauging station. High discharges were also recorded on downstream 17
tributaries, including the Baseu, Jijia, and Miletin. High discharges downstream occurred 18
because of water from the middle basin and the backwater from the Danube (a historic 19
discharge of 16,300 m3/s). The floods that occurred in the Prut basin in the summer of 2010 20
could not be controlled completely because the discharges far exceeded foreseen values. 21
22
1 Introduction 23
24
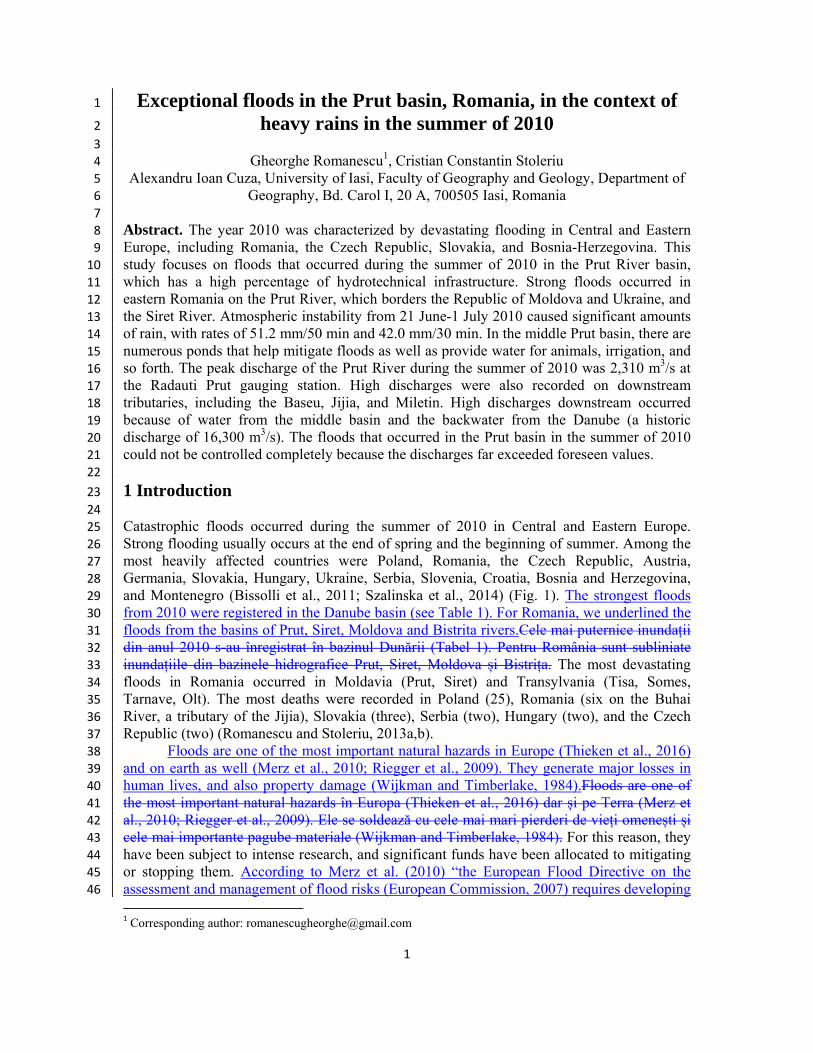
Catastrophic floods occurred during the summer of 2010 in Central and Eastern Europe. 25
Strong flooding usually occurs at the end of spring and the beginning of summer. Among the 26
most heavily affected countries were Poland, Romania, the Czech Republic, Austria, 27
Germania, Slovakia, Hungary, Ukraine, Serbia, Slovenia, Croatia, Bosnia and Herzegovina, 28
and Montenegro (Bissolli et al., 2011; Szalinska et al., 2014) (Fig. 1). The strongest floods 29
from 2010 were registered in the Danube basin (see Table 1). For Romania, we underlined the 30
floods from the basins of Prut, Siret, Moldova and Bistrita rivers.Cele mai puternice inundații 31
din anul 2010 s-au înregistrat în bazinul Dunării (Tabel 1). Pentru România sunt subliniate 32
inundațiile din bazinele hidrografice Prut, Siret, Moldova și Bistrița. The most devastating 33
floods in Romania occurred in Moldavia (Prut, Siret) and Transylvania (Tisa, Somes, 34
Tarnave, Olt). The most deaths were recorded in Poland (25), Romania (six on the Buhai 35
River, a tributary of the Jijia), Slovakia (three), Serbia (two), Hungary (two), and the Czech 36
Republic (two) (Romanescu and Stoleriu, 2013a,b). 37
Floods are one of the most important natural hazards in Europe (Thieken et al., 2016) 38
and on earth as well (Merz et al., 2010; Riegger et al., 2009). They generate major losses in 39
human lives, and also property damage (Wijkman and Timberlake, 1984).Floods are one of 40
the most important natural hazards în Europa (Thieken et al., 2016) dar și pe Terra (Merz et 41
al., 2010; Riegger et al., 2009). Ele se soldează cu cele mai mari pierderi de vieți omenești și 42
cele mai importante pagube materiale (Wijkman and Timberlake, 1984). For this reason, they 43
have been subject to intense research, and significant funds have been allocated to mitigating 44
or stopping them. According to Merz et al. (2010) “the European Flood Directive on the 45
assessment and management of flood risks (European Commission, 2007) requires developing 46
1 Corresponding author: [email protected]
2
management plans for areas with significant flood risk (at a river basin scale), focusing on the 47
reduction of the probability of flooding and on the potential consequences to human health, 48
the environment and economic activity.” (p. 511).”This shift in flood risk reduction policies 49
can be observed in the European Flood Directive on the assessment and management of flood 50
risks (European Commission, 2007). It requires developing management plans for areas with 51
significant flood risk, focusing on the reduction of the probability of flooding and of the 52
potential consequences to human health, the environment and economic activity. Flood risk 53
management plans will be integrated in the long term with the river basin management plans 54
of the Water Framework Directive, contributing to integrated water management on the scale 55
of river catchments.” (Merz et al., 2010). Several studies investigated catastrophic floods or 56
the floods that generated significant damage. They focused on: the statistical distribution of 57
the maximum annual discharge, using GEV and the links with the basin geology (Ahilan et 58
al., 2012); climate change impacts on floods (Alfieri et al., 2015; Detrembleurs et al., 2015; 59
Schneider et al., 2013; Whitfield, 2012); disastruous effects on infrastructures such as 60
transportation infrastructures, and their interdependence (Berariu et al., 2015); historical 61
floods (Blöschl et al., 2013; Strupczewski et al., 2014; Vasileski and Radevski, 2014) and 62
their links to heavy rainfall (Bostan et al., 2009; Diakakis, 2011; Prudhomme and Genevier, 63
2011; Retsö, 2015); the public perception of flood risks (Brilly and Polic, 2005; Feldman et 64 al., 2016; Rufat et al., 2015); land use changes and flooding (Cammerer et al., 2012); the 65
evolution of natural risks (Hufschmidt et al., 2005); geomorphological effects of floods in 66
riverbeds (Lichter and Klein, 2011; Lóczy and Gyenizse, 2011; Lóczy et al., 2009, 2014; Reza 67
Ghanbarpour et al., 2014); the spatial distribution of floods (Moel et al., 2009; Parker and 68
Fordham, 1996); the interrelation between snow and flooding (Revuelto et al., 2013).Some of 69
the most interesting studies have investigated catastrophic floods or floods that caused 70
significant damage: statistical distribution of maximum annual discharge using GEV and 71
relationships with basin geology (Ahilan et al., 2012); climate change impacts on floods 72
(Alfieri et al., 2015; Detrembleurs et al., 2015; Schneider et al., 2013; Whitfield, 2012); 73
effects of disasters on infrastructures such as transportation infrastructures and their 74
interdependence (Berariu et al., 2015); historical floods (Blöschl et al., 2013; Strupczewski et 75
al., 2014; Vasileski and Radevski, 2014); relații între precipitații torențiale și inundații istorice 76
(Bostan et al., 2009; Diakakis, 2011; Prudhomme and Genevier, 2011; Retsö, 2015); public 77
perception of flood risks (Brilly and Polic, 2005; Feldman et al., 2016; Rufat et al., 2015); 78
schimbări în utilizarea terenurilor și producerea inundațiilor (Cammerer et al., 2012); 79
evolution of natural risk (Hufschmidt et al., 2005); efecte geomorfologice de albie (Lichter 80
and Klein, 2011; Lóczy and Gyenizse, 2011; Lóczy et al., 2009, 2014; Reza Ghanbarpour et 81
al., 2014); distribuția spațială a inundațiilor (Moel et al., 2009; Parker and Fordham, 1996); 82
interdependența dintre stratul de zăpadă și inundații (Revuelto et al., 2013). 83
84
3
85
86 Figure 1. The Danube catchment and the location of the most important floods that occurred 87
from May-June 2010 88
89
4
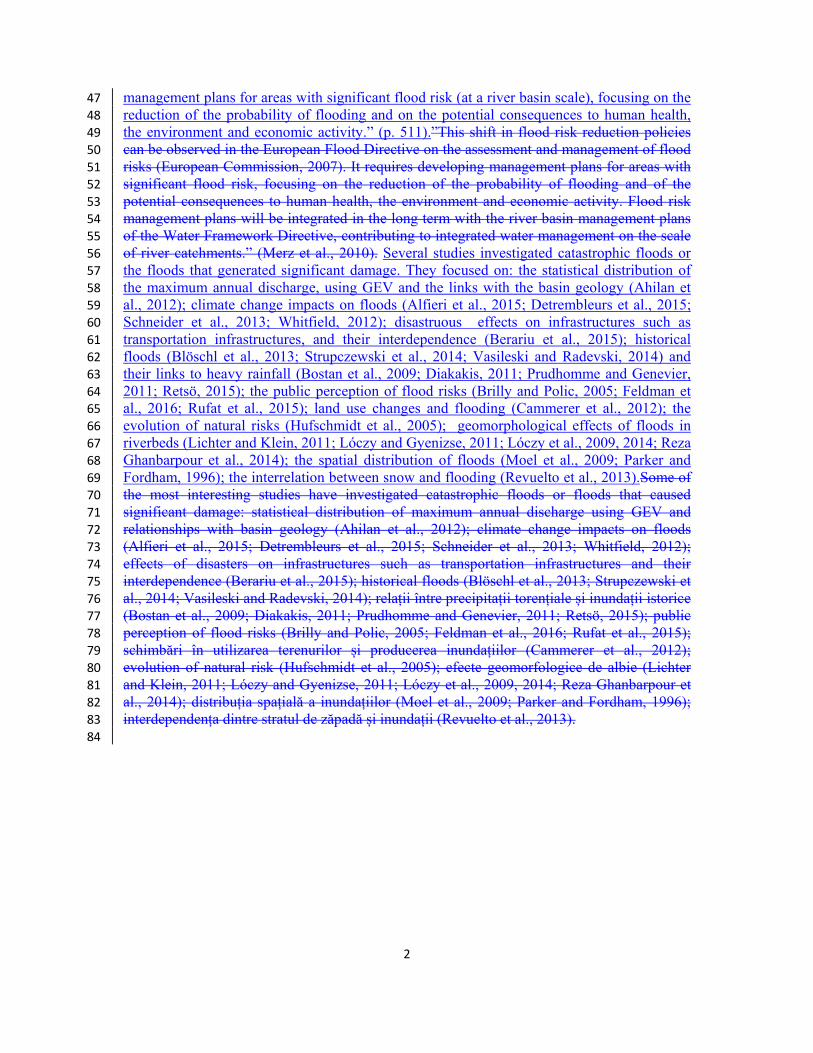
Table 1. Overview of main flood events for the Danube river basin in 2010, as forecasted by 90
EFAS and/or reported in international on-line news media (ICPDR, 2010) 91
Fro
m
(dd
.mm
)
To
(dd
.mm
)
Riv
er B
asin
A
fect
ed
Cou
ntr
y A
ffec
ted
EF
AS
Ale
rt
Sen
t?
Dat
e E
FA
S A
lert
Se
nt
Con
firm
ed?
Com
men
t
20.II February
4. March
III Sava
HR/ RS
Yes (Flood Watch)
24 febFeb.
Yes
Severe flooding in Central & E. Serbia, and in Sava & Morava river systems.
21.II February
28.II Februa
ry
Velika Morava
RS Yes
(Flood Watch)
16 Feb. Yes Severe flooding in eastern
Serbia
FebruaryFebr.
FebruaryFebr.
Koeroes RO/ HU
Yes (Flood Watch)
16 Feb. No
(No reports found on on-line news media). Events to be
confirmed by partners in next annual EFAS meeting
1.III March
5 March.
III Danube
RO/ BG
Yes (Flood Alert)
3 Mar. Yes
Severe flooding in S. Romania and in N.W. & N.
Bulgaria.
MarchMarch
MarchMarch
Somes/ Mures/ Koeroes
RO/ HU
Yes (Flood Alert)
18 Mar. No
No reports found on on-line news media. Events to be
confirmed by partners in next annual EFAS meeting
15.V May
30.V May
Danube/ Oder
SK/ PL/ CZ/ HU
Yes (Flood Alert)
12 May. Yes
Extensive flooding in central & eastern Europe, esp.
Poland, Czech Republic, Slovakia, Hungary and
Serbia.
Late June
July
Siret/ Prut/
Moldova/ Bistrita
RO/ MD
No - Yes
Severe flooding in N.E. Romania kill 25 people, also some counties in Moldova.
15 July.VII
15 July.V
II Prut/ Olt RO
Yes (Flood Alert)
7 July. Yes Maximum flood alert on Prut
river in E. Romania, along border with Moldova.
17.IX Septemb
er
19.IX September
Sava/ Soca
HR/ SL
Yes (Flood Alert)
18 Sept. Yes Severe flooding in Slovenia kill 3 people. Croatia also
affected.
Late NovemberNov.
Early DecemberDec
.
Drina RS Yes
(Flood Alert)
29 Nov. Yes
Severe flooding in Bosnia, Serbia and Montenegro, with river Drina at highest level in
100 years.
3.XII Decembe
r
8.XII Decem
ber Sava HR
Yes (Flood Alewrt)
5 Dec. Yes
Heavy rain causes devastating flooding in the Balkans, esp. Bosnia and
Herzegovina, Croatia, Montenegro, & Serbia.
9.XII Decembe
r
9.XII Decem
ber Tisza
HU/ RS
No - Yes
Snow-melt and swollen rivers flood 3000 km2 of arable land, esp. near Szeged, on
Tisza river, in S.E. Hungary.
DecemberDec.
DecemberDec
. Koeroes
HU/ RO
Yes (Flood Alert)
3 Dec. No
(No reports found on on-line news media. Event to be
confirmed by local authorities in annual EFAS meeting)
5
92
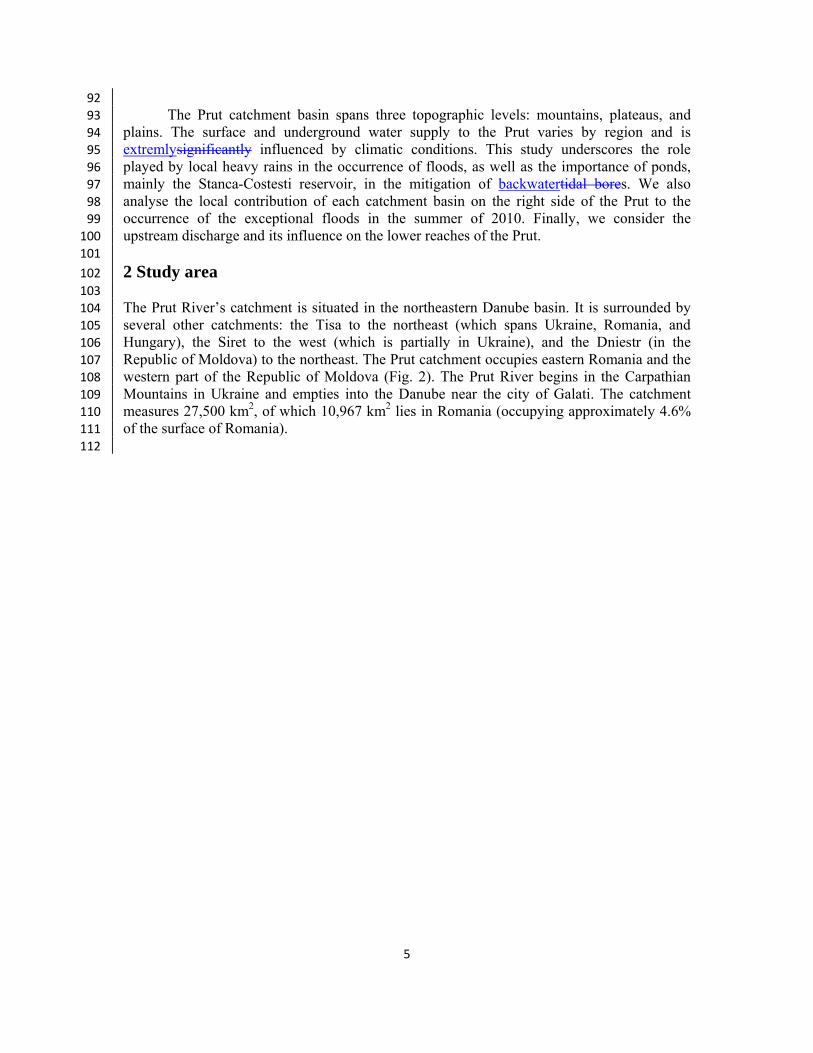
The Prut catchment basin spans three topographic levels: mountains, plateaus, and 93
plains. The surface and underground water supply to the Prut varies by region and is 94
extremlysignificantly influenced by climatic conditions. This study underscores the role 95
played by local heavy rains in the occurrence of floods, as well as the importance of ponds, 96
mainly the Stanca-Costesti reservoir, in the mitigation of backwatertidal bores. We also 97
analyse the local contribution of each catchment basin on the right side of the Prut to the 98
occurrence of the exceptional floods in the summer of 2010. Finally, we consider the 99
upstream discharge and its influence on the lower reaches of the Prut. 100
101
2 Study area 102
103
The Prut River’s catchment is situated in the northeastern Danube basin. It is surrounded by 104
several other catchments: the Tisa to the northeast (which spans Ukraine, Romania, and 105
Hungary), the Siret to the west (which is partially in Ukraine), and the Dniestr (in the 106
Republic of Moldova) to the northeast. The Prut catchment occupies eastern Romania and the 107
western part of the Republic of Moldova (Fig. 2). The Prut River begins in the Carpathian 108
Mountains in Ukraine and empties into the Danube near the city of Galati. The catchment 109
measures 27,500 km2, of which 10,967 km2 lies in Romania (occupying approximately 4.6% 110
of the surface of Romania). 111
112
6
113
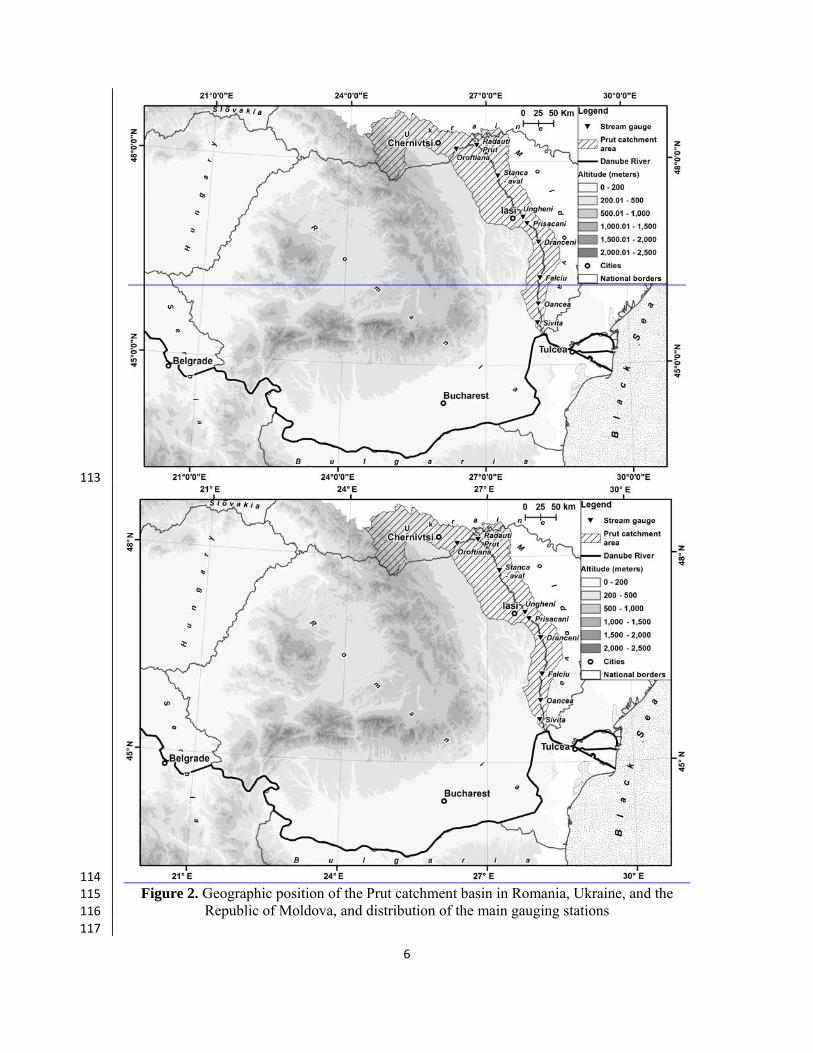
114 Figure 2. Geographic position of the Prut catchment basin in Romania, Ukraine, and the 115
Republic of Moldova, and distribution of the main gauging stations 116
117
7
The Prut River is the second-longest river in Romania, at 952.9 km in length. It is a 118
cross-border river, with 31 km in Ukraine and 711 km in the Republic of Moldova. The mean 119
altitude of the midstream sector of catchment area is 130 m, and for the downstream sector is 120
2 m.The mean altitude of the catchment ranges from 130 m in the centre to 2 m at the 121
confluence. The Prut has 248 tributaries. Its maximum width is 12 km (in the lower reaches, 122
Brates lakeLake) and its average slope is 0.2%. Its hydrographic network measures 11,000 km 123
in total, of which 3,000 km are permanent streams (33%) and 8,000 km are intermittent 124
(67%). The network has the highest density in Romania at 0.41 km/km2 (the average density 125
is 0.33 km/km2). 126
The Prut catchment is relatively symmetrical, but its largest proportion is in 127
Romania. To the west, it has 27 tributaries, including the Poiana, Cornesti, Isnovat, Radauti, 128
Volovat, Baseu, Jijia (with a discharge of 10 m3/s, the most important), Mosna, Elan, Oancea, 129
Branesti, and Chineja. The Jijia River is 275 km long, has a catchment area of 5757 km2 and 130
an annual average flow of 14 m3/s. Its most important tributaries are Miletin, Sitna and 131
Bahlui.Râul Jijia are o lungime de 275 km și bazinul hidrografic deține o suprafață de 5757 132
km2. Cei mai importanți afluenți sunt Miletin, Sitna și Bahlui. Debitul mediu multianual este 133
de 14 m3/s. To the east, it has 32 tributaries, including the Telenaia, Larga, Vilia, Lopatnic, 134
Racovetul, Ciugurlui, Kamenka, Garla Mare, Frasinul, and Mirnova (Romanescu et al., 135 2011a,b). The catchment basin has 225 small ponds, counting the Dracsani, which is the 136
largest pond in Romania. Small ponds are used as drinking water for livestock or to irrigate 137
subsistence rural households. They usually belong to individual households. Large ponds, on 138
the other hand, have multiple uses, such as: flooding mitigation, irrigation, fish farming etc. 139
They resisted better in time because of their significant surface and depth. Large ponds belong 140
to rural or urban communities.Iazurile mici sunt utilizate pentru adăpatul animalelor sau 141
pentru irigatul gospodăriilor. De obicei aparțin unor gospodării individuale. Iazurile mari au 142
întrebuințări multiple: atenuarea inundațiilor, irigații, piscicultură etc. și au rezistat în timp 143
deoarece dețin suprafețe și adâncimi apreciabile. Aparțin unor comunități rurale sau urbane. 144
The river also has 26 large ponds, of which the most important is the Stanca-Costesti 145
reservoir, which has the largest water volume of the interior rivers in Romania (1,400 million 146
m3). 147
The topography of the Prut basin includes the Carpathians in the spring area and the 148
Moldavian Plateau and the Romanian Plain near the river mouth. Arable land occupies 54.7% 149
of the Prut catchment, while forests occupy 21.4%, perennial cultures occupy another 13.3%, 150
and the water surface occupies only 1.19%. The mean annual temperature in the Prut 151
catchment is 9°C, and the mean annual precipitation is 550 mm. The mean annual discharge 152
increases downstream, varying from 82 m3/s at Radauti Prut to 86.7 m3/s at Ungheni to 93.8 153
m3/s at the Oancea gauging station situated near the mouth over the period 1950-2008. 154
Discharges in the downstream reaches of the Prut are controlled by the Stanca-Costesti 155
reservoir. In the Romanian Register of Large Dams, the Stanca-Costesti dam ranks 49th out of 156
246 dams in terms of height, but 2nd in terms of active reservoir volume (1,400 million m3, 157
after the Iron Gates I, with a volume of 2,100 million m3). It has a surface area of 5,900 ha 158
during a normal retention level (NRL). After construction of the Stanca-Costesti reservoir, 159
floods on the Romanian parts of the Prut diminished considerably. Because the Prut has 160
higher banks in the Republic of Moldova, this area was not affected by dam construction. The 161
reservoir was constructed with a mitigation level of 550 million.m3, allowing the mitigation of 162
a 1% backwatertidal bore from 2,940 to 700 m3/s. The damming infrastructure constructed 163
downstream from the hydrotechnical nodes prevents the flooding of approximately 100,000 164
ha of floodplain area (Romanescu et al., 2011a,b). 165
166
8
3 Methodology 167
168
Diverse methodology has been used to analyse exceptional floods. Hydrological data, 169
including discharge and the water level, were obtained from the Prut-Barlad Water Basin 170
Administration based in Iasi (a branch of the “Romanian Waters” National Administration). 171
For catchment basins that did not have gauging stations or observation points, measurements 172
were taken to estimate the discharge. Mathematical methods were used to reconstitute 173
discharges and terrain measurements using land surveying equipment (Leica Total Station) 174
were used to calculate the surface of the stream cross-section.S-a apelat la reconstituirea 175
debitelor (metode matematice specifice debitului reconstituit și măsurători de teren pentru 176
determinarea secțiunii active). Most stations within the Romanian portion of the Prut 177
catchment are automatic (Fig. 3). The recording and analysing methodology used is standard 178
or slightly adapted to local conditions: e.g. the influence of physical-geographical parameters 179
on runoff (Ali et al., 2012; Kappes et al., 2012; Kourgialas et al., 2012; Waylen and Laporte, 180
1999); the management of risk situations (Delli-Priscoli and Stakhiv, 2015; Demeritt et al., 181
2013; Grobicki et al, 2015 Grobicki et al, 2015); the role of reservoirs in flood mitigating (Fu 182
et al., 2014; Serban et al., 2004; Sorocovschi, 2011); the probability of flooding and the 183
changes in the runoff regime (Hall et al., 2004, 2014; Jones, 2011; Seidu et al., 2012a,b; Wu 184
et al., 2011); flood prevention (Hapuarachchi et al., 2011); runoff and stream flow indices 185
(Nguimalet and Ndjendole, 2008); morphologic changes of riverbeds or lake basins (Rusnák 186
and Lehotsky, 2014; Touchart et al., 2012; Verdu et al., 2014) etc.The recording and 187
analysing methodology used is standard or slightly adapted to local conditions: influența 188
parametrilor fizico-geografici asupra scurgerii (Ali et al., 2012; Kappes et al., 2012; 189
Kourgialas et al., 2012; Waylen and Laporte, 1999); managementul situațiilor de risc (Delli-190
Priscoli and Stakhiv, 2015; Demeritt et al., 2013; Grobicki et al, 2015 Grobicki et al, 2015); 191
rolul acumulărilor în atenuarea inundațiilor (Fu et al., 2014; Serban et al., 2004; Sorocovschi, 192
2011); probabilitatea de producere a inundațiilor și schimbările regimului de scurgere (Hall et 193
al., 2004, 2014; Jones, 2011; Seidu et al., 2012a,b; Wu et al., 2011); prevenirea inundațiilor 194
(Hapuarachchi et al., 2011); indicatori ai scurgerii (Nguimalet and Ndjendole, 2008); 195
modificări morfologice ale albiilor de râu sau ale cuvetelor lacustre (Rusnák and Lehotsky, 196
2014; Touchart et al., 2012; Verdu et al., 2014). 197
The cartographic basis used to map altitudes and slopes is Shuttle Radar Topography Mission 198
(Global Land Cover Facility, 2016), at a 1:50000 scale. The vector layers were projected 199
within a geodatabase, using ArcGis 10.1. They include stream lines, sub-catchment basins, 200
and reservoirs and ponds polygons, as well as gauging station points. In order to generate the 201
GIS layers, we applied the following methods: digitisation, queries, conversion, geometries 202
calculation (length, surface) and spatial modelling. Water levels and discharges data were 203
processed and plotted on charts using the Open Office software. We also used the Inkscape 204
software to design the final maps and images. 205
9
206
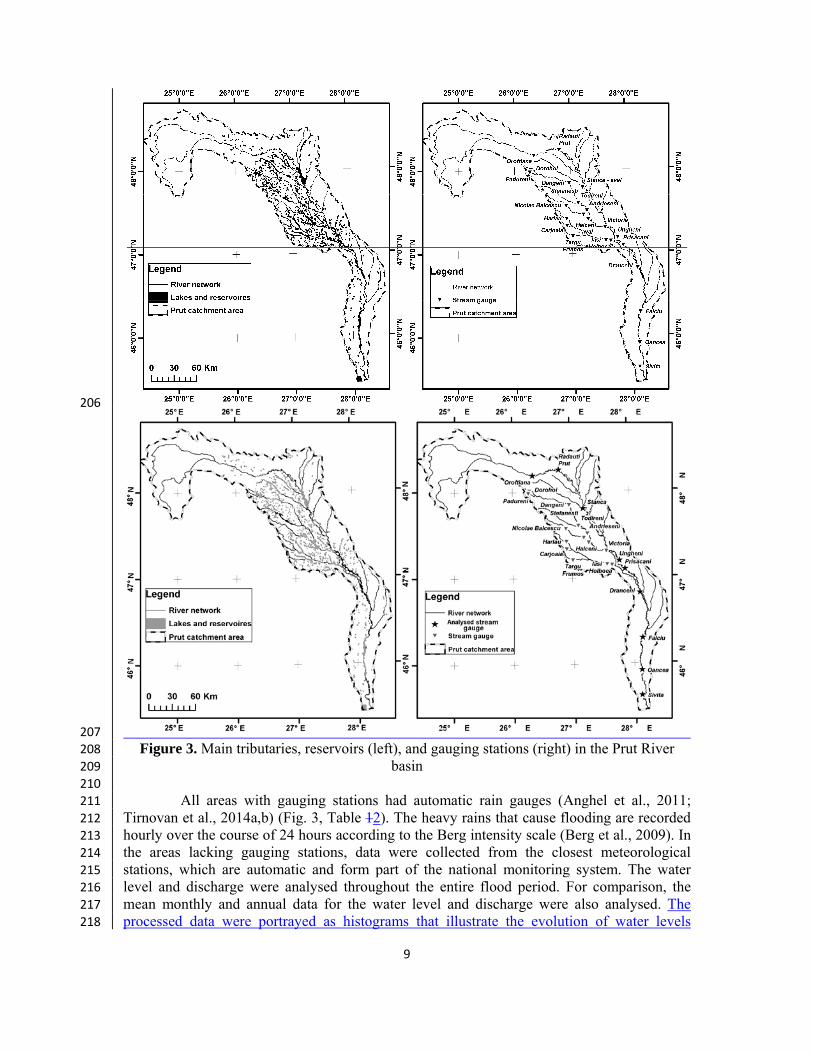
207 Figure 3. Main tributaries, reservoirs (left), and gauging stations (right) in the Prut River 208
basin 209
210
All areas with gauging stations had automatic rain gauges (Anghel et al., 2011; 211
Tirnovan et al., 2014a,b) (Fig. 3, Table 12). The heavy rains that cause flooding are recorded 212
hourly over the course of 24 hours according to the Berg intensity scale (Berg et al., 2009). In 213
the areas lacking gauging stations, data were collected from the closest meteorological 214
stations, which are automatic and form part of the national monitoring system. The water 215
level and discharge were analysed throughout the entire flood period. For comparison, the 216
mean monthly and annual data for the water level and discharge were also analysed. The 217
processed data were portrayed as histograms that illustrate the evolution of water levels 218
10
during the floods, including the CA (warning level), CI (flood level), and CP (danger level) 219
flood threshold levels before and after the flood, the daily and monthly runoff, and the hourly 220
variations of runoff during the backwater.The processed data were portrayed as histograms 221
that illustrate the evolution of water levels during the floods, including the CA (warning 222
level), CI (flood level), and CP (danger level) flood threshold levels before and after the 223
flood, the daily and monthly runoff, and the hourly variations of runoff during the tidal bore. 224
For an exact assessment of the damage and the flooded surface area, observations and field 225
measurements were conducted on the major floodplains of the Volovat, Baseu, Jijia, Sitna, 226
Miletin, Bahluet, Bahlui, Elan, and Chineja Rivers (Romanescu and Stoleriu, 2013b). 227
Nine gauging stations exist in Romanian sections of the Prut River: Oroftiana (near the 228
entry, only including water level measurements), Radauti Prut, Stanca Aval (downstream), 229
Ungheni, Prisacani, Dranceni, Falciu, Oancea, and Sivita (which is directly influenced by the 230
Danube, so no data were collected from this station) (Fig. 3, Table 2). The first gauging 231
station was installed at Ungheni in 1914, and the newest station is Sivita, which was installed 232
in 1978. Much older water level and discharge data are available from stations in other places. 233
The data on the deviation of rainfall quantities were obtained from the Climate Prediction 234
Center NOOA and from the scientific literature (Hustiu, 2011).Datele cu privire la abaterile 235
cantităților de precipitații au fost preluate de la Centrul de Predicție Climatică NOOA și din 236 literatura de specialitate (Hustiu, 2011). 237
238
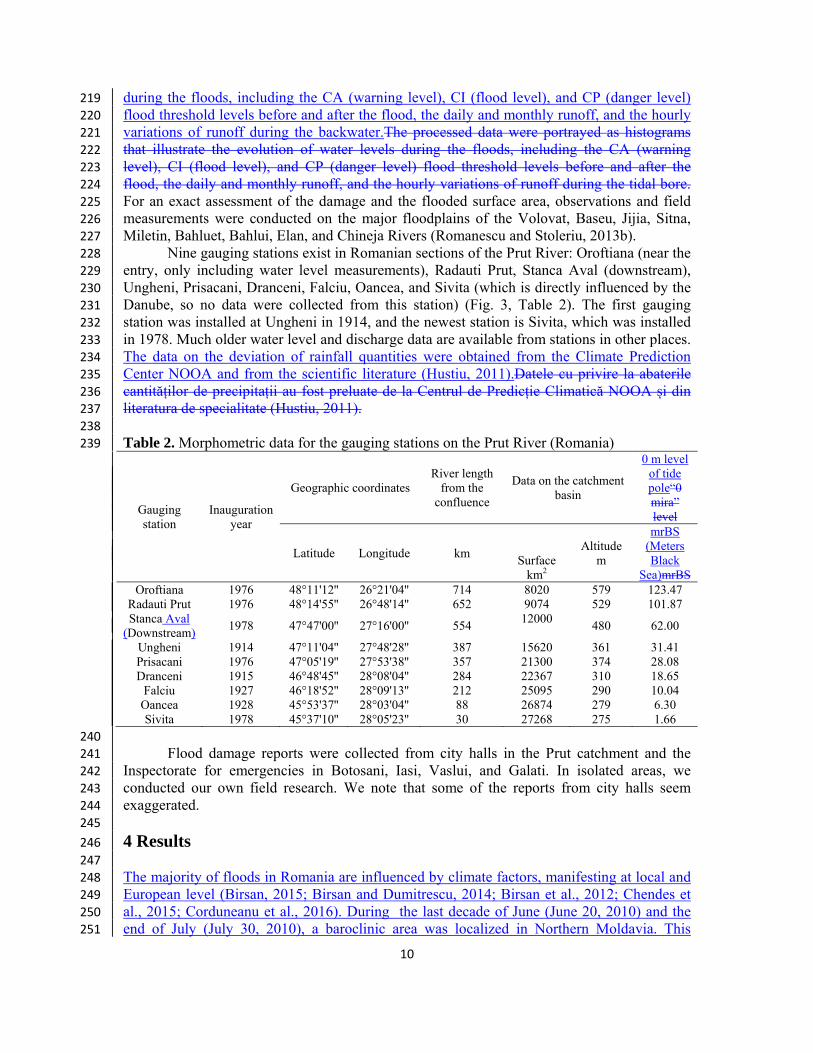
Table 2. Morphometric data for the gauging stations on the Prut River (Romania) 239
Gauging station
Inauguration year
Geographic coordinates River length
from the confluence
Data on the catchment basin
0 m level of tide pole“0 mira” level
Latitude Longitude km Surface
km2
Altitude m
mrBS (Meters Black
Sea)mrBS Oroftiana 1976 48°11'12'' 26°21'04'' 714 8020 579 123.47
Radauti Prut 1976 48°14'55'' 26°48'14'' 652 9074 529 101.87 Stanca Aval
(Downstream) 1978 47°47'00'' 27°16'00'' 554
12000 480 62.00
Ungheni 1914 47°11'04'' 27°48'28'' 387 15620 361 31.41 Prisacani 1976 47°05'19'' 27°53'38'' 357 21300 374 28.08 Dranceni 1915 46°48'45'' 28°08'04'' 284 22367 310 18.65
Falciu 1927 46°18'52'' 28°09'13'' 212 25095 290 10.04 Oancea 1928 45°53'37'' 28°03'04'' 88 26874 279 6.30 Sivita 1978 45°37'10'' 28°05'23'' 30 27268 275 1.66
240
Flood damage reports were collected from city halls in the Prut catchment and the 241
Inspectorate for emergencies in Botosani, Iasi, Vaslui, and Galati. In isolated areas, we 242
conducted our own field research. We note that some of the reports from city halls seem 243
exaggerated. 244
245
4 Results 246
247
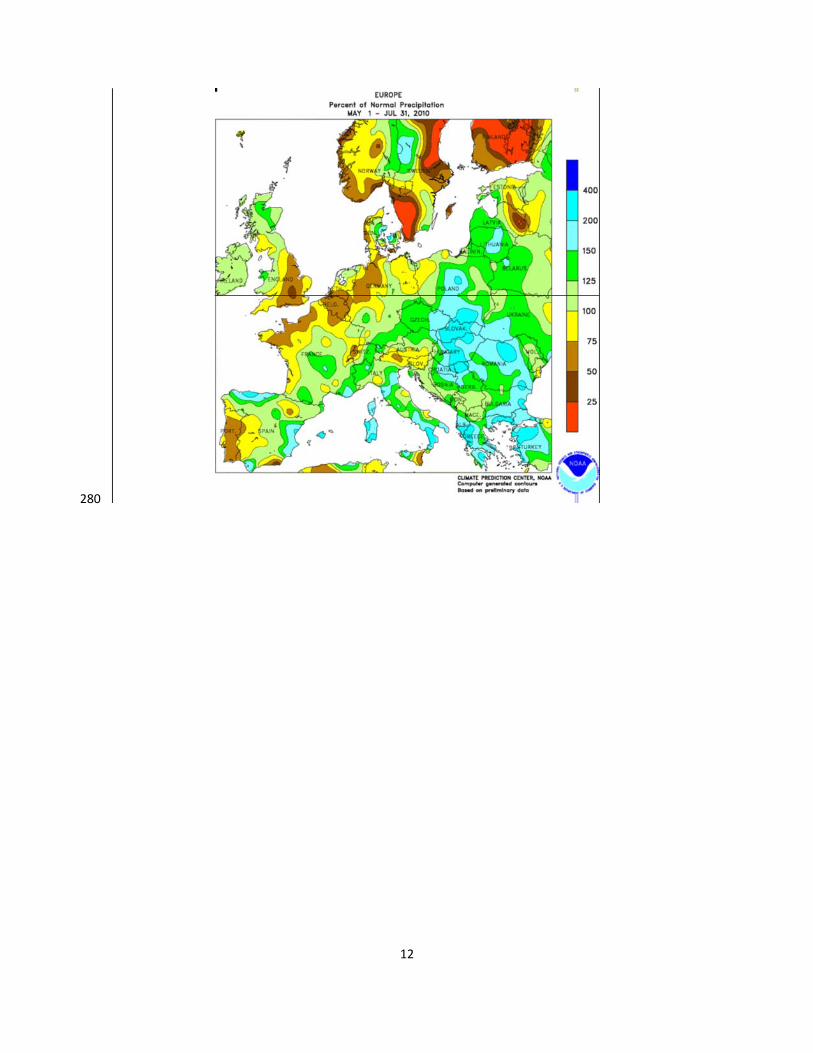
The majority of floods in Romania are influenced by climate factors, manifesting at local and 248
European level (Birsan, 2015; Birsan and Dumitrescu, 2014; Birsan et al., 2012; Chendes et 249
al., 2015; Corduneanu et al., 2016). During the last decade of June (June 20, 2010) and the 250
end of July (July 30, 2010), a baroclinic area was localized in Northern Moldavia. This 251
11
favoured the formation of a convergent area of humidity. In this case, a layer of humid, warm 252
and unstable air was installed between the topographic surface and 2500 m of altitude. The 253
high quantity of humidity originitated from The Black Sea, situated 500 km away. The warm 254
tropical air is generated by the Russian Plain, overheated by a strong continentality climate. 255
The cold air from medium troposphere, inducted by the cut-off nucleum that generated 256
atmospheric instability, overlapped this structure of the low troposphere (Hustiu, 2011). The 257
synoptic context was disturbed by local physical-geographical factors, especially by the 258
orography of Eastern Carpathians, which led to extremely powerful heavy rains: e.g. 100-200 259
mm in 24 hours at the sources of Jijia (representing the amount that normally falls during June 260
and July) or 40-60 mm in 24 hours at the Romanian frontier with Ukraine and the Republic of 261
Moldova. The quantity of rainfall in 24 hours were 2-3 higher than the normal values for this 262
period (Hustiu, 2011) (Fig. 4).Majoritatea inundațiilor din România sunt influențate de 263
condițiile climatice care se manifestă la nivel european dar și la nivel local (Birsan, 2015; 264
Birsan and Dumitrescu, 2014; Birsan et al., 2012; Chendes et al., 2015; Corduneanu et al., 265
2016). În ultima decadă a lunii iunie (20 iunie 2010) și sfârșitul lunii iulie (30 iulie 2010) s-a 266
instalat o zonă baroclină în nordul Moldovei. Aceasta a asigurat formarea unei arii 267
convergente de umezeală. În acest caz între suprafața topografică și altitudinea de 2500m s-a 268
instalat un strat de aer umed, cald și instabil. Cantitatea ridicată de umezeală provine din 269 Marea Neagră, situată la 500 km distanță. Aerul cald tropical este generat de Câmpia Rusă, 270
supraîncălzită ca urmare a continentalismului accentuat. Pe această structură a troposferei 271
joase s-a suprapus aerul rece din troposfera medie, antrenat de nucleul cut-off care a dat 272
naștere instabilității atmosferice (Hustiu, 2011). Contextul sinoptic a fost perturbat de factorii 273
fizico-geografici locali, mai ales de orografia Carpaților Orientali, care au dus la formarea 274
unor ploi torențiale extrem de puternice: 100-200 mm/24 ore la izvoarele râului Jijia (cantitate 275
care cade în mod normal în două luni: iunie și iulie) sau de 40-60 mm/24 ore la frontiera 276
României cu Ucraina și Republica Moldova. Cantitățile de precipitații căzute în 24 de ore 277
depășesc de 2-3 ori normele climatice ale perioadei (Hustiu, 2011) (Fig. ?). 278
279
12
280
13
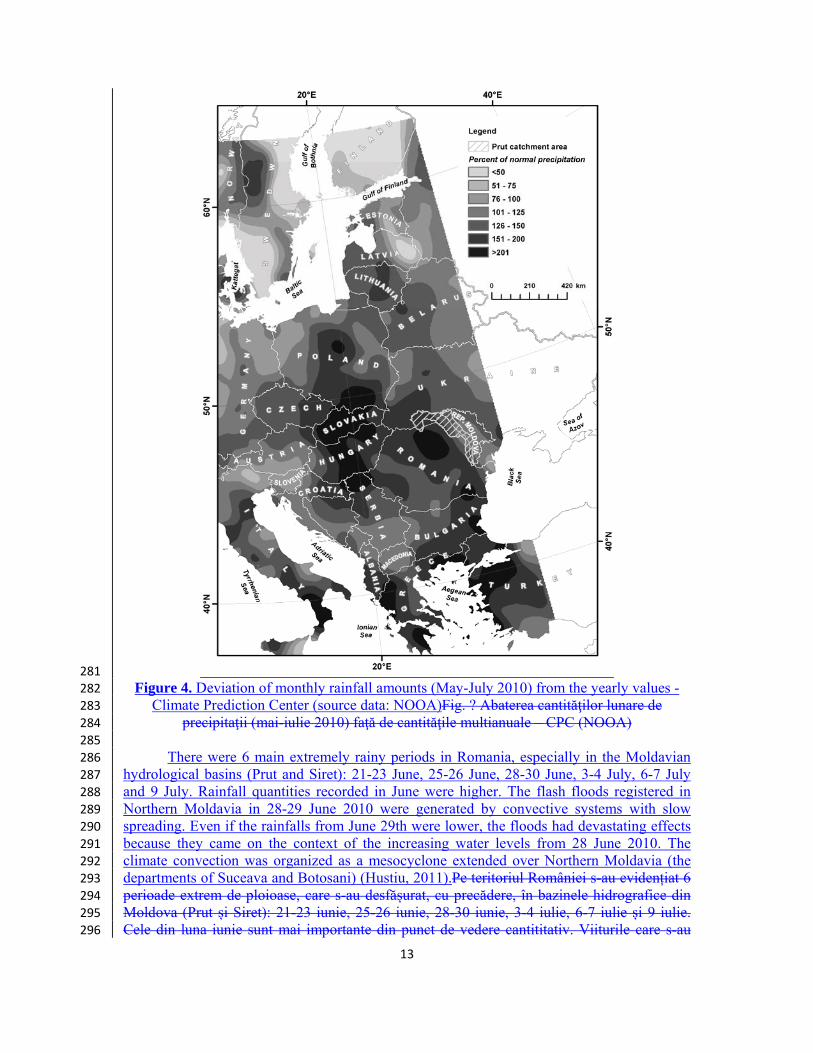
281 Figure 4. Deviation of monthly rainfall amounts (May-July 2010) from the yearly values - 282
Climate Prediction Center (source data: NOOA)Fig. ? Abaterea cantităţilor lunare de 283
precipitaţii (mai-iulie 2010) faţă de cantităţile multianuale – CPC (NOOA) 284
285
There were 6 main extremely rainy periods in Romania, especially in the Moldavian 286
hydrological basins (Prut and Siret): 21-23 June, 25-26 June, 28-30 June, 3-4 July, 6-7 July 287
and 9 July. Rainfall quantities recorded in June were higher. The flash floods registered in 288
Northern Moldavia in 28-29 June 2010 were generated by convective systems with slow 289
spreading. Even if the rainfalls from June 29th were lower, the floods had devastating effects 290
because they came on the context of the increasing water levels from 28 June 2010. The 291
climate convection was organized as a mesocyclone extended over Northern Moldavia (the 292
departments of Suceava and Botosani) (Hustiu, 2011).Pe teritoriul României s-au evidențiat 6 293
perioade extrem de ploioase, care s-au desfășurat, cu precădere, în bazinele hidrografice din 294
Moldova (Prut și Siret): 21-23 iunie, 25-26 iunie, 28-30 iunie, 3-4 iulie, 6-7 iulie și 9 iulie. 295
Cele din luna iunie sunt mai importante din punct de vedere cantititativ. Viiturile care s-au 296
14
produs pe 28-29 iunie 2010 în nordul Moldovei au fost generate de sisteme convective cu 297
propagare lentă. Deși ploile din data de 29 iunie au fost mai reduse inundațiile au avut efecte 298
distrugătoare deoarece veneau pe fondul creșterilor de nivel din data de 28 iunie 2010. 299
Convecția climatică s-a organizat sub forma unui mezociclon extins pe suprafața județelor din 300
nordul Moldovei (Suceava și Botosani) (Hustiu, 2011). 301
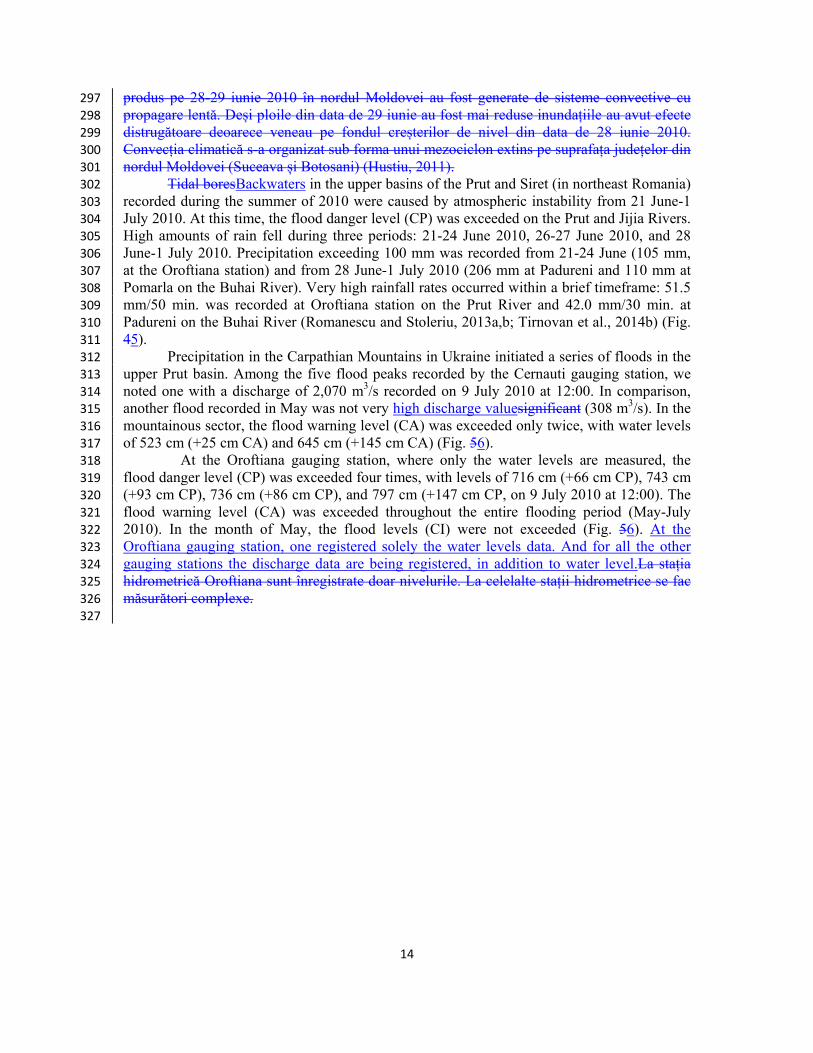
Tidal boresBackwaters in the upper basins of the Prut and Siret (in northeast Romania) 302
recorded during the summer of 2010 were caused by atmospheric instability from 21 June-1 303
July 2010. At this time, the flood danger level (CP) was exceeded on the Prut and Jijia Rivers. 304
High amounts of rain fell during three periods: 21-24 June 2010, 26-27 June 2010, and 28 305
June-1 July 2010. Precipitation exceeding 100 mm was recorded from 21-24 June (105 mm, 306
at the Oroftiana station) and from 28 June-1 July 2010 (206 mm at Padureni and 110 mm at 307
Pomarla on the Buhai River). Very high rainfall rates occurred within a brief timeframe: 51.5 308
mm/50 min. was recorded at Oroftiana station on the Prut River and 42.0 mm/30 min. at 309
Padureni on the Buhai River (Romanescu and Stoleriu, 2013a,b; Tirnovan et al., 2014b) (Fig. 310
45). 311
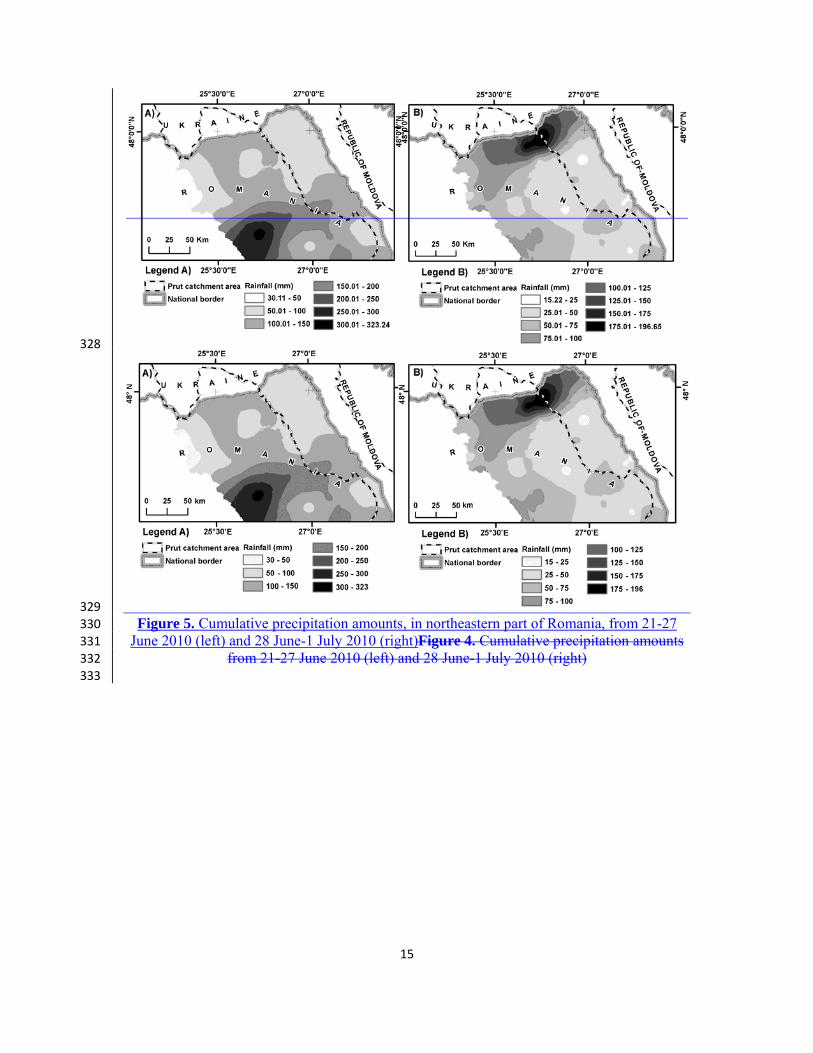
Precipitation in the Carpathian Mountains in Ukraine initiated a series of floods in the 312
upper Prut basin. Among the five flood peaks recorded by the Cernauti gauging station, we 313
noted one with a discharge of 2,070 m3/s recorded on 9 July 2010 at 12:00. In comparison, 314 another flood recorded in May was not very high discharge valuesignificant (308 m3/s). In the 315
mountainous sector, the flood warning level (CA) was exceeded only twice, with water levels 316
of 523 cm (+25 cm CA) and 645 cm (+145 cm CA) (Fig. 56). 317
At the Oroftiana gauging station, where only the water levels are measured, the 318
flood danger level (CP) was exceeded four times, with levels of 716 cm (+66 cm CP), 743 cm 319
(+93 cm CP), 736 cm (+86 cm CP), and 797 cm (+147 cm CP, on 9 July 2010 at 12:00). The 320
flood warning level (CA) was exceeded throughout the entire flooding period (May-July 321
2010). In the month of May, the flood levels (CI) were not exceeded (Fig. 56). At the 322
Oroftiana gauging station, one registered solely the water levels data. And for all the other 323
gauging stations the discharge data are being registered, in addition to water level.La stația 324
hidrometrică Oroftiana sunt înregistrate doar nivelurile. La celelalte stații hidrometrice se fac 325
măsurători complexe. 326
327
15
328
329
Figure 5. Cumulative precipitation amounts, in northeastern part of Romania, from 21-27 330
June 2010 (left) and 28 June-1 July 2010 (right)Figure 4. Cumulative precipitation amounts 331
from 21-27 June 2010 (left) and 28 June-1 July 2010 (right) 332
333
16
334
335
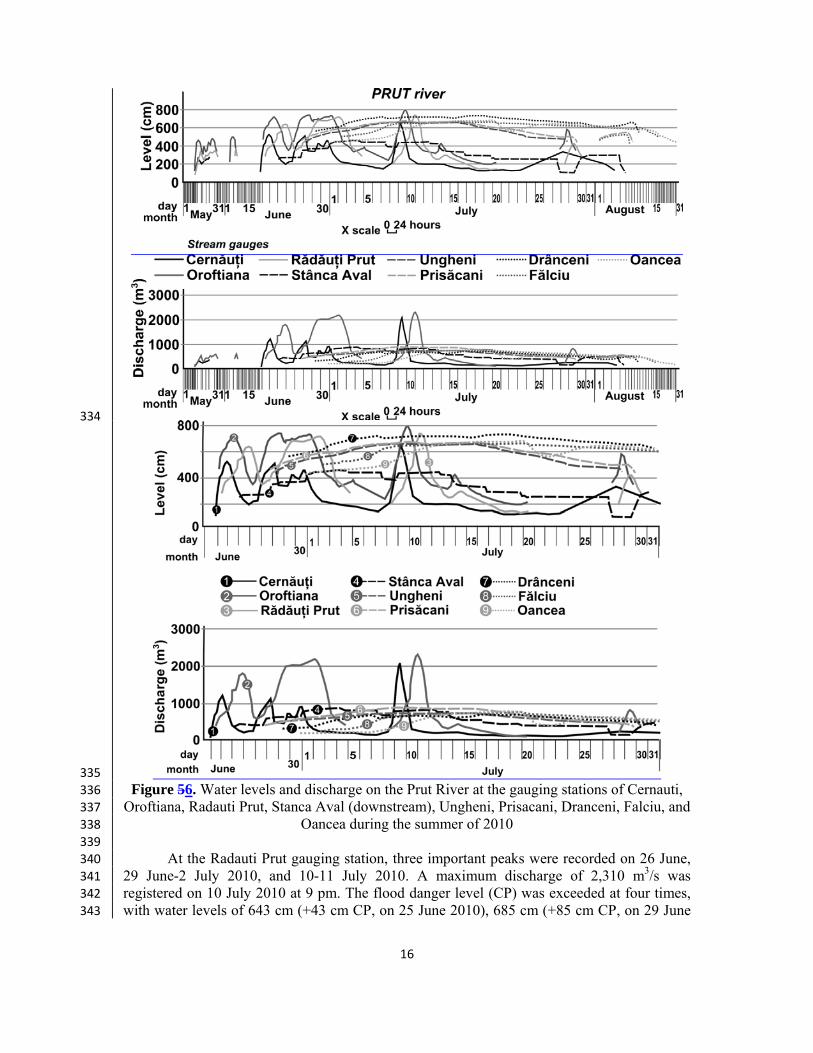
Figure 56. Water levels and discharge on the Prut River at the gauging stations of Cernauti, 336
Oroftiana, Radauti Prut, Stanca Aval (downstream), Ungheni, Prisacani, Dranceni, Falciu, and 337
Oancea during the summer of 2010 338
339
At the Radauti Prut gauging station, three important peaks were recorded on 26 June, 340
29 June-2 July 2010, and 10-11 July 2010. A maximum discharge of 2,310 m3/s was 341
registered on 10 July 2010 at 9 pm. The flood danger level (CP) was exceeded at four times, 342
with water levels of 643 cm (+43 cm CP, on 25 June 2010), 685 cm (+85 cm CP, on 29 June 343
17
2010), 721 cm (+121 cm CP, on 29 June-2 July 2010), and 744 cm (+144 cm CP, on 10-11 344
July 2010) (Fig. 56). 345
The Stanca Aval (downstream) gauging station is controlled by overflow from the 346
Stanca-Costesti reservoir. This control mitigates the flood hydrographs. The maximum 347
discharge value at this station was 885 m3/s on 3 July 2010. The flood level (CI) was 348
exceeded from the beginning to the end of the flooding period. The flood danger level (CP) 349
was exceeded from 1-13 July 2010, reaching a maximum water level of 460 cm (+85 cm CP, 350
on 3 July 2010) (Fig. 56). 351
At the Ungheni gauging station, floods were recorded throughout the entire month of 352
July. The maximum discharge was 673 m3/s on 8 July 2010. Flooding continued until 5 353
August 2010. The flood danger level (CP) was exceeded during the 12-day period from 6-17 354
July 2010. The maximum water level was 661 cm (+1 cm CP) (Fig. 56). 355
Floods were also recorded throughout July at the Prisacani gauging station. The 356
maximum discharge was 886 m3/s on 9 July 2010. Flooding continued until 5 August 2010. 357
The flood danger level (CP) was exceeded during the 16-day period from 4-19 July 2010. The 358
maximum water level was 673 cm (+73 cm CP) (Fig. 56). 359
At the Dranceni gauging station, floods were recorded over a long period from the end 360
of June until the beginning of August. The maximum discharge was 718 m3/s on 17 July 361 2010. The flood danger level (CP) was reached or exceeded during the 18-day period from 4-362
22 July 2010. The maximum water level was 729 cm (+29 cm CP) (Fig. 56). 363
At the Falciu gauging station, floods occurred throughout July and during the first half 364
of August. The maximum discharge was 722 m3/s on 19 July 2010. The flood danger level 365
(CP) was reached or exceeded during the 35-day period from 6 July-2 August 2010. The 366
maximum water level was 655 cm (+55 cm CP) (Fig. 56). 367
At the Oancea gauging station, two tidal boresbackwaters were recorded in July and 368
August. The first tidal borebackwaters on 19 July 2010 had a peak discharge of 697 m3/s and 369
the second on 27 July 2010 had a peak discharge of 581 m3/s. Both tidal boresbackwaters 370
exceeded the flood danger level (CP) throughout the month of July. The maximum water level 371
of the first backwaterbore was 683 cm (+83 cm CP), and the maximum for the second was 372
646 cm (+46 cm CP) (Fig. 56). Backwaters were caused by increasing water level of Danube 373
River, which influences the measurements results at the gauging stations situated on the 374
downstream sector of Prut River.Undele de remuu sunt determinate de creșterile de nivel de 375
pe fluviul Dunărea și influențează măsurătorile de la stațiile hidrometrice situate în sectorul 376
aval al Prutului. 377
The western tributaries of the Prut (within the Moldavian Plain) are 378
numerous, but they have only modest mean annual discharges. They are periodically affected 379
by floods following heavy summer rains. At the Stefanesti gauging station, within the 380
downstream sector of the Baseu River, floods were recorded from 1-4 July 2010. The 381
maximum discharge was 107 m3/s on 6 July 2010. The flood level (CI) was reached or 382
exceeded for two days. The maximum level was 355 cm (+5 cm CI) (Fig. 67). The Stefanesti 383
gauging station is located in the downstream sector of the dam and it is directly influenced by 384
the discharge water from the Stanca-Costesti Lake (since 1978).Stația hidrometrică Stefanesti 385
este situată în sectorul aval al barajului si este direct influențată de descărcarea apei din lacul 386
Stânca-Costești (începând cu anul 1978). 387
At the Padureni gauging station on the Buhai River, two tidal boresbackwaters 388
were recorded in June and a secondary backwatertidal bore in May. The maximum discharge 389
was 470 m3/s on 28 June 2010. The flood danger level was exceeded during both 390
backwaterbores, with water levels of 470 cm (+120 cm CP, on 28 June 2010) and 440 cm 391
(+90 cm CP, on 29 June 2010) (Figs. 3, 67). 392
18
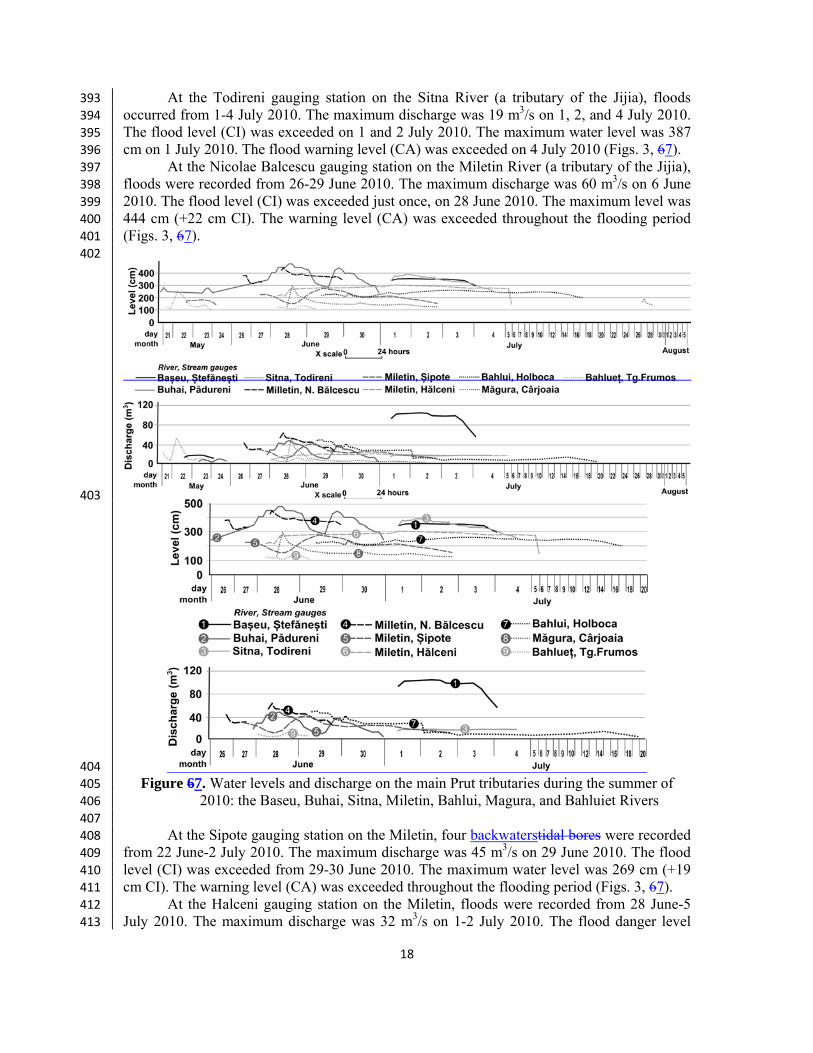
At the Todireni gauging station on the Sitna River (a tributary of the Jijia), floods 393
occurred from 1-4 July 2010. The maximum discharge was 19 m3/s on 1, 2, and 4 July 2010. 394
The flood level (CI) was exceeded on 1 and 2 July 2010. The maximum water level was 387 395
cm on 1 July 2010. The flood warning level (CA) was exceeded on 4 July 2010 (Figs. 3, 67). 396
At the Nicolae Balcescu gauging station on the Miletin River (a tributary of the Jijia), 397
floods were recorded from 26-29 June 2010. The maximum discharge was 60 m3/s on 6 June 398
2010. The flood level (CI) was exceeded just once, on 28 June 2010. The maximum level was 399
444 cm (+22 cm CI). The warning level (CA) was exceeded throughout the flooding period 400
(Figs. 3, 67). 401
402
403
404
Figure 67. Water levels and discharge on the main Prut tributaries during the summer of 405
2010: the Baseu, Buhai, Sitna, Miletin, Bahlui, Magura, and Bahluiet Rivers 406
407
At the Sipote gauging station on the Miletin, four backwaterstidal bores were recorded 408
from 22 June-2 July 2010. The maximum discharge was 45 m3/s on 29 June 2010. The flood 409
level (CI) was exceeded from 29-30 June 2010. The maximum water level was 269 cm (+19 410
cm CI). The warning level (CA) was exceeded throughout the flooding period (Figs. 3, 67). 411
At the Halceni gauging station on the Miletin, floods were recorded from 28 June-5 412
July 2010. The maximum discharge was 32 m3/s on 1-2 July 2010. The flood danger level 413
19
(CP) was exceeded during the peak discharge period, with a water level of 302 cm (+2 cm 414
CP). The flood level (CI) was exceeded throughout the flooding period (Figs. 3, 67). 415
The Carjoaia gauging station on the Magura River (a tributary of the Bahlui), one 416
major backwatertidal bore was recorded. The maximum discharge was 73.5 m3/s on 28 June 417
2010. The flood level (CI) was exceeded on 28 June 2010. The maximum water level was 280 418
cm (+90 cm CI) (Figs. 3, 67). 419
At the Targu Frumos gauging station on the Bahluet (atributary of the Bahlui), one 420
major backwatertidal bore was recorded on 22 May 2010, with a maximum discharge of 48 421
m3/s. The flood danger level (CP) was reached on the same day and the maximum water level 422
was 250 cm (0 cm CP). The flood warning level (CA) was exceeded throughout the flooding 423
period (Figs. 3, 67). 424
At the Harlau gauging station on the Bahlui (a tributary of the Jijia), successive and 425
increasing backwatertidal bores were recorded from 22 May-1 July 2010. The maximum 426
discharge was 32 m3/s on 29 June 2010. The flood level (CI) was exceeded throughout the 427
flooding period. The maximum water level was 552 cm (+132 cm CI) (Figs. 3, 67). 428
At the Iasi gauging station on the Bahlui, floods occurred from 24 June-4 July 2010. 429
The maximum discharge was 44 m3/s on 1 July 2010. The flood warning level (CA) was 430
exceeded throughout the flood. The maximum water level was 286 cm (+86 cm CA) (Figs. 3, 431 67). 432
At the Holboca gauging station on the Bahlui, floods were recorded from 29 June-17 433
July 2010. The maximum discharge was 50 m3/s on 29 June 2010. The warning level (CA) 434
was reached or exceeded throughout the flooding period. The maximum water level was 259 435
cm (+59 cm CA) (Figs. 3, 67). 436
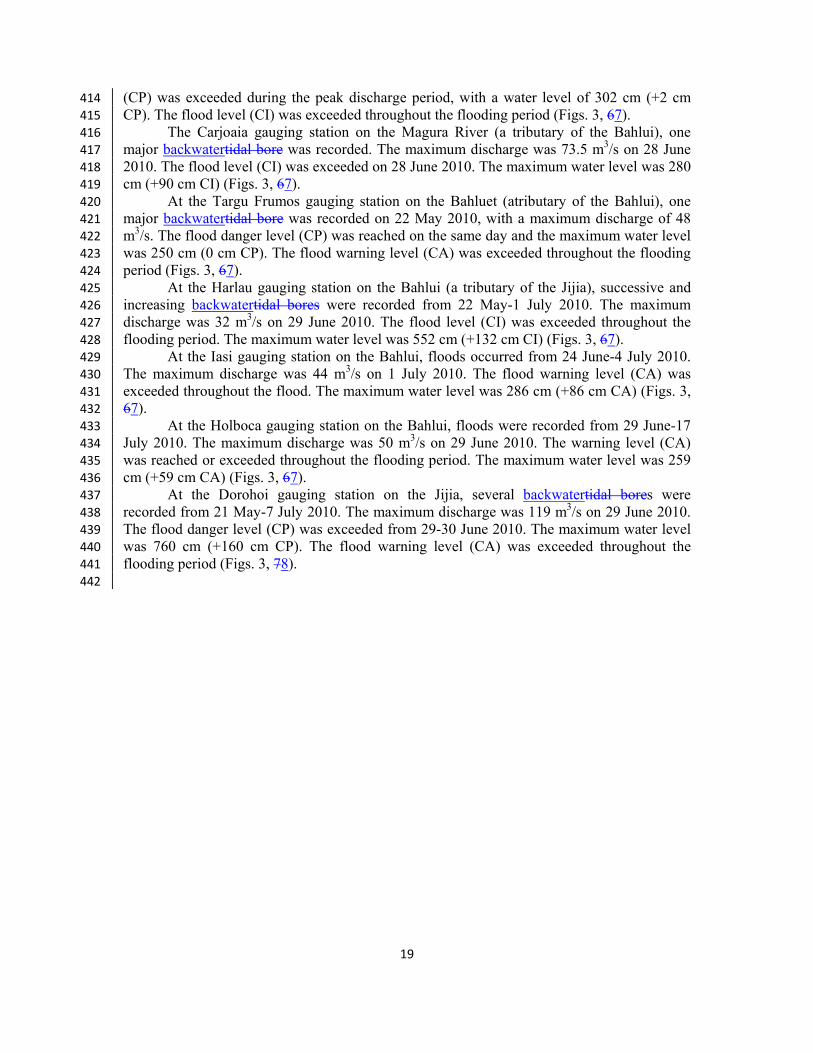
At the Dorohoi gauging station on the Jijia, several backwatertidal bores were 437
recorded from 21 May-7 July 2010. The maximum discharge was 119 m3/s on 29 June 2010. 438
The flood danger level (CP) was exceeded from 29-30 June 2010. The maximum water level 439
was 760 cm (+160 cm CP). The flood warning level (CA) was exceeded throughout the 440
flooding period (Figs. 3, 78). 441
442
20
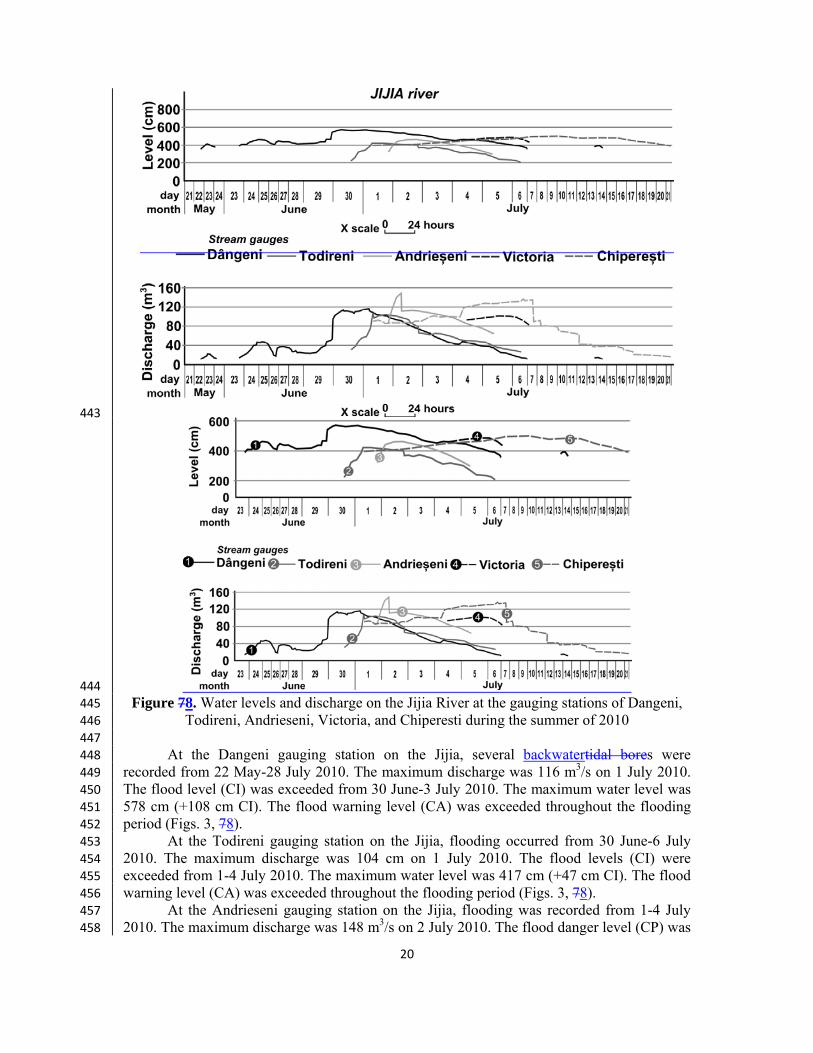
443
444 Figure 78. Water levels and discharge on the Jijia River at the gauging stations of Dangeni, 445
Todireni, Andrieseni, Victoria, and Chiperesti during the summer of 2010 446
447
At the Dangeni gauging station on the Jijia, several backwatertidal bores were 448
recorded from 22 May-28 July 2010. The maximum discharge was 116 m3/s on 1 July 2010. 449
The flood level (CI) was exceeded from 30 June-3 July 2010. The maximum water level was 450
578 cm (+108 cm CI). The flood warning level (CA) was exceeded throughout the flooding 451
period (Figs. 3, 78). 452
At the Todireni gauging station on the Jijia, flooding occurred from 30 June-6 July 453
2010. The maximum discharge was 104 cm on 1 July 2010. The flood levels (CI) were 454
exceeded from 1-4 July 2010. The maximum water level was 417 cm (+47 cm CI). The flood 455
warning level (CA) was exceeded throughout the flooding period (Figs. 3, 78). 456
At the Andrieseni gauging station on the Jijia, flooding was recorded from 1-4 July 457
2010. The maximum discharge was 148 m3/s on 2 July 2010. The flood danger level (CP) was 458
21
exceeded on 2 and 3 July 2010. The maximum water level was 461 cm (+11 cm CP). The 459
flood warning level (CA) was exceeded throughout the flooding period (Figs. 3, 78). 460
At the Chiperesti gauging station on the Jijia, successive and increasing backwatertidal 461
bores were recorded from1-19 July 2010. The maximum discharge was 136 m3/s on 6 July 462
2010. The flood warning level (CA) was exceeded throughout the flooding period. The 463
maximum water level was 497 cm (+97 cm CA) (Figs. 3, 78). 464
At the Victoria gauging station on the Jijia, flooding occurred from 4-7 July 2010. The 465
peak discharge was 100 m3/s on 5 July 2010. The flood warning level (CA) was exceeded 466
throughout the flooding period. The maximum water level was 485 cm (+35 cm CA) (Figs. 3, 467
78). 468
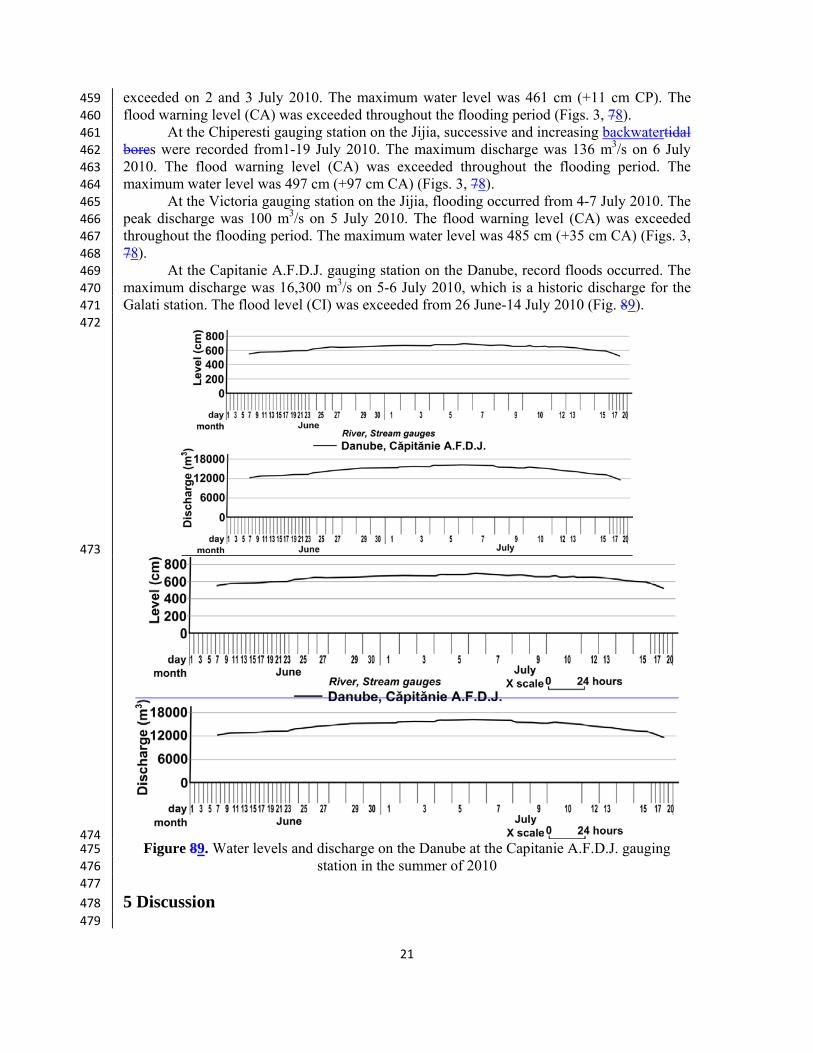
At the Capitanie A.F.D.J. gauging station on the Danube, record floods occurred. The 469
maximum discharge was 16,300 m3/s on 5-6 July 2010, which is a historic discharge for the 470
Galati station. The flood level (CI) was exceeded from 26 June-14 July 2010 (Fig. 89). 471
472
473
474 Figure 89. Water levels and discharge on the Danube at the Capitanie A.F.D.J. gauging 475
station in the summer of 2010 476
477
5 Discussion 478
479
22
Cumulative heavy rains from 21-24 June, 26-27 June, and 28 June-1 July 2010 caused water 480
levels to exceed the flood danger level (CP) by 40-150 cm on the Prut in the Oroftiana-481
Radauti Prut sector and by 30-150 cm in the upper basin of the Jijia. The flood level (CI) was 482
exceeded by 80-110 cm in the middle basin of the Jijia and in its tributaries (Sitna, Miletin, 483
and Buhai). Discharges within the lower Jijia basin were controlled by upstream reservoirs 484
and downstream polders in the lower reaches of the Jijia. 485
The Oroftiana gauging station only records water level measurements. The Radauti 486
Prut gauging station may be influenced by the water stored in the Stanca-Costesti reservoir 487
(which occurred during the historic flood of 2008) (Romanescu et al., 2011a,b). The Stanca 488
downstream gauging station may be influenced by overflow from the Stanca-Costesti 489
reservoir. The Oancea gauging station, situated near the mouth of the Prut, may be influenced 490
by waters from the Danube. The water level registered at the Radauti Prut gauging station 491
could have been influenced by the backwaters caused by Stanca-Costesti Lake. The most 492
obvious case of backwaters was registered during the 2008 historic flood. 493
Nivelul apei de la stația hidrometrică Radauti Prut poate fi influențat de remuul provocat în 494
lacul Stânca-Costești. Cel mai evident caz este cel produs în timpul inundațiilor istorice din 495
anul 2008). 496
High discharge and water levels of 2,310 m3/s and 744 cm (+144 cm CP), 497 respectively, were recorded at the Radauti Prut gauging station. The 2010 values are 498
remarkablesignificantly lower than the maximum values recorded in 2008 of 7,140 m3/s and 499
1,130 cm (+530 cm CP) (the highest value for Romanian rivers). This value was recalculated 500
after two years (through recomposed discharges)(prin intermediul debitelor reconstituite), 501
resulting in a discharge of 4,240 m3/s, which is the second highest value in Romania (after the 502
historic discharge of 4,650 m3/s on the Siret in 2005) (Romanescu et al., 2011a,b). The 503
existence of five backwatertidal bore peaks (with the second and third backwatertidal bores 504
being weaker) clearly indicates that they were caused by heavy rains in the Carpathian 505
Mountains in Ukraine. A volume of 200-400 mm of rainfall (ie 50-80% of the annual amount) 506
was recorded between 1 May and 15 July 2010. During the flood manifested in 2008, a 507
historic discharge value was registered for Prut River, but the by-passed water volume was 508
low (in upstream of Stanca-Costesti dam) because the flood duration was short. The 2010 509
flood registered lower maximum discharges compare to 2008, but it by-passed a larger water 510
volume, as flood lasted longer.În perioada 1 mai-15 iulie 2010 s-au înregistrat precipitații 511
cuprinse între 200-400 mm (adică 50-80% din norma anuală). Viitura din anul 2008 a 512
înregistrat debitul istoric pentru râul Prut dar volumul de apă tranzitat a fost redus (amonte de 513
barajul Stânca-Costești) deoarece durata fenomenului a fost scurtă. Viitura din anul 2010 a 514
înregistrat debite maxime mai reduse dar a tranzitat un volum mai mare de apă deoarece 515
durata fenomenului a fost îndelungată. 516
The flood hydrographs recorded at the Stanca Aval (downstream) gauging station 517
features flattened and relatively uniform backwatertidal bores, mostly in the central part of the 518
river. This behaviour is due to the influence of Stanca-Costesti reservoir, which significantly 519
reduced the maximum discharge at Stanca Aval (885 m3/s) compared to the Radauti Prut 520
gauging station upstream of the reservoir. The water level was maintained within the upper 521
limit recorded by longitudinal protection dams. 522
523
23
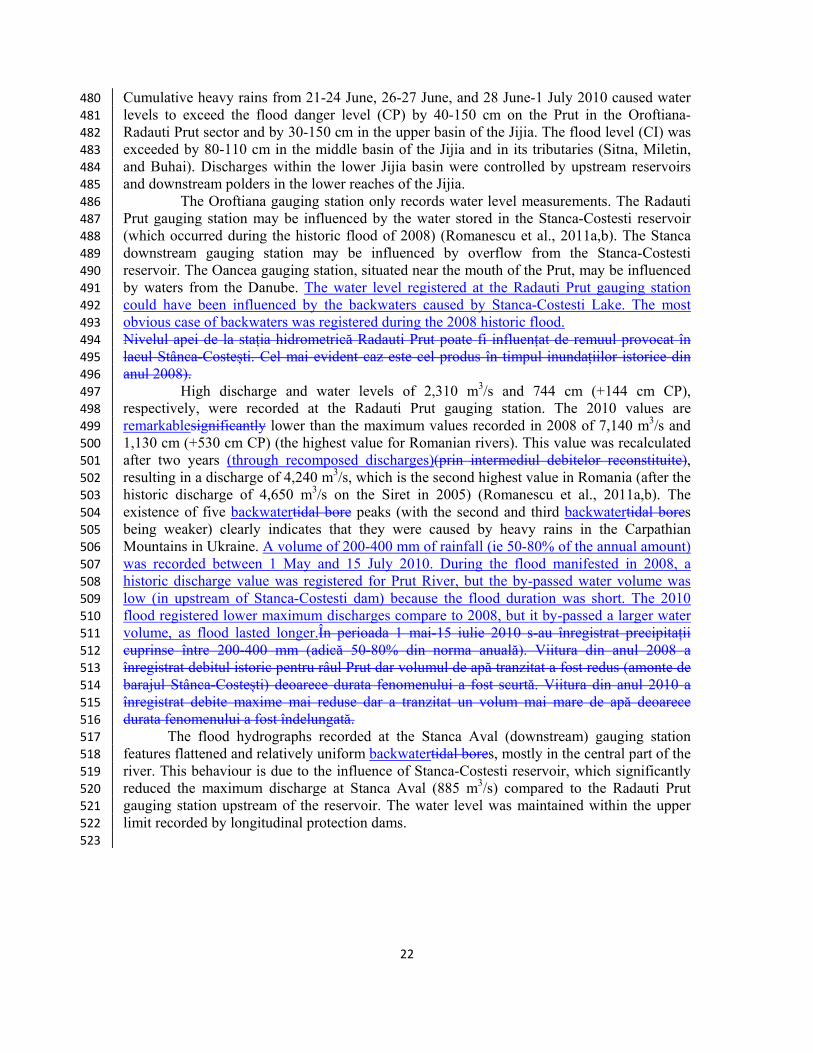
524 Figure 910. Distribution of sub-basins within the Jijia catchment and placement of the main 525
ponds 526
527
The Ungheni, Prisacani, Dranceni, and Falciu gauging stations had a flattened and 528
uniform backwatertidal bore, which signifies upstream control, including some of the 529
tributaries. The flood danger level (CP) was exceeded by a few centimetres and the floodplain 530
was partially flooded in these areas. The high discharges recorded at the Prisacani station 531
occurred because of waters in the upper Prut basin, including controlled spills from the 532
Stanca-Costesti reservoir. Downstream of the Prisacani station, the influence of the Jijia 533
becomes obvious: it increases the water level and lengthens the duration of floods. 534
Stronger floods within the middle reaches of the Prut occur because of its tributaries. 535
Flooding on the Baseu, Sitna, Miletin, Jijia, Bahluet, and Bahlui Rivers was strong, but it was 536
mitigated for the most part by the existence of ponds (Fig. 910). Therefore, the excess water 537
entering Romania from Ukraine entered the Stanca-Costesti reservoir. The excess water 538
downstream of the Stanca-Costesti reservoir came from tributaries. Discharge from the 539
tributaries is controlled by hydrotechnical works within each tributary’s catchment. The Jijia 540
and Bahlui catchments are 80% developed. The water levels downstream of these tributaries, 541
in the lower reaches of the Prut, are mitigated by the extreme width of the Prut floodplain (the 542
most important wetland of the interior Romanian rivers). 543
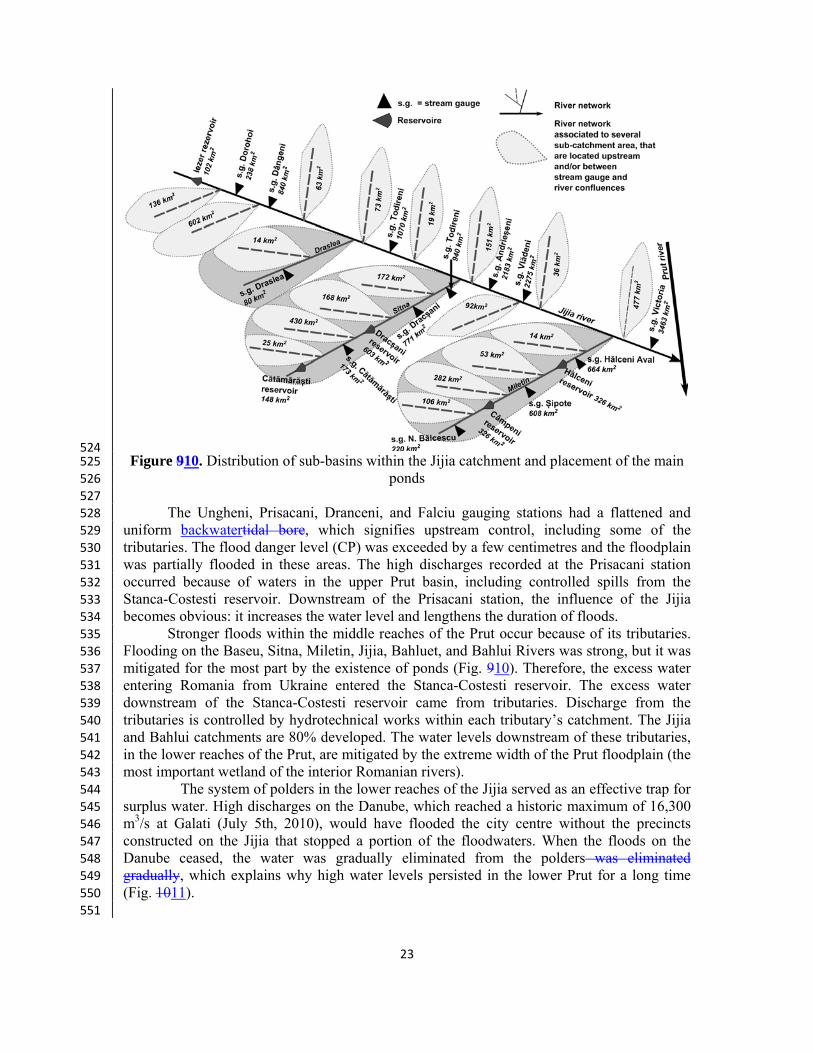
The system of polders in the lower reaches of the Jijia served as an effective trap for 544
surplus water. High discharges on the Danube, which reached a historic maximum of 16,300 545
m3/s at Galati (July 5th, 2010), would have flooded the city centre without the precincts 546
constructed on the Jijia that stopped a portion of the floodwaters. When the floods on the 547
Danube ceased, the water was gradually eliminated from the polders was eliminated 548
gradually, which explains why high water levels persisted in the lower Prut for a long time 549
(Fig. 1011). 550
551
24
552 Figure 1011. Polders on the Jijia and the floods recorded in the summer of 2010: storage of 553
excess water (left) and its elimination (right) 554
555
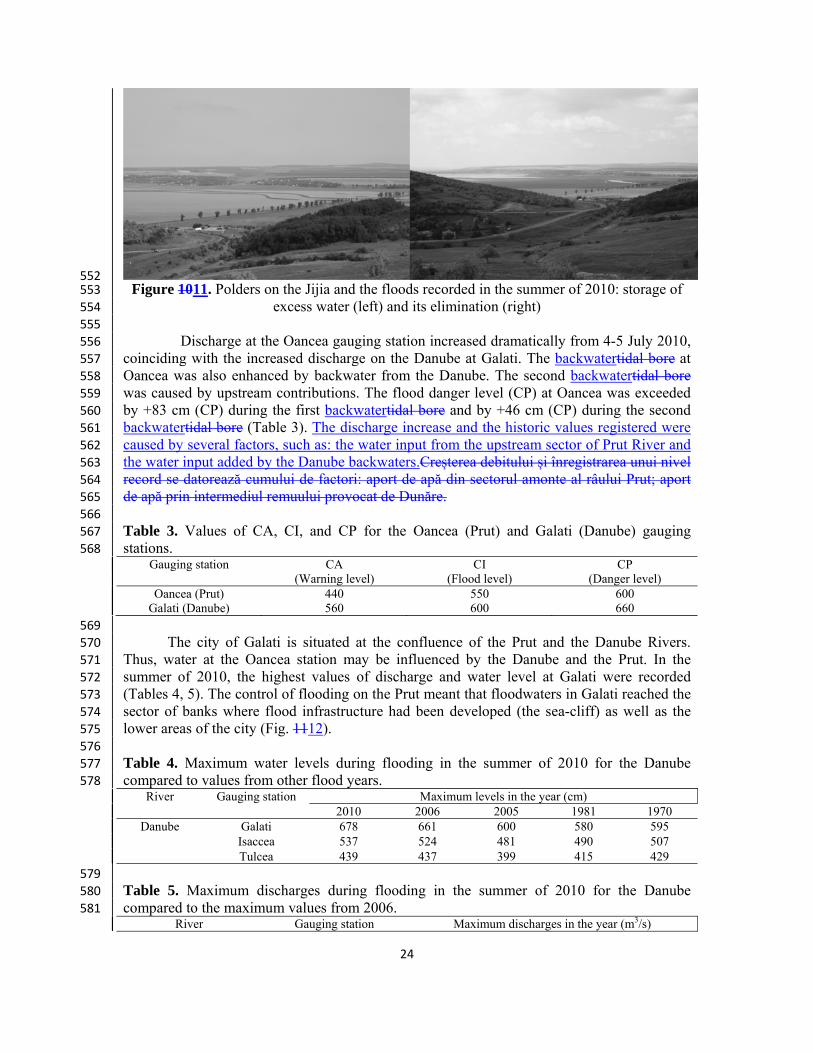
Discharge at the Oancea gauging station increased dramatically from 4-5 July 2010, 556
coinciding with the increased discharge on the Danube at Galati. The backwatertidal bore at 557
Oancea was also enhanced by backwater from the Danube. The second backwatertidal bore 558
was caused by upstream contributions. The flood danger level (CP) at Oancea was exceeded 559
by +83 cm (CP) during the first backwatertidal bore and by +46 cm (CP) during the second 560
backwatertidal bore (Table 3). The discharge increase and the historic values registered were 561
caused by several factors, such as: the water input from the upstream sector of Prut River and 562
the water input added by the Danube backwaters.Creșterea debitului și înregistrarea unui nivel 563
record se datorează cumului de factori: aport de apă din sectorul amonte al râului Prut; aport 564
de apă prin intermediul remuului provocat de Dunăre. 565
566
Table 3. Values of CA, CI, and CP for the Oancea (Prut) and Galati (Danube) gauging 567
stations. 568 Gauging station CA
(Warning level) CI
(Flood level) CP
(Danger level) Oancea (Prut) 440 550 600
Galati (Danube) 560 600 660
569
The city of Galati is situated at the confluence of the Prut and the Danube Rivers. 570
Thus, water at the Oancea station may be influenced by the Danube and the Prut. In the 571
summer of 2010, the highest values of discharge and water level at Galati were recorded 572
(Tables 4, 5). The control of flooding on the Prut meant that floodwaters in Galati reached the 573
sector of banks where flood infrastructure had been developed (the sea-cliff) as well as the 574
lower areas of the city (Fig. 1112). 575
576
Table 4. Maximum water levels during flooding in the summer of 2010 for the Danube 577
compared to values from other flood years. 578 River Gauging station Maximum levels in the year (cm)
2010 2006 2005 1981 1970 Danube Galati 678 661 600 580 595
Isaccea 537 524 481 490 507 Tulcea 439 437 399 415 429
579
Table 5. Maximum discharges during flooding in the summer of 2010 for the Danube 580
compared to the maximum values from 2006. 581 River Gauging station Maximum discharges in the year (m3/s)
25
2010 2006 Danube Galati 16300 14220
Isaccea 16240 14325 Tulcea 6117 5768
582
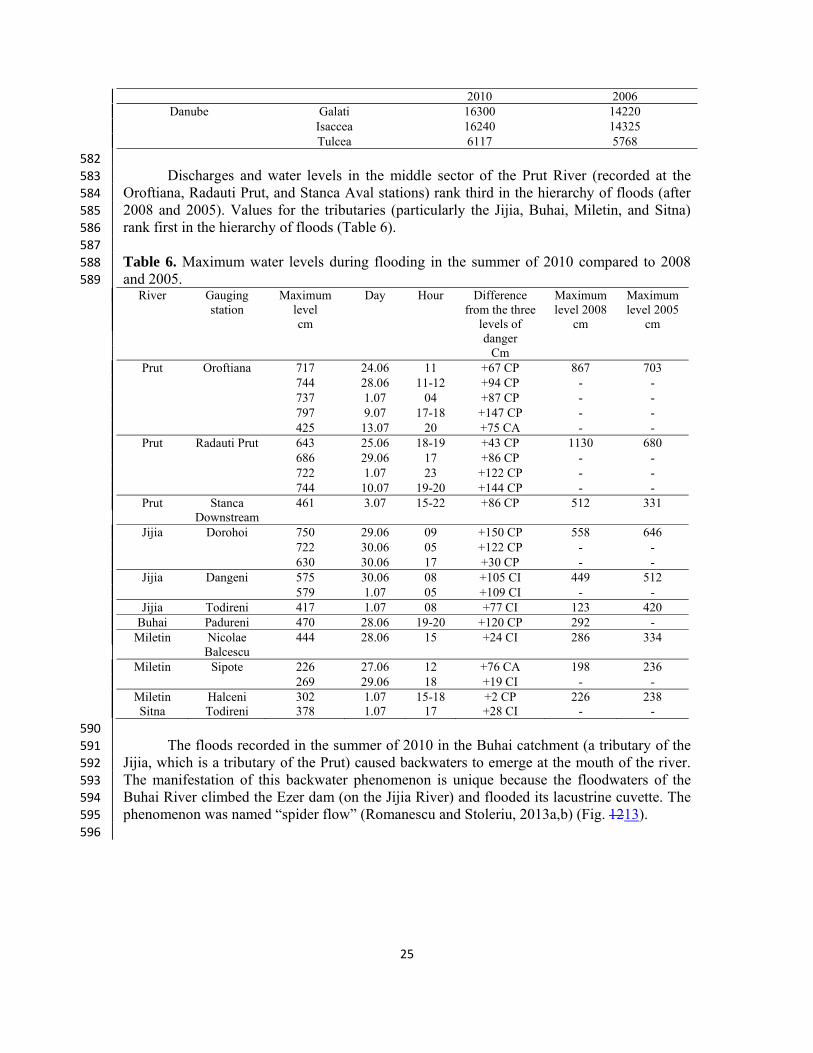
Discharges and water levels in the middle sector of the Prut River (recorded at the 583
Oroftiana, Radauti Prut, and Stanca Aval stations) rank third in the hierarchy of floods (after 584
2008 and 2005). Values for the tributaries (particularly the Jijia, Buhai, Miletin, and Sitna) 585
rank first in the hierarchy of floods (Table 6). 586
587
Table 6. Maximum water levels during flooding in the summer of 2010 compared to 2008 588
and 2005. 589 River Gauging
station Maximum
level cm
Day Hour Difference from the three
levels of danger
Cm
Maximum level 2008
cm
Maximum level 2005
cm
Prut Oroftiana 717 24.06 11 +67 CP 867 703 744 28.06 11-12 +94 CP - - 737 1.07 04 +87 CP - - 797 9.07 17-18 +147 CP - - 425 13.07 20 +75 CA - -
Prut Radauti Prut 643 25.06 18-19 +43 CP 1130 680 686 29.06 17 +86 CP - - 722 1.07 23 +122 CP - - 744 10.07 19-20 +144 CP - -
Prut Stanca Downstream
461 3.07 15-22 +86 CP 512 331
Jijia Dorohoi 750 29.06 09 +150 CP 558 646 722 30.06 05 +122 CP - - 630 30.06 17 +30 CP - -
Jijia Dangeni 575 30.06 08 +105 CI 449 512 579 1.07 05 +109 CI - -
Jijia Todireni 417 1.07 08 +77 CI 123 420 Buhai Padureni 470 28.06 19-20 +120 CP 292 -
Miletin Nicolae Balcescu
444 28.06 15 +24 CI 286 334
Miletin Sipote 226 27.06 12 +76 CA 198 236 269 29.06 18 +19 CI - -
Miletin Halceni 302 1.07 15-18 +2 CP 226 238 Sitna Todireni 378 1.07 17 +28 CI - -
590
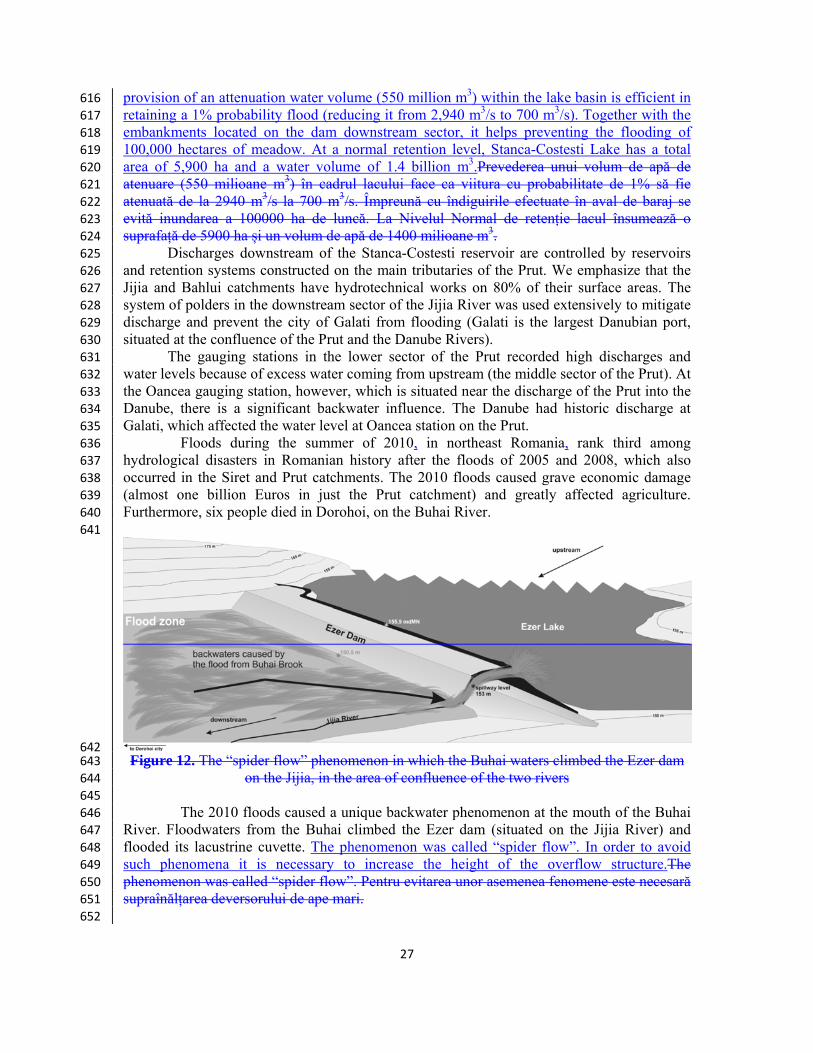
The floods recorded in the summer of 2010 in the Buhai catchment (a tributary of the 591
Jijia, which is a tributary of the Prut) caused backwaters to emerge at the mouth of the river. 592
The manifestation of this backwater phenomenon is unique because the floodwaters of the 593
Buhai River climbed the Ezer dam (on the Jijia River) and flooded its lacustrine cuvette. The 594
phenomenon was named “spider flow” (Romanescu and Stoleriu, 2013a,b) (Fig. 1213). 595
596
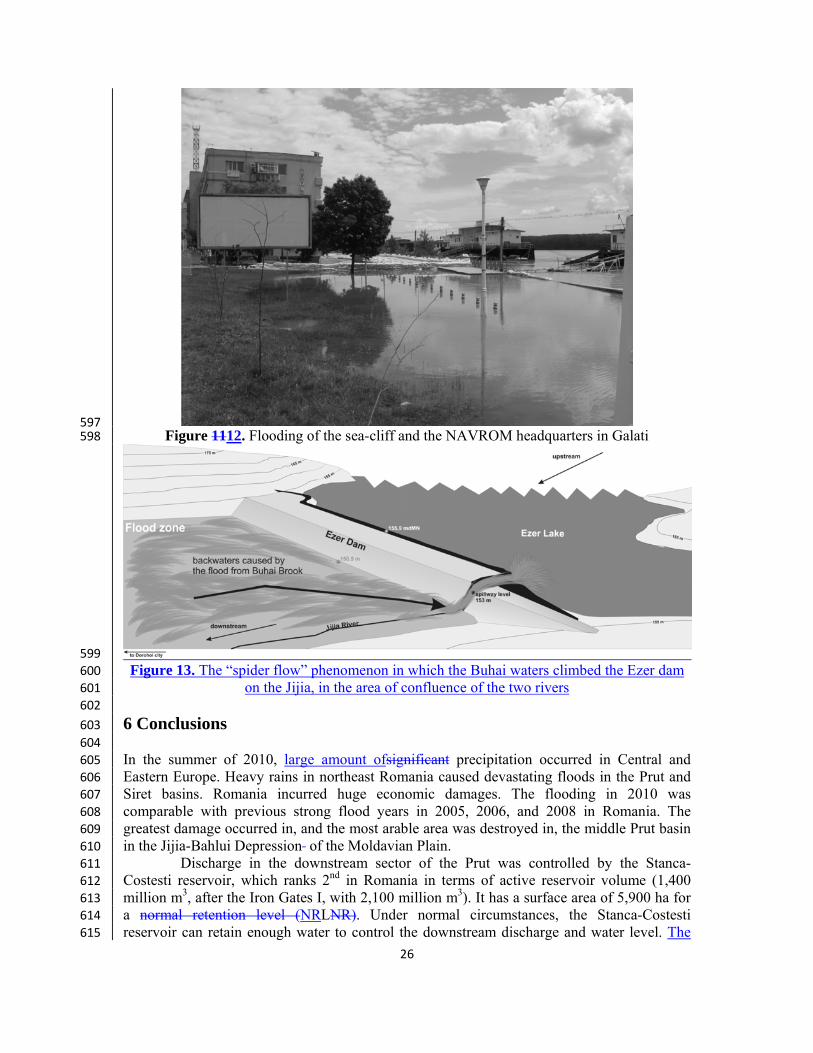
26
597 Figure 1112. Flooding of the sea-cliff and the NAVROM headquarters in Galati 598
599
Figure 13. The “spider flow” phenomenon in which the Buhai waters climbed the Ezer dam 600
on the Jijia, in the area of confluence of the two rivers 601
602
6 Conclusions 603
604
In the summer of 2010, large amount ofsignificant precipitation occurred in Central and 605
Eastern Europe. Heavy rains in northeast Romania caused devastating floods in the Prut and 606
Siret basins. Romania incurred huge economic damages. The flooding in 2010 was 607
comparable with previous strong flood years in 2005, 2006, and 2008 in Romania. The 608
greatest damage occurred in, and the most arable area was destroyed in, the middle Prut basin 609
in the Jijia-Bahlui Depression of the Moldavian Plain. 610
Discharge in the downstream sector of the Prut was controlled by the Stanca-611
Costesti reservoir, which ranks 2nd in Romania in terms of active reservoir volume (1,400 612
million m3, after the Iron Gates I, with 2,100 million m3). It has a surface area of 5,900 ha for 613
a normal retention level (NRLNR). Under normal circumstances, the Stanca-Costesti 614
reservoir can retain enough water to control the downstream discharge and water level. The 615
27
provision of an attenuation water volume (550 million m3) within the lake basin is efficient in 616
retaining a 1% probability flood (reducing it from 2,940 m3/s to 700 m3/s). Together with the 617
embankments located on the dam downstream sector, it helps preventing the flooding of 618
100,000 hectares of meadow. At a normal retention level, Stanca-Costesti Lake has a total 619
area of 5,900 ha and a water volume of 1.4 billion m3.Prevederea unui volum de apă de 620
atenuare (550 milioane m3) în cadrul lacului face ca viitura cu probabilitate de 1% să fie 621
atenuată de la 2940 m3/s la 700 m3/s. Împreună cu îndiguirile efectuate în aval de baraj se 622
evită inundarea a 100000 ha de luncă. La Nivelul Normal de retenție lacul însumează o 623
suprafață de 5900 ha și un volum de apă de 1400 milioane m3. 624
Discharges downstream of the Stanca-Costesti reservoir are controlled by reservoirs 625
and retention systems constructed on the main tributaries of the Prut. We emphasize that the 626
Jijia and Bahlui catchments have hydrotechnical works on 80% of their surface areas. The 627
system of polders in the downstream sector of the Jijia River was used extensively to mitigate 628
discharge and prevent the city of Galati from flooding (Galati is the largest Danubian port, 629
situated at the confluence of the Prut and the Danube Rivers). 630
The gauging stations in the lower sector of the Prut recorded high discharges and 631
water levels because of excess water coming from upstream (the middle sector of the Prut). At 632
the Oancea gauging station, however, which is situated near the discharge of the Prut into the 633 Danube, there is a significant backwater influence. The Danube had historic discharge at 634
Galati, which affected the water level at Oancea station on the Prut. 635
Floods during the summer of 2010, in northeast Romania, rank third among 636
hydrological disasters in Romanian history after the floods of 2005 and 2008, which also 637
occurred in the Siret and Prut catchments. The 2010 floods caused grave economic damage 638
(almost one billion Euros in just the Prut catchment) and greatly affected agriculture. 639
Furthermore, six people died in Dorohoi, on the Buhai River. 640
641
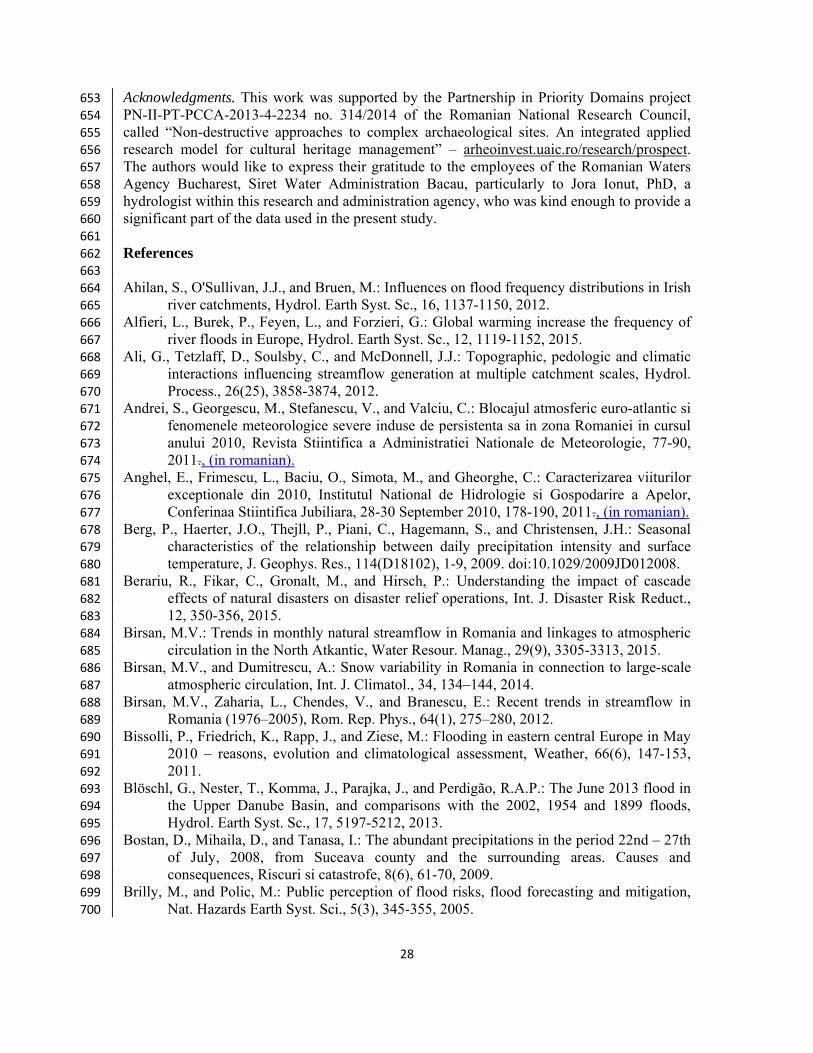
642 Figure 12. The “spider flow” phenomenon in which the Buhai waters climbed the Ezer dam 643
on the Jijia, in the area of confluence of the two rivers 644
645
The 2010 floods caused a unique backwater phenomenon at the mouth of the Buhai 646
River. Floodwaters from the Buhai climbed the Ezer dam (situated on the Jijia River) and 647
flooded its lacustrine cuvette. The phenomenon was called “spider flow”. In order to avoid 648
such phenomena it is necessary to increase the height of the overflow structure.The 649
phenomenon was called “spider flow”. Pentru evitarea unor asemenea fenomene este necesară 650
supraînălțarea deversorului de ape mari. 651
652
28
Acknowledgments. This work was supported by the Partnership in Priority Domains project 653
PN-II-PT-PCCA-2013-4-2234 no. 314/2014 of the Romanian National Research Council, 654
called “Non-destructive approaches to complex archaeological sites. An integrated applied 655
research model for cultural heritage management” – arheoinvest.uaic.ro/research/prospect. 656
The authors would like to express their gratitude to the employees of the Romanian Waters 657
Agency Bucharest, Siret Water Administration Bacau, particularly to Jora Ionut, PhD, a 658
hydrologist within this research and administration agency, who was kind enough to provide a 659
significant part of the data used in the present study. 660
661
References 662 663
Ahilan, S., O'Sullivan, J.J., and Bruen, M.: Influences on flood frequency distributions in Irish 664
river catchments, Hydrol. Earth Syst. Sc., 16, 1137-1150, 2012. 665
Alfieri, L., Burek, P., Feyen, L., and Forzieri, G.: Global warming increase the frequency of 666
river floods in Europe, Hydrol. Earth Syst. Sc., 12, 1119-1152, 2015. 667
Ali, G., Tetzlaff, D., Soulsby, C., and McDonnell, J.J.: Topographic, pedologic and climatic 668
interactions influencing streamflow generation at multiple catchment scales, Hydrol. 669
Process., 26(25), 3858-3874, 2012. 670 Andrei, S., Georgescu, M., Stefanescu, V., and Valciu, C.: Blocajul atmosferic euro-atlantic si 671
fenomenele meteorologice severe induse de persistenta sa in zona Romaniei in cursul 672
anului 2010, Revista Stiintifica a Administratiei Nationale de Meteorologie, 77-90, 673
2011., (in romanian). 674
Anghel, E., Frimescu, L., Baciu, O., Simota, M., and Gheorghe, C.: Caracterizarea viiturilor 675
exceptionale din 2010, Institutul National de Hidrologie si Gospodarire a Apelor, 676
Conferinaa Stiintifica Jubiliara, 28-30 September 2010, 178-190, 2011., (in romanian). 677
Berg, P., Haerter, J.O., Thejll, P., Piani, C., Hagemann, S., and Christensen, J.H.: Seasonal 678
characteristics of the relationship between daily precipitation intensity and surface 679
temperature, J. Geophys. Res., 114(D18102), 1-9, 2009. doi:10.1029/2009JD012008. 680
Berariu, R., Fikar, C., Gronalt, M., and Hirsch, P.: Understanding the impact of cascade 681
effects of natural disasters on disaster relief operations, Int. J. Disaster Risk Reduct., 682
12, 350-356, 2015. 683
Birsan, M.V.: Trends in monthly natural streamflow in Romania and linkages to atmospheric 684
circulation in the North Atkantic, Water Resour. Manag., 29(9), 3305-3313, 2015. 685
Birsan, M.V., and Dumitrescu, A.: Snow variability in Romania in connection to large-scale 686
atmospheric circulation, Int. J. Climatol., 34, 134–144, 2014. 687
Birsan, M.V., Zaharia, L., Chendes, V., and Branescu, E.: Recent trends in streamflow in 688
Romania (1976–2005), Rom. Rep. Phys., 64(1), 275–280, 2012. 689
Bissolli, P., Friedrich, K., Rapp, J., and Ziese, M.: Flooding in eastern central Europe in May 690
2010 – reasons, evolution and climatological assessment, Weather, 66(6), 147-153, 691
2011. 692
Blöschl, G., Nester, T., Komma, J., Parajka, J., and Perdigão, R.A.P.: The June 2013 flood in 693
the Upper Danube Basin, and comparisons with the 2002, 1954 and 1899 floods, 694
Hydrol. Earth Syst. Sc., 17, 5197-5212, 2013. 695
Bostan, D., Mihaila, D., and Tanasa, I.: The abundant precipitations in the period 22nd – 27th 696
of July, 2008, from Suceava county and the surrounding areas. Causes and 697
consequences, Riscuri si catastrofe, 8(6), 61-70, 2009. 698
Brilly, M., and Polic, M.: Public perception of flood risks, flood forecasting and mitigation, 699
Nat. Hazards Earth Syst. Sci., 5(3), 345-355, 2005. 700
29
Cammerer, H., Thieken, A.H., and Verburg, P.H.: Spatio-temporal dynamics in the flood 701
exposure due to land use changes in the Alpine Lech Valley in Tyrol (Austria), Nat. 702
Hazards, 68(3), 1243-1270, 2012. 703
Chendes, V., Corbus, C., and Petras, N.: Characterisyics of April 2005 flood event and 704
affected areas in the Timis-Bega Plain (Romania) analysed by hydrologic, hydraulic 705
and GIS methods, 15th International Multidisciplinary Scientific GeoConference, 706
SGEM2015, 1, 121-128, 2015. 707
Corduneanu, F., Bucur, D., Cimpeanu, S.M., Apostol, I.C., and Strugariu, Al.: Hazards 708
Resulting from Hydrological Extremes in the Upstream Catchment of the Prut River, 709
Water Resour., 43(1), 42-47, 2016. 710
Delli-Priscoli, J., and Stakhiv, E.: Water-Related Disaster Risk Reduction (DRR) 711
Management in the United States: Floods and Storm Surges, Water Policy, 712
17(suppl.1), 58–88, 2015. 713
Demeritt, D., Nobert, S., Clake, H.L., and Pappenberger, F.: The European Flood Alert 714
System and the communication, perception, and use of ensemble predictions for 715
operational flood risk management, Hydrol. Process., 27(1), 147-157, 2013. 716
Detrembleurs, S., Stilmant, F., Dewals, B., Erpicum, S., Archambeau, P., and Pirotton, M.: 717
Impacts of climate changes on future flood damage on the river Meuse, with a 718 distributed uncertainty analysis, Nat. Hazards, 2015. Doi:10.1007/s11069-015-1661-6. 719
Diakakis, M.: Rainfall thresholds for flood triggering. The case of Marathonas in Greece, Nat. 720
Hazards, 60(3), 789-800, 2011. 721
European Commission: A new EU Floods Directive 2007/60/EC, available at: 722
http://ec.europa.eu/environment/water/flood risk/index.htm(last access: March 2010), 723
2007. 724
Feldman, D., Contreras, S., Karlin, B., Basolo, V., Matthew, R., Sanders, B., Houston, D., 725
Cheung, W., Goodrich, K., Reyes, A., Serrano, K., Schubert, J., and Luke, A.: 726
Communicating flood risk: Looking back and forward at traditional and social media 727
outlets, Int. J. Disaster Risk Reduct., 15, 43-51, 2016. 728
Fu, X., Li, A.Q., and Wang, H.: Allocation of Flood Control Capacity for a Multireservoir 729
System Located at the Yangtze River Basin, Water Resour. Manag., 28(13), 4823-730
4834, 2014. 731
Global Land Cover Facility: http://glcfapp.glcf.umd.edu:8080/esdi/, last access: 11 January 732
2016 733
Grobicki, A., MacLeod, F., and Pischke, F.: Integrated policies and practices for flood and 734
drought risk management, Water Policy, 17, 180-194, 2015. 735
Hall, J., Rubio, E., and Anderson, M.: Random sets of probability measures in slope 736
hydrology and stability analysis, J. Appl. Math. Mech.- USS., 84(10-11), 710-720, 737
2004. 738
Hall, J. Arheimer, B., Borga, M., Brázdil, R., Claps, P., Kiss, A., Kjeldsen, T.R., 739
Kriaučiūnienė, J., Kundzewicz, Z.W., Lang, M., Llasat, M.C., Macdonald, N., 740
McIntyre, N., Mediero, L., Merz, B., Merz, R., Molnar, P., Montanari, A., Neuhold, 741
C., Parajka, J., Perdigão, R.A.P., Plavcová, L., Rogger, M., Salinas, J.L., Sauquet, E., 742
Schär, C., Szolgay, J., Viglione, A., and Blöschl, G.: Understanding flood regime 743
changes in Europe: a state-of-the-art assessment, Hydrol. Earth Syst. Sc., 18, 2735-744
2772, 2014. 745
Hapuarachchi, H.A.P., Wang, Q.J., and Pagano, T.C.: A review of advances in flash flood 746
forecasting, Hydrol. Process., 25(18), 2271-2784, 2011. 747
Hufschmidt, G., Crozier, M., and Glade, T.: Evolution of natural risk: research framework and 748
perspectives, Nat. Hazards Earth Syst. Sci., 5(3), 375-387, 2005. 749
30
Hustiu, M.C.: Structuri mezoscalare ce produc inundatii de tip ”flash flood” in Podisul 750
Moldovei, Revista Stiintifica a Administratiei Nationale de Meteorologie, 1-16, 2011. 751
ICPDR: Floods in the Danube River Basin. Brief overview of key events and lessons learned, 752
International Commission for the Protection of the Danube River, 753
icpdr_flood_report_2010.pdf, 2010., (in romanian). 754
Iosub, M., Enea, A., Hapciuc, O.E., Romanescu, R., and Minea, I.: Flood risk assessment for 755
the Ozana river sector corresponding to Leghin village (Romania), 14th SGEM 756
GeoConference on Water Resources. Forest, Marine And Ocean Ecosystems, 757
www.sgem.org, SGEM2014 Conference Proceedings, June 19-25, 2014, 1, 315-328, 758
2014. DOI: 10.5593/SGEM2014/B31/S12.041. 759
Jones, J.A.: Hydrologic responses to climate change: considering geographic context and 760
alternative hypotheses, Hydrol. Process., 25(12), 1996-2000, 2011. 761
Jora, I., and Romanescu, G.: Hydrograph of the flows of the most important high floods in 762
Vaslui river basin, Air and water components of the environment, 91-102, 2010. 763
Kappes, M.S., Keiler, M., Elverfeldt, K., and Glade, T.: Challenges of analyzing multi-hazard 764
risk: a review, Nat. Hazards, 64(2), 1925-1958, 2012. 765
Kourgialas, N.N., Karatzas, G.P., and Nikolaidis, N.P.: Development of a thresholds approach 766
for real-time flash flood prediction in complex geomorphological river basins, Hydrol. 767 Process., 26(10), 1478-1494, 2012. 768
Lichter, M., and Klein, M.: The effect of river floods on the morphology of small river 769
mouths in the southeastern Mediterranean, Z. Geomorphol. N.F., 55(3), 317-340, 770
2011. 771
Lóczy, D., and Gyenizse, P.: Fluvial micromorphology influenced by tillage on a Danubian 772
floodplain in Hungary, Z. Geomorphol. N.F., 55(Suppl 1), 67-76, 2011. 773
Lóczy, D., Kis, E., and Schweitzer, F.: Local flood hazards assessed from channel 774
morphometry along the Tisza River in Hungary, Geomorphology, 113(3-4), 200-209, 775
2009. 776
Lóczy, D., Mátrai, I., Fehér, G., and Váradi, Z.: Ecological Evaluation of the Baja-Bezdan 777
Canal (Hungary-Serbia) for Reconstruction Planning, Water Resour. Manag., 28(3), 778
815-831, 2014. 779
Merz, B., Hall, J., Disse, M., and Schumann, A.: Fluvial flood risk management in a changing 780
world, Nat. Hazards Earth Syst. Sci., 10, 509–527, 2010. 781
Mierla, M., and Romanescu, G.: Method to Assess the Extreme Hydrological Events in 782
Danube Fluvial Delta, Air and Water Components of the Environment, 149-157, 2012. 783
Mierla, M., Romanescu, G., Nichersu, I., and Grigoras, I.: Hydrological risk map for the 784
Danube Delta – a case study of floods within the fluvial delta, IEEE J. Sel. Top. Appl., 785
8(1), 98-104, 2015. 786
Mihu-Pintilie, A., and Romanescu, G.: Determining the potential hydrological risk associated 787
to maximum flow in small hydrological sub-basins with torrential character of the 788
river Bahlui, Present Environment and Sustainable Development, 5(2), 255-266, 2011. 789
Moel de, H., Alphen van, J., and Aerts, J.C.J.H.: Flood maps in Europe - methods, availability 790
and use, Nat. Hazards Earth Syst. Sci., 9, 289-301, 2009. 791
Nguimalet, C.R., and Ndjendole, S.: Les extrêmes hydrologiques: des indicateurs 792
d'hydrodynamisme ou d'hydraulicité du plateau gréseux de Mouka-Ouadda sur la 793
rivière Pipi a Ouadda (République Centrafricaine), Z. Geomorphol. N.F., 52(1), 125-794
141, 2008. 795
Parker, D., and Fordham, M.: An evaluation of flood forecasting, warning and response 796
systems in the European Union, Water Resour. Manag., 10(4), 279-302, 1996. 797
31
Podani, M., and Zavoianu, I.: Cauzele si efectele inundatiilor produse in luna iulie 1991 in 798
Moldova, Studii si cercetari de geografie, 39, 71-78, 1992., (in romanian). 799
Prudhomme, C., and Genevier, M.: Can atmospheric circulation be linked to flooding in 800
Europe? Hydrol. Process., 25(7), 1180-1190, 2011. 801
Reti, K.O., Malos, C.V., and Manciula, I.D.: Hydrological risk study in the Damuc village, 802
the Neamt county, J. Environ. Prot. Ecol., 15(1), 142-148, 2014. 803
Retsö, D.: Documentary evidence of historical floods and extreme rainfall events in Sweden 804
1400-1800, Hydrol. Earth Syst. Sc., 19, 1307-1323, 2015. 805
Revuelto, J., López-Moreno, J.I., Azorín-Molina, C., Arguedas, G., Vicente-Serrano, S.M., 806
and Serreta, A.: Utilización de técnicas de láser escáner terrestre en la monitorización 807
de procesos geomorfológicos dinámicos: el manto de nieve y heleros en áreas de 808
montaña, Cuadernos de Investigación Geográfica, 39(2), 335-357, 2013. 809
Reza Ghanbarpour, M., Saravi, M.M., and Salimi, S.: Floodplain Inundation Analysis 810
Combined with Contingent Valuation: Implications for Sustainable Flood Risk 811
Management, Water Resour. Manag., 28(9), 2491-2505, 2014. 812
Riegger, T., Bieberstein, A., Hörtkorn, H., and Kempfert, H.G.: Stabilisation of river dykes 813
with drainage elements, Nat. Hazards Earth Syst. Sci., 9, 2039–2047, 2009. 814
Rufat, S., Tate, E., Burton, C., and Maroof, A.S.: Social vulnerability to floods: Review of 815 case studies and implications for management, Int. J. Disaster Risk Reduct., 14(4), 816
470-486, 2015. 817
Romanescu, G., Jora, I., and Stoleriu, C.: The most important high floods in Vaslui river basin 818
– causes and consequences, Carpath. J. Earth Env., 6(1), 119-132, 2011a. 819
Romanescu, G., Stoleriu, C., and Romanescu, A.M.: Water reservoirs and the risk of 820
accidental flood occurrence. Case study: Stanca–Costesti reservoir and the historical 821
floods of the Prut river in the period July–August 2008, Romania, Hydrol. Process., 822
25(13), 2056-2070, 2011b. 823
Romanescu, G., Zaharia, C., and Stoleriu, C.: Long-term changes in average annual liquid 824
flow river Miletin (Moldavian Plain), Carpath. J. Earth Env., 7(1), 161-170, 2012. 825
Romanescu, G., Cretu, M.A., Sandu, I.G., Paun, E., and Sandu, I.: Chemism of Streams 826
Within the Siret and Prut Drainage Basins: Water Resources and Management, Rev. 827
Chim. (Bucharest), 64(12), 1416-1421, 2013. 828
Romanescu, G., and Stoleriu, C.: Causes and Effects of the Catastrophic Flooding on the Siret 829
River (Romania) in July-August 2008, Nat. Hazards, 69, 1351-1367, 2013a. 830
Romanescu, G., and Stoleriu, C.: An inter-basin backwater overflow (the Buhai Brook and the 831
Ezer reservoir on the Jijia River, Romania), Hydrol. Process., 28(7), 3118-3131, 832
2013b. 833
Romanescu, G., and Nicu, C.: Risk maps for gully erosion processes affecting archaeological 834
sites in Moldavia, Romania, Z. Geomorphol. N.F., 58(4), 509-523, 2014. 835
Romanescu, G., Sandu, I., Stoleriu, C., and Sandu, I.G.: Water Resources in Romania and 836
Their Quality in the Main Lacustrine Basins, Rev. Chim. (Bucharest), 63(3), 344-349, 837
2014a. 838
Romanescu, G., Tarnovan, A., Sandu, I.G., Cojoc, G.M., Dascalita, D., and Sandu, I.: The 839
Quality of Surface Waters in the Suha Hydrographic Basin (Oriental Carpathian 840
Mountains), Rev. Chim. (Bucharest), 65(10), 1168-1171, 2014b. 841
Romanescu, G., Zaharia, C., Paun, E., Machidon, O., and Paraschiv, V.: Depletion of 842
watercourses in north-eastern Romania. Case study: the Miletin river, Carpath. J. Earth 843
Env., 9(1), 209-220, 2014c. 844
Rusnák, M., and Lehotsky, M.: Time-focused investigation of river channel morphological 845
changes due to extreme floods, Z. Geomorphol. N.F., 58(2), 251-266, 2014. 846
32
Schneider, C., Laize, C.L.R., Acreman, M.C., and Flörke, M.: How will climate change 847
modify river flow regimes in Europe? Hydrol. Earth Syst. Sc., 17, 325-339, 2013. 848
Seidu, O., Ramsay, A., and Nistor, I.: Climate change impacts on extreme floods I: combining 849
imperfect deterministic simulations and non-stationary frequency analysis, Nat. 850
Hazards, 61(2), 647-659, 2012a. 851
Seidu, O., Ramsay, A., and Nistor, I.: Climate change impacts on extreme floods II: 852
Improving dlood future peaks simulation using non-stationary frequency analysis, Nat. 853
Hazards, 60(2), 715-726, 2012b. 854
Serban, G., Sorocovschi, V., and Fodorean, I.: Riscuri induse de amenajarea hidrotehnica a 855
iazurilor de pe Valea Sesului (Campia Transilvaniei), Riscuri si catastrofe, 1, 159-172, 856
2004., (in romanian). 857
Sorocovschi, V.: The classification of hydrological hazards. A point of view, Riscuri si 858
catastrofe, 9(2), 33-44, 2011. 859
Strupczewski, W.G., Kochanek, K., and Bogdanowicz, E.: Flood frequency analysis 860
supported by the largest historical flood, Nat. Hazards Earth Syst. Sci., 14, 1543-1551, 861
2014. 862
Szalinska, W., Otop, I., and Tokarczyk, T.: Precipitation extremes during flooding in the Odra 863
River Basin in May-June 2010, Meteorology, Hydrology and Water Management, 864 2(1), 13-20, 2014. 865
Thieken, A.H., Bessel, T., Kienzler, S., Kreibich, H., Müller, M., Pisi, S., and Schröter, K.: 866
The flood of June 2013 in Germany: how much do we know about its impacts? Nat. 867
Hazards Earth Syst. Sci., 16, 1519–1540, 2016. 868
Timu, M.D.: Vara anului 2010 - intre normal si atipic, Revista Stiintifica a Administratiei 869
Nationale de Meteorologie, 91-98, 2011., (in romanian). 870
Tirnovan, A., Romanescu, G., and Cojoc, M.G.: Floods and drought - hydroclimatic risk in 871
Suha river basin, Air and Water. Components of the Environment, 188-195, 2014a. 872
Tirnovan, A., Romanescu, G., Cojoc, G.M., and Stoleriu, C.: Flash floods on a forested and 873
heavily populated catchment. Case study for Suha basin (Romania), 14th SGEM 874
GeoConference on Water Resources. Forest, Marine and Ocean Ecosystems, Section 875
Hydrology and Water Resources. Forest, Marine And Ocean Ecosystems, 876
www.sgem.org, SGEM2014 Conference Proceedings, June 19-25, 2014, 1, 303-314, 877
2014b. 878
Touchart, L., Azaroua, A., Millot, C., Bartout, P., and Turczi, V.: Les risques d'érosion sur les 879
rives des étangs. Le cas du démaigrissement des plages, Riscuri si catastrofe, 11(2), 880
21-36, 2012. 881
Vasileski, D., and Radevski, I.: Analysis of high waters on the Kriva Reka River, Macodonia, 882
Acta Geogr. Slov., 54(2), 363-377, 2014. 883
Verdu, J.M., Batalla, R.J., and Martinez-Casasnovas, J.A.: Assessing river dynamics from 2D 884
hydraulic modelling and high resolution grain-size distribution, Z. Geomorphol. N.F., 885
58(1), 95-115, 2014. 886
Waylen, P., and Laporte, M.S.: Flooding and the El Nino-Southern Oscillation phenomenon 887
along the Pacific coast of Costa Rica, Hydrol. Process., 13(16), 2623-2638, 1999. 888
Whitfield, P.H.: Floods in future climates: a review, Journal of Flood Risk Management, 5(4), 889
336-365, 2012. 890
Wijkman, A., and Timberlake, L.: Natural Disasters: Acts of God or Acts of Man? London, 891
Earthscan, 2010. 892
Wu, S.J., Yang, J.C., and Tung, Y.K.: Risk analysis for flood-control structure under 893
consideration of uncertainties in design flood, Nat. Hazards, 58(1), 117-140, 2011. 894
895

33
896
Related Documents