© VCAA 2016 – Version 4 – September 2016 VCE Further Mathematics 2016–2018 Written examinations 1 and 2 – End of year Examination specifications Overall conditions There will be two end-of-year examinations for VCE Further Mathematics – examination 1 and examination 2. The examinations will be sat at a time and date to be set annually by the Victorian Curriculum and Assessment Authority (VCAA). VCAA examination rules will apply. Details of these rules are published annually in the VCE and VCAL Administrative Handbook. Both examinations will have 15 minutes reading time and 1 hour and 30 minutes writing time. For both examinations, students are permitted to bring into the examination room an approved technology with numerical, graphical, symbolic, financial and statistical functionality, as specified in the VCAA Bulletin and the VCE Exams Navigator. One bound reference may be brought into the examination room. This may be a textbook (which may be annotated), a securely bound lecture pad, a permanently bound student-constructed set of notes without fold-outs or an exercise book. Specifications for the bound reference are published annually in the VCE Exams Navigator. A formula sheet will be provided with both examinations. The examinations will be marked by a panel appointed by the VCAA. The examinations will each contribute 33 per cent to the study score. Content The VCE Mathematics Study Design 2016–2018 (‘Further Mathematics Units 3 and 4’) is the document for the development of the examination. All outcomes in ‘Further Mathematics Units 3 and 4’ will be examined. All content from the areas of study, and the key knowledge and skills that underpin the outcomes in Units 3 and 4, are examinable. Examination 1 will cover both Areas of study 1 and 2. The examination is designed to assess students’ knowledge of mathematical concepts, models and techniques, and their ability to reason, interpret and apply this knowledge in a range of contexts. Examination 2 will cover both Areas of study 1 and 2. The examination is designed to assess students’ ability to select and apply mathematical facts, concepts, models and techniques to solve extended application problems in a range of contexts.

Welcome message from author
This document is posted to help you gain knowledge. Please leave a comment to let me know what you think about it! Share it to your friends and learn new things together.
Transcript
© VCAA 2016 – Version 4 – September 2016
VCE Further Mathematics 2016–2018
Written examinations 1 and 2 – End of year
Examination specifications
Overall conditions There will be two end-of-year examinations for VCE Further Mathematics – examination 1 and examination 2.
The examinations will be sat at a time and date to be set annually by the Victorian Curriculum and Assessment Authority (VCAA). VCAA examination rules will apply. Details of these rules are published annually in the VCE and VCAL Administrative Handbook.
Both examinations will have 15 minutes reading time and 1 hour and 30 minutes writing time.
For both examinations, students are permitted to bring into the examination room an approved technology with numerical, graphical, symbolic, financial and statistical functionality, as specified in the VCAA Bulletin and the VCE Exams Navigator. One bound reference may be brought into the examination room. This may be a textbook (which may be annotated), a securely bound lecture pad, a permanently bound student-constructed set of notes without fold-outs or an exercise book. Specifications for the bound reference are published annually in the VCE Exams Navigator.
A formula sheet will be provided with both examinations.
The examinations will be marked by a panel appointed by the VCAA.
The examinations will each contribute 33 per cent to the study score.
Content The VCE Mathematics Study Design 2016–2018 (‘Further Mathematics Units 3 and 4’) is the document for the development of the examination. All outcomes in ‘Further Mathematics Units 3 and 4’ will be examined.
All content from the areas of study, and the key knowledge and skills that underpin the outcomes in Units 3 and 4, are examinable.
Examination 1 will cover both Areas of study 1 and 2. The examination is designed to assess students’ knowledge of mathematical concepts, models and techniques, and their ability to reason, interpret and apply this knowledge in a range of contexts.
Examination 2 will cover both Areas of study 1 and 2. The examination is designed to assess students’ ability to select and apply mathematical facts, concepts, models and techniques to solve extended application problems in a range of contexts.

FURMATH (SPECIFICATIONS)
© VCAA 2016 – Version 4 – September 2016 Page 2
Format
Examination 1
The examination will be in the form of a multiple-choice question book.
The examination will consist of two sections.
Section A will consist of 24 multiple-choice questions derived from the core component of the course. Of these 24 questions,16 will be on data analysis and 8 will be on recursion and financial modelling. All questions will be compulsory. Section A will be worth a total of 24 marks.
Section B will consist of eight multiple-choice questions on each of the four modules in Unit 4. Students must answer questions on two modules. Section B will be worth a total of 16 marks.
The total marks for the examination will be 40.
A formula sheet will be provided with the examination. The formula sheet will be the same for examinations 1 and 2.
All answers are to be recorded on the answer sheet provided for multiple-choice questions.
Examination 2
The examination will be in the form of a question and answer book.
The examination will consist of two sections.
Section A will consist of short-answer and extended-answer questions, including multi-stage questions of increasing complexity. Questions will be derived from the core component of the course. Of these, 24 marks will be allocated to data analysis and 12 marks will be allocated to recursion and financial modelling. All questions will be compulsory. Section A will be worth a total of 36 marks.
Section B will consist of short-answer and extended-answer questions, including multi-stage questions of increasing complexity. Questions will be derived from each of the four modules in Unit 4. Each module will contain questions that total 12 marks. Students must answer questions on two modules. Section B will be worth a total of 24 marks.
The total marks for the examination will be 60.
A formula sheet will be provided with the examination. The formula sheet will be the same for examinations 1 and 2.
Answers are to be recorded in the spaces provided in the question and answer book.
Approved materials and equipment The list below applies to both examinations 1 and 2:
• normal stationery requirements (pens, pencils, highlighters, erasers, sharpeners and rulers) • an approved technology with numerical, graphical, symbolic, financial and statistical
functionality • one scientific calculator • one bound reference

FURMATH (SPECIFICATIONS)
© VCAA 2016 – Version 4 – September 2016 Page 3
Relevant references The following publications should be referred to in relation to the VCE Further Mathematics examinations:
• VCE Mathematics Study Design 2016–2018 (‘Further Mathematics Units 3 and 4’) • VCE Further Mathematics – Advice for teachers 2016–2018 (includes assessment advice) • VCE Exams Navigator • VCAA Bulletin
Advice During the 2016–2018 accreditation period for VCE Further Mathematics, examinations will be prepared according to the examination specifications above. Each examination will conform to these specifications and will test a representative sample of the key knowledge and skills from all outcomes in Units 3 and 4.
The following sample examinations provide an indication of the types of questions teachers and students can expect until the current accreditation period is over.
Answers to multiple-choice questions are provided at the end of examination 1.
Answers to other questions are not provided.


S A M P L E
FURTHER MATHEMATICSWritten examination 1
Day Date Reading time: *.** to *.** (15 minutes) Writing time: *.** to *.** (1 hour 30 minutes)
MULTIPLE-CHOICE QUESTION BOOK
Structure of bookSection Number of
questionsNumber of questions
to be answeredNumber of modules
Number of modulesto be answered
Number of marks
A – Core 24 24 24B – Modules 32 16 4 2 16
Total 40
• Studentsarepermittedtobringintotheexaminationroom:pens,pencils,highlighters,erasers,sharpeners,rulers,oneboundreference,oneapprovedtechnology(calculatororsoftware)and,ifdesired,onescientificcalculator.CalculatormemoryDOESNOTneedtobecleared.Forapprovedcomputer-basedCAS,fullfunctionalitymaybeused.
• StudentsareNOTpermittedtobringintotheexaminationroom:blanksheetsofpaperand/orcorrectionfluid/tape.
Materials supplied• Questionbookof32pages.• Formulasheet.• Answersheetformultiple-choicequestions.• Workingspaceisprovidedthroughoutthebook.
Instructions• Checkthatyourname and student numberasprintedonyouranswersheetformultiple-choice
questionsarecorrect,andsignyournameinthespaceprovidedtoverifythis.• Unlessotherwiseindicated,thediagramsinthisbookarenotdrawntoscale.
At the end of the examination• Youmaykeepthisquestionbook.
Students are NOT permitted to bring mobile phones and/or any other unauthorised electronic devices into the examination room.
©VICTORIANCURRICULUMANDASSESSMENTAUTHORITY2016
Version4–September2016
Victorian Certificate of Education Year

FURMATHEXAM1(SAMPLE) 2 Version4–September2016
THIS PAGE IS BLANK

Version4–September2016 3 FURMATHEXAM1(SAMPLE)
SECTION A – continuedTURN OVER
SECTION A – Core
Instructions for Section AAnswerallquestionsinpencilontheanswersheetprovidedformultiple-choicequestions.Choosetheresponsethatiscorrectforthequestion.Acorrectanswerscores1;anincorrectanswerscores0.Markswillnotbedeductedforincorrectanswers.Nomarkswillbegivenifmorethanoneansweriscompletedforanyquestion.Unlessotherwiseindicated,thediagramsinthisbookarenotdrawntoscale.
Data analysis
Question 1Thefollowingstemplotshowstheareas,insquarekilometres,of27suburbsofalargecity.
key:1|6=1.6km2
1 5 6 7 82 1 2 4 5 6 8 9 93 0 1 1 2 2 8 94 0 4 75 0 16 1 978 4
Themedianareaofthesesuburbs,insquarekilometres,isA. 3.0B. 3.1C. 3.5D. 30.1E. 30.5
Question 2ThetimespentbyshoppersatahardwarestoreonaSaturdayisapproximatelynormallydistributedwithameanof31minutesandastandarddeviationof6minutes.If2850shoppersareexpectedtovisitthestoreonaSaturday,thenumberofshopperswhoareexpectedtospendbetween25and37minutesinthestoreisclosesttoA. 16B. 68C. 460D. 1900E. 2400

FURMATHEXAM1(SAMPLE) 4 Version4–September2016
SECTION A – continued
Use the following information to answer Questions 3–6.Thefollowingtableshowsthedatacollectedfromarandomsampleofsevendriversdrawnfromthepopulationofalldriverswhousedasupermarketcarparkononeday.Thevariablesinthetableare:• distance–thedistancethateachdrivertravelledtothesupermarketfromtheirhome• sex–thesexofthedriver(female,male)• number of children–thenumberofchildreninthecar• type of car–thetypeofcar(sedan,wagon,other)• postcode–thepostcodeofthedriver’shome.
Distance (km) Sex (F = female, M = male)
Number of children
Type of car (1 = sedan, 2 = wagon,
3 = other)
Postcode
4.2 F 2 1 8148
0.8 M 3 2 8147
3.9 F 3 2 8146
5.6 F 1 3 8245
0.9 M 1 3 8148
1.7 F 2 2 8147
2.5 M 2 2 8145
Question 3Themean, x ,andthestandarddeviation,sx,ofthevariable,distance,forthesedriversareclosesttoA. x =2.5 sx=3.3B. x =2.8 sx=1.7C. x =2.8 sx=1.8D. x =2.9 sx=1.7E. x =3.3 sx=2.5
Question 4ThenumberofdiscretenumericalvariablesinthisdatasetisA. 0B. 1C. 2D. 3E. 4

Version4–September2016 5 FURMATHEXAM1(SAMPLE)
SECTION A – continuedTURN OVER
Question 5ThenumberofordinalvariablesinthisdatasetisA. 0B. 1C. 2D. 3E. 4
Question 6ThenumberoffemaledriverswiththreechildreninthecarisA. 0B. 1C. 2D. 3E. 4
Question 7
25
20
15
10
5
0
frequency
–1.5 –1.0 –0.5 0.0 0.5 1.0 1.5log10 (oil consumption)
Thehistogramabovedisplaysthedistributionoftheannualpercapitaoil consumption(tonnes)for58countriesplottedonalog scale.Thepercentageofcountrieswithanannualpercapitaoil consumptionofmorethan10tonnesisclosesttoA. 1%B. 2%C. 27%D. 57%E. 98%

FURMATHEXAM1(SAMPLE) 6 Version4–September2016
SECTION A – continued
Question 8Thedotplotbelowshowsthedistributionofthetime,inminutes,that50peoplespentwaitingtogethelpfromacallcentre.
10 20 30 40 50 60time
70 80 90 100 110
n = 50
Whichoneofthefollowingboxplotsbestrepresentsthedata?
A.
time10 20 30 40 50 60 70 80 90 100 110
B.
time10 20 30 40 50 60 70 80 90 100 110
C.
time10 20 30 40 50 60 70 80 90 100 110
D.
10 20 30 40 50 60
time70 80 90 100 110
E.
10 20 30 40 50 60
time70 80 90 100 110

Version4–September2016 7 FURMATHEXAM1(SAMPLE)
SECTION A – continuedTURN OVER
Question 9Theparallelboxplotsbelowsummarisethedistributionofpopulationdensity,inpeoplepersquarekilometre,fortheinnersuburbsandtheoutersuburbsofalargecity.
population density (people per square kilometre)0 1000 2000 3000 4000 5000 6000 7000 8000 9000 10000
inner suburbs
outer suburbs
Whichoneofthefollowingstatementsisnot true?A. Morethan50%oftheoutersuburbshavepopulationdensitiesbelow2000peoplepersquarekilometre.B. Morethan75%oftheinnersuburbshavepopulationdensitiesbelow6000peoplepersquarekilometre.C. Populationdensitiesaremorevariableintheoutersuburbsthanintheinnersuburbs.D. Themedianpopulationdensityoftheinnersuburbsisapproximately4400peoplepersquarekilometre.E. Populationdensitiesare,onaverage,higherintheinnersuburbsthanintheoutersuburbs.
Question 10Asingleback-to-backstemplotwouldbeanappropriategraphicaltooltoinvestigatetheassociationbetweenacar’sspeed,inkilometresperhour,andtheA. driver’sage,inyears.B. car’scolour(white,red,grey,other).C. car’sfuelconsumption,inkilometresperlitre.D. averagedistancetravelled,inkilometres.E. driver’ssex(female,male).

FURMATHEXAM1(SAMPLE) 8 Version4–September2016
SECTION A – continued
Question 11Theequationofaleastsquaresregressionlineisusedtopredictthefuelconsumption,inkilometresperlitreoffuel,fromacar’sweight,inkilograms.Thisequationpredictsthatacarweighing900kgwilltravel10.7kmperlitreoffuel,whileacarweighing1700kgwilltravel6.7kmperlitreoffuel.TheslopeofthisleastsquaresregressionlineisclosesttoA. –200.0B. –0.005C. –0.004D. 0.005E. 200.0
Question 12Alargestudyofsecondary-schoolmalestudentsshowsthatthereisanegativeassociationbetweenthetimespentplayingsporteachweekandthetimespentplayingcomputergames.Fromthisinformation,itcanbeconcludedthatA. malestudentswhospendalotoftimeplayingcomputergamesdonotplaysport.B. encouragingmalestudentstospendlesstimeplayingsportwillincreasethetimetheyspendplaying
computergames.C. encouragingmalestudentstospendmoretimeplayingsportwillreducethetimetheyspendplaying
computergames.D. malestudentswhotendtospendmoretimeplayingsporttendtospendlesstimeplayingcomputer
games.E. malestudentswhotendtospendmoretimeplayingsporttendtospendmoretimeplayingcomputer
games.
Question 13Theseasonalindexforheatersinwinteris1.25Tocorrectforseasonality,theactualheatersalesinwintershouldbeA. reducedby20%B. increasedby20%C. reducedby25%D. increasedby25%E. reducedby75%

Version4–September2016 9 FURMATHEXAM1(SAMPLE)
SECTION A – continuedTURN OVER
Use the following information to answer Questions 14 and 15.Theseasonalindicesforthefirst11monthsoftheyearforsalesinasportingequipmentstoreareshowninthetablebelow.
Month Jan. Feb. Mar. Apr. May June July Aug. Sep. Oct. Nov. Dec.
Seasonal index 1.23 0.96 1.12 1.08 0.89 0.98 0.86 0.76 0.76 0.95 1.12
Question 14TheseasonalindexforDecemberisA. 0.89B. 0.97C. 1.02D. 1.23E. 1.29
Question 15InMay,thestoresold$213956worthofsportingequipment.ThedeseasonalisedvalueofthesesaleswasclosesttoA. $165857B. $190420C. $209677D. $218322E. $240400

FURMATHEXAM1(SAMPLE) 10 Version4–September2016
SECTION A – continued
Question 16Thetimeseriesplotbelowshowsthenumberofdaysthatitrainedinatowneachmonthduring2011.
Jan. Feb. Mar. Apr. May June July Aug. Sept. Oct. Nov. Dec.
numberof days
1214
1086420
Usingfive-mediansmoothing,thesmoothedtimeseriesplotwilllookmostlikeA.
Jan. Feb. Mar. Apr. May June July Aug. Sept. Oct. Nov. Dec.
numberof days
1214
1086420
B.
Jan. Feb. Mar. Apr. May June July Aug. Sept. Oct. Nov. Dec.
numberof days
1214
1086420
C.
Jan. Feb. Mar. Apr. May June July Aug. Sept. Oct. Nov. Dec.
numberof days
1214
1086420
D.
Jan. Feb. Mar. Apr. May June July Aug. Sept. Oct. Nov. Dec.
numberof days
1214
1086420
E.
Jan. Feb. Mar. Apr. May June July Aug. Sept. Oct. Nov. Dec.
numberof days
1214
1086420

Version4–September2016 11 FURMATHEXAM1(SAMPLE)
SECTION A – continuedTURN OVER
Recursion and financial modelling
Question 17
P0=2000, Pn + 1=1.5Pn – 500
ThefirstthreetermsofasequencegeneratedbytherecurrencerelationaboveareA. 500,2500,2000…B. 2000,1500,1000…C. 2000,2500,3000…D. 2000,2500,3250…E. 2000,3000,4500…
Question 18Whichofthefollowingrecurrencerelationswillgenerateasequencewhosevaluesdecaygeometrically?A. L0=2000, Ln + 1=Ln – 100
B. L0=2000, Ln + 1=Ln + 100
C. L0=2000, Ln + 1=0.65Ln
D. L0=2000, Ln + 1=6.5Ln
E. L0=2000, Ln + 1=0.85Ln – 100
Question 19Evahas$1200thatsheplanstoinvestforoneyear.Onecompanyofferstopayherinterestattherateof6.75%perannumcompoundingdaily.TheeffectiveannualinterestrateforthisinvestmentwouldbeclosesttoA. 6.75%B. 6.92%C. 6.96%D. 6.98%E. 6.99%
Question 20Rohaninvests$15000atanannualinterestrateof9.6%compoundingmonthly.LetVnbethevalueoftheinvestmentafternmonths.ArecurrencerelationthatcanbeusedtomodelthisinvestmentisA. V0=15000,Vn + 1=0.96Vn
B. V0=15000,Vn + 1=1.008Vn
C. V0=15000,Vn + 1=1.08Vn
D. V0=15000,Vn + 1=1.0096Vn
E. V0=15000,Vn + 1=1.096Vn

FURMATHEXAM1(SAMPLE) 12 Version4–September2016
SECTION A – continued
Use the following information to answer Questions 21–23.Kiminvests$400000inanannuitypaying3.2%interestperannum.Theannuityisdesignedtogiveheranannualpaymentof$47372for10years.Theamortisationtableforthisannuityisshownbelow.Someoftheinformationismissing.
Payment number (n)
Payment made
Interest earned
Reduction in principal
Balance of annuity
0 0 0.00 0.00 400000.00
1 47372.00 12800.00 34572.00
2 47372.00 11693.70 35678.30 329749.70
3 47372.00 10551.99 36820.01 292929.69
4 47372.00 9373.75 37998.25 254931.44
5 47372.00 8157.81 215717.24
6 47372.00 6902.95 40469.05 175248.19
7 47372.00 5607.94 41764.06 133484.14
8 47372.00 90383.63
9 47372.00 2892.28 44479.72 45903.90
10 47372.00 1468.92 45903.08 0.83
Question 21ThebalanceoftheannuityafteronepaymenthasbeenmadeisA. $339828.00B. $352628.00C. $365428.00D. $387200.00E. $400000.00
Question 22Thereductionintheprincipaloftheannuityafterpaymentnumber5isA. $36820.01B. $37998.25C. $39214.19D. $40469.05E. $41764.06
Question 23Theamountofpaymentnumber8thatistheinterestearnedisclosesttoA. $3799.82B. $4074.67C. $4271.49D. $4836.57E. $5607.94

Version4–September2016 13 FURMATHEXAM1(SAMPLE)
END OF SECTION ATURN OVER
Question 24Thefollowinggraphshowsthedecreasingvalueofanassetovereightyears.
O 1 2 3 4 5 6 7 8
250 000
200 000
150 000
100 000
50 000
n (years)
P (dollars)
LetPnbethevalueoftheassetafternyears,indollars.AruleforevaluatingPncouldbeA. Pn=250000×(1+0.14)
n B. Pn=250000×1.14×nC. Pn=250000×(1–0.14)×nD. Pn=250000×(0.14)
n
E. Pn=250000×(1–0.14)n

FURMATHEXAM1(SAMPLE) 14 Version4–September2016
SECTION B – continued
SECTION B – Modules
Instructions for Section BSelecttwomodulesandanswerallquestionswithintheselectedmodulesinpencilontheanswersheetprovidedformultiple-choicequestions.Showthemodulesyouareansweringbyshadingthematchingboxesonyourmultiple-choiceanswersheetandwritingthenameofthemoduleintheboxprovided.Choosetheresponsethatiscorrectforthequestion.Acorrectanswerscores1;anincorrectanswerscores0.Markswillnotbedeductedforincorrectanswers.Nomarkswillbegivenifmorethanoneansweriscompletedforanyquestion.Unlessotherwiseindicated,thediagramsinthisbookarenotdrawntoscale.
Contents Page
Module1–Matrices...................................................................................................................................... 15
Module2–Networksanddecisionmathematics.......................................................................................... 19
Module3–Geometryandmeasurement....................................................................................................... 24
Module4–Graphsandrelations................................................................................................................... 28

Version4–September2016 15 FURMATHEXAM1(SAMPLE)
SECTION B – Module 1–continuedTURN OVER
Question 1MatrixB,below,showsthenumberofphotography(P),art(A)andcooking(C)booksownedbySteven(S),Trevor(T),Ursula(U),Veronica(V)andWilliam(W).
P A C
B
STUVW
=
8 5 41 4 53 3 44 2 21 4 1
TheelementinrowiandcolumnjofmatrixBisbi j .Theelementb32isthenumberofA. artbooksownedbyTrevor.B. artbooksownedbyUrsula.C. artbooksownedbyVeronica.D. cookingbooksownedbyUrsula.E. cookingbooksownedbyTrevor.
Question 2Thetotalcostofoneice-creamandthreesoftdrinksatCatherine’sshopis$9.Thetotalcostoftwoice-creamsandfivesoftdrinksis$16.Letxbethecostofanice-creamandybethecostofasoftdrink.
Thematrixxy
isequalto
A. 1 32 5
xy
B. 1 32 5
916
C. 1 23 5
916
D. −−
5 23 1
916
E. −−
5 32 1
916
Module 1 – Matrices
Beforeansweringthesequestions,youmustshadethe‘Matrices’boxontheanswersheetfor multiple-choicequestionsandwritethenameofthemoduleintheboxprovided.

FURMATHEXAM1(SAMPLE) 16 Version4–September2016
SECTION B – Module 1–continued
Question 3 Considerthefollowingfourstatements.Apermutationmatrixisalways: I asquarematrix II abinarymatrixIII adiagonalmatrixIV equaltothetransposeofitself.
Howmanyofthestatementsabovearetrue?A. 0B. 1C. 2D. 3E. 4
Question 4Fourpeople,Ash(A),Binh(B),Con(C)andDan(D),competedinatabletennistournament.Inthistournament,eachcompetitorplayedeachoftheothercompetitorsonce.Theresultsofthetournamentaresummarisedinthematrixbelow.A1inthematrixshowsthattheplayernamedinthatrowdefeatedtheplayernamedinthatcolumn.Forexample,the1inrow3showsthatCondefeatedAsh.
loserA B C D
ABCD
winner
0 1 0 10 0 1 01 0 0 00 1 1 0
Inthetournament,eachcompetitorwasgivenarankingthatwasdeterminedbycalculatingthesumoftheirone-stepandtwo-stepdominances.Thecompetitorwiththehighestsumisrankednumberone(1).Thecompetitorwiththesecond-highestsumwasrankednumbertwo(2),andsoon.Usingthismethod,therankingsofthecompetitorsinthistournamentwereA. Dan(1),Ash(2),Con(3),Binh(4).B. Dan(1),Ash(2),Binh(3),Con(4).C. Con(1),Dan(2),Ash(3),Binh(4).D. Ash(1),Dan(2),Binh(3),Con(4).E. Ash(1),Dan(2),Con(3),Binh(4).

Version4–September2016 17 FURMATHEXAM1(SAMPLE)
SECTION B – Module 1–continuedTURN OVER
Question 5ThematrixSn + 1isdeterminedfromthematrixSnusingtheruleSn + 1=T Sn – C,whereT,S0andCaredefinedasfollows.
T S C=
=
=
0 5 0 60 5 0 4
100250
20200
. .
. ., and
Giventhisinformation,thematrixS2equals
A. 100250
B. 148122
C. 170140
D. 180130
E. 190160
Question 6AandBaresquarematricessuchthatAB=BA=I,whereIisanidentitymatrix.Whichoneofthefollowingstatementsisnottrue?A. ABA=AB. AB2A=IC. BmustequalAD. BistheinverseofAE. bothAandBhaveinverses

FURMATHEXAM1(SAMPLE) 18 Version4–September2016
End of Module 1 – SECTION B–continued
Question 7TheorderofmatrixXis3×2.TheelementinrowiandcolumnjofmatrixXisxi janditisdeterminedbytherule
xi j=i + j
ThematrixXisA. 1 2
3 45 6
B. 2 34 56 7
C. 2 3 43 4 5
D. 1 23 34 4
E. 2 33 44 5
Question 8Atransitionmatrix,T,andastatematrix,S2,aredefinedasfollows.
T =
0 5 0 0 50 5 0 5 00 0 5 0 5
. .
. .. .
S2
300200100
=
IfS2=TS1,thestatematrixS1is
A. 200250150
B. 300200100
C. 3000300
D. 4000200
E. undefined

Version4–September2016 19 FURMATHEXAM1(SAMPLE)
SECTION B – Module 2–continuedTURN OVER
Question 1Thegraphbelowshowstheroadsconnectingfourtowns:Kelly,Lindon,MiltonandNate.
Kelly Lindon
Nate
Milton
AbusstartsatKelly,travelsthroughNateandLindon,thenstopswhenitreachesMilton.ThemathematicaltermforthisrouteisA. aloop.B. anEuleriantrail.C. anEuleriancircuit.D. aHamiltonianpath.E. aHamiltoniancycle.
Question 2
YA
B
C
E
D
Inthedirectedgraphabove,theonlyvertexwithalabelthatcanbereachedfromvertexYisA. vertexA.B. vertexB.C. vertexC.D. vertexD.E. vertexE.
Module 2 – Networks and decision mathematics
Beforeansweringthesequestions,youmustshadethe‘Networksanddecisionmathematics’boxontheanswersheetformultiple-choicequestionsandwritethenameofthemoduleintheboxprovided.

FURMATHEXAM1(SAMPLE) 20 Version4–September2016
SECTION B – Module 2–continued
Question 3Thefollowingnetworkshowsthedistances,inkilometres,alongaseriesofroadsthatconnectTownA to TownB.
1
3
5
43 6
1
4
24
6
1
3
4 4
2
2
6
5
Town A Town B
UsingDijkstra’salgorithm,orotherwise,theshortestdistance,inkilometres,fromTownAtoTownBisA. 9B. 10C. 11D. 12E. 13

Version4–September2016 21 FURMATHEXAM1(SAMPLE)
SECTION B – Module 2–continuedTURN OVER
Question 4
C
D EA B
FG
H
IJ
8 109 11
14
1312
16
13
17
12 8
1510
6 7
9
Whichoneofthefollowingistheminimalspanningtreefortheweightedgraphshownabove?
A.
A B
C
D E
FG
H
IJ
B.
A B
C
D E
FG
H
IJ
C.
A B
C
D E
FG
H
IJ
D.
A B
C
D E
FG
H
IJ
E.
A B
C
D E
FG
H
IJ

FURMATHEXAM1(SAMPLE) 22 Version4–September2016
SECTION B – Module 2–continued
Use the following information to answer Questions 5 and 6.Considerthefollowingfourgraphs.
Question 5HowmanyofthefourgraphsabovehaveanEuleriancircuit?A. 0B. 1C. 2D. 3E. 4
Question 6Howmanyofthefourgraphsaboveareplanar?A. 0B. 1C. 2D. 3E. 4
Question 7Whichoneofthefollowingstatementsaboutcriticalpathsistrue?A. Therecanbeonlyonecriticalpathinaproject.B. Acriticalpathalwaysincludesatleasttwoactivities.C. Acriticalpathwillalwaysincludetheactivitythattakesthelongesttimetocomplete.D. Reducingthetimeofanyactivityonacriticalpathforaprojectwillalwaysreducetheminimum
completiontimefortheproject.E. Iftherearenootherchanges,increasingthetimeofanyactivityonacriticalpathwillalwaysincrease
thecompletiontimeofaproject.
Version4–September2016 23 FURMATHEXAM1(SAMPLE)
End of Module 2 – SECTION B–continuedTURN OVER
Question 8Anetworkoftracksconnectstwocarparksinafestivalvenuetotheexit,asshowninthedirectedgraphbelow.
75 5
10
735
11
5412
4 6 6
2
8
4
9
4
5
5
5
22exit
car park
car park
Cut A Cut B Cut C Cut D Cut E
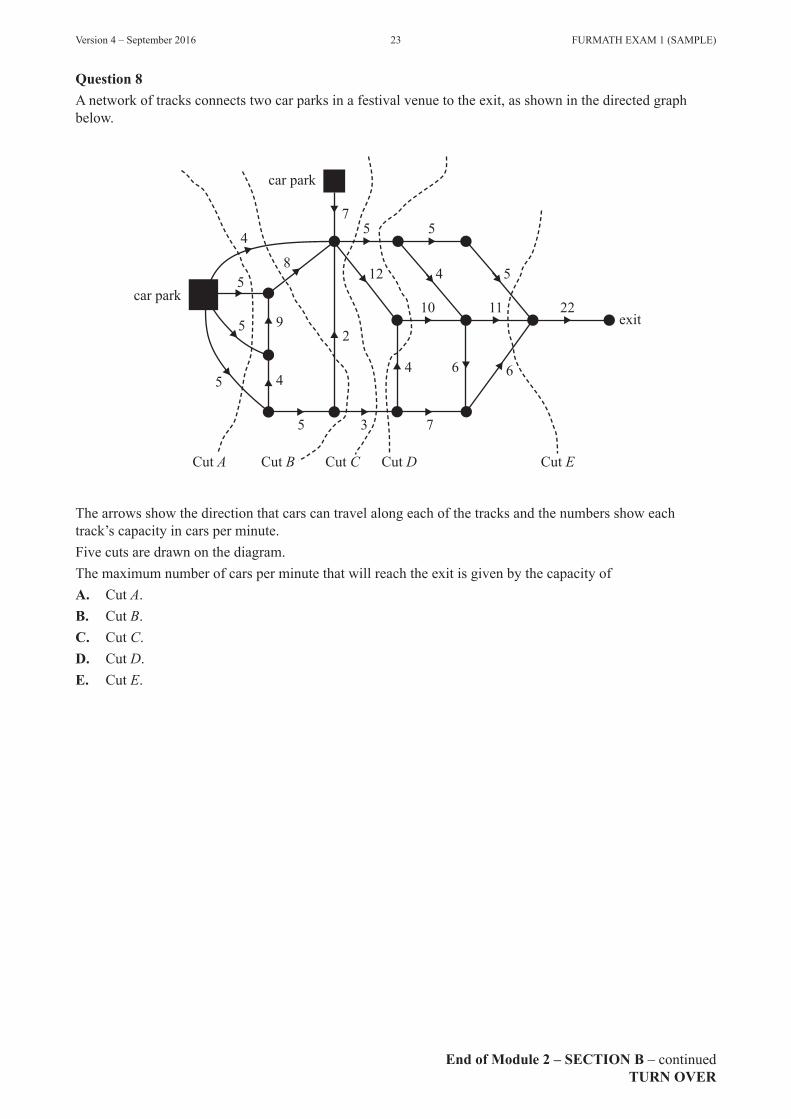
Thearrowsshowthedirectionthatcarscantravelalongeachofthetracksandthenumbersshoweachtrack’scapacityincarsperminute.Fivecutsaredrawnonthediagram.ThemaximumnumberofcarsperminutethatwillreachtheexitisgivenbythecapacityofA. Cut A.B. Cut B.C. Cut C.D. Cut D.E. Cut E.

FURMATHEXAM1(SAMPLE) 24 Version4–September2016
SECTION B – Module 3–continued
Question 1
2.5 cm
64°
Asectorofacircleofradius2.5cmsubtendsanangleof64°atthecentreofthecircle.Theareaofthesector,insquarecentimetres,isclosesttoA. 2.8B. 3.5C. 7.0D. 88.4E. 110.5
Question 2ThecitythatisclosesttotheequatorisA. Athens,latitude38.0°NB. Belgrade,latitude44.8°NC. Kingston,latitude45.3°SD. Pretoria,latitude25.7°SE. Brisbane,latitude27.5°S
Module 3 – Geometry and measurement
Beforeansweringthesequestions,youmustshadethe‘Geometryandmeasurement’boxontheanswersheetformultiple-choicequestionsandwritethenameofthemoduleintheboxprovided.

Version4–September2016 25 FURMATHEXAM1(SAMPLE)
SECTION B – Module 3–continuedTURN OVER
Question 3Acafesellstwosizesofcupcakeswithasimilarshape.Thelargecupcakeis6cmwideatthebaseandthesmallcupcakeis4cmwideatthebase.
4 cm6 cm
Thepriceofacupcakeisproportionaltoitsvolume.Ifthelargecupcakecosts$5.40,thenthesmallcupcakewillcostA. $1.60B. $2.32C. $2.40D. $3.40E. $3.60
Question 4
10 m
4 m
5 m
12 m
Agreenhouseisbuiltintheshapeofatrapezoidalprism,asshowninthediagramabove.Thecross-sectionofthegreenhouse(shaded)isanisoscelestrapezium.Theparallelsidesofthistrapeziumare4mand10mrespectively.Thetwoequalsidesareeach5m.Thelengthofthegreenhouseis12m.Thefiveexteriorsurfacesofthegreenhouse,notincludingthebase,aremadeofglass.Thetotalareaoftheglasssurfacesofthegreenhouse,insquaremetres,isA. 196B. 212C. 224D. 344E. 672
FURMATHEXAM1(SAMPLE) 26 Version4–September2016
SECTION B – Module 3–continued
Use the following information to answer Questions 5 and 6.
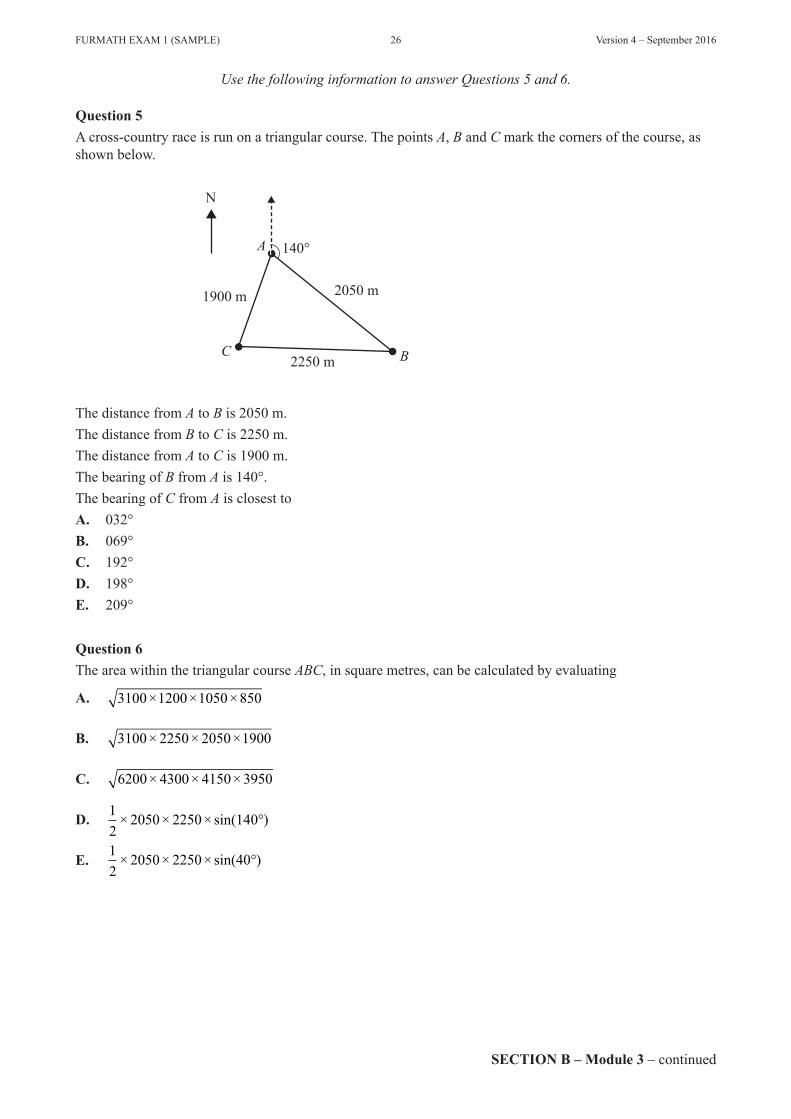
Question 5Across-countryraceisrunonatriangularcourse.ThepointsA,BandCmarkthecornersofthecourse,asshownbelow.
N
A
BC
140°
2050 m1900 m
2250 m
ThedistancefromA to Bis2050m.ThedistancefromB to Cis2250m.ThedistancefromA to Cis1900m.ThebearingofBfromAis140°.ThebearingofCfromAisclosesttoA. 032°B. 069°C. 192°D. 198°E. 209°
Question 6TheareawithinthetriangularcourseABC,insquaremetres,canbecalculatedbyevaluating
A. 3100×1200×1050×850
B. 3100× 2250× 2050×1900
C. 6200× 4300× 4150×3950
D. 12× 2050× 2250× sin(140°)
E. 12× 2050× 2250× sin(40°)

Version4–September2016 27 FURMATHEXAM1(SAMPLE)
End of Module 3 – SECTION B–continuedTURN OVER
Question 7
A
C
B, latitude 40° N
6400 km equator
AssumethattheradiusofEarthis6400km.ThediagramaboveshowsasmallcircleofEarth,withcentreatA,whoselatitudeis40°N.Theradiusofthissmallcircle,inkilometres,isclosesttoA. 4114B. 4903C. 5543D. 6400E. 7390
Question 8
E H
F G
CD
A B
Arightrectangularprismwithasquarebase,ABCD,isshownabove.Thediagonaloftheprism,AH,is8cm.Theheightoftheprism,HC,is4cm.Thevolumeofthisrectangularprism,incubiccentimetres,isA. 64 B. 96 C. 128 D. 192 E. 256

FURMATHEXAM1(SAMPLE) 28 Version4–September2016
SECTION B – Module 4–continued
Question 1Thegraphbelowshowsthealtitude,inmetres,ofaballoonoverasix-hourflight.
3500
3000
2500
2000
1500
1000
500
O
altitude(metres)
1 2 3time (hours)
4 5 6
Overthesix-hourperiod,thelengthoftime,inhours,wherethealtitudeoftheballoonwasatleast1500misA. 3B. 4C. 5D. 6E. 7
Question 2Theverticallinethatpassesthroughthepoint(3,2)hastheequationA. x + y=5B. xy=6C. 3y=2xD. y=2E. x=3
Module 4 – Graphs and relations
Beforeansweringthesequestions,youmustshadethe‘Graphsandrelations’boxontheanswersheetformultiple-choicequestionsandwritethenameofthemoduleintheboxprovided.

Version4–September2016 29 FURMATHEXAM1(SAMPLE)
SECTION B – Module 4–continuedTURN OVER
Question 3
Thepoint(2,20)liesonthegraphof y kx
= , asshownbelow.
100
80
60
40
20
2O 4 6 8 10
y
x
(2, 20)
ThevalueofkisA. 5B. 10C. 20D. 40E. 80

FURMATHEXAM1(SAMPLE) 30 Version4–September2016
SECTION B – Module 4–continued
Question 4Thedistance–timegraphbelowshowsatrain’sjourneybetweentwotowns.Duringthejourney,thetrainstoppedfor30minutes.
100
80
60
40
20
09.00 am 9.30 am 10.00 am 10.30 am 11.00 am
distance (kilometres)
time
Theaveragespeedofthetrain,inkilometresperhour,forthejourneyisclosesttoA. 45B. 50C. 60D. 65E. 80
Question 5TheDomesticsCleaningCompanyprovideshouseholdcleaningservices.Fortwohoursofcleaning,thecostis$55.Forfourhoursofcleaning,thecostis$94.Theruleforthecostofcleaningservicesis
cost = a + b×hours
whereaisafixedcharge,indollars,andbisthechargeperhourofcleaning,indollarsperhour.Usingthisrule,thecostforfivehoursofcleaningisA. $19.50B. $97.50C. $99.50D. $113.50E. $121.50
Version4–September2016 31 FURMATHEXAM1(SAMPLE)
SECTION B – Module 4–continuedTURN OVER
Question 6Whichoneofthefollowingstatementsrelatingtothesolutionoflinearprogrammingproblemsistrue?A. Onlyonepointcanbeasolution.B. Nopointoutsidethefeasibleregioncanbeasolution.C. Tohaveasolution,thefeasibleregionmustbebounded.D. Onlythecornerpointsofafeasibleregioncanbeasolution.E. Onlythecornerpointswithintegercoordinatescanbeasolution.
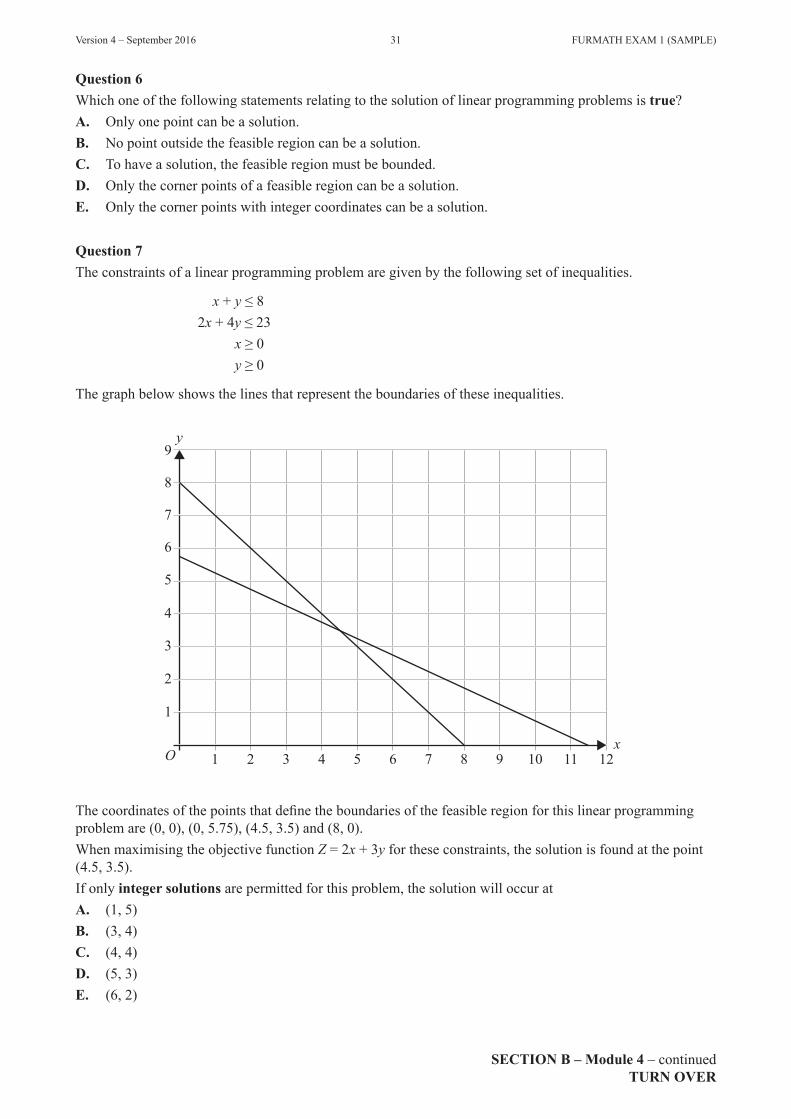
Question 7Theconstraintsofalinearprogrammingproblemaregivenbythefollowingsetofinequalities.
x + y≤8 2x + 4y≤23 x≥0 y≥0
Thegraphbelowshowsthelinesthatrepresenttheboundariesoftheseinequalities.
9
8
7
6
5
4
3
2
1
O 1 2 3 4 5 6 7 8 9 10 11 12x
y
Thecoordinatesofthepointsthatdefinetheboundariesofthefeasibleregionforthislinearprogrammingproblemare(0,0),(0,5.75),(4.5,3.5)and(8,0).WhenmaximisingtheobjectivefunctionZ=2x + 3yfortheseconstraints,thesolutionisfoundatthepoint(4.5,3.5).Ifonlyinteger solutionsarepermittedforthisproblem,thesolutionwilloccuratA. (1,5)B. (3,4)C. (4,4)D. (5,3)E. (6,2)

FURMATHEXAM1(SAMPLE) 32 Version4–September2016
END OF MULTIPLE-CHOICE QUESTION BOOK
Question 8XavierandYvetteshareajob.YvettemustworkatleasttwiceasmanyhoursasXavier.Theymustworkatleast40hourseachweek,intotal.Xaviermustworkatleast10hourseachweek.Yvettecanonlyworkforamaximumof30hourseachweek.LetxrepresentthenumberofhoursthatXavierworkseachweek.LetyrepresentthenumberofhoursthatYvetteworkseachweek.Inwhichoneofthefollowinggraphsdoestheshadedareashowthefeasibleregiondefinedbytheseconditions?
y
x
605040302010
O 10 20 30 40 50 60
y
x
605040302010
O 10 20 30 40 50 60
y
x
605040302010
O 10 20 30 40 50 60
y
x
605040302010
O 10 20 30 40 50 60
y
x
605040302010
O 10 20 30 40 50 60
A. B.
C. D.
E.
FURMATH EXAM 1 (SAMPLE – ANSWERS)
© VCAA 2016 – Version 4 – September 2016
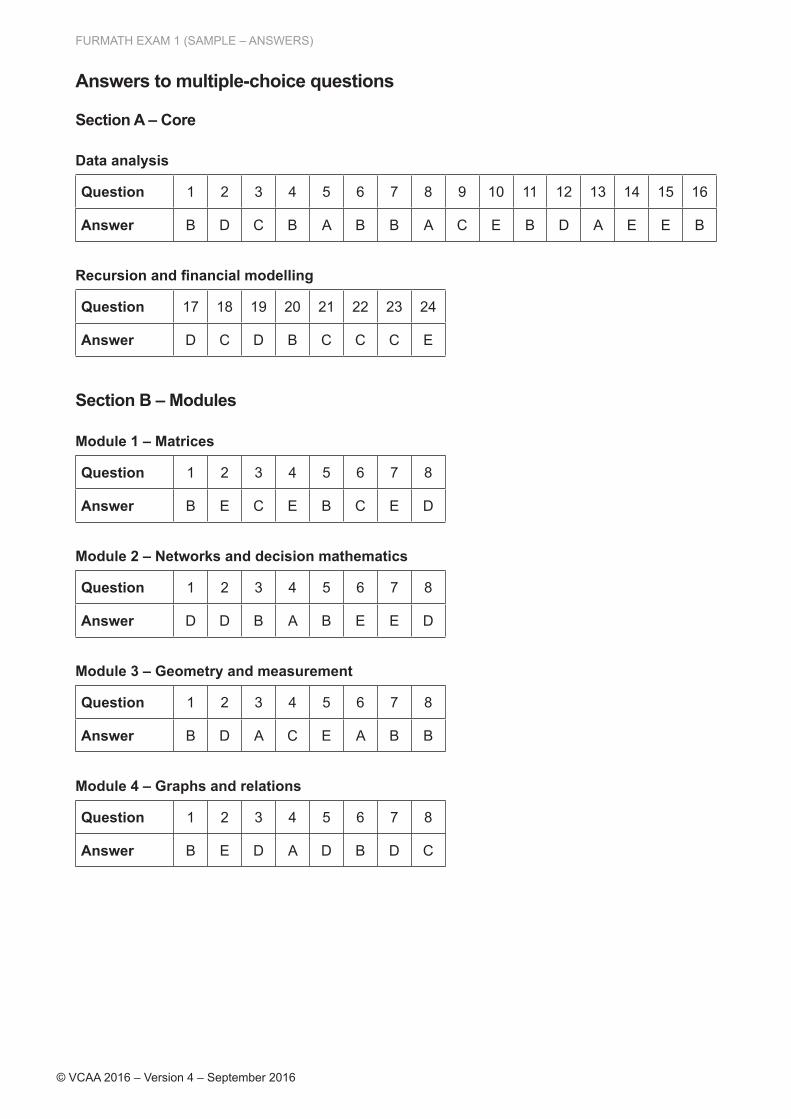
Answers to multiple-choice questions
Section A – Core
Data analysis
Question 1 2 3 4 5 6 7 8 9 10 11 12 13 14 15 16
Answer B D C B A B B A C E B D A E E B
Recursion and financial modelling
Question 17 18 19 20 21 22 23 24
Answer D C D B C C C E
Section B – Modules
Module 1 – Matrices
Question 1 2 3 4 5 6 7 8
Answer B E C E B C E D
Module 2 – Networks and decision mathematics
Question 1 2 3 4 5 6 7 8
Answer D D B A B E E D
Module 3 – Geometry and measurement
Question 1 2 3 4 5 6 7 8
Answer B D A C E A B B
Module 4 – Graphs and relations
Question 1 2 3 4 5 6 7 8
Answer B E D A D B D C


S A M P L E
FURTHER MATHEMATICSWritten examination 2
Day Date Reading time: *.** to *.** (15 minutes) Writing time: *.** to *.** (1 hour 30 minutes)
QUESTION AND ANSWER BOOK
Structure of bookSection A – Core Number of
questionsNumber of questions
to be answeredNumber of
marks
9 9 36Section B – Modules Number of
modulesNumber of modules
to be answeredNumber of
marks
4 2 24 Total 60
• Studentsaretowriteinblueorblackpen.• Studentsarepermittedtobringintotheexaminationroom:pens,pencils,highlighters,erasers,
sharpeners,rulers,oneboundreference,oneapprovedtechnology(calculatororsoftware)and,ifdesired,onescientificcalculator.CalculatormemoryDOESNOTneedtobecleared.Forapprovedcomputer-basedCAS,fullfunctionalitymaybeused.
• StudentsareNOTpermittedtobringintotheexaminationroom:blanksheetsofpaperand/orcorrectionfluid/tape.
Materials supplied• Questionandanswerbookof30pages.• Formulasheet.• Workingspaceisprovidedthroughoutthebook.
Instructions• Writeyourstudent numberinthespaceprovidedaboveonthispage.• Unlessotherwiseindicated,thediagramsinthisbookarenotdrawntoscale.• AllwrittenresponsesmustbeinEnglish.
Students are NOT permitted to bring mobile phones and/or any other unauthorised electronic devices into the examination room.
©VICTORIANCURRICULUMANDASSESSMENTAUTHORITY2016
Version4–September2016
SUPERVISOR TO ATTACH PROCESSING LABEL HEREVictorian Certificate of Education Year
STUDENT NUMBER
Letter

FURMATHEXAM2(SAMPLE) 2 Version4–September2016
do
no
t w
rit
e i
n t
his
ar
ea
do
no
t w
rit
e i
n t
his
ar
ea
SECTION A – Question 1 – continued
Data analysis
Question 1 (3marks)Thesegmentedbarchartbelowshowstheagedistributionofpeopleinthreecountries,Australia,IndiaandJapan,fortheyear2010.
65 years and over
15–64 years
0–14 years
100
90
80
70
60
50
40
30
20
10
0
percentage
Australia Indiacountry
Japan
Source:AustralianBureauofStatistics,3201.0–Population by Age and Sex, Australian States and Territories,June2010
SECTION A – Core
Instructions for Section AAnswerallquestionsinthespacesprovided.Writeusingblueorblackpen.Youneednotgivenumericalanswersasdecimalsunlessinstructedtodoso.Alternativeformsmayinclude, forexample,π,surdsorfractions.In‘Recursionandfinancialmodelling’,allanswersshouldberoundedtothenearestcentunlessotherwiseinstructed.Unlessotherwiseindicated,thediagramsinthisbookarenotdrawntoscale.

Version4–September2016 3 FURMATHEXAM2(SAMPLE)
SECTION A – continuedTURN OVER
do
no
t w
rit
e i
n t
his
ar
ea
do
no
t w
rit
e i
n t
his
ar
ea
a. WritedownthepercentageofpeopleinAustraliawhowereaged0–14yearsin2010. 1mark
b. In2010,thepopulationofJapanwas128000000.
HowmanypeopleinJapanwereaged65yearsandoverin2010? 1mark
c. Fromthegraphonpage2,itappearsthatthereisnoassociationbetweenthepercentageofpeopleinthe15–64agegroupandthecountryinwhichtheylive.
Explainwhy,quotingappropriatepercentagestosupportyourexplanation. 1mark

FURMATHEXAM2(SAMPLE) 4 Version4–September2016
SECTION A – continued
do
no
t w
rit
e i
n t
his
ar
ea
do
no
t w
rit
e i
n t
his
ar
ea
Question 2 (3marks)Thedevelopmentindexforacountryisawholenumberbetween0and100.Thedotplotbelowdisplaysthevaluesofthedevelopmentindicesfor28countries.
n = 28
70 71 72 73 74 75development index
76 77 78 79
a. Usingtheinformationinthedotplot,determineeachofthefollowing. 1mark
Themode Therange
b. Writedownanappropriatecalculationanduseittoexplainwhythecountrywithadevelopmentindexof70isanoutlierforthisgroupofcountries. 2marks

Version4–September2016 5 FURMATHEXAM2(SAMPLE)
do
no
t w
rit
e i
n t
his
ar
ea
do
no
t w
rit
e i
n t
his
ar
ea
SECTION A – Question 3 – continuedTURN OVER
Question 3 (6marks)Thescatterplotbelowshowsthepopulation and area(insquarekilometres)ofasampleofinnersuburbsofalargecity.
30000
25000
20000
15000population
10000
5000
00 1 2 3 4
area (km2)5 6 7 8 9
Theequationoftheleastsquaresregressionlineforthedatainthescatterplotis
population=5330+2680×area
a. Writedowntheresponsevariable. 1mark
b. Drawtheleastsquaresregressionlineonthescatterplot above. 1mark
(Answer on the scatterplot above.)
c. Interprettheslopeofthisleastsquaresregressionlineintermsofthevariablesarea and population. 2marks
FURMATHEXAM2(SAMPLE) 6 Version4–September2016
SECTION A – continued
do
no
t w
rit
e i
n t
his
ar
ea
do
no
t w
rit
e i
n t
his
ar
ea
d. Wistonisaninnersuburb.Ithasanareaof4km2andapopulationof6690. Thecorrelationcoefficient,r,isequalto0.668
i. CalculatetheresidualwhentheleastsquaresregressionlineisusedtopredictthepopulationofWistonfromitsarea. 1mark
ii. Whatpercentageofthevariationinthepopulationofthesuburbsisexplainedbythevariationinarea?
Roundyouranswertoonedecimalplace. 1mark

Version4–September2016 7 FURMATHEXAM2(SAMPLE)
SECTION A – continuedTURN OVER
do
no
t w
rit
e i
n t
his
ar
ea
do
no
t w
rit
e i
n t
his
ar
ea
Question 4 (3marks)Thescatterplotandtablebelowshowthepopulation,inthousands,andthearea,insquarekilometres,forasampleof21outersuburbsofthesamecity.
35
30
25
20population(thousands)
15
10
5
00 20 40 60 80
area (km2)100 120 140
Area (km2) Population (thousands)
1.6 5.2 4.4 14.3 4.6 7.5 5.6 11.0 6.3 17.1 7.0 19.4 7.3 15.5 8.0 11.3 8.8 17.1 11.1 19.7 13.0 17.9 18.5 18.7 21.3 24.6 24.2 15.2 27.0 13.6 62.1 26.1 66.5 16.4101.4 26.2119.2 16.5130.7 18.9135.4 31.3
Intheoutersuburbs,therelationshipbetweenpopulation and areaisnon-linear.A logtransformationcanbeappliedtothevariableareatolinearisethescatterplot.
a. Applythelogtransformationtothedataanddeterminetheequationoftheleastsquaresregressionlinethatallowsthepopulationofanoutersuburbtobepredictedfromthelogarithmofitsarea.
Writetheslopeandinterceptofthisleastsquaresregressionlineintheboxesprovidedbelow. Roundyouranswerstotwosignificantfigures. 2marks
population = + log(area)
b. Usetheequationoftheleastsquaresregressionlineinpart a.topredictthepopulationofanoutersuburbwithanareaof90km2.
Roundyouranswertothenearestonethousandpeople. 1mark

FURMATHEXAM2(SAMPLE) 8 Version4–September2016
SECTION A – continued
do
no
t w
rit
e i
n t
his
ar
ea
do
no
t w
rit
e i
n t
his
ar
ea
Question 5 (4marks)Thereisanegativeassociationbetweenthevariablespopulation density,inpeoplepersquarekilometre,and area,insquarekilometres,of38innersuburbsofthesamecity.Forthisassociation,r2=0.141
a. Writedownthevalueofthecorrelationcoefficientforthisassociationbetweenthevariablespopulation density and area.
Roundyouranswertothreedecimalplaces. 1mark
b. Themeanandstandarddeviationofthevariablespopulation density and areaforthese 38innersuburbsareshowninthetablebelow.
Population density (people per km2)
Area (km2)
Mean 4370 3.4
Standard deviation 1560 1.6
Oneofthesesuburbshasapopulationdensityof3082peoplepersquarekilometre.
i. Determinethestandardz-scoreofthissuburb’spopulationdensity. Roundyouranswertoonedecimalplace. 1mark
ii. Interpretthez-scoreofthissuburb’spopulationdensitywithreferencetothemeanpopulationdensity. 1mark
iii. Assumetheareasoftheseinnersuburbsareapproximatelynormallydistributed. Howmanyofthese38suburbsareexpectedtohaveanareathatistwostandarddeviationsor
moreabovethemean? Roundyouranswertothenearestwholenumber. 1mark

Version4–September2016 9 FURMATHEXAM2(SAMPLE)
do
no
t w
rit
e i
n t
his
ar
ea
do
no
t w
rit
e i
n t
his
ar
ea
SECTION A – Question 6 – continuedTURN OVER
Question 6 (5marks)Table1showstheAustraliangrossdomesticproduct(GDP)perperson,indollars,atfiveyearlyintervals(year)fortheperiod1980to2005.
Table 1
Year 1980 1985 1990 1995 2000 2005
GDP 20 900 22 300 25000 26 400 30 900 33800
1975 1980 1985 1990 1995 2000 2005 2010year
36 000
34 000
32 000
30 000
28 000
26 000
24 000
22 000
20 000
GDP (dollars)
a. Completethetime series plot abovebyplottingtheGDPfortheyears2000and2005. 1mark
(Answer on the time series plot above.)
b. Brieflydescribethegeneraltrendinthedata. 1mark

FURMATHEXAM2(SAMPLE) 10 Version4–September2016
SECTION A – continued
do
no
t w
rit
e i
n t
his
ar
ea
do
no
t w
rit
e i
n t
his
ar
ea
c. InTable2,thevariableyearhasbeenrescaledusing1980=0,1985=5,andsoon.Thenewvariableis time.
Table 2
Year 1980 1985 1990 1995 2000 2005
Time 0 5 10 15 20 25
GDP 20 900 22 300 25000 26 400 30 900 33800
i. Usethevariablestime and GDPtowritedowntheequationoftheleastsquaresregressionlinethatcanbeusedtopredictGDPfromtime.Taketimeastheexplanatoryvariable. 2marks
ii. Theleastsquaresregressionlineinpart c.i.abovehasbeenusedtopredicttheGDPin2010.
Explainwhythispredictionisunreliable. 1mark
Version4–September2016 11 FURMATHEXAM2(SAMPLE)
SECTION A – continuedTURN OVER
do
no
t w
rit
e i
n t
his
ar
ea
do
no
t w
rit
e i
n t
his
ar
ea
Recursion and financial modelling
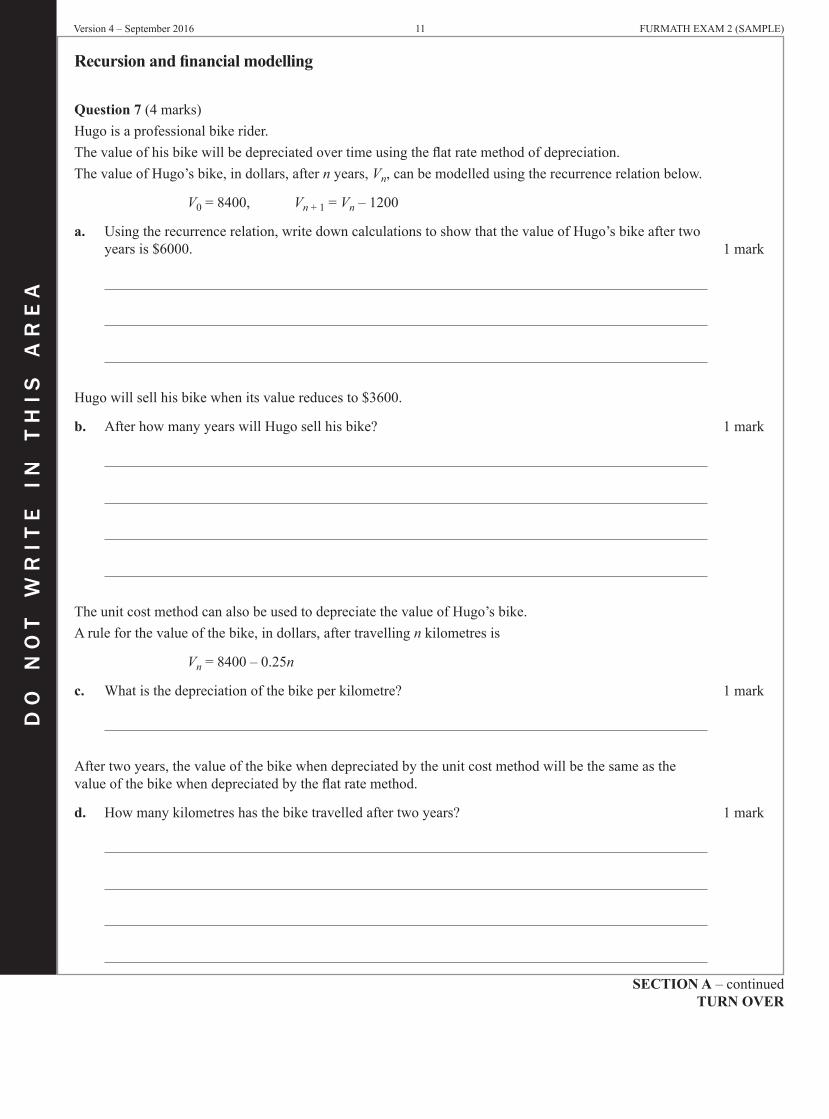
Question 7 (4marks)Hugoisaprofessionalbikerider.Thevalueofhisbikewillbedepreciatedovertimeusingtheflatratemethodofdepreciation.ThevalueofHugo’sbike,indollars,afternyears,Vn,canbemodelledusingtherecurrencerelationbelow.
V0=8400, Vn+1 = Vn–1200
a. Usingtherecurrencerelation,writedowncalculationstoshowthatthevalueofHugo’sbikeaftertwoyearsis$6000. 1mark
Hugowillsellhisbikewhenitsvaluereducesto$3600.
b. AfterhowmanyyearswillHugosellhisbike? 1mark
TheunitcostmethodcanalsobeusedtodepreciatethevalueofHugo’sbike.Aruleforthevalueofthebike,indollars,aftertravellingnkilometresis
Vn=8400–0.25n
c. Whatisthedepreciationofthebikeperkilometre? 1mark
Aftertwoyears,thevalueofthebikewhendepreciatedbytheunitcostmethodwillbethesameasthevalueofthebikewhendepreciatedbytheflatratemethod.
d. Howmanykilometreshasthebiketravelledaftertwoyears? 1mark
FURMATHEXAM2(SAMPLE) 12 Version4–September2016
SECTION A – continued
do
no
t w
rit
e i
n t
his
ar
ea
do
no
t w
rit
e i
n t
his
ar
ea
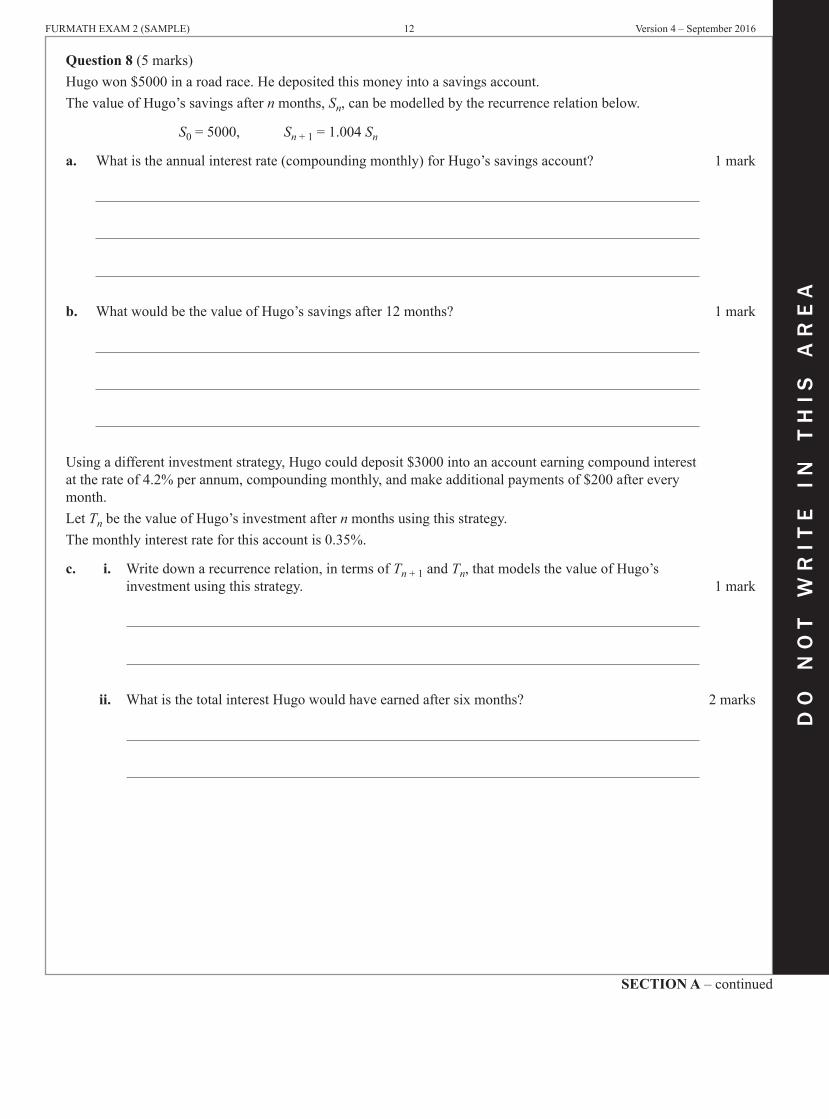
Question 8 (5marks)Hugowon$5000inaroadrace.Hedepositedthismoneyintoasavingsaccount.ThevalueofHugo’ssavingsafternmonths,Sn,canbemodelledbytherecurrencerelationbelow.
S0=5000, Sn+1=1.004Sn
a. Whatistheannualinterestrate(compoundingmonthly)forHugo’ssavingsaccount? 1mark
b. WhatwouldbethevalueofHugo’ssavingsafter12months? 1mark
Usingadifferentinvestmentstrategy,Hugocoulddeposit$3000intoanaccountearningcompoundinterestattherateof4.2%perannum,compoundingmonthly,andmakeadditionalpaymentsof$200aftereverymonth.LetTnbethevalueofHugo’sinvestmentafternmonthsusingthisstrategy.Themonthlyinterestrateforthisaccountis0.35%.
c. i. Writedownarecurrencerelation,intermsofTn+1 and Tn,thatmodelsthevalueofHugo’sinvestmentusingthisstrategy. 1mark
ii. WhatisthetotalinterestHugowouldhaveearnedaftersixmonths? 2marks

Version4–September2016 13 FURMATHEXAM2(SAMPLE)
do
no
t w
rit
e i
n t
his
ar
ea
do
no
t w
rit
e i
n t
his
ar
ea
END OF SECTION ATURN OVER
Question 9 (3marks)Hugoneedstobuyanewbike.Heborrowed$7500topayforthebikeandwillbechargedinterestattherateof5.76%perannum,compoundingmonthly.Hugowillfullyrepaythisloanwithrepaymentsof$430eachmonth.
a. Howmanyrepaymentsarerequiredtofullyrepaythisloan? Roundyouranswertothenearestwholenumber. 1mark
Afterthefifthrepayment,Hugoincreasedhismonthlyrepaymentsothattheloanwasfullyrepaidwithafurthersevenrepayments(thatis,12repaymentsintotal).
b. i. WhatistheminimumvalueofHugo’snewmonthlyrepayment? 1mark
ii. Whatisthevalueofthefinalrepaymentrequiredtoensuretheloanisfullyrepaidafter12repayments? 1mark

FURMATHEXAM2(SAMPLE) 14 Version4–September2016
do
no
t w
rit
e i
n t
his
ar
ea
do
no
t w
rit
e i
n t
his
ar
ea
SECTION B – continued
SECTION B – Modules
Instructions for Section BSelect twomodulesandanswerallquestionswithintheselectedmodules.Writeusingblueorblackpen.Youneednotgivenumericalanswersasdecimalsunlessinstructedtodoso.Alternativeformsmayinclude, forexample,π,surdsorfractions.Unlessotherwiseindicated,thediagramsinthisbookarenotdrawntoscale.
Contents Page
Module1–Matrices................................................................................................................................................... 15
Module2–Networksanddecisionmathematics....................................................................................................... 19
Module3–Geometryandmeasurement.................................................................................................................... 23
Module4–Graphsandrelations................................................................................................................................ 28

Version4–September2016 15 FURMATHEXAM2(SAMPLE)
do
no
t w
rit
e i
n t
his
ar
ea
do
no
t w
rit
e i
n t
his
ar
ea
SECTION B – Module 1 – continuedTURN OVER
Module 1 – Matrices
Question 1 (2marks)Fivetrout-breedingponds,P,Q,R,X and V,areconnectedbypipes,asshowninthediagrambelow.
P Q
V
R X
ThematrixWisusedtorepresenttheinformationinthisdiagram.
P Q R X V
W
PQRXV
=
0 1 1 0 01 0 0 1 11 0 0 1 00 1 1 0 10 1 0 1 0
InmatrixW:• the1inrow2,column1,forexample,indicatesthatpondPisdirectlyconnectedbyapipetopondQ• the0inrow5,column1,forexample,indicatesthatpondPisnotdirectlyconnectedbyapipeto
pondV.
a. Intermsofthebreedingpondsdescribed,whatdoesthesumoftheelementsinrow3ofmatrixW represent? 1mark
ThematrixW 2isshownbelow.
P Q R X V
W
PQRXV
2
2 0 0 2 10 3 2 1 10 2 2 0 12 1 0 3 11 1 1 1 2
=
b. MatrixW 2hasa2inrow2(Q),column3(R).
ExplainwhatthisnumbertellsusaboutthepipeconnectionsbetweenQ and R. 1mark
FURMATHEXAM2(SAMPLE) 16 Version4–September2016
do
no
t w
rit
e i
n t
his
ar
ea
do
no
t w
rit
e i
n t
his
ar
ea
SECTION B – Module 1 – Question 2 – continued
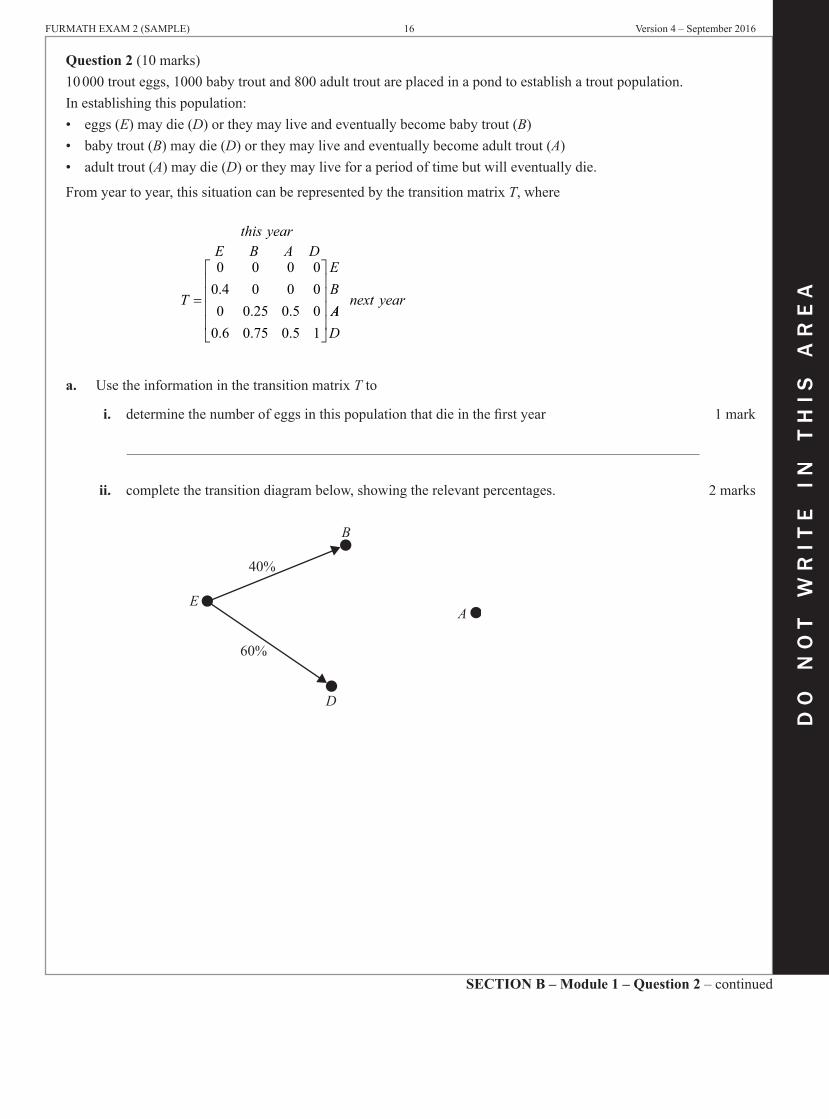
Question 2 (10marks)10000trouteggs,1000babytroutand800adulttroutareplacedinapondtoestablishatroutpopulation.Inestablishingthispopulation:• eggs(E)maydie(D)ortheymayliveandeventuallybecomebabytrout(B)• babytrout(B)maydie(D)ortheymayliveandeventuallybecomeadulttrout(A)• adulttrout(A)maydie(D)ortheymayliveforaperiodoftimebutwilleventuallydie.
Fromyeartoyear,thissituationcanberepresentedbythetransitionmatrixT,where
this yearE B A D
T
EB
=
0 0 0 00 4 0 0 00 0 25 0 5 00 6 0 75 0 5 1
.. .
. . .AAD
next year
a. UsetheinformationinthetransitionmatrixT to
i. determinethenumberofeggsinthispopulationthatdieinthefirstyear 1mark
ii. completethetransitiondiagrambelow,showingtherelevantpercentages. 2marks
40%
60%
B
EA
D

Version4–September2016 17 FURMATHEXAM2(SAMPLE)
do
no
t w
rit
e i
n t
his
ar
ea
do
no
t w
rit
e i
n t
his
ar
ea
SECTION B – Module 1 – Question 2 – continuedTURN OVER
Theinitialstatematrixforthistroutpopulation,S0,canbewrittenas
S
EBAD
0
1000010008000
=
LetSnrepresentthestatematrixdescribingthetroutpopulationafternyears.
b. UsingtheruleSn+1 = T Sn,determine
i. S1 1mark
ii. thenumberofadulttroutpredictedtobeinthepopulationafterfouryears. Roundyouranswertothenearestwholenumberoftrout. 1mark
c. ThetransitionmatrixTpredictsthat,inthelongterm,alloftheeggs,babytroutandadulttroutwilldie.
i. Howmanyyearswillittakeforalloftheadulttrouttodie(thatis,whenthenumberofadulttroutinthepopulationisfirstpredictedtobelessthanone)? 1mark
ii. Whatisthelargestnumberofadulttroutthatispredictedtobeinthepondinanyoneyear? 1mark
d. Determinethenumberofeggs,babytroutandadulttroutthat,ifaddedtoorremovedfromthepondattheendofeachyear,willensurethatthenumberofeggs,babytroutandadulttroutinthepopulationremainsconstantfromyeartoyear. 2marks

FURMATHEXAM2(SAMPLE) 18 Version4–September2016
do
no
t w
rit
e i
n t
his
ar
ea
do
no
t w
rit
e i
n t
his
ar
ea
End of Module 1 – SECTION B – continued
TheruleSn+1 = T Snthatwasusedtodescribethedevelopmentofthetroutinthisponddoesnottakeintoaccountneweggsaddedtothepopulationwhentheadulttroutbegintobreed.Totakebreedingintoaccount,assumethateveryyear50%oftheadulttrouteachlay500eggs.Thematrixdescribingthepopulationafternyears,Sn,isnowgivenbythenewrule
Sn+1 = T Sn+500M Sn
where
T M=
=
0 0 0 00 40 0 0 00 0 25 0 50 00 60 0 75 0 50 1 0
0 0 0 5.
. .. . . .
,
. 00 00 0 0 00 0 0 00 0 0 0
1000010008000
0
=
and S
e. UsethisnewruletodetermineS2. 1mark

Version4–September2016 19 FURMATHEXAM2(SAMPLE)
do
no
t w
rit
e i
n t
his
ar
ea
do
no
t w
rit
e i
n t
his
ar
ea
SECTION B – Module 2 – Question 1 – continuedTURN OVER
Module 2 – Networks and decision mathematics
Question 1 (6marks)Waterwillbepumpedfromadamtoeightlocationsonafarm.Thepumpandtheeightlocations(includingthehouse)areshownasverticesinthenetworkdiagrambelow.Thenumbersontheedgesjoiningtheverticesgivetheshortestdistances,inmetres,betweenlocations.
pump
7040
50house40
8080
9070
40
80
5080
90
6070
120
70
dam
a. i. Determinetheshortestdistancebetweenthehouseandthepump. 1mark
ii. Howmanyverticesonthenetworkdiagramhaveanodddegree? 1mark
iii. Thetotallengthofalledgesinthenetworkis1180m. Ajourneystartsandfinishesatthehouseandtravelsalongeveryedgeinthenetwork.
Determinetheshortestdistancetravelled. 1mark
iv. AHamiltonianpath,beginningatthehouse,isdeterminedforthisnetwork.
Howmanyedgesdoesthispathinvolve? 1mark

FURMATHEXAM2(SAMPLE) 20 Version4–September2016
do
no
t w
rit
e i
n t
his
ar
ea
do
no
t w
rit
e i
n t
his
ar
ea
SECTION B – Module 2 – continued
Thetotallengthofpipethatsupplieswaterfromthepumptotheeightlocationsonthefarmisaminimum.Thisminimumlengthofpipeislaidalongsomeoftheedgesinthenetwork.
b. i. Onthediagrambelow,drawtheminimumlengthofpipethatisneededtosupplywatertoalllocationsonthefarm. 1mark
pump
7040
50house40
8080
9070
40
80
5080
90
6070
120
70
dam
ii. Whatisthemathematicaltermthatisusedtodescribethisminimumlengthofpipeinpart b.i.? 1mark
Version4–September2016 21 FURMATHEXAM2(SAMPLE)
do
no
t w
rit
e i
n t
his
ar
ea
do
no
t w
rit
e i
n t
his
ar
ea
SECTION B – Module 2 – Question 2 – continuedTURN OVER
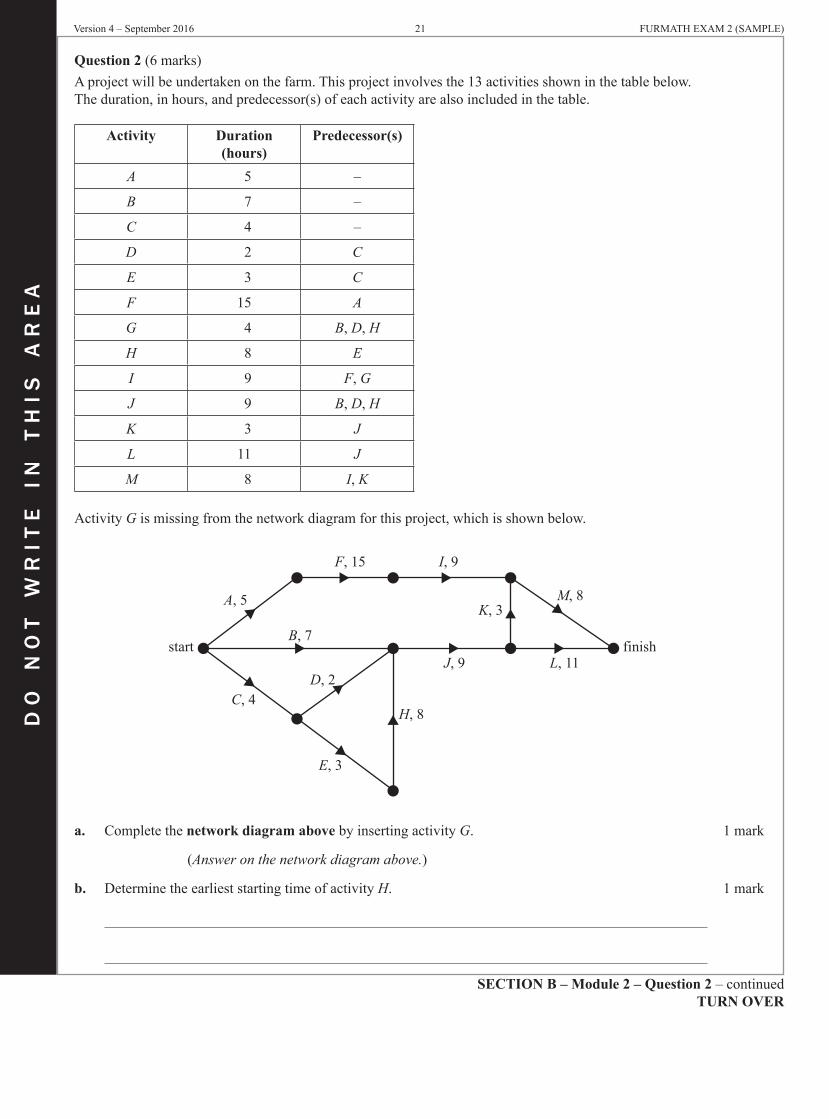
Question 2 (6marks)Aprojectwillbeundertakenonthefarm.Thisprojectinvolvesthe13activitiesshowninthetablebelow.Theduration,inhours,andpredecessor(s)ofeachactivityarealsoincludedinthetable.
Activity Duration (hours)
Predecessor(s)
A 5 –
B 7 –
C 4 –
D 2 C
E 3 C
F 15 A
G 4 B,D,H
H 8 E
I 9 F,G
J 9 B,D,H
K 3 J
L 11 J
M 8 I, K
ActivityGismissingfromthenetworkdiagramforthisproject,whichisshownbelow.
start finish
F, 15 I, 9
M, 8K, 3
L, 11
B, 7
A, 5
D, 2
H, 8
J, 9
C, 4
E, 3
a. Completethenetwork diagram abovebyinsertingactivityG. 1mark
(Answer on the network diagram above.)
b. DeterminetheearlieststartingtimeofactivityH. 1mark
FURMATHEXAM2(SAMPLE) 22 Version4–September2016
do
no
t w
rit
e i
n t
his
ar
ea
do
no
t w
rit
e i
n t
his
ar
ea
End of Module 2 – SECTION B – continued
c. GiventhatactivityGisnotonthecriticalpath
i. writedowntheactivitiesthatareonthecriticalpathintheorderthattheyarecompleted 1mark
ii. findthelateststartingtimeforactivityD. 1mark
d. Considerthefollowingstatement: ‘Ifjustoneoftheactivitiesinthisprojectiscrashedbyonehour,thentheminimumtimetocomplete
theentireprojectwillbereducedbyonehour.’
Explainthecircumstancesunderwhichthisstatementwillbetrueforthisproject. 1mark
e. AssumeactivityFiscrashedbytwohours.
Whatwillbetheminimumcompletiontimefortheproject? 1mark
Version4–September2016 23 FURMATHEXAM2(SAMPLE)
do
no
t w
rit
e i
n t
his
ar
ea
do
no
t w
rit
e i
n t
his
ar
ea
SECTION B – Module 3 – continuedTURN OVER
Module 3 – Geometry and measurement
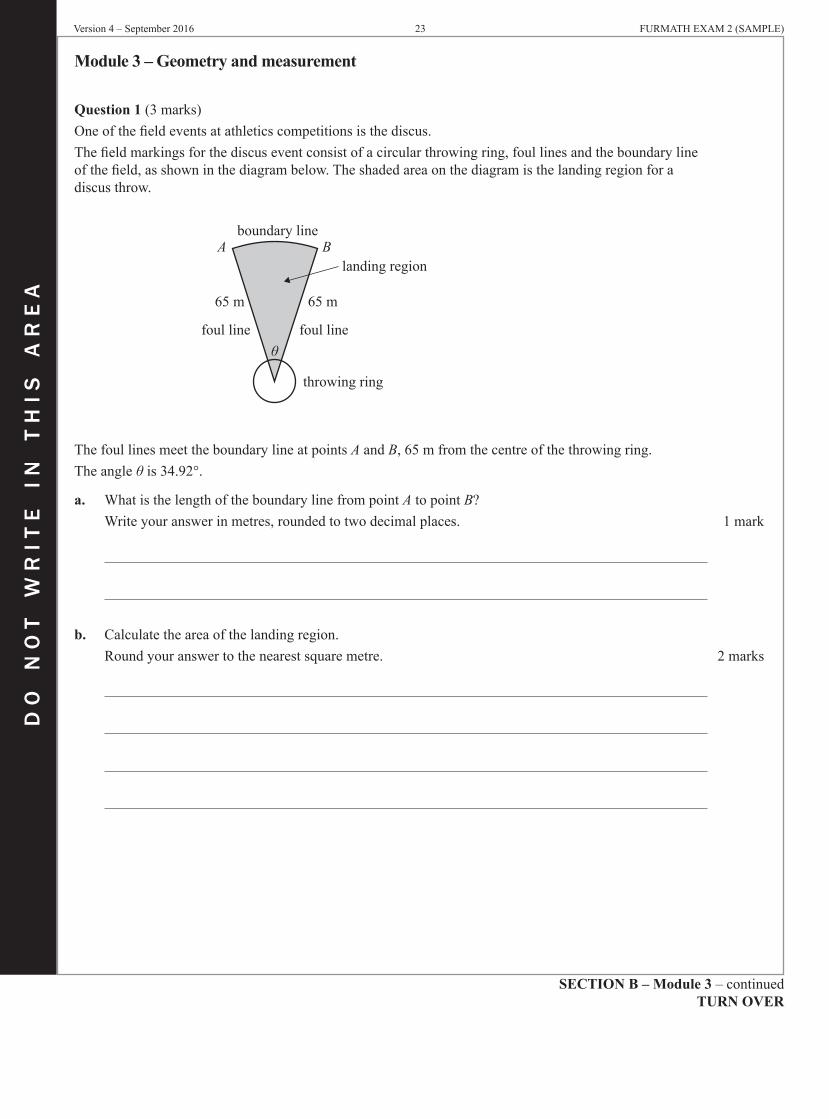
Question 1 (3marks)Oneofthefieldeventsatathleticscompetitionsisthediscus.Thefieldmarkingsforthediscuseventconsistofacircularthrowingring,foullinesandtheboundarylineofthefield,asshowninthediagrambelow.Theshadedareaonthediagramisthelandingregionforadiscusthrow.
boundary line
landing region
foul line foul line
throwing ring
A B
65 m 65 m
θ
ThefoullinesmeettheboundarylineatpointsA and B,65mfromthecentreofthethrowingring.Theangleθis34.92°.
a. WhatisthelengthoftheboundarylinefrompointAtopointB? Writeyouranswerinmetres,roundedtotwodecimalplaces. 1mark
b. Calculatetheareaofthelandingregion. Roundyouranswertothenearestsquaremetre. 2marks

FURMATHEXAM2(SAMPLE) 24 Version4–September2016
do
no
t w
rit
e i
n t
his
ar
ea
do
no
t w
rit
e i
n t
his
ar
ea
SECTION B – Module 3 – Question 2 – continued
Question 2 (5marks)DaniellivesinMildura(34°S,142°E).HewillflytoSydney(34°S,151°E)andthenflyontoRome(42°N,12°E)tocompeteinthediscuseventataninternationalathleticscompetition.Inthisquestion,assumethattheradiusofEarthis6400km.
a. FindtheshortestgreatcircledistancetotheSouthPolefromMildura(34°S,142°E). Roundyouranswertothenearestkilometre. 1mark
b. TheflightfromMildura(34°S,142°E)toSydney(34°S,151°E)travelsalongasmallcircle.
i. Findtheradiusofthissmallcircle. Roundyouranswertotwodecimalplaces. 1mark
ii. FindthedistancetheplanetravelsbetweenMildura(34°S,142°E)andSydney(34°S,151°E). Roundyouranswertothenearestkilometre. 1mark

Version4–September2016 25 FURMATHEXAM2(SAMPLE)
do
no
t w
rit
e i
n t
his
ar
ea
do
no
t w
rit
e i
n t
his
ar
ea
SECTION B – Module 3 – continuedTURN OVER
c. HowlongafterthesunrisesinSydney(34°S,151°E)willthesunriseinRome(42°N,12°E)? Roundyouranswertothenearestminute. 1mark
d. Daniel’sflighttoRomeleavesSydneyairportonSunday,6Marchat10.20am,localtime.TheflightarrivesinRomeonMonday,7Marchat2.30am.AssumethetimedifferencebetweenSydneyandRomeis10hours.
HowlongdoestheflighttaketotravelfromSydneytoRome? Roundyouranswertothenearestminute. 1mark

FURMATHEXAM2(SAMPLE) 26 Version4–September2016
do
no
t w
rit
e i
n t
his
ar
ea
do
no
t w
rit
e i
n t
his
ar
ea
SECTION B – Module 3 – continued
Question 3 (2marks)Danielwillcompeteintheintermediatedivisionofthediscuscompetition.Competitorsintheintermediatedivisionuseasmallerdiscusthantheoneusedintheseniordivision,butofasimilarshape.Thetotalsurfaceareaofeachdiscusisgivenbelow.
Intermediate discus
total surface area 500 cm2
Senior discus
total surface area 720 cm2
Bywhatvaluecanthevolumeoftheintermediatediscusbemultipliedtogivethevolumeoftheseniordiscus?

Version4–September2016 27 FURMATHEXAM2(SAMPLE)
do
no
t w
rit
e i
n t
his
ar
ea
do
no
t w
rit
e i
n t
his
ar
ea
End of Module 3 – SECTION B – continuedTURN OVER
Question 4 (2marks)Danielhasqualifiedforthefinalsofthediscuscompetition.Onhisfirstthrow,DanielthrewthediscustopointA,adistanceof53.32monabearingof057°.Onhissecondthrowfromthesamepoint,Danielthrewthediscusadistanceof57.51m.ThesecondthrowlandedatpointB,onabearingof125°,measuredfrompointA.
Determinethedistance,inmetres,betweenpointsA and B.Roundyouranswertoonedecimalplace.

FURMATHEXAM2(SAMPLE) 28 Version4–September2016
do
no
t w
rit
e i
n t
his
ar
ea
do
no
t w
rit
e i
n t
his
ar
ea
SECTION B – Module 4 – Question 1 – continued
Module 4 – Graphs and relations
Question 1 (8marks)FastgrowandBoosteraretwotomatofertilisersthatcontainthenutrientsnitrogenandphosphorus.TheamountofnitrogenandphosphorusineachkilogramofFastgrowandBoosterisshowninthetablebelow.
1 kg of Booster 1 kg of Fastgrow
Nitrogen 0.05kg 0.05kg
Phosphorus 0.02kg 0.06kg
a. Howmanykilogramsofphosphorusarein2kgofBooster? 1mark
b. If100kgofBoosterand400kgofFastgrowaremixed,howmanykilogramsofnitrogenwouldbeinthemixture? 1mark
Arthurisafarmerwhogrowstomatoes.HemixesquantitiesofBoosterandFastgrowtomakehisownfertiliser.LetxbethenumberofkilogramsofBoosterinArthur’sfertiliser.LetybethenumberofkilogramsofFastgrowinArthur’sfertiliser.Inequalities1to4representthenitrogenandphosphorusrequirementsofArthur’stomatofield.
Inequality1 x≥0Inequality2 y≥0Inequality3(nitrogen) 0.05x+0.05y≥200Inequality4(phosphorus) 0.02x+0.06y≥120
Arthur’stomatofieldalsorequiresatleast180kgofthenutrientpotassium.EachkilogramofBoostercontains0.06kgofpotassium.EachkilogramofFastgrowcontains0.04kgofpotassium.
c. Inequality5representsthepotassiumrequirementsofArthur’stomatofield.
WritedownInequality5intermsofx and y. 1mark
Inequality5(potassium)
Version4–September2016 29 FURMATHEXAM2(SAMPLE)
do
no
t w
rit
e i
n t
his
ar
ea
do
no
t w
rit
e i
n t
his
ar
ea
SECTION B – Module 4 – continuedTURN OVER
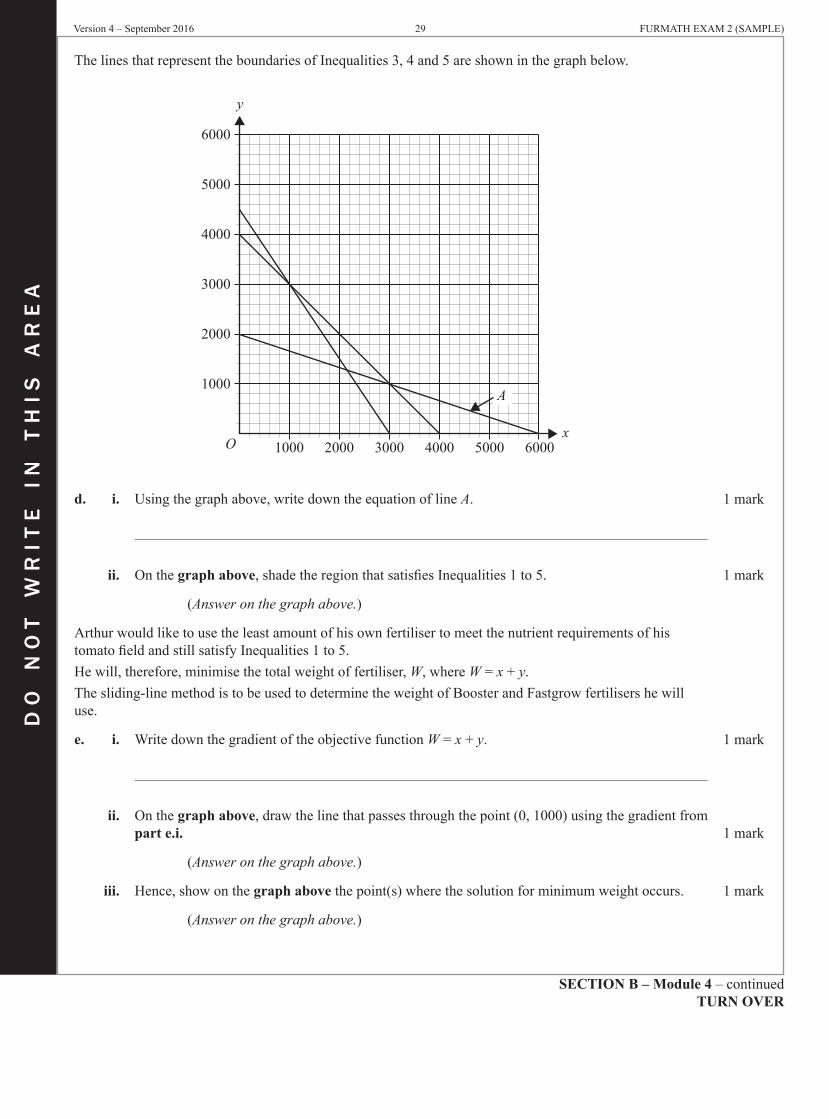
ThelinesthatrepresenttheboundariesofInequalities3,4and5areshowninthegraphbelow.
1000O 2000 3000 4000 5000 6000
1000
2000
3000
4000
5000
6000
y
x
A
d. i. Usingthegraphabove,writedowntheequationoflineA. 1mark
ii. Onthegraph above,shadetheregionthatsatisfiesInequalities1to5. 1mark
(Answer on the graph above.)
ArthurwouldliketousetheleastamountofhisownfertilisertomeetthenutrientrequirementsofhistomatofieldandstillsatisfyInequalities1to5.Hewill,therefore,minimisethetotalweightoffertiliser,W,whereW = x+y.Thesliding-linemethodistobeusedtodeterminetheweightofBoosterandFastgrowfertilisershewilluse.
e. i. WritedownthegradientoftheobjectivefunctionW = x+y. 1mark
ii. Onthegraph above,drawthelinethatpassesthroughthepoint(0,1000)usingthegradientfrom part e.i. 1mark
(Answer on the graph above.)
iii. Hence,showonthegraph abovethepoint(s)wherethesolutionforminimumweightoccurs. 1mark
(Answer on the graph above.)

FURMATHEXAM2(SAMPLE) 30 Version4–September2016
do
no
t w
rit
e i
n t
his
ar
ea
Question 2 (4marks)Ashopownerbought100kgofArthur’stomatoestosellinhershop.Sheboughtthetomatoesfor$3.50perkilogram.Theshopownerwillofferadiscounttohercustomersbasedonthenumberofkilogramsoftomatoestheybuyinonebag.Therevenue,indollars,thattheshopownerreceivesfromsellingthetomatoesisgivenbythepiecewisedefinedrelationbelow
revenue =< ≤
+ − < ≤+ − < <
5 4 0 210 8 4 2 2 10
2 10 10 100
.. ( )( )
n nn n
a n n
wherenisthenumberofkilogramsoftomatoesthatacustomerbuysinonebag.
a. Whatistherevenuethattheshopownerreceivesfromselling8kgoftomatoesinonebag? 1mark
b. Arevenueof$46.80isreceivedfromselling12kgoftomatoesinonebag.
Showthatahasthevalue42.8intherevenueequationabove. 1mark
c. Findthemaximumnumberofkilogramsoftomatoesthatacustomercanbuyinonebag,sothattheshopownernevermakesaloss. 2marks
END OF QUESTION AND ANSWER BOOK
Related Documents