Energy Procedia 29 (2012) 486 – 495 1876-6102 © 2012 Published by Elsevier Ltd. Selection and/or peer-review under responsibility of Canadian Hydrogen and Fuel Cell Association. doi:10.1016/j.egypro.2012.09.057 World Hydrogen Energy Conference 2012 Ex-situ Measurement of Properties of Gas Diffusion Layers of PEM Fuel Cells Ryan K. Phillips 1 *, Brooks R. Friess 2 , Anthony D. Hicks 1 , Julie Bellerive 2 , Mina Hoorfar 1 1 University of British Columbia School of Engineering, 3333 University Way, Kelowna, BC, V1V 1V7, Canada Ballard Power Systems, 9000 Glenlyon Parkway, Burnaby, BC, V5J 5J8, Canada Abstract The gas diffusion layer (GDL) of the proton exchange membrane (PEM) fuel cell is a vital component in water management since humidification and water removal are both achieved through the GDL. Capillary action in the GDL porous structure enhances water removal from the cathode catalyst layer, and hence prevents flooding which blocks the pathways of the reactants to the activation sites. To improve the transport of water and reactants, GDL properties are varied by changing the geometry and the PTFE loading of the carbon fiber paper (CFP), both changing the internal wettability of the GDL. In essence, the wettability describes the interaction of water with the porous structures inside the GDL. The knowledge of the surface properties and pore structure is important to enhance water management in the cell. In this work, two ex-situ techniques are used to measure transport characteristics of GDLs, such as the internal wettability, pore size distribution and permeability. These measurements have been applied to different types of GDLs with different structures and PTFE loadings. The comparison between the results will determine the effect of material and treatment on the properties of GDLs which can provide basic insight into the two-phase flow in this porous layer. Keywords: Proton exchange membrane fuel cell; gas diffusion layer; wettability; pore size distribution; permeability * Corresponding author. Tel.: 1-250-826-1304 E-mail address: [email protected] Available online at www.sciencedirect.com © 2012 Published by Elsevier Ltd. Selection and/or peer-review under responsibility of Canadian Hydrogen and Fuel Cell Association Open access under CC BY-NC-ND license. Open access under CC BY-NC-ND license.

Welcome message from author
This document is posted to help you gain knowledge. Please leave a comment to let me know what you think about it! Share it to your friends and learn new things together.
Transcript

Energy Procedia 29 ( 2012 ) 486 – 495
1876-6102 © 2012 Published by Elsevier Ltd. Selection and/or peer-review under responsibility of Canadian Hydrogen and Fuel Cell Association.doi: 10.1016/j.egypro.2012.09.057
World Hydrogen Energy Conference 2012
Ex-situ Measurement of Properties of Gas Diffusion Layers of PEM Fuel Cells
Ryan K. Phillips1*, Brooks R. Friess2, Anthony D. Hicks1, Julie Bellerive2, Mina Hoorfar1
1University of British Columbia School of Engineering, 3333 University Way, Kelowna, BC, V1V 1V7, Canada Ballard Power Systems, 9000 Glenlyon Parkway, Burnaby, BC, V5J 5J8, Canada
Abstract
The gas diffusion layer (GDL) of the proton exchange membrane (PEM) fuel cell is a vital component in water management since humidification and water removal are both achieved through the GDL. Capillary action in the GDL porous structure enhances water removal from the cathode catalyst layer, and hence prevents flooding which blocks the pathways of the reactants to the activation sites. To improve the transport of water and reactants, GDL properties are varied by changing the geometry and the PTFE loading of the carbon fiber paper (CFP), both changing the internal wettability of the GDL. In essence, the wettability describes the interaction of water with the porous structures inside the GDL. The knowledge of the surface properties and pore structure is important to enhance water management in the cell. In this work, two ex-situ techniques are used to measure transport characteristics of GDLs, such as the internal wettability, pore size distribution and permeability. These measurements have been applied to different types of GDLs with different structures and PTFE loadings. The comparison between the results will determine the effect of material and treatment on the properties of GDLs which can provide basic insight into the two-phase flow in this porous layer. © 2012 Published by Elsevier Ltd.
Selection and/or peer-review under responsibility of Canadian Hydrogen and Fuel Cell Association
Keywords: Proton exchange membrane fuel cell; gas diffusion layer; wettability; pore size distribution; permeability
* Corresponding author. Tel.: 1-250-826-1304 E-mail address: [email protected]
Available online at www.sciencedirect.com
© 2012 Published by Elsevier Ltd. Selection and/or peer-review under responsibility of Canadian Hydrogen and Fuel Cell Association Open access under CC BY-NC-ND license.
Open access under CC BY-NC-ND license.

Ryan K. Phillips et al. / Energy Procedia 29 ( 2012 ) 486 – 495 487
1. Introduction
Proton exchange membrane (PEM) fuel cells have been a major area of focus in the last decade as they provide a low-emission and high efficiency source of energy, applicable to a wide range of industrial products. However, the performance and cost of PEM fuel cells must be improved before they constitute a viable market for replacement of conventional energy technologies. Despite the general success of fuel cells, water management is the major issue as it can be the cause of flooding and mass transport limitations especially in the cathode side at high current densities [1-6]. In essence, excess water blocks active reaction sites on the catalyst layer and limits the performance of PEM fuel cells. Capillary forces in the gas diffusion layer (GDL) pore network effectively remove this excess water from the reaction sites; while simultaneously diffusing the reactant gases across the porous media to the catalyst layer. A delicate balance must be found to effectively remove water away from the catalyst layer, while maintaining membrane hydration for enhanced proton conductivity [7]. Different methods have been developed to enhance the liquid water transport through the GDL, such as loading it with polytetrafluoroethylene (PTFE) to increase the ratio of the hydrophobic to hydrophilic pores within the porous media [3,6]. Other methods such as loading a micro-porous layer (MPL) onto the carbon fiber paper (CFP) have been successful in enhancing liquid water removal from the catalyst layer.
The characterization of the GDL properties leads to understanding the complex multi-phase flow of water and air within this porous medium to help optimize water management in fuel cells and reduce the effects of flooding at the cathode. Due to the complex structure of the GDL, there is still no comprehensive method available for characterizing the properties of this medium. The objective of this study is to determine characteristics of CFP samples including wettability, pore size distribution and permeability. In addition to the ex-situ techniques used to characterize the samples, SEM images are also obtained to provide a visual comparison between the samples as well as validate the ex-situ results.
In this paper, the capillary rise technique [8] is used to determine the average internal contact angle which will provide a quantitative value describing wettability of the porous medium of the GDL. This value is defined as the average angle liquid droplets form within the pore walls of the porous structure. The determination of the average internal contact angle of a wide variety of the CFP samples will allow us to understand how different samples transfer liquid water. In most studies conducted in the past [5, 6] wettability of the GDL has been quantified by measuring the external contact angle of a sessile drop on the GDL. These contact angle values only reflect the surface roughness rather than the internal wettability of the GDL. In fact, these measurements do not describe the interaction of water beading on the surface of the carbon strands inside the porous GDL. The capillary rise technique, on the other hand, is an effective method to find the average internal contact angle (wettability) of GDLs which will represent hydrophobicity of the medium depending on the structure of the GDL and PTFE loading [8,9].
Reactant diffusion from the flow channels to the catalyst layer is governed by the two-phase flow occurring in the GDL during fuel cell operation [10]. A certain amount of pores must be left vacant to supply sufficient reactant gas to the electrode catalysts. As governed by the Laplace equation, liquid water prefers larger and more hydrophilic pores. This leaves the smaller and more hydrophobic pores in the GDL open for gas transport. The fabrication of common CFPs results in a randomized porous structure with a distribution of pore sizes. PTFE loading will also coat the walls of the pores and web between the carbon strands of the GDL, changing both the pore size and the wettability of the GDL. Finding the pore size distribution and in-plane permeability gives further quantitative values to classify GDLs.
The measurement of the properties mentioned above is crucial as they are dependent on each other. In essence, the hydrophobicity of a pore is influenced by both the contact angle and pore size, and hence evaluation between these properties that effect overall transport characteristics of GDLs will help in gaining insight into the two-phase flow inside of GDLs. With this knowledge, further advancement can be made in the area of water management in PEM fuel cells.
488 Ryan K. Phillips et al. / Energy Procedia 29 ( 2012 ) 486 – 495
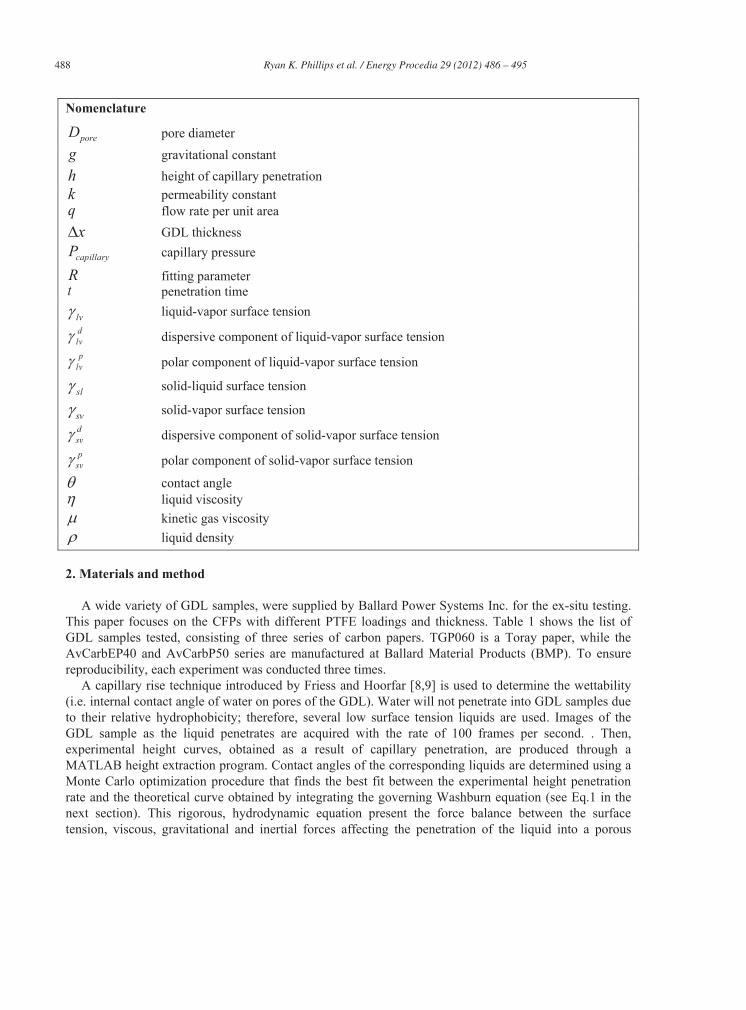
Nomenclature
poreD pore diameter g gravitational constant h height of capillary penetration k permeability constant q flow rate per unit area
x GDL thickness
capillaryP capillary pressure
R fitting parameter t penetration time
lv liquid-vapor surface tension dlv dispersive component of liquid-vapor surface tension p
lv polar component of liquid-vapor surface tension
sl solid-liquid surface tension
sv solid-vapor surface tension dsv dispersive component of solid-vapor surface tension psv polar component of solid-vapor surface tension
contact angle liquid viscosity kinetic gas viscosity liquid density
2. Materials and method
A wide variety of GDL samples, were supplied by Ballard Power Systems Inc. for the ex-situ testing.
This paper focuses on the CFPs with different PTFE loadings and thickness. Table 1 shows the list of GDL samples tested, consisting of three series of carbon papers. TGP060 is a Toray paper, while the AvCarbEP40 and AvCarbP50 series are manufactured at Ballard Material Products (BMP). To ensure reproducibility, each experiment was conducted three times.
A capillary rise technique introduced by Friess and Hoorfar [8,9] is used to determine the wettability (i.e. internal contact angle of water on pores of the GDL). Water will not penetrate into GDL samples due to their relative hydrophobicity; therefore, several low surface tension liquids are used. Images of the GDL sample as the liquid penetrates are acquired with the rate of 100 frames per second. . Then, experimental height curves, obtained as a result of capillary penetration, are produced through a MATLAB height extraction program. Contact angles of the corresponding liquids are determined using a Monte Carlo optimization procedure that finds the best fit between the experimental height penetration rate and the theoretical curve obtained by integrating the governing Washburn equation (see Eq.1 in the next section). This rigorous, hydrodynamic equation present the force balance between the surface tension, viscous, gravitational and inertial forces affecting the penetration of the liquid into a porous
Ryan K. Phillips et al. / Energy Procedia 29 ( 2012 ) 486 – 495 489
sample [8]. Once the contact angle for a set of test liquids is found the contact angle of water in the GDL is determined using the Owens-Wendt-two-parameter surface tension model (see the details in the next section).
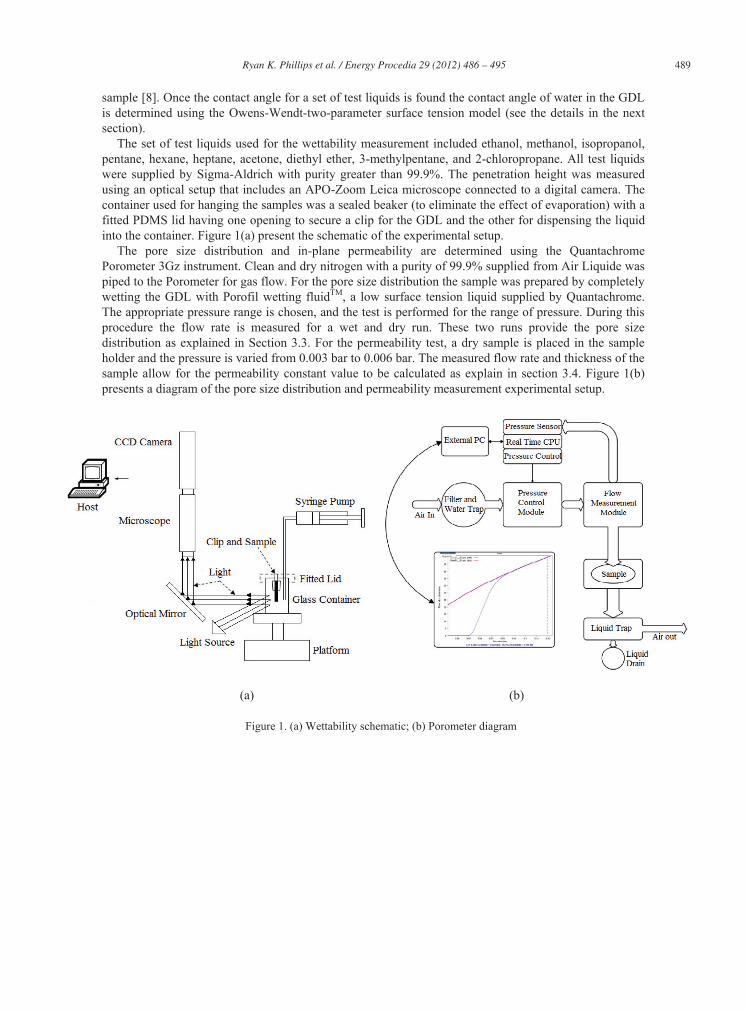
The set of test liquids used for the wettability measurement included ethanol, methanol, isopropanol, pentane, hexane, heptane, acetone, diethyl ether, 3-methylpentane, and 2-chloropropane. All test liquids were supplied by Sigma-Aldrich with purity greater than 99.9%. The penetration height was measured using an optical setup that includes an APO-Zoom Leica microscope connected to a digital camera. The container used for hanging the samples was a sealed beaker (to eliminate the effect of evaporation) with a fitted PDMS lid having one opening to secure a clip for the GDL and the other for dispensing the liquid into the container. Figure 1(a) present the schematic of the experimental setup.
The pore size distribution and in-plane permeability are determined using the Quantachrome Porometer 3Gz instrument. Clean and dry nitrogen with a purity of 99.9% supplied from Air Liquide was piped to the Porometer for gas flow. For the pore size distribution the sample was prepared by completely wetting the GDL with Porofil wetting fluidTM, a low surface tension liquid supplied by Quantachrome. The appropriate pressure range is chosen, and the test is performed for the range of pressure. During this procedure the flow rate is measured for a wet and dry run. These two runs provide the pore size distribution as explained in Section 3.3. For the permeability test, a dry sample is placed in the sample holder and the pressure is varied from 0.003 bar to 0.006 bar. The measured flow rate and thickness of the sample allow for the permeability constant value to be calculated as explain in section 3.4. Figure 1(b) presents a diagram of the pore size distribution and permeability measurement experimental setup.
(a) (b)
(a) (b)
Figure 1. (a) Wettability schematic; (b) Porometer diagram
490 Ryan K. Phillips et al. / Energy Procedia 29 ( 2012 ) 486 – 495
3. Theory and calculation
3.1. General capillary penetration equation
The governing Washburn equation (Eq. 1) for capillary penetration shows the balance between surface tension (i.e., the cause of capillary action) and forces such as viscous, gravitational, inertial and frictional work which all impede the motion of the liquid through the porous structure [8]. In this equation, θ is the average internal contact angle formed by the liquid and the GDL material, γlv is the liquid-vapor surface tension, ρ is the density of the sample liquid, and η is the viscosity of the sample liquid. The height and time of penetration are h and t, respectively, and R is a fitting parameter dependent on pore size.
22 2
22 2
cos
8 72 cos 1.2256lv
gravitysurface tensionvis ity inertia friction
h dh d h dh d hghR R R RhR dt dt dt dt (1)
Integration of the Washburn second order non-linear ordinary differential equation (ODE) models the
height of liquid penetration within a porous media. The penetration rate is heavily dependent on the properties of the liquid due to the interaction between the pore walls and the intermolecular forces pulling the liquid upward. For a constant sample, theory states that the rate of penetration will decrease as a higher surface tension, more viscous or denser liquid is used. From this equation the average internal contact angle can be calculated by knowing the properties of the penetrating liquid and fitting the equation to an experimental height curve.
3.2. Determination of contact angle using Owens-Wendt two-parameter surface tension model
Young’s equation (Eq. 2) is the governing equation originated from balancing the interfacial tensions at the three-phase solid-liquid-gas contact line [8]. According to the Owens-Wendt surface tension model, liquid and solid surface tensions consist of two components: i) the dispersive component, accounting for van der Waals and non-site specific interactions , and ii) the polar component, accounting for the dipole moment and site specific interactions [11,12]. The addition of these components is the total surface tension (Eq.3). The Owens-Wendt equation (Eq. 5) is obtained by combining Good’s equation (Eq. 4), which is an empirical equation approximating the solid-liquid component of the surface tension and the Young’s equations.
coslv sv sl (2)
; total d p total d plv lv lv sv sv sv (3)
2 d d p psl sv lv sv lv sv lv (4)
1 cos2
p d pd plv lv lvsv sv dd
lvlv A BXY
(5)
Ryan K. Phillips et al. / Energy Procedia 29 ( 2012 ) 486 – 495 491
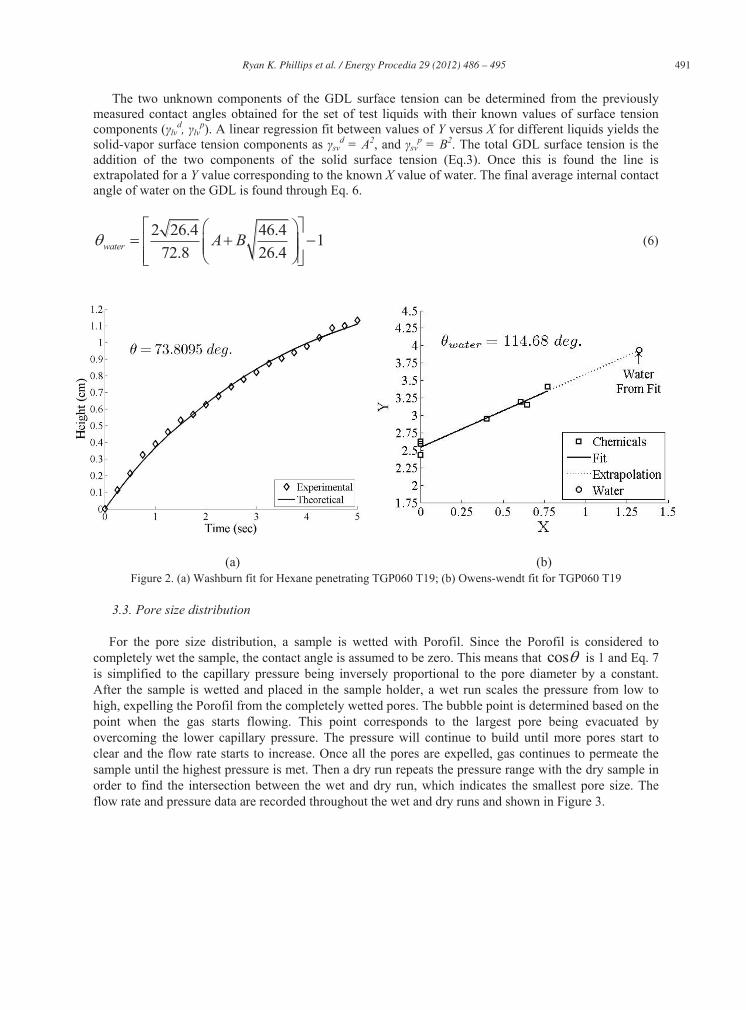
The two unknown components of the GDL surface tension can be determined from the previously measured contact angles obtained for the set of test liquids with their known values of surface tension components (γlv
d, γlvp). A linear regression fit between values of Y versus X for different liquids yields the
solid-vapor surface tension components as γsvd = A2, and γsv
p = B2. The total GDL surface tension is the addition of the two components of the solid surface tension (Eq.3). Once this is found the line is extrapolated for a Y value corresponding to the known X value of water. The final average internal contact angle of water on the GDL is found through Eq. 6.
2 26.4 46.4 172.8 26.4water A B (6)
(a) (b)
(a) (b)
Figure 2. (a) Washburn fit for Hexane penetrating TGP060 T19; (b) Owens-wendt fit for TGP060 T19
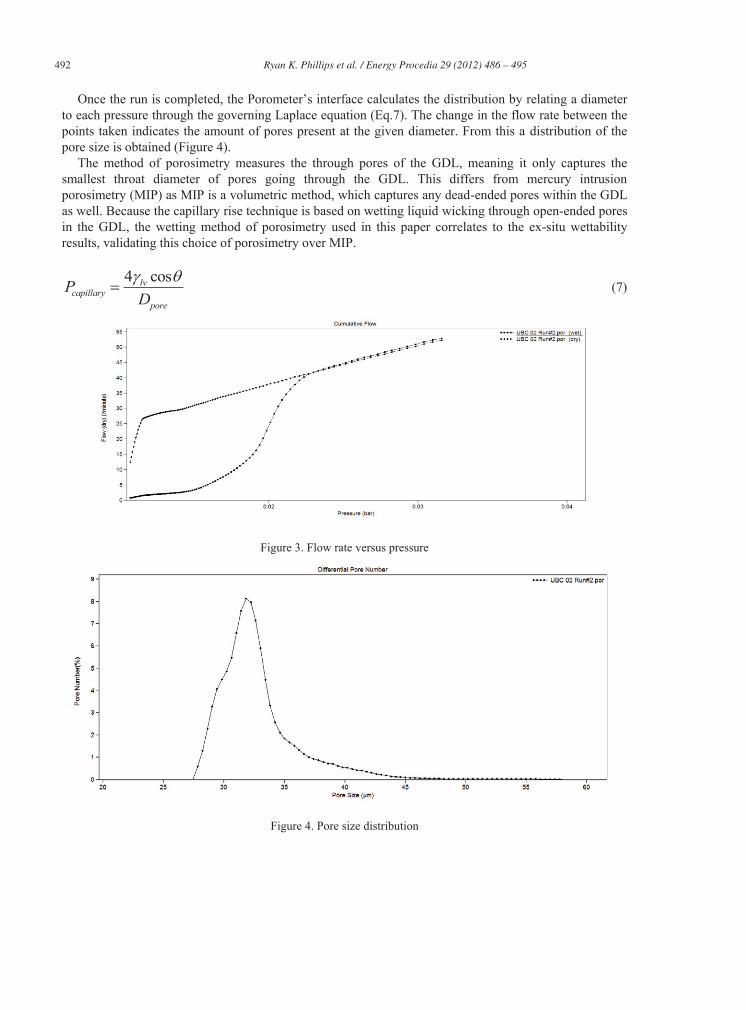
3.3. Pore size distribution For the pore size distribution, a sample is wetted with Porofil. Since the Porofil is considered to
completely wet the sample, the contact angle is assumed to be zero. This means that cos is 1 and Eq. 7 is simplified to the capillary pressure being inversely proportional to the pore diameter by a constant. After the sample is wetted and placed in the sample holder, a wet run scales the pressure from low to high, expelling the Porofil from the completely wetted pores. The bubble point is determined based on the point when the gas starts flowing. This point corresponds to the largest pore being evacuated by overcoming the lower capillary pressure. The pressure will continue to build until more pores start to clear and the flow rate starts to increase. Once all the pores are expelled, gas continues to permeate the sample until the highest pressure is met. Then a dry run repeats the pressure range with the dry sample in order to find the intersection between the wet and dry run, which indicates the smallest pore size. The flow rate and pressure data are recorded throughout the wet and dry runs and shown in Figure 3.
492 Ryan K. Phillips et al. / Energy Procedia 29 ( 2012 ) 486 – 495
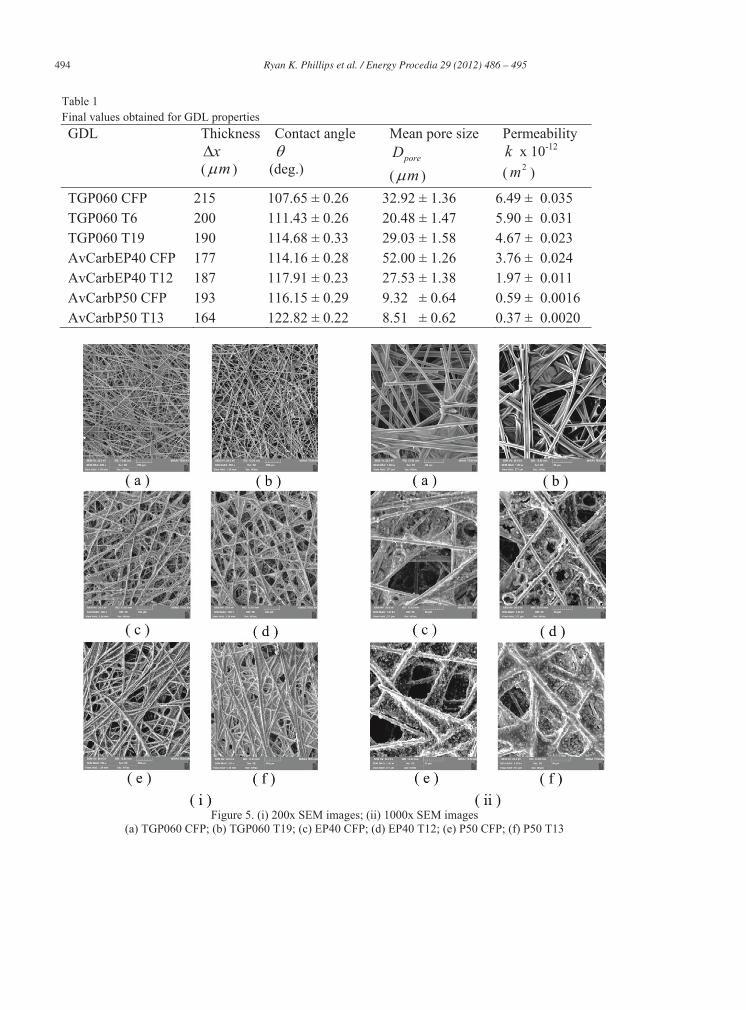
Once the run is completed, the Porometer’s interface calculates the distribution by relating a diameter to each pressure through the governing Laplace equation (Eq.7). The change in the flow rate between the points taken indicates the amount of pores present at the given diameter. From this a distribution of the pore size is obtained (Figure 4).
The method of porosimetry measures the through pores of the GDL, meaning it only captures the smallest throat diameter of pores going through the GDL. This differs from mercury intrusion porosimetry (MIP) as MIP is a volumetric method, which captures any dead-ended pores within the GDL as well. Because the capillary rise technique is based on wetting liquid wicking through open-ended pores in the GDL, the wetting method of porosimetry used in this paper correlates to the ex-situ wettability results, validating this choice of porosimetry over MIP.
4 coslv
capillarypore
PD
(7)
Figure 3. Flow rate versus pressure
Figure 3. Flow rate versus pressure for pore size distribution
Figure 4. Pore size distribution

Ryan K. Phillips et al. / Energy Procedia 29 ( 2012 ) 486 – 495 493
3.4. In-plane permeability To determine permeability of a GDL sample, a dry sample is placed in the sample holder of the
Porometer. Nitrogen is permeated through the sample as the pressure is changed from 0.003 bar to 0.006 bar. During the pressure range the corresponding flow rate is recorded. From the Darcy’s law (Eq.8) the permeability constant can be found at each data point. An average of this array reveals the permeability constant for a given sample.
k Pq
x (8)
4. Results and discussion
The properties (i.e., the internal contact angle, mean pore size and permeability) of different GDL
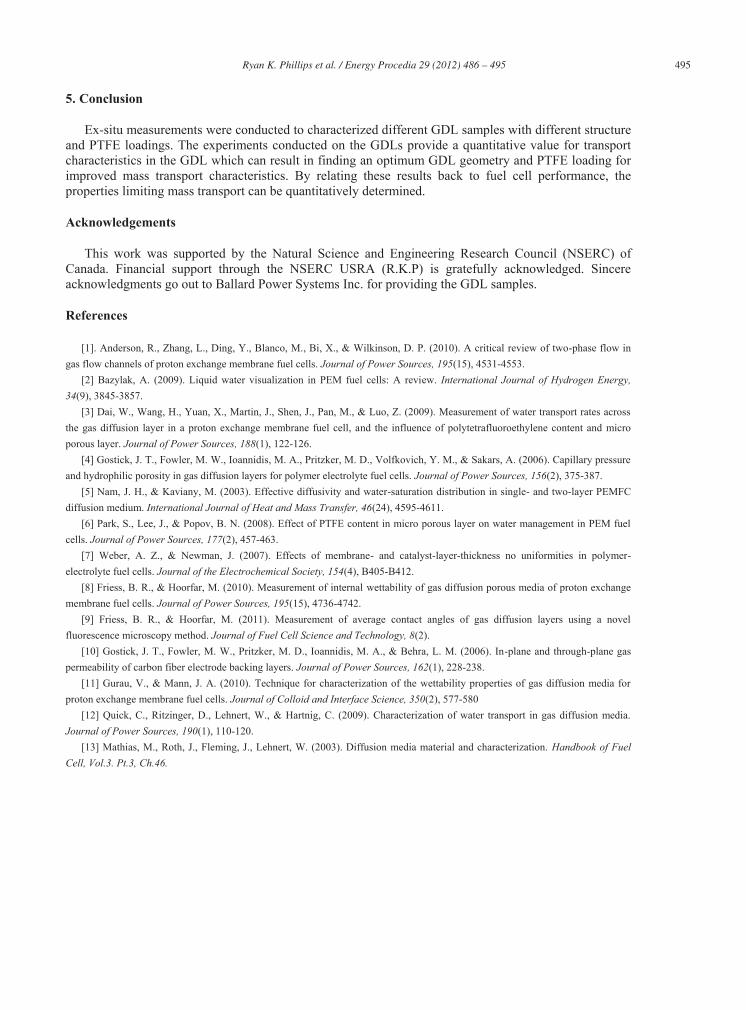
samples are summarized in Table 1. The comparison between the contact angle of the GDLs shows that the TGP060 series has the lowest contact angle, followed by the AvCarbEP40 and finally the AvCarbP50 series has the highest contact angle (see Table 1). The contact angle values of the plain CFP with no rated PTFE loading reveals the hydrophobicity of the material properties of the carbon strands and binder used. Although these samples do not have a rated Teflon loading, a carbonizing resin is present from the manufacturing and can be seen in the Figure 5 (a,c,e) [13]. From these SEM images it can be seen that the resin coats the non-teflonated samples which influences the structure and wetting properties of the CFP. The comparison between Figure 5 (b,d,f) shows that Teflon coats the carbon pore walls of the Toray paper as it webs between the stands; whereas the Teflon tends to group in between the carbon strands of the AvCarb papers, beading away from strands into the pores. This result follows the trend observed in the contact angle values which depends on material properties and construction of the GDL. As the Teflon loading is increased for a given GDL series, the contact angle increases as the higher PTFE content further covers the pore walls, making them more hydrophobic. The interaction between the Teflon and a given CFP will play a major role in water and gas transport. The results obtained from the pore size distribution reveals that the P50 series has the smallest pore size. Therefore, the hydrophobic material has more opportunity to completely block the pores, as seen in Figure 5 (ii)(f). This results in obtaining the highest contact angle value for this series.
As the Teflon loading increases, the walls of the pores are coated with the PTFE which results in smaller pore size (see the results of pore size listed in Table 1).This decrease in the pore diameter and the presence of Teflon makes a pore more hydrophobic and more likely a better pathway for gas transport to the catalyst layer. AvCarbEP40 series is known to have higher porosity than the AvCarbP50 series, which is proved by obtaining a much smaller pore size in the P50 series and is shown in the SEM images (Figure 5 (c.e)). Compared to the other two series, the nominal pore size of EP40 series decreases significantly with an increase in Teflon loading. This could be due to the way that Teflon interacts with carbon strands of the EP40 CFP, covering the pores more and hence decreasing the pore size.
The permeability values presented in Table 1 decrease as the PTFE loading increases. This loading results in the decrease in pore size, allowing less gas to flow. A thinner GDL sample with the same order of magnitude pore size will have a lower permeability constant (based on Darcy’s law), as can be seen between TGP060 T19 and EP40 T12 samples.
494 Ryan K. Phillips et al. / Energy Procedia 29 ( 2012 ) 486 – 495
Table 1 Final values obtained for GDL properties GDL Thickness
x ( m )
Contact angle
(deg.)
Mean pore size poreD
( m )
Permeability k x 10-12 ( 2m )
TGP060 CFP 215 107.65 ± 0.26 32.92 ± 1.36 6.49 ± 0.035 TGP060 T6 200 111.43 ± 0.26 20.48 ± 1.47 5.90 ± 0.031 TGP060 T19 190 114.68 ± 0.33 29.03 ± 1.58 4.67 ± 0.023 AvCarbEP40 CFP 177 114.16 ± 0.28 52.00 ± 1.26 3.76 ± 0.024 AvCarbEP40 T12 187 117.91 ± 0.23 27.53 ± 1.38 1.97 ± 0.011 AvCarbP50 CFP 193 116.15 ± 0.29 9.32 ± 0.64 0.59 ± 0.0016 AvCarbP50 T13 164 122.82 ± 0.22 8.51 ± 0.62 0.37 ± 0.0020
Figure 5. (i) 200x SEM images; (ii) 1000x SEM images
(a) TGP060 CFP; (b) TGP060 T19; (c) EP40 CFP; (d) EP40 T12; (e) P50 CFP; (f) P50 T13
Ryan K. Phillips et al. / Energy Procedia 29 ( 2012 ) 486 – 495 495
5. Conclusion
Ex-situ measurements were conducted to characterized different GDL samples with different structure and PTFE loadings. The experiments conducted on the GDLs provide a quantitative value for transport characteristics in the GDL which can result in finding an optimum GDL geometry and PTFE loading for improved mass transport characteristics. By relating these results back to fuel cell performance, the properties limiting mass transport can be quantitatively determined. Acknowledgements
This work was supported by the Natural Science and Engineering Research Council (NSERC) of Canada. Financial support through the NSERC USRA (R.K.P) is gratefully acknowledged. Sincere acknowledgments go out to Ballard Power Systems Inc. for providing the GDL samples. References
[1]. Anderson, R., Zhang, L., Ding, Y., Blanco, M., Bi, X., & Wilkinson, D. P. (2010). A critical review of two-phase flow in
gas flow channels of proton exchange membrane fuel cells. Journal of Power Sources, 195(15), 4531-4553. [2] Bazylak, A. (2009). Liquid water visualization in PEM fuel cells: A review. International Journal of Hydrogen Energy,
34(9), 3845-3857. [3] Dai, W., Wang, H., Yuan, X., Martin, J., Shen, J., Pan, M., & Luo, Z. (2009). Measurement of water transport rates across
the gas diffusion layer in a proton exchange membrane fuel cell, and the influence of polytetrafluoroethylene content and micro porous layer. Journal of Power Sources, 188(1), 122-126.
[4] Gostick, J. T., Fowler, M. W., Ioannidis, M. A., Pritzker, M. D., Volfkovich, Y. M., & Sakars, A. (2006). Capillary pressure and hydrophilic porosity in gas diffusion layers for polymer electrolyte fuel cells. Journal of Power Sources, 156(2), 375-387.
[5] Nam, J. H., & Kaviany, M. (2003). Effective diffusivity and water-saturation distribution in single- and two-layer PEMFC diffusion medium. International Journal of Heat and Mass Transfer, 46(24), 4595-4611.
[6] Park, S., Lee, J., & Popov, B. N. (2008). Effect of PTFE content in micro porous layer on water management in PEM fuel cells. Journal of Power Sources, 177(2), 457-463.
[7] Weber, A. Z., & Newman, J. (2007). Effects of membrane- and catalyst-layer-thickness no uniformities in polymer-electrolyte fuel cells. Journal of the Electrochemical Society, 154(4), B405-B412.
[8] Friess, B. R., & Hoorfar, M. (2010). Measurement of internal wettability of gas diffusion porous media of proton exchange membrane fuel cells. Journal of Power Sources, 195(15), 4736-4742.
[9] Friess, B. R., & Hoorfar, M. (2011). Measurement of average contact angles of gas diffusion layers using a novel fluorescence microscopy method. Journal of Fuel Cell Science and Technology, 8(2).
[10] Gostick, J. T., Fowler, M. W., Pritzker, M. D., Ioannidis, M. A., & Behra, L. M. (2006). In-plane and through-plane gas permeability of carbon fiber electrode backing layers. Journal of Power Sources, 162(1), 228-238.
[11] Gurau, V., & Mann, J. A. (2010). Technique for characterization of the wettability properties of gas diffusion media for proton exchange membrane fuel cells. Journal of Colloid and Interface Science, 350(2), 577-580
[12] Quick, C., Ritzinger, D., Lehnert, W., & Hartnig, C. (2009). Characterization of water transport in gas diffusion media. Journal of Power Sources, 190(1), 110-120.
[13] Mathias, M., Roth, J., Fleming, J., Lehnert, W. (2003). Diffusion media material and characterization. Handbook of Fuel Cell, Vol.3. Pt.3, Ch.46.
Related Documents