Evolvable Cryogenics (eCryo) Project Technology Workshop with Industry Engineering Development Unit (EDU) Workshop Mass Gauging Test Results Greg Zimmerli 1 https://ntrs.nasa.gov/search.jsp?R=20150002607 2018-06-09T02:48:47+00:00Z

Welcome message from author
This document is posted to help you gain knowledge. Please leave a comment to let me know what you think about it! Share it to your friends and learn new things together.
Transcript

Evolvable Cryogenics (eCryo) ProjectTechnology Workshop with Industry
Engineering Development Unit (EDU) Workshop
Mass Gauging Test Results
Greg Zimmerli
1
https://ntrs.nasa.gov/search.jsp?R=20150002607 2018-06-09T02:48:47+00:00Z
Mass Gauging
2
Mass gauging sensors on the EDU• DT-670 diode temperature/wet-dry rake• RF Mass Gauge• Reduced Gravity CryoTracker (Sierra Lobo)• Capacitance Probe (American Magnetics)
LH2 Test Objectives met or addressed:• Ground loading: Mass gauging checkouts & heat load measurement• Gather data for model validation
LH2 Test Success Criteria met or addressed:• Load the EDU to 90% full with Liquid Hydrogen • Conduct mass gauging measurements with RFMG and compare to liquid level
information provided by temperature rake • Measure EDU Boil off for simulated on-orbit heat load• Data collection from above objectives• Gauging data was also critical for LAD outflow testing

3
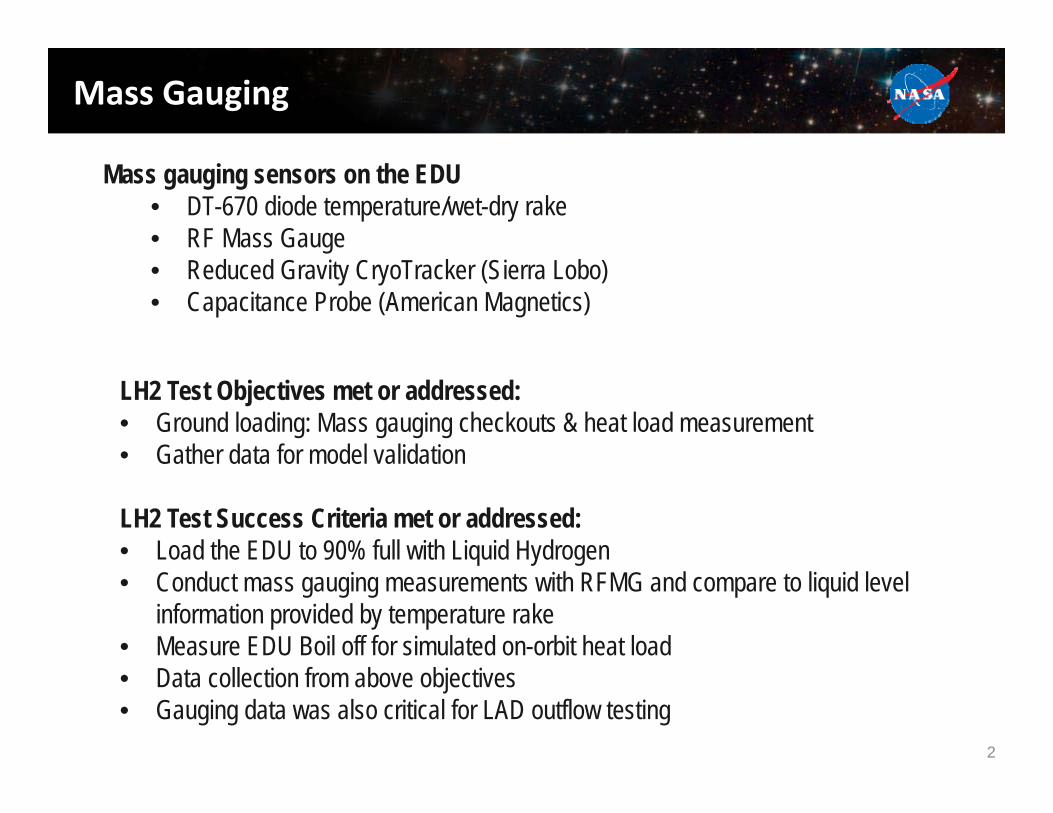
Mass Gauging
EDU mass gauging probe
Al T‐bar support structure
Reduced Gravity CryoTracker
Capacitance probe
Not shown: RFMG antennas, diode rake
4
Al T‐bar
Mass Gauging

5
Capacitance probeCP2440
4%
90%
• Temperature rake (wet-dry sensors) and cap probe data is stored with facility CSV data files.
• RFMG and CryoTracker data were both stored on separate systems.
• RFMG and CryoTracker clocks were synchronized to the facility data computer clock to within a few seconds
NOTE: The diode tank station values are from the EDU CAD model, not the as-built configuration
Mass Gauging

6
Photos of the mass gauging sensors, mounted to aluminum T-bar
diodes
Cap probe
Mass Gauging

7
Silicon diodes at 5% location
The wet-dry rake diodes are mounted above the perf board.
Mass Gauging
8
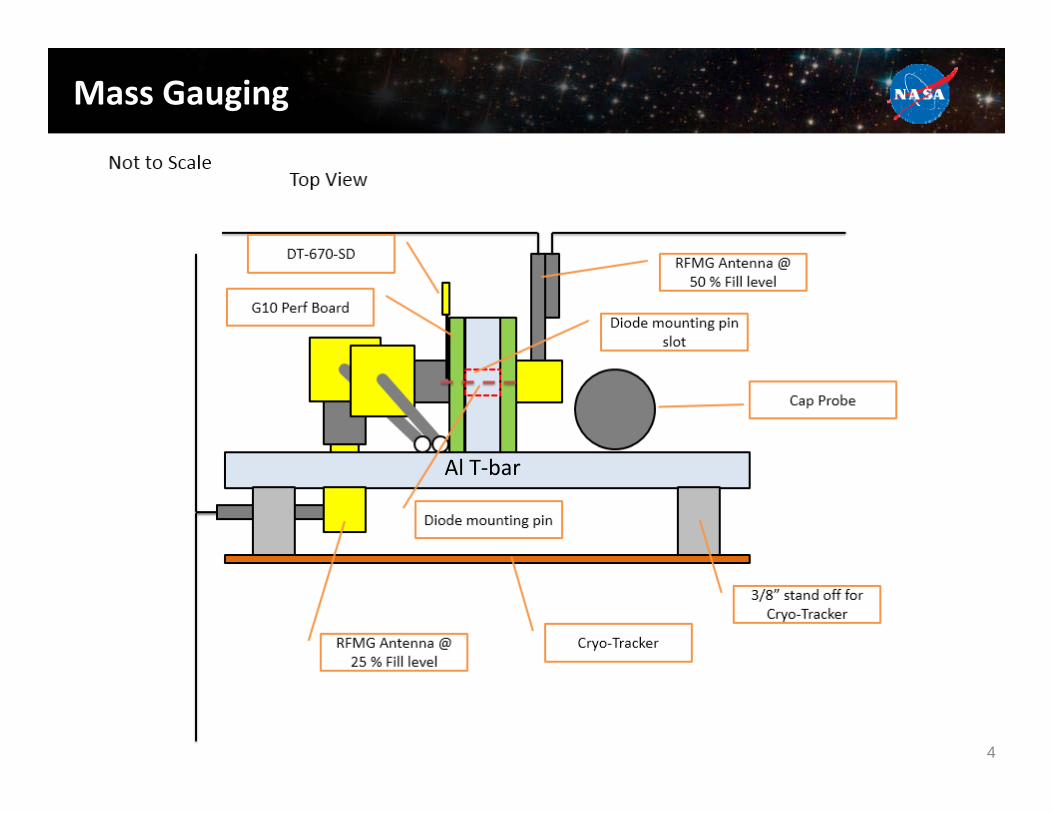
• Reduced Gravity CryoTracker (RGCT) probe; contains 8 sensors mounted on backside of T-bar
• RF Mass Gauge antennas mounted on edges of T-bar, about 20 inches apart
• All mass gauging sensors are attached to the T-bar assembly
RFMG antennas
Mass Gauging

9
Silicon diodes are run “hot” (30 mA) when in wet-dry mode.• The T reading during wet-dry mode is obviously not accurate. It is based on an DT- 670
voltage vs T table (valid for 10 A) extrapolated to negative temperatures
T mode (10 A)
Wet-dry mode (30 mA)
Dry-wet transitions during filling
• Different offsets in the transition value are due to lead resistance
• This did not affect the analysis, which was done manually
T, K
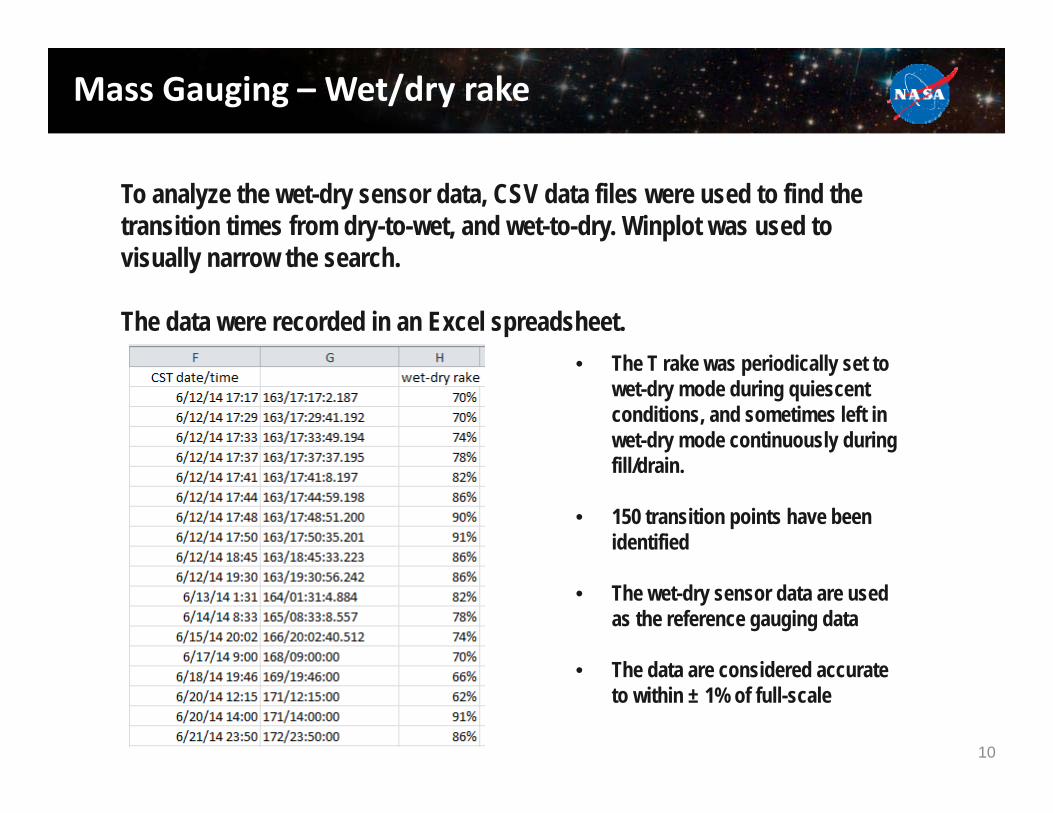
Mass Gauging – Wet/dry rake
10
To analyze the wet-dry sensor data, CSV data files were used to find the transition times from dry-to-wet, and wet-to-dry. Winplot was used to visually narrow the search.
The data were recorded in an Excel spreadsheet.• The T rake was periodically set to
wet-dry mode during quiescent conditions, and sometimes left in wet-dry mode continuously during fill/drain.
• 150 transition points have been identified
• The wet-dry sensor data are used as the reference gauging data
• The data are considered accurate to within ± 1% of full-scale
Mass Gauging – Wet/dry rake

11
Mass Gauging – Wet/dry rake
Wet‐dry transition points during EDU LH2 testing:
% fill
Discrete wet‐dry data points are augmented by the continuous cap‐probe data

12
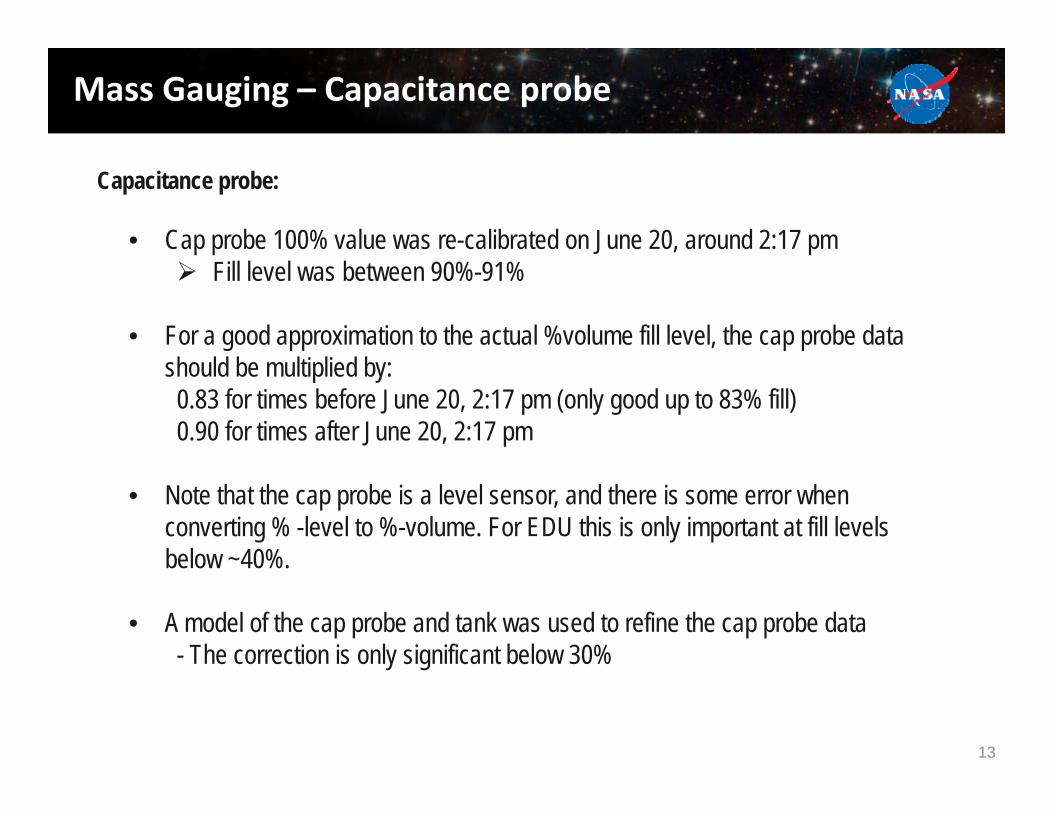
Capacitance probe:
• American Magnetics, Model 185 controller• Output was zeroed at LN2 temperature, He gas• Output was calibrated to “100%” at two different fill levels:
• An initial cal to “100%” was done with a partially filled tank• Wet-dry/RFMG data was used to find the cal-point, which was at 83% fill
• Cap probe output saturates at 100% reading at 163/17:39
• Actual fill level is 83% • Reported cal fill level was
77% (not consistent with the data)
% fi
ll
Mass Gauging – Capacitance probe
13
• Cap probe 100% value was re-calibrated on June 20, around 2:17 pm Fill level was between 90%-91%
• For a good approximation to the actual %volume fill level, the cap probe data should be multiplied by:0.83 for times before June 20, 2:17 pm (only good up to 83% fill)0.90 for times after June 20, 2:17 pm
• Note that the cap probe is a level sensor, and there is some error when converting % -level to %-volume. For EDU this is only important at fill levels below ~40%.
• A model of the cap probe and tank was used to refine the cap probe data- The correction is only significant below 30%
Capacitance probe:
Mass Gauging – Capacitance probe

14
h0
h100
Refined cap probe output model
hliq = h0 + (h100 - h0)x Cap%
%-Volume = f(hliq)
7 inches
• COMSOL RF tank model was used to convert liquid height to %Vol
Mass Gauging – Capacitance probe
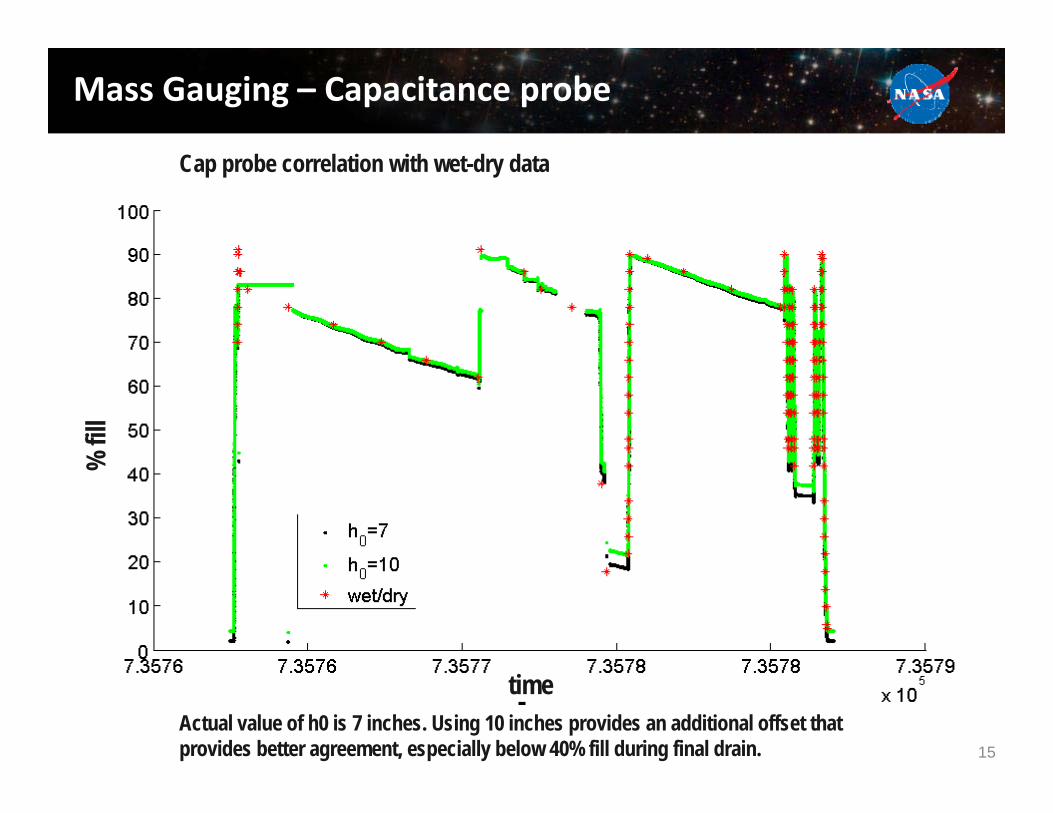
15
Cap probe correlation with wet-dry data
Actual value of h0 is 7 inches. Using 10 inches provides an additional offset that provides better agreement, especially below 40% fill during final drain.
% fi
ll
time
Mass Gauging – Capacitance probe

16
Cap probe correlation with wet-dry data
Detail during LAD testing
% fi
ll
time
Mass Gauging – Capacitance probe
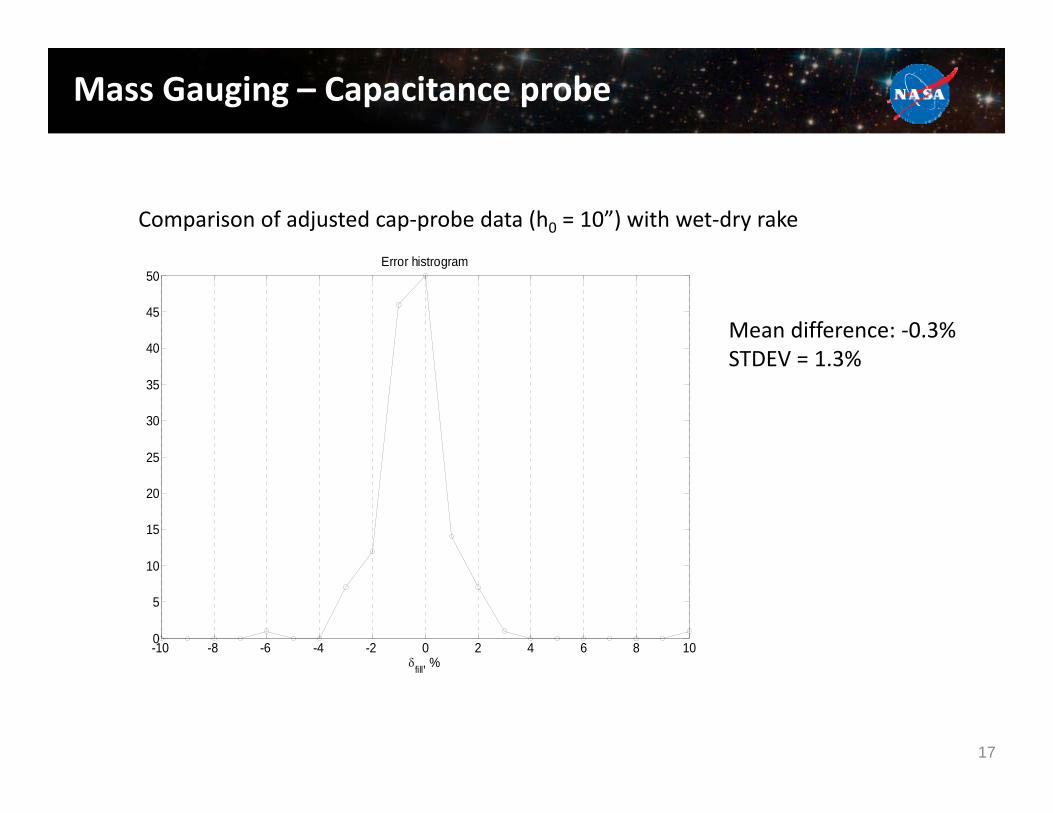
17
-10 -8 -6 -4 -2 0 2 4 6 8 100
5
10
15
20
25
30
35
40
45
50
fill, %
Error histrogram
Mean difference: ‐0.3%STDEV = 1.3%
Mass Gauging – Capacitance probe
Comparison of adjusted cap‐probe data (h0 = 10”) with wet‐dry rake

18
RFMG: Principle of operation
• Metal tank has natural RF modes
• RF network analyzer measures the tank spectrum (< 1 mW RF power)
• RFMG software finds the peaks, compares the frequencies to a database of simulations, and returns the best match %fill‐level information
• Gauging operation takes 1 ‐ 10 s, depending on number of frequency points (4k – 40k)
• The tank RF spectrum changes with fill level, since the dielectric fluid slows the speed of light
• The basis of the RFMG is that these changes can be accurately predicted
Lcf /~
ZVL
Control roomRemote Desktop
Mass Gauging – RF Mass Gauge

19
Mass Gauging – RF Mass Gauge
COMSOL – RF Module was used to calculate the tank mode frequencies
Model includes: 3 LAD arms, LAD crossover TVS tube, top diffuser, bottom diffuser, axial jet nozzle, mass gauging T‐bar, horizontal ullage T rake

20
Computed RF modes for EDU tank
• 100 simulation files – 1% resolution• Specified dielectric constant for liquid and vapor phases in the model
f, MH
z
Fill, %
5 modes used for gauging
Mass Gauging – RF Mass Gaugef,
MHz
Fill, %

21
Plot of RFMG raw data from June 24/03:41:51
The RFMG software finds the frequencies of these peaks, compares it to the database of 5 modes, and returns a % fill level.
Retu
rn lo
ss, d
B
f, MHz
Mass Gauging – RF Mass Gauge

22
RFMG data
• Typically collected RFMG data once every 15 minutes during boil-off tests• Once every 10-20 seconds during fill/drain
• 12,900 files were collected, zipped, and sent to GRC
• Bad connection somewhere along Antenna 2 line before start of test. Signal came back during fill.
• A couple re-boots of the ZVL network analyzer were required during testing
• RFMG software initially set to use 3 measured modes• This led to poor results around 38% fill level, and several %
discrepancy with wet-dry data near 90% fill• June 26: Updated software to use 5 measured modes, and
updated the mode calibration factors• The 6/12 – 6/26 data reported here has been re-processed using
the June 26 software update
Mass Gauging – RF Mass Gauge

23
Comparison of RFMG result with wet-dry data:
RFMG Wet-dry rake
time
% fi
ll
• No correction has been applied to convert wet-dry %-fill by volume to %-fill by mass (small effect)
Mass Gauging – RF Mass Gauge
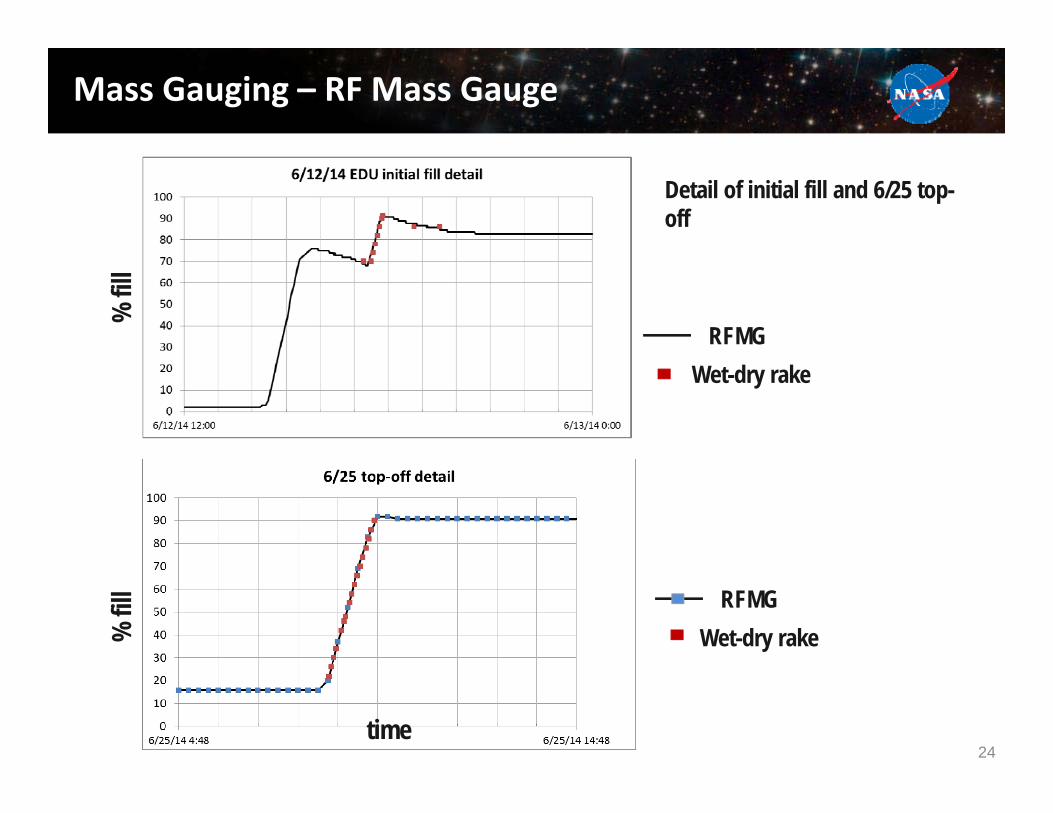
24
RFMGWet-dry rake
RFMGWet-dry rake
Detail of initial fill and 6/25 top-off
time
% fi
ll%
fill
Mass Gauging – RF Mass Gauge

25
RFMGWet-dry rake
Excellent agreement between RFMG and wet-dry rake data
time
% fi
llMass Gauging – RF Mass Gauge

26
Mass Gauging – RF Mass Gauge
-10 -5 0 5 100
5
10
15
20
fill, %
Error histrogram
Comparison of RFMG output with wet‐dry rake:
Mean difference: ‐0.6%STDEV = 2.6%
Wet_Dry – RFMG output, %

27
Reduced Gravity CryoTracker probes:
• CryoTracker instrument was controlled via laptop in instrument area• Control room “mass gauge” computer running Remote Desktop was
used to control and monitor the instrument• CryoTracker software was used to manually switch the probe between T
mode and mass gauging mode• Data was recorded once every 10 s• Unresolved software bug: CryoTracker software had to be restarted
many times throughout testing
Mass Gauging – Reduced Gravity CryoTracker

28
Reduced Gravity CryoTracker
• Data is similar to wet-dry rake• Wet-dry transition points were found manually• 72 wet-dry transition points were identified
Mass Gauging – Reduced Gravity CryoTracker
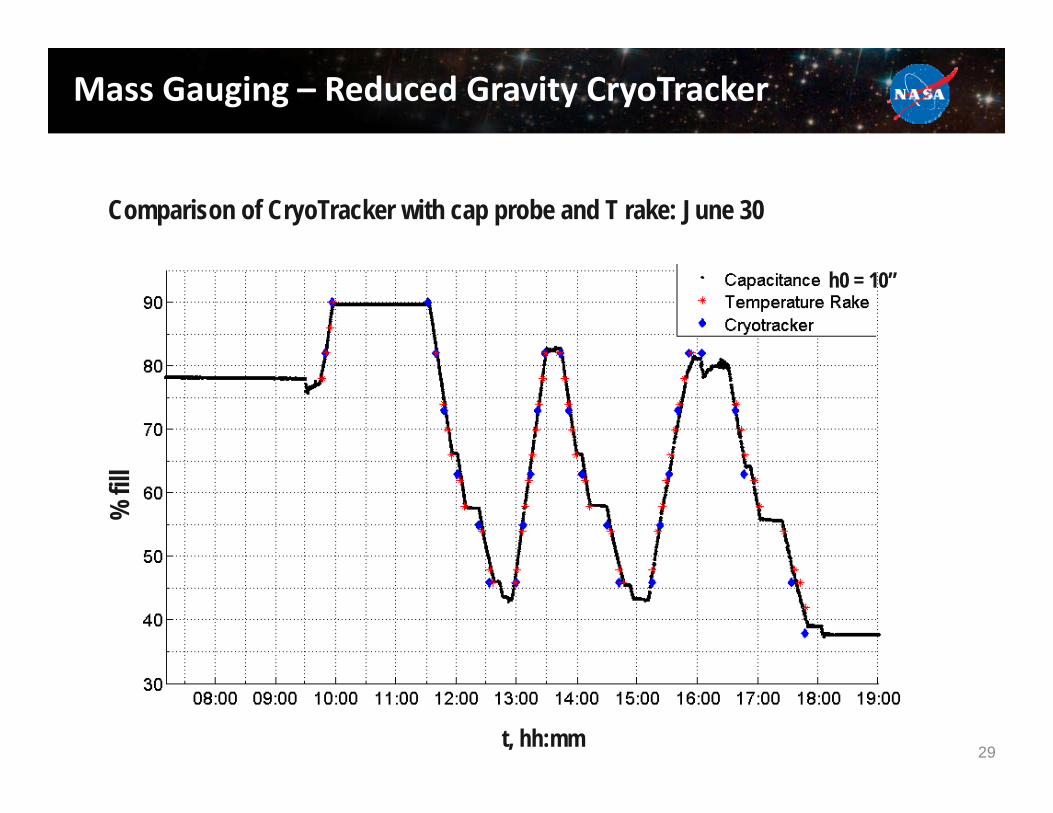
29
% fi
ll
t, hh:mm
h0 = 10”
Comparison of CryoTracker with cap probe and T rake: June 30
Mass Gauging – Reduced Gravity CryoTracker
30
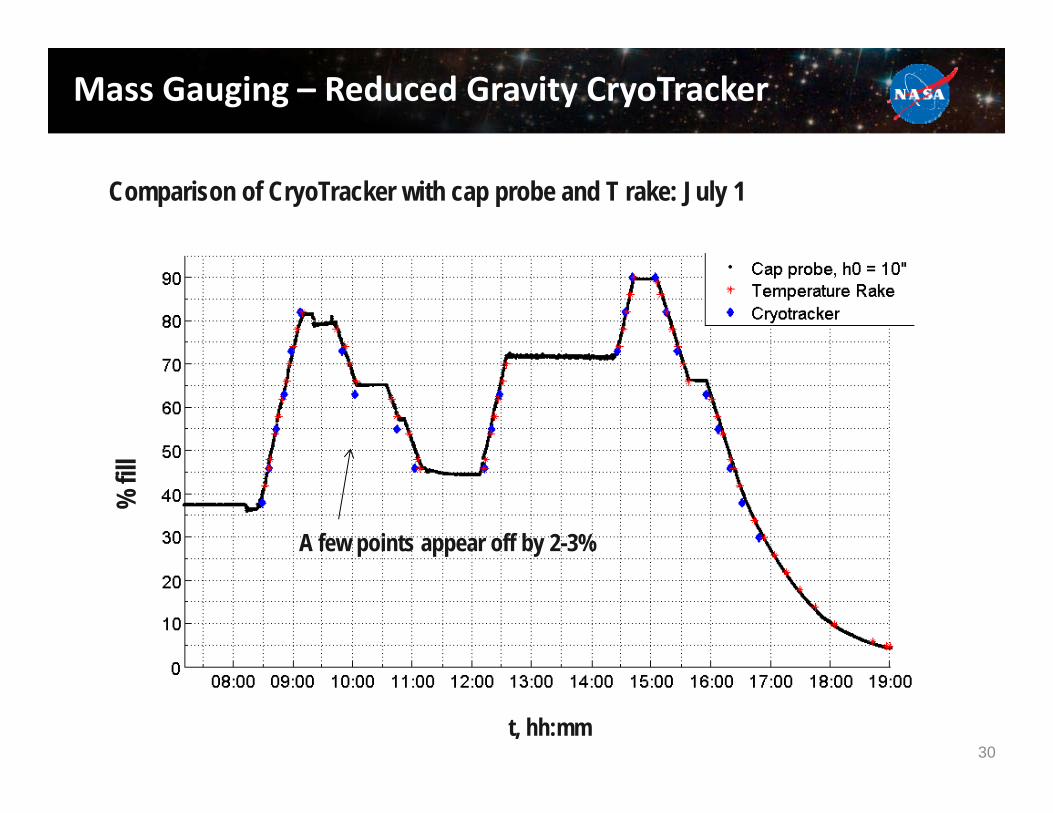
Comparison of CryoTracker with cap probe and T rake: July 1
% fi
ll
t, hh:mm
A few points appear off by 2-3%
Mass Gauging – Reduced Gravity CryoTracker

31
Mass Gauging – Reduced Gravity CryoTracker
-10 -5 0 5 100
2
4
6
8
10
12
14
16
18
20
fill, %
Error histrogram
Mean difference: ‐1.4%STDEV = 2.2%
Comparison of RGCT output with cap‐probe data:

32
Mass Gauging – Comparison of all probes
Initial fill:
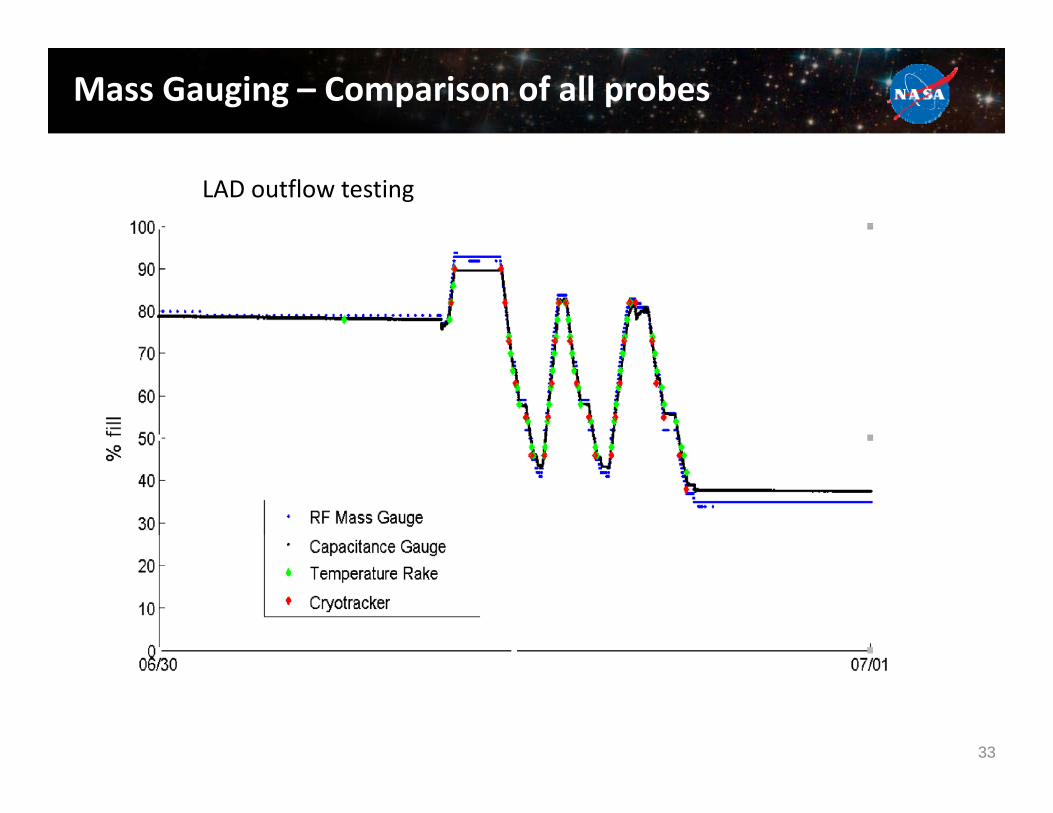
33
Mass Gauging – Comparison of all probes
LAD outflow testing
34
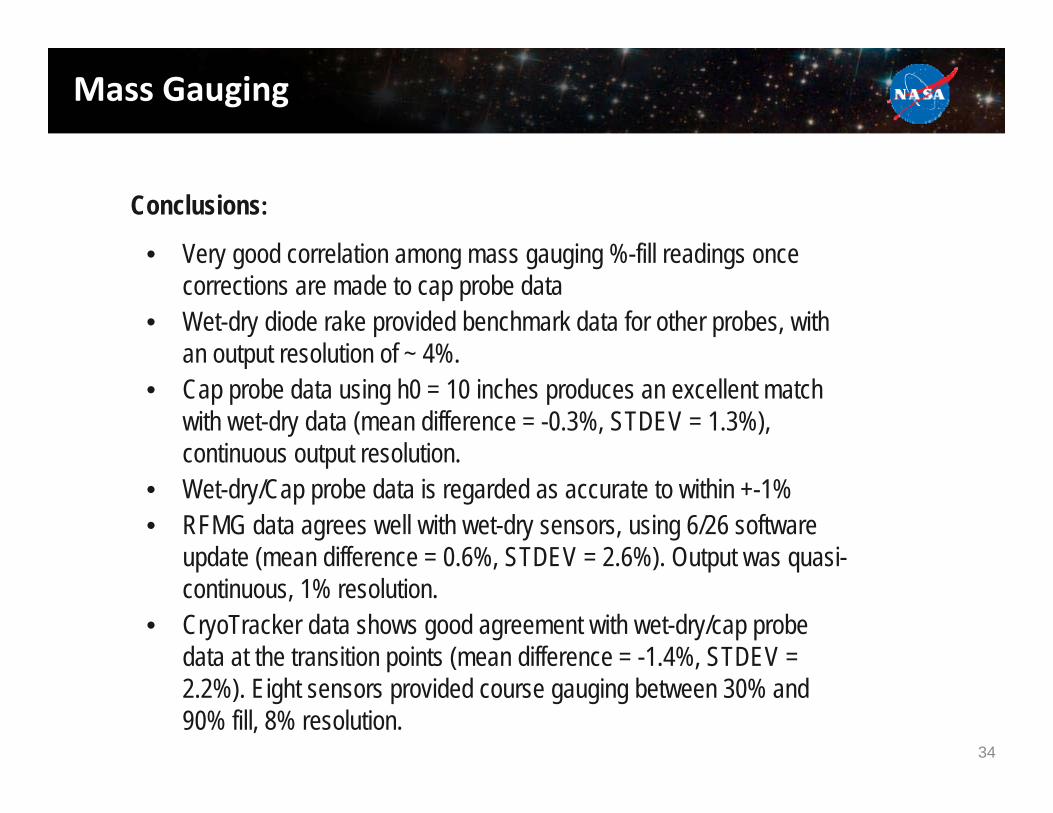
Conclusions:
• Very good correlation among mass gauging %-fill readings once corrections are made to cap probe data
• Wet-dry diode rake provided benchmark data for other probes, with an output resolution of ~ 4%.
• Cap probe data using h0 = 10 inches produces an excellent match with wet-dry data (mean difference = -0.3%, STDEV = 1.3%), continuous output resolution.
• Wet-dry/Cap probe data is regarded as accurate to within +-1%• RFMG data agrees well with wet-dry sensors, using 6/26 software
update (mean difference = 0.6%, STDEV = 2.6%). Output was quasi-continuous, 1% resolution.
• CryoTracker data shows good agreement with wet-dry/cap probe data at the transition points (mean difference = -1.4%, STDEV = 2.2%). Eight sensors provided course gauging between 30% and 90% fill, 8% resolution.
Mass Gauging
Related Documents