Biochemistry 1989, 28, 9293-9305 9293 Evolutionary Optimization of the Catalytic Effectiveness of an Enzyme? Jonathan J. Burbaum,* Ronald T. Raines,g W. John Albery,” and Jeremy R. Knowles* Department of Chemistry, Harvard University, Cambridge, Massachusetts 02138 Received December 21, 1988; Revised Manuscript Received June 16, 1989 ABSTRACT: The kinetic and thermodynamic features of reactions catalyzed by present-day enzymes appear to be the consequence of the evolution of these proteins toward maximal catalytic effectiveness. These features are identified and analyzed (in detail for one substrate-one product enzymes) by using ideas that link the energetics of the reaction catalyzed by an enzyme to the maximization of its catalytic efficiency. A catalytically optimized enzyme will have a value for the “internal” equilibrium constant (Kin,, the equilibrium constant between the substrates and the products of the enzyme when all are bound productively) that depends on how close to equilibrium the enzyme maintains its reaction in vivo. Two classes are apparent. For an enzyme that operates near equilibrium, the catalytic efficiency is sensitive to the value of Kht, and the optimum value of Kin, is near unity. For an enzyme that operates far from equilibrium, the catalytic efficiency is less sensitive to the value of Kint, and Kin, assumes a value that ensures that the rate of the chemical transformation is equal to the rate of product release. In each of these cases, the internal thermodynamics is “dynamically matched”, where the concentrations of substrate- and product-containing complexes are equal at the steady state in vivo. E n z y m e s have been subjected to natural selection as a result of the evolutionary pressures on the organisms that contain them. Thus, to the extent that the survival of the host depends upon a particular chemical transformation, improvements in the efficiency of the enzyme catalyzing that transformation will be selected for. We can, therefore, speak of the evolution of an enzyme analogously to the evolution of a trait of an organism. The primary role of an enzyme is as a catalyst to accelerate the transformation of substrate to product. More efficient enzymes can mediate a higher flux of substrate to product than less efficient enzymes, or can mediate the same flux using fewer enzyme molecules. The catalytic effectiveness of today’s enzymes is remarkable, and rate enhancements of lolo or more (over the acid- or base-catalyzed reaction, for example) are not uncommon. Here, we codify and rationalize such rate enhancements in terms of the binding interactions between an enzyme and its substrates and discuss the changes in these interactions as catalytic effectiveness develops as a consequence of natural selection. This paper expands upon earlier theoretical work (Albery & Knowles, 1976, 1977; Knowles & Albery, 1977) and ela- borates upon those aspects of the theory that can be tested experimentally. The approach of the earlier work is retained, and we examine the kinetic characteristics of an enzyme that-over evolutionary time- has become optimally efficient as a catalyst. The earlier analysis led to several proposals, one of which was that enzymes that maintain their substrates at equilibrium in vivo would exhibit “balanced internal thermodynamics”; that is, the two intermediate states flanking the kinetically significant transition state would have ap- proximately the same free energy. In this case, the “internal” ‘This work was supported by the National Institutes of Health and the National Science Foundation. ‘Present address: Department of Biology, Massachusetts Institute of Technology, Cambridge, MA 021 39. t Present address: Department of Biochemistry, University of Wisconsin-Madison, Madison, WI 53706. 11 Present address: Department of Chemistry, Imperial College of Science and Technology, South Kensington, London, SW7 2AY, U.K. 0006-2960/89/0428-9293$01.50/0 equilibrium constant between these enzyme-bound forms would be close to unity. In the past decade, this proposal has received experimental support from studies on several enzymes, and these data are summarized in the following paper. The scope of the earlier treatment was limited, however, since only those enzymes that maintain their substrates at equilibrium in the cell were de- scribed properly. [In practice this limitation was not exces- sively severe, because most intracellular enzymes do operate close to equilibrium (Rolleston, 1972; Crabtree & Newsholme, 1985; Burbaum & Knowles, 1989).] The problem has been recognized, notably by Chin (1983), who has presented equations for an enzyme that catalyzes a reaction where the concentration of free product is negligible. The question has also been probed and the incompleteness of the earlier work discussed further by Ellington and Benner (1987). Here, we predict the kinetic behavior of an enzyme that has become optimized for catalysis under any given steady-state concentrations of substrate and product. The resulting solution incorporates both the original treatment (Albery & Knowles, 1976, 1977; Knowles & Albery, 1977) and its later amendment (Chin, 1983) and allows us to predict the behavior of enzymes that have become kinetically optimized under any physiological boundary conditions. EVOLUTIONARY SELECTION OF ENZYMES To address the natural selection of enzyme catalysts, we first consider how the survival of the host can depend upon the catalytic effectiveness of a particular enzyme. In an organism, enzymes have unequal stature. Enzymes within a given or- ganism have evolved in response to different pressures because the evolutionary advantage conferred by an increase in cata- lytic effectiveness differs from enzyme to enzyme. Further, within a particular metabolic pathway, enzymes play different roles. There are enzymes that control the flux through the pathway (by altering their kinetic characteristics in response to metabolic changes in the host), and there are enzymes that simply sustain the flux between the control points. While the fitness or efficiency of control enzymes is difficult to define, 0 1989 American Chemical Society

Welcome message from author
This document is posted to help you gain knowledge. Please leave a comment to let me know what you think about it! Share it to your friends and learn new things together.
Transcript

Biochemistry 1989, 28, 9293-9305 9293
Evolutionary Optimization of the Catalytic Effectiveness of an Enzyme?
Jonathan J. Burbaum,* Ronald T. Raines,g W. John Albery,” and Jeremy R. Knowles* Department of Chemistry, Harvard University, Cambridge, Massachusetts 02138
Received December 21, 1988; Revised Manuscript Received June 16, 1989
ABSTRACT: The kinetic and thermodynamic features of reactions catalyzed by present-day enzymes appear to be the consequence of the evolution of these proteins toward maximal catalytic effectiveness. These features a re identified and analyzed (in detail for one substrate-one product enzymes) by using ideas that link the energetics of the reaction catalyzed by an enzyme to the maximization of its catalytic efficiency. A catalytically optimized enzyme will have a value for the “internal” equilibrium constant (Kin,, the equilibrium constant between the substrates and the products of the enzyme when all are bound productively) that depends on how close to equilibrium the enzyme maintains its reaction in vivo. Two classes are apparent. For an enzyme that operates near equilibrium, the catalytic efficiency is sensitive to the value of Kht, and the optimum value of Kin, is near unity. For an enzyme that operates far from equilibrium, the catalytic efficiency is less sensitive to the value of Kint, and Kin, assumes a value that ensures that the rate of the chemical transformation is equal to the rate of product release. In each of these cases, the internal thermodynamics is “dynamically matched”, where the concentrations of substrate- and product-containing complexes are equal at the steady state in vivo.
E n z y m e s have been subjected to natural selection as a result of the evolutionary pressures on the organisms that contain them. Thus, to the extent that the survival of the host depends upon a particular chemical transformation, improvements in the efficiency of the enzyme catalyzing that transformation will be selected for. We can, therefore, speak of the evolution of an enzyme analogously to the evolution of a trait of an organism. The primary role of an enzyme is as a catalyst to accelerate the transformation of substrate to product. More efficient enzymes can mediate a higher flux of substrate to product than less efficient enzymes, or can mediate the same flux using fewer enzyme molecules. The catalytic effectiveness of today’s enzymes is remarkable, and rate enhancements of lolo or more (over the acid- or base-catalyzed reaction, for example) are not uncommon. Here, we codify and rationalize such rate enhancements in terms of the binding interactions between an enzyme and its substrates and discuss the changes in these interactions as catalytic effectiveness develops as a consequence of natural selection.
This paper expands upon earlier theoretical work (Albery & Knowles, 1976, 1977; Knowles & Albery, 1977) and ela- borates upon those aspects of the theory that can be tested experimentally. The approach of the earlier work is retained, and we examine the kinetic characteristics of an enzyme that-over evolutionary time- has become optimally efficient as a catalyst. The earlier analysis led to several proposals, one of which was that enzymes that maintain their substrates at equilibrium in vivo would exhibit “balanced internal thermodynamics”; that is, the two intermediate states flanking the kinetically significant transition state would have ap- proximately the same free energy. In this case, the “internal”
‘This work was supported by the National Institutes of Health and the National Science Foundation.
‘Present address: Department of Biology, Massachusetts Institute of Technology, Cambridge, MA 021 39.
t Present address: Department of Biochemistry, University of Wisconsin-Madison, Madison, WI 53706.
11 Present address: Department of Chemistry, Imperial College of Science and Technology, South Kensington, London, SW7 2AY, U.K.
0006-2960/89/0428-9293$01.50/0
equilibrium constant between these enzyme-bound forms would be close to unity.
In the past decade, this proposal has received experimental support from studies on several enzymes, and these data are summarized in the following paper. The scope of the earlier treatment was limited, however, since only those enzymes that maintain their substrates at equilibrium in the cell were de- scribed properly. [In practice this limitation was not exces- sively severe, because most intracellular enzymes do operate close to equilibrium (Rolleston, 1972; Crabtree & Newsholme, 1985; Burbaum & Knowles, 1989).] The problem has been recognized, notably by Chin (1983), who has presented equations for an enzyme that catalyzes a reaction where the concentration of free product is negligible. The question has also been probed and the incompleteness of the earlier work discussed further by Ellington and Benner (1987).
Here, we predict the kinetic behavior of an enzyme that has become optimized for catalysis under any given steady-state concentrations of substrate and product. The resulting solution incorporates both the original treatment (Albery & Knowles, 1976, 1977; Knowles & Albery, 1977) and its later amendment (Chin, 1983) and allows us to predict the behavior of enzymes that have become kinetically optimized under any physiological boundary conditions.
EVOLUTIONARY SELECTION OF ENZYMES
To address the natural selection of enzyme catalysts, we first consider how the survival of the host can depend upon the catalytic effectiveness of a particular enzyme. In an organism, enzymes have unequal stature. Enzymes within a given or- ganism have evolved in response to different pressures because the evolutionary advantage conferred by an increase in cata- lytic effectiveness differs from enzyme to enzyme. Further, within a particular metabolic pathway, enzymes play different roles. There are enzymes that control the flux through the pathway (by altering their kinetic characteristics in response to metabolic changes in the host), and there are enzymes that simply sustain the flux between the control points. While the fitness or efficiency of control enzymes is difficult to define,
0 1989 American Chemical Society

9294 Biochemistry, Vol. 28, No. 24, 1989 Burbaum et al.
*2 Scheme I: Simplest Kinetic Pathway for the Enzyme-Catalyzed Interconversion of a Single Substrate, S, and a Single Product, Po
'In this scheme, there are three steps, the binding of substrate (step l ) , the conversion of substrate to product (step 2), and the release of product (step 3 ) .
since we normally lack an adequate knowledge of the con- trolling variables and of the enzyme's sensitivity to them, the effectiveness of enzymes that have no control function can be judged more easily. More efficient enzymes carry a greater flux,' and an increase in the catalytic efficiency of an enzyme may improve the competitive edge of the host organism. We first direct our discussion toward those enzymes (the clear majority) that mediate the metabolic flux between control points and later consider the catalytic effectiveness of the enzymes at these control points.
The simplest kinetic mechanism for the enzyme-catalyzed interconversion of a single substrate, S, and a single product, P, is shown in Scheme I, where the Michaelis complex with substrate, E&, is converted into the Michaelis complex with product, E.P, in a single chemical step.* In the original formulation (Albery & Knowles, 1976, 1977; Knowles & Albery, 1977), improvements in the catalytic efficiency of an enzyme were treated in terms of changes in the binding of the various intermediates and transition states along the reaction pathway. Mutations in the enzyme leading to changes in binding were grouped into three classes according to the level of discrimination (between different reaction intermediates or between an intermediate and a transition state) effected by the change. It was postulated that the first and least discriminating class of catalytic mutations would affect the binding of all bound species equally. As illustrated in Figure I A,3 such mutations would therefore change the free energies
' There are, of course, more features to the suitability of an enzyme for a particular metabolic purpose than mere flux, all of which may be refined by natural selection. According to Darwin ( l872) , "...natural selection is continually trying to economise every part of the org- anisation." Thus, if an organism were able to produce a smaller protein having the same catalytic properties, or an enzyme of longer in vivo half-life, the organism would presumably profit somewhat from this economy. Likewise, if an organism produced an enzyme that channeled an unstable metabolic intermediate directly to the downstream enzyme, the organism would enjoy an advantage over one with a less refined enzyme that liberated its product into solution. This point has been expressed as a concern with our original treatment (Srivastava & Bern- hard, 1987), but the present development remains unchanged in this respect. Since the intracellular concentrations of enzymes are high, one might expect that many intermediary metabolites are complexed to their enzymes rather than free and that direct substrate transfer between enzymes may be a common occurrence. Yet this possibility does not contradict any of the qualitative arguments presented; there is no as- sumption in any derivation that [E] < [SI or [PI.
* There may be some concern that these simplifications reduce the generality of what follows, in that most enzyme-catalyzed reactions in- volve more than one substrate and/or product and more than three elementary steps. Yet we may conflate elementary steps, algebraically by the use of net rate constants and illustratively by the omission of kinetically insignificant intermediates and transition states, so that Scheme I approximates the more complex reality of actual systems. Indeed, to treat more complex situations in the first instance would be to complicate the discussion gratuitously.
A
E
P + E E 4
free free - - bound - - 6 states states states - -
B
C
Uniform Binding
Differential Binding
Catalysis of an
Elementary Step
FIGURE 1: Kinetic barrier diagram3 illustrating the three types of binding interaction between an enzyme and its substrates: (A) uniform binding, in which all bound states are bound more tightly or less tightly with respect to the free states; (B) differential binding, in which the substrate, S, and the product, P, are bound by the enzyme with different avidities; (C) catalysis of a n elementary step, in which the transition state for the interconversion of enzyme-bound S and P is bound more strongly than S or P itself.
of the "bound states" (E& E.P, and transition state 2) with respect to the "free states" (E + S , transition state 1, transition state 3, and E + P). Since these changes affect the binding of all bound states identically, this theme was called uniform binding (Albery & Knowles, 1976, 1977; Knowles & Albery, 1977). In the case of triosephosphate isomerase, for example, the substrate dihydroxyacetone phosphate, the product gly-
Kinetic discussions such as that developed in this paper can be conducted in several ways. We have chosen to navigate between the Scylla of pure algebra and the Charybdis of qualitative illustrations. In the illustration of the kinetics of enzyme-catalyzed reactions, there are several problems: for example, how do we represent first-order rate processes and second-order rate processes on the same diagram?; how can we illustrate the kinetic barriers that the enzyme experiences as it turns over again and again?; and how should we show that the ambient levels of the enzyme's substrates and products can be far from their equilibrium values, being defined by the relative activities of the enzymes upstream and downstream in the metabolic sequence? These problems have led us to use kinetic barrier diagrams rather than classical free energy profiles in this paper. In these diagrams, we write all second-order rate constants as pseudo-first-order rate constants by including the actual ambient substrate concentrations. All these rate constants (each having the units of s-I) are now collected in a plot the ordinate axis of which is log I l k (where k is a first-order or a pseudo-first-order rate constant) that quantitates the kinetic barrier to a particular transformation. The construction, utility, and meaning of kinetic barrier diagrams are further described in Appendix I.
Evolutionary Optimization of Catalytic Effectiveness
ceraldehyde phosphate, and the intermediate enediol, as well as the two catalytic transition states, are all phosphate mo- noesters. A simple change in the enzyme’s affinity for phosphate monoesters would affect the free energy of all the bound states relative to all the free states, and such a change was classified as a uniform-binding change.
The second class of mutations that was proposed is more subtle and would allow the enzyme to distinguish between two bound states. For example, in the triosephosphate isomerase reaction, dihydroxyacetone phosphate contains a carbonyl group at C-2 that is transformed into a hydroxyl group in the product glyceraldehyde phosphate. A mutation that places a hydrogen-bond acceptor near C-2 will stabilize the product but not the substrate, thereby changing the binding of the substrates differentially. Such mutations alter the free energy of E.P with respect to E 4 as shown in Figure 1B.4 Since these changes affect the affinity of the enzyme for substrate and for product differently, this theme was called differential binding (Albery & Knowles, 1976, 1977; Knowles & Albery, 1977).
The third class of change that was suggested would be the most sophisticated, in that the enzyme would differentiate among species that are very similar in structure, namely, a transition state and the two intermediates that flank it. Mutations in this class would alter the free energy of transition state 2 with respect to those of E.P and EeS, as shown in Figure 1C. This type of interaction is equivalent to the view originally put forward by Haldane (1930) [and later developed by Pauling (1946, 1948), Jencks (1980), and others] in allowing the enzyme to bind the transition state more tightly than either of the flanking ground states. This theme was called catalysis of an elementary step (Albery & Knowles, 1976, 1977; Knowles & Albery, 1977).
The binding interactions outlined above are classified by an increasing level of structural discernment, and we suggested that the probability that a random amino acid change in an enzyme would effect a particular change was lower the greater the subtlety of the change. Indiscriminate effects on the relative free energy of all bound species seem to be the most probable, a priori, and these will lead to the optimization of uniform binding. A less probable mutational event will be one that allows the protein to distinguish between substrate and product, and we therefore expect the differential binding will become optimized more slowly. Finally, the most discrimi- nating change will be one that allows the enzyme to recognize the fine structural and electronic differences between a tran- sition state and the ground states that flank it. We presumed that such a change would be the least probable and suggested that catalysis of an elementary step would be the last event in the time scale of the evolution of a catalyst. Although these three types of binding interaction are easily distinguished, we do not expect that this classification restricts the evolution of an enzyme in any way. The evolution of each enzyme will surely be idiosyncratic and involve a blend of the three pro- cesses described.
THE METABOLIC NICHE In any living cell, the concentrations of most metabolites
are maintained within rather narrow limits, and metabolic control is exercised by changes in the flux through metabolic pathways rather than by changes in the concentrations of the
The only effect on transition-state binding would be as a consequence of a free energy relationship of the Hammett or Brernsted type. Changes in the relative free energies of E 8 and ESP would be partially reflected in changes in the relative free energy of the transition state (see Figure 1B).
Biochemistry, Vol. 28, No. 24, 1989 9295
metabolites themsel~es.~ As organisms evolved, it is obvious that changes occurred both in the levels of metabolites and in the ability of the enzymes to handle those levels, and that such incremental improvements brought us to the state that we can now observe. If we want to define the fitness or the effectiveness of an enzyme, however, we must first define the milieu in which the enzyme operates, and this requires that we specify not only the relatively trivial parameters of pH, temperature, ionic strength, viscosity, etc. but also the critical parameters of substrate and product concentration. Throughout this work, we take the existing concentrations of substrate and product as fixed parameters that define the metabolic niche in which the enzyme operates and ask how effectively it performs in that particular environment.
There are two aspects of the substrate and product con- centrations that must concern us. First, the absolute con- centrations must be known, to establish how far the enzyme is from saturation. Second, the relative concentrations of S and P must be known, so that the actual value of [S]/[P] can be compared with the equilibrium ratio, [S],/[P], (where [SI and [PI are the actual in vivo concentrations of substrate and product, respectively, and [SI, and [PI, are the equi- librium concentrations of substrate and product, respectively). This comparison shows whether the enzyme of interest man- ages to maintain its substrates and products at equilibrium.
At the steady state, the enzyme catalyzing each step in a metabolic pathway mediates the same net flux of metabolites6 An enzyme is said to operate “at equilibrium” if, in vivo, it catalyzes the interconversion of S and P much faster than P reacts to form downstream products. On the other hand, an enzyme is said to operate “off-equilibrium” if it cannot maintain S and P at their equilibrium values. Thus, the consumption of P by the downstream enzymes may be so rapid that the target enzyme cannot maintain S and P at equilibrium, and the steady-state concentration of P will then be lower than that predicted from [SI and the value of the equilibrium constant, K,. Alternatively, the production of S by the up- stream enzymes may be so rapid that the target enzyme cannot achieve equilibrium of S and P, and the steady-state concen- tration of S will then be higher than that predicted from [PI and K,. As a measure of the enzyme’s ability to equilibrate S and P, we define the parameter 8 as
where 8 = ([PI / [SI /Keq) (1)
(2) When 8 equals 1, S and P are at equilibrium and there is no net flux from S to P. On the other hand, when 8 is near 0, either the upstream reactions in the pathway produce S so rapidly that its steady-state concentration is large and [P]/[S]
Kq = [PI eq/ [SI eq
Indeed, the viability of the cell in a changing environment is main- tained primarily by altering the fluxes through its various metabolic pathways. In general, the concentration levels of metabolites remain steady while the fluxes adjust to handle a changed substrate supply or an altered metabolic state (Newsholme & Start, 1972; Albery & Knowles, 1976).
Strictly speaking, this statement is true only of unbranched path- ways, that is, in regions of metabolism where the substrate is supplied by one enzyme and the product is consumed by one enzyme. For this reason, a careful definition of flux is needed. For example, in glycolysis, in which a six-carbon hexose bisphosphate is cleaved into two three- carbon triose phosphates that are interconverted, the enzyme that in- terconverts the two three-carbon units (triosephosphate isomerase) must maintain a flux of three-carbon molecules equal to the flux of six-carbon molecules through the preceding enzyme (aldolase) even though the subsequent enzymes (glyceraldehyde phosphate dehydrogenase et seq.) must maintain twice the flux of three-carbon molecules.

9296
< Kq, or the downstream reactions remove P so quickly that its concentration is small and, again, [P]/[S] < Kq. In reality, of course, the enzymes in the metabolic pathways of living cells neither completely succeed nor totally fail to equilibrate their substrates and products. Rather, the value of 8 for each re- action in a pathway is always greater than 0 (because the concentration of S is never infinite, nor is the concentration of P ever zero) and less than 1 (because there will always be some net flux of metabolites through each reaction in the pathway).’ For most metabolic sequences, neither the sub- strate concentration nor the product concentration changes significantly, even though the flux through the pathway may change dramatically. The value of 8 is therefore roughly constant and characterizes the metabolic niche occupied by the enzyme.
We may classify an enzyme on the basis of the value of 6’ for its metabolic niche. In glycolysis, for example, 7 of the 10 enzymes are essentially at equilibrium, and each has a value of 6’ close to 1 (Williamson, 1965). The remaining three enzymes (hexokinase, phosphofructokinase, and pyruvate kinase) are off-equilibrium systems, and each of these has a value of 8 of less than 10”. These three enzymes lie at control points of the glycolytic pathway. Indeed, an enzyme at a control point must operate under off-equilibrium conditions, otherwise no control of metabolic flux could be exercised (Hess, 1963, 1973; Biicher & Russman, 1964). In gluconeogenesis, the carbon flux is in the direction opposite that of glycolysis. Those enzymes that operate close to equilibrium in glycolysis perform the same functions in gluconeogenesis, and only slight kinetic differences between the isozymes used in glycolysis and in gluconeogenesis can be discerned. In contrast, the enzymes that operate far from equilibrium in glycolysis (and which control the flux through this pathway) are replaced in glu- coneogenesis by enzymes that perform different chemistry. Thus, phosphofructokinase of the glycolytic pathway is re- placed in gluconeogenesis by fructose 1,6-bisphosphatase, and pyruvate kinase in glycolysis is replaced in gluconeogenesis by the pair of enzymes pyruvate carboxylase and phosphoe- nolpyruvate carboxykinase. These changes in chemistry at the control points allow glycolysis to proceed in one tissue and gluconeogenesis to dominate in another, without drastic changes in the in vivo concentrations of the intermediary metabolites. The control enzymes in both pathways (because of the change in chemistry) have values of 6’ of less than 1.
Implicit in the construction of kinetic barrier diagrams (see footnote 3 and Appendix I) is the repesentation of how close the enzyme is to equilibrium, as expressed by 6’. For a system at equilibrium (6’ = l) , the levels of E + S and E + P are the same, as shown in Figure 2A.* In this figure we have drawn a second turnover using dashed lines, which allows us to vis- ualize all three of the catalytic cycles of the enzyme: E + Sa
Biochemistry, Vol. 28, No. 24, 1989
to E + Sb, E*Sa to E&, and ESP, to NOW, if the
Burbaum et al.
’ Not all enzymes lie along well-defined metabolic pathways. For example, digestive or detoxifying enzymes have such a broad substrate specificity that pinpointing the “natural” reaction is hopeless. Further, some enzymes (such as creatine kinase) catalyze reactions whose sub- strates are not used elsewhere in metabolism. It must also be noted that in a dynamic system such as a living cell oscillations about an equilibrium value are possible (Stengers & Prigogine, 1984). Since such oscillations, if present, occur on a much shorter time scale than evolutionary selection, the effective value of 6’ is unity, as in the equilibrium model.
* This fact is evident from the equivalence of the rates of the forward and back reactions at equilibrium. The overall second-order reaction rate of E + S - E + P is [S],(k,,+/K,,,+) and the overall second-order reaction rate of E + P - E + S is
Where necessary, we distinguish between successive enzyme turn- overs by subscript letters.
A At
Equilibrium (0 = 1m
. . . . . . . . . . . , . ,
E E-Sa E*Pa E + + Sa
B
( o < e < 1)
Off - Equilibrium
C Effectively Irreversible n
FIGURE 2: Kinetic barrier diagrams illustrating the consequences of the target enzyme being unable to maintain S and P at equilibrium, as expressed by the parameter 8: (A) equilibrium case, where [P]/[S] = [PI /[SI ; (B) slightly off-equilibrium case, where [P]/[S] < [PI,/%],; T C ) effectively irreversible case, where [P]/[S] <<
metabolic niche in which the enzyme finds itself is one where [p] / [ s ] < [p],9/[s]q (that is, a niche for which 8 < 1: eq 1 and 2), the situation becomes that shown in Figure 2B. Effectively, the level of the second turnover is lower than the first, the drop corresponding to l/8, as illustrated by the vertical arrow. This figure shows a particularly useful feature of kinetic barrier diagrams, that the kinetic partitioning of the free enzyme E (reacting forward with Sb or reacting back with Pa, Figure 2A,B) is explicit in the diagram.1° When 8 is less than 1, the actual value of [P]/[S] experienced by the enzyme is less than the equilibrium ratio [P]q/[S], and the free enzyme partitions more strongly forward (in Figure 2B) than would be the case at equilibrium (in Figure 2A). Finally, as 6’ approaches 0, the second catalytic cycle becomes completely unimportant (since product is released at very low concen- tration), as shown in Figure 2C.
THE RATE EXPRESSION AND THE CORRESPONDING KINETIC BARRIER DIAGRAMS
To discuss the catalytic effectiveness of an enzyme, we must describe the kinetic barriers to the enzyme-catalyzed trans- formation, for which we define the function y (Albery & Knowles, 1976, 1977)
(3)
[PI,/[Sl,.
Y = ((1 - el,,,,,)/^
l o The first kinetic barrier in the back reaction of E + P, is represented by k_,[P], and the first kinetic barrier in the forward reaction of E + Sb is represented by k , [SI.
Evolutionary Optimization of Catalytic Effectiveness
A
E E*S ESP E
S P + +
(terms in K:/& S, from eq 7)
C (terms in B/kCat ,
from eq 8)
. . . L_
E E-Sa E*P, E E E.Sb E*Pb E + + + + Sa 'a 'b 'b
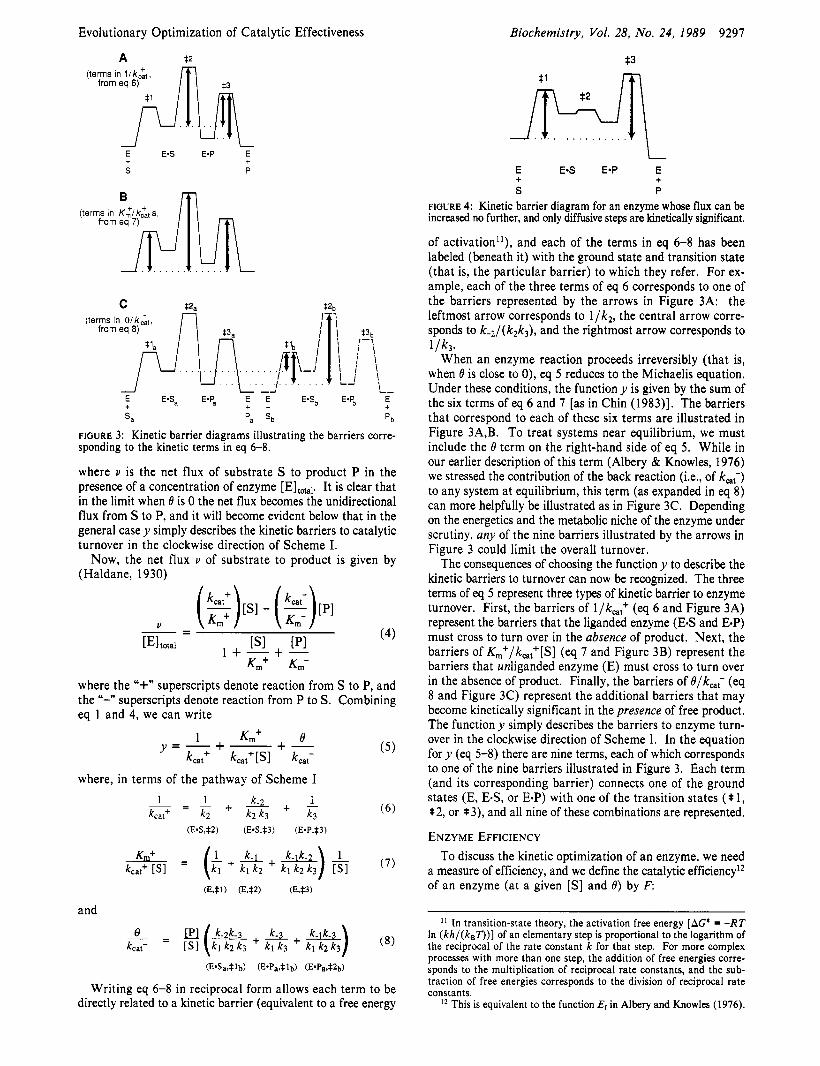
FIGURE 3: Kinetic barrier diagrams illustrating the barriers corre- sponding to the kinetic terms in eq 6-8.
where v is the net flux of substrate S to product P in the presence of a concentration of enzyme [Eltotal. It is clear that in the limit when 6 is 0 the net flux becomes the unidirectional flux from S to P, and it will become evident below that in the general case y simply describes the kinetic barriers to catalytic turnover in the clockwise direction of Scheme I.
Now, the net flux u of substrate to product is given by (Haldane, 1930)
where the "+" superscripts denote reaction from S to P, and the "-" superscripts denote reaction from P to S . Combining eq 1 and 4, we can write
6 + - 1 K m + y = - + - kcat+ kcat+[SI kcat-
where, in terms of the pathway of Scheme I
(5)
and
(E.Sa,*lb) (E.Pa,*lb) (E*Pa,SZb)
Writing eq 6-8 in reciprocal form allows each term to be directly related to a kinetic barrier (equivalent to a free energy
Biochemistry, Vof. 28, No. 24, 1989 9291
$3
L
E €4 E*P E
S P
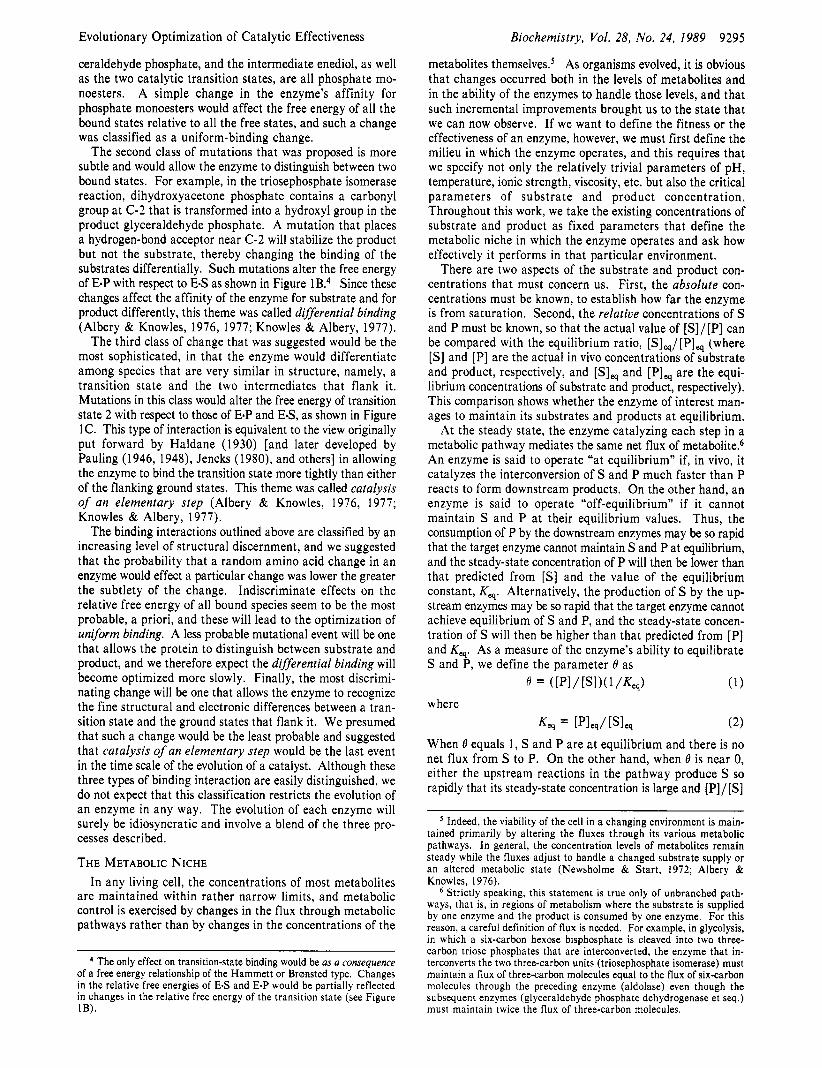
FIGURE 4: Kinetic barrier diagram for an enzyme whose flux can be increased no further, and only diffusive steps are kinetically significant.
of activation"), and each of the terms in eq 6-8 has been labeled (beneath it) with the ground state and transition state (that is, the particular barrier) to which they refer. For ex- ample, each of the three terms of eq 6 corresponds to one of the barriers represented by the arrows in Figure 3A: the leftmost arrow corresponds to l/k2, the central arrow corre- sponds to k-2/(k2k3), and the rightmost arrow corresponds to
When an enzyme reaction proceeds irreversibly (that is, when 6 is close to 0), eq 5 reduces to the Michaelis equation. Under these conditions, the function y is given by the sum of the six terms of eq 6 and 7 [as in Chin (1983)l. The barriers that correspond to each of these six terms are illustrated in Figure 3A,B. To treat systems near equilibrium, we must include the 6 term on the right-hand side of eq 5. While in our earlier description of this term (Albery & Knowles, 1976) we stressed the contribution of the back reaction (i.e., of kat-) to any system at equilibrium, this term (as expanded in eq 8) can more helpfully be illustrated as in Figure 3C. Depending on the energetics and the metabolic niche of the enzyme under scrutiny, any of the nine barriers illustrated by the arrows in Figure 3 could limit the overall turnover.
The consequences of choosing the function y to describe the kinetic barriers to turnover can now be recognized. The three terms of eq 5 represent three types of kinetic barrier to enzyme turnover. First, the barriers of l/k,,+ (eq 6 and Figure 3A) represent the barriers that the liganded enzyme ( E 4 and ESP) must cross to turn over in the absence of product. Next, the barriers of K,+/k,?[S] (eq 7 and Figure 3B) represent the barriers that unliganded enzyme (E) must cross to turn over in the absence of product. Finally, the barriers of 6/k,; (eq 8 and Figure 3C) represent the additional barriers that may become kinetically significant in the presence of free product. The function y simply describes the barriers to enzyme turn- over in the clockwise direction of Scheme I . In the equation for y (eq 5-8) there are nine terms, each of which corresponds to one of the nine barriers illustrated in Figure 3. Each term (and its corresponding barrier) connects one of the ground states (E, E-S, or E.P) with one of the transition states ( * 1, $2, or *3), and all nine of these combinations are represented.
ENZYME EFFICIENCY To discuss the kinetic optimization of an enzyme, we need
a measure of efficiency, and we define the catalytic efficiency12 of an enzyme (at a given [SI and 0) by F
+ +
I ' In transition-state theory, the activation free energy [AG' = -RT In (kh/(k,T))] of an elementary step is proportional to the logarithm of the reciprocal of the rate constant k for that step. For more complex processes with more than one step, the addition of free energies corre- sponds to the multiplication of reciprocal rate constants, and the sub- traction of free energies corresponds to the division of reciprocal rate constants.
l 2 This is equivalent to the function El in Albery and Knowles (1976).
9298 Biochemistry, Vol. 28, No. 24, 1989 Burbaum et al.
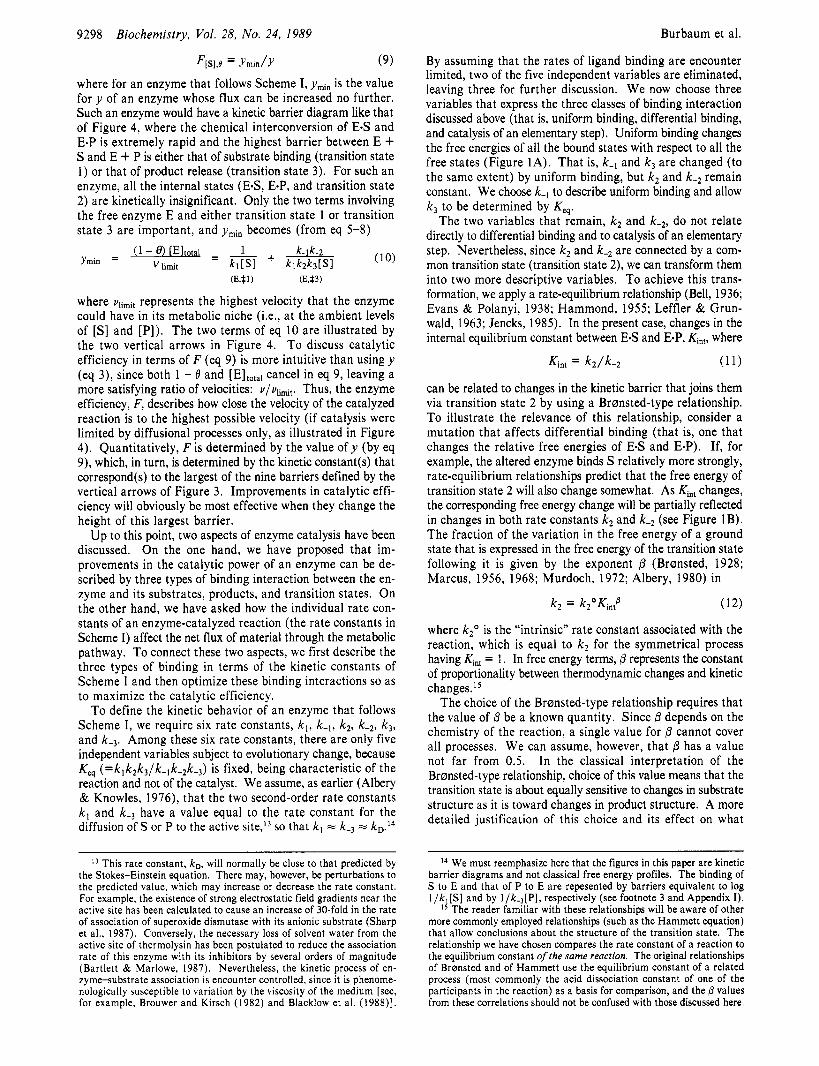
where for an enzyme that follows Scheme I, ymin is the value for y of an enzyme whose flux can be increased no further. Such an enzyme would have a kinetic barrier diagram like that of Figure 4, where the chemical interconversion of E-S and ESP is extremely rapid and the highest barrier between E + S and E + P is either that of substrate binding (transition state 1) or that of product release (transition state 3). For such an enzyme, all the internal states (E-S, ESP, and transition state 2) are kinetically insignificant. Only the two terms involving the free enzyme E and either transition state 1 or transition state 3 are important, and ymin becomes (from eq 5-8)
(EA 1) (E.S3)
where vlimit represents the highest velocity that the enzyme could have in its metabolic niche (Le., at the ambient levels of [SI and [PI). The two terms of eq 10 are illustrated by the two vertical arrows in Figure 4. To discuss catalytic efficiency in terms of F (eq 9) is more intuitive than using y (eq 3), since both 1 - 0 and [Eltotal cancel in eq 9, leaving a more satisfying ratio of velocities: u/vlimit. Thus, the enzyme efficiency, F, describes how close the velocity of the catalyzed reaction is to the highest possible velocity (if catalysis were limited by diffusional processes only, as illustrated in Figure 4). Quantitatively, F is determined by the value of y (by eq 9), which, in turn, is determined by the kinetic constant(s) that correspond(s) to the largest of the nine barriers defined by the vertical arrows of Figure 3. Improvements in catalytic effi- ciency will obviously be most effective when they change the height of this largest barrier.
Up to this point, two aspects of enzyme catalysis have been discussed. On the one hand, we have proposed that im- provements in the catalytic power of an enzyme can be de- scribed by three types of binding interaction between the en- zyme and its substrates, products, and transition states. On the other hand, we have asked how the individual rate con- stants of an enzyme-catalyzed reaction (the rate constants in Scheme I) affect the net flux of material through the metabolic pathway. To connect these two aspects, we first describe the three types of binding in terms of the kinetic constants of Scheme I and then optimize these binding interactions so as to maximize the catalytic efficiency.
To define the kinetic behavior of an enzyme that follows Scheme I, we require six rate constants, k , , k-,, k2, k-,, k3, and k-3. Among these six rate constants, there are only five independent variables subject to evolutionary change, because Keq ( = k l k2k3/k- , k-,k-,) is fixed, being characteristic of the reaction and not of the catalyst. We assume, as earlier (Albery & Knowles, 1976), that the two second-order rate constants k , and k..3 have a value equal to the rate constant for the diffusion of S or P to the active site,I3 so that k , i= k-3 i= kD.I4
By assuming that the rates of ligand binding are encounter limited, two of the five independent variables are eliminated, leaving three for further discussion. We now choose three variables that express the three classes of binding interaction discussed above (that is, uniform binding, differential binding, and catalysis of an elementary step). Uniform binding changes the free energies of all the bound states with respect to all the free states (Figure 1A). That is, k-, and k3 are changed (to the same extent) by uniform binding, but k2 and k-2 remain constant. We choose k-l to describe uniform binding and allow k, to be determined by Kq.
The two variables that remain, k2 and k-2, do not relate directly to differential binding and to catalysis of an elementary step. Nevertheless, since k2 and k-, are connected by a com- mon transition state (transition state 2), we can transform them into two more descriptive variables. To achieve this trans- formation, we apply a rate-equilibrium relationship (Bell, 1936; Evans & Polanyi, 1938; Hammond, 1955; Leffler & Grun- wald, 1963; Jencks, 1985). In the present case, changes in the internal equilibrium constant between E-S and EaP, Kintr where
can be related to changes in the kinetic barrier that joins them via transition state 2 by using a Brernsted-type relationship. To illustrate the relevance of this relationship, consider a mutation that affects differential binding (that is, one that changes the relative free energies of E-S and E-P). If, for example, the altered enzyme binds S relatively more strongly, rate-equilibrium relationships predict that the free energy of transition state 2 will also change somewhat. As Kht changes, the corresponding free energy change will be partially reflected in changes in both rate constants k , and k-, (see Figure 1B). The fraction of the variation in the free energy of a ground state that is expressed in the free energy of the transition state following it is given by the exponent p (Bransted, 1928; Marcus, 1956, 1968; Murdoch, 1972; Albery, 1980) in
k2 = kZ0Kin? (12)
where k20 is the “intrinsic” rate constant associated with the reaction, which is equal to k2 for the symmetrical process having Ki, = 1. In free energy terms, p represents the constant of proportionality between thermodynamic changes and kinetic changes.
The choice of the Brernsted-type relationship requires that the value of p be a known quantity. Since depends on the chemistry of the reaction, a single value for p cannot cover all processes. We can assume, however, that p has a value not far from 0.5. In the classical interpretation of the Brernsted-type relationship, choice of this value means that the transition state is about equally sensitive to changes in substrate structure as it is toward changes in product structure. A more detailed justification of this choice and its effect on what
l 3 This rate constant, ko, will normally be close to that predicted by the Stokes-Einstein equation. There may, however, be perturbations to the predicted value, which may increase or decrease the rate constant. For example, the existence of strong electrostatic field gradients near the active site has been calculated to cause an increase of 30-fold in the rate of association of superoxide dismutase with its anionic substrate (Sharp et al., 1987). Conversely, the necessary loss of solvent water from the active site of thermolysin has been postulated to reduce the association rate of this enzyme with its inhibitors by several orders of magnitude (Bartlett & Marlowe, 1987). Nevertheless, the kinetic process of en- zyme-substrate association is encounter controlled, since it is phenome- nologically susceptible to variation by the viscosity of the medium [see, for example, Brouwer and Kirsch (1982) and Blacklow et al. (1988)l.
~~~~ ~
l 4 We must reemphasize here that the figures in this paper are kinetic barrier diagrams and not classical free energy profiles. The binding of S to E and that of P to E are repesented by barriers equivalent to log l /k , [S] and by l/k-,[P], respectively (see footnote 3 and Appendix I).
I s The reader familiar with these relationships will be aware of other more commonly employed relationships (such as the Hammett equation) that allow conclusions about the structure of the transition state. The relationship we have chosen compares the rate constant of a reaction to the equilibrium constant of the same reaction. The original relationships of Bransted and of Hammett use the equilibrium constant of a related process (most commonly the acid dissociation constant of one of the participants in the reaction) as a basis for comparison, and the values from these correlations should not be confused with those discussed here.
Evolutionary Optimization of Catalytic Effectiveness
follows is included in Appendix 11. We can now assign kinetic variables to the two remaining
binding interactions: differential binding and catalysis of an elementary step. Differential binding is related directly to Kht since the relative free energy of E-S and ESP determines Kint, and catalysis of an elementary step is described by effects on the intrinsic rate constant k20. So, maximizing catalytic ef- ficiency with respect to uniform binding (that is, optimizing k - l ) will optimize the internal states relative to the external states. Maximizing catalytic efficiency with respect to dif- ferential binding (that is, optimizing KinJ will optimize the internal states relative to one another. Finally, an improvement in catalysis of an elementary step is related to a decrease in the intrinsic barrier to reaction, that is, to an increase in k20.
MAXIMIZATION OF CATALYTIC EFFICIENCY To find the maximum efficiency with respect to any variable,
x , we calculate the partial derivative of F with respect to that variable ( d F / d x ) and set it equal to 0. Since the function F contains terms that derive from constraints imposed either by the system (e.g., the overall equilibrium constant of the re- action, Kq) or by the environment (e.g., the ambient substrate and product levels, as specified by e), which cannot be affected by evolutionary change in the target enzyme, we begin by collecting these constant terms. Thus, eq 9 can be rewritten as
(1 3) F[S],O = Ymin/(A + Ymin)
where A can be cast in terms of inverse rate constants (from eq 4-8 and 13): A = _ _
[ & + t(,+ &)( 2 + I ) ] + (; + &) (14)
The function A contains each of the three independent vari- ables, k - l , k2, and k-2, that could in principle change if the structure of the enzyme were altered. Furthermore, the function A has the same maximum and minimum points as F. The three rate constants k-l , k2, and k-2 can be transformed into the three kinetic variables k-,, Kint, and k20 (discussed in the previous section) by using eq 11 and 12 to give
A = [ k ~ [ S ] k 2 ~ K i , ? k-I + -!-( k-1 6 + &)(Kint + l ) ] + 1 \ ('+ k20 Kin? kz0
In eq 15, the terms that contain k-l are collected together in the left-hand brackets, and those that do not are collected in the right-hand parentheses. To investigate the consequences of optimizing the three binding interactions in our hierarchy (uniform binding, differential binding, and catalysis of an elementary step), we evaluate seriatim the effects of mini- mizing A (eq 15) with respect to k- l , Kint, and k,O.
Uniform Binding. As shown in Figure lA, uniform binding affects both k-I and k3 equally. To derive the equation for optimized uniform binding, we take aA/dk-l and set it equal to 0, giving
Biochemistry, Vol. 28, No. 24, 1989 9299
$2. $2b
,A, r-l *'a .
. . . . . .
L . . . . . . . , , -2 . . . *
E E'Sa E*P, E E E*% E*% E + + t t
s a 'a 'b 'b
. . . , , , . . .
L-
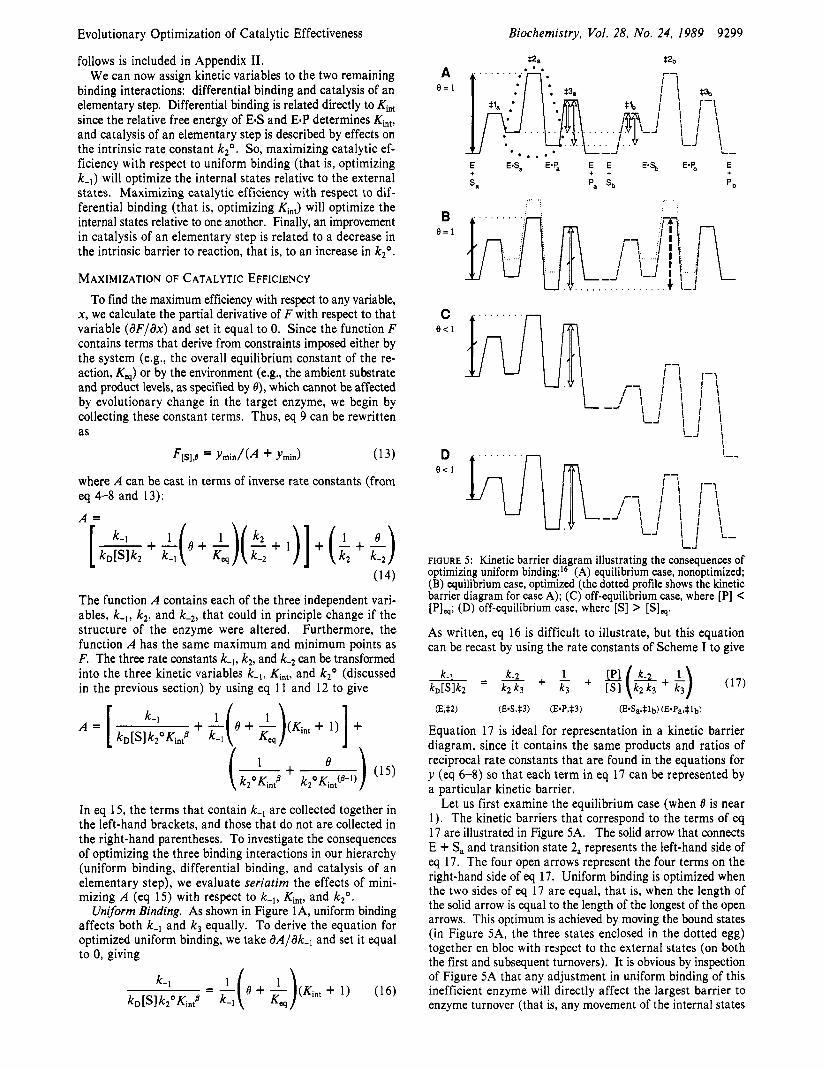
FIGURE 5 : Kinetic barrier diagram illustrating the consequences of optimizing uniform binding:I6 (A) equilibrium case, nonoptimized; (B) equilibrium case, optimized (the dotted profile shows the kinetic barrier diagram for case A); (C) off-equilibrium case, where [PI < [PI,; (D) off-equilibrium case, where [SI > [SI,. As written, eq 16 is difficult to illustrate, but this equation can be recast by using the rate constants of Scheme I to give
(E#) ( E * S , S 3 ) ( E * P , S 3 ) (E*Sa,S 1 b) (E*Pa,S lb)
Equation 17 is ideal for representation in a kinetic barrier diagram, since it contains the same products and ratios of reciprocal rate constants that are found in the equations for y (eq 6-8) so that each term in eq 17 can be represented by a particular kinetic barrier.
Let us first examine the equilibrium case (when 6 is near 1). The kinetic barriers that correspond to the terms of eq 17 are illustrated in Figure SA. The solid arrow that connects E + Sa and transition state 2, represents the left-hand side of eq 17. The four open arrows represent the four terms on the right-hand side of eq 17. Uniform binding is optimized when the two sides of eq 17 are equal, that is, when the length of the solid arrow is equal to the length of the longest of the open arrows. This optimum is achieved by moving the bound states (in Figure SA, the three states enclosed in the dotted egg) together en bloc with respect to the external states (on both the first and subsequent turnovers). It is obvious by inspection of Figure 5A that any adjustment in uniform binding of this inefficient enzyme will directly affect the largest barrier to enzyme turnover (that is, any movement of the internal states

9300 Biochemistry, Vol. 28, No. 24, 1989
will change the length of the solid arrow). The uniform- binding condition (eq 17) is satisfied if all bound species bind more tightly to the enzyme. The kinetic barrier diagram that results when all the bound states bind optimally is shown in Figure 5B.I6 Yet in this situation, the largest barrier to turnover is that represented by the dashed arrow, and the catalytic efficiency of the enzyme is relatively insensitive to changes in uniform binding. While very inefficient catalysts have much to gain by the improvement of uniform binding, the optimum can be a rather flat one. In general, enzyme efficiency is determined by the heights of the nine barriers (represented by the arrows of Figure 3) that determine the value of F. If the largest of these nine barriers is also one of the the five barriers that determine the uniform-binding op- timum (shown in Figure 5A), then catalytic efficiency will be sharply influenced by changes in uniform binding. On the other hand, if the largest of the nine barriers (Figure 3) is not one of the five uniform-binding barriers (Figure 5A), then the uniform-binding optimum will be rather flat and F will be less sensitive to changes of this type. In other words, the catalytic efficiency of an enzyme will be relatively insensitive to changes in uniform binding near the optimum if the catalytic step is either extremely slow or extremely fast.
Off-Equilibrium Systems. Optimization of uniform binding adjusts the proportion of the enzyme that exists in bound complexes, and the optimum state therefore depends on the concentrations of substrate and product. Thus, an enzyme that has been optimized for higher ambient substrate and product concentrations will bind its substrate and product less tightly than an enzyme that has been optimized to operate lower substrate and product levels. But what would the optimum of uniform binding be if the substrate and product concen- trations were not their equilibrium levels? That is, what would happen to the enzyme illustrated in Figure 5B if it found itself in a metabolic niche where 8 is less than l ? Since uniform binding concerns the ratio of free enzyme to bound enzyme, the absolute concentrations of S and P (as well as 8, which contains the ratio of [P]/[S]) are relevant here.
Consider first the case where [PI is lowered because the downstream enzymes remove P faster than the target enzyme can supply it (thus making [P]/[S] < [PIq/[S], and 8 C 1). The situation illustrated in Figure 5B would become that in Figure 5C (in which, compared with Figure 5B, only the barrier for 1/k3[P] has been changed). It is evident that the barriers that determine the uniform-binding optimum do not change. This is exactly what we expect: [PI is smaller than [SI for the reaction illustrated in Figure 5 anyway, and making it even smaller because of the activity of the downstream enzymes does not significantly affect the proportion of the target enzyme that is liganded.
In contrast, what happens if the upstream enzymes supply substrate S more rapidly than the target enzyme can equili- brate it? Once again [P]/[S] C [Plq/[S], and 8 < 1, yet the kinetic situation is rather different here and is represented by Figure 5D (in which, compared with Figure 5B, only the barrier for 1 / k , [SI has been changed). In this case, uniform binding is no longer optimal (the solid arrow and the open arrow have different lengths), and the enzyme could become more efficient if it were to bind its substrates and products more loosely until the two kinetic barriers (represented by the two arrows) became equal. Once again, this is what we expect:
Burbaum et al.
I6 In this figure and those that follow, we illustrate matched barriers as in geometry, with tick marks indicating vertical arrows of equal length. When two barriers are equal, the two associated rate constants (or net rate constants) are by definition equal.
Pa sb ‘b
C
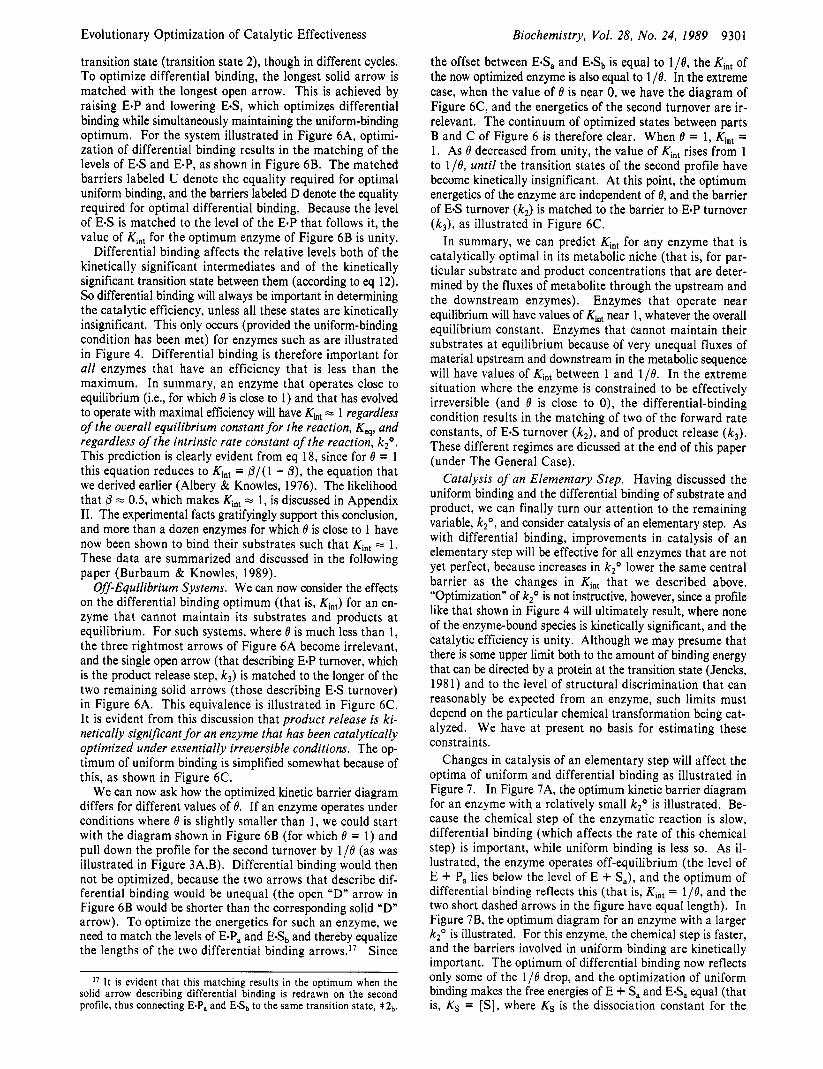
1 FIGURE 6: Kinetic barrier dia ram illustrating the consequences of optimizing differential bindin& (A) equilibrium case, nonoptimized; (B) equilibrium case, optimized; (C) effectively irreversible case. Kinetic barriers marked U relate to the uniform binding condition, and kinetic barriers marked D relate to the differential binding condition.
the uniform-binding optimum, which is concerned with the ratio of free and bound enzyme forms, is more sensitive to changes in the level of the more abundant ligand (in this case, S). Here, then, the uniform-binding optimum for a niche where O = 1 is different from the uniform-binding optimum for a niche where O < 1.
Differential Binding. Differential binding, like uniform binding, affects only one kinetic variable, in this case the internal equilibrium constant, Kin,. To evaluate the optimum Kin, (under conditions where the uniform-binding condition is, and remains, satisfied), we take the partial derivative dA/dKin, , set this derivative to 0, substitute for k-, using eq 16, and solve for Kin, to obtain
1 + OK, + ( k 3 / k 2 ) Kin, = ( L) 1 - /3 1 + 8K,, + O(k3/k-,)
(18)
As before, this equation can be recast by using the rate con- stants of Scheme I to give
( E W 2 ) (E*S,S3) (E*Sa.*lb) (E.P,S3) (E*Pa,Slb) (E0Pa,$2b)
(19)
when /3 = 0.5 (see Appendix 11). The
left-hand side of the equation describes the turnover of E& and the solid arrows in the figure point to the kinetic barriers for this cycle. Analogously, the right-hand side of eq 19 describes the turnover of ESP, and the open arrows in Figure 6A point to the kinetic barriers for this cycle. The longest solid arrow (representing the kinetically dominant term in E 6 turnover) and the longest open arrow (representing the ki- netically dominant term in ESP turnover) point to the same
The terms of eq 19 are illustrated in Figure 6A.
Evolutionary Optimization of Catalytic Effectiveness
transition state (transition state 2), though in different cycles. To optimize differential binding, the longest solid arrow is matched with the longest open arrow. This is achieved by raising ESP and lowering E.S, which optimizes differential binding while simultaneously maintaining the uniform-binding optimum. For the system illustrated in Figure 6A, optimi- zation of differential binding results in the matching of the levels of E-S and E-P, as shown in Figure 6B. The matched barriers labeled U denote the equality required for optimal uniform binding, and the barriers labeled D denote the equality required for optimal differential binding. Because the level of E-S is matched to the level of the ESP that follows it, the value of Kinl for the optimum enzyme of Figure 6B is unity.
Differential binding affects the relative levels both of the kinetically significant intermediates and of the kinetically significant transition state between them (according to eq 12). So differential binding will always be important in determining the catalytic efficiency, unless all these states are kinetically insignificant. This only occurs (provided the uniform-binding condition has been met) for enzymes such as are illustrated in Figure 4. Differential binding is therefore important for all enzymes that have an efficiency that is less than the maximum. In summary, an enzyme that operates close to equilibrium (Le., for which 0 is close to 1) and that has evolved to operate with maximal efficiency will have Kht = 1 regardless of the overall equilibrium constant for the reaction, Kq, and regardless of the intrinsic rate constant of the reaction, k2’. This prediction is clearly evident from eq 18, since for 0 = 1 this equation reduces to Kin, = p / ( 1 - p), the equation that we derived earlier (Albery & Knowles, 1976). The likelihood that /3 = 0.5, which makes Kin, = 1, is discussed in Appendix 11. The experimental facts gratifyingly support this conclusion, and more than a dozen enzymes for which 0 is close to 1 have now been shown to bind their substrates such that Kin, = 1. These data are summarized and discussed in the following paper (Burbaum & Knowles, 1989).
Off-Equilibrium Systems. We can now consider the effects on the differential binding optimum (that is, Kinl) for an en- zyme that cannot maintain its substrates and products at equilibrium. For such systems, where 0 is much less than 1, the three rightmost arrows of Figure 6A become irrelevant, and the single open arrow (that describing E.P turnover, which is the product release step, k3) is matched to the longer of the two remaining solid arrows (those describing E-S turnover) in Figure 6A. This equivalence is illustrated in Figure 6C. It is evident from this discussion that product release is ki- netically significant for an enzyme that has been catalytically optimized under essentially irreversible conditions. The op- timum of uniform binding is simplified somewhat because of this, as shown in Figure 6C.
We can now ask how the optimized kinetic barrier diagram differs for different values of 0. If an enzyme operates under conditions where 0 is slightly smaller than 1, we could start with the diagram shown in Figure 6B (for which 0 = 1) and pull down the profile for the second turnover by 1 / O (as was illustrated in Figure 3A,B). Differential binding would then not be optimized, because the two arrows that describe dif- ferential binding would be unequal (the open “D” arrow in Figure 6B would be shorter than the corresponding solid “D” arrow). To optimize the energetics for such an enzyme, we need to match the levels of ESP, and E& and thereby equalize the lengths of the two differential binding arrows.’’ Since
I t is evident that this matching results in the optimum when the solid arrow describing differential binding is redrawn on the second profile, thus connecting ESP, and E& to the same transition state, *2,,.
Biochemistry, Vol. 28, No. 24, 1989 9301
the offset between EeS, and E-Sb is equal to l/O, the Kin, of the now optimized enzyme is also equal to 1/19. In the extreme case, when the value of 0 is near 0, we have the diagram of Figure 6C, and the energetics of the second turnover are ir- relevant. The continuum of optimized states between parts B and C of Figure 6 is therefore clear. When 0 = 1, Kin, = 1. As 0 decreased from unity, the value of Kin, rises from 1 to l/0, until the transition states of the second profile have become kinetically insignificant. At this point, the optimum energetics of the enzyme are independent of 0, and the barrier of E.S turnover (k2) is matched to the barrier to E.P turnover ( k 3 ) , as illustrated in Figure 6C.
In summary, we can predict Kin, for any enzyme that is catalytically optimal in its metabolic niche (that is, for par- ticular substrate and product concentrations that are deter- mined by the fluxes of metabolite through the upstream and the downstream enzymes). Enzymes that operate near equilibrium will have values of Kin, near 1, whatever the overall equilibrium constant. Enzymes that cannot maintain their substrates at equilibrium because of very unequal fluxes of material upstream and downstream in the metabolic sequence will have values of Kin, between 1 and l/O. In the extreme situation where the enzyme is constrained to be effectively irreversible (and 0 is close to 0), the differential-binding condition results in the matching of two of the forward rate constants, of E 4 turnover ( k 2 ) , and of product release ( k 3 ) . These different regimes are dicussed at the end of this paper (under The General Case).
Catalysis of an Elementary Step. Having discussed the uniform binding and the differential binding of substrate and product, we can finally turn our attention to the remaining variable, k2’, and consider catalysis of an elementary step. As with differential binding, improvements in catalysis of an elementary step will be effective for all enzymes that are not yet perfect, because increases in k2” lower the same central barrier as the changes in Kin, that we described above. “Optimization” of k2’ is not instructive, however, since a profile like that shown in Figure 4 will ultimately result, where none of the enzyme-bound species is kinetically significant, and the catalytic efficiency is unity. Although we may presume that there is some upper limit both to the amount of binding energy that can be directed by a protein at the transition state (Jencks, 1981) and to the level of structural discrimination that can reasonably be expected from an enzyme, such limits must depend on the particular chemical transformation being cat- alyzed. We have at present no basis for estimating these constraints.
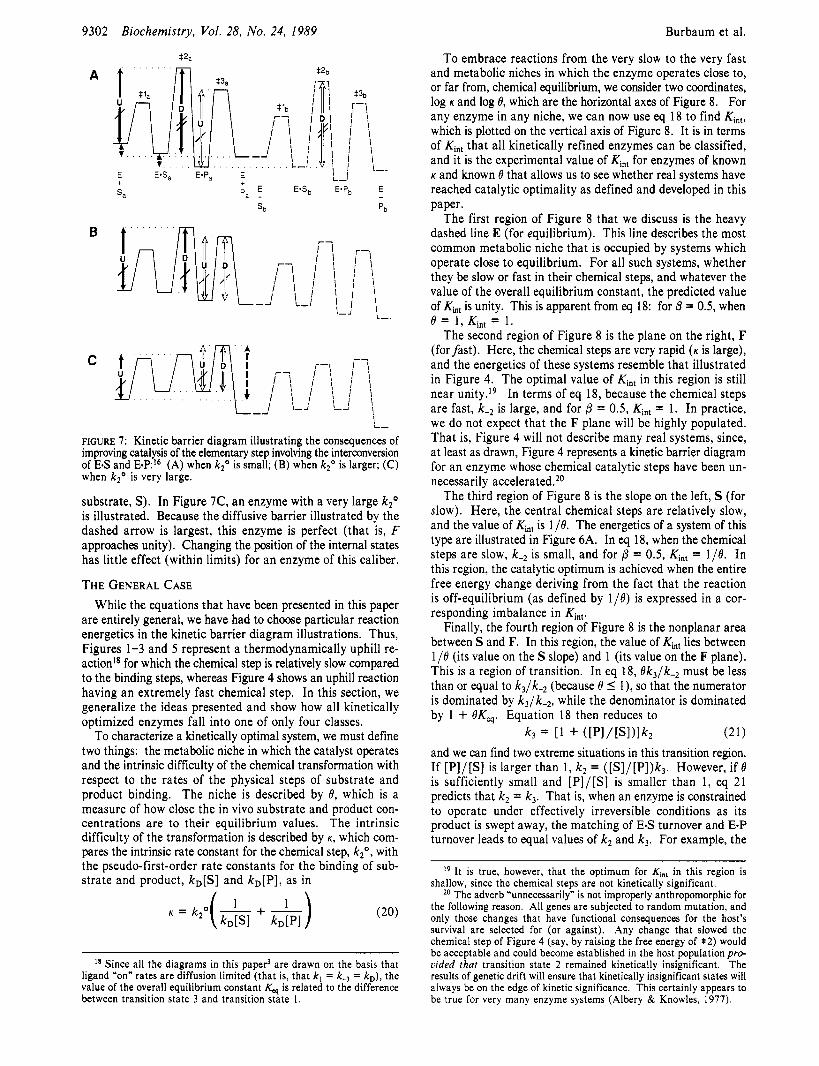
Changes in catalysis of an elementary step will affect the optima of uniform and differential binding as illustrated in Figure 7. In Figure 7A, the optimum kinetic barrier diagram for an enzyme with a relatively small k2” is illustrated. Be- cause the chemical step of the enzymatic reaction is slow, differential binding (which affects the rate of this chemical step) is important, while uniform binding is less so. As il- lustrated, the enzyme operates off-equilibrium (the level of E + P, lies below the level of E + Sa), and the optimum of differential binding reflects this (that is, Kin, = 1/19, and the two short dashed arrows in the figure have equal length). In Figure 7B, the optimum diagram for an enzyme with a larger k2’ is illustrated. For this enzyme, the chemical step is faster, and the barriers involved in uniform binding are kinetically important. The optimum of differential binding now reflects only some of the l/O drop, and the optimization of uniform binding makes the free energies of E + Sa and E-Sa equal (that is, Ks = [SI, where Ks is the dissociation constant for the
9302 Biochemistry, Vol. 28, No. 24, 1989
$2,
A
Burbaum et al.
*2b
T E E.Sb E*Pb E pa + +
'b 'b
L-
FIGURE 7: Kinetic barrier diagram illustrating the consequences of improving catalysis of the elementary step involving the interconversion of E-S and E-PI6 (A) when k20 is small; (B) when k2' is larger; (C) when k20 is very large.
substrate, S). In Figure 7C, an enzyme with a very large k2' is illustrated. Because the diffusive barrier illustrated by the dashed arrow is largest, this enzyme is perfect (that is, F approaches unity). Changing the position of the internal states has little effect (within limits) for an enzyme of this caliber.
THE GENERAL CASE While the equations that have been presented in this paper
are entirely general, we have had to choose particular reaction energetics in the kinetic barrier diagram illustrations. Thus, Figures 1-3 and 5 represent a thermodynamically uphill re- actionI8 for which the chemical step is relatively slow compared to the binding steps, whereas Figure 4 shows an uphill reaction having an extremely fast chemical step. In this section, we generalize the ideas presented and show how all kinetically optimized enzymes fall into one of only four classes.
To characterize a kinetically optimal system, we must define two things: the metabolic niche in which the catalyst operates and the intrinsic difficulty of the chemical transformation with respect to the rates of the physical steps of substrate and product binding. The niche is described by 6, which is a measure of how close the in vivo substrate and product con- centrations are to their equilibrium values. The intrinsic difficulty of the transformation is described by K , which com- pares the intrinsic rate constant for the chemical step, k20, with the pseudo-first-order rate constants for the binding of sub- strate and product, k D [ S ] and k D [ P ] , as in
K = k2'( k D I S l + I) k D I P l
' * Since all the diagrams in this paper' are drawn on the basis that ligand -on" rates are diffusion limited (that is, that k , = k3 = k D ) , the value of the overall equilibrium constant K, is related to the difference between transition state 3 and transition state I .
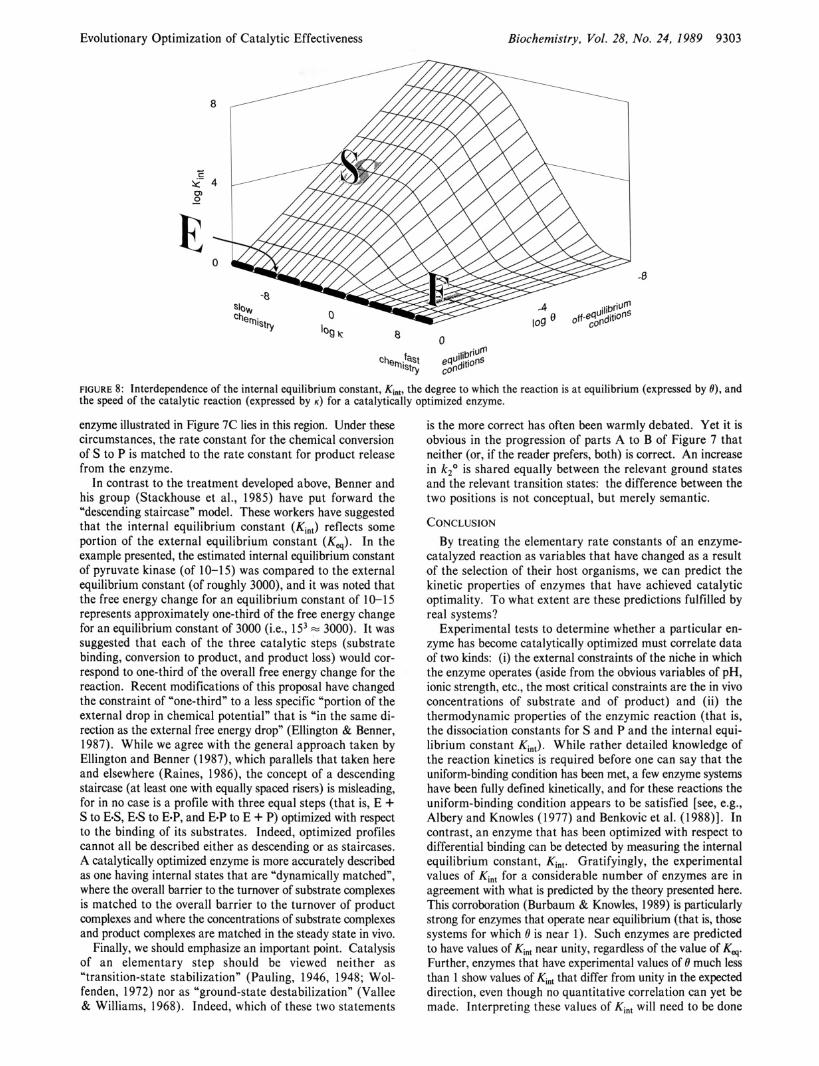
To embrace reactions from the very slow to the very fast and metabolic niches in which the enzyme operates close to, or far from, chemical equilibrium, we consider two coordinates, log K and log 8, which are the horizontal axes of Figure 8. For any enzyme in any niche, we can now use eq 18 to find Kin,, which is plotted on the vertical axis of Figure 8. It is in terms of Kin, that all kinetically refined enzymes can be classified, and it is the experimental value of Kin, for enzymes of known K and known 0 that allows us to see whether real systems have reached catalytic optimality as defined and developed in this paper.
The first region of Figure 8 that we discuss is the heavy dashed line E (for equilibrium). This line describes the most common metabolic niche that is occupied by systems which operate close to equilibrium. For all such systems, whether they be slow or fast in their chemical steps, and whatever the value of the overall equilibrium constant, the predicted value of K,, is unity. This is apparent from eq 18: for /3 = 0.5, when
The second region of Figure 8 is the plane on the right, F (for fast). Here, the chemical steps are very rapid ( K is large), and the energetics of these systems resemble that illustrated in Figure 4. The optimal value of Kin, in this region is still near unity.19 In terms of eq 18, because the chemical steps are fast, k-, is large, and for /3 = 0.5, Kin, = 1. In practice, we do not expect that the F plane will be highly populated. That is, Figure 4 will not describe many real systems, since, at least as drawn, Figure 4 represents a kinetic barrier diagram for an enzyme whose chemical catalytic steps have been un- necessarily acceleratede20
The third region of Figure 8 is the slope on the left, S (for slow). Here, the central chemical steps are relatively slow, and the value of K,, is l/%. The energetics of a system of this type are illustrated in Figure 6A. In eq 18, when the chemical steps are slow, k-, is small, and for /3 = 0.5, Kin, = l /e. In this region, the catalytic optimum is achieved when the entire free energy change deriving from the fact that the reaction is off-equilibrium (as defined by l/e) is expressed in a cor- responding imbalance in Kint.
Finally, the fourth region of Figure 8 is the nonplanar area between S and F. In this region, the value of K,, lies between l/t9 (its value on the S slope) and 1 (its value on the F plane). This is a region of transition. In eq 18, 6k3 /k -2 must be less than or equal to k3 /k -2 (because 0 I l), so that the numerator is dominated by k3 /k -2 , while the denominator is dominated by 1 + OKq. Equation 18 then reduces to
(21) and we can find two extreme situations in this transition region. If [ P ] / [ S ] is larger than 1, k , = ( [ S ] / [ P ] ) k 3 . However, if 0 is sufficiently small and [ P ] / [ S ] is smaller than 1, eq 21 predicts that k2 = k3. That is, when an enzyme is constrained to operate under effectively irreversible conditions as its product is swept away, the matching of E-S turnover and ESP turnover leads to equal values of k , and k 3 . For example, the
e = 1, K~,, = 1.
k3 = [1 + ( [ P I / [ S l ) l k ,
l9 It is true, however, that the optimum for Kin, in this region is shallow, since the chemical steps are not kinetically significant.
*O The adverb "unnecessarily" is not improperly anthropomorphic for the following reason. All genes are subjected to random mutation, and only those changes that have functional consequences for the host's survival are selected for (or against). Any change that slowed the chemical step of Figure 4 (say, by raising the free energy of 9 2 ) would be acceptable and could become established in the host population pro- uided that transition state 2 remained kinetically insignificant. The results of genetic drift will ensure that kinetically insignificant states will always be on the edge of kinetic significance. This certainly appears to be true for very many enzyme systems (Albery I% Knowles, 1977).
Evolutionary Optimization of Catalytic Effectiveness Biochemistry, Vol. 28, No. 24, 1989 9303
-8
FIGURE 8: Interdependence of the internal equilibrium constant, Kint, the degree to which the reaction is at equilibrium (expressed by e), and the speed of the catalytic reaction (expressed by K ) for a catalytically optimized enzyme.
enzyme illustrated in Figure 7C lies in this region. Under these circumstances, the rate constant for the chemical conversion of S to P is matched to the rate constant for product release from the enzyme.
In contrast to the treatment developed above, Benner and his group (Stackhouse et al., 1985) have put forward the “descending staircase” model. These workers have suggested that the internal equilibrium constant (Kint) reflects some portion of the external equilibrium constant (Kq). In the example presented, the estimated internal equilibrium constant of pyruvate kinase (of 10-1 5) was compared to the external equilibrium constant (of roughly 3000), and it was noted that the free energy change for an equilibrium constant of 10-15 represents approximately one-third of the free energy change for an equilibrium constant of 3000 (Le., 153 = 3000). It was suggested that each of the three catalytic steps (substrate binding, conversion to product, and product loss) would cor- respond to one-third of the overall free energy change for the reaction. Recent modifications of this proposal have changed the constraint of “one-third” to a less specific “portion of the external drop in chemical potential” that is “in the same di- rection as the external free energy drop” (Ellington & Benner, 1987). While we agree with the general approach taken by Ellington and Benner (1 987), which parallels that taken here and elsewhere (Raines, 1986), the concept of a descending staircase (at least one with equally spaced risers) is misleading, for in no case is a profile with three equal steps (that is, E + S to E-S, E*S to E-P, and E=P to E + P) optimized with respect to the binding of its substrates. Indeed, optimized profiles cannot all be described either as descending or as staircases. A catalytically optimized enzyme is more accurately described as one having internal states that are “dynamically matched”, where the overall barrier to the turnover of substrate complexes is matched to the overall barrier to the turnover of product complexes and where the concentrations of substrate complexes and product complexes are matched in the steady state in vivo.
Finally, we should emphasize an important point. Catalysis of an elementary step should be viewed neither as “transition-state stabilization” (Pauling, 1946, 1948; Wol- fenden, 1972) nor as “ground-state destabilization” (Vallee & Williams, 1968). Indeed, which of these two statements
is the more correct has often been warmly debated. Yet it is obvious in the progression of parts A to B of Figure 7 that neither (or, if the reader prefers, both) is correct. An increase in k2’ is shared equally between the relevant ground states and the relevant transition states: the difference between the two positions is not conceptual, but merely semantic.
CONCLUSION By treating the elementary rate constants of an enzyme-
catalyzed reaction as variables that have changed as a result of the selection of their host organisms, we can predict the kinetic properties of enzymes that have achieved catalytic optimality. To what extent are these predictions fulfilled by real systems?
Experimental tests to determine whether a particular en- zyme has become catalytically optimized must correlate data of two kinds: (i) the external constraints of the niche in which the enzyme operates (aside from the obvious variables of pH, ionic strength, etc., the most critical constraints are the in vivo concentrations of substrate and of product) and (ii) the thermodynamic properties of the enzymic reaction (that is, the dissociation constants for S and P and the internal equi- librium constant Kint). While rather detailed knowledge of the reaction kinetics is required before one can say that the uniform-binding condition has been met, a few enzyme systems have been fully defined kinetically, and for these reactions the uniform-binding condition appears to be satisfied [see, e.g., Albery and Knowles (1977) and Benkovic et al. (1988)l. In contrast, an enzyme that has been optimized with respect to differential binding can be detected by measuring the internal equilibrium constant, Kint. Gratifyingly, the experimental values of Kint for a considerable number of enzymes are in agreement with what is predicted by the theory presented here. This corroboration (Burbaum & Knowles, 1989) is particularly strong for enzymes that operate near equilibrium (that is, those systems for which 6 is near 1). Such enzymes are predicted to have values of Kint near unity, regardless of the value of Kes. Further, enzymes that have experimental values of 8 much less than 1 show values of Kint that differ from unity in the expected direction, even though no quantitative correlation can yet be made. Interpreting these values of Kint will need to be done
9304 Biochemistry, Vol. 28, No. 24, 1989 Burbaum et al.
cautiously, because many of the enzymes that are off-equi- librium in vivo have demonstrated roles in metabolic control. That this correlation exists, however, suggests that the span of evolutionary time that has already passed has been enough for the kinetic refinement of enzymes (at least, of many of those of primary metabolism) to have been essentially com- pleted.
ACKNOWLEDGMENTS We are grateful to W. J. Ray, G. M. Whitesides, F. H.
Westheimer, and S. L. Bender for all their efforts to clarify the presentation of the concepts developed in this paper.
APPENDIX I. KINETIC BARRIER DIAGRAMS There are several problems that attend any attempt to
represent the course of an enzyme-catalyzed reaction by a free energy profile, three of which have been mentioned in footnote 3 . The first of these problems (of how to represent first-order and second-order steps on the same profile) can be circum- vented by the choice of a standard-state concentration, which need not be the 1 M most often used by chemists, but can- more realistically for an enzyme-catalyzed reaction-be the actual concentration of the enzyme's substrates in vivo. Thus, in our earlier work on triosephosphate isomerase (Albery & Knowles, 1976), we specified 40 pM as the standard-state concentration, since that is the level of dihydroxyacetone phosphate in muscle. This approach is perfectly proper when one is illustrating the energetics of an enzyme system at equilibrium, but it is not appropriate when (as here) one wants also to illustrate the behavior of enzyme systems that cannot maintain their substrates and products at equilibrium.
In this paper, therefore, we adopt a different convention for the illustration of the kinetic behavior of enzymes and use what we shall call "kinetic barrier diagrams". These diagrams are constructed first by writing all second-order rate constants (and higher order rate constants) as pseudo-first-order rate con- stants, simply by including the actual ambient reactant con- centrations. Thus, for the reaction illustrated in Scheme I, we write the rate constants of the two bimolecular reactions (the binding of S and P to the enzyme) as k , [ S ] and k-,[P]. The values of [SI and [PI are the actual levels that the enzyme is experiencing in the steady-state conditions under consid- eration. All six rate constants of Scheme I (each in units of s-I) can now be presented together, where the ordinate is proportional to log l / k ( k is a first-order or a pseudo-first- order rate constant) and quantitates the kinetic barrier to a particular transformation. This protocol means that the barriers that represent the second-order binding steps of S and P depend upon the concentrations of S and P that the enzyme experiences. The relationship of this formalism to a free energy profile is obvious, in the sense that the value of log l / k for a particular step in the reaction sequence is proportional to the value of AG* for that step. The constant of proportionality is, of course, k T / h . Yet it must be emphasized that there are some features of a free energy profile (most obviously the value of AGO for the overall reaction) that are not explicitly repre- sented in a kinetic barrier diagram. In contrast to the classical free energy profile, the kinetic barrier diagram describes how each form of the enzyme (including the free enzyme, E) partitions kinetically, and it provides a pictorial representation of the barriers to enzyme turnover that exist under specified conditions of substrate and product concentration. This rep- resentation also recognizes that catalysis is a cyclic process and that a single enzyme turnover (of the system shown in Scheme I) can be viewed as E round to E (via E& and EmP), or, equally validly, as E 6 round to E.S, or as ESP round to
ESP. The kinetic barrier diagram (unlike a free energy profile where a single standard-state concentration is chosen and given to S and to P) allows one to treat all starting points of the catalytic cycle more evenhandedly.
The kinetic barrier diagram shows immediately whether the enzyme is in an equilibrium or an off-equilibrium niche. If the enzyme maintains the relative concentration of S and P at the equilibrium value (in terms of eq 1 , if 0 is near unity), then in the kinetic barrier diagram the levels of E + S and E + P will be the same. If, however, the supply of S by the upstream enzymes is too rapid for the target enzyme to handle, or if the downstream enzymes remove P faster than the target enzyme can supply it (in terms of eq 1 , 0 is less than unity), then in the kinetic barrier diagram the level of E + P will lie below that of E + S . Systems that are at equilibrium and systems that are off-equilibrium are thus immediately ap- parent.
APPENDIX 11. THE CHOICE OF 0 e 0.5 We have treated 0 as a constant that is approximately equal
to 0.5 for several reasons. First, in many reaction series where rates are compared to equilibria, a Brernsted-type relationship (with a constant 0) satisfactorily accommodates the data, even when the reaction thermodynamics vary over several orders of magnitude (Jencks, 1985). Indeed, linear free energy re- lationships of this type have been described as being "more general than [they] ought to be" (Bolton 8t Helper, 1971). The evident constancy of 0 suggests that changes in transi- tion-state structure (which would produce a variable 0) are relatively small within a particular reaction series. Other authors [e.g., Rees (1985) and Ellington and Benner (1987)l have treated 0 as a variable that is subject to evolutionary variation. In our hierarchy, such evolutionary variation would require an excruciatingly subtle discrimination: for a mutation to effect a change in would require the enzyme to distinguish between two transition states (say, a more symmetrical one and a less symmetrical one) of the same elementary step.
Second, the subset of chemical reactions found in physiology tends to be closer to thermodynamic neutrality (AGO nearer 0) than chemical reactions as a whole. Values of 0 for thermodynamically neutral reactions tend toward 0.5, so that the subset of 0 values for physiological reactions might rea- sonably be expected to cluster nearer 0.5 than the entire set of 0 values for all reactions.
Third, as the equilibrium constant for a reaction becomes closer to 1, the transition state of the reaction tends to become more symmetric, which causes a 0 value that was further from 0.5 to move toward 0.5 as the thermodynamics become bal- anced. This argument is not circular, as has been implied (Ellington & Benner, 1987; Nambiar e t al., 1983), since a reaction with an equilibrium constant of unity need not be chemically symmetrical and therefore need not have a tran- sition state equally sensitive to each ground state. This ar- gument is independent of the first argument presented. The first argument states that does not vary much with ther- modynamic changes, while this argument states that the small variations in 0 move it toward 0.5, narrowing further the subset of 0 values for physiological reactions.
Finally we note that when 6 is equal to 0.5, the transition state will be (very roughly) equidistant along the reaction coordinate between substrate and product, since the reaction is equally sensitive to changes in substrate structure as it is to changes in product structure (i.e., promad = 0,- only when 0 = 0.5). At this point, discrimination of transition states from ground states will be easiest, since at this point the transition state is least like either ground state.
Evolutionary Optimization of Catalytic Effectiveness
As far as the proposals in this paper are concerned, the value of 0 does not affect the optimization of uniform binding. The value of /3 does, however, affect the optimization of differential binding. Specifically, since differential binding is optimized as a direct result of the linear free energy relationship, the p value (for the forward direction) and the 1 - p value (for the reverse direction) become weighting factors in the matching of E.P and E 4 turnover. Suppose we found an enzyme with a p value of 0.7. Rather than matching E-P turnover to E 4 turnover exactly, we should match 0.7 parts of E 4 turnover to 0.3 parts of E-P turnover. A value of 0.7 would thus affect our conclusions by a factor of approximately 2 (actually, 7/3). As /3 moves to either extreme, of course, either E-S turnover or ESP turnover may become more heavily weighted. But in view of the arguments presented above, such extreme values of p seem unlikely to be relevant to enzymatic processes.
REFERENCES Albery, W. J. (1980) Annu. Rev. Phys. Chem. 31, 227-263. Albery, W. J., & Knowles, J . R. (1976) Biochemistry 15,
Albery, W. J., & Knowles, J. R. (1977) Angew. Chem., Znt.
Bartlett, P. A,, & Marlowe, C. K. (1987) Biochemistry 26,
Bell, R. P. (1936) Proc. R . SOC. London, A 154, 414-429. Benkovic, S . J., Fierke, C. A., & Naylor, A. M. (1988) Science
Blacklow, S . C., Raines, R. T., Lim, W. A,, Zamore, P. D., & Knowles, J. R. (1988) Biochemistry 27, 1158-1167.
Bolton, P. D., & Hepler, L. G. (1971) Q. Rev. Chem. SOC.
Brernsted, J. N. (1928) Chem. Rev. 5 , 231-338. Brouwer, A. C., & Kirsch, J . F. (1982) Biochemistry 21,
Bucher, T., & Russman, W. (1964) Angew. Chem., Znt. Ed.
Burbaum, J. J., & Knowles, J . R. (1989) Biochemistry (fol-
Chin, J. (1983) J . Am. Chem. SOC. 105, 6502-6503. Crabtree, B., & Newsholme, E. A. (1985) Curr. Top. Cell.
Darwin, C. R. (1872) The Origin of Species, Volume I,
Ellington, A., & Benner, S . A. (1987) J . Theor. Biol. 127,
Evans, M. G., & Polanyi, M. (1938) Trans. Faraday SOC. 34,
Haldane, J. B. S . (1930) Enzymes, Longmans, Green, & Co.,
5631-5640.
Ed. Engl. 16, 285-293.
8553-8561.
239, 1105-1 110.
25, 521-532.
1302-1307.
Engl. 3, 426-439.
lowing paper in this issue).
Regul. 25, 21-77.
Chapter VI, pp 182-183, Appleton, New York.
491-506.
11-24.
London.
Biochemistry, Vol. 28, No. 24, 1989 9305
Hammond, G. S . (1955) J . Am. Chem. SOC. 77, 334-338. Hess, B. (1963) in Control Mechanisms in Respiration and
Fermentation (Wright, B., Ed.) MBL Woods Hole Sym- posium 8, pp 333-350, Ronald Press, New York.
Hess, B. (1973) in Rate Control of Biological Processes (Davies, D. D., Ed.) Society for Experimental Biology Symposium 27, pp 105-131, Cambridge University Press, Cambridge, U.K.
Jencks, W. P. (1980) Adv. Enzymol. Relat. Areas Mol. Biol.
Jencks, W. P. (1981) Proc. Natl. Acad. Sci. U.S.A. 78,
Jencks, W. P. (1985) Chem. Rev. 85, 511-526. Knowles, J. R., & Albery, W. J. (1977) Acc. Chem. Res. 10,
Leffler, J. E., & Grunwald, E. (1 963) in Rates and Equilibria
Marcus, R. A. (1956) J . Chem. Phys. 24, 966-978. Marcus, R. A. (1968) J . Phys. Chem. 72, 891-899. Murdoch, J . R. (1972) J . Am. Chem. SOC. 94, 4410-4418. Nambiar, K. P., Stauffer, D. M., Kolodziej, P. A,, & Benner,
S . A. (1983) J . Am. Chem. SOC. 105, 5886-5890. Newsholme, E. A., & Start, C. (1972) Handbook of
Physiology-Endocrinology I , Chapter 23, Williams & Wilkins, Baltimore, MD.
51, 75-106.
4046-4050.
105-1 11.
of Organic Reactions, Wiley, New York.
Pauling, L. (1946) Chem. Eng. News 24, 1375-1377. Pauling, L. (1948) Am. Sci. 36, 51-58. Raines, R. T. (1986) Ph.D. Thesis, Harvard University. Raines, R. T., & Knowles, J. R. (1987) Biochemistry 26,
Raines, R. T., Sutton, E. L., Straus, D. R., Gilbert, W., &
Ray, W. J. (1983) Biochemistry 22, 4625-4637. Rees, D. C. (1985) Proc. Natl. Acad. Sci. U.S.A. 82,
Rolleston, F. S . (1972) Curr. Top. Cell. Regul. 5, 47-75. Sharp, K., Fine, R., & Honig, B. (1987) Science 236,
Srivastava, D. K., & Bernhard, S. A. (1987) Annu. Rev. Biophys. Biophys. Chem. 16, 175-204.
Stackhouse, J., Nambiar, K. P., Burbaum, J. J., Stauffer, D. M., & Benner, S . A. (1985) J . Am. Chem. SOC. 107,
Stengers, I., & Prigogine, I. (1984) Order Out of Chaos: Man’s New Dialogue With Nature, Random House, Boulder, CO.
Vallee, B., & Williams, R. J. P. (1 968) Proc. Natl. Acad. Sci.
Williamson, J. R. (1965) J . Biol. Chem. 240, 2308-2321. Wolfenden, R. (1972) Acc. Chem. Res. 5 , 10-18.
7014-7020.
Knowles, J. R. (1986) Biochemistry 25, 7 142-7 154.
3082-3085.
1460-1 463.
2757-2763.
U.S.A. 59, 498-505.
Related Documents