Proceedings World Geothermal Congress 2015 Melbourne, Australia, 19-25 April 2015 1 Evolution of the Natural Radioactivity on the Soultz-sous-Forêt EGS Power Plant and Implication for Radiation Protection Nicolas Cuenot 1 , Julia Scheiber 1 , Wilfrid Moeckes 1 and Albert Genter 2 1 GEIE Exploitation Minière de la Chaleur, Route de Soultz, BP 40038, 67250 Kutzenhausen, France 2 ES-Géothermie, 3A Chemin du Gaz, 67500 Haguenau, France [email protected] (corresponding author), [email protected], [email protected], [email protected] Keywords: EGS, natural radioactivity, radiation protection ABSTRACT The Soultz-sous-Forêts EGS power plant exploits a reservoir hosted in fractured granitic rocks, which naturally contain radionuclides. The circulation of geothermal fluid can leach some radionuclides and bring them to the surface, where radioactivity may happen: this implies to set up radiation protection procedures in accordance to the nuclear safety regulation. As asked by ASN (French national agency for nuclear safety), several monitoring surveys have been carried out since 2009 to follow the evolution of natural radioactivity on the geothermal installation and to better understand the chemical and physical mechanisms leading to the presence of radioactivity. Hence around 400 contact and ambient dose rate measurements were regularly sampled on both GPK1 and GPK2 platforms, allowing a precise monitoring and mapping of the evolution of radioactivity. For all surveys, results show a general increase of the dose rate values as a function of circulated volume. Moreover, the highest values are mostly found on the reinjection line: here the lower fluid temperature (~70°C) tends to induce the precipitation of sulfates (solid solutions between barite, BaSO 4 , and Celestine, SrSO 4 ) and sulfides (Galena, PbS), which are able to trap radionuclides (mainly 226 Ra for sulfates and 210 Pb for Galena) during their formation. The presence of radioactivity on surface installation requires setting up radiation protection procedure for workers and public, as asked by the French nuclear safety regulation. A protected zone and a controlled zone have been defined around the installation, with specific access authorization. Adapted protection equipments must be worn by workers especially for operation where they may be in direct contact with radioactive material (heat exchanger and filter cleaning, pipe dismantling). Finally a procedure has also been established for the disposal and removal of radioactive waste (mainly residues from filters) in agreement with the French regulation. 1. INTRODUCTION Natural radioactivity becomes a growing concern among the geothermal community, especially on geothermal plants that exploits reservoirs hosted by rocks naturally containing radionuclides. This is, for instance, the case of geothermal power plants located in the Upper Rhine Graben, whose boreholes are often drilled down to the crystalline basement. Indeed granitic rocks contain radionuclides, mainly, Uranium, Thorium and products from their decay chain. Geothermal fluid, which naturally circulates in this fractured granite, is able to leach some radionuclides and bring them to the surface through pumping. In 2005 a 6-months circulation test was performed at the Soultz site in artesian conditions. During this test, first measurements on the surface installation revealed the occurrence of natural radioactivity. Results were sent to the ASN (French National Agency for Nuclear Safety), which recommended to start a regular monitoring of the evolution of natural radioactivity on the surface installations. Despite the fact that the radioactivity level is rather low, the French nuclear regulation requires to set up radiation protection measures, as soon as radiations may occur, in order to ensure that any worker will not receive a cumulative dose larger than 1 mSv over a period of 12 consecutive months. Since 2009, several circulation tests of different durations have been performed while testing the Soultz-sous-Forêts power plant. During each of them, at least one measurement survey has been made so as to observe the evolution of natural radioactivity on the surface installation and try to correlate it with hydraulic parameters (Cuenot et al., 2013). In parallel a research work has been launched in order to better understand the origin of radioactivity occurring in the surface installation. This paper presents the results of the surveys and of the scientific research, as well as the applied radiation protection procedures. 2. RADIOACTIVITY MEASUREMENTS Between June 2009 and April 2013, 10 radioactivity measurement surveys have been performed on the Soultz geothermal installation during or after the circulation tests described in 2.2. They allowed monitoring rather precisely the evolution of the radioactivity level during a given test and to compare it from one test to the others. 2.1 Measurement Method A radiameter is used for the measurements (Fig. 1): it allows to record two types of parameters: - the activity, which is the number of nuclear disintegrations per second,

Evolution of the Natural Radioactivity on the Soultz-sous ... · 2ES-Géothermie, 3A Chemin du Gaz, 67500 Haguenau, France [email protected] (corresponding author), [email protected],
Sep 15, 2018
Welcome message from author
This document is posted to help you gain knowledge. Please leave a comment to let me know what you think about it! Share it to your friends and learn new things together.
Transcript

Proceedings World Geothermal Congress 2015
Melbourne, Australia, 19-25 April 2015
1
Evolution of the Natural Radioactivity on the Soultz-sous-Forêt EGS Power Plant and
Implication for Radiation Protection
Nicolas Cuenot1, Julia Scheiber
1, Wilfrid Moeckes
1 and Albert Genter
2
1GEIE Exploitation Minière de la Chaleur, Route de Soultz, BP 40038, 67250 Kutzenhausen, France
2ES-Géothermie, 3A Chemin du Gaz, 67500 Haguenau, France
[email protected] (corresponding author), [email protected], [email protected], [email protected]
Keywords: EGS, natural radioactivity, radiation protection
ABSTRACT
The Soultz-sous-Forêts EGS power plant exploits a reservoir hosted in fractured granitic rocks, which naturally contain
radionuclides. The circulation of geothermal fluid can leach some radionuclides and bring them to the surface, where radioactivity
may happen: this implies to set up radiation protection procedures in accordance to the nuclear safety regulation.
As asked by ASN (French national agency for nuclear safety), several monitoring surveys have been carried out since 2009 to
follow the evolution of natural radioactivity on the geothermal installation and to better understand the chemical and physical
mechanisms leading to the presence of radioactivity. Hence around 400 contact and ambient dose rate measurements were regularly
sampled on both GPK1 and GPK2 platforms, allowing a precise monitoring and mapping of the evolution of radioactivity.
For all surveys, results show a general increase of the dose rate values as a function of circulated volume. Moreover, the highest
values are mostly found on the reinjection line: here the lower fluid temperature (~70°C) tends to induce the precipitation of
sulfates (solid solutions between barite, BaSO4, and Celestine, SrSO4) and sulfides (Galena, PbS), which are able to trap
radionuclides (mainly 226Ra for sulfates and 210Pb for Galena) during their formation.
The presence of radioactivity on surface installation requires setting up radiation protection procedure for workers and public, as
asked by the French nuclear safety regulation. A protected zone and a controlled zone have been defined around the installation,
with specific access authorization. Adapted protection equipments must be worn by workers especially for operation where they
may be in direct contact with radioactive material (heat exchanger and filter cleaning, pipe dismantling). Finally a procedure has
also been established for the disposal and removal of radioactive waste (mainly residues from filters) in agreement with the French
regulation.
1. INTRODUCTION
Natural radioactivity becomes a growing concern among the geothermal community, especially on geothermal plants that exploits
reservoirs hosted by rocks naturally containing radionuclides. This is, for instance, the case of geothermal power plants located in
the Upper Rhine Graben, whose boreholes are often drilled down to the crystalline basement. Indeed granitic rocks contain
radionuclides, mainly, Uranium, Thorium and products from their decay chain. Geothermal fluid, which naturally circulates in this
fractured granite, is able to leach some radionuclides and bring them to the surface through pumping.
In 2005 a 6-months circulation test was performed at the Soultz site in artesian conditions. During this test, first measurements on
the surface installation revealed the occurrence of natural radioactivity. Results were sent to the ASN (French National Agency for
Nuclear Safety), which recommended to start a regular monitoring of the evolution of natural radioactivity on the surface
installations. Despite the fact that the radioactivity level is rather low, the French nuclear regulation requires to set up radiation
protection measures, as soon as radiations may occur, in order to ensure that any worker will not receive a cumulative dose larger
than 1 mSv over a period of 12 consecutive months.
Since 2009, several circulation tests of different durations have been performed while testing the Soultz-sous-Forêts power plant.
During each of them, at least one measurement survey has been made so as to observe the evolution of natural radioactivity on the
surface installation and try to correlate it with hydraulic parameters (Cuenot et al., 2013). In parallel a research work has been
launched in order to better understand the origin of radioactivity occurring in the surface installation. This paper presents the results
of the surveys and of the scientific research, as well as the applied radiation protection procedures.
2. RADIOACTIVITY MEASUREMENTS
Between June 2009 and April 2013, 10 radioactivity measurement surveys have been performed on the Soultz geothermal
installation during or after the circulation tests described in 2.2. They allowed monitoring rather precisely the evolution of the
radioactivity level during a given test and to compare it from one test to the others.
2.1 Measurement Method
A radiameter is used for the measurements (Fig. 1): it allows to record two types of parameters:
- the activity, which is the number of nuclear disintegrations per second,

Cuenot et al.
2
- the dose rate, which is the dose of radiation received by a body per unit of time. Here it is expressed in µSv/h
(micro-Sievert per hour).
Figure 1: Contact dose rate measurement performed with a radiameter.
As the dose is the main relevant parameter used in radiation protection, dose rate measurements are performed. “Contact” data are
recorded, that are taken 1 cm away from the installation (Figure 1). They are used to precisely map the radioactivity level on the
different parts of the surface installation. “Ambient” values are also measured 1 m away from the installation: they are more
representative of actual work places and used to set up radiation protection procedures. Around 350 contact and 50 ambient
measurements are sampled both on GPK2 and GPK1 platforms. As they are precisely identified, measurements can be repeated at
the exact same position, so as to compare values from one survey to the next.
GPK2 platform comprises the main geothermal installation (Fig. 2), with 3 5-km deep boreholes, GPK2 (production with a
downhole pump), GPK3 (reinjection) and GPK4 (production, then reinjection). The 1.5 MWe power plant and all associated
equipments (pipelines, heat exchangers, filters) are also located on GPK2 platform. On GPK1 platform are located only GPK1
borehole (reinjection) and the associated equipment (mainly pipes).
Figure 2: View of GPK2 platform
2.2 Circulation Tests and Corresponding Surveys
10 radioactivity measurements surveys have been performed over 6 circulations tests:
- circulation March – October 2009: 2 surveys performed in June 2009, after 2 months of circulation and October
2009, after the end of the test,
- circulation November 2009 – October 2010: 3 surveys performed in June 2010, after 6 months of circulation, in
August 2010, after 9 months of circulation and October 2010, just before the end of the test,
- circulation January 2011 – April 2011: 1 survey performed in April 2011, after the end of circulation,
- circulation August 2011 – October 2011: 1 survey performed in October 2011, after the end of the test,
- circulation March 2012 – April 2012: 1 survey performed in April 2012 at the end of the circulation test,

Cuenot et al.
3
- circulation January 2013 – July 2013: 1 survey performed in April 2013, during the circulation test.
It has to be noted that another survey has been performed in July 2011, between both 2011 circulation tests.
2.3 Results from GPK2 Platform
Figure 3 presents the evolution of dose rates at the 350 contact measurements positions for the 10 surveys described above. Figure 4
shows the same results, but for ambient measurements. For the latter, several measurements points have been added in April 2012
and 2013 that were not checked during the former surveys.
Figure 3: Evolution of contact dose rate measurements on GPK2 platform during the 10 surveys. The circled numbers
correspond to: 1) Filters on reinjection lines, 2) Part of reinjection line, 3) Reinjection line to GPK3, 4) Part of
reinjection line and 5) Reinjection pumps
In June 2009, the dose rates values (contact measurements) varied from the background noise level (~0.06 µSv/h) to a maximum of
4.90 µSv/h, with an average of 0.89 µSv/h (Cuenot, 2009; Maquet, 2011). Concerning ambient measurements, they range between
the background noise level, up to 0.66 µSv/h, with an average of 0.24 µSv/h.
It can be observed on figures 3 and 4 that in October 2009 after 7 months of circulation the dose rates values increased. The
maximum contact value now reached 11.93 µSv/h, with an average of 1.49 µSv/h (Guéry, 2009; Maquet, 2011). The same
behaviour is observed for the ambient measurements with a maximum of 1.00 µSv/h and a mean of 0.35 µSv/h. Table 1 presents
the cumulative volume of circulated geothermal fluid and the corresponding contact dose rate average for each survey (Maquet,
2011; Orsat, 2012a; Réaud, 2013).
Survey Volume (m3) Contact dose rate average
value (µSv/h)
June 2009 308 500 0.89
October 2009 404 000 1.49
May/June 2010 297 600 1.60
August 2010 408 300 1.78
October 2010 494 000 2.23
April 2011 160 000 1.88
October 2011 132 000 1.86
April 2012 112 800 1.77
April 2013 90 000 1.74
Table 1: Circulated volume and dose rate average for each survey
The third survey in May/June 2010 took place after around 6 months of circulation. In between the circulation tests of 2009 and
2010, a general cleaning of the installation was performed. Here the maximum contact value is 11.26 µSv/h and the average is 1.60
µSv/h (Cuenot et al., 2010a; Maquet 2011). Those values are close to those of the preceding survey, done after almost the same
circulation duration. Maximum ambient value reached 1.73 µSv/h, for an average of 0.43 µSv/h. During the next two surveys
performed in August and October 2010, the contact dose rate values continued to increase (Cuenot et al., 2010b). The maximum
Cuenot et al.
4
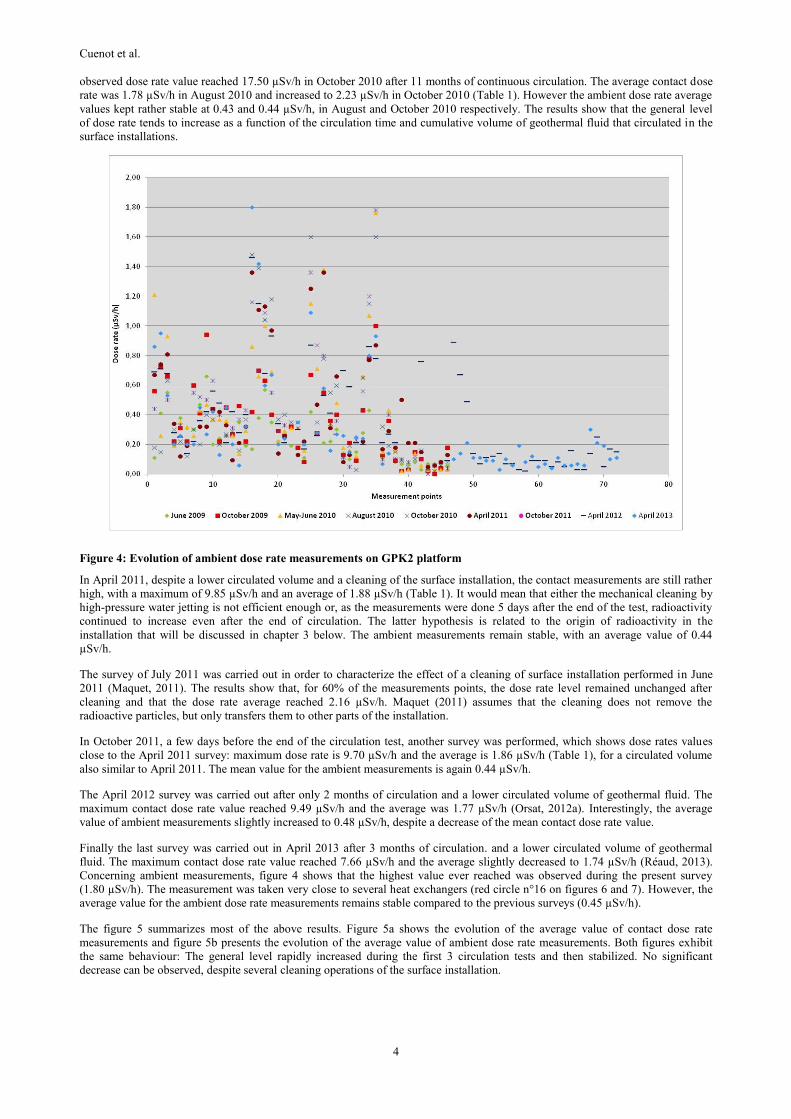
observed dose rate value reached 17.50 µSv/h in October 2010 after 11 months of continuous circulation. The average contact dose
rate was 1.78 µSv/h in August 2010 and increased to 2.23 µSv/h in October 2010 (Table 1). However the ambient dose rate average
values kept rather stable at 0.43 and 0.44 µSv/h, in August and October 2010 respectively. The results show that the general level
of dose rate tends to increase as a function of the circulation time and cumulative volume of geothermal fluid that circulated in the
surface installations.
Figure 4: Evolution of ambient dose rate measurements on GPK2 platform
In April 2011, despite a lower circulated volume and a cleaning of the surface installation, the contact measurements are still rather
high, with a maximum of 9.85 µSv/h and an average of 1.88 µSv/h (Table 1). It would mean that either the mechanical cleaning by
high-pressure water jetting is not efficient enough or, as the measurements were done 5 days after the end of the test, radioactivity
continued to increase even after the end of circulation. The latter hypothesis is related to the origin of radioactivity in the
installation that will be discussed in chapter 3 below. The ambient measurements remain stable, with an average value of 0.44
µSv/h.
The survey of July 2011 was carried out in order to characterize the effect of a cleaning of surface installation performed in June
2011 (Maquet, 2011). The results show that, for 60% of the measurements points, the dose rate level remained unchanged after
cleaning and that the dose rate average reached 2.16 µSv/h. Maquet (2011) assumes that the cleaning does not remove the
radioactive particles, but only transfers them to other parts of the installation.
In October 2011, a few days before the end of the circulation test, another survey was performed, which shows dose rates values
close to the April 2011 survey: maximum dose rate is 9.70 µSv/h and the average is 1.86 µSv/h (Table 1), for a circulated volume
also similar to April 2011. The mean value for the ambient measurements is again 0.44 µSv/h.
The April 2012 survey was carried out after only 2 months of circulation and a lower circulated volume of geothermal fluid. The
maximum contact dose rate value reached 9.49 µSv/h and the average was 1.77 µSv/h (Orsat, 2012a). Interestingly, the average
value of ambient measurements slightly increased to 0.48 µSv/h, despite a decrease of the mean contact dose rate value.
Finally the last survey was carried out in April 2013 after 3 months of circulation. and a lower circulated volume of geothermal
fluid. The maximum contact dose rate value reached 7.66 µSv/h and the average slightly decreased to 1.74 µSv/h (Réaud, 2013).
Concerning ambient measurements, figure 4 shows that the highest value ever reached was observed during the present survey
(1.80 µSv/h). The measurement was taken very close to several heat exchangers (red circle n°16 on figures 6 and 7). However, the
average value for the ambient dose rate measurements remains stable compared to the previous surveys (0.45 µSv/h).
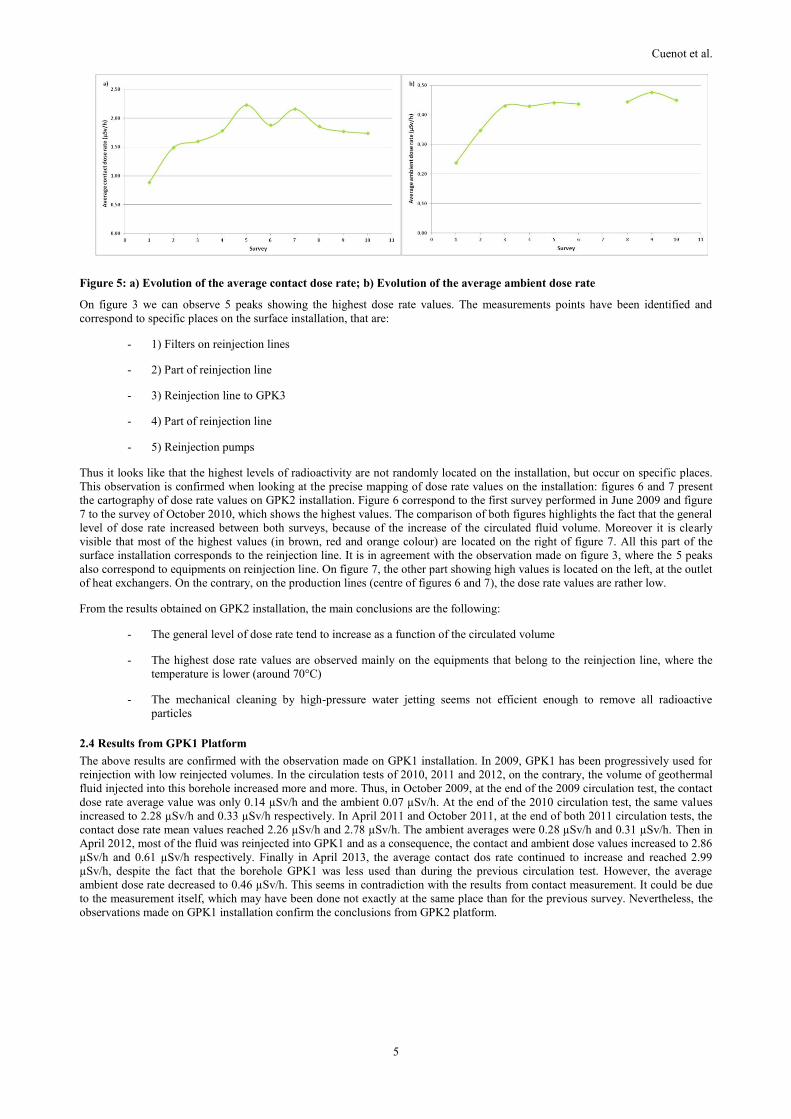
The figure 5 summarizes most of the above results. Figure 5a shows the evolution of the average value of contact dose rate
measurements and figure 5b presents the evolution of the average value of ambient dose rate measurements. Both figures exhibit
the same behaviour: The general level rapidly increased during the first 3 circulation tests and then stabilized. No significant
decrease can be observed, despite several cleaning operations of the surface installation.
Cuenot et al.
5
Figure 5: a) Evolution of the average contact dose rate; b) Evolution of the average ambient dose rate
On figure 3 we can observe 5 peaks showing the highest dose rate values. The measurements points have been identified and
correspond to specific places on the surface installation, that are:
- 1) Filters on reinjection lines
- 2) Part of reinjection line
- 3) Reinjection line to GPK3
- 4) Part of reinjection line
- 5) Reinjection pumps
Thus it looks like that the highest levels of radioactivity are not randomly located on the installation, but occur on specific places.
This observation is confirmed when looking at the precise mapping of dose rate values on the installation: figures 6 and 7 present
the cartography of dose rate values on GPK2 installation. Figure 6 correspond to the first survey performed in June 2009 and figure
7 to the survey of October 2010, which shows the highest values. The comparison of both figures highlights the fact that the general
level of dose rate increased between both surveys, because of the increase of the circulated fluid volume. Moreover it is clearly
visible that most of the highest values (in brown, red and orange colour) are located on the right of figure 7. All this part of the
surface installation corresponds to the reinjection line. It is in agreement with the observation made on figure 3, where the 5 peaks
also correspond to equipments on reinjection line. On figure 7, the other part showing high values is located on the left, at the outlet
of heat exchangers. On the contrary, on the production lines (centre of figures 6 and 7), the dose rate values are rather low.
From the results obtained on GPK2 installation, the main conclusions are the following:
- The general level of dose rate tend to increase as a function of the circulated volume
- The highest dose rate values are observed mainly on the equipments that belong to the reinjection line, where the
temperature is lower (around 70°C)
- The mechanical cleaning by high-pressure water jetting seems not efficient enough to remove all radioactive
particles
2.4 Results from GPK1 Platform
The above results are confirmed with the observation made on GPK1 installation. In 2009, GPK1 has been progressively used for
reinjection with low reinjected volumes. In the circulation tests of 2010, 2011 and 2012, on the contrary, the volume of geothermal
fluid injected into this borehole increased more and more. Thus, in October 2009, at the end of the 2009 circulation test, the contact
dose rate average value was only 0.14 µSv/h and the ambient 0.07 µSv/h. At the end of the 2010 circulation test, the same values
increased to 2.28 µSv/h and 0.33 µSv/h respectively. In April 2011 and October 2011, at the end of both 2011 circulation tests, the
contact dose rate mean values reached 2.26 µSv/h and 2.78 µSv/h. The ambient averages were 0.28 µSv/h and 0.31 µSv/h. Then in
April 2012, most of the fluid was reinjected into GPK1 and as a consequence, the contact and ambient dose values increased to 2.86
µSv/h and 0.61 µSv/h respectively. Finally in April 2013, the average contact dos rate continued to increase and reached 2.99
µSv/h, despite the fact that the borehole GPK1 was less used than during the previous circulation test. However, the average
ambient dose rate decreased to 0.46 µSv/h. This seems in contradiction with the results from contact measurement. It could be due
to the measurement itself, which may have been done not exactly at the same place than for the previous survey. Nevertheless, the
observations made on GPK1 installation confirm the conclusions from GPK2 platform.

Cuenot et al.
6
Figure 6: Cartography of dose rates on GPK2 platform from the survey performed in June 2009. The coloured circles
correspond to the contact measurements points and the colour code is function of the dose rate value. The red circles
with a red number indicate the ambient measurement positions.

Cuenot et al.
7
Figure 7: Cartography of dose rates on GPK2 platform from the survey performed in October 2010. The coloured circles
correspond to the contact measurements points and the colour code is function of the dose rate value. The red circles
with a red number indicate the ambient measurement positions.
Cuenot et al.
8
3. ORIGIN OF RADIOACTIVITY IN THE GEOTHERMAL INSTALLATION
3.1 Scaling in the Surface Installation
From the precise mapping of dose rate values on GPK1 and GPK2 surface installation, it appears that the highest levels are located
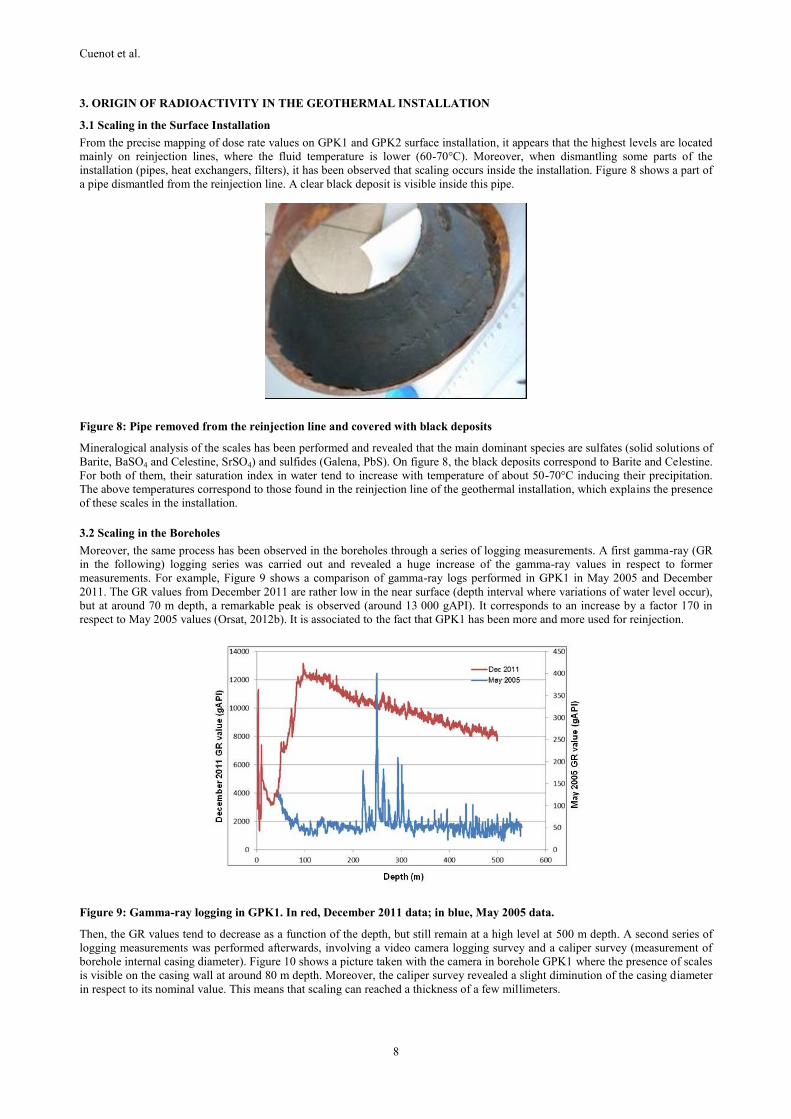
mainly on reinjection lines, where the fluid temperature is lower (60-70°C). Moreover, when dismantling some parts of the
installation (pipes, heat exchangers, filters), it has been observed that scaling occurs inside the installation. Figure 8 shows a part of
a pipe dismantled from the reinjection line. A clear black deposit is visible inside this pipe.
Figure 8: Pipe removed from the reinjection line and covered with black deposits
Mineralogical analysis of the scales has been performed and revealed that the main dominant species are sulfates (solid solutions of
Barite, BaSO4 and Celestine, SrSO4) and sulfides (Galena, PbS). On figure 8, the black deposits correspond to Barite and Celestine.
For both of them, their saturation index in water tend to increase with temperature of about 50-70°C inducing their precipitation.
The above temperatures correspond to those found in the reinjection line of the geothermal installation, which explains the presence
of these scales in the installation.
3.2 Scaling in the Boreholes
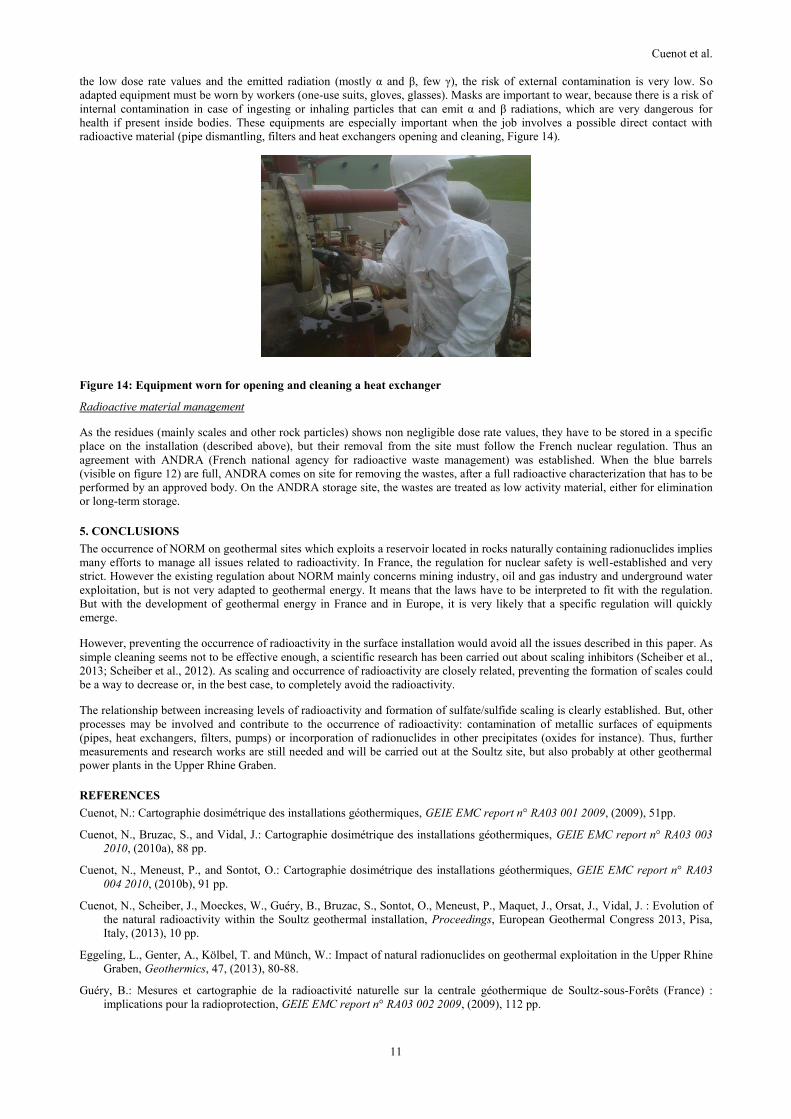
Moreover, the same process has been observed in the boreholes through a series of logging measurements. A first gamma-ray (GR
in the following) logging series was carried out and revealed a huge increase of the gamma-ray values in respect to former
measurements. For example, Figure 9 shows a comparison of gamma-ray logs performed in GPK1 in May 2005 and December
2011. The GR values from December 2011 are rather low in the near surface (depth interval where variations of water level occur),
but at around 70 m depth, a remarkable peak is observed (around 13 000 gAPI). It corresponds to an increase by a factor 170 in
respect to May 2005 values (Orsat, 2012b). It is associated to the fact that GPK1 has been more and more used for reinjection.
Figure 9: Gamma-ray logging in GPK1. In red, December 2011 data; in blue, May 2005 data.
Then, the GR values tend to decrease as a function of the depth, but still remain at a high level at 500 m depth. A second series of
logging measurements was performed afterwards, involving a video camera logging survey and a caliper survey (measurement of
borehole internal casing diameter). Figure 10 shows a picture taken with the camera in borehole GPK1 where the presence of scales
is visible on the casing wall at around 80 m depth. Moreover, the caliper survey revealed a slight diminution of the casing diameter
in respect to its nominal value. This means that scaling can reached a thickness of a few millimeters.

Cuenot et al.
9
Figure 10: Camera view of GPK1 borehole wall showing the presence of deposits.
GR and caliper logging surveys were also performed in reinjection borehole GPK3 in December 2012; they show the same results
as GPK1 survey, namely, high GR values and presence of a few millimeters thick scales.
However, the same series of logging measurements was performed into production borehole GPK2. They show slightly increased
GR values and the presence of very localized scaling. In GPK4, mainly used as a production well, a very low level of radioactivity
and very few deposits were observed in the December 2012 logging surveys. So the level of GR values and the volume of scales are
very different in the production boreholes than in reinjection boreholes.
Thus, from the observation made on surface installation and in the geothermal boreholes, a clear relationship appears between the
presence of scaling and the occurrence of radioactivity.
3.3 Relationship Scaling/Radioactivity: Origin of Radioactivity
A research work has been carried out to understand the origin of radioactivity linked with scaling formation. Eggeling et al. (2013)
showed that, during the precipitation of Barite and Celestine, atoms of Barium (Br2+) and Strontium (Sr2+) can be replaced by atoms
of Radium (Ra2+), because of their similar atomic radius. Then, 226Ra can be incorporated in the Barite and Celestine crystals. 226Ra
is a product of the disintegration of Uranium 238U, that is naturally present in the granite.
Concerning Galena (PbS), the process which leads to the occurrence of radioactivity is the incorporation of a radioactive isotope of
lead, namely 210Pb, during the crystallization of Galena.
The radioactive material which is indeed created is due to natural chemical processes, but they are not the results of a dedicated
industrial process. Thus in the nuclear regulation, they are called NORM (Naturally Occurring Radioactive Material).
4. RADIATION PROTECTION
4.1 Some Values for Comparison
The general dose rate level is not very high, especially the ambient dose rate values, which best represent work positions. For
instance, ambient values of 1 µSv/h would require for a worker to spend 1000 hours in this environment, in order to reach the legal
limit of 1 mSv/h over a period of 12 consecutive months. This is clearly unrealistic. Moreover, to give a better idea of the level of
dose rate on the surface installation, it is interesting to compare it with examples of human natural and medical exposure (Table 2).
For example, in France, the average natural dose received per year is 2.6 mSv, coming mostly from exposure to radon but also
cosmic and telluric radiations. This value is higher than the legal limit of 1 mSv.
Origin of radiation Dose received
Cosmic radiations 0.31 mSv/year (average in France)
Telluric radiations 0.60 mSv/year (average in France)
Exposure to Radon 1.5 mSv/year (average in France)
Flight Paris-New York 0.02 mSv
Chest X-ray 0.05 mSv
Chest scanner 5.7 mSv
Abdominal scanner 12 mSv
Table 2: Examples of naturally and medically received doses.
4.2 Radiation Protection Procedures
In regards to the values in Table 2 and considering the annual working time, the dose rates observed in the surface installation are
rather low. Nevertheless, because of the occurrence of radiations, even low, the French nuclear regulation requires setting up
radiation protection procedure for the workers, but also for the public as the Soultz site regularly welcomes visitors. Two “PCR” (in
French: Personne Compétente en Radioprotection, Radiation Protection Expert) have been trained and nominated in the GEIE and
are in charge of the organization of radiation protection in the company and exchanges with authorities.

Cuenot et al.
10
Installation zoning
The first measure was to set up a zoning of the installation, in respect to the French regulation, which implies a restricted access. A
blue zone, called “protected area” has been defined to ensure that, outside this zone, no one would receive a dose of 1 mSv over 12
consecutive months. Practically, its limits are defined by an average dose rate of 0.5 µSv/h, which is in the range of the average
ambient dose rates measured on surface installation. A blue line has been drawn on the floor and blue radioactive signs have been
installed (Figure 11).
Figure 11: Blue line and radioactive sign defining the protected area
A second zone has been defined around the place where residues of scales from filters, heat exchangers and pipes are stored. Due to
their radioactive content, these residues have to be stored into barrels, in a specific place that is isolated from the main installation.
Due to the accumulation of radioactive material inside this area, which involves an increase of the dose rate, a green zone, called
“controlled area” has been defined, where the access is even more restricted than in the “protected area” (Figure 12).
Figure 12: Storage of radioactive residues in the controlled area
Radiation protection procedures for workers
Some of the works that have to be done on the installation require specific radiation protection procedures for the workers. The first
is imposed by the French regulation and is linked with the zoning of the installation: in protected or controlled areas, workers must
wear a personal dosimeter (Figure 13) which records the cumulative dose that they received during their working time. Every 3
months, they are sent back to IRSN (Institut de Radioprotection et de Sûreté Nucléaire). Here they are analyzed to see if the legal
dose of 1 mSv over 12 consecutive months has been reached or not. Results are sent to the works doctor in charge of the company,
who has to proceed to a specific follow up of the workers. Moreover, if external workers need to enter in the protected area, a work
permit is required and must be signed by the PCR.
Figure 13: Personal dosimeters of GEIE’s employees
A detailed analysis of every work station has to be made by the PCR so as to evaluate the dose that can be received. This has to be
further confirmed by real measurements. Once it has been done, specific radiation protection procedures can be set up. In view of
Cuenot et al.
11
the low dose rate values and the emitted radiation (mostly α and β, few γ), the risk of external contamination is very low. So
adapted equipment must be worn by workers (one-use suits, gloves, glasses). Masks are important to wear, because there is a risk of
internal contamination in case of ingesting or inhaling particles that can emit α and β radiations, which are very dangerous for
health if present inside bodies. These equipments are especially important when the job involves a possible direct contact with
radioactive material (pipe dismantling, filters and heat exchangers opening and cleaning, Figure 14).
Figure 14: Equipment worn for opening and cleaning a heat exchanger
Radioactive material management
As the residues (mainly scales and other rock particles) shows non negligible dose rate values, they have to be stored in a specific
place on the installation (described above), but their removal from the site must follow the French nuclear regulation. Thus an
agreement with ANDRA (French national agency for radioactive waste management) was established. When the blue barrels
(visible on figure 12) are full, ANDRA comes on site for removing the wastes, after a full radioactive characterization that has to be
performed by an approved body. On the ANDRA storage site, the wastes are treated as low activity material, either for elimination
or long-term storage.
5. CONCLUSIONS
The occurrence of NORM on geothermal sites which exploits a reservoir located in rocks naturally containing radionuclides implies
many efforts to manage all issues related to radioactivity. In France, the regulation for nuclear safety is well-established and very
strict. However the existing regulation about NORM mainly concerns mining industry, oil and gas industry and underground water
exploitation, but is not very adapted to geothermal energy. It means that the laws have to be interpreted to fit with the regulation.
But with the development of geothermal energy in France and in Europe, it is very likely that a specific regulation will quickly
emerge.
However, preventing the occurrence of radioactivity in the surface installation would avoid all the issues described in this paper. As
simple cleaning seems not to be effective enough, a scientific research has been carried out about scaling inhibitors (Scheiber et al.,
2013; Scheiber et al., 2012). As scaling and occurrence of radioactivity are closely related, preventing the formation of scales could
be a way to decrease or, in the best case, to completely avoid the radioactivity.
The relationship between increasing levels of radioactivity and formation of sulfate/sulfide scaling is clearly established. But, other
processes may be involved and contribute to the occurrence of radioactivity: contamination of metallic surfaces of equipments
(pipes, heat exchangers, filters, pumps) or incorporation of radionuclides in other precipitates (oxides for instance). Thus, further
measurements and research works are still needed and will be carried out at the Soultz site, but also probably at other geothermal
power plants in the Upper Rhine Graben.
REFERENCES
Cuenot, N.: Cartographie dosimétrique des installations géothermiques, GEIE EMC report n° RA03 001 2009, (2009), 51pp.
Cuenot, N., Bruzac, S., and Vidal, J.: Cartographie dosimétrique des installations géothermiques, GEIE EMC report n° RA03 003
2010, (2010a), 88 pp.
Cuenot, N., Meneust, P., and Sontot, O.: Cartographie dosimétrique des installations géothermiques, GEIE EMC report n° RA03
004 2010, (2010b), 91 pp.
Cuenot, N., Scheiber, J., Moeckes, W., Guéry, B., Bruzac, S., Sontot, O., Meneust, P., Maquet, J., Orsat, J., Vidal, J. : Evolution of
the natural radioactivity within the Soultz geothermal installation, Proceedings, European Geothermal Congress 2013, Pisa,
Italy, (2013), 10 pp.
Eggeling, L., Genter, A., Kölbel, T. and Münch, W.: Impact of natural radionuclides on geothermal exploitation in the Upper Rhine
Graben, Geothermics, 47, (2013), 80-88.
Guéry, B.: Mesures et cartographie de la radioactivité naturelle sur la centrale géothermique de Soultz-sous-Forêts (France) :
implications pour la radioprotection, GEIE EMC report n° RA03 002 2009, (2009), 112 pp.

Cuenot et al.
12
Maquet, J.: Radioactivité naturelle de la centrale géothermique de Soultz-sous-Forêts, cartographies dosimétriques d’avril et juillet
2011 et comparaison avec les campagnes de mesures antérieures, GEIE EMC report n° RA03 005 2011, (2011), 58 pp.
Orsat, J.: Etude de la radioactivité naturelle de la centrale géothermique de Soultz-sous-Forêts. Mesure, cartographie, comparaison
avec les campagnes précédentes et influence sur la radioprotection, GEIE EMC report n° RA03 006 2012, (2012a), 32 pp.
Orsat, J.: Etude de la radioactivité dans les puits GPK-1 et GPK-3 : corrélation entre les mesures géophysiques et inspection
visuelle du puits par vidéo caméra, GEIE EMC report n° RA03 007 2012, (2012b), 52pp.
Réaud, M.: L’évolution de la radioactivité naturelle de la centrale géothermique de Soultz-sous-Forêts, GEIE EMC report n° RA03
008 2013, (2013), 25pp.
Scheiber, J., Nitschke, F., Seibt, A. and Genter A.: Geochemical and mineralogical monitoring of the geothermal power plant in
Soultz-sous-Forêts (France), Proceedings, 37th Workshop on Geothermal Reservoir Engineering, Stanford University,
Stanford, CA, USA (2012), 10 pp.
Scheiber, J., Seibt, A., Birner, J., Genter, A. and Moeckes, W.: Application of a Scaling Inhibitor System at the Geothermal Power
Plant in Soultz-sous-Forêts: Laboratory and On-site Studies, Proceedings, European Geothermal Congress 2013, Pisa, Italy,
(2013), 10 pp.
Related Documents


