Syst. Biol. 53(6):914–932, 2004 Copyright c Society of Systematic Biologists ISSN: 1063-5157 print / 1076-836X online DOI: 10.1080/10635150490888840 Evolution of a RNA Polymerase Gene Family in Silene (Caryophyllaceae)—Incomplete Concerted Evolution and Topological Congruence Among Paralogues MAGNUS POPP AND BENGT OXELMAN Department of Systematic Botany, Evolutionary Biology Centre, Uppsala University, Norbyv¨ agen 18D, SE-752 36 Uppsala, Sweden; E-mail: [email protected] (M.P.) Abstract.—Four low-copy nuclear DNA intron regions from the second largest subunits of the RNA polymerase gene family (RPA2, RPB2, RPD2a, and RPD2b), the internal transcribed spacers (ITSs) from the nuclear ribosomal regions, and the rps16 intron from the chloroplast were sequenced and used in a phylogenetic analysis of 29 species from the tribe Sileneae (Caryophyllaceae). We used a low stringency nested polymerase chain reaction (PCR) approach to overcome the difficulties of constructing specific primers for amplification of the low copy nuclear DNA regions. Maximum parsimony analyses resulted in largely congruent phylogenetic trees for all regions. We tested overall model congruence in a likelihood context using the software PLATO and found that ITSs, RPA2, and RPB2 deviated from the maximum likelihood model for the combined data. The topology parameter was then isolated and topological congruence assessed by nonparametric bootstrapping. No strong topological incongruence was found. The analysis of the combined data sets resolves previously poorly known major relationships within Sileneae. Two paralogues of RPD2 were found, and several independent losses and incomplete concerted evolution were inferred. The among-site rate variation was significantly lower in the RNA polymerase introns than in the rps16 intron and ITSs, a property that is attractive in phylogenetic analyses. [Caryophyllaceae; concerted evolution; congruence test; low-copy nuclear genes; paralogy; RNA polymerase; Sileneae.] Nuclear ribosomal DNA (nrDNA) and chloroplast DNA (cpDNA) are the most widely used DNA regions to infer phylogenetic relationships among plants. And for good reasons too; both nrDNA and cpDNA are abun- dant in plant cells, they are usually easy to amplify and sequence using standard protocols, and the phylogenetic interpretations are generally reasonably uncomplicated. However, there are some limitations with nrDNA and cpDNA, for example incomplete homogenization of the tandem repeats in nrDNA (Buckler et al., 1997), or loss of one or more of the homoeologs in allopolyploids (Wendel et al., 1995). Due to the predominant maternal inheritance of chloroplasts, the evolutionary history of cpDNA may differ substantially from that of the main part of the nuclear genome (Cronn et al., 2002; Ferguson and Jansen, 2002), and the transfer of DNA regions from the plastid to the nucleus (Martin and Herrmann, 1998; Rujan and Martin, 2001) may further complicate the picture. Although these characteristics of nrDNA and cpDNA sometimes may cause severe difficulties when inferring organismal phylogenies, in many cases they do not. The major problem when working at shallower taxonomical levels is often that there is just not enough information to draw unambiguous conclusions from. The ambiguity may either stem from the fact that there is not enough information from nucleotide substitutions and/or the cpDNA/nrDNA trees are discordant to or incomplete with respect to the organismal history (see Sang, 2002). To deal with these problems, there has been a surge of “new” low-copy nuclear DNA regions (lcnDNA) used in plant phylogenetics the last few years, for example Adh (Yokoyama and Harry, 1993; Kosuge et al., 1995), GPAT (Tank and Sang, 2001), waxy (Mason-Gamer et al., 1998), Betv1 (Wen et al., 1997), PgiC (Gottlieb and Ford, 1996), and RPB2 (Denton et al., 1998; Oxelman and Bremer, 2000; Popp and Oxelman, 2001). Cronn et al. (2002) used 11 single-copy nuclear loci to study the evolution of the major lineages in Gossypium (Malvaceae). The incorporation of lcnDNA regions in phylogenet- ics has not been without obstacles. The evolution of lc- nDNA regions is largely unknown but seem to be rather dynamic with fluctuating copy numbers, differences in chromosomal locations, and recombination events (e.g., Gottlieb and Ford, 1996; Clegg et al., 1997; Martin and Burg, 2002). This contributes to the difficulties of deter- mining orthology of the sequences used and emphasizes the importance of as complete sampling of sequences as possible. The paralogy may stem from, for exam- ple, duplications within the same organism, or lateral transfer between organisms (Wendel and Doyle, 1998). In plants, allopolyploidy is an important evolutionary process, in which the entire genomes of the parental lin- eages are merged. It is possible to differentiate between paralogy due to gene duplication and paralogy due to allopolyploidy by using several unlinked regions simul- taneously. However, few, if any, protocols for lcnDNA regions can be applied to a given plant group without optimization and redesign of polymerase chain reaction (PCR) primers and of PCR parameters. Sang (2002) con- sidered it unlikely that there will be universal primers for the majority of low-copy nuclear genes. Instead, primers specific for less inclusive groups (families, genera) will have to be developed. The RNA polymerase (RNAP) family consists of three large nuclear DNA-dependent RNA polymerase holoen- zymes in most eukaryotes. RNAPs I and III transcribe structural RNA such as rRNA and tRNA, respectively, whereas RNAP II mainly transcribes mRNA. However, a fourth member, RNAP IV, is found only in plants and its function is yet to be elucidated (The Arabidop- sis Genome, 2000). In Arabidopsis thaliana, three of the 914 Downloaded from https://academic.oup.com/sysbio/article/53/6/914/1651891 by guest on 15 July 2022

Welcome message from author
This document is posted to help you gain knowledge. Please leave a comment to let me know what you think about it! Share it to your friends and learn new things together.
Transcript
Syst. Biol. 53(6):914–932, 2004Copyright c© Society of Systematic BiologistsISSN: 1063-5157 print / 1076-836X onlineDOI: 10.1080/10635150490888840
Evolution of a RNA Polymerase Gene Family in Silene (Caryophyllaceae)—IncompleteConcerted Evolution and Topological Congruence Among Paralogues
MAGNUS POPP AND BENGT OXELMAN
Department of Systematic Botany, Evolutionary Biology Centre, Uppsala University, Norbyvagen 18D, SE-752 36 Uppsala, Sweden;E-mail: [email protected] (M.P.)
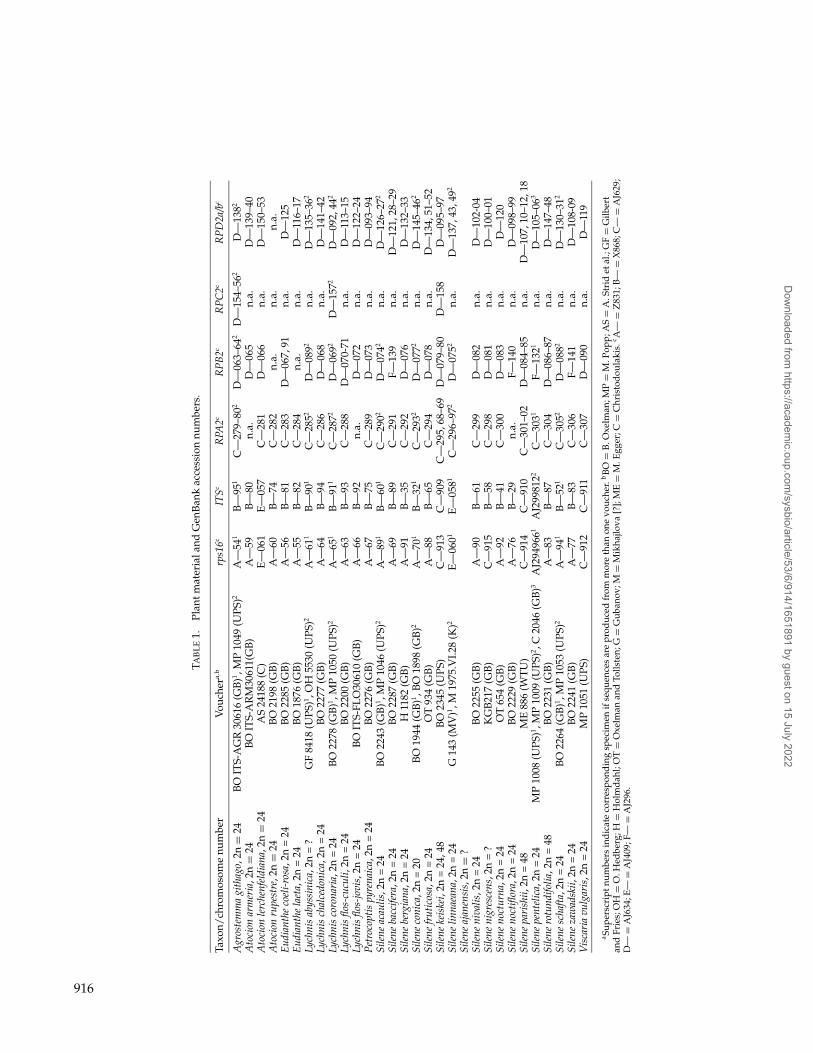
Abstract.—Four low-copy nuclear DNA intron regions from the second largest subunits of the RNA polymerase genefamily (RPA2, RPB2, RPD2a, and RPD2b), the internal transcribed spacers (ITSs) from the nuclear ribosomal regions, andthe rps16 intron from the chloroplast were sequenced and used in a phylogenetic analysis of 29 species from the tribeSileneae (Caryophyllaceae). We used a low stringency nested polymerase chain reaction (PCR) approach to overcome thedifficulties of constructing specific primers for amplification of the low copy nuclear DNA regions. Maximum parsimonyanalyses resulted in largely congruent phylogenetic trees for all regions. We tested overall model congruence in a likelihoodcontext using the software PLATO and found that ITSs, RPA2, and RPB2 deviated from the maximum likelihood modelfor the combined data. The topology parameter was then isolated and topological congruence assessed by nonparametricbootstrapping. No strong topological incongruence was found. The analysis of the combined data sets resolves previouslypoorly known major relationships within Sileneae. Two paralogues of RPD2 were found, and several independent losses andincomplete concerted evolution were inferred. The among-site rate variation was significantly lower in the RNA polymeraseintrons than in the rps16 intron and ITSs, a property that is attractive in phylogenetic analyses. [Caryophyllaceae; concertedevolution; congruence test; low-copy nuclear genes; paralogy; RNA polymerase; Sileneae.]
Nuclear ribosomal DNA (nrDNA) and chloroplastDNA (cpDNA) are the most widely used DNA regions toinfer phylogenetic relationships among plants. And forgood reasons too; both nrDNA and cpDNA are abun-dant in plant cells, they are usually easy to amplify andsequence using standard protocols, and the phylogeneticinterpretations are generally reasonably uncomplicated.
However, there are some limitations with nrDNAand cpDNA, for example incomplete homogenizationof the tandem repeats in nrDNA (Buckler et al., 1997), orloss of one or more of the homoeologs in allopolyploids(Wendel et al., 1995). Due to the predominant maternalinheritance of chloroplasts, the evolutionary history ofcpDNA may differ substantially from that of the mainpart of the nuclear genome (Cronn et al., 2002; Fergusonand Jansen, 2002), and the transfer of DNA regions fromthe plastid to the nucleus (Martin and Herrmann, 1998;Rujan and Martin, 2001) may further complicate thepicture.
Although these characteristics of nrDNA and cpDNAsometimes may cause severe difficulties when inferringorganismal phylogenies, in many cases they do not. Themajor problem when working at shallower taxonomicallevels is often that there is just not enough informationto draw unambiguous conclusions from. The ambiguitymay either stem from the fact that there is not enoughinformation from nucleotide substitutions and/or thecpDNA/nrDNA trees are discordant to or incompletewith respect to the organismal history (see Sang, 2002).To deal with these problems, there has been a surge of“new” low-copy nuclear DNA regions (lcnDNA) used inplant phylogenetics the last few years, for example Adh(Yokoyama and Harry, 1993; Kosuge et al., 1995), GPAT(Tank and Sang, 2001), waxy (Mason-Gamer et al., 1998),Betv1 (Wen et al., 1997), PgiC (Gottlieb and Ford, 1996),and RPB2 (Denton et al., 1998; Oxelman and Bremer,
2000; Popp and Oxelman, 2001). Cronn et al. (2002) used11 single-copy nuclear loci to study the evolution of themajor lineages in Gossypium (Malvaceae).
The incorporation of lcnDNA regions in phylogenet-ics has not been without obstacles. The evolution of lc-nDNA regions is largely unknown but seem to be ratherdynamic with fluctuating copy numbers, differences inchromosomal locations, and recombination events (e.g.,Gottlieb and Ford, 1996; Clegg et al., 1997; Martin andBurg, 2002). This contributes to the difficulties of deter-mining orthology of the sequences used and emphasizesthe importance of as complete sampling of sequencesas possible. The paralogy may stem from, for exam-ple, duplications within the same organism, or lateraltransfer between organisms (Wendel and Doyle, 1998).In plants, allopolyploidy is an important evolutionaryprocess, in which the entire genomes of the parental lin-eages are merged. It is possible to differentiate betweenparalogy due to gene duplication and paralogy due toallopolyploidy by using several unlinked regions simul-taneously. However, few, if any, protocols for lcnDNAregions can be applied to a given plant group withoutoptimization and redesign of polymerase chain reaction(PCR) primers and of PCR parameters. Sang (2002) con-sidered it unlikely that there will be universal primers forthe majority of low-copy nuclear genes. Instead, primersspecific for less inclusive groups (families, genera) willhave to be developed.
The RNA polymerase (RNAP) family consists of threelarge nuclear DNA-dependent RNA polymerase holoen-zymes in most eukaryotes. RNAPs I and III transcribestructural RNA such as rRNA and tRNA, respectively,whereas RNAP II mainly transcribes mRNA. However,a fourth member, RNAP IV, is found only in plantsand its function is yet to be elucidated (The Arabidop-sis Genome, 2000). In Arabidopsis thaliana, three of the
914
Dow
nloaded from https://academ
ic.oup.com/sysbio/article/53/6/914/1651891 by guest on 15 July 2022
2004 POPP AND OXELMAN—EVOLUTION OF A RNA POLYMERASE GENE FAMILY IN SILENE 915
genes (RPA2, RPB2, and RPC2), encoding the secondlargest subunits of these holoenzymes, are single-copyand are located on chromosomes 1, 4, and 5, respectively,whereas the fourth (RPD2) is present in two, presumablyrecently diverged paralogues located on chromosome 3(The Arabidopsis Genome, 2000).
The phylogeny of the tribe Sileneae (Caryophyllaceae)has recently been investigated using nrDNA (the ITS re-gions) and cpDNA (the rps16 intron) data (Oxelman andLiden, 1995; Desfeux and Lejeune, 1996; Oxelman et al.,1997, 2001). We choose 29 species from Sileneae to studythe evolution and the phylogenetic utility of the RNAPintrons and to compare the results with the analyses ofthe ITS and rps16 data.
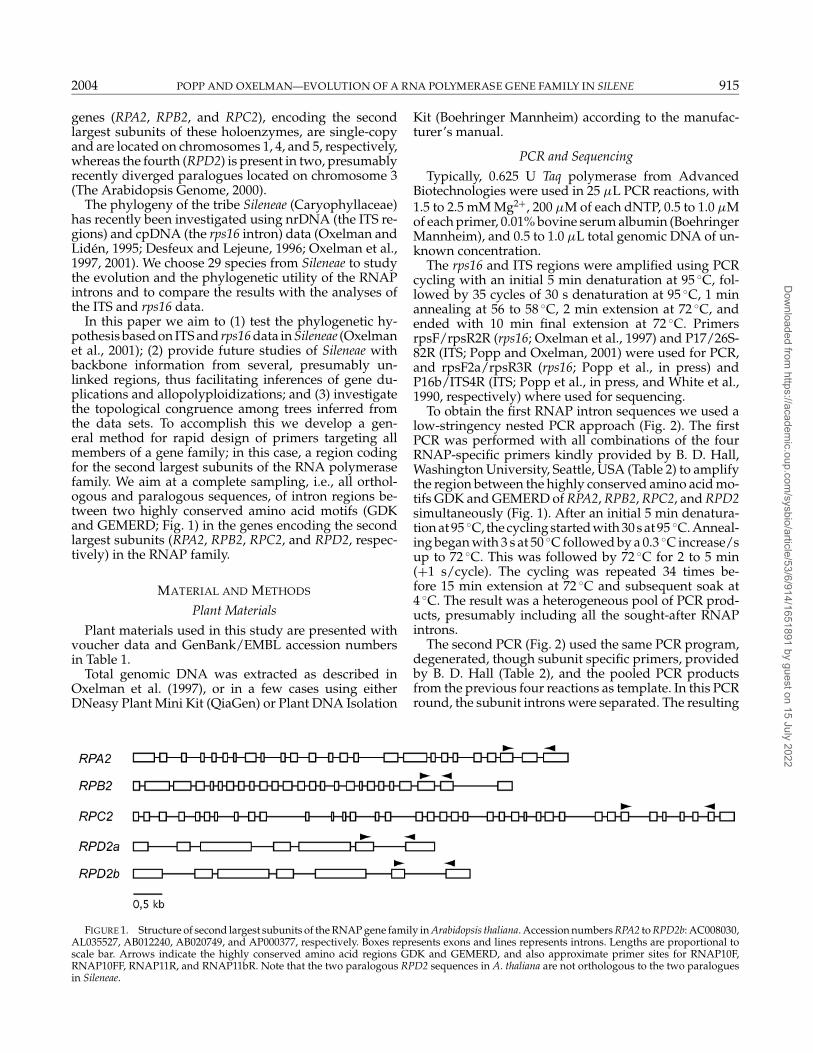
In this paper we aim to (1) test the phylogenetic hy-pothesis based on ITS and rps16 data in Sileneae (Oxelmanet al., 2001); (2) provide future studies of Sileneae withbackbone information from several, presumably un-linked regions, thus facilitating inferences of gene du-plications and allopolyploidizations; and (3) investigatethe topological congruence among trees inferred fromthe data sets. To accomplish this we develop a gen-eral method for rapid design of primers targeting allmembers of a gene family; in this case, a region codingfor the second largest subunits of the RNA polymerasefamily. We aim at a complete sampling, i.e., all orthol-ogous and paralogous sequences, of intron regions be-tween two highly conserved amino acid motifs (GDKand GEMERD; Fig. 1) in the genes encoding the secondlargest subunits (RPA2, RPB2, RPC2, and RPD2, respec-tively) in the RNAP family.
MATERIAL AND METHODS
Plant Materials
Plant materials used in this study are presented withvoucher data and GenBank/EMBL accession numbersin Table 1.
Total genomic DNA was extracted as described inOxelman et al. (1997), or in a few cases using eitherDNeasy Plant Mini Kit (QiaGen) or Plant DNA Isolation
FIGURE 1. Structure of second largest subunits of the RNAP gene family in Arabidopsis thaliana. Accession numbers RPA2 to RPD2b: AC008030,AL035527, AB012240, AB020749, and AP000377, respectively. Boxes represents exons and lines represents introns. Lengths are proportional toscale bar. Arrows indicate the highly conserved amino acid regions GDK and GEMERD, and also approximate primer sites for RNAP10F,RNAP10FF, RNAP11R, and RNAP11bR. Note that the two paralogous RPD2 sequences in A. thaliana are not orthologous to the two paraloguesin Sileneae.
Kit (Boehringer Mannheim) according to the manufac-turer’s manual.
PCR and Sequencing
Typically, 0.625 U Taq polymerase from AdvancedBiotechnologies were used in 25 µL PCR reactions, with1.5 to 2.5 mM Mg2+, 200 µM of each dNTP, 0.5 to 1.0 µMof each primer, 0.01% bovine serum albumin (BoehringerMannheim), and 0.5 to 1.0 µL total genomic DNA of un-known concentration.
The rps16 and ITS regions were amplified using PCRcycling with an initial 5 min denaturation at 95 ◦C, fol-lowed by 35 cycles of 30 s denaturation at 95 ◦C, 1 minannealing at 56 to 58 ◦C, 2 min extension at 72 ◦C, andended with 10 min final extension at 72 ◦C. PrimersrpsF/rpsR2R (rps16; Oxelman et al., 1997) and P17/26S-82R (ITS; Popp and Oxelman, 2001) were used for PCR,and rpsF2a/rpsR3R (rps16; Popp et al., in press) andP16b/ITS4R (ITS; Popp et al., in press, and White et al.,1990, respectively) where used for sequencing.
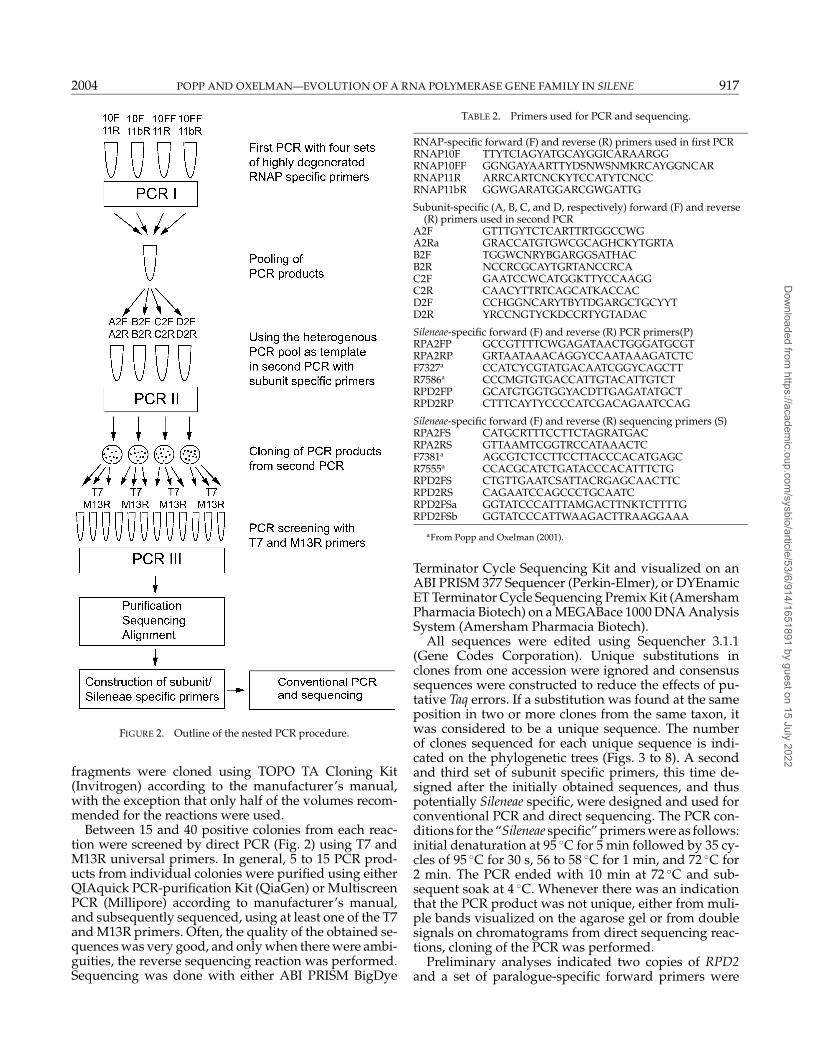
To obtain the first RNAP intron sequences we used alow-stringency nested PCR approach (Fig. 2). The firstPCR was performed with all combinations of the fourRNAP-specific primers kindly provided by B. D. Hall,Washington University, Seattle, USA (Table 2) to amplifythe region between the highly conserved amino acid mo-tifs GDK and GEMERD of RPA2, RPB2, RPC2, and RPD2simultaneously (Fig. 1). After an initial 5 min denatura-tion at 95 ◦C, the cycling started with 30 s at 95 ◦C. Anneal-ing began with 3 s at 50 ◦C followed by a 0.3 ◦C increase/sup to 72 ◦C. This was followed by 72 ◦C for 2 to 5 min(+1 s/cycle). The cycling was repeated 34 times be-fore 15 min extension at 72 ◦C and subsequent soak at4 ◦C. The result was a heterogeneous pool of PCR prod-ucts, presumably including all the sought-after RNAPintrons.
The second PCR (Fig. 2) used the same PCR program,degenerated, though subunit specific primers, providedby B. D. Hall (Table 2), and the pooled PCR productsfrom the previous four reactions as template. In this PCRround, the subunit introns were separated. The resulting
Dow
nloaded from https://academ
ic.oup.com/sysbio/article/53/6/914/1651891 by guest on 15 July 2022
TAB
LE
1.Pl
antm
ater
iala
ndG
enB
ank
acce
ssio
nnu
mbe
rs.
Taxo
n/ch
rom
osom
enu
mbe
rV
ouch
era,
brp
s16c
ITSc
RPA
2cR
PB
2cR
PC
2cR
PD
2a/b
c
Agr
oste
mm
agi
thag
o,2n
=24
BO
ITS-
AG
R30
616
(GB
)1 ,MP
1049
(UPS
)2A
—54
1B
—95
1C
—27
9–80
2D
—06
3–64
2D
—15
4–56
2D
—13
82
Ato
cion
arm
eria
,2n
=24
BO
ITS-
AR
M30
611(
GB
)A
—59
B—
80n.
a.D
—06
5n.
a.D
—13
9–40
Ato
cion
lerc
henf
eldi
ana,
2n=
24A
S24
188
(C)
E—
061
E—
057
C—
281
D—
066
n.a.
D—
150–
53A
toci
onru
pest
re,2
n=
24B
O21
98(G
B)
A—
60B
—74
C—
282
n.a.
n.a.
n.a.
Eud
iant
heco
eli-
rosa
,2n
=24
BO
2285
(GB
)A
—56
B—
81C
—28
3D
—06
7,91
n.a.
D—
125
Eud
iant
hela
eta,
2n=
24B
O18
76(G
B)
A—
55B
—82
C—
284
n.a.
n.a.
D—
116–
17Ly
chni
sab
yssi
nica
,2n
=?
GF
8418
(UPS
)1 ,OH
5530
(UPS
)2A
—61
1B
—90
1C
—28
52D
—08
92n.
a.D
—13
5–36
2
Lych
nis
chal
cedo
nica
,2n
=24
BO
2277
(GB
)A
—64
B—
94C
—28
6D
—06
8n.
a.D
—14
1–42
Lych
nis
coro
nari
a,2n
=24
BO
2278
(GB
)1 ,MP
1050
(UPS
)2A
—65
1B
—91
1C
—28
72D
—06
92D
—15
72D
—09
2,44
2
Lych
nis
flos-
cucu
li,2n
=24
BO
2200
(GB
)A
—63
B—
93C
—28
8D
—07
0-71
n.a.
D—
113–
15Ly
chni
sflo
s-jo
vis,
2n=
24B
OIT
S-FL
O30
610
(GB
)A
—66
B—
92n.
a.D
—07
2n.
a.D
—12
2–24
Pet
roco
ptis
pyre
naic
a,2n
=24
BO
2276
(GB
)A
—67
B—
75C
—28
9D
—07
3n.
a.D
—09
3–94
Sile
neac
aulis
,2n
=24
BO
2243
(GB
)1 ,MP
1046
(UPS
)2A
—89
1B
—60
1C
—29
02D
—07
42n.
a.D
—12
6–27
2
Sile
neba
ccife
ra,2
n=
24B
O22
87(G
B)
A—
69B
—89
C—
291
F—13
9n.
a.D
—12
1,28
–29
Sile
nebe
rgia
na,2
n=
24H
1182
(GB
)A
—91
B—
35C
—29
2D
—07
6n.
a.D
—13
2–33
Sile
neco
nica
,2n
=20
BO
1944
(GB
)1 ,BO
1898
(GB
)2A
—70
1B
—32
1C
—29
32D
—07
72n.
a.D
—14
5–46
2
Sile
nefr
utic
osa,
2n=
24O
T93
4(G
B)
A—
88B
—65
C—
294
D—
078
n.a.
D—
134,
51–5
2Si
lene
keis
kei,
2n=
24,4
8B
O23
45(U
PS)
C—
913
C—
909
C—
295,
68–6
9D
—07
9–80
D—
158
D—
095–
97Si
lene
linna
eana
,2n
=24
G14
3(M
V)1 ,M
1975
.VI.2
8(K
)2E
—06
01E
—05
81C
—29
6–97
2D
—07
52n.
a.D
—13
7,43
,492
Sile
neaj
anen
sis,
2n=
?Si
lene
niva
lis,2
n=
24B
O22
55(G
B)
A—
90B
—61
C—
299
D—
082
n.a.
D—
102-
04Si
lene
nigr
esce
ns,2
n=
?K
GB
217
(GB
)C
—91
5B
—58
C—
298
D—
081
n.a.
D—
100–
01Si
lene
noct
urna
,2n
=24
OT
654
(GB
)A
—92
B—
41C
—30
0D
—08
3n.
a.D
—12
0Si
lene
noct
iflor
a,2n
=24
BO
2229
(GB
)A
—76
B—
29n.
a.F—
140
n.a.
D—
098–
99Si
lene
pari
shii,
2n=
48M
E88
6(W
TU
)C
—91
4C
—91
0C
—30
1–02
D—
084–
85n.
a.D
—10
7,10
–12,
18Si
lene
pent
elic
a,2n
=24
MP
1008
(UPS
)1 ,MP
1009
(UPS
)2 ,C20
46(G
B)3
AJ2
9496
61A
J299
8122
C—
3031
F—13
21n.
a.D
—10
5–06
3
Sile
nero
tund
ifolia
,2n
=48
BO
2231
(GB
)A
—83
B—
87C
—30
4D
—08
6–87
n.a.
D—
147–
48Si
lene
scha
fta,
2n=
24B
O22
64(G
B)1 ,M
P10
53(U
PS)2
A—
941
B—
521
C—
3052
D—
0882
n.a.
D—
130–
312
Sile
neza
wad
skii,
2n=
24B
O22
41(G
B)
A—
77B
—83
C—
306
F—14
1n.
a.D
—10
8-09
Vis
cari
avu
lgar
is,2
n=
24M
P10
51(U
PS)
C—
912
C—
911
C—
307
D—
090
n.a.
D—
119
a Supe
rscr
iptn
umbe
rsin
dic
ate
corr
espo
ndin
gsp
ecim
enif
sequ
ence
sar
epr
oduc
edfr
omm
ore
than
one
vouc
her.
bB
O=
B.O
xelm
an;M
P=
M.P
opp;
AS
=A
.Str
idet
al.;
GF
=G
ilber
tan
dFr
ies;
OH
=O
.Hed
berg
;H=
Hol
md
ahl;
OT
=O
xelm
anan
dTo
llste
n;G
=G
uban
ov;M
=M
ikha
jlova
[?];
ME
=M
.Egg
er;C
=C
hris
tod
oula
kis.
c A—
=Z
831;
B—
=X
868;
C—
=A
J629
;D
—=
AJ6
34;E
—=
AJ4
09;F
—=
AJ2
96.
916
Dow
nloaded from https://academ
ic.oup.com/sysbio/article/53/6/914/1651891 by guest on 15 July 2022
2004 POPP AND OXELMAN—EVOLUTION OF A RNA POLYMERASE GENE FAMILY IN SILENE 917
FIGURE 2. Outline of the nested PCR procedure.
fragments were cloned using TOPO TA Cloning Kit(Invitrogen) according to the manufacturer’s manual,with the exception that only half of the volumes recom-mended for the reactions were used.
Between 15 and 40 positive colonies from each reac-tion were screened by direct PCR (Fig. 2) using T7 andM13R universal primers. In general, 5 to 15 PCR prod-ucts from individual colonies were purified using eitherQIAquick PCR-purification Kit (QiaGen) or MultiscreenPCR (Millipore) according to manufacturer’s manual,and subsequently sequenced, using at least one of the T7and M13R primers. Often, the quality of the obtained se-quences was very good, and only when there were ambi-guities, the reverse sequencing reaction was performed.Sequencing was done with either ABI PRISM BigDye
TABLE 2. Primers used for PCR and sequencing.
RNAP-specific forward (F) and reverse (R) primers used in first PCRRNAP10F TTYTCIAGYATGCAYGGICARAARGGRNAP10FF GGNGAYAARTTYDSNWSNMKRCAYGGNCARRNAP11R ARRCARTCNCKYTCCATYTCNCCRNAP11bR GGWGARATGGARCGWGATTG
Subunit-specific (A, B, C, and D, respectively) forward (F) and reverse(R) primers used in second PCR
A2F GTTTGYTCTCARTTRTGGCCWGA2Ra GRACCATGTGWCGCAGHCKYTGRTAB2F TGGWCNRYBGARGGSATHACB2R NCCRCGCAYTGRTANCCRCAC2F GAATCCWCATGGKTTYCCAAGGC2R CAACYTTRTCAGCATKACCACD2F CCHGGNCARYTBYTDGARGCTGCYYTD2R YRCCNGTYCKDCCRTYGTADAC
Sileneae-specific forward (F) and reverse (R) PCR primers(P)RPA2FP GCCGTTTTCWGAGATAACTGGGATGCGTRPA2RP GRTAATAAACAGGYCCAATAAAGATCTCF7327a CCATCYCGTATGACAATCGGYCAGCTTR7586a CCCMGTGTGACCATTGTACATTGTCTRPD2FP GCATGTGGTGGYACDTTGAGATATGCTRPD2RP CTTTCAYTYCCCCATCGACAGAATCCAG
Sileneae-specific forward (F) and reverse (R) sequencing primers (S)RPA2FS CATGCRTTTCCTTCTAGRATGACRPA2RS GTTAAMTCGGTRCCATAAACTCF7381a AGCGTCTCCTTCCTTACCCACATGAGCR7555a CCACGCATCTGATACCCACATTTCTGRPD2FS CTGTTGAATCSATTACRGAGCAACTTCRPD2RS CAGAATCCAGCCCTGCAATCRPD2FSa GGTATCCCATTTAMGACTTNKTCTTTTGRPD2FSb GGTATCCCATTWAAGACTTRAAGGAAA
aFrom Popp and Oxelman (2001).
Terminator Cycle Sequencing Kit and visualized on anABI PRISM 377 Sequencer (Perkin-Elmer), or DYEnamicET Terminator Cycle Sequencing Premix Kit (AmershamPharmacia Biotech) on a MEGABace 1000 DNA AnalysisSystem (Amersham Pharmacia Biotech).
All sequences were edited using Sequencher 3.1.1(Gene Codes Corporation). Unique substitutions inclones from one accession were ignored and consensussequences were constructed to reduce the effects of pu-tative Taq errors. If a substitution was found at the sameposition in two or more clones from the same taxon, itwas considered to be a unique sequence. The numberof clones sequenced for each unique sequence is indi-cated on the phylogenetic trees (Figs. 3 to 8). A secondand third set of subunit specific primers, this time de-signed after the initially obtained sequences, and thuspotentially Sileneae specific, were designed and used forconventional PCR and direct sequencing. The PCR con-ditions for the “Sileneae specific” primers were as follows:initial denaturation at 95 ◦C for 5 min followed by 35 cy-cles of 95 ◦C for 30 s, 56 to 58 ◦C for 1 min, and 72 ◦C for2 min. The PCR ended with 10 min at 72 ◦C and sub-sequent soak at 4 ◦C. Whenever there was an indicationthat the PCR product was not unique, either from muli-ple bands visualized on the agarose gel or from doublesignals on chromatograms from direct sequencing reac-tions, cloning of the PCR was performed.
Preliminary analyses indicated two copies of RPD2and a set of paralogue-specific forward primers were
Dow
nloaded from https://academ
ic.oup.com/sysbio/article/53/6/914/1651891 by guest on 15 July 2022
918 SYSTEMATIC BIOLOGY VOL. 53
constructed (Table 2) and used for both PCR andsequencing. The cloning procedure used in this study hasthe disadvantage of PCR-mediated recombinants beingsequenced. To detect recombinants, the criteria of Poppand Oxelman (2001) was employed.
Alignment and Gap coding
The sequences were manually aligned using Se-Al Ver.1.0a1 (A. Rambaut, http://evolve.zoo.ox.ac.uk). Gaps(inferred insertions/deletions) were introduced in the se-quences to keep the number of substitutions in an alignedregion to a minimum. Equal costs were assumed for gapopening and extension versus substitutions, but lowercosts to substitutions in case of ties. Two or more gaps ofequal length inferred at the same position were assumedto be a homologous character, and was binary codedas present/absent. Large autapomorphic insertions wereexcluded from the analyses. These insertions varied be-tween 50 bp (Silene bergiana, rps16) and 710 bp (Lychniscoronaria, RPA2).
Phylogenetic Analyses
Maximum parsimony analyses (MP in the follow-ing text) of all six data sets were performed separatelywith PAUP∗ version 4.0b10 for Macintosh (PPC), orUNIX (Swofford, 2002), using heuristic search, randomaddition sequence with 100 replicates, tree bisection-reconnection (TBR) branch swapping, MULTREES op-tion on, and DELTRAN optimization (ACCTRAN opti-mization may cause erroneous branch lengths in branchlengths tables and when printing trees due to a bug inPAUP∗ version 4.0b10). Maximum parsimony bootstrapanalyses (MPB in the following text) were carried outwith full heuristics, 1000 replicates, TBR branch swap-ping, MULTREES option off, and random addition se-quence with four replicates. Maximum likelihood esti-mates of all parameters, including branch lengths, wasdetermined on one arbitrarily chosen most parsimonioustree for each data set.
Bayesian posterior probabilities (PPs) for the nodesin the phylogenetic trees were estimated using MrBayesversion 3.0B4 (Huelsenbeck and Ronquist, 2001). Eachdata set was analyzed with the default prior distribu-tions and an optimal model of evolution determinedby MrModeltest version 1.1b (Nylander, 2003). MrMod-eltest is a modified version of Modeltest (Posada andCrandall 1998), which only considers models that can beused by MrBayes. Indels were included in the analysisand treated as binary “morphological” characters withabsence of an indel coded as “0,” and presence as “1.”The MCMC chains were run for 200000 generations.Every 100th tree was saved, resulting in 2001 trees foreach data set, of which the first 501 was discarded.This strategy supposedly conservatively discard theburn-in phase for likelihood scores, but there is noguarantee that this is so for the group frequencies,which is the parameter of interest here. Therefore,and because several studies have indicated high errorrates on PPs for groups (e.g., Erixon et al., 2003),
we choose a very high “significance level,” 0.99, forthose.
Based on previous analyses (Oxelman and Liden, 1995;Desfeux and Lejeune, 1996; Oxelman et al., 1997, 2001),Agrostemma githago was used for outgroup rooting.
In addition to separate analyses of each region, MPand MPB analyses of the combined data were performedwith the same settings. One sequence per species wasonly found in the rps16 and ITS data sets, and to beable to concatenate the data sets the numbers of termi-nals were reduced in the other matrices. We used con-sensus sequences from sequences found to be mono-phyletic within species. In the cases where sequenceswere found to be para- or polyphyletic within species, allsequences from that species were excluded from the par-ticular data set, and instead treated as missing data. Thisexcluded, in particular, the polyploid taxa from RPB2 andRPD2, as well as S. acaulis, S. nivalis, and S. fruticosa fromRPD2a.
Congruence Assessment
PLATO Ver. 2.0 (Grassly and Holmes, 1997) was usedto test for incongruence in the combined data set. Thissoftware uses a sliding window to find regions in a nu-cleotide matrix that do not fit a given model, and wasoriginally intended to discover possible recombinationor selection in a maximum likelihood context. Regionswith a significantly low likelihood indicate a deviationfrom the a priori phylogenetic model and therefore alsopossible topological incongruence. By assembling the se-quence regions in an arbitrary order, we avoid restrictingourselves to the boundaries defined by the PCR primers.Thus, we also enable the detection of recombinationevents within the individual sequenced regions. One po-tential drawback of this approach might be that the orderof the regions may affect the results. However, as long asdetected deviating regions do not cross region borders,this appears to be unproblematic.
Due to the prohibitively long computation time re-quired for a full maximum likelihood (ML in the follow-ing text) analysis estimating all parameters, ML analyseswere performed as follows: a MP topology was obtainedwith a heuristic search carried out as described above.Initial parameter values were estimated using an arbi-trary MP topology and a general time-reversible modelwith substitution rate variability among sites followinga gamma distribution (GTR+� model), as suggested byMrModeltest (Nylander, 2001). A complete TBR branchswapping with fixed GTR+� parameter values was per-formed under the ML criterion with the MP topology asstarting tree. The ML topology obtained was used to rees-timate the parameter values, which in turn were used toperform TBR branch swapping of the ML topology. Fi-nally, we performed a heuristic search with five randomsequence additions, TBR branch swapping and GTR+�using parameter values from the last iteration. The MLtopology thus obtained from the combined datasets andthe other model parameter values estimated with PAUP∗constituted the input for PLATO.
Dow
nloaded from https://academ
ic.oup.com/sysbio/article/53/6/914/1651891 by guest on 15 July 2022
2004 POPP AND OXELMAN—EVOLUTION OF A RNA POLYMERASE GENE FAMILY IN SILENE 919
TABLE 3. Matrix and tree statistics.
rps16 ITS RPA2 RPB2 RPD2 Combined
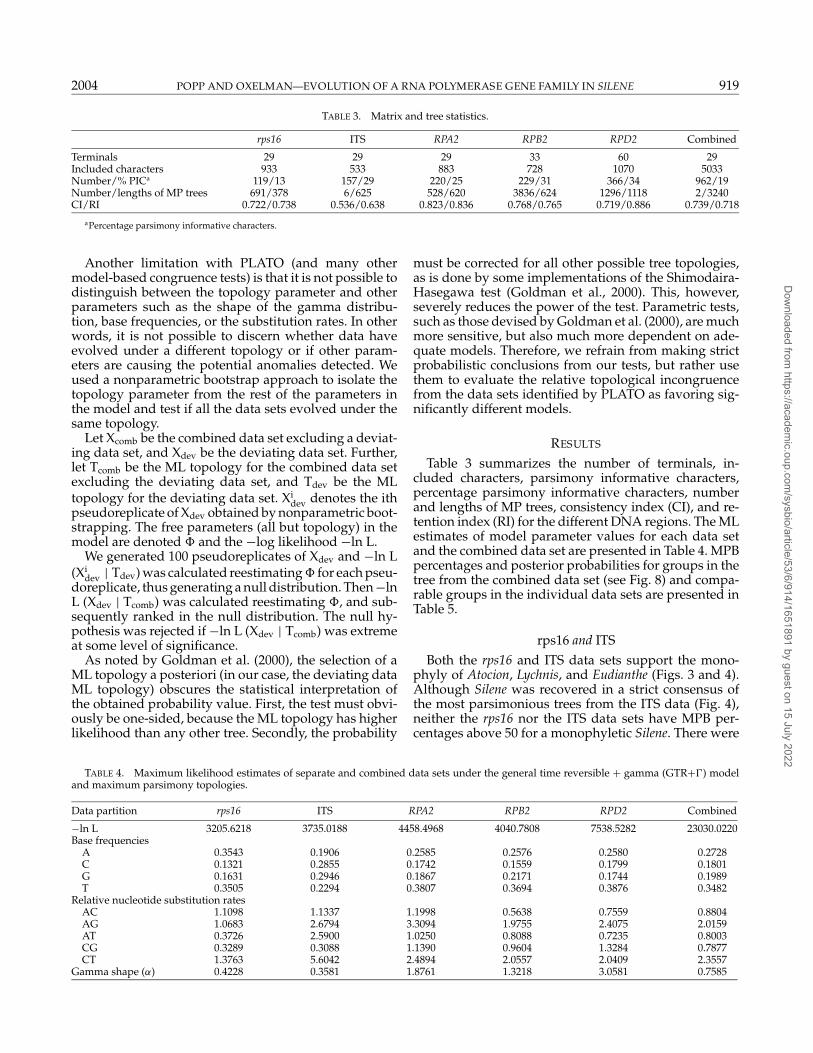
Terminals 29 29 29 33 60 29Included characters 933 533 883 728 1070 5033Number/% PICa 119/13 157/29 220/25 229/31 366/34 962/19Number/lengths of MP trees 691/378 6/625 528/620 3836/624 1296/1118 2/3240CI/RI 0.722/0.738 0.536/0.638 0.823/0.836 0.768/0.765 0.719/0.886 0.739/0.718
aPercentage parsimony informative characters.
Another limitation with PLATO (and many othermodel-based congruence tests) is that it is not possible todistinguish between the topology parameter and otherparameters such as the shape of the gamma distribu-tion, base frequencies, or the substitution rates. In otherwords, it is not possible to discern whether data haveevolved under a different topology or if other param-eters are causing the potential anomalies detected. Weused a nonparametric bootstrap approach to isolate thetopology parameter from the rest of the parameters inthe model and test if all the data sets evolved under thesame topology.
Let Xcomb be the combined data set excluding a deviat-ing data set, and Xdev be the deviating data set. Further,let Tcomb be the ML topology for the combined data setexcluding the deviating data set, and Tdev be the MLtopology for the deviating data set. Xi
dev denotes the ithpseudoreplicate of Xdev obtained by nonparametric boot-strapping. The free parameters (all but topology) in themodel are denoted � and the −log likelihood −ln L.
We generated 100 pseudoreplicates of Xdev and −ln L(Xi
dev | Tdev) was calculated reestimating � for each pseu-doreplicate, thus generating a null distribution. Then −lnL (Xdev | Tcomb) was calculated reestimating �, and sub-sequently ranked in the null distribution. The null hy-pothesis was rejected if −ln L (Xdev | Tcomb) was extremeat some level of significance.
As noted by Goldman et al. (2000), the selection of aML topology a posteriori (in our case, the deviating dataML topology) obscures the statistical interpretation ofthe obtained probability value. First, the test must obvi-ously be one-sided, because the ML topology has higherlikelihood than any other tree. Secondly, the probability
TABLE 4. Maximum likelihood estimates of separate and combined data sets under the general time reversible + gamma (GTR+�) modeland maximum parsimony topologies.
Data partition rps16 ITS RPA2 RPB2 RPD2 Combined
−ln L 3205.6218 3735.0188 4458.4968 4040.7808 7538.5282 23030.0220Base frequencies
A 0.3543 0.1906 0.2585 0.2576 0.2580 0.2728C 0.1321 0.2855 0.1742 0.1559 0.1799 0.1801G 0.1631 0.2946 0.1867 0.2171 0.1744 0.1989T 0.3505 0.2294 0.3807 0.3694 0.3876 0.3482
Relative nucleotide substitution ratesAC 1.1098 1.1337 1.1998 0.5638 0.7559 0.8804AG 1.0683 2.6794 3.3094 1.9755 2.4075 2.0159AT 0.3726 2.5900 1.0250 0.8088 0.7235 0.8003CG 0.3289 0.3088 1.1390 0.9604 1.3284 0.7877CT 1.3763 5.6042 2.4894 2.0557 2.0409 2.3557
Gamma shape (α) 0.4228 0.3581 1.8761 1.3218 3.0581 0.7585
must be corrected for all other possible tree topologies,as is done by some implementations of the Shimodaira-Hasegawa test (Goldman et al., 2000). This, however,severely reduces the power of the test. Parametric tests,such as those devised by Goldman et al. (2000), are muchmore sensitive, but also much more dependent on ade-quate models. Therefore, we refrain from making strictprobabilistic conclusions from our tests, but rather usethem to evaluate the relative topological incongruencefrom the data sets identified by PLATO as favoring sig-nificantly different models.
RESULTS
Table 3 summarizes the number of terminals, in-cluded characters, parsimony informative characters,percentage parsimony informative characters, numberand lengths of MP trees, consistency index (CI), and re-tention index (RI) for the different DNA regions. The MLestimates of model parameter values for each data setand the combined data set are presented in Table 4. MPBpercentages and posterior probabilities for groups in thetree from the combined data set (see Fig. 8) and compa-rable groups in the individual data sets are presented inTable 5.
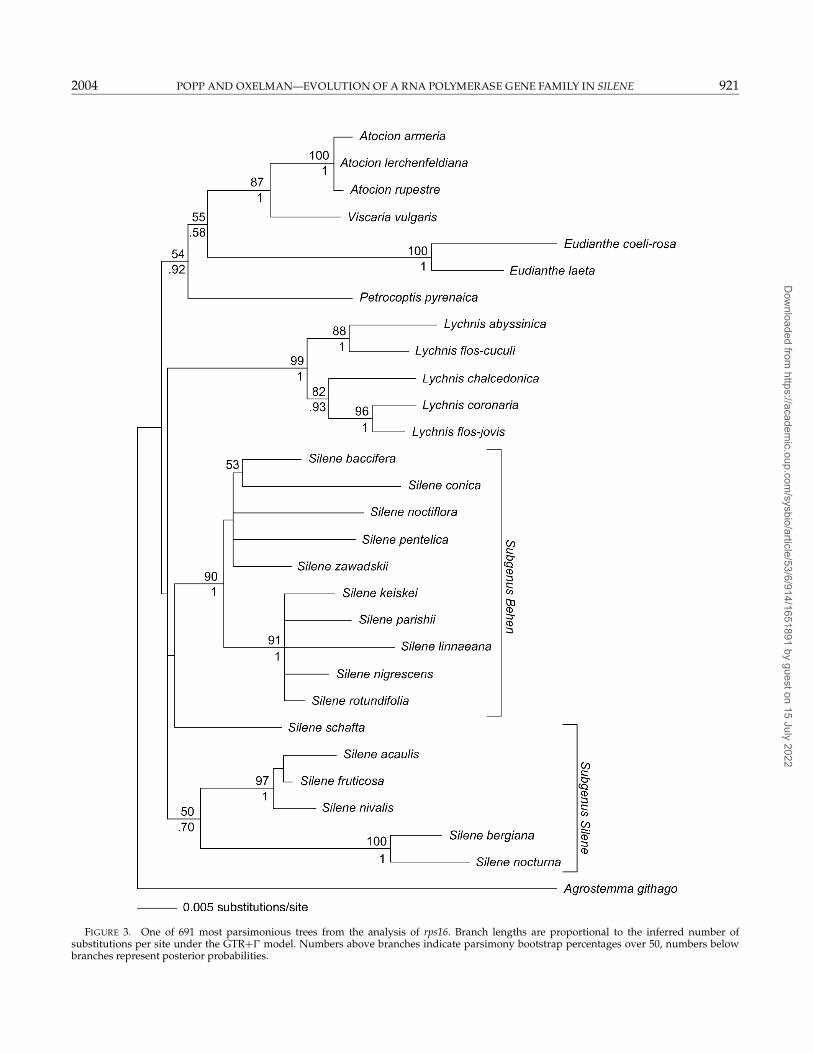
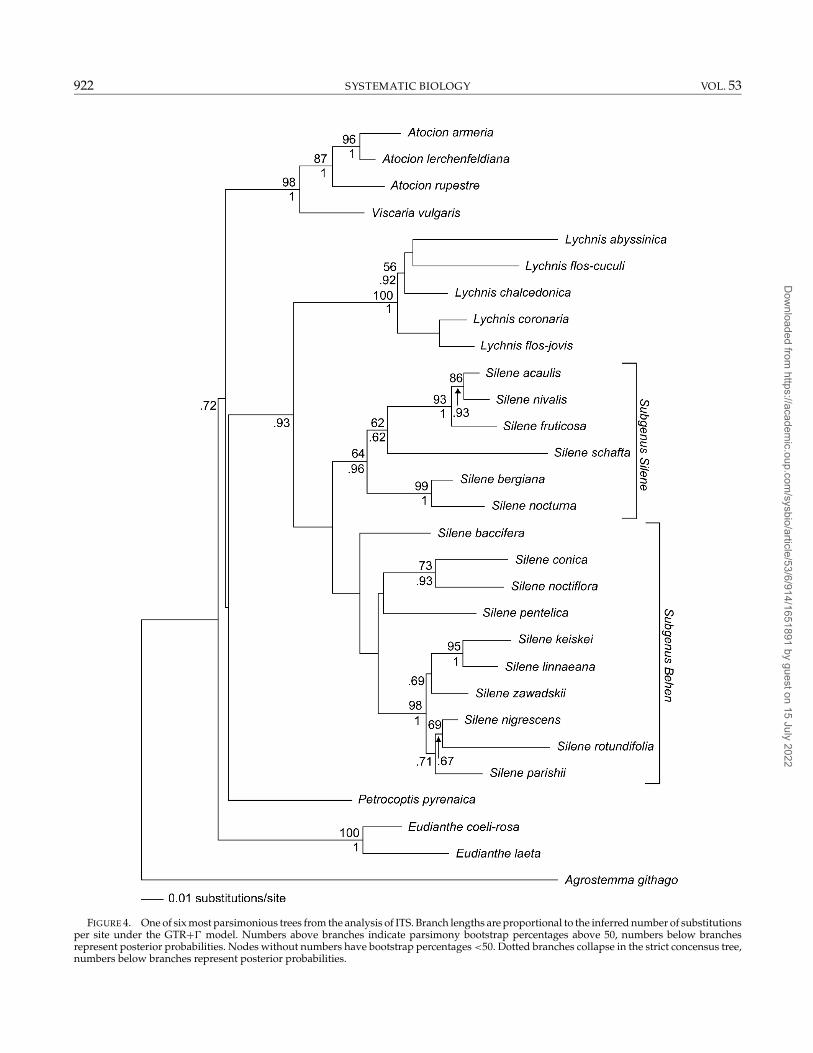
rps16 and ITSBoth the rps16 and ITS data sets support the mono-
phyly of Atocion, Lychnis, and Eudianthe (Figs. 3 and 4).Although Silene was recovered in a strict consensus ofthe most parsimonious trees from the ITS data (Fig. 4),neither the rps16 nor the ITS data sets have MPB per-centages above 50 for a monophyletic Silene. There were
Dow
nloaded from https://academ
ic.oup.com/sysbio/article/53/6/914/1651891 by guest on 15 July 2022
920 SYSTEMATIC BIOLOGY VOL. 53
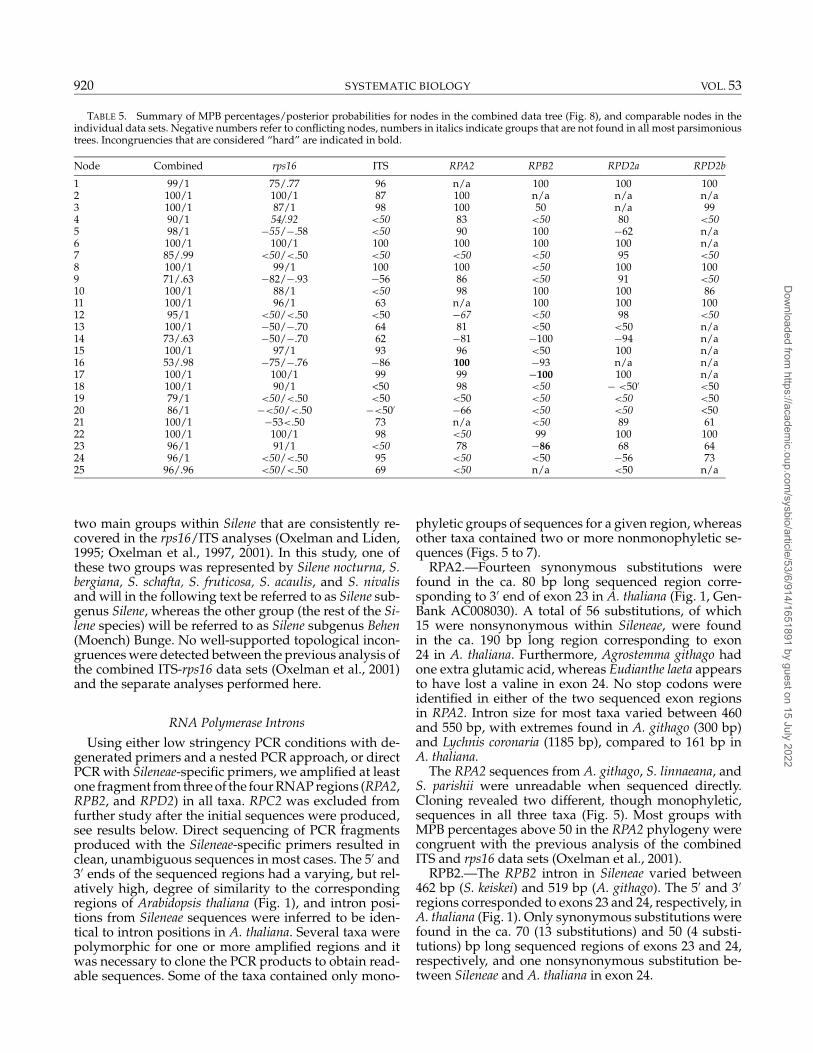
TABLE 5. Summary of MPB percentages/posterior probabilities for nodes in the combined data tree (Fig. 8), and comparable nodes in theindividual data sets. Negative numbers refer to conflicting nodes, numbers in italics indicate groups that are not found in all most parsimonioustrees. Incongruencies that are considered “hard” are indicated in bold.
Node Combined rps16 ITS RPA2 RPB2 RPD2a RPD2b
1 99/1 75/.77 96 n/a 100 100 1002 100/1 100/1 87 100 n/a n/a n/a3 100/1 87/1 98 100 50 n/a 994 90/1 54/.92 <50 83 <50 80 <505 98/1 −55/−.58 <50 90 100 −62 n/a6 100/1 100/1 100 100 100 100 n/a7 85/.99 <50/<.50 <50 <50 <50 95 <508 100/1 99/1 100 100 <50 100 1009 71/.63 −82/−.93 −56 86 <50 91 <5010 100/1 88/1 <50 98 100 100 8611 100/1 96/1 63 n/a 100 100 10012 95/1 <50/<.50 <50 −67 <50 98 <5013 100/1 −50/−.70 64 81 <50 <50 n/a14 73/.63 −50/−.70 62 −81 −100 −94 n/a15 100/1 97/1 93 96 <50 100 n/a16 53/.98 −75/−.76 −86 100 −93 n/a n/a17 100/1 100/1 99 99 −100 100 n/a18 100/1 90/1 <50 98 <50 − <50′ <5019 79/1 <50/<.50 <50 <50 <50 <50 <5020 86/1 −<50/<.50 −<50′ −66 <50 <50 <5021 100/1 −53<.50 73 n/a <50 89 6122 100/1 100/1 98 <50 99 100 10023 96/1 91/1 <50 78 −86 68 6424 96/1 <50/<.50 95 <50 <50 −56 7325 96/.96 <50/<.50 69 <50 n/a <50 n/a
two main groups within Silene that are consistently re-covered in the rps16/ITS analyses (Oxelman and Liden,1995; Oxelman et al., 1997, 2001). In this study, one ofthese two groups was represented by Silene nocturna, S.bergiana, S. schafta, S. fruticosa, S. acaulis, and S. nivalisand will in the following text be referred to as Silene sub-genus Silene, whereas the other group (the rest of the Si-lene species) will be referred to as Silene subgenus Behen(Moench) Bunge. No well-supported topological incon-gruences were detected between the previous analysis ofthe combined ITS-rps16 data sets (Oxelman et al., 2001)and the separate analyses performed here.
RNA Polymerase Introns
Using either low stringency PCR conditions with de-generated primers and a nested PCR approach, or directPCR with Sileneae-specific primers, we amplified at leastone fragment from three of the four RNAP regions (RPA2,RPB2, and RPD2) in all taxa. RPC2 was excluded fromfurther study after the initial sequences were produced,see results below. Direct sequencing of PCR fragmentsproduced with the Sileneae-specific primers resulted inclean, unambiguous sequences in most cases. The 5′ and3′ ends of the sequenced regions had a varying, but rel-atively high, degree of similarity to the correspondingregions of Arabidopsis thaliana (Fig. 1), and intron posi-tions from Sileneae sequences were inferred to be iden-tical to intron positions in A. thaliana. Several taxa werepolymorphic for one or more amplified regions and itwas necessary to clone the PCR products to obtain read-able sequences. Some of the taxa contained only mono-
phyletic groups of sequences for a given region, whereasother taxa contained two or more nonmonophyletic se-quences (Figs. 5 to 7).
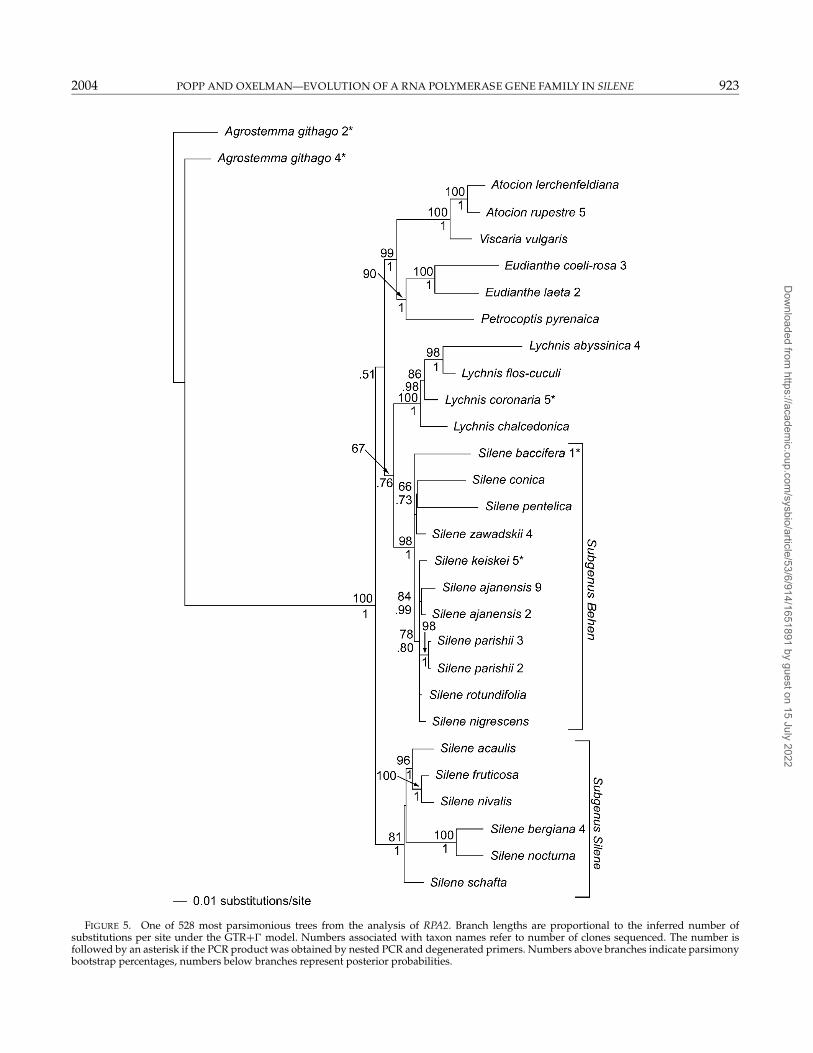
RPA2.—Fourteen synonymous substitutions werefound in the ca. 80 bp long sequenced region corre-sponding to 3′ end of exon 23 in A. thaliana (Fig. 1, Gen-Bank AC008030). A total of 56 substitutions, of which15 were nonsynonymous within Sileneae, were foundin the ca. 190 bp long region corresponding to exon24 in A. thaliana. Furthermore, Agrostemma githago hadone extra glutamic acid, whereas Eudianthe laeta appearsto have lost a valine in exon 24. No stop codons wereidentified in either of the two sequenced exon regionsin RPA2. Intron size for most taxa varied between 460and 550 bp, with extremes found in A. githago (300 bp)and Lychnis coronaria (1185 bp), compared to 161 bp inA. thaliana.
The RPA2 sequences from A. githago, S. linnaeana, andS. parishii were unreadable when sequenced directly.Cloning revealed two different, though monophyletic,sequences in all three taxa (Fig. 5). Most groups withMPB percentages above 50 in the RPA2 phylogeny werecongruent with the previous analysis of the combinedITS and rps16 data sets (Oxelman et al., 2001).
RPB2.—The RPB2 intron in Sileneae varied between462 bp (S. keiskei) and 519 bp (A. githago). The 5′ and 3′regions corresponded to exons 23 and 24, respectively, inA. thaliana (Fig. 1). Only synonymous substitutions werefound in the ca. 70 (13 substitutions) and 50 (4 substi-tutions) bp long sequenced regions of exons 23 and 24,respectively, and one nonsynonymous substitution be-tween Sileneae and A. thaliana in exon 24.
Dow
nloaded from https://academ
ic.oup.com/sysbio/article/53/6/914/1651891 by guest on 15 July 2022
2004 POPP AND OXELMAN—EVOLUTION OF A RNA POLYMERASE GENE FAMILY IN SILENE 921
FIGURE 3. One of 691 most parsimonious trees from the analysis of rps16. Branch lengths are proportional to the inferred number ofsubstitutions per site under the GTR+� model. Numbers above branches indicate parsimony bootstrap percentages over 50, numbers belowbranches represent posterior probabilities.
Dow
nloaded from https://academ
ic.oup.com/sysbio/article/53/6/914/1651891 by guest on 15 July 2022
922 SYSTEMATIC BIOLOGY VOL. 53
FIGURE 4. One of six most parsimonious trees from the analysis of ITS. Branch lengths are proportional to the inferred number of substitutionsper site under the GTR+� model. Numbers above branches indicate parsimony bootstrap percentages above 50, numbers below branchesrepresent posterior probabilities. Nodes without numbers have bootstrap percentages <50. Dotted branches collapse in the strict concensus tree,numbers below branches represent posterior probabilities.
Dow
nloaded from https://academ
ic.oup.com/sysbio/article/53/6/914/1651891 by guest on 15 July 2022
2004 POPP AND OXELMAN—EVOLUTION OF A RNA POLYMERASE GENE FAMILY IN SILENE 923
FIGURE 5. One of 528 most parsimonious trees from the analysis of RPA2. Branch lengths are proportional to the inferred number ofsubstitutions per site under the GTR+� model. Numbers associated with taxon names refer to number of clones sequenced. The number isfollowed by an asterisk if the PCR product was obtained by nested PCR and degenerated primers. Numbers above branches indicate parsimonybootstrap percentages, numbers below branches represent posterior probabilities.
Dow
nloaded from https://academ
ic.oup.com/sysbio/article/53/6/914/1651891 by guest on 15 July 2022
924 SYSTEMATIC BIOLOGY VOL. 53
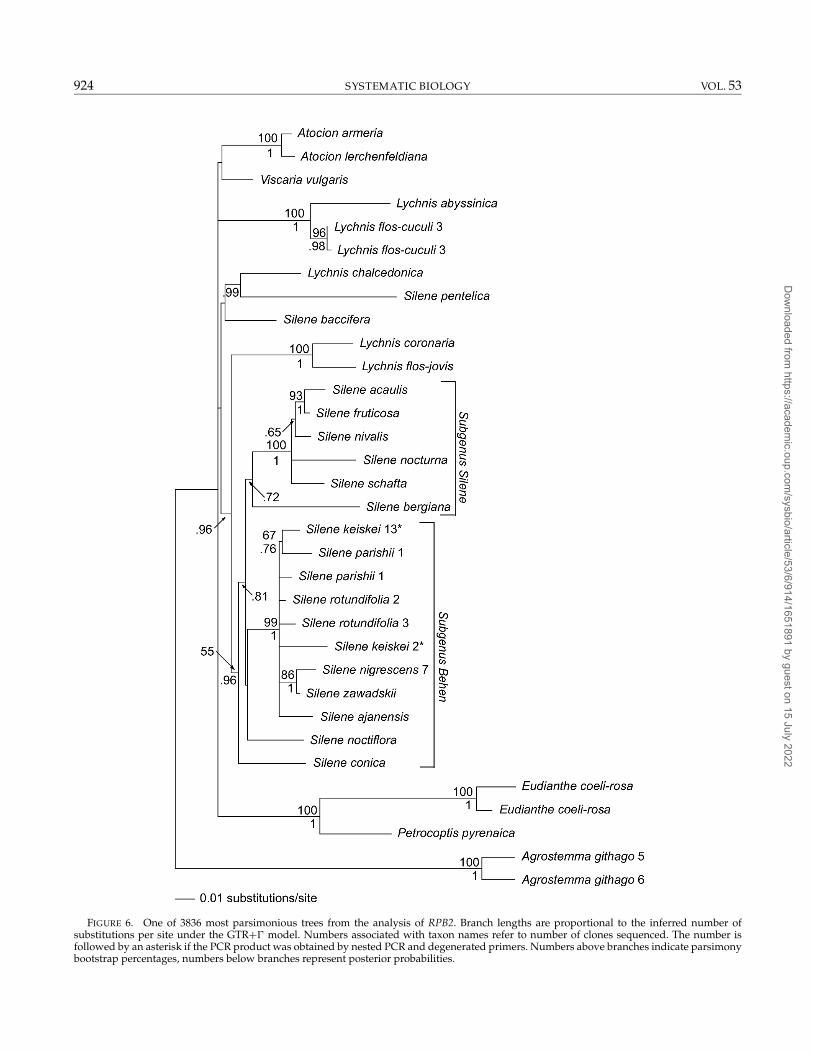
FIGURE 6. One of 3836 most parsimonious trees from the analysis of RPB2. Branch lengths are proportional to the inferred number ofsubstitutions per site under the GTR+� model. Numbers associated with taxon names refer to number of clones sequenced. The number isfollowed by an asterisk if the PCR product was obtained by nested PCR and degenerated primers. Numbers above branches indicate parsimonybootstrap percentages, numbers below branches represent posterior probabilities.
Dow
nloaded from https://academ
ic.oup.com/sysbio/article/53/6/914/1651891 by guest on 15 July 2022
2004 POPP AND OXELMAN—EVOLUTION OF A RNA POLYMERASE GENE FAMILY IN SILENE 925
The phylogenetic analyses of the RPB2 sequencesresulted in a basally poorly resolved tree (Fig. 6).Agrostemma githago, E. coeli-rosa, and L. flos-cuculi werepolymorphic, and cloning revealed two different, thoughmonophyletic, sequences in each of the three taxa. Threeother taxa, S. keiskei, S. rotundifolia, and S. parishii werealso cloned due to polymorphisms. These sequencesdid not form monophyletic groups within species. Themonophyly of Atocion was strongly supported (MPB per-centage 100), whereas neither Silene nor Lychnis were re-solved as monophyletic in the MPB analysis. Lychnis chal-cedonica was not found in any of the two Lychnis groups(both with MPB percentage 100), and Silene itself con-sisted of two well-supported (MPB percentages 99 and100, respectively) clades and a few “stray species” in apolytomy with the rest of the ingroup.
RPC2.—Only a few RPC2 sequences (Table 1) wereproduced because a 35- to 45-bp AC/T repeat close tothe 3′ end caused sequencing problems. The length ofthe fragment, 1300 to 1400 bp, would have made it nec-essary to make at least four separate sequencing reactionsto sequence the entire fragment in both directions. Theforward primer site C2F is located at the very 3′ end ofexon 31 of the A. thaliana sequence (GenBank AB012240).The ca. 95-bp exon sequence corresponding to exon 36in A. thaliana, had only synonymous substitutions in thetaxa investigated in this study. No RPC2 sequences wereincluded in the analyses.
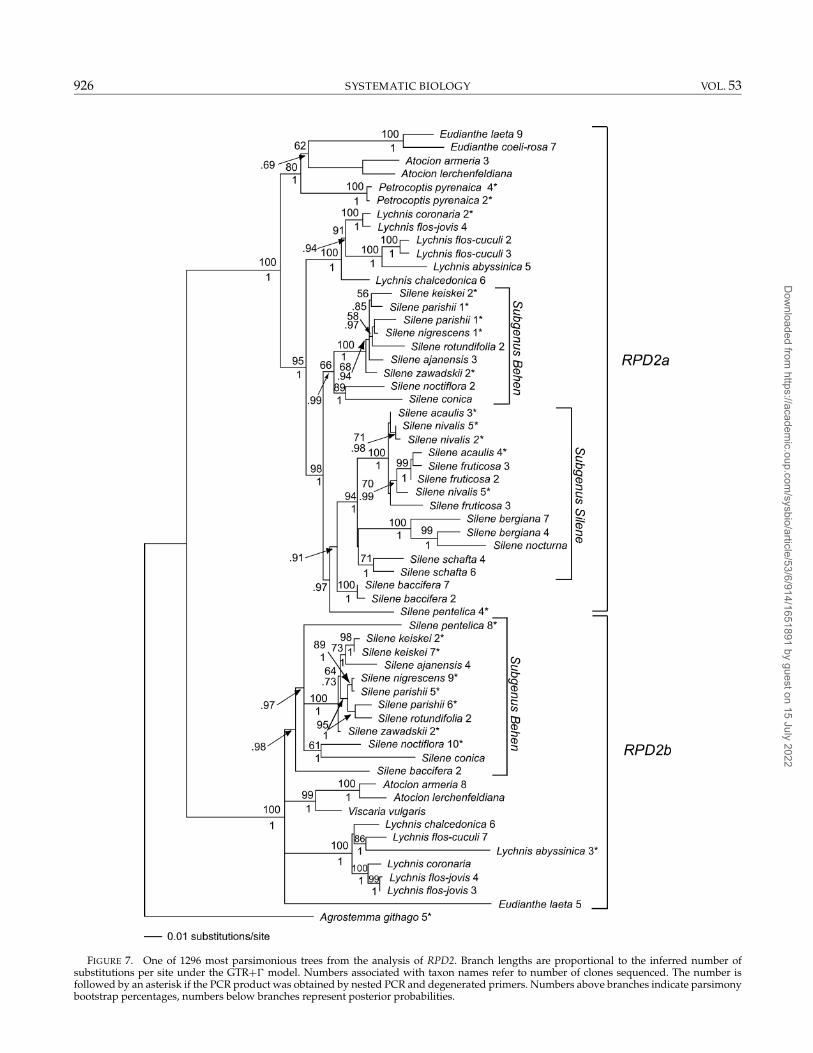
RPD2.—The partial exon sequences in Sileneae corre-sponds to the 3′ end of exon 6 (Fig. 1, Table 5) in thetwo paralogues found in A. thaliana (GenBank AB020749and AP000377). The Sileneae-specific RPD2RP reverseprimer is located one nucleotide position downstreamof the 5′ end of exon 7. Two or more copies of RPD2were found in most species in Sileneae. The phyloge-netic analysis showed that there were two groups, RPD2aand RPD2b, of paralogous RPD2 sequences (Fig. 7). OnlyRPD2a sequences were found in E. coeli-rosa, Petrocoptispyrenaica, and in the subgenus Silene clade, whereas onlythe RPD2b copy was found in Viscaria vulgaris. A singlesequence was found in A. githago. The RPD2a and RPD2bsequences are readily alignable over most of the area inSileneae, whereas they could not be reliably aligned withthe Arabidopsis sequences. The length of the intron se-quences varied between 227 bp (S. fruticosa) and 1123 bp(L . flos-cuculi), with most sequences being ca. 700 to 750bp long.
In all taxa belonging to the subgenus Silene clade,two or more discrete sequences belonging to the RPD2agroup were found after cloning. Most of these sequencesdid not form monophyletic groups within species (Fig.7). Three sequences were found in S. fruticosa. Two ofthem were very short, 296 and 328 bp, respectively. Thethird sequence was 624 bp, a more “normal” length. Thetwo short sequences had a large deletion from the end ofthe forward PCR primer (RPD2FP) to approximately halfthe intron. These sequences appeared in multiple inde-pendent PCR reactions, indicating that they might rep-resent pseudogenes. Although S. nocturna successfullywas sequenced directly without cloning, it contained 12
polymorphic sites. This sequence was sister to one ofthe S. bergiana sequences, with the second S. bergiana se-quence as sister to this clade (MPB percentage 100). TheS. nocturna polymorphisms did not correspond to the dis-agreements between the two S. bergiana sequences. Thetwo sequences from S. schafta formed a monophyleticgroup in a trichotomy with the rest of the taxa in sub-genus Silene.
The two RPD2b sequences found in S. parishii were notmonophyletic (Fig. 7), but sisters to S. nigrescens and S.rotundifolia, respectively. The latter S. parishii sequencelacks the two last amino acids in exon 6 and has oneamino acid substitution (a leucine for a proline). Therewas alignment ambiguity in the beginning of the intron,and a substantial proportion of the conserved splice re-gion is missing. Thus, it seems likely that this sequenceis a pseudogene.
All included genera were strongly supported as mono-phyletic groups with MPB percentages of 98 or 100 by theRPD2a sequences. The results from the previous analy-sis of ITS and rps16 (Oxelman et al., 2001) and the well-supported RPD2a topology (Fig. 7) were congruent at thegeneric level. The RPD2b clade was less well resolvedthan the RPD2a clade and there was no MPB supportabove 50 for a monophyletic Silene. Both Lychnis and Ato-cion had MPB percentages of 100, though, and the topol-ogy was largely congruent with the ITS and rps16 data.
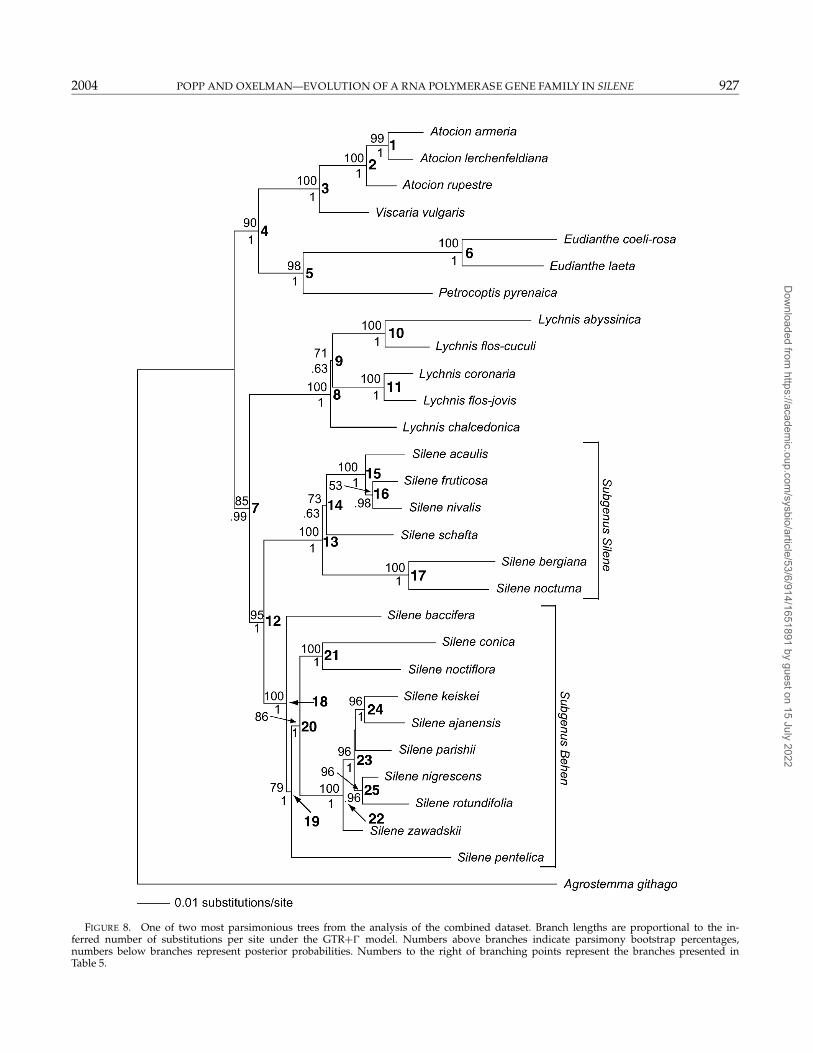
Analysis of the combined data sets.—PLATO identifiedpart of ITS (464 aligned bp, Z = 26.8), RPA2 (398 alignedbp, Z = 6.2), and RPB2 (459 aligned bp, Z = 15.3) as hav-ing significantly lower likelihoods with the ML topol-ogy for the combined datasets and the GTR+� modelwith parameter values estimated in PAUP∗. These re-gions contains 97%, 66%, and 92% of the parsimony in-formative characters in the ITS, RPA2, and RPB2 data sets,respectively. The likelihood for the ITS data set evolvingunder the ML topology of the combined data set exclud-ing ITS was ranked as number 72 among the 100 boot-strapped ITS data sets (i.e., P = 0.28). The correspond-ing P-values were 0.30 and 0.12 for the evolution of theRPA2 and RPB2 data sets under ML topologies inferred,excluding RPA2 and RPB2, respectively, from the com-bined data set. Thus, no strong topological incongruencewas detected, and all data sets were included in the com-bined analysis.
The parsimony bootstrap analysis of the combineddata sets resulted in a well-resolved topology where allgenera have MPB percentages of 95 or higher (Fig. 8).Lychnis and Silene were resolved as sister to Atocion, Vis-caria, Eudianthe, and Petrocoptis. A previously unresolvedsister-group relationship (e.g., Oxelman et al., 2001) be-tween Eudianthe and Petrocoptis was also found in thelatter clade. The result are compatible with previous re-sults from Oxelman et al. (2001).
DISCUSSION
We will discuss the results from each separate RNAPintron separately. Results from more extensive phylo-genetic analyses of rps16 and ITS sequences in Sileneae
Dow
nloaded from https://academ
ic.oup.com/sysbio/article/53/6/914/1651891 by guest on 15 July 2022
926 SYSTEMATIC BIOLOGY VOL. 53
FIGURE 7. One of 1296 most parsimonious trees from the analysis of RPD2. Branch lengths are proportional to the inferred number ofsubstitutions per site under the GTR+� model. Numbers associated with taxon names refer to number of clones sequenced. The number isfollowed by an asterisk if the PCR product was obtained by nested PCR and degenerated primers. Numbers above branches indicate parsimonybootstrap percentages, numbers below branches represent posterior probabilities.
Dow
nloaded from https://academ
ic.oup.com/sysbio/article/53/6/914/1651891 by guest on 15 July 2022
2004 POPP AND OXELMAN—EVOLUTION OF A RNA POLYMERASE GENE FAMILY IN SILENE 927
FIGURE 8. One of two most parsimonious trees from the analysis of the combined dataset. Branch lengths are proportional to the in-ferred number of substitutions per site under the GTR+� model. Numbers above branches indicate parsimony bootstrap percentages,numbers below branches represent posterior probabilities. Numbers to the right of branching points represent the branches presented inTable 5.
Dow
nloaded from https://academ
ic.oup.com/sysbio/article/53/6/914/1651891 by guest on 15 July 2022
928 SYSTEMATIC BIOLOGY VOL. 53
have been discussed thoroughly elsewhere (Oxelmanand Liden, 1995; Oxelman et al., 1997, 2001), and we willonly discuss results that deviate from these analyses. Fi-nally, we will discuss the combinability of the differentsequence regions and the general utility of the RNAPstrategy proposed in this paper.
RPA2Although strong bootstrap support for monophyly of
the genus Silene is found only in one of the RPD2 par-alogues (Fig. 7), the sister-group relationship betweenthe Silene clade and the rest of the ingroup shown inthe RPA2 phylogeny (Fig. 5) is somewhat unexpectedwhen compared to previous studies (Oxelman and Li-den, 1995; Oxelman et al., 1997, 2001) as well as the restof the results in this study. However, the incongruenceis poorly resolved, and might be due to stochastic effectstogether with lack of information. Nevertheless, we findit instructive to examine other explanations to this puta-tively incongruent gene phylogeny in some detail.
Wendel and Doyle (1998) list a number of biologicalphenomena that can lead to incongruence, such as orthol-ogy/paralogy conflation, lineage sorting, rate hetero-geneity among taxa, hybridization/introgression, andshort internal branches. One of the aims of this studyis to minimize the risk of orthology/paralogy confla-tion by using degenerated primers and low-stringencyPCR conditions in combination with cloning to amplifyand sequence all possible paralogues. RPA2 polymor-phisms were found in three taxa; S. parishii, S. linnaeana,and the outgroup Agrostemma githago, but because theyform monophyletic groups within species, the polymor-phisms may be explained either by allelic variation or au-tapomorphic gene duplications. No traces of an ancientgene duplication or polymorphic RPA2 gene pool weredetected, and we conclude that there is no support for ahypothesis involving orthology/paralogy conflation.
Lineage sorting (e.g., Pamilo and Nei, 1988), and fail-ure of alleles to coalesce within a species lineage, is verydifficult to distinguish from orthology/paralogy confla-tion. It is, however, unlikely that a polymorphic RPA2allele pool has been maintained during a time span longenough for fixation of one allele and loss of the other inthe Silene clade, while the opposite allele is fixed and lost,respectively, in all other lineages investigated here.
It is likely that a hybridization event would leave tracesin more than one nuclear gene (e.g., Cronn et al., 1999).The topological pattern found in RPA2 is not found in anyof the other four nuclear DNA regions, nor did we findany pattern of strong incongruence between the mater-nally inherited (Corriveau and Coleman, 1988) cpDNAand the nuclear DNA as sometimes is seen in hybridsif evolutionary processes homogenize the paralogues(e.g.,. Brochmann et al., 1996). A hybridization event istherefore not supported as an explanation to the appar-ent incongruence.
In phylogenetic analyses using inconsistent models,rate heterogeneity among taxa may confound phylogenyestimations as a result of parallel substitution in faster
evolving taxa, i.e., “long branch attraction” (Felsenstein,1978), and therefore cause incongruence between differ-ent data partitions. A solution to this may be a densertaxon sampling to break up the long branches. The sam-pling of taxa from the Silene clade is rather scattered,and perhaps a denser sampling would result in a topol-ogy more in line with results from the analyses of theother datasets. A second solution is to use a phyloge-netic method more robust to rate heterogeneity. Givena reasonable model and enough data, maximum likeli-hood is often suggested to be more robust than parsi-mony (Felsenstein, 1973). Analyzing the RPA2 data withmaximum likelihood method as implemented in PAUP∗,using the HKY+� model suggested by MrModeltest1.1b (Nylander, 2001), five random additions with TBRbranch swapping, and estimating all parameters fromthe data resulted in a topology (not shown) that was ba-sically the same as when analyzed with parsimony. Thus,it must either be that the inferred RPA2 phylogeny is notconfused by long branch attraction, or the model is notrobust to deviations in the data. The conclusion is thatthere is no positive evidence for long branch attractionas an explanation to the observed pattern in RPA2.
In the case of short internal branches, i.e., if lineagesplits are common relative to the substitution rate, arelatively high degree of random variation is expectedin the data, and a phylogenetic analysis would resultin a poorly resolved tree. Separate analyses of severalputatively independent DNA regions are predicted tohave weakly supported “soft incongruences” (Wendeland Doyle, 1998) due to these phenomena, and the in-congruences are expected to vanish when more data areadded. Most of the MP topologies from the analyses ofthe separate data sets are poorly resolved and poorlysupported by MPB to a varying degree. In the light ofthis, plus the fact that the MPB support of subgenus Si-lene as sister to the rest of the ingroup was low (two nodeswith MPB percentages of <50 and 67, respectively), wedraw the conclusion that the putative incongruence is aresult of random variation as an effect of short internalbranches. This hypothesis is not rejected by the likeli-hood score rank test discussed below.
RPB2Several taxa in RPB2 had to be cloned due to polymor-
phisms making the sequences unreadable when the PCRproducts were sequenced directly. If sequences within aspecies were monophyletic (Fig. 6), the polymorphismswere assumed to be caused by divergent alleles in het-erozygous individuals, or autapomorphic gene duplica-tions. The sequences from S. keiskei, S. rotundifolia, andS. parishii did not form monophyletic groups withinspecies, but nonmonophyly did not receive strong sup-port. A weakly supported monophyletic group consist-ing of one sequence from S. parishii and one from S. keiskeiis found together with the other sequences in a poly-tomy. Silene zawadskii and S. nigrescens are resolved assister group to these. The pattern is not too surprisingas all three former taxa are tetraploids. The variation in
Dow
nloaded from https://academ
ic.oup.com/sysbio/article/53/6/914/1651891 by guest on 15 July 2022
2004 POPP AND OXELMAN—EVOLUTION OF A RNA POLYMERASE GENE FAMILY IN SILENE 929
the sequenced part of RPB2, however, is not enough toresolve the internal relationships of the paralogues. Thisgroup, also including S. linnaeana (MPB percentage of 99),is one of two well-supported groups found within Silenein the bootstrap analysis; the other group was withinthe subgenus Silene clade. Contrary to previous analyses(Oxelman and Liden, 1995; Oxelman et al., 1997, 2001)and the RPA2 and RPD2 trees (Figs. 5 and 7), S. bergianais not resolved as sister to S. nocturna. Silene bergiana isfound to be sister to the rest of the clade in the strict con-sensus from the MP trees, but the MPB percentage forthis relationship was less than 50. There is no MPB sup-port above 50 from RPB2 data neither for the otherwisewell supported Lychnis clade nor for the Atocion/Viscariaclade.
RPD2By comparing the short sequenced regions of exon 6
(Table 6) in the RPD2 paralogues found in Sileneae andArabidopsis thaliana, it is clear that the paralogues in Sile-neae are more closely related to each other than to eitherof the two paralogues in A. thaliana.
Despite cloning of the PCR products and the use ofparalogue-specific primers, only a single sequence wasfound in Agrostemma githago, the outgroup in this study.Several of the indels and substitutions diagnostic for ei-ther of the paralogues are found in the single sequencefrom A. githago. This indicates that the duplication oc-curred in the branch leading to the ingroup, or the se-quence may be a result of incomplete concerted evolu-tion (see below). However, the orthology of this sequenceas well as the duplication event, cannot be determineduntil other alignable outgroup sequences are added.
A single gene duplication is not enough to explainthe RPD2 gene phylogeny (Fig. 7). If one accepts onlybranches with MPB >95%, at least two more gene du-plications and two losses have to be inferred in the sub-genus Silene clade. Firstly, one duplication and one lossin the lineage leading to the clade consisting of S. acaulisand S. fruticosa, and secondly, one duplication and oneloss in the lineage leading to S. bergiana and S. nocturna(Fig. 7). As there are numerous species that are mor-phologically more close to either of these two species,it seems unlikely that S. nocturna would be derived fromwithin S. bergiana. Also S. schafta contains two sequences,and although the two sequences were fairly divergent,it may be explained by heterozygosity. If one accepts allbranches in the strict consensus tree (Fig. 7), several ad-ditional duplications and losses have to be inferred. Allsix species mentioned above are diploid, and thereforeonly one or two sequences are expected to be found froma single locus. The bootstrap support is low for most ofthe nodes, and part of the pattern could be explained by
TABLE 6. Amino acid alignment of the 3′ end of exon 6 in RPD2
Sileneae RPD2a GKGIAC- - - - - -GG- - - - - - -T-L-RYATPFSTPSVESITEQLHSileneae RPD2b GKGIAC- - - - - -GG- - - - - - -T-L-RYATPFSTPSVESITEQLHA. thaliana 1 SKGIACPIQKKEGSSAAYTKLTRHATPFSTPGVTEITEQLHA. thaliana 2 SKGIACPIQK–EGSSAAYTKLTRHATPFSTPGVTEITEQLH
lineage sorting in recently diverged lineages. However,in S. nivalis and S. fruticosa, three sequences were foundin each specimen, and lineage sorting alone cannot ex-plain the pattern. No RPD2b paralogues were recoveredin any of the sampled specimens from the subgenus Si-lene despite extensive cloning and the use of paralogue-specific primers, implying at least one more paralogueextinction.
Due to the perfect correspondence between multiplecopies of RPD2a paralogues and the complete loss ofthe RPD2b paralogues in subgenus Silene, an alterna-tive explanation to the observed pattern is incompleteconcerted evolution. As a result of incomplete concertedevolution between RPD2a and RPD2b, one would ex-pect mosaic sequences in case of reciprocal recombina-tion, or more homogenous sequences if gene conversionis operating (Wendel and Doyle, 1998). Incomplete con-certed evolution has been suggested to occur in smallnuclear gene families such as Adh in Gossypium (Millarand Dennis, 1996), PgiC in Clarkia (Gottlieb and Ford,1996), and glutamine synthetase in Pisum (Walker et al.,1995). No obvious mosaic sequences were found in thesubgenus Silene RPD2 data set. Thus, there is no sup-port for reciprocal recombination as the evolutionaryprocess. Incomplete concerted evolution by gene conver-sion is a simpler explanation than a number of indepen-dent duplications and losses, and therefore a preferredhypothesis.
Combined Analysis and Comparisons of the Data Sets
Both the rps16 intron and ITS data sets show highamong-site rate variation (α =0.42 and 0.35, respectively;Table 4). The high among-site rate variation is likely cor-related to constraints imposed by the secondary structurefound in the rps16 group II intron (e.g., Kelchner, 2002)and ITS (e.g., Baldwin et al., 1995). The RNAP introns, onthe other hand, have low among-site rate variation (α =1.88, 1.32, and 3.06 for RPA2, RPB2, and RPD2, respec-tively; Table 4) and consequently seem to be free fromsuch constraints to a much greater extent.
PLATO detected several regions where the ML topol-ogy had significantly low likelihood to explain the com-bined data set. These differences in likelihood score in-dicate deviations from the model including the topologyparameter and/or other model parameter values (ML es-timates from the combined data set) supplied as input toPLATO (Grassly and Holmes, 1997). Using PLATO, it isnot possible to discern whether data have evolved undera different topology or if other parameters are causing theanomalies. Are the observed differences caused by dif-ferent evolutionary histories, or are they just an effect ofstochastic variation? To answer that question, it wouldbe desirable to test whether or not the ML topologies
Dow
nloaded from https://academ
ic.oup.com/sysbio/article/53/6/914/1651891 by guest on 15 July 2022
930 SYSTEMATIC BIOLOGY VOL. 53
inferred from the deviating regions (i.e., ITS, RPA2, andRPB2, respectively) discovered with PLATO are differ-ent from the ML topologies inferred from the rest of thecombined data (excluding, in turn, ITS, RPA2, and RPB2)at some level of significance. Typically, different imple-mentations of parametric bootstrapping (Huelsenbeckand Bull, 1996) are formulated to test whether the max-imum likelihood topology or an alternative topology istrue (Goldman et al., 2000). However, because we are in-terested in whether the ML topology differs significantlyfrom an alternative topology, this is not the appropriatequestion to ask in our case. Parametric tests of topologiesare highly sensitive to model misspecification (Buckley,2002). The nonparametric tests of Kishino and Hasegawa(KH test) (Hasegawa and Kishino, 1989; Kishino andHasegawa, 1989) and Shimodaira-Hasegawa (SH test)(Shimodaira and Hasegawa, 1999) have been used forpairwise (KH test) or multiple (SH test) test of topolo-gies. Goldman et al. (2000) showed that the KH test isnot appropriate if one of the compared topologies is alsothe ML topology chosen a posteriori. If only two topolo-gies are compared using the SH test, this test reduces tothe KH test (Shimodaira and Hasegawa, 1999). Becauseone of the two topologies we want to compare is alwaysthe ML topology in this study, the SH test is also im-proper to use. Therefore, we do not use the KH test per se,but rather measure how the ML topology from one dataset (combined data excluding a deviating data partition,e.g., ITS) fits into the likelihood distribution of anotherdata set (e.g., ITS), which has a different ML topology.Although it is difficult to define a relevant null hypothe-sis because the ML topology is selected a posteriori, therelative size of the obtained P values give an indicationof the relative impact of the topology parameter on eachdata partition.
PLATO detected the strongest deviations from themodel in the ITS data. This contrasts to the low impact ofthe topology parameter (P = 0.28) on the ITS data. Theonly incongruence between the two topologies reason-ably well supported by MPB is the internal relationshipof the group consisting of S. acaulis, S. nivalis, and S. fruti-cosa, where a sister-group relationship between S. acaulisand S. nivalis is supported by ITS (MPB 86%; Fig. 4), butcontradicted by MPB analysis of the combined data ex-cluding ITS, where a sister-group relationship betweenS. nivalis and S. fruticosa is supported instead (MPB 69%;data not shown). The ML estimates of the parameter val-ues show that ITS deviates both in relative nucleotidesubstitution rates and is also slightly GC biased com-pared to the other partitions (and also the values in themodel supplied to PLATO), which are AT biased (Table4). The gamma parameter included in the model makesPLATO less sensitive to deviations in relative rates of nu-cleotide substitutions to some extent, whereas PLATOwill detect significant differences in base composition(Grassly and Holmes, 1997). It therefore seems plausi-ble that the model deviation stem from parameters otherthan topology in this case, and we conclude that the de-viation observed with PLATO is due to the base compo-sition in ITS.
The apparent incongruence detected in RPA2 andRPB2 cannot be explained by deviating rates of substi-tutions and/or base composition. The parameter valuesare in both datasets close to the values in the model usedwith PLATO (Table 4). Some topological incongruencewas detected in both datasets. Both the position of sub-genus Silene (two nodes with MPB <50% and 67%, re-spectively; Fig. 5) and the sister-group relationship ofS. nivalis and S. fruticosa (MPB 100%) inferred from theRPA2 data were incongruent with the ML topology fromcombined data excluding RPA2. In RPB2, S. linnaeana wasresolved at a slightly different position, but with poorMPB support (63% and 67%, respectively). The incon-gruences are not reflected in the likelihood ranking of theML topologies (P = 0.30 and 0.12 excluding RPA2 andRPB2, respectively). It is notable, however, that many ofthe internal branches in the RPB2 topology are relativelyshort (Fig. 6). The branch lengths constitute a large frac-tion of the free parameters, and are dependent on thetopology. One may argue that it is difficult to distinguishbetween topological differences and branch length dif-ferences, but we find the lack of strong differences inbranching order and other parameters as indicative thatit is the branch lengths themselves that are deviating.The biological explanation for this is obscure, but a rea-sonable hypothesis is that it is a random effect of rapiddiversification of the group.
Based on the ML ranking, we cannot reject the null hy-pothesis that all our data have evolved under the sametopology, and we therefore choose to combine all data ina MPB analysis. The analysis of the combined data setresolved the previously poorly known generic relation-ships within Sileneae (Fig. 8). A denser taxon samplingis needed to infer the relationships within subgenus Si-lene, but our analysis supports a hypothesis of a mono-phyletic genus Silene. To resolve the relationships of thepolyploid taxa, it is necessary to search more thoroughlyfor paralogues (see below) and include them in the anal-ysis, instead of excluding nonorthologous sequences asis done in this analysis. The taxonomic conclusions basedon the rps16 and ITS data sets (Oxelman et al., 2001) arefurther substantiated by the results presented here.
General Utility of the Primer Design strategy
The second PCR, with subunit-specific primers,yielded highly specific PCR products despite the low-stringency PCR conditions. With very few exceptions,all PCR products used for the sequences in this studywere obtained at the first attempt, with either degener-ated or Sileneae-specific primers. Some sequences were“missing” in the RPD2 data set, i.e., only one of the ex-pected paralogues was found in spite of several attemptswith cloning PCR products obtained with subunit spe-cific primers. In addition, all attempts to amplify a “miss-ing” paralogue with paralogue specific primers faileddespite using several different polymerases, and varyingPCR parameters such as annealing temperature, Mg2+,and primer concentration. There may be several explana-tions of this. Differences in secondary structure (Buckler
Dow
nloaded from https://academ
ic.oup.com/sysbio/article/53/6/914/1651891 by guest on 15 July 2022
2004 POPP AND OXELMAN—EVOLUTION OF A RNA POLYMERASE GENE FAMILY IN SILENE 931
et al., 1997) or differences in primer mismatching mightbias the PCR, resulting in recovering only one of thecopies, i.e., PCR selection (Wagner et al., 1994). Anotherpossibility is physical elimination of one of the redun-dant copies as is found in some allopolyploids (Shakedet al., 2001), or large inserts in pseudogenes (Tank andSang, 2001) causing either inhibition or heavy bias ofthe PCR. Besides running several reactions under vary-ing conditions and with several different sets of primersand/or paralogue specific primers (Rauscher et al., 2002)combined with cloning, PCR cannot take us any furtherand an ultimate answer to whether there is another copyor not cannot be given by PCR alone. Despite these in-herent difficulties, we argue that our method is suitablefor studying evolutionary relationships of lcnDNA se-quence regions. The simultaneous analysis of multiple,presumably unlinked, lcnDNA sequence regions enablesus to detect complicated evolutionary processes at thegenome level, while offering a large amount of data forstrong inferences of phylogenetic relationships at the “or-ganismal” level. We suggest that this approach holds avery strong potential for phylogenetic studies of manyorganismal groups.
CONCLUSIONS
The addition of intron sequences from RPA2, RPB2,and RPD2 to the rps16 and ITS data sets results ina strongly supported phylogeny of the tribe Sileneae.Among-site rate variation is substantially lower in theRNA polymerase introns than in the rps16 intron andITS. The analyses reveal evolutionary patterns consistentwith gene duplication and incomplete concerted evolu-tion in RPD2. Nested PCR with several sets of highly de-generated “universal” primers combined with cloningand subsequent design of more specific primers provesto be a powerful way to amplify and sequence low-copynuclear DNA regions.
ACKNOWLEDGMENTS
We thank Chris Simon, Roberta Mason-Gamer, two anonymousreviewers, Katarina Andreasen, Magnus Liden, Johan Nylander, andSylvain Razafimandimbison for valuable comments; Reija Dufva, IngaHallin, and Nahid Heidari for excellent help in the lab; Benjamin D. Hallfor providing primer sequences; Mark W. Chase, the herbaria at WTUand UPS, and the Botanical Garden in Uppsala for providing plantmaterial. This study was supported by Helge Ax:son Johnsons Stiftelse,The Swedish Research Council, The Royal Physiographic Society inLund, The Royal Swedish Academy of Sciences, and Linnestipendiet.
REFERENCES
Baldwin, B. G., M. J. Sanderson, M. J. Porter, M. F. Wojciechowski, C.S. Campbell, and M. J. Donoghue. 1995. The ITS region of nuclearribosomal DNA: A valuable source of evidence on angiosperm phy-logeny. Ann. Miss. Bot. Garden 82:247–277.
Brochmann, C., T. Nilsson, and T. M. Gabrielsen. 1996. A classicalexample of postglacial allopolyploid speciation re-examined usingRAPD markers and nucleotide sequences: Saxifraga osloensis. Sym-bolae Botanicae Upsaliensis 31:75–89.
Buckler, E. S., A. Ippolito, and T. P. Holtsford. 1997. The evolution of ri-bosomal DNA: Divergent paralogues and phylogenetic implications.Genetics 145:821–832.
Buckley, T. R. 2002. Model misspecification and probabilistic testsof topology: Evidence from empirical data sets. Syst. Biol. 51:509–523.
Clegg, M. T., M. P. Cummings, and M. L. Durbin. 1997. The evolutionof plant nuclear genes. Proc. Nat. Acad. Sci. USA 94:7791–7798.
Corriveau, J. L., and A. W. Coleman. 1988. Rapid screening method todetect potential biparental inheritance of plasmid DNA and resultfor over 200 angiosperm species. Am. J. Bot. 75:1443–1458.
Cronn, R. C., R. L. Small, T. Haselkorn, and J. F. Wendel. 2002. Rapid di-versification of the cotton genus (Gossypium: Malvaceae) revealed byanalysis of sixteen nuclear and chloroplast genes. Am. J. Bot. 89:707–725.
Cronn, R. C., R. L. Small, and J. F. Wendel. 1999. Duplicated genesevolve independently after polyploid formation in cotton. Proc. Nat.Acad. Sci. USA 96:14406–14411.
Denton, A. L., B. L. McConaughy, and B. D. Hall. 1998. Usefulness ofRNA polymerase II coding sequences for estimation of green plantphylogeny. Mol. Biol. Evol. 15:1082–1085.
Desfeux, C., and B. Lejeune. 1996. Systematics of euromediterraneanSilene (Caryophyllaceae): Evidence from a phylogenetic analysis us-ing ITS sequences. Comptes Rendus Acad. Sci. Serie ii—Sci. Vie–LifeSci. 319:351–358.
Erixon, P, Svennblad, B, Britton, T., and Oxelman, B. 2003. The reliabil-ity of bayesian posterior probabilities and bootstrap frequencies inphylogenetics. Syst. Biol. 52:665–673.
Felsenstein, J. 1973. Maximum likelihood and minimum-steps methodsfor estimating evolutionary trees from data on discrete characters.Syst. Zool. 22:240–249.
Felsenstein, J. 1978. Cases in which parsimony or compatibility meth-ods will be positively misleading. Syst. Zool. 1978:401–410.
Ferguson, C. J., and R. K. Jansen. 2002. A chloroplast DNA phylogenyof eastern Phlox (Polemoniaceae): Implications of congruence andincongruence with the its phylogeny. Am. J. Bot. 89:1324–1335.
Goldman, N., J. P. Anderson, and A. G. Rodrigo. 2000. Likelihood-basedtests of topologies in phylogenetics. Syst. Biol. 49:652–670.
Gottlieb, L. D., and V. S. Ford. 1996. Phylogenetic relationships amongthe sections of Clarkia (Onagraceae) inferred from the nucleotide se-quences of PgiC. Syst. Bot. 21:45–62.
Grassly, N. C., and E. C. Holmes. 1997. A likelihood method for thedetection of selection and recombination using nucleotide sequences.Mol. Biol. Evol. 14:239–247.
Hasegawa, M., and H. Kishino. 1989. Confidence-limits onthe maximum-likelihood estimate of the hominoid tree frommitochondrial-DNA sequences. Evolution 43:672–677.
Huelsenbeck, J. P., and J. J. Bull. 1996. A likelihood ratio test to detectconflicting phylogenetic signal. Syst. Biol. 45:92–98.
Kelchner, S. A. 2002. Group II introns as phylogenetic tools: Structurefunction, and evolutionary constraints. Am. J. Bot. 89:1651–1669.
Kishino, H., and M. Hasegawa. 1989. Evaluation of the maximum-likelihood estimate of the evolutionary tree topologies from DNA-sequence data, and the branching order in hominoidea. J. Mol. Evol.29:170–179.
Kosuge, K., K. Sawada, T. Denda, J. Adachi, and K. Watanabe. 1995.Phylogenetic relationships of some genera in the Ranuculaceaebased on alcohol dehydrogenase genes. Plant Syst. emat Evol.9(Suppl):263–271.
Martin, A. P., and T. M. Burg. 2002. Perils of paralogy: Using HSP70genes for inferring organismal phylogenies. Syst. Biol. 51:570–587.
Martin, W., and R. G. Herrmann. 1998. Gene transfer from organellesto the nucleus: How much, what happens, and why? Plant Physiol.Rockville. Sept. 118:9–17.
Mason-Gamer, R. J., C. F. Weil, and E. A. Kellogg. 1998. Granule-boundstarch synthase: Structure, function, and phylogenetic utility. Mol.Biol. Evol. 15:1658–1673.
Millar, A. A., and E. S. Dennis. 1996. The alcohol dehydrogenase genesof cotton. Plant Mol. Biol. 31:897–904.
Nylander, J. A. A. 2003. MrModeltest, version 1.1b. Department ofSystematic Zoology, EBC, Uppsala University, Sweden. E-mail: [email protected]
Oxelman, B., and B. Bremer. 2000. Discovery of paralogous nuclear genesequences coding for the second-largest subunit of RNA polymeraseII (RPB2) and their phylogenetic utility in gentianales of the asterids.Mol. Biol. Evol. 17:1131–1145.
Dow
nloaded from https://academ
ic.oup.com/sysbio/article/53/6/914/1651891 by guest on 15 July 2022
932 SYSTEMATIC BIOLOGY VOL. 53
Oxelman, B., and M. Liden. 1995. Generic boundaries in the tribe Sile-neae (Caryophyllaceae) as inferred from nuclear rDNA sequences.Taxon 44:525–542.
Oxelman, B., M. Liden, and D. Berglund. 1997. Chloroplast rps16 intronphylogeny of the tribe Sileneae (Caryophyllaceae). Plant Syst. ematEvol. 206:393–410.
Oxelman, B., M. Liden, R. K. Rabeler, and M. Popp. 2001. A revisedgeneric classification of the tribe Sileneae (Caryophyllaceae). NordicJ. Bot. 20:743–748.
Pamilo, P., and M. Nei. 1988. Relationships between gene trees andspecies trees. Mol. Biol. Evol. 5:568–583.
Popp, M., P. Erixon, F. Eggens, and B. Oxelman. In press. Originand evolution of a circumpolar polyploid species complex in Silene(Caryophyllaceae) inferred from low copy nuclear RNA polymeraseintrons, rDNA, and chloroplast DNA. Syst. Bot.
Popp, M., and B. Oxelman. 2001. Inferring the history of the polyploidSilene aegaea (Caryophyllaceae) using plastid and homoeologous nu-clear DNA sequences. Mol. Phylogenet. Evol. 20:474–481.
Posada, D. and K. A. Crandall. 1998. MODELTEST: testing the modelof DNA substitution. Bioinformatics 14:817–818.
Rauscher, J. T., J. J. Doyle, and A. H. D. Brown. 2002. Internal transcribedspacer repeat-specific primers and the analysis of hybridization inthe Glycine tomentella (Leguminosae) polyploid complex. Mol. Ecol.11:2691–2702.
Rujan, T., and W. Martin. 2001. How many genes in Arabidopsis comefrom cyanobacteria? An estimate from 386 protein phylogenies.Trends in Genet. 17:113–120.
Sang, T. 2002. Utility of low-copy nuclear gene sequences in plant phy-logenetics. Crit. Rev. Biochem. Mol. Biol. 37:121–147.
Shaked, H., K. Kashkush, H. Ozkan, M. Feldman, and A. A. Levy.2001. Sequence elimination and cytosine methylation are rapid andreproducible responses of the genome to wide hybridization andallopolyploidy in wheat. Plant Cell 13:1749–1759.
Shimodaira, H., and M. Hasegawa. 1999. Multiple comparisons of log-likelihoods with applications to phylogenetic inference. Mol. Biol.Evol. 16:1114–1116.
Swofford, D. L. 2002. PAUP∗. Phylogenetic analysis using parsimony(∗and other methods). version 4.0b10. Sinauer Associates, Sunder-land, Massachusetts.
Tank, D. C., and T. Sang. 2001. Phylogenetic utility of the glycerol-3-phosphate acyltransferase gene: Evolution and implications in Paeo-nia (Paeoniaceae). Mol. Phylogenet. Evol. 19:421–429.
The Arabidopsis Genome Initiative. 2000. Analysis of the genome se-quence of the flowering plant Arabidopsis thaliana. Nature 408:796–815.
Wagner, A., N. Blackstone, P. Cartwright, M. Dick, B. Misof, P. Snow, G.P. Wagner, J. Bartels, M. Murtha, and J. Pendleton. 1994. Surveys ofgene families using polymerase chain-reaction—PCR selection andPCR drift. Syst. Biol. 43:250–261.
Walker, E. L., N. F. Weeden, C. B. Taylor, P. Green, and G. M. Coruzzi.1995. Molecular evolution of duplicate copies of genes encodingcytosolic glutamine synthetase in Pisum sativum. Plant Mol. Biol.29:1111–1125.
Wen, J., M. Vanek-Krebitz, K. Hoffmann-Sommergruber, O. Scheiner,and H. Breiteneder. 1997. The potential of Betv1 homologues, a nu-clear multigene family, as phylogenetic markers in flowering plants.Mol. Phylogenet. Evol. 8:317–333.
Wendel, J. F., and J. J. Doyle. 1998. Phylogenetic incongruence: Win-dow into genome history and molecular evolution. Pages 265–296 InMolecular systematics of plants. II (P. Soltis, D. Soltis, and J. Doyle,eds.). Kluwer Academic Press, Dordrecht.
Wendel, J. F., A. Schnabel, and T. Seelanan. 1995. Bidirectional inter-locus concerted evolution following allopolyploid speciation in cot-ton (Gossypium). Proc. Nat. Acad. Sci. USA 92:280–284.
White, T. J., T. Bruns, S. Lee, and J. Taylor. 1990. Amplification and directsequencing of fungal ribsomal RNA genes for phylogenetics. Pages315–322 in PCR protocols: A guide to methods and applications (M.Innis, D. Gelfand, J. Sninsky, and T. J. White, eds.). Academic Press,San Diego, California.
Yokoyama, S., and D. E. Harry. 1993. Molecular phylogeny and evo-lutionary rates of alcohol dehydrogenases in vertebrates and plants.Mol. Biol. Evol. 10:1215–1226.
First submitted 29 July 2003; reviews returned 14 January 2004;final acceptance 23 August 2004
Associate Editor: Roberta Mason-Gamer
Dow
nloaded from https://academ
ic.oup.com/sysbio/article/53/6/914/1651891 by guest on 15 July 2022
Related Documents