Evolution, architecture and hierarchy of distributary deep-water deposits: a high-resolution outcrop investigation from the Permian Karoo Basin, South Africa A. PRE ´ LAT, D. M. HODGSON and S. S. FLINT Stratigraphy Group, Department of Earth and Ocean Sciences, University of Liverpool, 4 Brownlow Street, Liverpool, L69 3GP, UK (E-mail: [email protected]) Associate Editor: Adrian Immenhauser ABSTRACT Sea floor and shallow seismic data sets of terminal submarine fan lobes can provide excellent planform timeslices of distributive deep-water systems but commonly only limited information on cross-sectional architecture. Extensive outcrops in the Tanqua depocentre, south-west Karoo Basin, provide these three-dimensional constraints on lithofacies distributions, stacking patterns, depositional geometries and the stratigraphic evolution of submarine lobe deposits at a scale comparable with modern lobe systems. Detailed study (bed-scale) of a single-lobe complex (Fan 3) over a 15 km by 8 km area has helped to define a four-fold hierarchy of depositional elements from bed through to lobe element, lobe and lobe complex. The Fan 3 lobe complex comprises six distinct fine-grained sandstone packages, interpreted as lobes, which display compensational stacking patterns on a 5 km scale. Between successive lobes are thin-bedded, very fine-grained sandstones and siltstones that do not change lithofacies over several kilometres and therefore are identified as a different architectural element. Each lobe is built by many lobe elements, which also display compensational stacking patterns over a kilometre scale. Thickness variations of lobe elements can be extremely abrupt without erosion, particularly in distal areas where isopach maps reveal a finger-like distal fringe to lobes. Lobe deposits, therefore, are not simple radial sheet-dominated systems as commonly envisaged. Keywords Dimensions, geometry of depositional elements, hierarchy, Permian, submarine lobe deposits, Tanqua depocentre. INTRODUCTION Terminal submarine fan lobes are distributive systems at the most down-dip depositional position of terrigenous sediment transported by gravity flows through basin margins. Terminal lobes contrast with transient intraslope lobes (e.g. Adeogba et al., 2005) as they mark the most distal component of the clastic depositional system and are dominated by sediment gravity- flow processes. As such, these lobes form an important, if cryptic, record of the interplay between climatic, eustatic and tectonic controls on the transfer of sediment from land to ocean. Early investigation of terminal lobe systems from analysis of modern systems (e.g. Normark, 1970, 1978; Walker, 1978) has been supported by high- resolution seismic and side-scan sonar data sets (e.g. Nelson et al., 1992; Twichell et al., 1992; Ribeiro Machado et al., 2004; Gervais et al., 2006; Deptuck et al., 2008; Jegou et al., 2008; Saller et al., 2008). These data sets provide information on the depositional architecture, the map-pattern hierarchy and stacking patterns of depositional elements that comprise lobe deposits. High-resolution outcrop data sets, however, allow lithofacies distributions to be documented across a hierarchy of elements in lobe deposits, which cannot be attained by other means. Sedimentology (2009) 56, 2132–2154 doi: 10.1111/j.1365-3091.2009.01073.x 2132 Ó 2009 The Authors. Journal compilation Ó 2009 International Association of Sedimentologists

Welcome message from author
This document is posted to help you gain knowledge. Please leave a comment to let me know what you think about it! Share it to your friends and learn new things together.
Transcript
Evolution, architecture and hierarchy of distributary deep-waterdeposits: a high-resolution outcrop investigation from thePermian Karoo Basin, South Africa
A. PRELAT, D. M. HODGSON and S. S. FLINTStratigraphy Group, Department of Earth and Ocean Sciences, University of Liverpool, 4 BrownlowStreet, Liverpool, L69 3GP, UK (E-mail: [email protected])
Associate Editor: Adrian Immenhauser
ABSTRACT
Seafloorandshallowseismicdata sets of terminal submarine fan lobescanprovide
excellent planform timeslices of distributive deep-water systems but commonly
only limited information on cross-sectionalarchitecture. Extensive outcrops in the
Tanqua depocentre, south-west Karoo Basin, provide these three-dimensional
constraints on lithofacies distributions, stacking patterns, depositional geometries
and the stratigraphic evolution of submarine lobe deposits at a scale comparable
with modern lobe systems. Detailed study (bed-scale) of a single-lobe complex
(Fan 3) over a 15 km by 8 km area has helped to define a four-fold hierarchy of
depositional elements from bed through to lobe element, lobe and lobe complex.
The Fan 3 lobe complex comprises six distinct fine-grained sandstone packages,
interpreted as lobes, which display compensational stacking patterns on a 5 km
scale. Betweensuccessive lobes are thin-bedded, very fine-grainedsandstonesand
siltstones that do not change lithofacies over several kilometres and therefore are
identified as a different architectural element. Each lobe is built by many lobe
elements, which also display compensational stacking patterns over a kilometre
scale. Thickness variations of lobe elements can be extremely abrupt without
erosion, particularly in distal areas where isopach maps reveal a finger-like distal
fringe to lobes. Lobe deposits, therefore, are not simple radial sheet-dominated
systems as commonly envisaged.
Keywords Dimensions, geometry of depositional elements, hierarchy,Permian, submarine lobe deposits, Tanqua depocentre.
INTRODUCTION
Terminal submarine fan lobes are distributivesystems at the most down-dip depositionalposition of terrigenous sediment transported bygravity flows through basin margins. Terminallobes contrast with transient intraslope lobes(e.g. Adeogba et al., 2005) as they mark the mostdistal component of the clastic depositionalsystem and are dominated by sediment gravity-flow processes. As such, these lobes form animportant, if cryptic, record of the interplaybetween climatic, eustatic and tectonic controlson the transfer of sediment from land to ocean.Early investigation of terminal lobe systems from
analysis of modern systems (e.g. Normark, 1970,1978; Walker, 1978) has been supported by high-resolution seismic and side-scan sonar data sets(e.g. Nelson et al., 1992; Twichell et al., 1992;Ribeiro Machado et al., 2004; Gervais et al.,2006; Deptuck et al., 2008; Jegou et al., 2008;Saller et al., 2008). These data sets provideinformation on the depositional architecture,the map-pattern hierarchy and stacking patternsof depositional elements that comprise lobedeposits. High-resolution outcrop data sets,however, allow lithofacies distributions to bedocumented across a hierarchy of elements inlobe deposits, which cannot be attained by othermeans.
Sedimentology (2009) 56, 2132–2154 doi: 10.1111/j.1365-3091.2009.01073.x
2132 � 2009 The Authors. Journal compilation � 2009 International Association of Sedimentologists
Detailed correlation of interpreted lobe depositsat outcrop can provide some constraints on thedistribution and stacking pattern of lithofaciesand depositional elements but these analyses arelimited by the much greater three-dimensional(3D) size of the lobes compared with the two-dimensional (2D) control that the outcrop affords.Commonly, these deposits are referred to as‘sheets’ because the 3D geometry and volume ofthe deposits cannot be resolved (Shanmugam &Moiola, 1991; Mahaffie, 1994; Satur et al., 2000;Shanmugam, 2000; Weimar & Slatt, 2006). Sev-eral outcrop-based schemes of depositional ele-ments identified in terminal lobe deposits havebeen presented; for example, the Upper Carbon-iferous Ross Formation, Western Ireland (Chapinet al., 1994; Sullivan et al., 2004), the PermianBrushy Canyon Formation, West Texas, USA(Beaubouef et al., 1999; Carr & Gardner, 2000),the Permian Skoorsteenberg Formation, SouthAfrica (Johnson et al., 2001; Sullivan et al.,2004; Hodgson et al., 2006) and the Eocene HechoGroup, Northern Spain (e.g. Remacha & Fernan-dez, 2003). A key outcrop-derived characteristicof terminal lobe deposits is the presence ofsystematic vertical patterns in bed thickness.Mutti & Sonnino (1981) ascribed upward-thick-ening packages to outer fan progradation andvertical accretion. Mutti & Sonnino (1981) alsoobserved that the stacking pattern between bedsresults from the smoothing of the depositionaltopography along a short (500 m) strike sectionand named them ‘compensational cycles’ but theywere not able to place constraints on the shape orsize of the lobes.
Detailed study of terminal lobe deposits anddistributary systems has been less extensive thanslope channel/levee systems. Lobes form down-dip of a submarine channel mouth, or ‘transitionpoint’ (Posamentier & Kolla, 2003; Posamentier &Walker, 2006). Commonly, this is also the pointwhere the sand-to-mud ratio is greatest because,downslope of the transition point, the sand part ofthe flow is unconfined (Posamentier & Kolla, 2003).With deep hydrocarbon exploration and challeng-ing production issues, it has become apparent thatan improved understanding of the geometry andstacking pattern of the depositional elementswhich comprise lobe deposits is required.
Extensive exposures of Permian basin-floorsubmarine fans in the south-west Karoo Basinprovide a rare opportunity for a comprehensiveinvestigation of terminal lobe deposits. Thepresent-day geomorphology provides continuous(tens of kilometres) outcrops down depositional
dip and across depositional strike with numerousclosely spaced gullies and no significant tectonicdisruption. Aspects of terminal lobe depositsdiscussed here include: (i) their architecturalhierarchy; (ii) lateral change in thickness trends;(iii) depositional geometries and volumes; (iv)distribution of lithofacies; and (v) controls onstacking patterns. Excellent exposures of distallobe deposits and subsurface information fromresearch boreholes in the study area allow theassessment of lobe fringe settings and deposi-tional shapes.
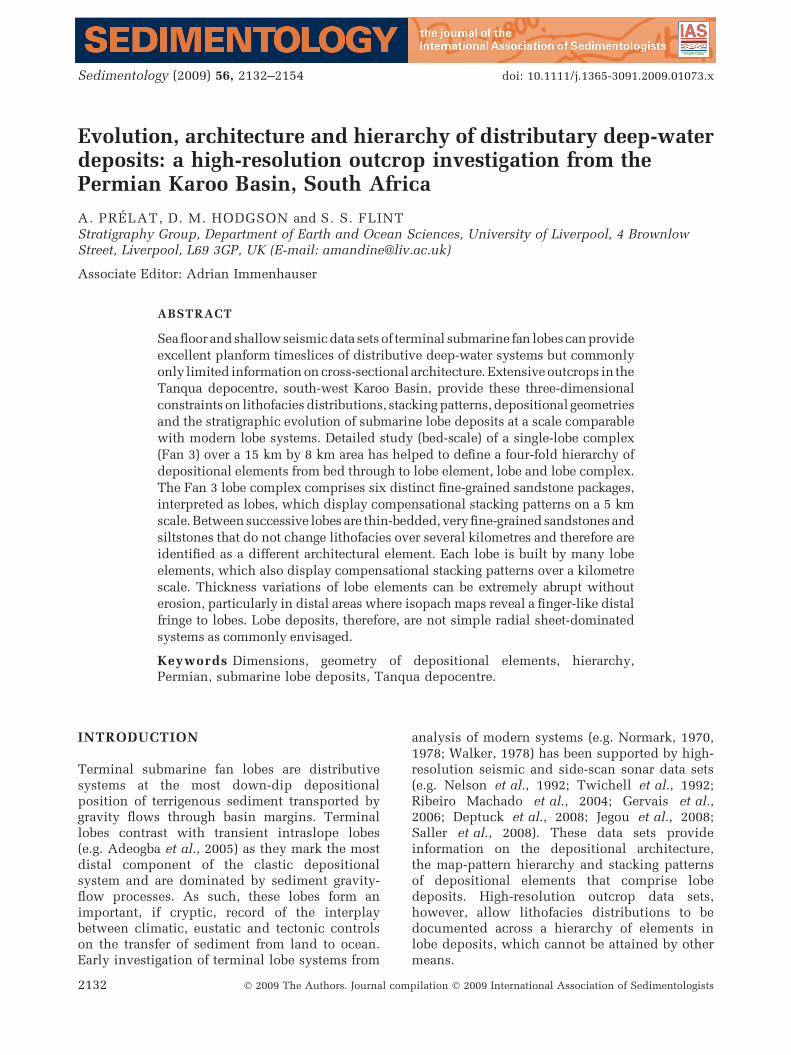
Here, terminal lobes are considered to formdownslope of a lobe apex (or transition point;Fig. 1). The volumetric centre (centre of mass) of alobe is referred to as the ‘lobe centroid’. Lobe lengthis the longest distance measured parallel to palae-oflow from apex to frontal pinchout, along the lobeaxis. Lobe width is the longest distance measuredperpendicular to palaeoflow direction and passesfrom lateral pinchout to lateral pinchout via tran-sitional sub-environments referred to as ‘lobe axis’,‘lobe off-axis’, ‘lobe fringe’ and ‘distal lobe fringe’.
GEOLOGICAL SETTING AND PREVIOUSWORK
The Late Palaeozoic to Mesozoic foreland basinsof the southern margin of Gondwana (Parana,Karoo, Beacon and Bowen Basins) developed in
Fig. 1. Schematic plan view and cross-section throughtwo lobes indicating the nomenclature used to describedifferent components and environments of distributivelobe systems.
Evolution, architecture and hierarchy of deep-water lobes 2133
� 2009 The Authors. Journal compilation � 2009 International Association of Sedimentologists, Sedimentology, 56, 2132–2154
response to convergent-margin tectonics (De Wit& Ransome, 1992; Veevers et al., 1994; Lopez-Gamundı & Rosello, 1998) (Fig. 2B). Northwardsubduction of the Panthalassan (palaeo-Pacific)plate beneath the Gondwana plate led to theformation of a magmatic arc between the KarooBasin and the southern margin of Gondwana(Visser, 1987, 1993; Johnson, 1991).
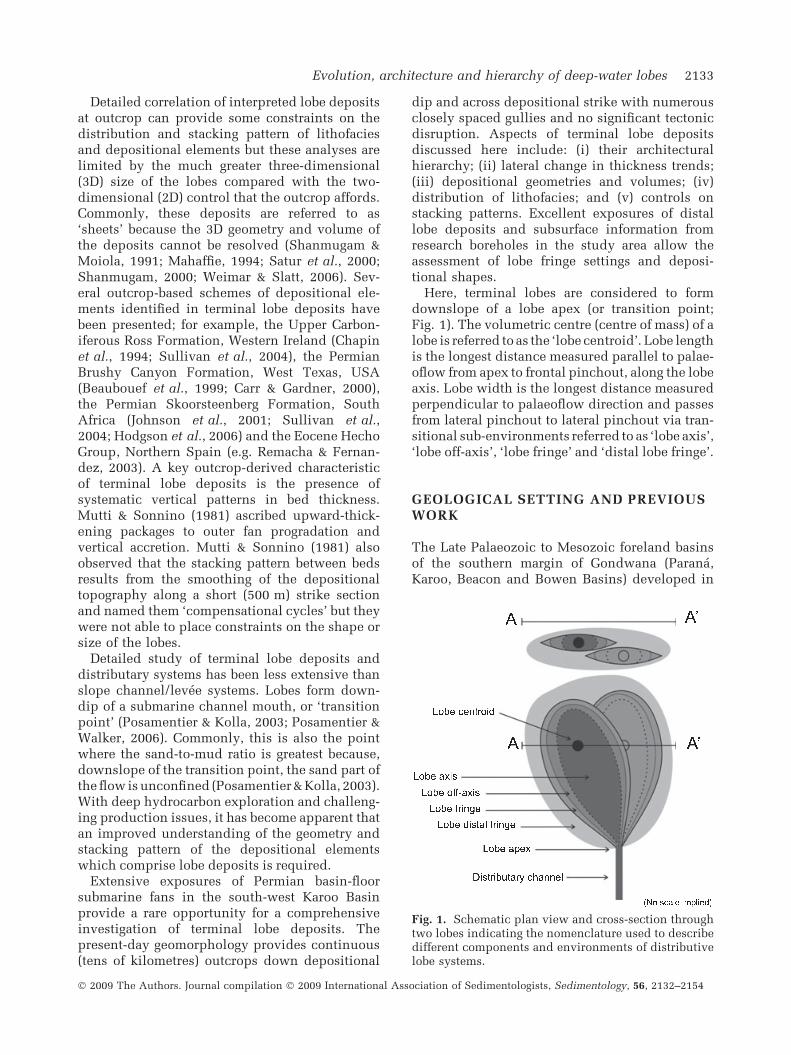
The Tanqua depocentre is located in the south-western corner of the Karoo Basin (Fig. 2A),where the Karoo Supergroup includes the DwykaGroup (glaciogenic), the Ecca Group (siliciclasticmarine) and the Beaufort Group (fluvial). TheLower Ecca Group comprises the Prince AlbertFormation (cherty shale beds), the WhitehillFormation (black, carbonaceous mudstones withpelagic organisms) and the Collingham Formation(fine-grained turbidites and intercalated ashes).The Upper Ecca Group includes the TierbergFormation (dark basinal mudstone), the Skoors-teenberg Formation (fine-grained, sand-rich, sub-marine-fan systems), the Kookfontein Formation
(slope and shelf-edge deltaic sediments) and theWaterford Formation (Bouma & Wickens, 1991;Wickens, 1994), which mark the overall progra-dation of the sedimentary system to the north andeast (Wild et al., 2005; Hodgson et al., 2006)(Fig. 3).
The Skoorsteenberg Formation consists of foursandstone-rich bodies interpreted as basin-floorfans (Fans 1 to 4; Bouma & Wickens, 1991;Wickens, 1994; Wickens & Bouma, 2000; Johnsonet al., 2001) and an upper unit interpreted asrepresenting a lower slope to base-of-slope setting(Unit 5; Wild et al., 2005; Hodgson et al., 2006).Within this formation, the grain-size range isnarrow, between mud and fine-grained sand.Differential global positioning system (DGPS)mapping of stratigraphic surfaces (Hodgetts et al.,2004) has been combined with accurate calibra-tion and correlation of seven strategically posi-tioned research boreholes (Luthi et al., 2006).This integrated data set has allowed the relativespatial and temporal distribution of lithofacies,
Fig. 2. (A) Satellite image of the field area showing the location of the Tanqua depocentre. (B) Generalized andsimplified Permian palaeogeographic map of Gondwana (after Faure & Cole, 1999).
2134 A. Prelat, D. M. Hodgson and S. S. Flint
� 2009 The Authors. Journal compilation � 2009 International Association of Sedimentologists, Sedimentology, 56, 2132–2154
architectural elements and palaeocurrents to beestablished (Hodgson et al., 2006) (Fig. 4). Fromthis study, a pattern of fan growth (initiation andbasinward movement of the fan fringe), aggrada-tion and fan retreat (landward movement of thefan fringe) has been documented for each basinfloor fan.
This study is focused on lobe deposits of Fan 3that crop out in the northern part of the Tanqua ina 15 km down-dip (N–S) and 8 km across-strike(E–W) area some 15 km from the frontal pinchoutof Fan 3 (Fig. 4A). The principal palaeocurrentorientations are to the north/north-east (Johnsonet al., 2001; Van der Werff & Johnson, 2003; Luthiet al., 2006). Recently published U-Pb single-grain zircon ages from ashes indicate that thesubmarine fans of the Skoorsteenberg Formationwere deposited during the Late Permian (Fildaniet al., 2007) (Fig. 3).
METHODOLOGY, DATA SET AND STUDYAREA
The present-day geomorphology of the study areaallows the 3D architecture and geometry of the lobe
deposits to be constrained via a series of closelyspaced gullies (500 to 1000 m deep, 100 to 200 mwide; Fig. 4B) which generally are continuous indown-dip (S–N) and across-strike (E–W) orienta-tions, which permit key surfaces, marker beds andbedsets to be walked out for several kilometres.
The data set comprises a total of 239 sedimentarylogs that were correlated between 44 architecturalpanels (Fig. 4B). Each architectural panel recordsthicknesses of the different units, correspondingsedimentary lithofacies and palaeocurrent mea-surements. Key stratigraphic surfaces, beds andbedsets were walked out systematically in order toachieve a robust correlation of the internal strati-graphy of Fan 3. More than 800 palaeocurrentmeasurements, primarily from ripples’ cross-lamination on the top surface of beds, werecollected and tied to specific stratigraphic units.The data distribution enabled construction ofisopach maps for each lobe as well as for eachinterlobe unit. Lengths and widths of the differentarchitectural elements were measured using ahand held GPS with accuracy ±5 m. When theelement measured was more extensive than theoutcrop control, a minimum size was extrapolated,using one or more pinchout points and the rate of
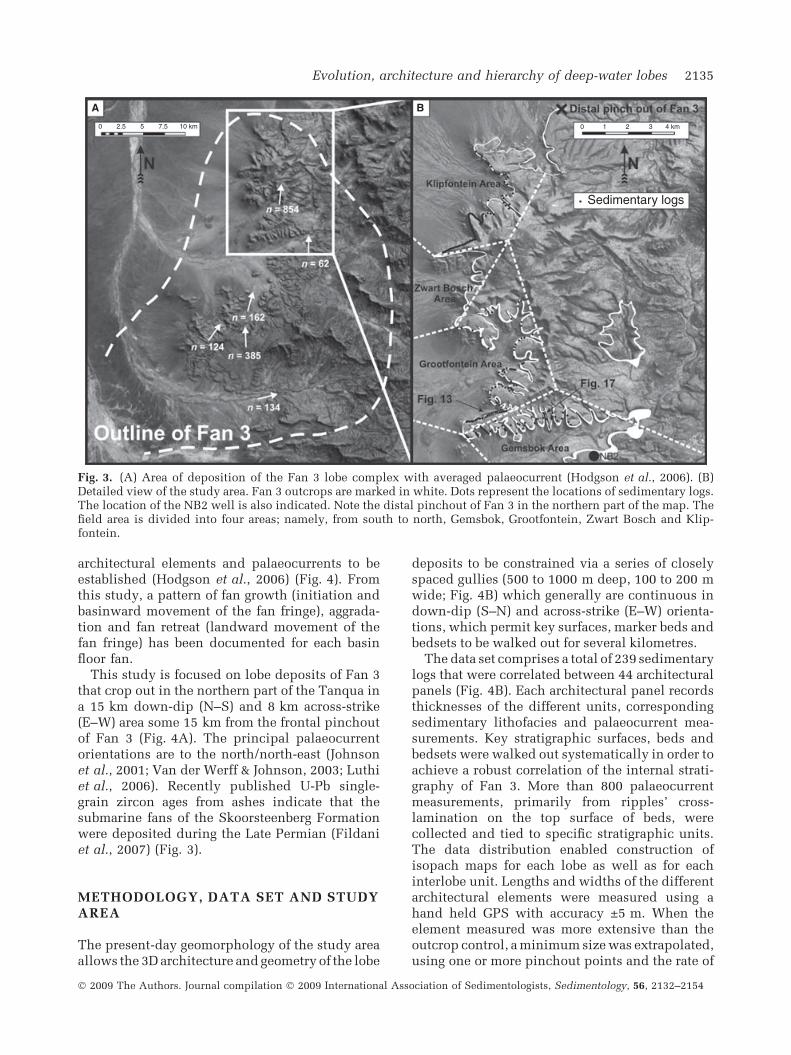
Fig. 3. (A) Area of deposition of the Fan 3 lobe complex with averaged palaeocurrent (Hodgson et al., 2006). (B)Detailed view of the study area. Fan 3 outcrops are marked in white. Dots represent the locations of sedimentary logs.The location of the NB2 well is also indicated. Note the distal pinchout of Fan 3 in the northern part of the map. Thefield area is divided into four areas; namely, from south to north, Gemsbok, Grootfontein, Zwart Bosch and Klip-fontein.
Evolution, architecture and hierarchy of deep-water lobes 2135
� 2009 The Authors. Journal compilation � 2009 International Association of Sedimentologists, Sedimentology, 56, 2132–2154
thinning. In addition to this outcrop data set, theNB2 and NS2 research boreholes (Hodgson et al.,2006) are included in the data set.
LITHOFACIES
The lithofacies of the Skoorsteenberg Formationhas been described in detail previously (e.g.
Johnson et al., 2001; Hodgson et al., 2006). Belowis a brief summary of the lithofacies encounteredin this study.
Thick-bedded sandstone
This lithofacies is characterized by >0Æ6 m thickbeds of fine-grained sandstone that commonly areamalgamated. Typically, beds are structureless,
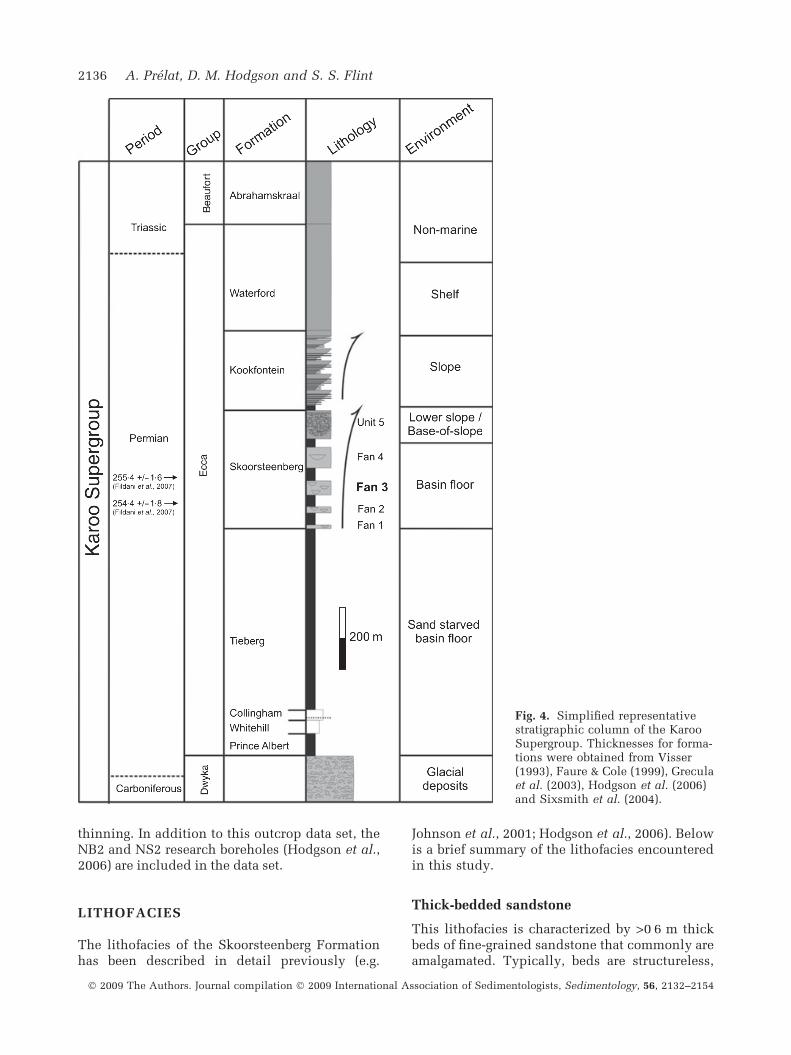
Fig. 4. Simplified representativestratigraphic column of the KarooSupergroup. Thicknesses for forma-tions were obtained from Visser(1993), Faure & Cole (1999), Greculaet al. (2003), Hodgson et al. (2006)and Sixsmith et al. (2004).
2136 A. Prelat, D. M. Hodgson and S. S. Flint
� 2009 The Authors. Journal compilation � 2009 International Association of Sedimentologists, Sedimentology, 56, 2132–2154
with thin divisions at bed tops that grade to veryfine-grained sandstone with faint parallel andripple lamination. Bed bases are sharp, erosive orloaded, with common tool marks. Amalgamationsurfaces between beds are highlighted by subtlegrain-size breaks, convolute lamination, trunca-tion of dewatering features (pipes and dishes), orthin discontinuous layers of small (<2 cm dia-meter) mudstone clasts. Mudstone clasts ofvarious sizes mantle erosion surfaces. This lithof-acies is interpreted as the deposits from high-concentration, locally erosive turbidity currents,commonly found in axial positions (Lowe, 1982).
Thin-bedded to medium-bedded sandstone
Thin-bedded to medium-bedded sandstonesrange between 0Æ03 and 0Æ6 m in thickness andare very fine-grained or fine-grained (Fig. 5A).Stratification is highlighted by normal gradingand thin (<1 cm) siltstone drapes. Typical sedi-
mentary structures are parallel, current andclimbing ripple lamination, although structure-less graded divisions are common. Beds aretabular to lenticular in cross-sectional geometry.This lithofacies is interpreted as the deposits oflow concentration turbidity currents, commonlydeposited in off-axis/fringe positions. Locally,bipartite beds occur with a lower structurelesssandstone division overlain by an upper poorlysorted to chaotic division that is concentrated inmudstone clasts and plant fragments (Fig 4D).These beds are interpreted as turbidites with‘linked debrites’ (Hodgson 2009; sensu Haughtonet al., 2003).
Heterolithic packages
Silt-prone heterolithic packages consist of alter-nations of thin-bedded (0Æ01 to 0Æ05 m thick),commonly ripple or planar-laminated gradedsiltstones and very fine-grained sandstones
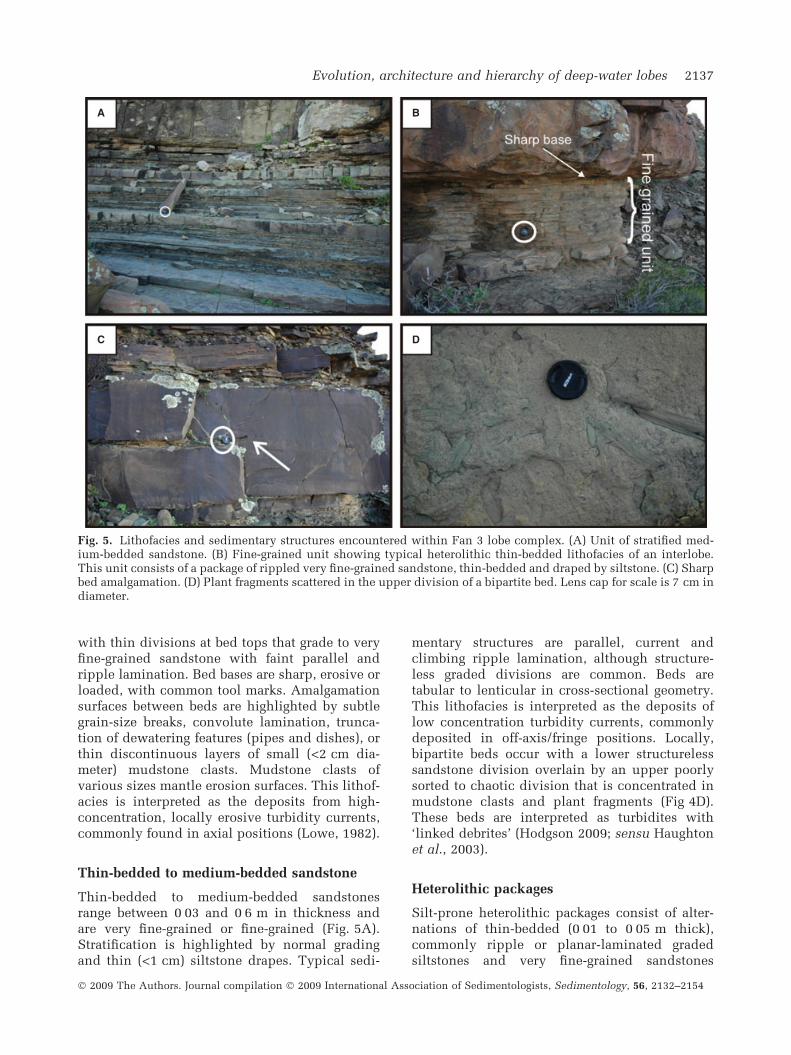
Fig. 5. Lithofacies and sedimentary structures encountered within Fan 3 lobe complex. (A) Unit of stratified med-ium-bedded sandstone. (B) Fine-grained unit showing typical heterolithic thin-bedded lithofacies of an interlobe.This unit consists of a package of rippled very fine-grained sandstone, thin-bedded and draped by siltstone. (C) Sharpbed amalgamation. (D) Plant fragments scattered in the upper division of a bipartite bed. Lens cap for scale is 7 cm indiameter.
Evolution, architecture and hierarchy of deep-water lobes 2137
� 2009 The Authors. Journal compilation � 2009 International Association of Sedimentologists, Sedimentology, 56, 2132–2154
(Fig. 5B). Packages vary between 0Æ2 and 2 m inthickness and maintain a constant thickness andlithofacies over the scale of the study area, exceptin case of erosion by younger units. This litho-facies is interpreted as the deposits of dilute lowconcentration turbidity currents. Hemipelagicclaystone is only found outside the fan succes-sions.
HIERARCHY SCHEME
Hierarchy of lobe deposits
Hierarchical schemes of component architecturalelements have been developed in a range ofsiliciclastic settings including fluvial, submarinechannel/levee and aeolian dune deposits in orderto aid comparison of scales, processes and stack-ing patterns across different data sets (e.g. Allen,1966; Brookfield, 1977; Mutti & Normark, 1987;Miall, 1988; Pickering & Clark, 1996; Spragueet al., 2003). In these schemes, architecturalelements are defined by their bounding surfacesand depositional geometries. Here, the hierarchyis defined based on the characteristics and geo-metry of fine-grained units that bound the sand-prone bodies. A hierarchy of submarine lobeelements has recently been proposed, largelyemploying map-view dimensions from modernand subsurface data sets (Ribeiro Machado et al.,2004; Gervais et al., 2006; Deptuck et al., 2008).
While these studies can provide useful con-straints on the size, shape and stacking patternsof the lobe deposits, they lack information on thenature of bounding surfaces and the thickness,lithofacies and grain-size distributions of thecomposite stratal units. The lateral scale of thearchitectural elements is far greater than mostoutcrops but the scale of the Tanqua outcropspermits mapping of individual architectural ele-ments and documentation of the internal archi-tecture, distributions of lithofacies and estimatevolumes.
Defining a hierarchy in the Tanqua lobedeposits
Development of an outcrop-based hierarchy ofarchitectural elements that form the buildingblocks of a distributive deep-water system beginswith identification of surfaces and/or fine-grainedunits that bound sandstone bodies. This approachdefines the levels of genetically related compositeelements. An initial hierarchy scheme can bedeveloped using one-dimensional (1D) (log) and2D (architectural panel) data sets, although map-ping of the composite elements is required toidentify stacking patterns that could refine thehierarchy.
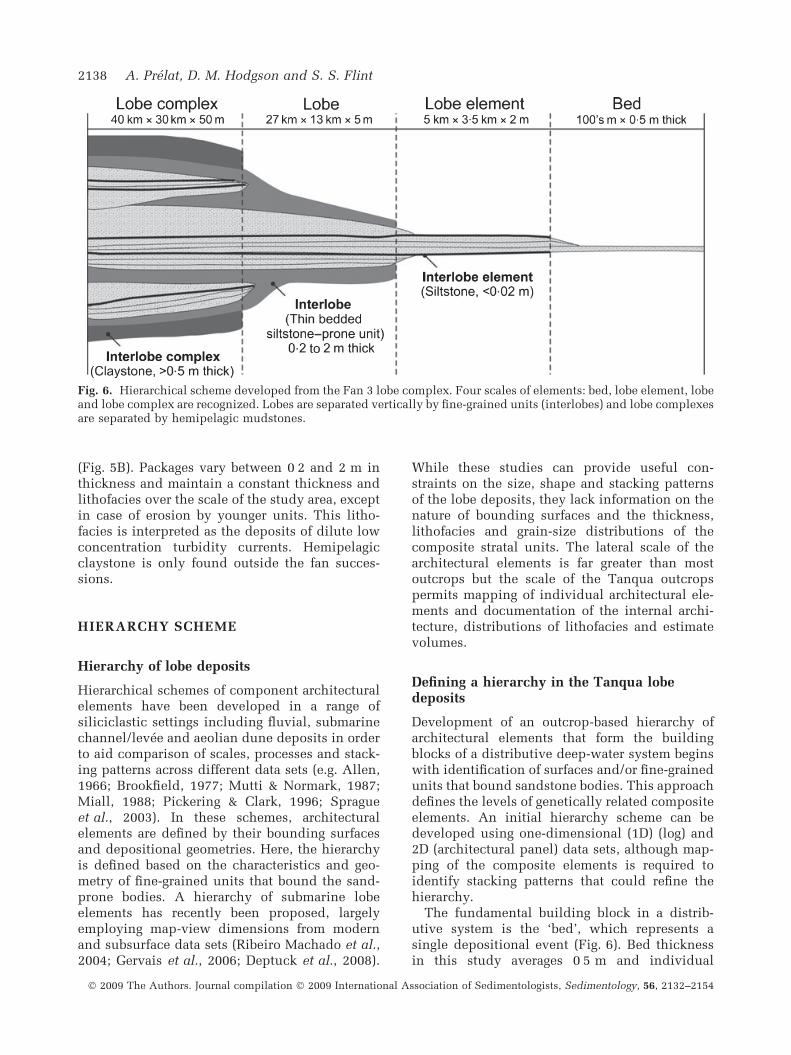
The fundamental building block in a distrib-utive system is the ‘bed’, which represents asingle depositional event (Fig. 6). Bed thicknessin this study averages 0Æ5 m and individual
Fig. 6. Hierarchical scheme developed from the Fan 3 lobe complex. Four scales of elements: bed, lobe element, lobeand lobe complex are recognized. Lobes are separated vertically by fine-grained units (interlobes) and lobe complexesare separated by hemipelagic mudstones.
2138 A. Prelat, D. M. Hodgson and S. S. Flint
� 2009 The Authors. Journal compilation � 2009 International Association of Sedimentologists, Sedimentology, 56, 2132–2154
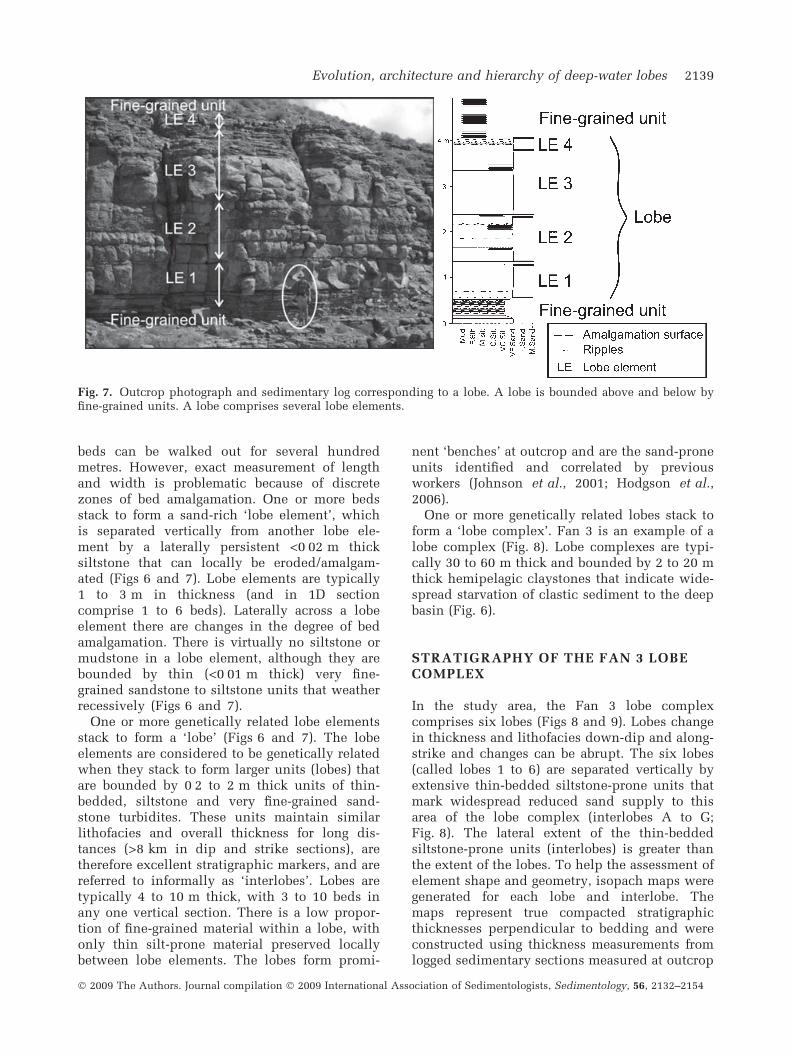
beds can be walked out for several hundredmetres. However, exact measurement of lengthand width is problematic because of discretezones of bed amalgamation. One or more bedsstack to form a sand-rich ‘lobe element’, whichis separated vertically from another lobe ele-ment by a laterally persistent <0Æ02 m thicksiltstone that can locally be eroded/amalgam-ated (Figs 6 and 7). Lobe elements are typically1 to 3 m in thickness (and in 1D sectioncomprise 1 to 6 beds). Laterally across a lobeelement there are changes in the degree of bedamalgamation. There is virtually no siltstone ormudstone in a lobe element, although they arebounded by thin (<0Æ01 m thick) very fine-grained sandstone to siltstone units that weatherrecessively (Figs 6 and 7).
One or more genetically related lobe elementsstack to form a ‘lobe’ (Figs 6 and 7). The lobeelements are considered to be genetically relatedwhen they stack to form larger units (lobes) thatare bounded by 0Æ2 to 2 m thick units of thin-bedded, siltstone and very fine-grained sand-stone turbidites. These units maintain similarlithofacies and overall thickness for long dis-tances (>8 km in dip and strike sections), aretherefore excellent stratigraphic markers, and arereferred to informally as ‘interlobes’. Lobes aretypically 4 to 10 m thick, with 3 to 10 beds inany one vertical section. There is a low propor-tion of fine-grained material within a lobe, withonly thin silt-prone material preserved locallybetween lobe elements. The lobes form promi-
nent ‘benches’ at outcrop and are the sand-proneunits identified and correlated by previousworkers (Johnson et al., 2001; Hodgson et al.,2006).
One or more genetically related lobes stack toform a ‘lobe complex’. Fan 3 is an example of alobe complex (Fig. 8). Lobe complexes are typi-cally 30 to 60 m thick and bounded by 2 to 20 mthick hemipelagic claystones that indicate wide-spread starvation of clastic sediment to the deepbasin (Fig. 6).
STRATIGRAPHY OF THE FAN 3 LOBECOMPLEX
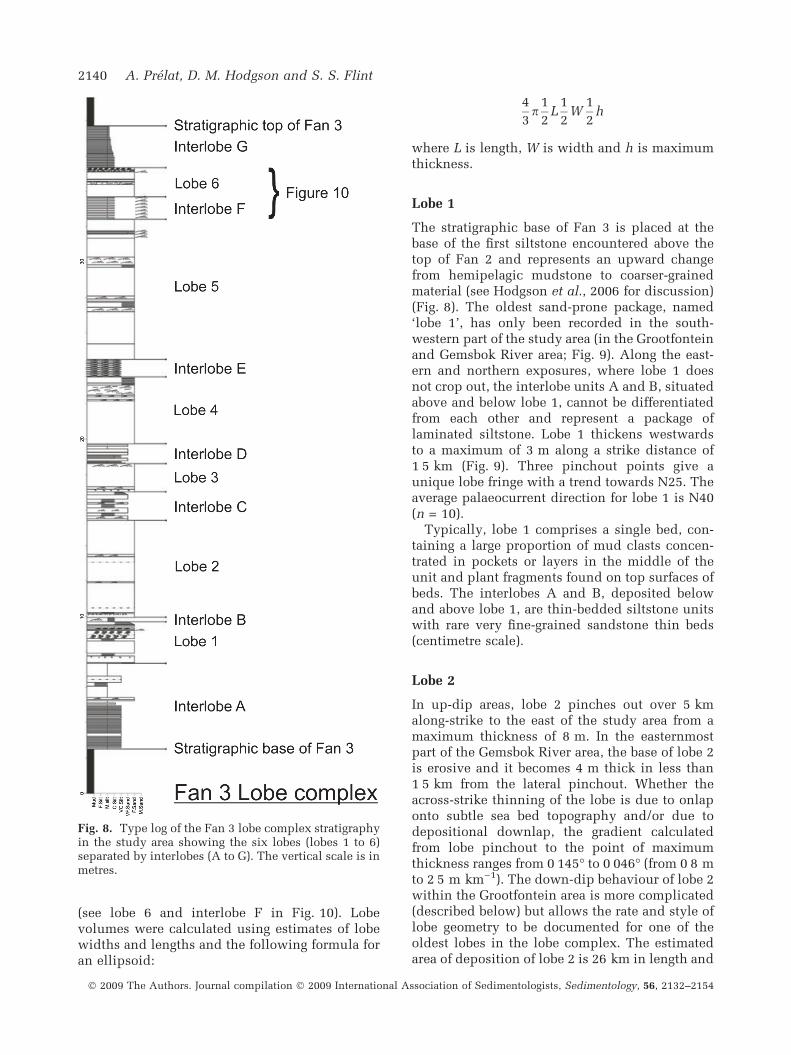
In the study area, the Fan 3 lobe complexcomprises six lobes (Figs 8 and 9). Lobes changein thickness and lithofacies down-dip and along-strike and changes can be abrupt. The six lobes(called lobes 1 to 6) are separated vertically byextensive thin-bedded siltstone-prone units thatmark widespread reduced sand supply to thisarea of the lobe complex (interlobes A to G;Fig. 8). The lateral extent of the thin-beddedsiltstone-prone units (interlobes) is greater thanthe extent of the lobes. To help the assessment ofelement shape and geometry, isopach maps weregenerated for each lobe and interlobe. Themaps represent true compacted stratigraphicthicknesses perpendicular to bedding and wereconstructed using thickness measurements fromlogged sedimentary sections measured at outcrop
Fig. 7. Outcrop photograph and sedimentary log corresponding to a lobe. A lobe is bounded above and below byfine-grained units. A lobe comprises several lobe elements.
Evolution, architecture and hierarchy of deep-water lobes 2139
� 2009 The Authors. Journal compilation � 2009 International Association of Sedimentologists, Sedimentology, 56, 2132–2154
(see lobe 6 and interlobe F in Fig. 10). Lobevolumes were calculated using estimates of lobewidths and lengths and the following formula foran ellipsoid:
4
3p
1
2L
1
2W
1
2h
where L is length, W is width and h is maximumthickness.
Lobe 1
The stratigraphic base of Fan 3 is placed at thebase of the first siltstone encountered above thetop of Fan 2 and represents an upward changefrom hemipelagic mudstone to coarser-grainedmaterial (see Hodgson et al., 2006 for discussion)(Fig. 8). The oldest sand-prone package, named‘lobe 1’, has only been recorded in the south-western part of the study area (in the Grootfonteinand Gemsbok River area; Fig. 9). Along the east-ern and northern exposures, where lobe 1 doesnot crop out, the interlobe units A and B, situatedabove and below lobe 1, cannot be differentiatedfrom each other and represent a package oflaminated siltstone. Lobe 1 thickens westwardsto a maximum of 3 m along a strike distance of1Æ5 km (Fig. 9). Three pinchout points give aunique lobe fringe with a trend towards N25. Theaverage palaeocurrent direction for lobe 1 is N40(n = 10).
Typically, lobe 1 comprises a single bed, con-taining a large proportion of mud clasts concen-trated in pockets or layers in the middle of theunit and plant fragments found on top surfaces ofbeds. The interlobes A and B, deposited belowand above lobe 1, are thin-bedded siltstone unitswith rare very fine-grained sandstone thin beds(centimetre scale).
Lobe 2
In up-dip areas, lobe 2 pinches out over 5 kmalong-strike to the east of the study area from amaximum thickness of 8 m. In the easternmostpart of the Gemsbok River area, the base of lobe 2is erosive and it becomes 4 m thick in less than1Æ5 km from the lateral pinchout. Whether theacross-strike thinning of the lobe is due to onlaponto subtle sea bed topography and/or due todepositional downlap, the gradient calculatedfrom lobe pinchout to the point of maximumthickness ranges from 0Æ145� to 0Æ046� (from 0Æ8 mto 2Æ5 m km)1). The down-dip behaviour of lobe 2within the Grootfontein area is more complicated(described below) but allows the rate and style oflobe geometry to be documented for one of theoldest lobes in the lobe complex. The estimatedarea of deposition of lobe 2 is 26 km in length and
Fig. 8. Type log of the Fan 3 lobe complex stratigraphyin the study area showing the six lobes (lobes 1 to 6)separated by interlobes (A to G). The vertical scale is inmetres.
2140 A. Prelat, D. M. Hodgson and S. S. Flint
� 2009 The Authors. Journal compilation � 2009 International Association of Sedimentologists, Sedimentology, 56, 2132–2154
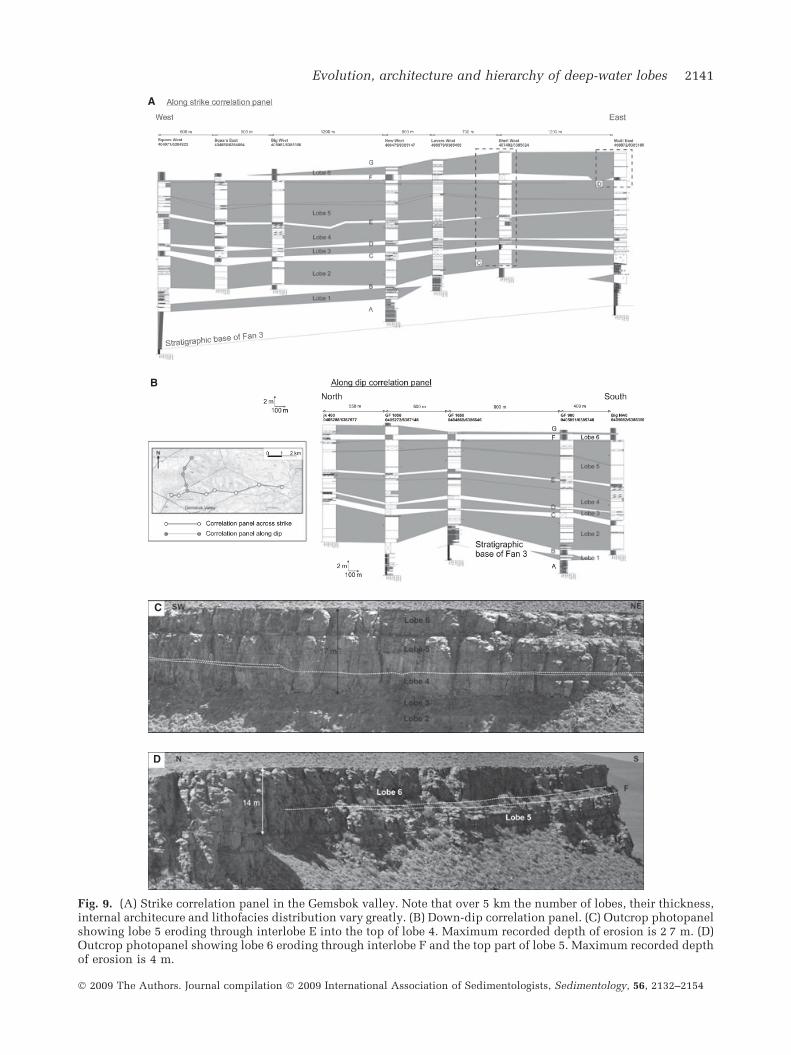
Fig. 9. (A) Strike correlation panel in the Gemsbok valley. Note that over 5 km the number of lobes, their thickness,internal architecure and lithofacies distribution vary greatly. (B) Down-dip correlation panel. (C) Outcrop photopanelshowing lobe 5 eroding through interlobe E into the top of lobe 4. Maximum recorded depth of erosion is 2Æ7 m. (D)Outcrop photopanel showing lobe 6 eroding through interlobe F and the top part of lobe 5. Maximum recorded depthof erosion is 4 m.
Evolution, architecture and hierarchy of deep-water lobes 2141
� 2009 The Authors. Journal compilation � 2009 International Association of Sedimentologists, Sedimentology, 56, 2132–2154
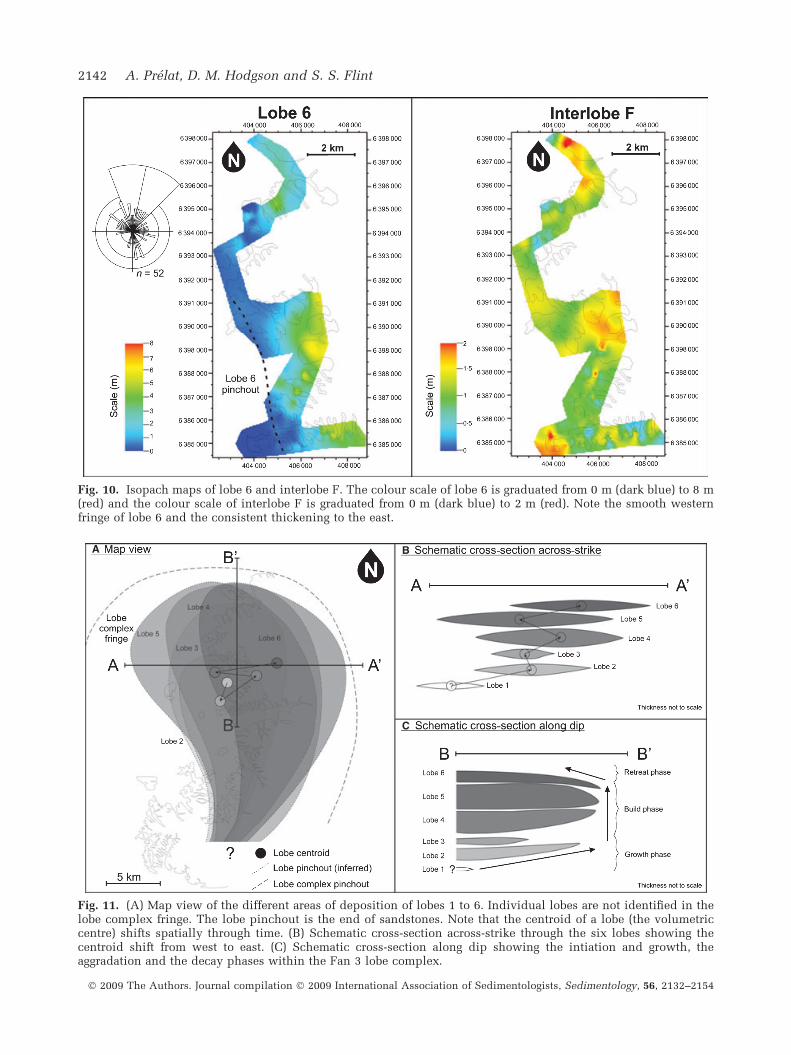
Fig. 10. Isopach maps of lobe 6 and interlobe F. The colour scale of lobe 6 is graduated from 0 m (dark blue) to 8 m(red) and the colour scale of interlobe F is graduated from 0 m (dark blue) to 2 m (red). Note the smooth westernfringe of lobe 6 and the consistent thickening to the east.
Fig. 11. (A) Map view of the different areas of deposition of lobes 1 to 6. Individual lobes are not identified in thelobe complex fringe. The lobe pinchout is the end of sandstones. Note that the centroid of a lobe (the volumetriccentre) shifts spatially through time. (B) Schematic cross-section across-strike through the six lobes showing thecentroid shift from west to east. (C) Schematic cross-section along dip showing the intiation and growth, theaggradation and the decay phases within the Fan 3 lobe complex.
2142 A. Prelat, D. M. Hodgson and S. S. Flint
� 2009 The Authors. Journal compilation � 2009 International Association of Sedimentologists, Sedimentology, 56, 2132–2154
12 km in width (Fig. 11). With a maximumthickness recorded of 10 m, lobe 2 represents anapproximate volume of 2Æ2 km3. Interlobe C thinsand fines down-dip towards the north fromalmost 2 m in the south-east of Gemsbok Riverto less than 0Æ5 m in the north of the Grootfonteinarea.
Lobe 2 is dominantly thick-bedded sandstonelithofacies, with more stratified units locallywhere faint parallel laminations are observed. Inthe south-east outcrops of the Gemsbok Riverarea, close to the pinchout, lobe 2 sandstonescontain more mud clasts and plant fragments.Furthermore, in the Grootfontein area, where lobe2 has an additional thickness of 8 m withoutbasal erosion, most of the beds are bipartite with alower clean sand division and an upper dirtychaotic division rich in plant fragments, inter-preted as turbidites with ‘linked’ debrites(Hodgson 2009).
Lobe 3
Lobe 3 has a maximum recorded thickness of 3 mand is identified as a separate lobe based on thethickness and lithofacies of the thin-bedded andfine-grained bounding units (Fig. 8). This lobepinches out in the Gemsbok River area but aprecise pinchout point is difficult to identifybecause the few beds of lobe 3 thin and fine untilthey interfinger with thin-bedded siltstone inter-lobes C and D. The down-dip pinchout of lobe 3,within the north Grootfontein area, is betterconstrained. Where lobe 3 is thicker, the bound-ing interlobe units below and above are thinner.Lobe 3 is characterized by a single amalgamatedunit along the northern outcrops that breaks upinto a package of thin-bedded to medium-beddedsandstones along the southern outcrops. Thestratification and thinning of the beds south-eastward is gradual.
Lobe 4
Lobe 4 crops out over the whole field area and nopinchout points are observed. The thickest part oflobe 4 is located in the northern part of Groot-fontein, down-dip of the distal pinchout of lobe 3.The thinnest outcrops of lobe 4 are located indown-dip areas (Klipfontein) as well as up-dipareas (Gemsbok River).
Lobe 4 displays sedimentary characteristicsthat remain unchanged for long distances overthe study area. Commonly, it includes a lowerpart with structureless thick-bedded sandstone
and an upper, more stratified part that containsmore tractional sedimentary structures (e.g. par-allel laminations). Only in the south-east of theGemsbok River area is lobe 4 thickly beddedthroughout. Interlobe E, deposited between lobes4 and 5, forms a distinctive package of thin-bedded, ripple-laminated, very fine-grainedsandstones and siltstones that was used as animportant marker unit. This unit is 0Æ7 m thickbut can be thinner because of erosion at the baseof the overlying lobe.
Lobe 5
Along the southern flank of the outcrops, thick-ness data show three discrete areas where lobe 5is particularly thick, reaching 10 m in places.This thickening is due to basal erosion. Lobe 5cuts out interlobe E completely, as well as part oflobe 4 below, which results in local lobe-on-lobeamalgamation (Fig. 9C). The erosion surfaceshave high aspect ratios, being about 2 m deepand a few hundred metres wide. With a maxi-mum recorded thickness of 12 m, an estimatedlength of 30 km and a width of 17Æ5 km, thevolume of lobe 5 is around 3Æ5 km3 and this is thelargest lobe of the Fan 3 lobe complex. InterlobeF, deposited between lobe 5 and lobe 6, consistsmainly of thin (<0Æ03 m) siltstone beds with arelatively constant thickness of 1Æ15 m. In theeastern part of the field area, lobe 5 is thinnerbecause of erosion by the overlying lobe 6.
Along-strike in the Gemsbok River area, lobe 5changes characteristics and thickness graduallyfrom the east, where it is represented by one lobeelement, consisting of thick beds of structurelesssandstone. To the west the lobe thickens slightlyand becomes better stratified. Moreover, a break ispresent in the middle of lobe 5, represented by upto 0Æ05 m of siltstone that weathers recessively.This break can be walked out across the westernpart of the Gemsbok River area and the wholeGrootfontein area but not within the Klipfonteinarea. Using an alternative hierarchical division itcould be argued that lobe 5 represents twodistinct lobes and that only one of them reachesthe down-dip location of Klipfontein. Interlobe Fconsists of a package of centimetre-scale siltstonebeds, containing parallel and ripple laminations.
Lobe 6
Lobe 6, the youngest lobe in the study area,pinches out completely to the west within theoutcrop area (Fig. 10); this helps to document the
Evolution, architecture and hierarchy of deep-water lobes 2143
� 2009 The Authors. Journal compilation � 2009 International Association of Sedimentologists, Sedimentology, 56, 2132–2154
rate and style of lobe pinchout of the youngestlobes in the lobe complex. Along-strike, thethinning rate is 2 m km)1 (a depositional slopeof 0Æ114�, assuming a horizontal base). Thewestern fringe of lobe 6 appears as a smooth linein map view with a direction of N165E (Fig. 10).The area of deposition of lobe 6 is estimated to be29Æ5 km in length and 12 km in width (Fig. 11).With a maximum thickness of 7Æ2 m, lobe 6 has anapproximate volume of 1Æ3 km3.
Lobe 6 changes lithofacies along-strike, fromthe east of the Gemsbok area, where the base iserosive, to a lateral pinchout westward. In theeast of Gemsbok River, lobe 6 is thick-bedded andconsists mainly of structureless sandstone. Goingwest, the lobe becomes better stratified and threelobe elements can be distinguished. With thin-ning, beds contain more sedimentary structures,including parallel (Tb) and ripple (Tc) lamination.
The top surface of lobe 6 represents the litho-logical top of Fan 3 in the study area. Thesiltstone package deposited on top of lobe 6weathers recessively and typically is poorlyexposed. The stratigraphic top of Fan 3 is markedby the onset of hemipelagic shale depositionabove the siltstone (Hodgson et al., 2006).
Lateral lithofacies changes
Four lobe sub-environments were identified inthis study based primarily on degree of amalgam-ation and presence of associated lithofacies: axis,off-axis, fringe and distal fringe (Fig. 1). Axissettings are represented by amalgamated sand-stone units (>80% sandstone). Off-axis settingscomprise stratified medium-bedded lithofacieswith Ta, Tab and local Tc divisions and someamalgamation (60% to 80% sandstone). Fringesettings are represented by medium-bedded tothin-bedded successions of ripple-laminated and/or bipartite (lower turbidite with a linked debrite)
beds (40% to 60% sandstone). Distal fringesettings are represented by successions of thin-bedded and very fine-grained sandstone andsiltstone units that are commonly graded andripple laminated (<40% sandstone). The highpercentage of sandstone is maintained from theaxis most of the way to the lateral fringe and thendrops off sharply. Lobe sub-environments passtransitionally from one setting to another overtens of metres.
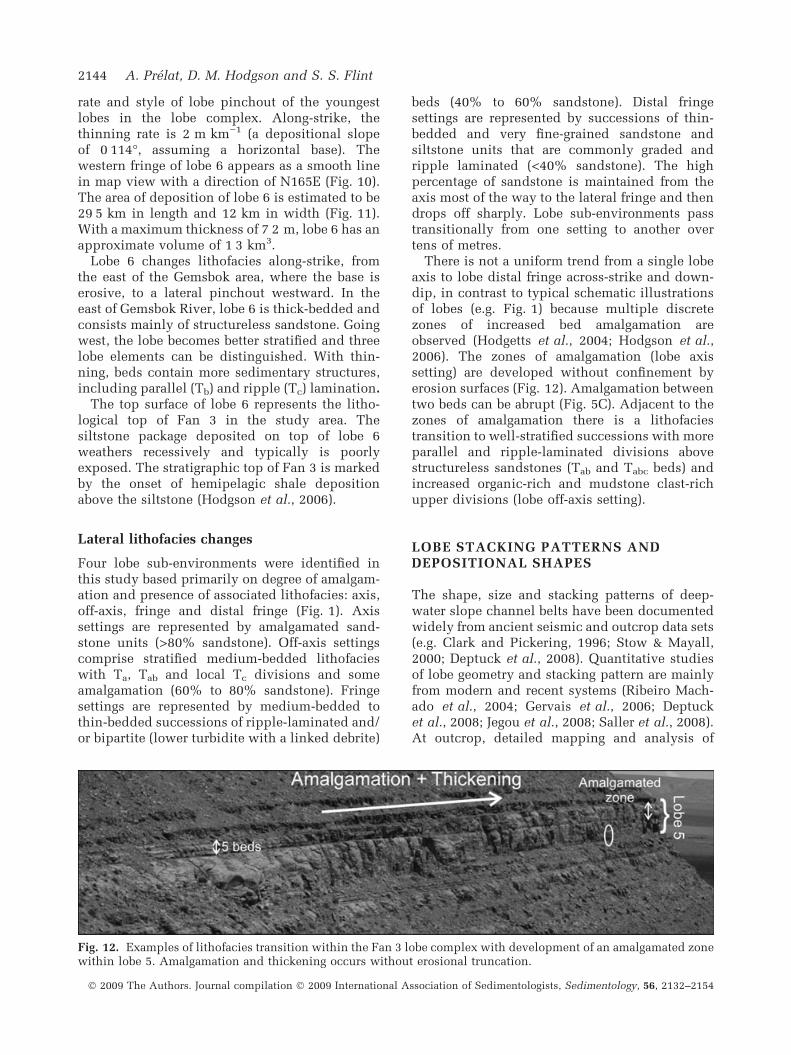
There is not a uniform trend from a single lobeaxis to lobe distal fringe across-strike and down-dip, in contrast to typical schematic illustrationsof lobes (e.g. Fig. 1) because multiple discretezones of increased bed amalgamation areobserved (Hodgetts et al., 2004; Hodgson et al.,2006). The zones of amalgamation (lobe axissetting) are developed without confinement byerosion surfaces (Fig. 12). Amalgamation betweentwo beds can be abrupt (Fig. 5C). Adjacent to thezones of amalgamation there is a lithofaciestransition to well-stratified successions with moreparallel and ripple-laminated divisions abovestructureless sandstones (Tab and Tabc beds) andincreased organic-rich and mudstone clast-richupper divisions (lobe off-axis setting).
LOBE STACKING PATTERNS ANDDEPOSITIONAL SHAPES
The shape, size and stacking patterns of deep-water slope channel belts have been documentedwidely from ancient seismic and outcrop data sets(e.g. Clark and Pickering, 1996; Stow & Mayall,2000; Deptuck et al., 2008). Quantitative studiesof lobe geometry and stacking pattern are mainlyfrom modern and recent systems (Ribeiro Mach-ado et al., 2004; Gervais et al., 2006; Deptucket al., 2008; Jegou et al., 2008; Saller et al., 2008).At outcrop, detailed mapping and analysis of
Fig. 12. Examples of lithofacies transition within the Fan 3 lobe complex with development of an amalgamated zonewithin lobe 5. Amalgamation and thickening occurs without erosional truncation.
2144 A. Prelat, D. M. Hodgson and S. S. Flint
� 2009 The Authors. Journal compilation � 2009 International Association of Sedimentologists, Sedimentology, 56, 2132–2154
thickness patterns is required to document theshape and stacking pattern of distributive archi-tectural elements.
Mapping of individual lobes is possible over15 km down-dip and 8 km across-strike. Even so,documenting the dimensions of an entire lobe isnot possible as they are larger than the constraintsafforded by the outcrop. Therefore, the lobedimensions presented are estimates assumingrates of thinning and using palaeocurrent pat-terns and should be considered as minimumdimensions (Fig. 11). The position of a lobecentroid (the volumetric centre of a lobe) is alsoestimated. Nevertheless, the outcrop constraintsindicate that the lobes are elongate in a down-dipdirection with dimensions of several kilometresin length and width. Isopach maps, generatedfrom logged thicknesses of lobes, show a specificvolume, position and shape for each lobe withinthe field area (Fig. 11).
Lobe-scale compensational stacking
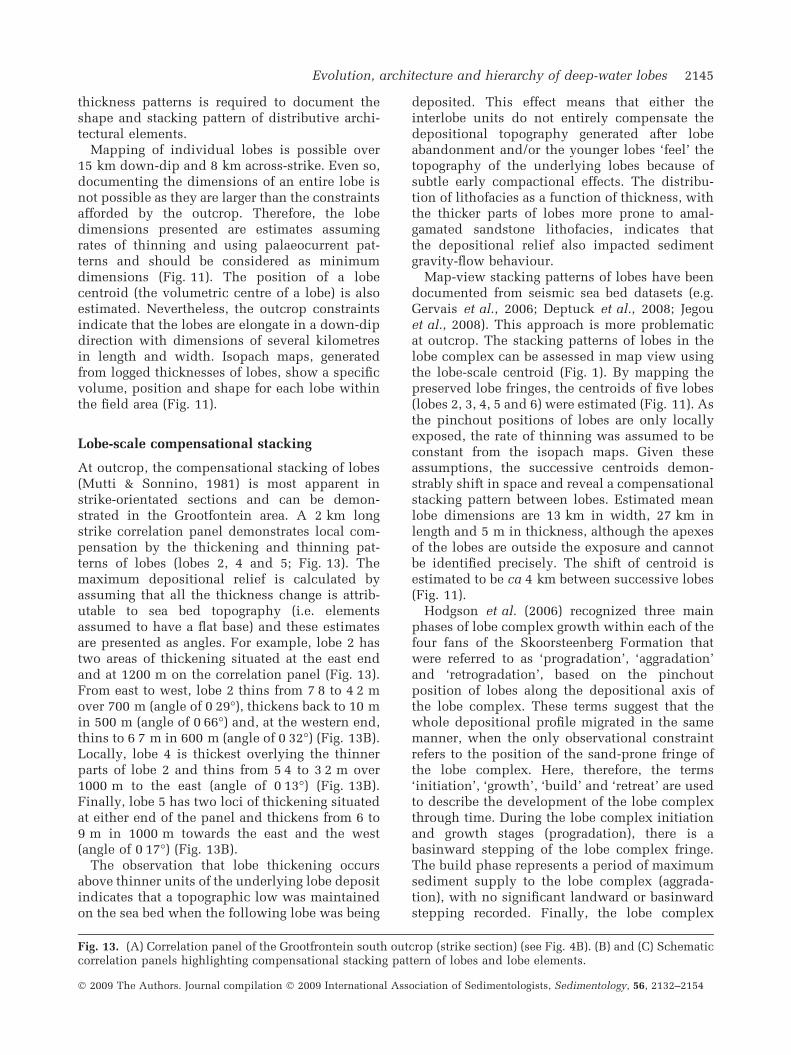
At outcrop, the compensational stacking of lobes(Mutti & Sonnino, 1981) is most apparent instrike-orientated sections and can be demon-strated in the Grootfontein area. A 2 km longstrike correlation panel demonstrates local com-pensation by the thickening and thinning pat-terns of lobes (lobes 2, 4 and 5; Fig. 13). Themaximum depositional relief is calculated byassuming that all the thickness change is attrib-utable to sea bed topography (i.e. elementsassumed to have a flat base) and these estimatesare presented as angles. For example, lobe 2 hastwo areas of thickening situated at the east endand at 1200 m on the correlation panel (Fig. 13).From east to west, lobe 2 thins from 7Æ8 to 4Æ2 mover 700 m (angle of 0Æ29�), thickens back to 10 min 500 m (angle of 0Æ66�) and, at the western end,thins to 6Æ7 m in 600 m (angle of 0Æ32�) (Fig. 13B).Locally, lobe 4 is thickest overlying the thinnerparts of lobe 2 and thins from 5Æ4 to 3Æ2 m over1000 m to the east (angle of 0Æ13�) (Fig. 13B).Finally, lobe 5 has two loci of thickening situatedat either end of the panel and thickens from 6 to9 m in 1000 m towards the east and the west(angle of 0Æ17�) (Fig. 13B).
The observation that lobe thickening occursabove thinner units of the underlying lobe depositindicates that a topographic low was maintainedon the sea bed when the following lobe was being
deposited. This effect means that either theinterlobe units do not entirely compensate thedepositional topography generated after lobeabandonment and/or the younger lobes ‘feel’ thetopography of the underlying lobes because ofsubtle early compactional effects. The distribu-tion of lithofacies as a function of thickness, withthe thicker parts of lobes more prone to amal-gamated sandstone lithofacies, indicates thatthe depositional relief also impacted sedimentgravity-flow behaviour.
Map-view stacking patterns of lobes have beendocumented from seismic sea bed datasets (e.g.Gervais et al., 2006; Deptuck et al., 2008; Jegouet al., 2008). This approach is more problematicat outcrop. The stacking patterns of lobes in thelobe complex can be assessed in map view usingthe lobe-scale centroid (Fig. 1). By mapping thepreserved lobe fringes, the centroids of five lobes(lobes 2, 3, 4, 5 and 6) were estimated (Fig. 11). Asthe pinchout positions of lobes are only locallyexposed, the rate of thinning was assumed to beconstant from the isopach maps. Given theseassumptions, the successive centroids demon-strably shift in space and reveal a compensationalstacking pattern between lobes. Estimated meanlobe dimensions are 13 km in width, 27 km inlength and 5 m in thickness, although the apexesof the lobes are outside the exposure and cannotbe identified precisely. The shift of centroid isestimated to be ca 4 km between successive lobes(Fig. 11).
Hodgson et al. (2006) recognized three mainphases of lobe complex growth within each of thefour fans of the Skoorsteenberg Formation thatwere referred to as ‘progradation’, ‘aggradation’and ‘retrogradation’, based on the pinchoutposition of lobes along the depositional axis ofthe lobe complex. These terms suggest that thewhole depositional profile migrated in the samemanner, when the only observational constraintrefers to the position of the sand-prone fringe ofthe lobe complex. Here, therefore, the terms‘initiation’, ‘growth’, ‘build’ and ‘retreat’ are usedto describe the development of the lobe complexthrough time. During the lobe complex initiationand growth stages (progradation), there is abasinward stepping of the lobe complex fringe.The build phase represents a period of maximumsediment supply to the lobe complex (aggrada-tion), with no significant landward or basinwardstepping recorded. Finally, the lobe complex
Fig. 13. (A) Correlation panel of the Grootfrontein south outcrop (strike section) (see Fig. 4B). (B) and (C) Schematiccorrelation panels highlighting compensational stacking pattern of lobes and lobe elements.
Evolution, architecture and hierarchy of deep-water lobes 2145
� 2009 The Authors. Journal compilation � 2009 International Association of Sedimentologists, Sedimentology, 56, 2132–2154
retreats before abandonment (retrogradation) andshows a significant landward shift of the lobecomplex fringe.
The three phases of lobe complex develop-ment are documented within the deposits of theFan 3 lobe complex (Fig. 11C). Lobes 1 and 2show basinward stepping to the north. Thesetwo lobes are therefore interpreted as being partof the growth phase. Lobes 4 and 5 record thebuild phase. The volume of those two lobes isgreater than those of the previous and subse-quent lobes and represents a maximum supplyof sediment. Finally, lobe 6 records the land-ward stepping phase and represents the retreatphase prior to abandonment of the lobe com-plex (Fig. 11C). This study has identified anadditional and important lateral-stepping com-ponent through estimates of the lobe centroidposition, with an overall shift from west to eastthroughout the deposition of the six lobes(Fig. 11B). This observation indicates the impor-tance of recording the lateral stepping of lobeaxes through time and not just transects throughthe axis of the lobe complex, when identifyingthe phases of growth on lobe complex develop-ment and stacking patterns.
Lobe element-scale compensational stacking
A similar stacking pattern has been identified atthe smaller scale of lobe elements. This pattern isparticularly striking within lobe 5 on the along-strike correlation panel of Grootfontein(Fig. 13C). A total of five distinct lobe elementshave been walked out along the outcrop repre-sented on this panel. The first lobe elementsdeposited are thicker in the east and the thickestpart of each lobe element steps to the west duringdeposition of the younger lobe elements.
Lobe shapes and pinchout styles
Detailed mapping of lobe fringes and changes inlobe thickness indicate that there are differentstyles of lobe fringe pinchout and thereforedifferent planform shapes. Mapping the down-dip pinchout of lobe 2 to the north, where it is thebasal lobe, reveals a complicated finger-likegeometry. In one section, lobe 2 thins from 3 min the west to 0Æ1 m and then thickens back to 3 mmoving east, along-strike. Up-dip (500 m to thesouth-west), lobe 2 doubles in thickness to 14 m.The cross-sectional geometry of this feature atoutcrop is channel-form (base thickening). Thispinchout pattern of lobe 2 has a multiple finger-
like expression. A similar pattern has been iden-tified in basal lobes in Fan 3 in the Klipfonteinarea (lobe 4, this study), Fan 2 (Rozman, 2000)and Fan 4 (Bouma & Rozman, 2000). This finger-like pinchout pattern is evident particularly inbasal lobes and indicates that the map view shapeof lobes is not as smooth and dominated by radialchanges as previously envisaged but can be muchmore irregular across-strike. Nelson et al. (1992)and Twichell et al. (1992) describe distal reachesof a depositional lobe of the Mississippi Fan as‘dentritic’. Map views of the individual lobes ofthe Mississippi Fan are comparable with thereconstructed map views of Tanqua Fan 3 forthe present study in terms of these distal termi-nations and their geometries. In contrast, thelateral fringe of lobe 6 is smooth and is parallel tothe direction of thinning of the lobe (Figs 10 and11). Away from its western fringe, lobe 6 thickensconsistently at 2 m km)1.
Van der Werff & Johnson (2003) referred to thefingers (in Fan 3) as ‘pinchout channels’, imply-ing their formation through erosional processes.The lateral changes in thickness cannot beexplained by basal erosion as underlying markerbeds are not truncated and do not changethickness or lithofacies, indicating that the plan-form shape is attributed to the depositionalprocess.
The control on the finger-like pattern identifiedmay be due to a pre-existing topographic tem-plate. This relief would need to be generatedduring a discrete time interval after initiation ofthe lobe complex (the underlying marker beds arepart of the lobe complex) but before lobe 2 wasactive in the Grootfontein area and before lobe 4was active in the Klipfontein area. There is noevidence of tectonic or diapiric mechanisms thatcould generate the radial finger-like topography.
An alternative mechanism which could pro-duce the finger-like patterns is that the mostdistal flows were elongate and deposited finger-like bed shapes. Commonly, the deposits inthese fingers are bipartite beds with clean lowerdivisions and mud-prone clast-rich and organic-rich upper divisions that are interpreted asturbidites with ‘linked’ debrites (Hodgson 2009;sensu Haughton et al., 2003), which supports animportant flow process control (concentrationand cohesiveness of the flows) on the mappinchout pattern of lobes, and may be subtlydifferent between growth and retreat phases.
An additional control on the pinchout geometrymight be the substrate cohesiveness that the(elongate) flows of each lobe deposited onto. That
2146 A. Prelat, D. M. Hodgson and S. S. Flint
� 2009 The Authors. Journal compilation � 2009 International Association of Sedimentologists, Sedimentology, 56, 2132–2154
the fingers of basal lobes (e.g. lobe 2 in Groot-fontein or lobe 4 in Klipfontein) comprise severalbeds suggests that the initial deposits duringbasinward stepping of the lobe complex loadedinto the mud-prone substrate and this set up thesubtle topography for the next flow to follow.Younger lobes active during the landward back-stepping of lobe complex fringe (e.g. lobe 6) pinchout over a sand-prone substrate and contain fewerbipartite beds (Hodgson 2009), which could pro-mote a smoother pinchout fringe.
Assessment of statistics
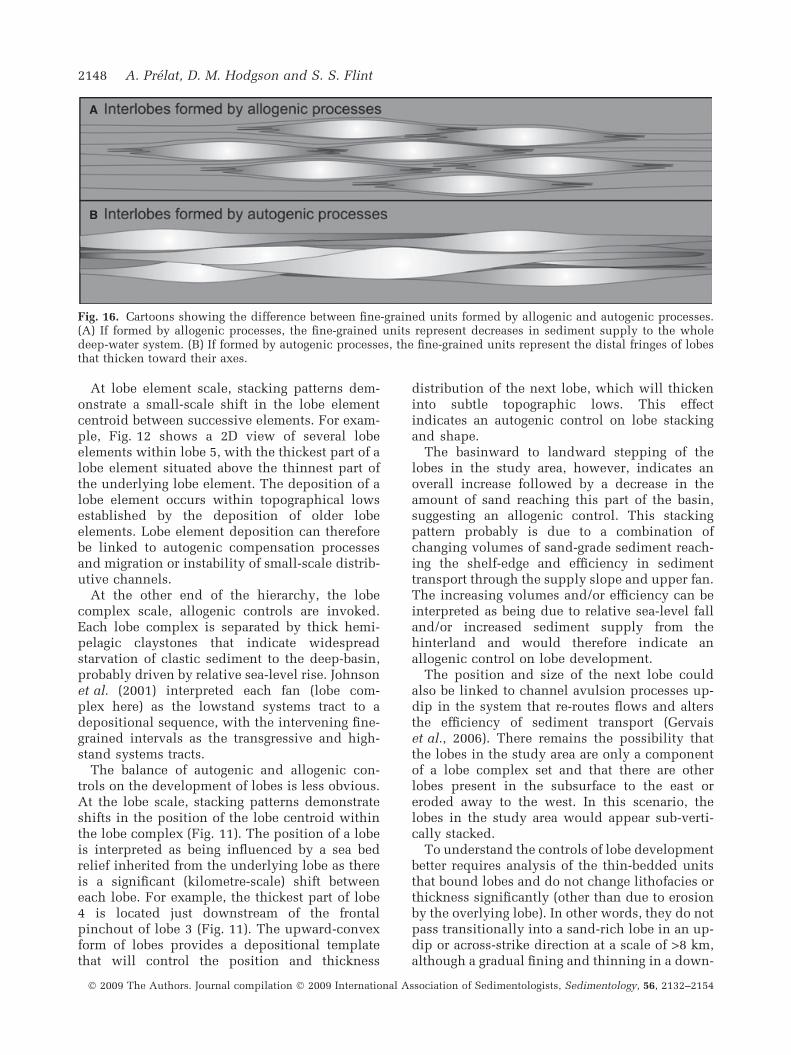
It is important to note that, although lengths andwidths have been adjusted to palaeoflow, workingat outcrop means it is unlikely that the measuredwidths and lengths represent the in situ dimen-sions of any single lobe element (Fig. 14). How-ever, the present-day geomorphology of the studyarea allows some constraints to be placed on thedimensions of the architectural elements, allow-ing important observations to still be made.
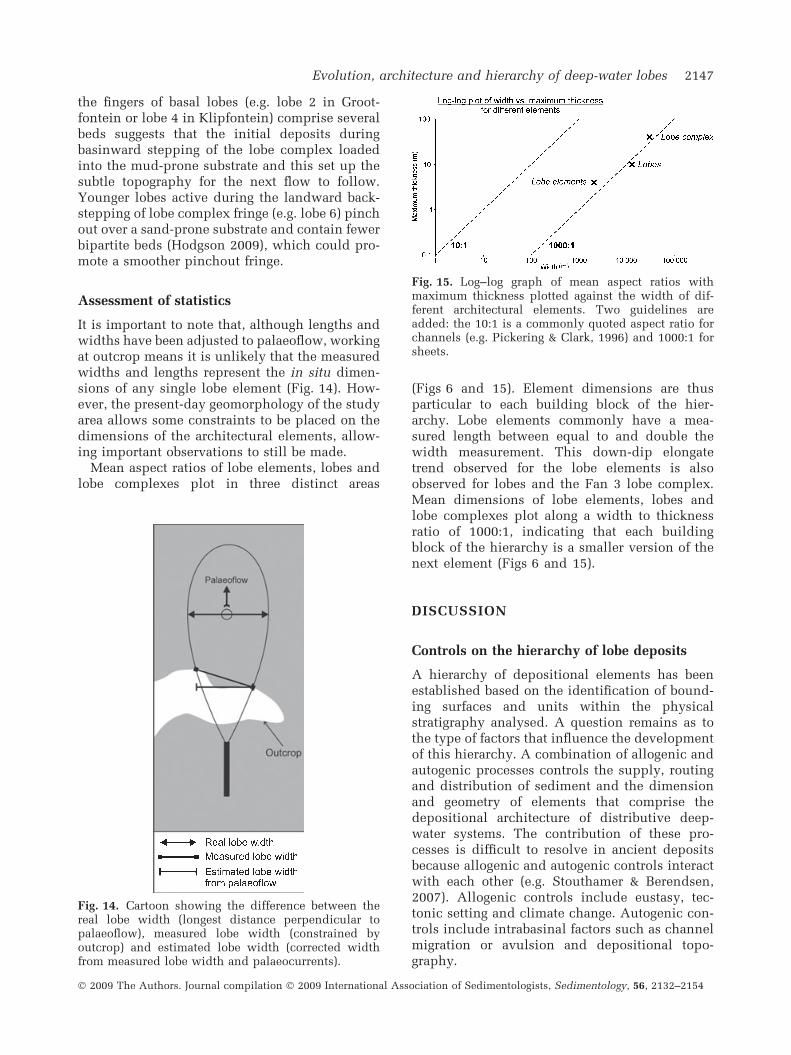
Mean aspect ratios of lobe elements, lobes andlobe complexes plot in three distinct areas
(Figs 6 and 15). Element dimensions are thusparticular to each building block of the hier-archy. Lobe elements commonly have a mea-sured length between equal to and double thewidth measurement. This down-dip elongatetrend observed for the lobe elements is alsoobserved for lobes and the Fan 3 lobe complex.Mean dimensions of lobe elements, lobes andlobe complexes plot along a width to thicknessratio of 1000:1, indicating that each buildingblock of the hierarchy is a smaller version of thenext element (Figs 6 and 15).
DISCUSSION
Controls on the hierarchy of lobe deposits
A hierarchy of depositional elements has beenestablished based on the identification of bound-ing surfaces and units within the physicalstratigraphy analysed. A question remains as tothe type of factors that influence the developmentof this hierarchy. A combination of allogenic andautogenic processes controls the supply, routingand distribution of sediment and the dimensionand geometry of elements that comprise thedepositional architecture of distributive deep-water systems. The contribution of these pro-cesses is difficult to resolve in ancient depositsbecause allogenic and autogenic controls interactwith each other (e.g. Stouthamer & Berendsen,2007). Allogenic controls include eustasy, tec-tonic setting and climate change. Autogenic con-trols include intrabasinal factors such as channelmigration or avulsion and depositional topo-graphy.
Fig. 15. Log–log graph of mean aspect ratios withmaximum thickness plotted against the width of dif-ferent architectural elements. Two guidelines areadded: the 10:1 is a commonly quoted aspect ratio forchannels (e.g. Pickering & Clark, 1996) and 1000:1 forsheets.
Fig. 14. Cartoon showing the difference between thereal lobe width (longest distance perpendicular topalaeoflow), measured lobe width (constrained byoutcrop) and estimated lobe width (corrected widthfrom measured lobe width and palaeocurrents).
Evolution, architecture and hierarchy of deep-water lobes 2147
� 2009 The Authors. Journal compilation � 2009 International Association of Sedimentologists, Sedimentology, 56, 2132–2154
At lobe element scale, stacking patterns dem-onstrate a small-scale shift in the lobe elementcentroid between successive elements. For exam-ple, Fig. 12 shows a 2D view of several lobeelements within lobe 5, with the thickest part of alobe element situated above the thinnest part ofthe underlying lobe element. The deposition of alobe element occurs within topographical lowsestablished by the deposition of older lobeelements. Lobe element deposition can thereforebe linked to autogenic compensation processesand migration or instability of small-scale distrib-utive channels.
At the other end of the hierarchy, the lobecomplex scale, allogenic controls are invoked.Each lobe complex is separated by thick hemi-pelagic claystones that indicate widespreadstarvation of clastic sediment to the deep-basin,probably driven by relative sea-level rise. Johnsonet al. (2001) interpreted each fan (lobe com-plex here) as the lowstand systems tract to adepositional sequence, with the intervening fine-grained intervals as the transgressive and high-stand systems tracts.
The balance of autogenic and allogenic con-trols on the development of lobes is less obvious.At the lobe scale, stacking patterns demonstrateshifts in the position of the lobe centroid withinthe lobe complex (Fig. 11). The position of a lobeis interpreted as being influenced by a sea bedrelief inherited from the underlying lobe as thereis a significant (kilometre-scale) shift betweeneach lobe. For example, the thickest part of lobe4 is located just downstream of the frontalpinchout of lobe 3 (Fig. 11). The upward-convexform of lobes provides a depositional templatethat will control the position and thickness
distribution of the next lobe, which will thickeninto subtle topographic lows. This effectindicates an autogenic control on lobe stackingand shape.
The basinward to landward stepping of thelobes in the study area, however, indicates anoverall increase followed by a decrease in theamount of sand reaching this part of the basin,suggesting an allogenic control. This stackingpattern probably is due to a combination ofchanging volumes of sand-grade sediment reach-ing the shelf-edge and efficiency in sedimenttransport through the supply slope and upper fan.The increasing volumes and/or efficiency can beinterpreted as being due to relative sea-level falland/or increased sediment supply from thehinterland and would therefore indicate anallogenic control on lobe development.
The position and size of the next lobe couldalso be linked to channel avulsion processes up-dip in the system that re-routes flows and altersthe efficiency of sediment transport (Gervaiset al., 2006). There remains the possibility thatthe lobes in the study area are only a componentof a lobe complex set and that there are otherlobes present in the subsurface to the east oreroded away to the west. In this scenario, thelobes in the study area would appear sub-verti-cally stacked.
To understand the controls of lobe developmentbetter requires analysis of the thin-bedded unitsthat bound lobes and do not change lithofacies orthickness significantly (other than due to erosionby the overlying lobe). In other words, they do notpass transitionally into a sand-rich lobe in an up-dip or across-strike direction at a scale of >8 km,although a gradual fining and thinning in a down-
Fig. 16. Cartoons showing the difference between fine-grained units formed by allogenic and autogenic processes.(A) If formed by allogenic processes, the fine-grained units represent decreases in sediment supply to the wholedeep-water system. (B) If formed by autogenic processes, the fine-grained units represent the distal fringes of lobesthat thicken toward their axes.
2148 A. Prelat, D. M. Hodgson and S. S. Flint
� 2009 The Authors. Journal compilation � 2009 International Association of Sedimentologists, Sedimentology, 56, 2132–2154
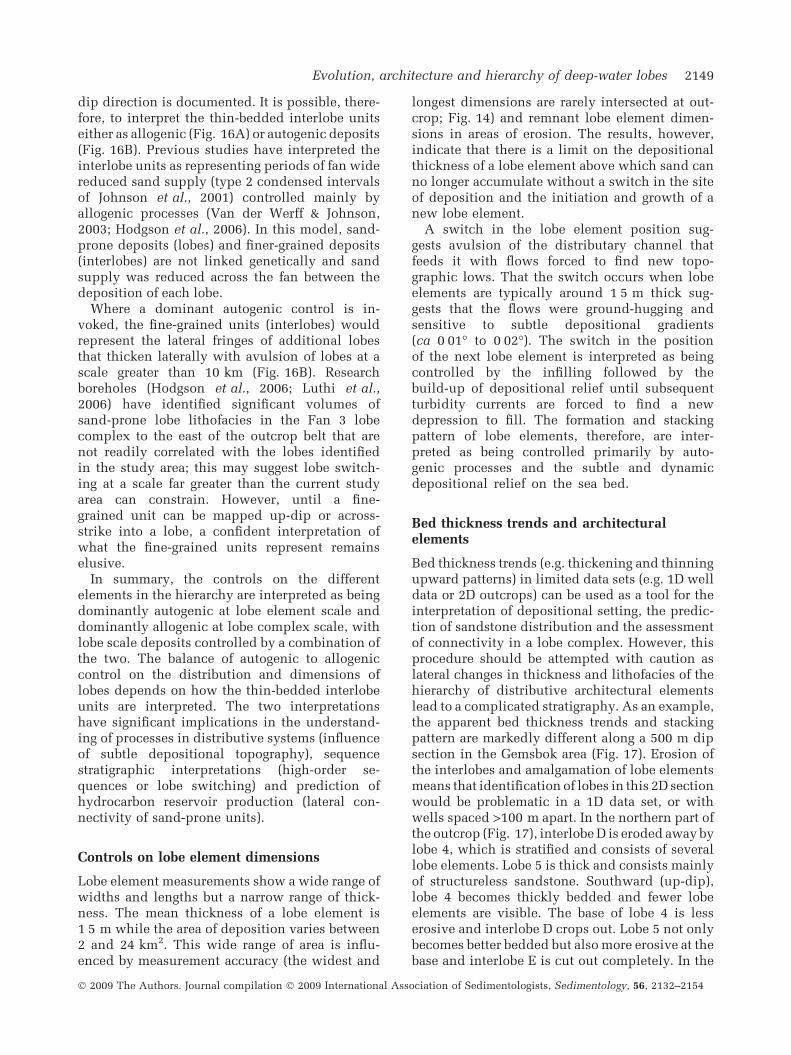
dip direction is documented. It is possible, there-fore, to interpret the thin-bedded interlobe unitseither as allogenic (Fig. 16A) or autogenic deposits(Fig. 16B). Previous studies have interpreted theinterlobe units as representing periods of fan widereduced sand supply (type 2 condensed intervalsof Johnson et al., 2001) controlled mainly byallogenic processes (Van der Werff & Johnson,2003; Hodgson et al., 2006). In this model, sand-prone deposits (lobes) and finer-grained deposits(interlobes) are not linked genetically and sandsupply was reduced across the fan between thedeposition of each lobe.
Where a dominant autogenic control is in-voked, the fine-grained units (interlobes) wouldrepresent the lateral fringes of additional lobesthat thicken laterally with avulsion of lobes at ascale greater than 10 km (Fig. 16B). Researchboreholes (Hodgson et al., 2006; Luthi et al.,2006) have identified significant volumes ofsand-prone lobe lithofacies in the Fan 3 lobecomplex to the east of the outcrop belt that arenot readily correlated with the lobes identifiedin the study area; this may suggest lobe switch-ing at a scale far greater than the current studyarea can constrain. However, until a fine-grained unit can be mapped up-dip or across-strike into a lobe, a confident interpretation ofwhat the fine-grained units represent remainselusive.
In summary, the controls on the differentelements in the hierarchy are interpreted as beingdominantly autogenic at lobe element scale anddominantly allogenic at lobe complex scale, withlobe scale deposits controlled by a combination ofthe two. The balance of autogenic to allogeniccontrol on the distribution and dimensions oflobes depends on how the thin-bedded interlobeunits are interpreted. The two interpretationshave significant implications in the understand-ing of processes in distributive systems (influenceof subtle depositional topography), sequencestratigraphic interpretations (high-order se-quences or lobe switching) and prediction ofhydrocarbon reservoir production (lateral con-nectivity of sand-prone units).
Controls on lobe element dimensions
Lobe element measurements show a wide range ofwidths and lengths but a narrow range of thick-ness. The mean thickness of a lobe element is1Æ5 m while the area of deposition varies between2 and 24 km2. This wide range of area is influ-enced by measurement accuracy (the widest and
longest dimensions are rarely intersected at out-crop; Fig. 14) and remnant lobe element dimen-sions in areas of erosion. The results, however,indicate that there is a limit on the depositionalthickness of a lobe element above which sand canno longer accumulate without a switch in the siteof deposition and the initiation and growth of anew lobe element.
A switch in the lobe element position sug-gests avulsion of the distributary channel thatfeeds it with flows forced to find new topo-graphic lows. That the switch occurs when lobeelements are typically around 1Æ5 m thick sug-gests that the flows were ground-hugging andsensitive to subtle depositional gradients(ca 0Æ01� to 0Æ02�). The switch in the positionof the next lobe element is interpreted as beingcontrolled by the infilling followed by thebuild-up of depositional relief until subsequentturbidity currents are forced to find a newdepression to fill. The formation and stackingpattern of lobe elements, therefore, are inter-preted as being controlled primarily by auto-genic processes and the subtle and dynamicdepositional relief on the sea bed.
Bed thickness trends and architecturalelements
Bed thickness trends (e.g. thickening and thinningupward patterns) in limited data sets (e.g. 1D welldata or 2D outcrops) can be used as a tool for theinterpretation of depositional setting, the predic-tion of sandstone distribution and the assessmentof connectivity in a lobe complex. However, thisprocedure should be attempted with caution aslateral changes in thickness and lithofacies of thehierarchy of distributive architectural elementslead to a complicated stratigraphy. As an example,the apparent bed thickness trends and stackingpattern are markedly different along a 500 m dipsection in the Gemsbok area (Fig. 17). Erosion ofthe interlobes and amalgamation of lobe elementsmeans that identification of lobes in this 2D sectionwould be problematic in a 1D data set, or withwells spaced >100 m apart. In the northern part ofthe outcrop (Fig. 17), interlobe D is eroded away bylobe 4, which is stratified and consists of severallobe elements. Lobe 5 is thick and consists mainlyof structureless sandstone. Southward (up-dip),lobe 4 becomes thickly bedded and fewer lobeelements are visible. The base of lobe 4 is lesserosive and interlobe D crops out. Lobe 5 not onlybecomes better bedded but also more erosive at thebase and interlobe E is cut out completely. In the
Evolution, architecture and hierarchy of deep-water lobes 2149
� 2009 The Authors. Journal compilation � 2009 International Association of Sedimentologists, Sedimentology, 56, 2132–2154
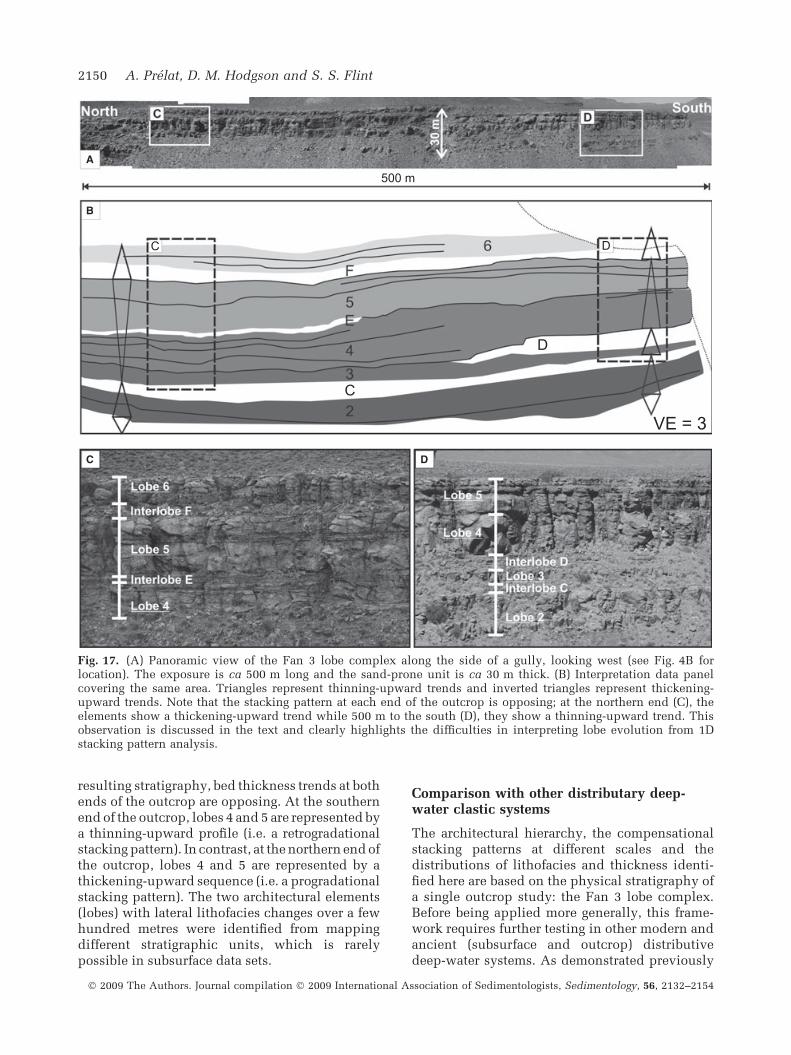
resulting stratigraphy, bed thickness trends at bothends of the outcrop are opposing. At the southernend of the outcrop, lobes 4 and 5 are represented bya thinning-upward profile (i.e. a retrogradationalstacking pattern). In contrast, at the northern end ofthe outcrop, lobes 4 and 5 are represented by athickening-upward sequence (i.e. a progradationalstacking pattern). The two architectural elements(lobes) with lateral lithofacies changes over a fewhundred metres were identified from mappingdifferent stratigraphic units, which is rarelypossible in subsurface data sets.
Comparison with other distributary deep-water clastic systems
The architectural hierarchy, the compensationalstacking patterns at different scales and thedistributions of lithofacies and thickness identi-fied here are based on the physical stratigraphy ofa single outcrop study: the Fan 3 lobe complex.Before being applied more generally, this frame-work requires further testing in other modern andancient (subsurface and outcrop) distributivedeep-water systems. As demonstrated previously
Fig. 17. (A) Panoramic view of the Fan 3 lobe complex along the side of a gully, looking west (see Fig. 4B forlocation). The exposure is ca 500 m long and the sand-prone unit is ca 30 m thick. (B) Interpretation data panelcovering the same area. Triangles represent thinning-upward trends and inverted triangles represent thickening-upward trends. Note that the stacking pattern at each end of the outcrop is opposing; at the northern end (C), theelements show a thickening-upward trend while 500 m to the south (D), they show a thinning-upward trend. Thisobservation is discussed in the text and clearly highlights the difficulties in interpreting lobe evolution from 1Dstacking pattern analysis.
2150 A. Prelat, D. M. Hodgson and S. S. Flint
� 2009 The Authors. Journal compilation � 2009 International Association of Sedimentologists, Sedimentology, 56, 2132–2154
(Mutti & Normark, 1987, 1991; Normark et al.,1993), lobe deposits are highly variable in size.However, because the hierarchy is based onbounding surfaces and units, it could be appliedto any system at outcrop or in subsurface data setswith core and well logs. In every hierarchy, thebuilding blocks show a progressive increase inscale from bed to lobe element to lobe tolobe complex to lobe complex set, with thebasic principle that one or more geneticallyrelated building blocks form the next step of thehierarchy.
The interplay of different parameters, such assea bed topography, grain-size range and shelftransport distances, varies between distributivedeep-water systems and so the stacking patternsand lobe geometries might be expected to differfrom those identified in the Skoorsteenberg For-mation. Interestingly, however, strikingly similardimensions and geometries have been describedfrom a distributive deep-water system usingshallow seismic data in the Pleistocene GoloLobe of the western coast of Corsica, France(Deptuck et al., 2008). Such dimensions andgeometries similarly exist despite significant con-trasts in key parameters. In the offshore Corsicanexample, there is a steep hinterland, a narrowshelf and a steep submarine slope with a widerange of grain-sizes transported and depositedinto a topographically complex setting (Gervaiset al., 2006; Deptuck et al., 2008).
Hierarchies of architectural elements in dis-tributive settings have been identified frommodern data sets using planform size and stack-ing patterns. In a study of the Campos Basinmargin, Ribeiro Machado et al. (2004) identifieda hierarchical classification, namely ‘bulb’, ‘lobe’and ‘fan’, which were interpreted as beingdriven by autogenic processes. These authorsdescribed a lobe as a heterogeneous ellipse of 10by 20 km. Deptuck et al. (2008) redefined thehierarchy of Gervais et al. (2006) into four levelsof bed/bed-set, lobe element, composite lobe andlobe complex for the Golo system of WestCorsica.
The stratigraphic hierarchy and geometrical dataobtained from outcrops in this study are compara-ble with independently derived new data sets fromultra high-resolution seismic/sonar studies ofrecent lobes by other authors (e.g. Deptuck et al.,2008). This comparison increases the genericimportance of the information, although furtherwork is required to assess and test the applicabilityof dimensions and stacking patterns identified toother systems.
Implications for subsurface studies
Mitchum (1985) described mounded seismicexpressionwithinternalbidirectionaldownlappingreflections in a lower fan sub-environment. Three-dimensional seismic reflection, borehole data andside-scan sonar are all used to describe sandbodygeometry. However, it is the integration of differentdata types that permits a comprehensive analysisof the architectural elements.
Establishing a robust architectural hierarchy indeep-water distributive systems aids the interpre-tation of lobe position, the estimation of dimen-sions and the prediction of connectivity awayfrom core and well logs. Care should be takenwhen applying any outcrop-based hierarchyscheme to a different distributary lobe setting withdifferent data constraints. In any 1D or 2D section,an initial lobe hierarchy scheme must be treatedwith caution, as it is only after mapping out thecomposite elements that a confident hierarchy canbe established based on the extent of boundingunits. The interpretation of stacking pattern ofdifferent architectural elements can be employedto identify the relative position of an element in ahierarchy, although the use of the boundingsurfaces/units is a more pragmatic starting point.The thickness of the different architectural ele-ments should also be used with caution, as thiscan be controlled by local accommodation varia-tions, amalgamation and position within deposi-tional system. Down-dip and along-strike, a lobecomplex will thin and eventually be representedby a single lobe which, in turn, will thin andeventually be represented by a single-lobe elementand so on. The application of a hierarchicalscheme based solely on thickness is too simplistic.
Finally, the term ‘sheet’ is widely used in thedescription of deep-water architectural elements.However, the identification of lobe elements thatstack to form lobes which are elongate in a down-slope direction and change lithofacies in a fewhundred metres, indicates that lobes do not com-prise building blocks of simple ‘sheets’. The term‘sheet’ is misleading, particularly in the construc-tion of reservoir models. Subtle but importantlateral lithofacies changes and low-angle element-bounding surfaces form a complicated stratigraphythat should be included in accurate models.
CONCLUSIONS
• Terminal lobe deposits of the Fan 3 lobe complexconsist of architectural elements organized in a
Evolution, architecture and hierarchy of deep-water lobes 2151
� 2009 The Authors. Journal compilation � 2009 International Association of Sedimentologists, Sedimentology, 56, 2132–2154
four-fold hierarchy: bed, lobe element, lobe andlobe complex. The bed is the smallest element andrepresents a single sedimentary event. One or moregenetically related beds stack to form a lobe ele-ment, one or more lobe elements form a lobe andone or more lobes form a lobe complex. Thisscheme emphasizes the importance of the lithofa-cies and extent of interlobe units that bound sand-rich depositional elements.
• A compensational stacking pattern is iden-tified at the scale of lobe elements and lobes.Lobe elements are deposited preferentiallywithin topographic lows that are established bythe deposition of older elements. The lobe ele-ment initially fills in remnant relief and thenbuilds local depositional topography, whicheventually forces an avulsion or migration of achannel. Lobe stacking takes place at the scaleof several kilometres and is documented by aspatial shift of the element centroid throughtime and through cross-sectional thicknesspatterns.
• Lobes are elongate in a downslope direction,commonly with their length ranging from equal totwice their width. The minimum area of deposi-tion extracted for five lobes gives an estimated27 km mean length and a 13 km mean width. Themaximum lobe thickness recorded is 14 m. Esti-mated lobe volumes vary greatly between 0Æ2 and3Æ5 km3.
• Basal frontal lobe fringes that pinchout onto amud-prone substrate are not smooth and radial,rather their pinchout is irregular with multiplefinger-like protrusions in planform geometry.Changes in thickness are abrupt and are perpen-dicular to flow direction. Overlying, youngerlateral lobe fringes that pinchout on a sand-pronesubstrate are smoother and radially oriented. Acombination of substrate cohesiveness and flowprocess is interpreted as controlling this patternof distal lobe termination.
• Lobe elements have a length and width in theorder of a few kilometres. Lateral changes inamalgamation and bed stratification are commonwithin a single lobe element. Therefore, lobes arenot built by ‘sheets’ even though the elementappears sheet-like in two dimensions at the scaleof many outcrops.
• The shape and dimensions of a hierarchy ofarchitectural elements that stack to build the Fan3 lobe complex can be applied to other systems.The results could support interpretations ofstratigraphic successions in less well-exposedsuccessions and help predict sand distributionand connectivity in subsurface settings.
ACKNOWLEDGEMENTS
The authors are grateful to the LOBE projectsponsors (Chevron, Maersk, Petrobras, PetroSA,StatoilHydro and Total) for their financial supportof a PhD studentship to the first author. We alsoacknowledge landowners in the Tanqua area foraccess to land. Laura McAllister, Emily Parrot andJohn P. Kavanagh are thanked for field assistance.Many thanks are due to Sedimentology reviewersB. Romans and R. Hesse whose points clarified andgreatly improved the manuscript.
REFERENCES
Adeogba, A.A., McHargue, T.R. and Graham, S.A. (2005)
Transient fan architecture and depositional controls from
near-surface 3-D seismic data, Niger Delta continental slope.
AAPG Bull., 89, 627–643.
Allen, J.R.L. (1966) On bedforms and palaeocurrents. Sedi-
mentology, 6, 153–190.
Beaubouef, R.T., Rossen, C., Zelt, F.B., Sullivan, M.D., Moh-rig, D.C. and Jennette, D.C. (1999) Deep-water sandstones,
Brushy Canyon Formation, West Texas. Field Guide for
AAPG Hedberg Field Research Conference. AAPG Con-
tinuing Education Course Note Series #40, Tulsa, OK, 99 p.
Bouma, A.H. and Rozman, D.J. (2000) Characteristics of fine-
grained outer fan fringe turbidite systems. In: Fine-grainedTurbidite Systems (Eds A.H. Bouma and C.G. Stone), AAPG
Mem. 72/SEPM Spec. Publ., 68, 291–298.
Bouma, A.H. and Wickens, H.d.V. (1991) Permian passive
margin submarine fan complex, Karoo Basin, South Africa:
possible model to Gulf of Mexico. Trans Gulf Coast Assoc.
Geol. Soc., 41, 30–42.
Brookfield, M.E. (1977) The origin of bounding surfaces
in ancient aeolian sandstones. Sedimentology, 24, 303–
332.
Carr, M. and Gardner, M.H. (2000) Portrait of a basin-floor fan
for sandy deepwater systems, Permian Lower Brushy Can-
yon Formation, West Texas. In: Fine-Grained Turbidite
Systems (Eds A.H. Bouma and C.G. Stone), AAPG Mem. 72/
SEPM Spec. Publ. 68, 215–232.
Chapin, M.A., Davies, P., Gibson, J.L. and Pettingill, H.S.(1994) Reservoir architecture of turbidite sheet sandstones
in laterally extensive outcrops, Ross Formation, Western
Ireland. In: Submarine Fans and Turbidite Systems: Gulf
Coast Section SEPM Foundation 15th Annual ResearchConference (Eds P. Weimer, A.H. Bouma and B.F. Perkins),
pp. 53–68.
Clark, J.D. and Pickering, K.T. (1996) Architectural elements
and growth patterns of submarine channels: application to
hydrocarbon exploration. AAPG Bulletin. 80, 194–221.
De Wit, M.J. and Ransome, I.G.D. (1992) Regional inversion
tectonics along the southern margin of Gondwana. In:
Inversion Tectonics of the Cape Fold Belt, Karoo and Cre-
taceous Basins of Southern Africa (Eds M.J. De Wit and
I.G.D. Ransome), pp. 15–21. Balkema, Rotterdam.
Deptuck, M.E., Piper, D.J.W., Savoye, B. and Gervais, A.(2008) Dimensions and architecture of late Pleistocene
submarine lobes off the northern margin of East Corsica.
Sedimentology, 55, 869–898.
2152 A. Prelat, D. M. Hodgson and S. S. Flint
� 2009 The Authors. Journal compilation � 2009 International Association of Sedimentologists, Sedimentology, 56, 2132–2154
Faure, K. and Cole, D.I. (1999) Geochemical evidence for
lacustrine microbial blooms in the vast Permian Main
Karoo, Parana, Falkland Islands and Huab basins of south-
western Gondwana. Palaeogeogr. Palaeoclimatol. Palaeo-ecol., 152, 189–213.
Fildani, A., Drinkwater, N.J., Weislogel, A., McHargue, T.,Hodgson, D.M. and Flint, S.S. (2007) Age controls on the
Tanqua and Laingsburg deep-water systems: new insights
on the evolution and sedimentary fill of the Karoo Basin,
South Africa. J. Sed. Res., 77, 901–908.
Gervais, A., Savoye, B., Mulder, T. and Gonthier, E. (2006)
Sandy modern turbidite lobes: a new insight from
high resolution seismic data. Mar. Petrol. Geol., 23, 485–
502.
Grecula, M., Flint, S.S., Wickens, H.De-V. and Johnson, S.D.(2003) Upward-thickening patterns and lateral continuity of
Permian sand-rich turbidite channel fills, Laingsburg Karoo,
South Africa. Sedimentology, 50, 831–853.
Haughton, P.D.W., Barker, S.P. and McCaffrey, W.D. (2003)
‘‘Linked’’ debrites in sand-rich turbidite systems – origin
and significance. Sedimentology, 50, 459–482.
Hodgetts, D., Drinkwater, N.J., Hodgson, D.M., Kavanagh, J.P.,Flint, S.S., Keogh, K.J. and Howell, J.A. (2004) Three-
dimensional geological models from outcrop data using dig-
ital data collection techniques: an example from the Tanqua
Karoo depocentre, South Africa. In: Geological Prior Infor-mation: Informing Science and Engineering (Eds A.C. Curtis
and R. Wood), Geol. Soc. London Spec. Publ. 239, 57–75.
Hodgson, D.M. (2009) Distribution and origin of hybrids beds
in sand-rich submarine fans of the Tanqua depocentre,
Karoo Basin, South Africa. Marine and Petroleum Geology.
doi:10.1016/j.marpetgeo.2009.02.011.
Hodgson, D.M., Flint, S.S., Hodgetts, D., Drinkwater, N.J.,Johannessen, E.P. and Luthi, S. (2006) Stratigraphic
evolution of fine-grained submarine fan systems, Tanqua
depocentre, Karoo Basin, South Africa. J. Sed. Res., 76, 20–
40.
Jegou, I., Savoye, B., Pirmez, C. and Droz, L. (2008) Channel-
mouth lobe complex of the recent Amazon fan: The missing
piece. Mar. Geol., 252, 62–77.
Johnson, M.R. (1991) Sandstone petrography, provenance and
plate tectonic setting in Gondwana context of the south-
eastern Cape-Karoo Basin. S. Afr. J. Geol., 94, 137–154.
Johnson, S.D., Flint, S.S., Hinds, D. and Wickens, H.d.V.(2001) Anatomy of basin floor to slope turbidite systems,
Tanqua Karoo, South Africa: sedimentology, sequence
stratigraphy and implications for subsurface prediction.
Sedimentology, 48, 987–1023.
Lopez-Gamundı, O.R. and Rosello, E.A. (1998) Basin-fill
evolution and paleotectonic patterns along the Samfrau
geosyncline: the Sauce Grande Basin – Ventana foldbelt
(Argentina) and Karoo Basin – Cape foldbelt (South Africa)
revisited. Geol. Rundsch., 86, 819–834.
Lowe, D.R. (1982) Sediment gravity flows: II. Depositional
models with special reference to the deposits of high den-
sity turbidity currents. Journal of Sedimentary Petrology, 52,279–297.
Luthi, S.M., Hodgson, D.M., Geel, C.R., Flint, S.S., Goedbloed,J.W., Drinkwater, N.J. and Johannessen, E.P. (2006) Con-
tribution of research borehole data to modelling fine-grained
turbidite reservoir analogues, Permian Tanqua–Karoo basin-
floor fans (South Africa). Petrol. Geosci., 12, 1–16.
Mahaffie, M.J. (1994) Reservoir classification for turbidite
intervals at the Mars discovery, Mississippi canyon 807,
Gulf of Mexico. In: Submarine Fans and Turbidite Systems
(Eds P. Weimer, A.H. Bouma and B.F. Perkins), Gulf Coast
Section–SEPM Found. 15th Annu. Res. Conf., Houston,
USA: 233–244.
Miall, A.D. (1988) Facies architecture in clastic sedimentary
basins. In: New Perspectives in Basin Analysis (Eds K.L.
Kleinspehn and C. Paola), pp. 67–81. Springer-Verlag, New
York.
Mitchum, R.M. (1985) Seismic stratigraphic expression of
submarine fans. AAPG Bull., 39, 117–136.
Mutti, E. and Normark, W.R. (1987) Comparing examples of
modern and ancient turbidite systems: problems and con-
cepts. In: Marine Clastic Sedimentology: Concepts and Case
Studies (Eds J.K. Legget and G.G. Zuffa), pp. 1–38. Graham
and Troutman, London.
Mutti, E. and Normark, W.R. (1991) An integrated approach to
the study of turbidite systems. In: Seismic Facies and
Sedimentary Processes of Submarine Fans and Turbidite
Systems (Eds P. Weimer and M.H. Link), pp. 75–106.
Springer-Verlag, New York.
Mutti, E. and Sonnino, M. (1981) Compensation cycles: a
diagnostic feature of turbidite sandstone lobes. IAS 2nd Eur.
Meet., Bologna, Italy, 120–123.
Nelson, C.H., Twichell, D.C., Schwab, W.C., Lee, H.J. and
Kenyon, N.H. (1992) Upper Pleistocene turbidite sand beds
and chaotic silt beds in the channelized, distal, outer-fan
lobes of the Mississippi fan. Geology, 20, 693–696.
Normark, W.R. (1970) Growth patterns of deep-sea fans.
AAPG Bull., 54, 2170–2195.
Normark, W.R. (1978) Fan valleys, channels, and deposi-
tional lobes on modern submarine fans: characters for
recognition of sandy turbidite environments. AAPG Bull.,
62, 912–931.
Normark, W.R., Posamentier, H.W. and Mutti, E. (1993) Tur-
bidite systems: state of the art and future directions. Rev.
Geophys., 2, 91–116.
Pickering, K.T. and Clark, J.D. (1996) Architectural elements
and growth patterns of submarine channels: application to
hydrocarbon exploration. AAPG Bull., 80, 194–221.
Posamentier, H.W. and Kolla, V. (2003) Seismic geomorphol-
ogy and stratigraphy of depositional elements in deep-water
settings. J. Sed. Res., 73, 367–388.
Posamentier, H.W. and Walker, R.G. (2006) Deep-water
turbidites and submarine fans. SEPM Spec. Publ., 84, 399–
520.
Remacha, E. and Fernandez, L.P. (2003) High-resolution cor-
relation patterns in the turbidite systems of the Hecho
Group (South-Central Pyrenees, Spain). Mar. Petrol. Geol.,
20, 711–726.
Ribeiro Machado, L.C., Kowsmann, R.O., de Almeida, W. Jr,Murakami, C.Y., Schreiner, S., Miller, D.J., Orlando, P. and
Piauilino, V. (2004) Geometry of the proximal part of the
modern turbidite depositional system of the Carapebus
Formation, Campos Basin: a model for reservoir hetero-
geneities. Boletim de Geociencias da Petrobras, 12, 287–315.
Rozman, D.J. (2000) Characterization of a fine-grained outer
submarine fan deposit, Tanqua-Karoo Basin, South Africa.
In: Fine-grained Turbidite Systems (Eds A.H. Bouma and
C.G. Stone), AAPG Mem., 72, 291–298.
Saller, A., Werner, K., Sugiaman, F., Cebastiant, A., May, R.,Glenn, D. and Barker, C. (2008) Characteristics of Pleisto-
cene deep-water fan lobes and their application to an upper
Miocene reservoir model, offshore East Kalimantan, Indo-
nesia. AAPG Bull., 92, 919–949.
Satur, N., Hurst, A., Cronin, B.T., Kelling, G. and Gurbuz, K.(2000) Sand body geometry in a sand-rich, deep-water
Evolution, architecture and hierarchy of deep-water lobes 2153
� 2009 The Authors. Journal compilation � 2009 International Association of Sedimentologists, Sedimentology, 56, 2132–2154
clastic system, Miocene Cingoz Formation of southern
Turkey. Mar. Petrol. Geol., 17, 239–252.
Shanmugam, G. (2000) 50 years of the turbidite paradigm
(1950s-1990s): deep-water processes and facies models – a
critical perspective. Mar. Petrol. Geol., 17, 285–342.
Shanmugam, G. and Moiola, R.J. (1991) Types of submarine
fan lobes: models and implications. AAPG Bull., 75, 156–
179.
Sixsmith, P.J., Flint, S.S., Wickens, H. de V. and Johnson, S.D.(2004) Anatomy and stratigraphic development of a Basin
floor turbidite system in the Laingsburg Formation, Main
Karoo Basin, South Africa. J. Sediment. Res., 74, 239–254.
Sprague, A.R., Sullivan, M.D., Campion, K.M., Jensen, G.N.,Goulding, F.J., Garfield, T.R., Sickafoose, D.K., Rossen, C.,Jennette, D.C., Beaubouef, R.T., Abreu, V., Ardill, J., Porter,M.L. and Zelt, F.B. (2003) The physical stratigraphy of deep-
water strata: a hierarchical approach to the analysis of
genetically related stratigraphic elements for improved res-
ervoir prediction (Abstract) AAPG Annual Meeting. AAPGBull., 87, 10.
Stouthamer, E. and Berendsen, H.J.A. (2007) Avulsion: the
relative roles of autogenic and allogenic processes. Sed.Geol., 198, 309–325.
Stow, D.A.V. and Mayall, M. (2000) Deep-water sedimentary
systems: new models for the 21st century. Mar. Petrol. Geol.,
17, 125–135.
Sullivan, M., Formeman, J.L., Jennette, D., Stern, D., Gerrick,N.J. and Goulding, F.J. (2004) An integrated approach to
characterization and modeling deep-water reservoirs, Diana
Field, Western Gulf of Mexico, an integration of outcrop and
modern analogs in reservoirs modeling. AAPG Mem., 80,215–234.
Twichell, D.C., Schwab, W.C., Nelson, C.H., Kenyon, N.H. and
Lee, H.J. (1992) Characteristics of a sandy depositional lobe
on the outer Mississippi fan from DeaMARC IA sidescan
sonar images. Geology, 20, 689–692.
Van der Werff, W. and Johnson, S.D. (2003) Deep-sea fan
pinch-out geometries and their relationship to fan archi-
tecture, Tanqua Karoo basin (South Africa). Int. J. Earth Sci.
(Geol Rundsch), 92, 728–742.
Veevers, J.J., Cole, D.I. and Cowan, E.J. (1994) Southern
Africa: Karoo Basin and Cape Fold Belt. In: Permian-Trias-sic Pangean Basins and Folbelts along the Panthalassan
Margin of Gondwanaland: Geological Society of America
(Eds J.J. Veevers and C.M. Powel), Mem. Geol. Soc. Am. 184,223–279.
Visser, J.N.J. (1987) The palaeogeography of part of south-
western Gondwana during the Permo-Carboniferous
glaciations. Palaeogeogr. Palaeoclimatol. Palaeoecol., 61,205–219.
Visser, J.N.J. (1993) Sea-level changes in a back-arc foreland
transition – the late Carboniferous – Permian Karoo Basin of
South Africa. Sed. Geol., 83, 115–131.
Walker, R.G. (1978) Deep-water sandstone facies and ancient
submarine fans: models for exploration and stratigraphic
traps. AAPG Bull., 62, 932–966.
Weimar, P. and Slatt, R. (2006) Introduction to petroleum
geology of deepwater settings. AAPG Stud. Geol., 57, 816.
Wickens, H.d.V. (1994) Basin floor fan building turbidites of
the southwestern Karoo Basin, Permian Ecca Group. PhD
Thesis, Port Elizabeth University, South Africa, 233 P.
Wickens, H.d.V. and Bouma, A.H. (2000) The Tanqua Fan
Complex, Karoo Basin, South Africa – outcrop analogue for
fine-grained, deepwater deposits. In: Fine-grained TurbiditeSystems (Eds A.H. Bouma and C.G. Stone), AAPG Mem. 72
and SEPM Spec. Publ. 68, 153–165.
Wild, R.J., Hodgson, D.M. and Flint, S.S. (2005) Architecture
and stratigraphic evolution of multiple, vertically-stacked
slope-channel complexes, Tanqua depocentre, Karoo Basin,
South Africa. In: Submarine Slope Systems, Processes and
Products (Eds D.M. Hodgson and S.S. Flint), Geol. Soc.London Spec. Publ. 244, 89–112.
Manuscript received 26 September 2008; revisionaccepted 1 April 2009
2154 A. Prelat, D. M. Hodgson and S. S. Flint
� 2009 The Authors. Journal compilation � 2009 International Association of Sedimentologists, Sedimentology, 56, 2132–2154
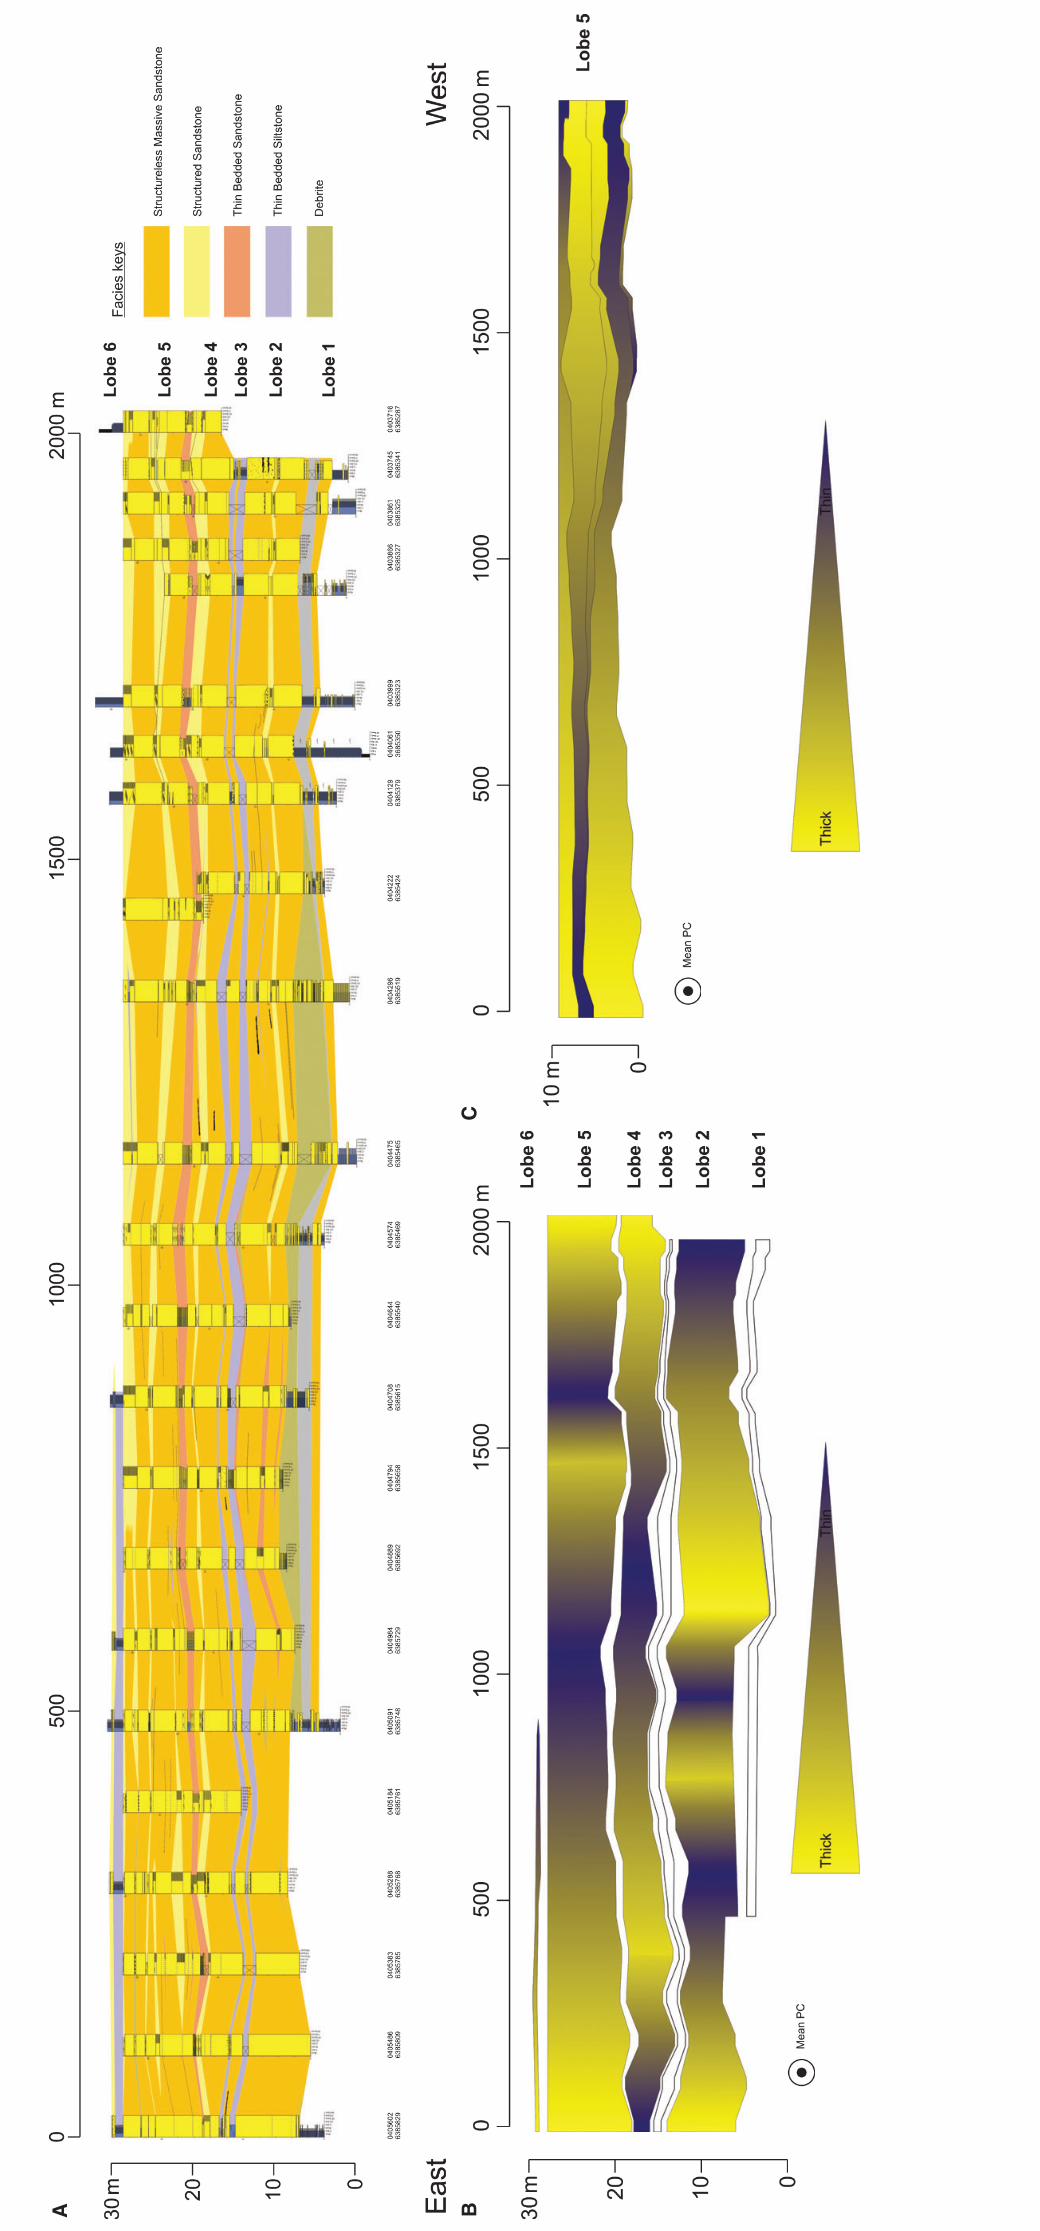
Related Documents