www.eurexchange.com Evolution and behaviour of European volatility: VSTOXX® January 2018 Evolution and behaviour of European volatility: VSTOXX® Megan Morgan Email: [email protected] Twitter: @meganbeausang

Welcome message from author
This document is posted to help you gain knowledge. Please leave a comment to let me know what you think about it! Share it to your friends and learn new things together.
Transcript

www.eurexchange.com
Evolution and behaviour of European volatility: VSTOXX® January 2018
Evolution and behaviour of European volatility: VSTOXX®Megan MorganEmail: [email protected]: @meganbeausang
www.eurexchange.com
Evolution and behaviour of European volatility: VSTOXX® January 2018
• Eurex recognized the US volatility market as a strategic area of growth upon receiving no action relief for the VSTOXX® futures in 2012
• Shortly thereafter, the exchange put in place a strategy to grow liquidity based upon changing market structure to open up the VSTOXX® market to US participants.
– Step One: Grow the liquidity in the VSTOXX® futures – Step Two: Convert the VSTOXX® Options to Options on Futures for CFTC-approval– Step Three: Work with a ETP provider to list a VSTOXX® ETN on a US-based exchange
• US participants have been keen to trade VSTOXX® to access European volatility – The index is constructed in a similar fashion as the VIX– The VSTOXX® is more reactive to European-specific events– The VSTOXX®/VIX spread is mean reverting
2
VSTOXX® and the US market

www.eurexchange.com
Evolution and behaviour of European volatility: VSTOXX® January 2018
3
A path to liquidity: VSTOXX® market structure initiatives

www.eurexchange.com
Evolution and behaviour of European volatility: VSTOXX® January 2018
4
FVS ADV
2012 ADV 15,000
2013 ADV 21,000
2014 ADV 27,500
2015 ADV 29,500
2016 ADV 38,200
2017 ADV 52,205
Orderbook volume growth 2012 vs 2017
FVS 2012 2017
Order book 71.93% 84.67%
A path to liquidity: grow liquidity in the underlying
• August 1, 2012: VSTOXX® futures received CFTC no-action relief. Volume doubled from month to month as Eurex saw an inflow of volume from US-based customers previously restricted from the contract
• March 1, 2015: Extend VSTOXX® futures market hours to overlap US trading hours• November 1, 2015: Eurex revamped the VSTOXX® futures market making program adding six new
market making participants improving order book liquidity.
0
10,000
20,000
30,000
40,000
50,000
60,000
70,000FVS - ADV By Expiry
Expiry 1 Expiry 2 Expiry 3 Expiry 4 Expiry 5 Expiry 6 Expiry 7 Expiry 8

www.eurexchange.com
Evolution and behaviour of European volatility: VSTOXX® January 2018
0.0000
0.1000
0.2000
0.3000
0.4000
0.5000
0.6000
0.7000
0.8000
0.00
50.00
100.00
150.00
200.00
250.00
insi
de m
arke
t spr
ead
insi
de m
arke
t vol
ume
The effect of new market makers on order book liquidity
average size bid average size ask average spread(r.h.scale)
5
A path to liquidity: grow liquidity in the underlying
www.eurexchange.com
Evolution and behaviour of European volatility: VSTOXX® January 2018
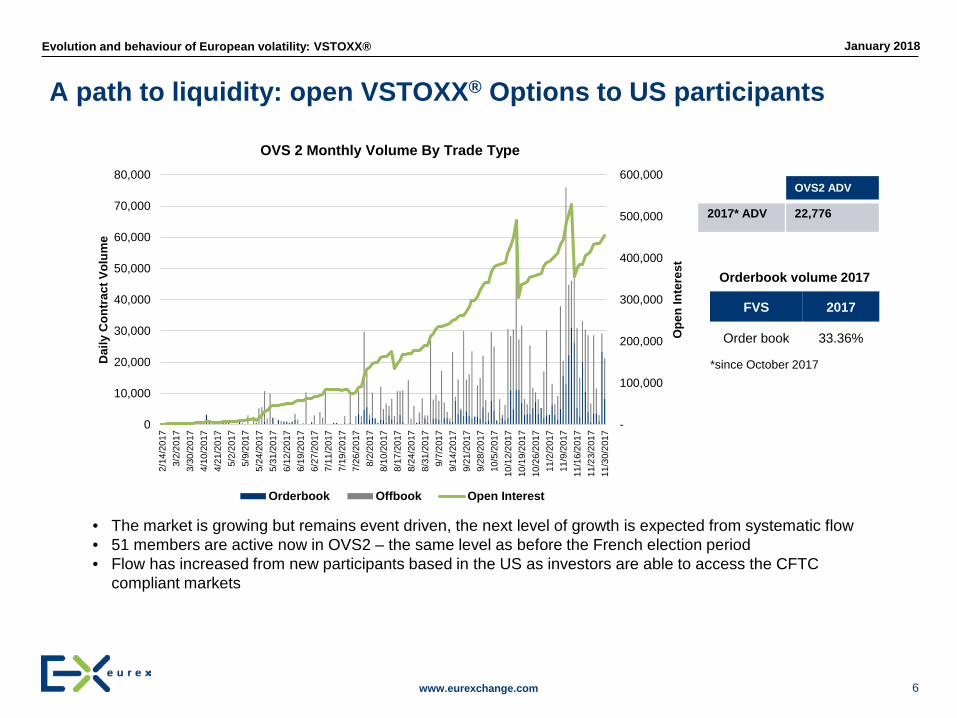
A path to liquidity: open VSTOXX® Options to US participants
• The market is growing but remains event driven, the next level of growth is expected from systematic flow• 51 members are active now in OVS2 – the same level as before the French election period• Flow has increased from new participants based in the US as investors are able to access the CFTC
compliant markets
6
-
100,000
200,000
300,000
400,000
500,000
600,000
0
10,000
20,000
30,000
40,000
50,000
60,000
70,000
80,0002/
14/2
017
3/2/
2017
3/30
/201
74/
10/2
017
4/21
/201
75/
2/20
175/
9/20
175/
24/2
017
5/31
/201
76/
12/2
017
6/19
/201
76/
27/2
017
7/11
/201
77/
19/2
017
7/26
/201
78/
2/20
178/
10/2
017
8/17
/201
78/
24/2
017
8/31
/201
79/
7/20
179/
14/2
017
9/21
/201
79/
28/2
017
10/5
/201
710
/12/
2017
10/1
9/20
1710
/26/
2017
11/2
/201
711
/9/2
017
11/1
6/20
1711
/23/
2017
11/3
0/20
17
Ope
n In
tere
st
Dai
ly C
ontr
act V
olum
e
OVS 2 Monthly Volume By Trade Type
Orderbook Offbook Open Interest
OVS2 ADV
2017* ADV 22,776
Orderbook volume 2017
FVS 2017
Order book 33.36%
*since October 2017

www.eurexchange.com
Evolution and behaviour of European volatility: VSTOXX® January 2018
Evolution and behaviour of European volatility: VSTOXX®Mark Shore, Shore Capital Research LLCEmail: [email protected]
www.shorecapmgmt.comTwitter: @shorecap

www.eurexchange.com
Evolution and behaviour of European volatility: VSTOXX® January 2018
• Past performance is not necessarily indicative of future results.
• There is risk of loss when investing in futures and options.
• Futures & options can be a volatile and risky investment; only use appropriate risk capital; this investment is not for everyone.
• The opinions expressed are solely those of the author and are only for educational purposes. Please talk to your financial advisor before making any investment decisions.
Evolution and behaviour of European volatility: VSTOXX®
8
www.eurexchange.com
Evolution and behaviour of European volatility: VSTOXX® January 2018
• Over 30 years experience in the futures markets/ alternative investments
• Undergrad DePaul University; MBA University of Chicago; Doctoral candidate in applied research
• Former COO of VK Capital (a wholly owned $300 million AUM CTA subsidiary of Morgan Stanley)
• Former Head of Risk at Octane Research, $1.1 billion AUM
• Adjunct Professor, DePaul University
• Contributing Author to two Wiley & Sons books on hedge funds & commodities
• Contributing Writer: Eurex, CBOE, CBOE Futures, MicroCap Review, Swiss Derivatives Review, Seeking
Alpha, Prime Meridian Capital Management, Coquest Advisors
• Board Member Arditti Center for Risk Mgmt; PRMIA Chicago Steering Committee, NIBA Board of
Directors, QWAFAFEW Chicago Steering Committee
• Director of Educational Research, Coquest Advisors LLC
• Hosted an internet talk show on alternative investments “Skewing Your Diversification”
• Founded consulting/research firm Shore Capital Research LLC• Research of markets & trading strategies• Due diligence of managers • Business development of alternative investments• Educational workshops• Research & expert witness testimony for capital market litigation
Mark Shore’s bio
9

www.eurexchange.com
Evolution and behaviour of European volatility: VSTOXX® January 2018
• VSTOXX® Spot (V2X)
• VSTOXX® Futures (FVS)
• VSTOXX® Options (OVS) – ended in Sept 2017
• (New) Options on VSTOXX® Futures (OVS2) – began Feb 2017
VSTOXX® volatility index derivatives
10

www.eurexchange.com
Evolution and behaviour of European volatility: VSTOXX® January 2018
VSTOXX® Futures (Eurex)
30 Day Forward Yes
Annualized Implied Volatility of EURO STOXX 50® Index
Ticker Symbol for Spot & Futures V2X (spot) & FVS (futures)
Currency Euro
Futures Began Trading (trades 8 expirations) 2009
Average Daily Trading Volume (As of November 2017) **
52,580
Long negative volatility of underlying Market Yes
Mean Reverting Yes
Top range 45 to 50
Median* 22.8
Bottom range 13 to 17
*Spot price 1/4/1999 to 8/14/17** Eurex website
VSTOXX® spot and futures
11

www.eurexchange.com
Evolution and behaviour of European volatility: VSTOXX® January 2018
• STOXX Limited formed in 1997. A leading index specialist based in Zurich, Switzerland (stoxx.com)
• EURO STOXX 50® Index “represents the performance of the 50 largest companies in terms of free-float market cap” of up to 11 Eurozone countries.
• Austria, Belgium, Finland, France, Germany, Ireland, Italy, Luxembourg, the Netherlands, Portugal and Spain
• Composition is reviewed every September
• A smaller and less diversified index than S&P 500
• Heavily weighted by financial stocks ~(25%)
Source: www.stoxx.com, as of Oct 31, 2017
STOXX®
12

www.eurexchange.com
Evolution and behaviour of European volatility: VSTOXX® January 2018
Sector Weighting Country Weighting
Banks 15.5% France 36.5%
Industrial Good & Services 10.8% Germany 33.1%
Personal Household Goods 9.2% Spain 10.4%
Chemicals 9.0% Netherlands 10.1%
Technology 7.3% Italy 4.7%
Healthcare 7.2% Belgium 3.1%
Insurance 6.9% Ireland 1.1%
Oil & Gas 6.2% Finland 1.0%
Utilities 5.2%
Automobiles & Parts 5.1%
Food & Beverage 4.9%
Telecommunications 4.8%
Construction & Materials 4.1%
Retail 2.2%
Media 0.9%
Real Estate 0.9%
Total 100% Total 100%
Source: https://www.stoxx.com/document/Bookmarks/CurrentFactsheets/SX5GT.pdfAs of October 31, 2017
EURO STOXX 50® index sector weightings
13

www.eurexchange.com
Evolution and behaviour of European volatility: VSTOXX® January 2018
0
50,000
100,000
150,000
200,000
250,000
300,000
350,000
0
10,000
20,000
30,000
40,000
50,000
60,000
2010 2011 2012 2013 2014 2015 2016 2017
Ope
n in
tere
st
Aver
age
Dai
ly V
olum
e
Avg Daily Volume Open interest
VSTOXX® volume & open interest (2010 to November 2017)
14
Source: Eurex website
www.eurexchange.com
Evolution and behaviour of European volatility: VSTOXX® January 2018
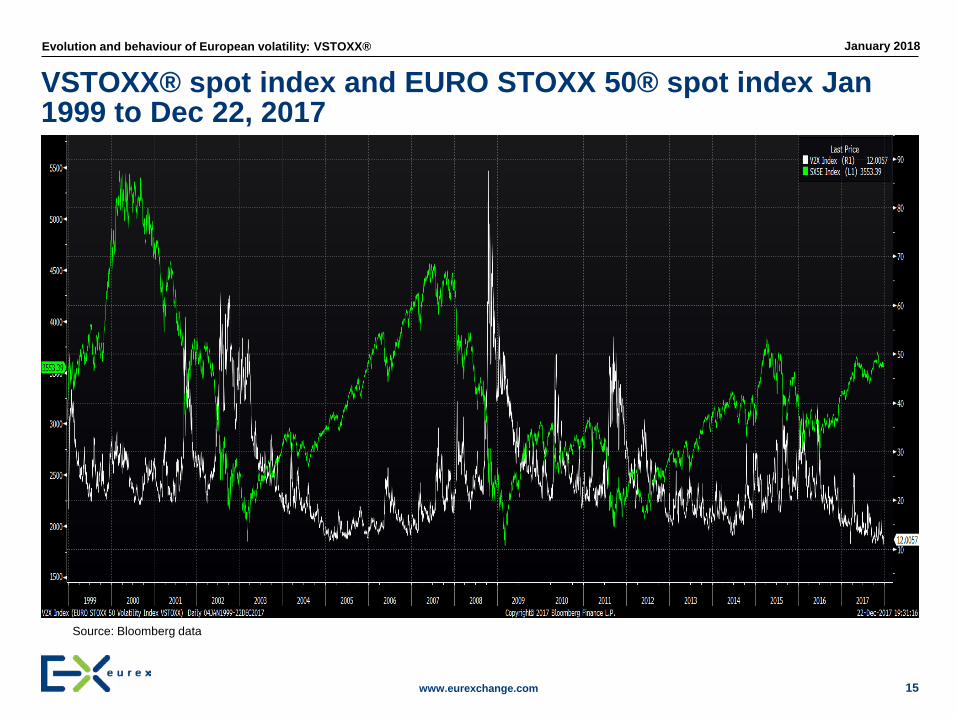
VSTOXX® spot index and EURO STOXX 50® spot index Jan 1999 to Dec 22, 2017
15
Source: Bloomberg data

www.eurexchange.com
Evolution and behaviour of European volatility: VSTOXX® January 2018
• Hedging
• Directional trading
• Intra-market spreads = term structure
• VSTOXX® Futures / VIX futures spreads (relative value trading)
• Sentiment indicator
• Trading CFTC – certified options on the futures contracts
Utilizing VSTOXX® derivatives
16
www.eurexchange.com
Evolution and behaviour of European volatility: VSTOXX® January 2018
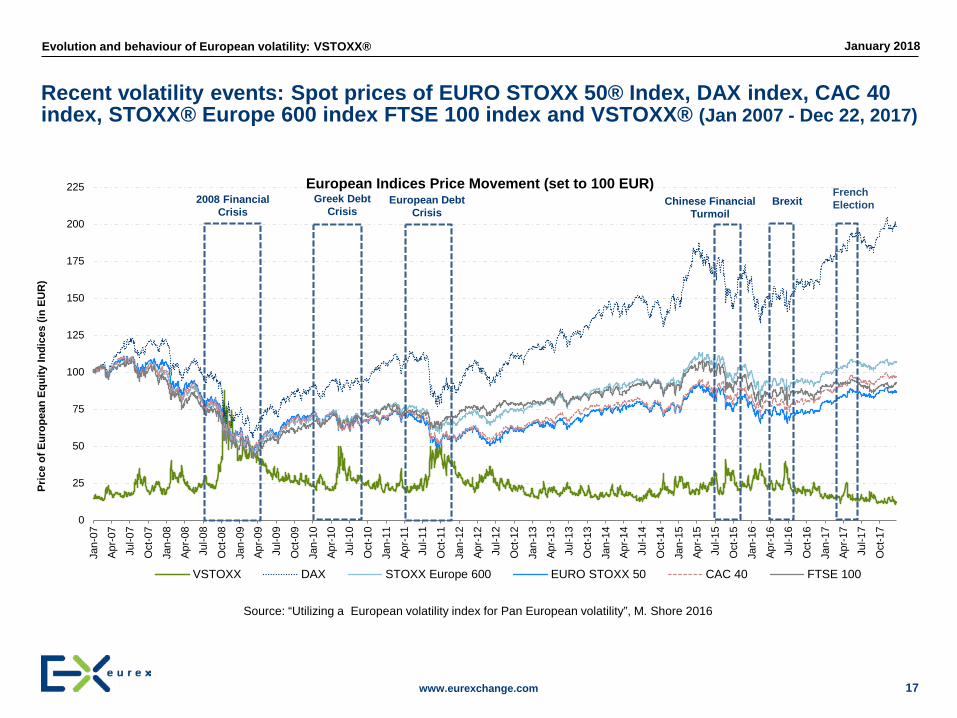
Recent volatility events: Spot prices of EURO STOXX 50® Index, DAX index, CAC 40 index, STOXX® Europe 600 index FTSE 100 index and VSTOXX® (Jan 2007 - Dec 22, 2017)
17
Source: “Utilizing a European volatility index for Pan European volatility”, M. Shore 2016
0
25
50
75
100
125
150
175
200
225
Jan-
07Ap
r-07
Jul-0
7
Oct
-07
Jan-
08Ap
r-08
Jul-0
8
Oct
-08
Jan-
09Ap
r-09
Jul-0
9
Oct
-09
Jan-
10Ap
r-10
Jul-1
0
Oct
-10
Jan-
11Ap
r-11
Jul-1
1
Oct
-11
Jan-
12Ap
r-12
Jul-1
2
Oct
-12
Jan-
13Ap
r-13
Jul-1
3
Oct
-13
Jan-
14Ap
r-14
Jul-1
4
Oct
-14
Jan-
15Ap
r-15
Jul-1
5
Oct
-15
Jan-
16Ap
r-16
Jul-1
6
Oct
-16
Jan-
17Ap
r-17
Jul-1
7
Oct
-17
Pric
e of
Eur
opea
n Eq
uity
Indi
ces
(in E
UR
)
European Indices Price Movement (set to 100 EUR)
VSTOXX DAX STOXX Europe 600 EURO STOXX 50 CAC 40 FTSE 100
European Debt Crisis
Chinese Financial Turmoil
Greek Debt Crisis
Brexit2008 Financial Crisis
French Election

www.eurexchange.com
Evolution and behaviour of European volatility: VSTOXX® January 2018
VSTOXX® EURO STOXX 50® Index CAC 40 FTSE 100 DAX STOXX®
Europe 600
VSTOXX® 1.00 -0.77 -0.76 -0.67 -0.74 -0.76
EURO STOXX 50® Index 1.00 0.98 0.85 0.95 0.96
CAC 40 1.00 0.87 0.93 0.97
FTSE 100 1.00 0.82 0.94
DAX 1.00 0.93
STOXX® Europe 600 1.00
Can you apply VSTOXX® derivatives to other European equity indices?
18
Source: “Utilizing a European volatility index for Pan European volatility”, M. Shore 2016
• Pan-European Correlation Spot Prices (2 Jan 2007 to 30 Sept 2016 in EUR)

www.eurexchange.com
Evolution and behaviour of European volatility: VSTOXX® January 2018
-60%
-40%
-20%
0%
20%
40%
60% 5-Day Rolling Return of European Equity Index Futures (2 April 2016 to 1 July 2016)
VSTOXX DAX STOXX Europe 600 CAC 40 EURO STOXX 50
European equity front months future returns vs VSTOXX® futures front month returns
19
Source: Utilizing a European volatility index for Pan European volatility”, M. Shore 2016

www.eurexchange.com
Evolution and behaviour of European volatility: VSTOXX® January 2018
Why VSTOXX® is a better proxy for European volatility
20
0
100
200
300
400
500
600
700
800
900-1
.00
-0.9
5-0
.90
-0.8
5-0
.80
-0.7
5-0
.70
-0.6
5-0
.60
-0.5
5-0
.50
-0.4
5-0
.40
-0.3
5-0
.30
-0.2
5-0
.20
-0.1
5-0
.10
-0.0
50.
000.
050.
100.
150.
200.
250.
300.
350.
400.
450.
500.
550.
600.
650.
700.
750.
800.
850.
900.
951.
00
Freq
uenc
y
Correlation
Frequency of 5-Day Rolling Correlation of VSTOXX® Spot & VIX Spot to EURO STOXX 50® Index January 1999 to December 2013
VIX Correlation VSTOXX Correlation
Average Maximum Minimum5 Day Rolling PeriodVSTOXX ® spot correlation -0.85 0.57 -1.0VIX spot correlation -0.51 1.0 -1.0One-Month Rolling PeriodVSTOXX ® spot correlation -0.83 -0.28 -0.97VIX spot correlation -0.51 0.27 -0.87
Correlations of VSTOXX® spot and VIX spot to EURO STOXX 50® during -2% or greater equity market corrections
Source: “Noisy short-term correlations in global volatility index futures: why trading one regional index futures market may not be enough”, M. Shore 2014

www.eurexchange.com
Evolution and behaviour of European volatility: VSTOXX® January 2018
12
14
16
18
20
22
24
26
28
30
32
1 2 3 4 5 6 7 8 9
19/6/2014 19/9/2014 6/10/2014 10/10/2014 16/10/2014
Contango to Backwardation: evolution of the volatility regime shift of VSTOXX® spot and VSTOXX® futures
21
• VSTOXX® is in contango 70% of the time since 2011: source Eurex Exchange
Source: “An analysis of why volatility indexes are relevant”, M. Shore 2014
www.eurexchange.com
Evolution and behaviour of European volatility: VSTOXX® January 2018
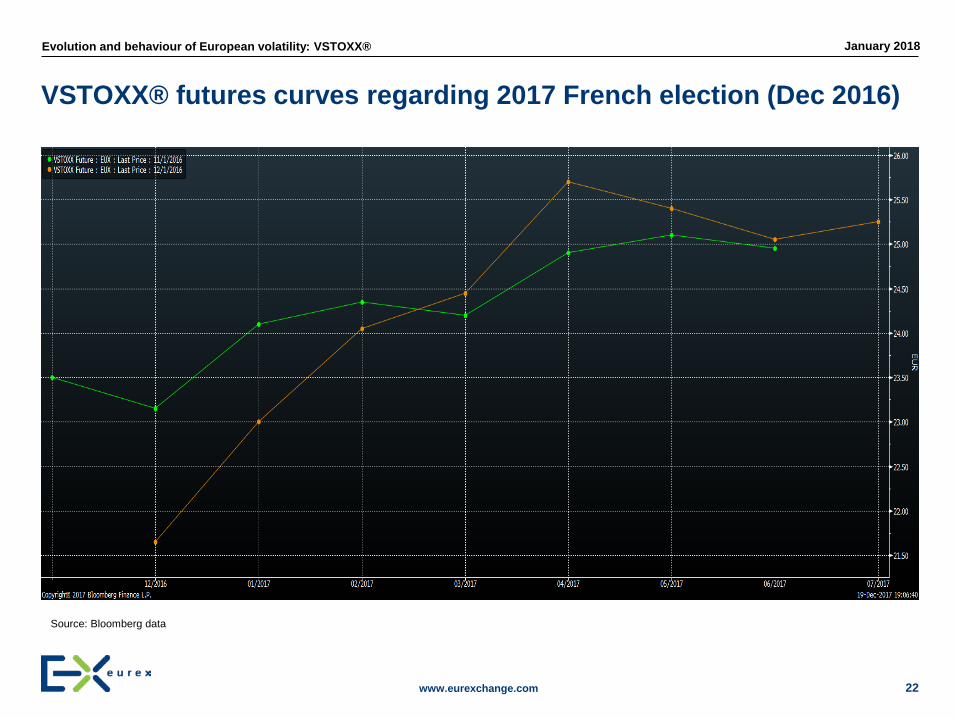
VSTOXX® futures curves regarding 2017 French election (Dec 2016)
22
Source: Bloomberg data
www.eurexchange.com
Evolution and behaviour of European volatility: VSTOXX® January 2018
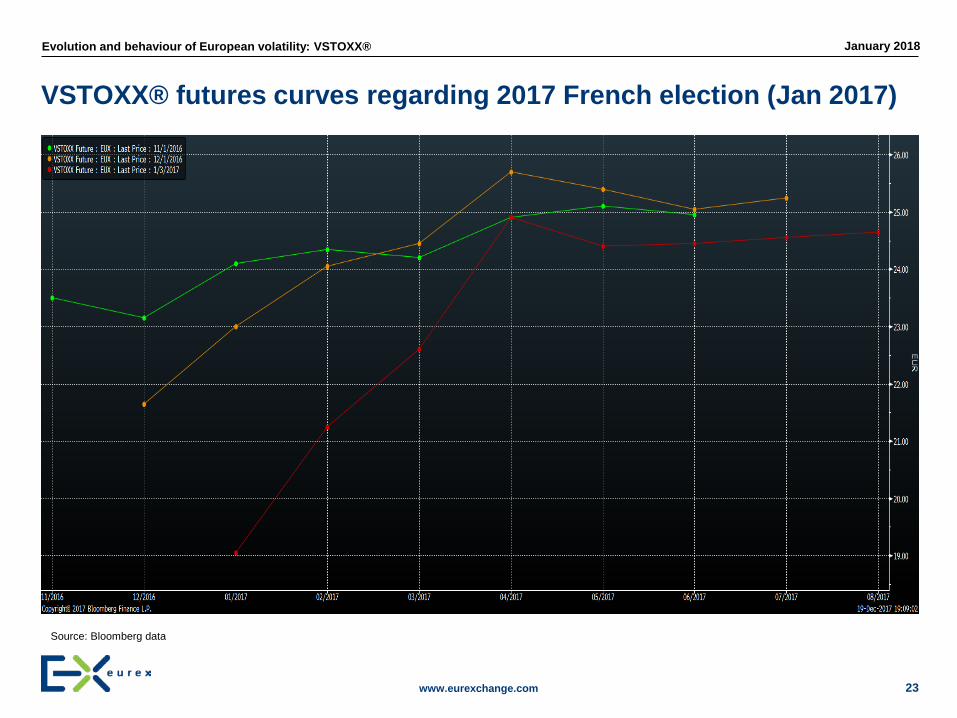
VSTOXX® futures curves regarding 2017 French election (Jan 2017)
23
Source: Bloomberg data

www.eurexchange.com
Evolution and behaviour of European volatility: VSTOXX® January 2018
VSTOXX® futures curves regarding 2017 French election (Feb 2017)
24
Source: Bloomberg data

www.eurexchange.com
Evolution and behaviour of European volatility: VSTOXX® January 2018
VSTOXX® futures curves regarding 2017 French election (Mar 2017)
25
Source: Bloomberg data

www.eurexchange.com
Evolution and behaviour of European volatility: VSTOXX® January 2018
VSTOXX® futures curves regarding 2017 French election (April 2017)
26
Source: Bloomberg data

www.eurexchange.com
Evolution and behaviour of European volatility: VSTOXX® January 2018
VSTOXX® futures curves regarding 2017 French election (May 2017)
27
Source: Bloomberg data
www.eurexchange.com
Evolution and behaviour of European volatility: VSTOXX® January 2018
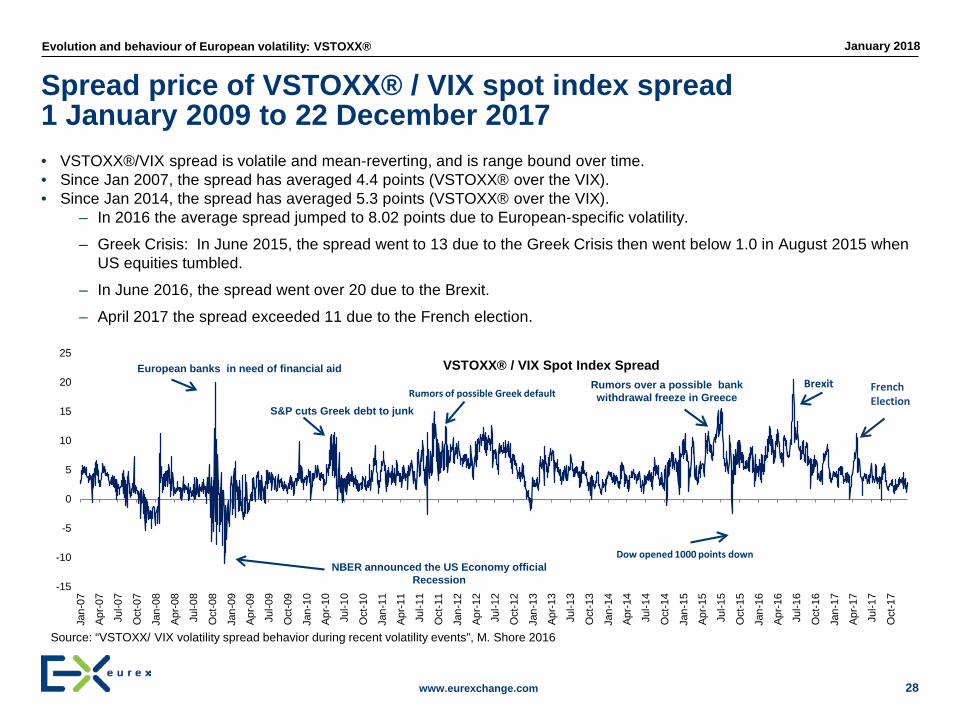
Spread price of VSTOXX® / VIX spot index spread 1 January 2009 to 22 December 2017
28
Source: “VSTOXX/ VIX volatility spread behavior during recent volatility events”, M. Shore 2016
• VSTOXX®/VIX spread is volatile and mean-reverting, and is range bound over time.• Since Jan 2007, the spread has averaged 4.4 points (VSTOXX® over the VIX).• Since Jan 2014, the spread has averaged 5.3 points (VSTOXX® over the VIX).
– In 2016 the average spread jumped to 8.02 points due to European-specific volatility.
– Greek Crisis: In June 2015, the spread went to 13 due to the Greek Crisis then went below 1.0 in August 2015 when US equities tumbled.
– In June 2016, the spread went over 20 due to the Brexit.
– April 2017 the spread exceeded 11 due to the French election.
-15
-10
-5
0
5
10
15
20
25
Jan-
07
Apr-0
7
Jul-0
7
Oct
-07
Jan-
08
Apr-0
8
Jul-0
8
Oct
-08
Jan-
09
Apr-0
9
Jul-0
9
Oct
-09
Jan-
10
Apr-1
0
Jul-1
0
Oct
-10
Jan-
11
Apr-1
1
Jul-1
1
Oct
-11
Jan-
12
Apr-1
2
Jul-1
2
Oct
-12
Jan-
13
Apr-1
3
Jul-1
3
Oct
-13
Jan-
14
Apr-1
4
Jul-1
4
Oct
-14
Jan-
15
Apr-1
5
Jul-1
5
Oct
-15
Jan-
16
Apr-1
6
Jul-1
6
Oct
-16
Jan-
17
Apr-1
7
Jul-1
7
Oct
-17
VSTOXX® / VIX Spot Index SpreadEuropean banks in need of financial aid
NBER announced the US Economy official Recession
S&P cuts Greek debt to junkRumors of possible Greek default
Dow opened 1000 points down
Rumors over a possible bank withdrawal freeze in Greece
Brexit French Election

www.eurexchange.com
Evolution and behaviour of European volatility: VSTOXX® January 2018
• The term structure of VSTOXX® Futures is frequently in contango (spot price is less than futures prices)
• When volatility begins to show up in the VSTOXX® index, it tends to experience greater moves in the spot, front and nearby futures months:
• If the market is in contango and an expectation of a larger move in the front month vs back months:– buy calls in the front month and buy puts in the back months– sell puts in the front month to receive some premium and the expectation the front month may move
higher
• If the market is expected to remain in contango:– buy puts in the back months as the price of the back months may decline as they move closer to
expiration
• If the futures term structure is in backwardation for an extended period of time: – determine to either buy puts or sell calls in the front month or nearby month with the perspective of
the VSTOXX® futures potentially moving lower
Potential ideas to think about regarding trading OVS2
29
Source: “Introduction on CFTC – certified Options on VSTOXX® Futures” M. Shore 2017

www.eurexchange.com
Evolution and behaviour of European volatility: VSTOXX® January 2018
• Go to: http://www.eurexchange.com/exchange-en/products/vol/vstoxx
http://www.eurexgroup.com/group-en/newsroom/vstoxx-outlook
• Or to: http://www.shorecapmgmt.com/vstoxx-articles.html
For more information
30

www.eurexchange.com
Evolution and behaviour of European volatility: VSTOXX® January 2018
Thank You
31
Related Documents