Evaluation of flexicurity 2007-2010: Final Report A report by ICF GHK to European Commission, Directorate-General Employment, Social Affairs and Equal Opportunities (VC/2011/0682) 30 October 2012 “Labour market reforms are by their nature a relatively slow process. Their implementation due to their political sensitively often takes years. Visible results are even longer in their appearance. Furthermore it is extremely difficult to disentangle precise causalities.” COMMISSION STAFF WORKING DOCUMENT Accompanying the COMMUNICATION FROM THE COMMISSION TO THE EUROPEAN PARLIAMENT, THE COUNCIL, THE EUROPEAN ECONOMIC AND SOCIAL COMMITTEE AND THE COMMITTEE OF THE REGIONS Towards Common Principles of Flexicurity: More and better jobs through flexibility and security, Brussels, 27.6.2007, SEC(2007) 861, p. 21

Welcome message from author
This document is posted to help you gain knowledge. Please leave a comment to let me know what you think about it! Share it to your friends and learn new things together.
Transcript
Evaluation of flexicurity 2007-2010: Final Report
A report by ICF GHK to European Commission, Directorate-General Employment, Social Affairs and Equal Opportunities (VC/2011/0682)
30 October 2012
“Labour market reforms are by their nature a relatively slow process. Their implementation due to their political sensitively often takes years. Visible results are even longer in their appearance. Furthermore it is extremely difficult to disentangle precise causalities.” COMMISSION STAFF WORKING DOCUMENT Accompanying the COMMUNICATION FROM THE COMMISSION TO THE EUROPEAN PARLIAMENT, THE COUNCIL, THE EUROPEAN ECONOMIC AND SOCIAL COMMITTEE AND THE COMMITTEE OF THE REGIONS Towards Common Principles of Flexicurity: More and better jobs through flexibility and security, Brussels, 27.6.2007, SEC(2007) 861, p. 21

This publication is supported for under the European Community Programme for Employment and Social Solidarity (2007-2013). This programme is managed by the Directorate-General for Employment, Social Affairs and Inclusion of the European Commission. It was established to financially support the implementation of the objectives of the European Union in the employment and social affairs area, as set out in the Social Agenda, and thereby contribute to the achievement of the Lisbon Strategy goals in these fields.
The seven-year Programme targets all stakeholders who can help shape the development of appropriate and effective employment and social legislation and policies, across the EU-27, EFTA-EEA and EU candidate and pre-candidate countries.
PROGRESS mission is to strengthen the EU contribution in support of Member States' commitments and efforts to create more and better jobs and to build a more cohesive society. To that effect, PROGRESS will be instrumental in:
providing analysis and policy advice on PROGRESS policy areas;
monitoring and reporting on the implementation of EU legislation and policies in PROGRESS policy areas;
promoting policy transfer, learning and support among Member States on EU objectives and priorities; and
relaying the views of the stakeholders and society at large
For more information see:
http://ec.europa.eu/social/main.jsp?langId=en&catId=987
This report is the responsibility of the contractor and does not necessarily reflect the position or opinion of the European Commission.
Evaluation of flexicurity (2007-2010): final report
i
Evaluation of flexicurity 2007-2010: Final Report
A report submitted by ICF GHK
Date: 30 October 2012
Job Number: 30258873
Evaluation of flexicurity (2007-2010): final report
ii
Contacts for this study:
Inga Pavlovaite, Pat Irving, Tina Weber
ICF GHK 30 St Paul's Square Birmingham B3 1QZ T +44 (0) 121 233 8900 FF +44 (0) 121 212 0308 inga.pavlovaite@ICF GHKint.com www.ICF GHKint.com

Evaluation of flexicurity (2007-2010): final report
iii
Document control
Document Title Evaluation of the first phase of flexicurity (2007-2010): final report
Job number 30258873 (VC/2011/0682)
Prepared by Richard Smith, Inga Pavlovaite, Elena Jurado, Tina Weber
Checked by Tina Weber
Date 30 October 2012
Evaluation of flexicurity (2007-2010): final report
iv
Contents
1 Introduction ......................................................................................................... 1 1.1 Introduction ............................................................................................................................. 1 1.2 Study aims and objectives....................................................................................................... 1 1.3 Key evaluation questions ........................................................................................................ 1 1.4 Structure of the report ............................................................................................................. 2
2 Methodological approach ................................................................................... 3 2.1 Task 1: The research design process and scoping exercise (December 2011- February
2012) ....................................................................................................................................... 3 2.2 Task 2: In-depth case study research in 12 countries (December 2011 – April 2012) ............ 7 2.3 Task 3 – Preparation of examples of interesting practice (December 2011 – May 2012) ....... 9 2.4 Task 4 – Finalisation phase (May - September 2012) ........................................................... 10
3 Understanding the concept of Flexicurity ........................................................ 11 3.1 Flexicurity in the EU’s evolving policy landscape .................................................................. 11 3.2 Implementing Flexicurity at the national level 2007-2010 ...................................................... 16 3.3 Flexicurity during the economic crisis and beyond ................................................................ 17
4 Impact of the Communication and Common Principles on national policy making ................................................................................................................ 21
4.1 Introduction ........................................................................................................................... 21 4.2 Emergence of flexicurity as an overarching strategy combining the four elements ............... 21 4.3 Impact of flexicurity on national political and policy debates ................................................. 27 4.4 Governance and monitoring structures for flexicurity policies ............................................... 34 4.5 The role of flexicurity in guiding the national reform policy since 2007 .................................. 40 4.6 Summary of overall findings .................................................................................................. 54
5 Labour market changes in the EU-27 in 2007-2010 period ............................57 5.1 Introduction ........................................................................................................................... 57 5.2 Flexible and Secure Contractual Arrangements .................................................................... 59 5.3 Developments in Lifelong learning component...................................................................... 66 5.4 Effective active labour market policies .................................................................................. 74 5.5 Modern social security systems ............................................................................................ 83 5.6 Analysis of the relationship between all input and process / outcome indicators .................. 93
6 Impact of the implemented integrated flexicurity policies on labour market outcomes ........................................................................................................... 96
6.1 Introduction ........................................................................................................................... 96 6.2 To what extent have implemented flexicurity policies strengthened employment security? .. 96 6.3 Flexicurity measures and the facilitation of employment transitions .................................... 100 6.4 The impact of flexicurity measures on labour market segmentation .................................... 103 6.5 The impact of flexicurity measures on gender disparities .................................................... 106 6.6 The key macro-economic trends ......................................................................................... 108 6.7 Summary of findings ........................................................................................................... 119
7 Relationships between the flexicurity policies, macro economic performance and labour market outcomes .................................................... 121
7.1 Introduction ......................................................................................................................... 121 7.2 Overview analysis ............................................................................................................... 121 7.3 Analysis of the trends in the Nordic cluster ......................................................................... 123 7.4 Analysis of the trends in the Continental cluster .................................................................. 124 7.5 Analysis of the trends in Anglo-Saxon cluster ..................................................................... 125 7.6 Analysis of the trends in Southern Cluster .......................................................................... 126 7.7 Analysis of the trends in Eastern European cluster ............................................................. 127 7.8 Summary conclusions ......................................................................................................... 128
8 Conclusions and policy messages ................................................................... 131
Evaluation of flexicurity (2007-2010): final report
v
8.1 EQ1: Whether and to what extent have Member States put into practice the Common Principles?........................................................................................................................... 131
8.2 EQ2: Whether and to what extent did Member States develop their own 'flexicurity pathways'? .......................................................................................................................... 135
8.3 EQ3: Whether and to what extent have Member States put into practice appropriate governance mechanisms? .................................................................................................. 136
8.4 EQ4: What has been the impact of the implemented integrated flexicurity policies at EU and national level concerning the objectives of flexicurity and the Lisbon Strategy? .......... 137
8.5 Flexibility and security: mutually supportive or working in opposition? ................................ 142 8.6 Is there a place for flexicurity in current labour market policy making? ............................... 143
9 Recommendations ........................................................................................... 145
Evaluation of flexicurity (2007-2010): final report
1
1 Introduction
1.1 Introduction
This is the final report of the evaluation of the first phase of flexicurity (2007-2010) undertaken by ICF GHK for the European Commission’s Directorate-General Employment, Social Affairs and Inclusion in the period between November 2011 and June 2012.
1.2 Study aims and objectives
The objectives of the evaluation were twofold:
1. To assess, more than three years after their publication/adoption the impact of the Communication “Towards Common Principles of flexicurity” and the Common Principles on national policy making in the EU Member States; and
2. To analyse the impact of the implemented integrated flexicurity policies on labour market outcomes at EU and national level in terms of strengthening employment security, facilitating transitions and reducing labour market segmentation.
The evaluation covers the 27 Member States looking at the time frame between the publication of the two key Commission Communications on Flexicurity so far i.e. “Towards Common Principles of Flexicurity”, adopted in June 2007, and “An Agenda for new skills and jobs”, adopted in November 2010. However, the evaluation also includes developments occurring after November 2010 when they resulted in significant changes in national policy making, such as labour market reforms in Spain and Italy. 12 Member States have been subject to in-depth case study research.
1.3 Key evaluation questions
The following key evaluation questions (EQ) have been set to frame the evaluation.
1.3.1 Impact of the Communication and Common Principles on national policy making
EQ1: Whether and to what extent have Member States put into practice the Common Principles?
1. Have Member States outlined in their National Reform Programmes the national arrangements giving effect to the Common Principles?
2. To what extent has the concept of flexicurity been addressed in the national policy/political debates?
3. To what extent have the flexicurity-related challenges (notably enhancing employment security, reducing labour market segmentation and managing positive transitions) been on the public and political agenda?
4. Has there been a balanced approach concerning improving flexibility and security at the same time? Has there been a bias towards one of these key aspects?
5. Has flexicurity been considered as an over-arching strategy, i.e. is there a deliberate combination of the (four) components or have they been treated in a rather separate way? Has there been a bias towards one or some of the components?
6. Have policies been introduced to reduce segmentation? Has the enhancement of contractual flexibility been ensured and accompanied by measures to secure transitions from job to job?
7. To what extent have policies been introduced to promote equal access to quality employment for women and men and measures offered to reconcile work, family and private life?
8. Which major reforms, inspired by flexicurity, have been introduced or announced? Were these measures costly/cost-effective? Were they relevant/appropriate for all labour market groups?
9. What flexicurity-type measures have been introduced to mitigate the impact of the crisis? ▪ Identify best practices in relation to the questions above.
Evaluation of flexicurity (2007-2010): final report
2
EQ2: Whether and to what extent did Member States develop their own 'flexicurity pathways'?
10. Has a 'national flexicurity pathway', i.e. an explicit strategy combining the four flexicurity components been developed in a deliberate way?
11. To what extent have Member States used the model pathways proposed by the Commission?
12. Which aspects are regarded as strengths/weaknesses in the national approaches to the implementation of the flexicurity principles by the stakeholders?
▪ Identify best practices in relation to the questions above.
EQ3: Whether and to what extent have Member States put into practice appropriate governance mechanisms?
13. To what extent have the various stakeholders, notably the social partners, been involved in the development of the national pathway? Has it been subject to public debate?
14. Is the implementation of integrated flexicurity policies monitored? How? What kind of monitoring mechanisms have been put in place?
1.3.2 Impact of the implemented integrated flexicurity policies on labour market outcomes
EQ4: What has been the impact of the implemented integrated flexicurity policies at EU and national level concerning the objectives of flexicurity and the Lisbon Strategy?
15. To what extent have integrated flexicurity policies increased adaptability, employment and social cohesion?
16. To what extent have integrated flexicurity policies strengthened employment security? 17. To what extent have integrated flexicurity policies facilitated transitions? 18. To what extent have integrated flexicurity policies reduced labour market segmentation?
1.4 Structure of the report
The report consists of the following sections:
▪ Section 2 – the description of the methodological approach,
▪ Section 3 – the analysis of the flexicurity concept and policy background,
▪ Section 4 – analysis of the impact on national policy making,
▪ Section 5 – the analysis of key labour market trends,
▪ Section 6 – analysis of the impact on labour market outcomes,
▪ Section 7 – offering conclusions and recommendations.
The report is accompanied by the following annexes:
▪ Annex 1 – interesting practice examples,
▪ Annex 2 – the analysis of NRPs,
▪ Annex 3 – methodological description of statistical analysis.
▪ Annex 4 – full data analysis results with macro-economic and flexicurity scoreboards for 27 EU Member States.
▪ Annex 5 – summary table of the key trends observed in the macro-economic and flexicurity scoreboards of 27 EU Member States.
Evaluation of flexicurity (2007-2010): final report
3
2 Methodological approach
In this section, the methodological approach in undertaking the evaluation is described in brief.
2.1 Task 1: The research design process and scoping exercise (December 2011- February 2012)
2.1.1 Step 1.1 – Refinement of the logic model and analytical framework
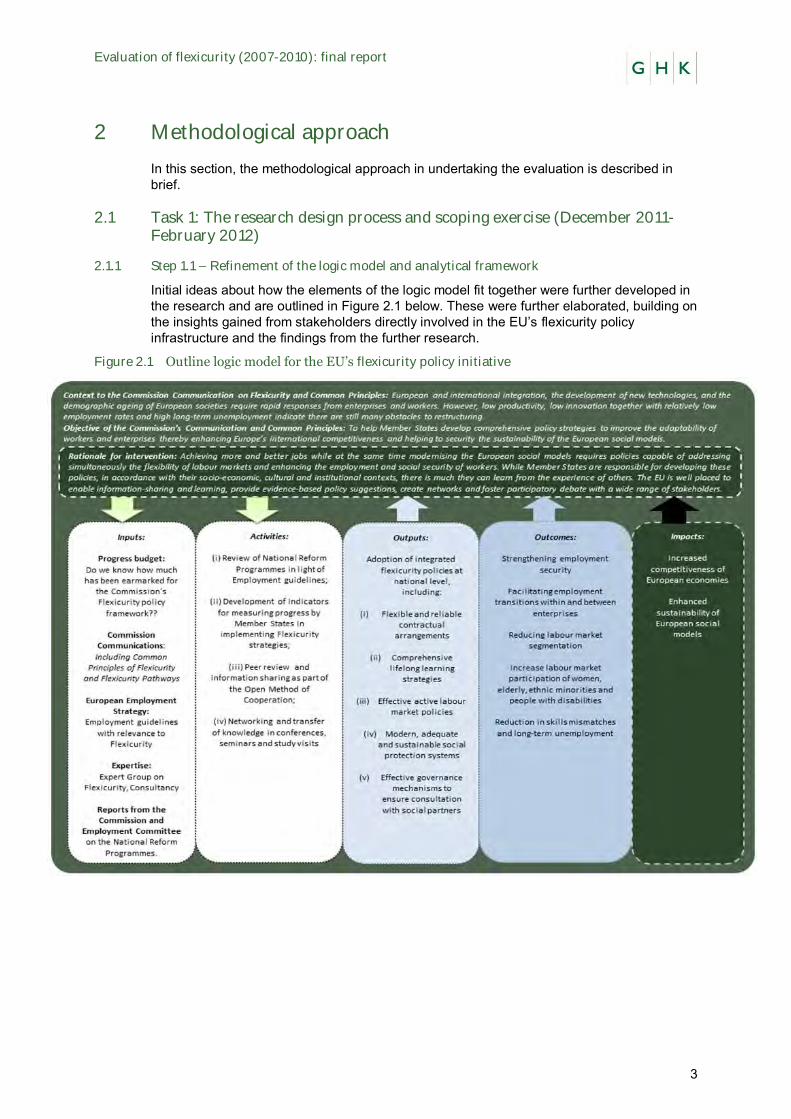
Initial ideas about how the elements of the logic model fit together were further developed in the research and are outlined in Figure 2.1 below. These were further elaborated, building on the insights gained from stakeholders directly involved in the EU’s flexicurity policy infrastructure and the findings from the further research.
Figure 2.1 Outline logic model for the EU’s flexicurity policy initiative
Evaluation of flexicurity (2007-2010): final report
4
2.1.2 Step 1.2 - Scoping exercise
The scoping exercise was a key element of Task 1 to validate the logic model and hypotheses. It provided information to refine the research tools and enabled a horizontal analysis of the key policy developments and labour market trends in all 27 Member States. The scoping exercise comprised the following analyses:
▪ It explored the presence of the Common Principles of flexicurity in the 2008-2010 National Reform Programmes (NRPs) for all 27 Member States and sought to understand the influence (or not) of the four components and the eight Common Principles on national policy-making.
▪ It helped to identify the policies and measures (at national, European and international levels) which may have influenced the evolution of the labour market and social policies of the 27 Member States.
▪ It helped the research team develop a deeper understanding of the major changes to the labour markets and social policies of the 27 Member States during the analysis period (June 2007 – November 2010).
This analysis was informed by:
▪ Collating contextual statistical information drawn from European and national sources (the analysis is presented in section 5).
▪ Key EU level sources describing the flexicurity related developments across the 27 Member States since 2007.1
Turning first to the statistical information, our analysis included a review of descriptive statistics linked to the indicators corresponding to the four components of flexicurity. The choice of the indicators was based on reviewing the flexicurity indicator work undertaken by EMCO2, relevant flexicurity indicators in the JAF framework 3 and indicators used in several pan-European flexicurity studies.
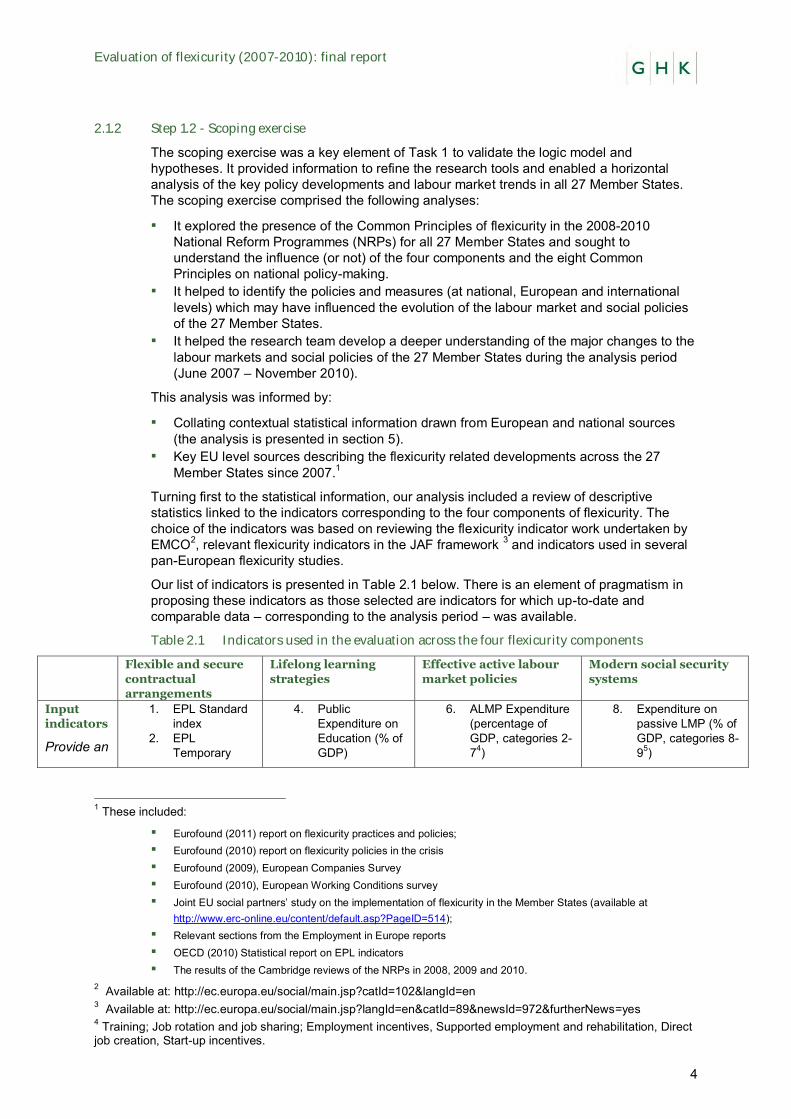
Our list of indicators is presented in Table 2.1 below. There is an element of pragmatism in proposing these indicators as those selected are indicators for which up-to-date and comparable data – corresponding to the analysis period – was available.
Table 2.1 Indicators used in the evaluation across the four flexicurity components
Flexible and secure
contractual
arrangements
Lifelong learning
strategies
Effective active labour
market policies
Modern social security
systems
Input
indicators
Provide an
1. EPL Standard index
2. EPL Temporary
4. Public Expenditure on Education (% of GDP)
6. ALMP Expenditure (percentage of GDP, categories 2-74)
8. Expenditure on passive LMP (% of GDP, categories 8-95)
1 These included:
▪ Eurofound (2011) report on flexicurity practices and policies; ▪ Eurofound (2010) report on flexicurity policies in the crisis ▪ Eurofound (2009), European Companies Survey ▪ Eurofound (2010), European Working Conditions survey ▪ Joint EU social partners’ study on the implementation of flexicurity in the Member States (available at
http://www.erc-online.eu/content/default.asp?PageID=514); ▪ Relevant sections from the Employment in Europe reports ▪ OECD (2010) Statistical report on EPL indicators ▪ The results of the Cambridge reviews of the NRPs in 2008, 2009 and 2010.
2 Available at: http://ec.europa.eu/social/main.jsp?catId=102&langId=en 3 Available at: http://ec.europa.eu/social/main.jsp?langId=en&catId=89&newsId=972&furtherNews=yes 4 Training; Job rotation and job sharing; Employment incentives, Supported employment and rehabilitation, Direct job creation, Start-up incentives.
Evaluation of flexicurity (2007-2010): final report
5
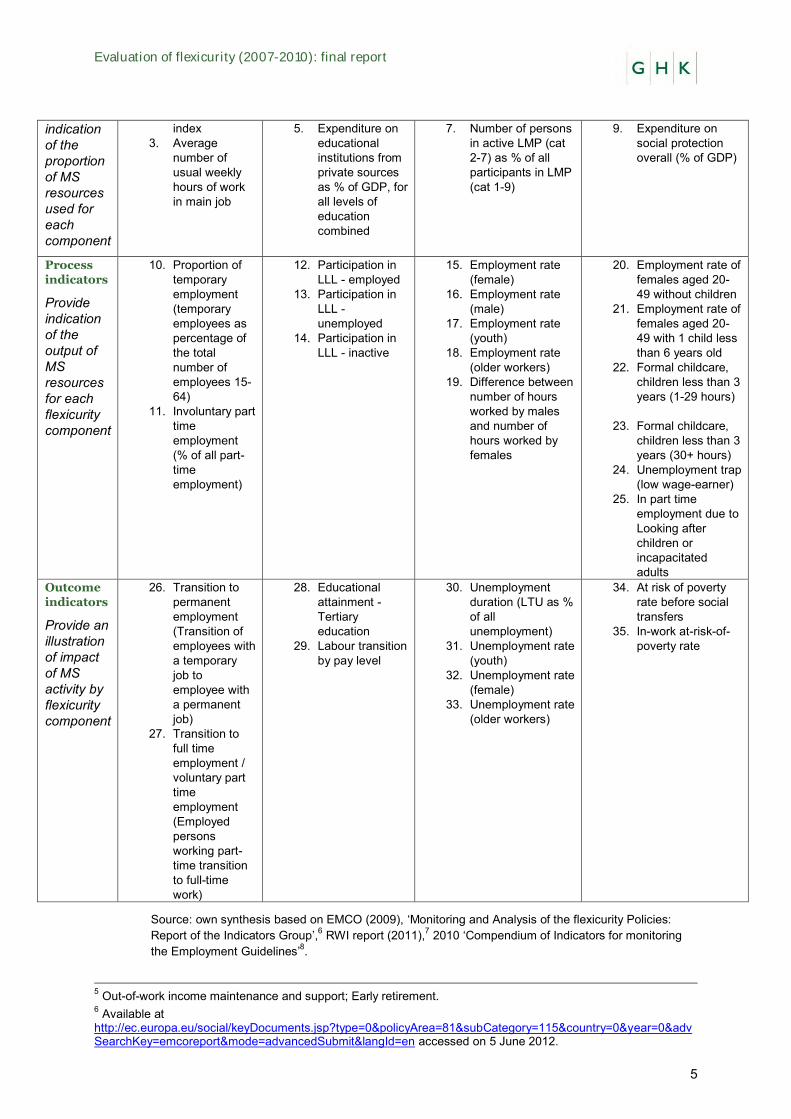
indication of the proportion of MS resources used for each component
index 3. Average
number of usual weekly hours of work in main job
5. Expenditure on educational institutions from private sources as % of GDP, for all levels of education combined
7. Number of persons in active LMP (cat 2-7) as % of all participants in LMP (cat 1-9)
9. Expenditure on social protection overall (% of GDP)
Process
indicators
Provide indication of the output of MS resources for each flexicurity component
10. Proportion of temporary employment (temporary employees as percentage of the total number of employees 15-64)
11. Involuntary part time employment (% of all part-time employment)
12. Participation in LLL - employed
13. Participation in LLL - unemployed
14. Participation in LLL - inactive
15. Employment rate (female)
16. Employment rate (male)
17. Employment rate (youth)
18. Employment rate (older workers)
19. Difference between number of hours worked by males and number of hours worked by females
20. Employment rate of females aged 20-49 without children
21. Employment rate of females aged 20-49 with 1 child less than 6 years old
22. Formal childcare, children less than 3 years (1-29 hours)
23. Formal childcare, children less than 3 years (30+ hours)
24. Unemployment trap (low wage-earner)
25. In part time employment due to Looking after children or incapacitated adults
Outcome
indicators
Provide an illustration of impact of MS activity by flexicurity component
26. Transition to permanent employment (Transition of employees with a temporary job to employee with a permanent job)
27. Transition to full time employment / voluntary part time employment (Employed persons working part-time transition to full-time work)
28. Educational attainment - Tertiary education
29. Labour transition by pay level
30. Unemployment duration (LTU as % of all unemployment)
31. Unemployment rate (youth)
32. Unemployment rate (female)
33. Unemployment rate (older workers)
34. At risk of poverty rate before social transfers
35. In-work at-risk-of-poverty rate
Source: own synthesis based on EMCO (2009), ‘Monitoring and Analysis of the flexicurity Policies: Report of the Indicators Group’,6 RWI report (2011),7 2010 ‘Compendium of Indicators for monitoring the Employment Guidelines’8.
5 Out-of-work income maintenance and support; Early retirement. 6 Available at http://ec.europa.eu/social/keyDocuments.jsp?type=0&policyArea=81&subCategory=115&country=0&year=0&advSearchKey=emcoreport&mode=advancedSubmit&langId=en accessed on 5 June 2012.
Evaluation of flexicurity (2007-2010): final report
6
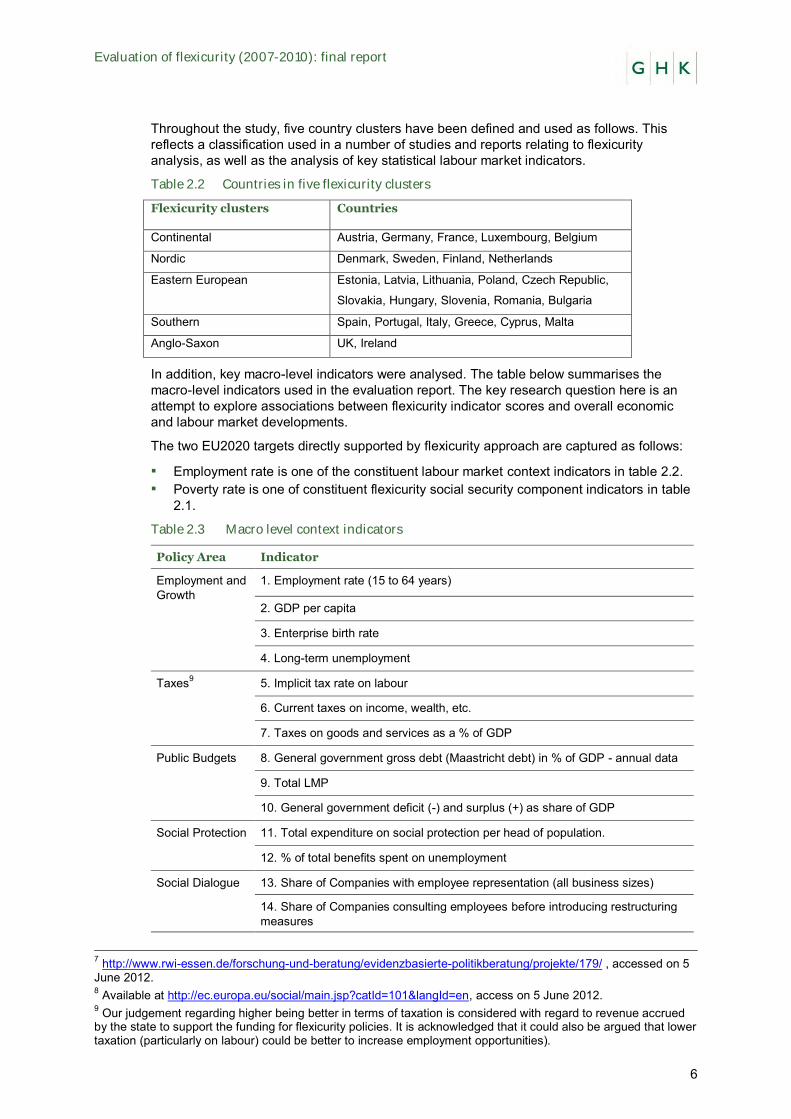
Throughout the study, five country clusters have been defined and used as follows. This reflects a classification used in a number of studies and reports relating to flexicurity analysis, as well as the analysis of key statistical labour market indicators.
Table 2.2 Countries in five flexicurity clusters
Flexicurity clusters
Countries
Continental Austria, Germany, France, Luxembourg, Belgium
Nordic Denmark, Sweden, Finland, Netherlands
Eastern European Estonia, Latvia, Lithuania, Poland, Czech Republic,
Slovakia, Hungary, Slovenia, Romania, Bulgaria
Southern Spain, Portugal, Italy, Greece, Cyprus, Malta
Anglo-Saxon UK, Ireland
In addition, key macro-level indicators were analysed. The table below summarises the macro-level indicators used in the evaluation report. The key research question here is an attempt to explore associations between flexicurity indicator scores and overall economic and labour market developments.
The two EU2020 targets directly supported by flexicurity approach are captured as follows:
▪ Employment rate is one of the constituent labour market context indicators in table 2.2. ▪ Poverty rate is one of constituent flexicurity social security component indicators in table
2.1.
Table 2.3 Macro level context indicators
Policy Area Indicator
Employment and Growth
1. Employment rate (15 to 64 years)
2. GDP per capita
3. Enterprise birth rate
4. Long-term unemployment
Taxes9 5. Implicit tax rate on labour
6. Current taxes on income, wealth, etc.
7. Taxes on goods and services as a % of GDP
Public Budgets 8. General government gross debt (Maastricht debt) in % of GDP - annual data
9. Total LMP
10. General government deficit (-) and surplus (+) as share of GDP
Social Protection 11. Total expenditure on social protection per head of population.
12. % of total benefits spent on unemployment
Social Dialogue 13. Share of Companies with employee representation (all business sizes)
14. Share of Companies consulting employees before introducing restructuring measures
7 http://www.rwi-essen.de/forschung-und-beratung/evidenzbasierte-politikberatung/projekte/179/ , accessed on 5 June 2012. 8 Available at http://ec.europa.eu/social/main.jsp?catId=101&langId=en, access on 5 June 2012. 9 Our judgement regarding higher being better in terms of taxation is considered with regard to revenue accrued by the state to support the funding for flexicurity policies. It is acknowledged that it could also be argued that lower taxation (particularly on labour) could be better to increase employment opportunities).
Evaluation of flexicurity (2007-2010): final report
7
Policy Area Indicator
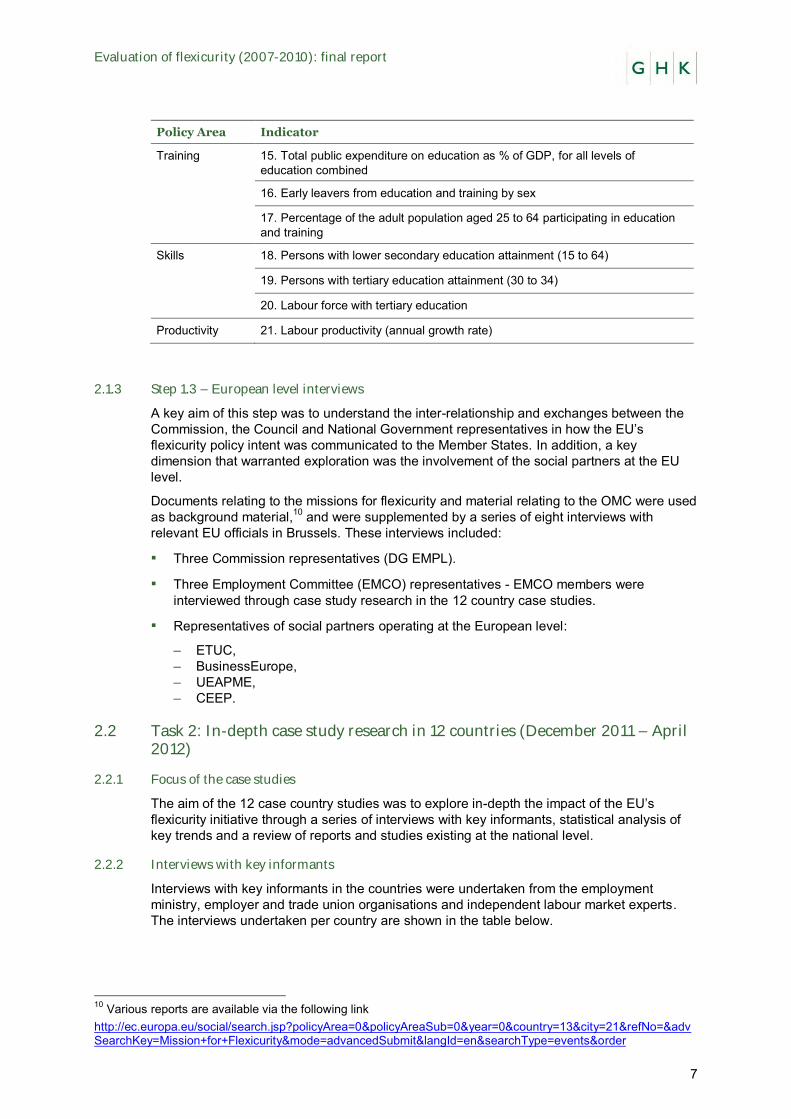
Training 15. Total public expenditure on education as % of GDP, for all levels of education combined
16. Early leavers from education and training by sex
17. Percentage of the adult population aged 25 to 64 participating in education and training
Skills 18. Persons with lower secondary education attainment (15 to 64)
19. Persons with tertiary education attainment (30 to 34)
20. Labour force with tertiary education
Productivity 21. Labour productivity (annual growth rate)
2.1.3 Step 1.3 – European level interviews
A key aim of this step was to understand the inter-relationship and exchanges between the Commission, the Council and National Government representatives in how the EU’s flexicurity policy intent was communicated to the Member States. In addition, a key dimension that warranted exploration was the involvement of the social partners at the EU level.
Documents relating to the missions for flexicurity and material relating to the OMC were used as background material,10 and were supplemented by a series of eight interviews with relevant EU officials in Brussels. These interviews included:
▪ Three Commission representatives (DG EMPL).
▪ Three Employment Committee (EMCO) representatives - EMCO members were interviewed through case study research in the 12 country case studies.
▪ Representatives of social partners operating at the European level:
– ETUC, – BusinessEurope, – UEAPME, – CEEP.
2.2 Task 2: In-depth case study research in 12 countries (December 2011 – April 2012)
2.2.1 Focus of the case studies
The aim of the 12 case country studies was to explore in-depth the impact of the EU’s flexicurity initiative through a series of interviews with key informants, statistical analysis of key trends and a review of reports and studies existing at the national level.
2.2.2 Interviews with key informants
Interviews with key informants in the countries were undertaken from the employment ministry, employer and trade union organisations and independent labour market experts. The interviews undertaken per country are shown in the table below.
10 Various reports are available via the following link http://ec.europa.eu/social/search.jsp?policyArea=0&policyAreaSub=0&year=0&country=13&city=21&refNo=&advSearchKey=Mission+for+Flexicurity&mode=advancedSubmit&langId=en&searchType=events&order
Evaluation of flexicurity (2007-2010): final report
8
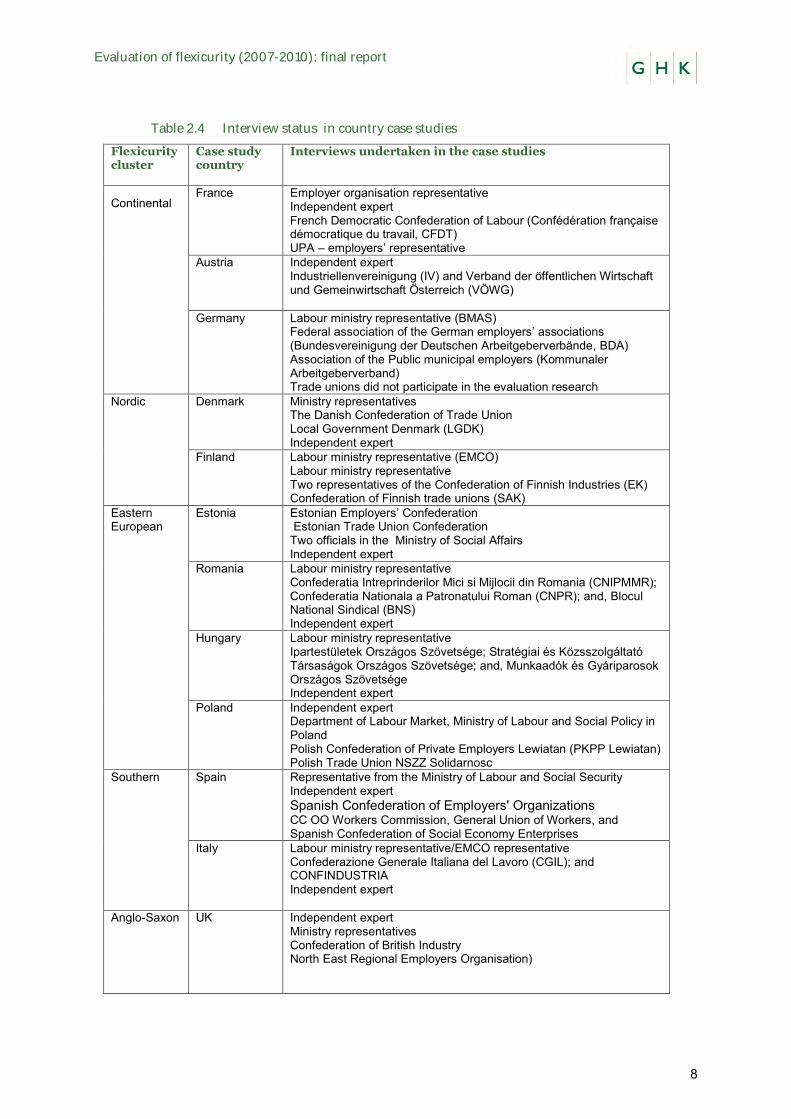
Table 2.4 Interview status in country case studies
Flexicurity cluster
Case study country
Interviews undertaken in the case studies
Continental France Employer organisation representative
Independent expert French Democratic Confederation of Labour (Confédération française démocratique du travail, CFDT) UPA – employers’ representative
Austria Independent expert Industriellenvereinigung (IV) and Verband der öffentlichen Wirtschaft und Gemeinwirtschaft Österreich (VÖWG)
Germany Labour ministry representative (BMAS) Federal association of the German employers’ associations (Bundesvereinigung der Deutschen Arbeitgeberverbände, BDA) Association of the Public municipal employers (Kommunaler Arbeitgeberverband) Trade unions did not participate in the evaluation research
Nordic Denmark Ministry representatives The Danish Confederation of Trade Union Local Government Denmark (LGDK) Independent expert
Finland Labour ministry representative (EMCO) Labour ministry representative Two representatives of the Confederation of Finnish Industries (EK) Confederation of Finnish trade unions (SAK)
Eastern European
Estonia Estonian Employers’ Confederation Estonian Trade Union Confederation Two officials in the Ministry of Social Affairs Independent expert
Romania Labour ministry representative Confederatia Intreprinderilor Mici si Mijlocii din Romania (CNIPMMR); Confederatia Nationala a Patronatului Roman (CNPR); and, Blocul National Sindical (BNS) Independent expert
Hungary Labour ministry representative Ipartestületek Országos Szövetsége; Stratégiai és Közsszolgáltató Társaságok Országos Szövetsége; and, Munkaadók és Gyáriparosok Országos Szövetsége Independent expert
Poland Independent expert Department of Labour Market, Ministry of Labour and Social Policy in Poland Polish Confederation of Private Employers Lewiatan (PKPP Lewiatan) Polish Trade Union NSZZ Solidarnosc
Southern Spain Representative from the Ministry of Labour and Social Security Independent expert Spanish Confederation of Employers' Organizations CC OO Workers Commission, General Union of Workers, and Spanish Confederation of Social Economy Enterprises
Italy Labour ministry representative/EMCO representative Confederazione Generale Italiana del Lavoro (CGIL); and CONFINDUSTRIA Independent expert
Anglo-Saxon UK Independent expert Ministry representatives Confederation of British Industry North East Regional Employers Organisation)
Evaluation of flexicurity (2007-2010): final report
9
2.2.3 Step 2.3 – Review of policy documentation and statistical profiles
In parallel to arranging and carrying out the stakeholder interviews, case study researchers reviewed key policy documents and statistical data pertinent to their national context to inform the completion of the country report, using the agreed template. Key policy documents reviewed included:
▪ 2008 NRPs (reviewed already in the scoping exercise), 2009 implementation report, 2010 draft NRP;
▪ Information available on the national flexicurity regimes from the EU level sources; ▪ Key employment, social policy, education policy statements for the evaluation reference
period (2007-2010) and up to 2012 in cases where there has been a change in government, equivalent information on the current policy context / programmes
▪ Laws/decisions/ notes underpinning key policy initiatives. ▪ Existing assessments/analyses/reflections of employment/social policy/education policy
changes in the 2007-2010 period. As a first source of information, SYSDEM experts’ assessments of the NRPs in 2008, 2009 and 2010 were used. The SYSDEM assessments provided pointers to other existing analyses.
▪ Relevant reports and academic papers at the national level, ▪ Relevant documents and statements issued by social partners at the national level.
Case study researchers reviewed and analysed trend data linked to the indicators identified in Table 2.1 under Task 1.2. For each indicator, the case researcher reflected on the following dimensions:
▪ Labour market evolution before 2007 and during the 2008-2010 period ▪ Performance relative to the Lisbon targets in the Member State ▪ Relative positioning of the Member State with respect to the EU-27 average.
2.2.4 Step 2.4 – Completion of the case study reports
Following the completion of stakeholder interviews and review of policy documentation and statistical profiles, case study researchers wrote the case study reports. These are provided as internal deliverables to DG EMPL. The report is a stand-alone document of 15-20 pages, plus annexes as appropriate, following a common structure agreed in the inception phase.
2.3 Task 3 – Preparation of examples of interesting practice (December 2011 – May 2012)
The aims of this task were:
▪ To provide examples of how the principles and vision of the EU’s flexicurity initiative have been put into practice in the Member States
▪ To demonstrate how national flexicurity pathways have been developed ▪ To identify cases where integrated flexicurity pathways have generated some labour
market impacts.
The suggestions for examples of interesting practice came from:
▪ Case study research– therefore, we explicitly asked the case study researchers to identify such examples;
▪ The results of the scoping exercise in all 27 Member States – with particular attention being paid to countries not selected for further case study research;
▪ Review of available EU level sources – e.g. the Eurofound 2011 report.
The examples of interesting practices cover:
▪ The common principles and the four components of flexicurity; ▪ Examples with well-documented impacts; ▪ Good geographical spread; ▪ Examples of significant innovation and relevance in a particular national context;
Evaluation of flexicurity (2007-2010): final report
10
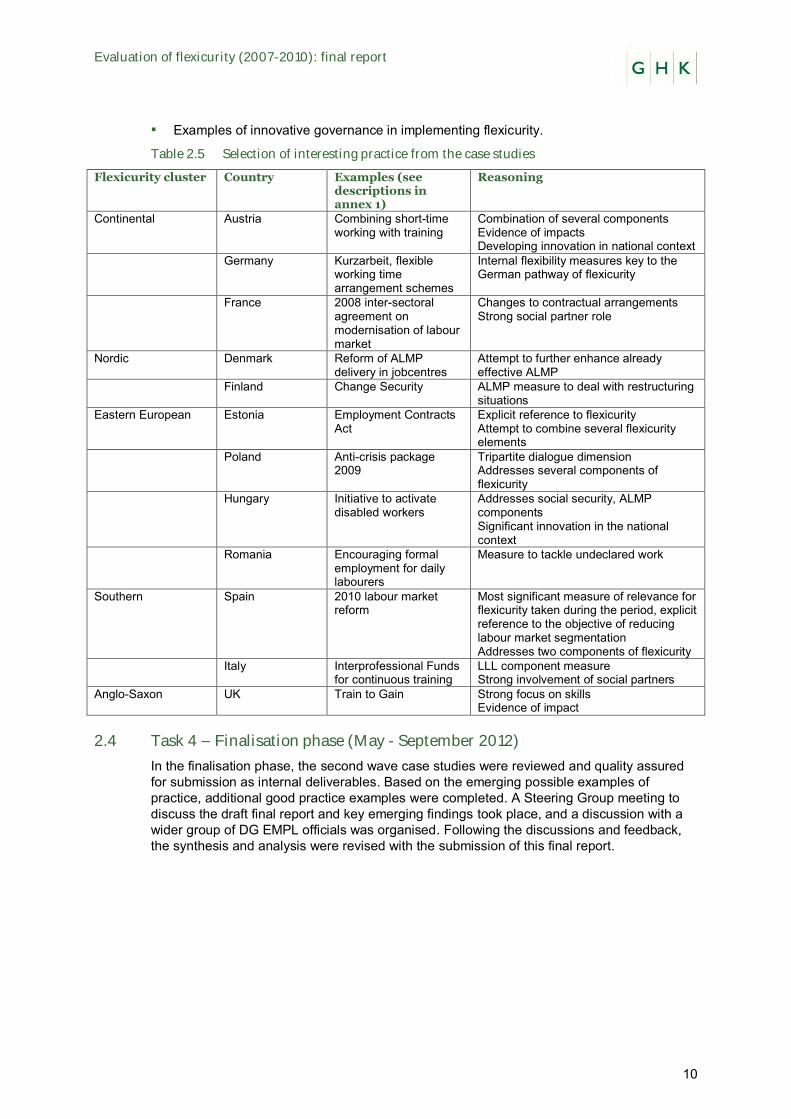
▪ Examples of innovative governance in implementing flexicurity.
Table 2.5 Selection of interesting practice from the case studies
Flexicurity cluster
Country Examples (see descriptions in annex 1)
Reasoning
Continental Austria Combining short-time working with training
Combination of several components Evidence of impacts Developing innovation in national context
Germany Kurzarbeit, flexible working time arrangement schemes
Internal flexibility measures key to the German pathway of flexicurity
France 2008 inter-sectoral agreement on modernisation of labour market
Changes to contractual arrangements Strong social partner role
Nordic Denmark Reform of ALMP delivery in jobcentres
Attempt to further enhance already effective ALMP
Finland Change Security ALMP measure to deal with restructuring situations
Eastern European Estonia Employment Contracts Act
Explicit reference to flexicurity Attempt to combine several flexicurity elements
Poland Anti-crisis package 2009
Tripartite dialogue dimension Addresses several components of flexicurity
Hungary Initiative to activate disabled workers
Addresses social security, ALMP components Significant innovation in the national context
Romania Encouraging formal employment for daily labourers
Measure to tackle undeclared work
Southern Spain 2010 labour market reform
Most significant measure of relevance for flexicurity taken during the period, explicit reference to the objective of reducing labour market segmentation Addresses two components of flexicurity
Italy Interprofessional Funds for continuous training
LLL component measure Strong involvement of social partners
Anglo-Saxon UK Train to Gain Strong focus on skills Evidence of impact
2.4 Task 4 – Finalisation phase (May - September 2012)
In the finalisation phase, the second wave case studies were reviewed and quality assured for submission as internal deliverables. Based on the emerging possible examples of practice, additional good practice examples were completed. A Steering Group meeting to discuss the draft final report and key emerging findings took place, and a discussion with a wider group of DG EMPL officials was organised. Following the discussions and feedback, the synthesis and analysis were revised with the submission of this final report.
Evaluation of flexicurity (2007-2010): final report
11
3 Understanding the concept of Flexicurity
At the EU level, the debate on flexicurity was inspired by a series of innovative labour market policy developments, coupled with favourable socio-economic performances, seen in Denmark and the Netherlands during the 1990s. After experiencing persistently high levels of unemployment, both of these countries entered the 1990s with some of the lowest unemployment rates in Europe – an achievement which was attributed to an increased emphasis on active labour market measures, combined with a moderate amount of employment protection and relatively generous unemployment benefits.
As its name suggests (a combination of flexibility and security), the concept of flexicurity is based on the idea that new forms of flexibility and security are needed both by individuals and companies. Flexicurity aims at enhancing, simultaneously and deliberately, the flexibility of labour markets, work organisations and labour relations on the one hand, and employment and income security and reconciliation of work and family life on the other hand. The overall objective of flexicurity is to facilitate transitions between jobs and tackle labour market segmentation, with a view to improve the functioning of labour markets in a context of constant and rapid change due to globalisation and technological advancements but also demographic and societal trends.
3.1 Flexicurity in the EU’s evolving policy landscape
Since the mid-2000s, flexicurity has been developed and refined as a policy concept through common work between the European Commission, the European Council, the Member States, social partners and academic experts.11
The key problem in 2007 was defined as a lack of deliberate integration of policies at the national level relating to different contractual arrangements, credible lifelong learning systems, active labour market policies, and modern social security systems. By 2007, few countries went beyond clustering separate measures under the new title of flexicurity. Member States did not use the concept of flexicurity to focus on the interaction of measures rather than on individual measures. The separate treatment of the individual measures did not exploit the complementarities and synergies between different policies and was considered less likely to be conducive to a set of consistent policies for achieving the employment targets within the Lisbon strategy.
This lack of an integrated approach was linked to segmented labour markets (increasingly so in some Member States), high long-term unemployment and/or a lack of adaptability on the labour markets in some Member States, which were hindering progress towards the achievement of the Lisbon strategy goals.
The establishment of common EU objectives and a framework which included common pathways, the exchange of good practice, and mutual learning between Member States in relation to flexicurity policies was expected to provide added value for the design and implementation of flexicurity policies at the national level. The June 2007 Communication recognised that this would require the establishment of carefully planned and negotiated combinations and sequences of policies and measures. Since Member States vary considerably in their socio-economic, cultural and institutional background, the specific combinations and sequences would also vary.
The expected impact from the EU action on flexicurity was that Member States would consider the relevant flexicurity pathway and design their own national flexicurity strategies that led to better combinations of flexibility and security. The EU flexicurity framework was expected to serve as an inspiration, mutual learning and benchmarking tool. Ultimately, following the adoption of national flexicurity strategies, problems identified in the contemporary labour markets were expected to be tackled. The impact of flexicurity was therefore expected to depend on how Member States would define their own policies, and on
11 An expert group on Flexicurity was set up by the Commission to elaborate proposals.
Evaluation of flexicurity (2007-2010): final report
12
how these nationally tailored policies are implemented. Expected impacts by individual Member State were not identified – consistent with the spirit of communication.
A series of broad common principles and different pathways were defined to take into account the different situations in Member States, their institutional settings, traditions (e.g. social dialogue), social protection systems, and budgetary constraints. ‘One size fits all' was ruled out as neither feasible nor optimal as it would require all Member States to act in one direction disregarding their different starting points and trajectories, set-up and labour market situations.
In recent EU policy documents, the Commission has defined flexicurity as “an integrated policy strategy to enhance both flexibility and security within the labour market”12. By 2008, flexicurity had become an integral part of the European Employment Strategy and Lisbon Strategy for Growth and Jobs, and therefore a central plank of the Commission’s labour market policy guidelines to Member States.
In 2007, the Commission issued a Communication ‘Towards Common Principles of Flexicurity’, which aimed to raise awareness in the Member States of the benefits of introducing flexicurity arrangements for those in work and those out of work.
The June 2007 Communication outlined four inter-related components of flexicurity, which comprise:
▪ Flexible and secure contractual arrangements from the point of view of both employer and worker;
▪ Lifelong learning strategies in order to ensure workers' ongoing capacity to adapt, and increase their employability;
▪ Effective active labour market policies in order to facilitate transitions to new jobs;
▪ Modern social security systems providing adequate income support during transitions.
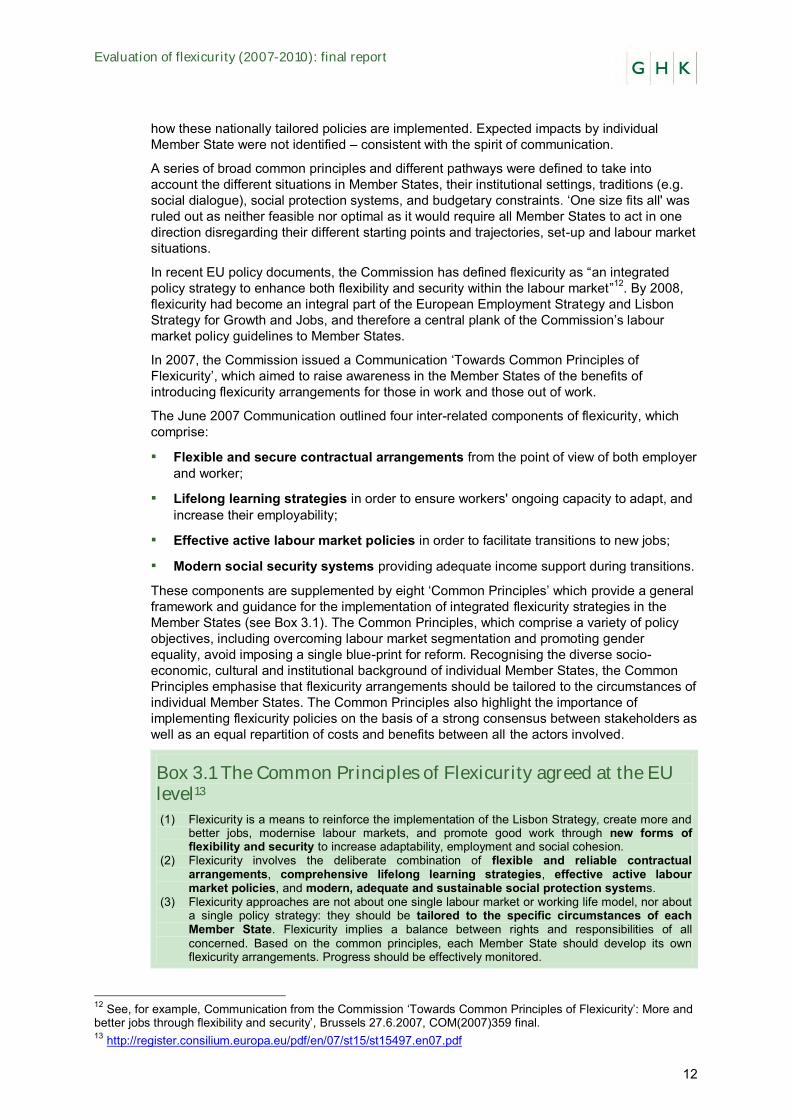
These components are supplemented by eight ‘Common Principles’ which provide a general framework and guidance for the implementation of integrated flexicurity strategies in the Member States (see Box 3.1). The Common Principles, which comprise a variety of policy objectives, including overcoming labour market segmentation and promoting gender equality, avoid imposing a single blue-print for reform. Recognising the diverse socio-economic, cultural and institutional background of individual Member States, the Common Principles emphasise that flexicurity arrangements should be tailored to the circumstances of individual Member States. The Common Principles also highlight the importance of implementing flexicurity policies on the basis of a strong consensus between stakeholders as well as an equal repartition of costs and benefits between all the actors involved.
Box 3.1 The Common Principles of Flexicurity agreed at the EU level13
(1) Flexicurity is a means to reinforce the implementation of the Lisbon Strategy, create more and better jobs, modernise labour markets, and promote good work through new forms of flexibility and security to increase adaptability, employment and social cohesion.
(2) Flexicurity involves the deliberate combination of flexible and reliable contractual arrangements, comprehensive lifelong learning strategies, effective active labour market policies, and modern, adequate and sustainable social protection systems.
(3) Flexicurity approaches are not about one single labour market or working life model, nor about a single policy strategy: they should be tailored to the specific circumstances of each Member State. Flexicurity implies a balance between rights and responsibilities of all concerned. Based on the common principles, each Member State should develop its own flexicurity arrangements. Progress should be effectively monitored.
12 See, for example, Communication from the Commission ‘Towards Common Principles of Flexicurity’: More and better jobs through flexibility and security’, Brussels 27.6.2007, COM(2007)359 final. 13 http://register.consilium.europa.eu/pdf/en/07/st15/st15497.en07.pdf
Evaluation of flexicurity (2007-2010): final report
13
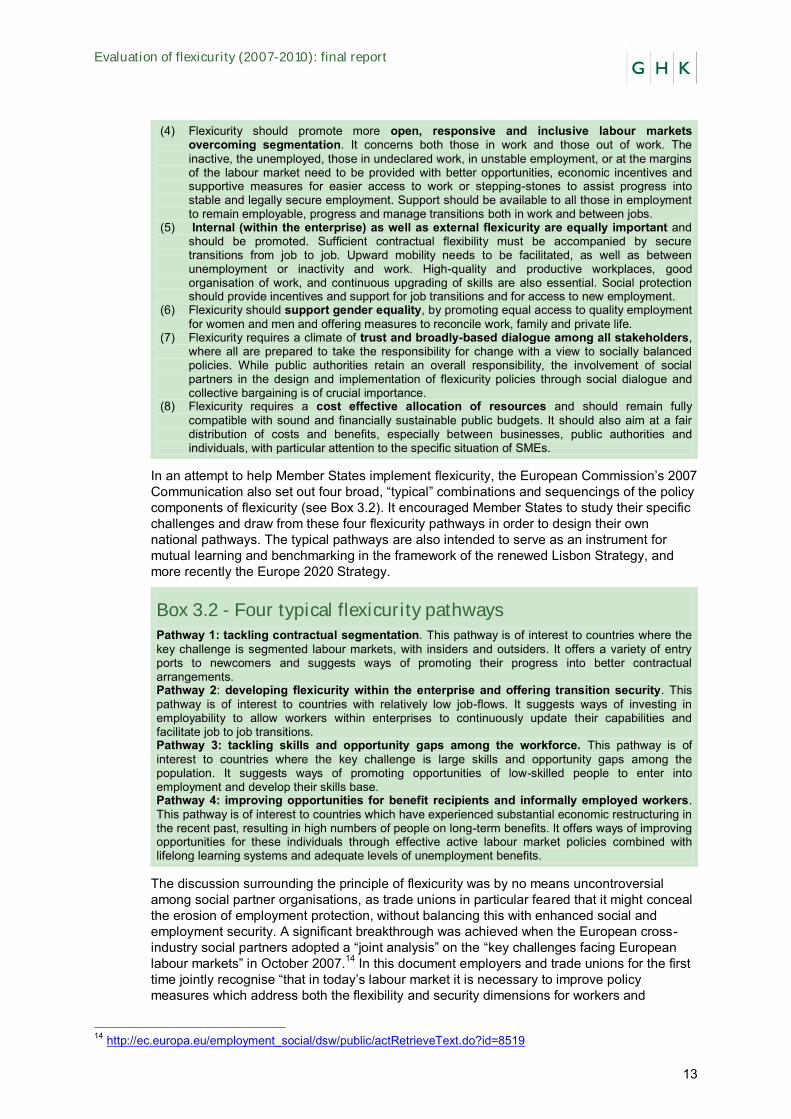
(4) Flexicurity should promote more open, responsive and inclusive labour markets overcoming segmentation. It concerns both those in work and those out of work. The inactive, the unemployed, those in undeclared work, in unstable employment, or at the margins of the labour market need to be provided with better opportunities, economic incentives and supportive measures for easier access to work or stepping-stones to assist progress into stable and legally secure employment. Support should be available to all those in employment to remain employable, progress and manage transitions both in work and between jobs.
(5) Internal (within the enterprise) as well as external flexicurity are equally important and should be promoted. Sufficient contractual flexibility must be accompanied by secure transitions from job to job. Upward mobility needs to be facilitated, as well as between unemployment or inactivity and work. High-quality and productive workplaces, good organisation of work, and continuous upgrading of skills are also essential. Social protection should provide incentives and support for job transitions and for access to new employment.
(6) Flexicurity should support gender equality, by promoting equal access to quality employment for women and men and offering measures to reconcile work, family and private life.
(7) Flexicurity requires a climate of trust and broadly-based dialogue among all stakeholders, where all are prepared to take the responsibility for change with a view to socially balanced policies. While public authorities retain an overall responsibility, the involvement of social partners in the design and implementation of flexicurity policies through social dialogue and collective bargaining is of crucial importance.
(8) Flexicurity requires a cost effective allocation of resources and should remain fully compatible with sound and financially sustainable public budgets. It should also aim at a fair distribution of costs and benefits, especially between businesses, public authorities and individuals, with particular attention to the specific situation of SMEs.
In an attempt to help Member States implement flexicurity, the European Commission’s 2007 Communication also set out four broad, “typical” combinations and sequencings of the policy components of flexicurity (see Box 3.2). It encouraged Member States to study their specific challenges and draw from these four flexicurity pathways in order to design their own national pathways. The typical pathways are also intended to serve as an instrument for mutual learning and benchmarking in the framework of the renewed Lisbon Strategy, and more recently the Europe 2020 Strategy.
Box 3.2 - Four typical flexicurity pathways
Pathway 1: tackling contractual segmentation. This pathway is of interest to countries where the key challenge is segmented labour markets, with insiders and outsiders. It offers a variety of entry ports to newcomers and suggests ways of promoting their progress into better contractual arrangements. Pathway 2: developing flexicurity within the enterprise and offering transition security. This pathway is of interest to countries with relatively low job-flows. It suggests ways of investing in employability to allow workers within enterprises to continuously update their capabilities and facilitate job to job transitions. Pathway 3: tackling skills and opportunity gaps among the workforce. This pathway is of interest to countries where the key challenge is large skills and opportunity gaps among the population. It suggests ways of promoting opportunities of low-skilled people to enter into employment and develop their skills base. Pathway 4: improving opportunities for benefit recipients and informally employed workers. This pathway is of interest to countries which have experienced substantial economic restructuring in the recent past, resulting in high numbers of people on long-term benefits. It offers ways of improving opportunities for these individuals through effective active labour market policies combined with lifelong learning systems and adequate levels of unemployment benefits.
The discussion surrounding the principle of flexicurity was by no means uncontroversial among social partner organisations, as trade unions in particular feared that it might conceal the erosion of employment protection, without balancing this with enhanced social and employment security. A significant breakthrough was achieved when the European cross-industry social partners adopted a “joint analysis” on the “key challenges facing European labour markets” in October 2007.14 In this document employers and trade unions for the first time jointly recognise “that in today’s labour market it is necessary to improve policy measures which address both the flexibility and security dimensions for workers and
14 http://ec.europa.eu/employment_social/dsw/public/actRetrieveText.do?id=8519
Evaluation of flexicurity (2007-2010): final report
14
employers alike. Applied in the right way, the flexicurity approach can create a win-win situation and can be equally beneficial to employers and employees”.15 The document effectively endorsed the four key components of flexicurity, while emphasising the key role to be played by social partners in implementing approaches adapted to different requirements at the national level.
In the same document the European cross-industry social partners called upon national governments to review and if necessary adjust labour law, employment and social policy frameworks with view to:
▪ Ensuring an optimal balance between flexibility and security for all employment relationships. Provide adequate security for workers under all forms of contracts in order to tackle segmented labour markets;
▪ Enhancing legal certainty and transparency for both employers and workers with regard to the scope, coverage and the enforcement of labour law;
▪ Developing complementary employment security measures promoting transitions into productive and rewarding jobs;
▪ Implementing and respect at the national level the principles and rules of European social directives, including those deriving from a framework agreement among European Social Partners, as well as the basic principles of equal treatment and non-discrimination;
▪ Promoting stable employment relationships and sustainable labour market practices; ▪ Putting in place a framework to develop work place practices improving the work/life
balance and in this way promoting full use of the productive potential of the European labour force.
In December 2007, the Employment and Social Affairs Council adopted, with minor amendments, the Commission’s eight Common Principles,16 and called on the Member States to take them into account in drawing up and implementing ‘national flexicurity pathways’. The European Council of 14 December 2007 also endorsed the Common Principles and invited the Member States to explain, in their National Reform Programmes, the national arrangements with which they would give them effect. 17 The same message was reiterated in the Presidency conclusions of the European Council on Growth and Employment held on 13-14 March 2008, where a new three-year cycle of the Lisbon Strategy was launched.18
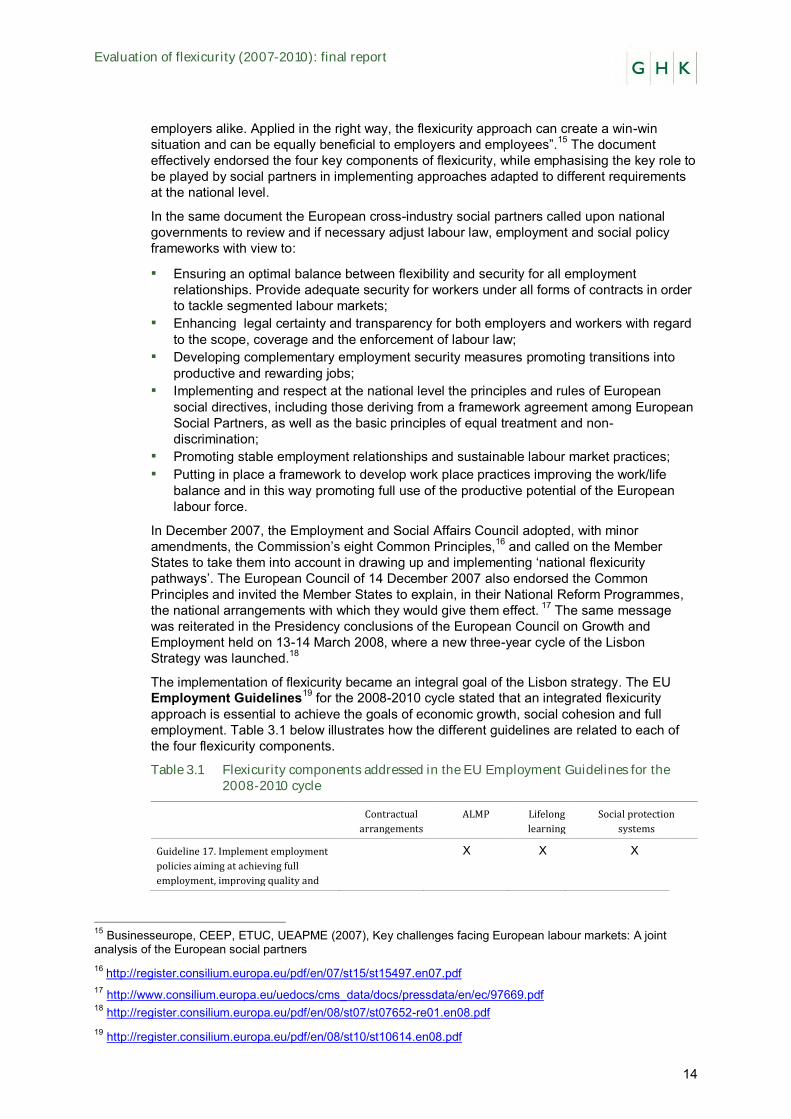
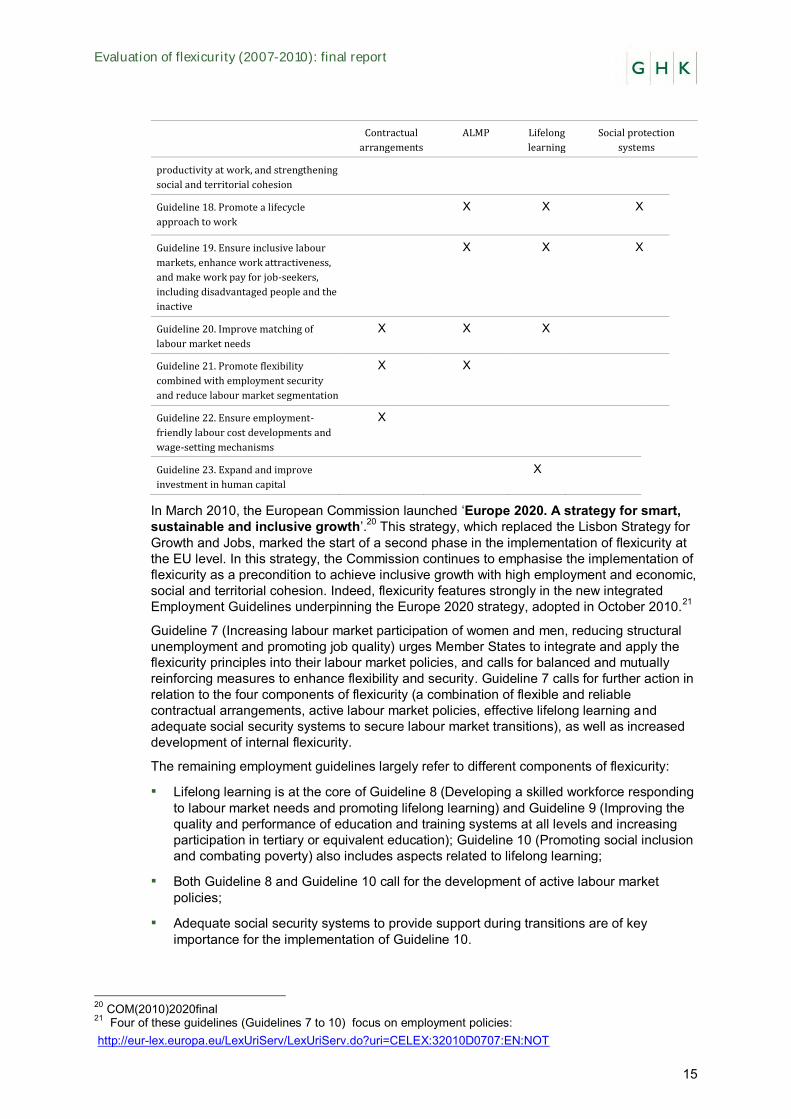
The implementation of flexicurity became an integral goal of the Lisbon strategy. The EU Employment Guidelines19 for the 2008-2010 cycle stated that an integrated flexicurity approach is essential to achieve the goals of economic growth, social cohesion and full employment. Table 3.1 below illustrates how the different guidelines are related to each of the four flexicurity components.
Table 3.1 Flexicurity components addressed in the EU Employment Guidelines for the 2008-2010 cycle
Contractual
arrangements
ALMP Lifelong
learning
Social protection
systems
Guideline 17. Implement employment
policies aiming at achieving full
employment, improving quality and
X X X
15 Businesseurope, CEEP, ETUC, UEAPME (2007), Key challenges facing European labour markets: A joint analysis of the European social partners 16
http://register.consilium.europa.eu/pdf/en/07/st15/st15497.en07.pdf 17 http://www.consilium.europa.eu/uedocs/cms_data/docs/pressdata/en/ec/97669.pdf 18 http://register.consilium.europa.eu/pdf/en/08/st07/st07652-re01.en08.pdf 19 http://register.consilium.europa.eu/pdf/en/08/st10/st10614.en08.pdf
Evaluation of flexicurity (2007-2010): final report
15
Contractual
arrangements
ALMP Lifelong
learning
Social protection
systems
productivity at work, and strengthening
social and territorial cohesion
Guideline 18. Promote a lifecycle
approach to work X X X
Guideline 19. Ensure inclusive labour
markets, enhance work attractiveness,
and make work pay for job-seekers,
including disadvantaged people and the
inactive
X X X
Guideline 20. Improve matching of
labour market needs X X X
Guideline 21. Promote flexibility
combined with employment security
and reduce labour market segmentation
X X
Guideline 22. Ensure employment-
friendly labour cost developments and
wage-setting mechanisms
X
Guideline 23. Expand and improve
investment in human capital
X
In March 2010, the European Commission launched ‘Europe 2020. A strategy for smart, sustainable and inclusive growth’.20 This strategy, which replaced the Lisbon Strategy for Growth and Jobs, marked the start of a second phase in the implementation of flexicurity at the EU level. In this strategy, the Commission continues to emphasise the implementation of flexicurity as a precondition to achieve inclusive growth with high employment and economic, social and territorial cohesion. Indeed, flexicurity features strongly in the new integrated Employment Guidelines underpinning the Europe 2020 strategy, adopted in October 2010.21
Guideline 7 (Increasing labour market participation of women and men, reducing structural unemployment and promoting job quality) urges Member States to integrate and apply the flexicurity principles into their labour market policies, and calls for balanced and mutually reinforcing measures to enhance flexibility and security. Guideline 7 calls for further action in relation to the four components of flexicurity (a combination of flexible and reliable contractual arrangements, active labour market policies, effective lifelong learning and adequate social security systems to secure labour market transitions), as well as increased development of internal flexicurity.
The remaining employment guidelines largely refer to different components of flexicurity:
▪ Lifelong learning is at the core of Guideline 8 (Developing a skilled workforce responding to labour market needs and promoting lifelong learning) and Guideline 9 (Improving the quality and performance of education and training systems at all levels and increasing participation in tertiary or equivalent education); Guideline 10 (Promoting social inclusion and combating poverty) also includes aspects related to lifelong learning;
▪ Both Guideline 8 and Guideline 10 call for the development of active labour market policies;
▪ Adequate social security systems to provide support during transitions are of key importance for the implementation of Guideline 10.
20 COM(2010)2020final 21 Four of these guidelines (Guidelines 7 to 10) focus on employment policies: http://eur-lex.europa.eu/LexUriServ/LexUriServ.do?uri=CELEX:32010D0707:EN:NOT
Evaluation of flexicurity (2007-2010): final report
16
3.2 Implementing Flexicurity at the national level 2007-2010
The 27 EU Member States are characterised by very different modalities and combinations of flexibility and security elements.22 These differences reflect the diversity of European ‘employment regimes’, which create a path dependence process with far-reaching consequences for EU efforts to promote the flexicurity approach.
Most observers identify five different flexicurity regimes within the European Union. The following approach, based on five country clusters, has been adopted in this evaluation23:
▪ The Anglo-Saxon system, including the UK and Ireland, features a high degree of flexibility, relatively low security and low taxation. These countries have looser employment protection legislation, making it easier for enterprises to restructure in the face of changing economic circumstances. Their high degree of flexibility results in higher numbers of people in temporary and/or atypical forms of employment. Countries in this cluster spend intermediate-to-low amounts on labour market policies aimed at helping the unemployed back to work. Cash transfers are primarily oriented to people of working age, with access to benefits linked to regular employment. The model is characterised by weak unions, low rates of unemployment and comparatively high disparities in wages.
▪ The Continental system, including Austria, Germany, France, Luxembourg and Belgium, is characterised by intermediate-to-low flexibility, intermediate-to-high security and intermediate-to-high taxation. These countries rely extensively on insurance-based benefits and have stricter employment protection legislation. Although union membership is in decline in most countries, the unions remain strong and are regularly included in processes of decision-making and implementation. These countries tend to have higher levels of long-term unemployment than the Anglo-Saxon countries but, thanks to higher levels of redistribution via taxes and transfers, they have lower numbers of people in or at risk of poverty.
▪ The Nordic system, comprising Denmark, Netherlands, Sweden and Finland, is characterised by high security, intermediate-to-high flexibility and intermediate-to-high taxation. These countries have Europe’s highest levels of social protection expenditure and universal welfare provision. The strictness of employment protection legislation is low, but extensive active labour market policies combine with generous social assistance to produce comparatively high levels of employment, low long-term unemployment rates, high job-turn over and a much higher sense of security among the population than in other European countries. Social partners tend to play an important role in decision-making.
▪ The Mediterranean system, including Spain, Italy, Portugal, Greece, Cyprus and Malta, features low flexibility, relatively low security, and no clear pattern of taxation. These countries generally have strict employment protection legislation for workers on open-ended contracts, while a growing number of people with part-time and/or fixed-term contracts (especially women, ethnic minorities and the young) enjoy very little if any employment security at all. The social protection expenditure of these countries tends to be concentrated on old-age pensions, with low coverage of unemployment benefits. Countries in this system reveal high levels of unemployment and a wider incidence of poverty and social exclusion.
▪ The Eastern European system, including the Baltic States, Poland, Hungary, Czech Republic, Slovakia, Slovenia, Romania and Bulgaria are characterised by insecurity, intermediate-to-high flexibility and intermediate-to-high taxation. With lower levels of
22 European Commission, Employment in Europe, 2006; Philips, K. and Eamets, R. Approaches to Flexicurity: EU models, European Foundation for the Improvement of Living and Working Conditions: Luxembourg, 2007. 23 The following is the categorisation of Flexicurity regimes used by the European Commission in Employment in Europe, 2006. However, the description of each regime draws especially from Sapir, A. “Globalization and the Reform of European Social Models”, 2005.
Evaluation of flexicurity (2007-2010): final report
17
employment protection legislation than the Mediterranean system, the provision of social assistance in these countries is also weaker. The countries in this system tend to have high long-term unemployment rates, with unemployment particularly high among older people.
One of the important aspects highlighted in the initial Commission Communication on flexicurity, and re-iterated subsequently, is the importance of the involvement of social partner organisations in giving shape to flexicurity policies and their implementation. The findings of project implemented by the European cross-industry social partners between 2010/2011 on the Implementation of the Flexicurity Concept in the EU24 concludes that in reality the level of this involvement has depended very much on existing traditions of social dialogue and social partner involvement and cultures of labour relations. As a result, the integration of social partners in decision making process was rather weak or symbolic in some countries, while in others employer and trade union organisations have played a leading role in shaping reforms. The research which accompanied the cross-industry social partners’ project also provides some important insights into the perception of the success of the implementation of the flexicurity concept at the national level. While overall 82% of social partner respondents to a survey (66% of trade unions and 96% of employers) confirmed that view that a balanced flexicurity approach could lead to a win-win situation, 84% of trade unions felt that in its national implementation, flexicurity was yet to prove itself as a balanced approached. On the other hand 66% of employers’ organisations argued that a fair degree of balance was already being achieved, thus highlighting remaining divergences in views regarding the nature of the national implementation of the flexicurity concept.
3.3 Flexicurity during the economic crisis and beyond
While the Common Principles of Flexicurity were elaborated in a period of economic prosperity, from the end of 2008 they were put to the test by the financial and economic crisis and the rapidly deteriorating labour market context. The impact of the economic crisis on the flexicurity debate has been twofold. On the one hand, it served to further expose the structural weaknesses which the flexicurity agenda is intended to tackle, in particular Europe’s ageing workforce and increasing labour market segmentation. On the other hand, by severely constraining the spending power of Member States, the economic crisis has raised questions about the viability of introducing flexicurity arrangements in a fair and balanced way.
The potential contribution of flexicurity to the promotion of growth and employment in more difficult economic conditions has been highlighted by the Commission in numerous policy documents. In its November 2008 ‘European Economic Recovery Plan’,25 the Commission stressed that the implementation of integrated flexicurity policies is essential to promote employability, ensure rapid re-integration into the labour market of workers who have been made redundant and avoid long term unemployment. In its Communication ‘A Shared Commitment for Employment’26 released in June 2009, the Commission likewise recalled that flexicurity remained the right approach to modernise and foster the adaptability of labour markets in the context of the crisis, increase competitiveness and prepare for recovery.
At the same time, however, the Commission has acknowledged that the economic crisis and post-crisis recovery in Europe raises challenging questions for the flexicurity agenda.27 One concern is how to finance flexicurity, including the provision of adequate social protection and high levels of spending on ALMPs, during a period of severe budgetary constraints when the pool of unemployed in need of support is rising. In these circumstances, social
24 For more information see http://www.erc-online.eu/content/default.asp?PageID=514 25 COM (2008) 800 final 26 COM(2009) 257 final 27 Overcoming these challenges was the subject of a High-Level Stakeholder Conference on Flexicurity, organised by the Commission on 14 November 2011. See http://ec.europa.eu/social/main.jsp?langId=en&catId=102&furtherEvents=yes
Evaluation of flexicurity (2007-2010): final report
18
protection measures often need to be enhanced at the very moment when public spending needs to be tightened, raising questions about how unemployment benefits and other forms of income support can be financed and made more efficient. Emphasis is therefore placed on ensuring unemployment and social insurance systems build up sufficient resources in times of economic growth to allow them to be adapted to changing requirements in an economic downturn (for example by extending entitlement periods to avoid social hardship).
The question of how lifelong learning is financed also becomes more pressing during a crisis. Prior to the crisis, there was a growing consensus that employers, and even the workers themselves, should co-invest in education and training activities, where necessary and for certain target groups with the support of the state. However, during a crisis, there is a risk that companies facing constraints on resources will not be able to address the training needs of employees. One of the main concerns during the crisis (and in some countries to date) was the rise in youth unemployment. The Commission’s Flagship initiative “Youth on the Move” therefore called for the implementation of a training guarantee to prevent damaging long-term youth unemployment. In connection with the debate on ALMP, in a constrained labour market, it is therefore worthwhile considering the precise balance and implementation of “train first” versus “work first” approaches and, as will be shown below, the exploitation of the opportunity to enhance the skills of workers during times of reduced labour demand, without having to resort to redundancies.
Another key question raised by the economic crisis is how to ensure that activation measures - the ALMP component of flexicurity – can be financed and remain effective notwithstanding the slump in demand for workers (and hence skills). In other words, the challenge is to ensure that spending on activation measures remains effective even in an economic climate where the creation of jobs is difficult. In these circumstances, are certain ALMP tools more effective than others? Here it is important to note that one of the measures widely used during the crisis- that of short-time working - is widely considered as a good example of a flexicurity measure encouraging employment security while enabling companies to quickly exploit growth opportunities when they arise, as they will have been able to retain their skilled staff. Efforts were also made, with somewhat mixed results, to combine short-time working with training and skills enhancement initiatives – in principle another positive example of the use of a combined flexicurity approach.
The crisis may also lead to an over-emphasis on flexibility in governments’ reform efforts at the expense of job and/or income security. Indeed, there is a danger that, in the absence of security, measures introduced to increase the flexibility of labour markets will harm the people and working conditions they are designed to protect, reflecting the concerns of ETUC prior to the introduction of the common principles.28 There has, in particular, been increasing concern about growing labour market segmentation resulting from the rise in the use of (involuntary) temporary employment and the successive fixed-term contracts, which – rather than acting as a stepping stone – can trap workers for many years in precarious employment. This leads not only to low job security, reduced opportunities for career advancement and wage progression, reduced access to training but also has an impact on wider opportunities, for example to access a mortgage, save for a pension or make long-term decisions about family formation. One of the ideas that has been muted to address the issue of labour market segmentation is that of the “single open ended contract”, designed to encourage employers to offer such arrangements by phasing in employment protections gradually as seniority increases.
In the face of growing economic uncertainty, trade unions in many Member States may also have become more resistant to the introduction of measures intended to promote labour market flexibility. This highlights the challenge of designing effective governance strategies for implementing flexicurity in times of crisis, when governments must take decisive steps to strengthen the economy while continuing to involve the social partners in the design and implementation of reforms. The findings of a survey carried out as part of the above mentioned cross-industry social partner project on flexicurity may therefore prove some
28 Bekker, S (2011) Flexicurity – explaining the development of a European concept
Evaluation of flexicurity (2007-2010): final report
19
cause for concern as it demonstrates a clear divergence of opinion regarding the quality of social partner involvement in decision making on flexicurity policies as a result of the crisis. While 64% of employers’ organisations felt that the role of social partners had increased during the crisis, around 65% of trade union organisations argued that their influence and involvement had declined. The latter is particularly linked to a perception in the context of the crisis there has been growing pressure towards labour market liberalisation without counterbalancing efforts to achieve greater employment and social security. It is particularly in countries hardest hit by the crisis, where trade unions felt disengaged and feared that efforts to work towards balanced and consensus politics and policies had declined.
In addition to reiterating the importance of implementing flexicurity as a precondition for achieving ‘smart, sustainable and inclusive growth’, the Europe 2020 strategy acknowledged the need to reflect on how flexicurity, as defined during the first phase, may need to be adjusted to continue to support the reform efforts of Member States. Indeed, one of Europe 2020’s flagship initiatives, presented in the Commission’s November 2010 Communication 'An Agenda for new skills and jobs: A European contribution towards full employment’29, is to initiate a ‘new momentum for flexicurity.’30 This Communication, while confirming the validity of the approach of the Common Principles of Flexicurity, acknowledged the relatively limited progress in their implementation at the national level. It stressed that the combination of the four components of flexicurity must be significantly strengthened and adapted to the new socio-economic context in partnership with Member States and social partners.
To achieve such objectives, the Communication highlighted a series of priorities in connection with each of the four components of flexicurity and proposed some key actions at EU level. In relation to contractual arrangements, the new priorities included focusing on reducing labour market segmentation, including by making greater use of open-ended contracts (see also reference to the single open ended contract above) and putting greater weight on internal flexibility to help employers adjust labour input to the temporary fall in demand while preserving jobs. In relation to life-long learning, the Communication highlighted the importance of introducing more flexible learning pathways, targeting approaches for the more vulnerable workers, and enhancing stakeholder involvement in the implementation of training. In relation to ALMP, the Communication emphasised the need to adapt the mix of activation measures and their institutional setting to reduce the risk of long-term unemployment. And in relation to social protection, the Communication called for a new emphasis on reforming unemployment benefit systems, improving their coverage for those most at risk and reviewing pension systems to ensure adequate pensions for those with gaps in their contributions.
The Communication also highlighted, as an overarching priority, the need to strengthen the involvement of the social partners and the role of labour market institutions, in particular Public Employment Services (PES), in the design and delivery of flexicurity policies.
In April 2012, with EU unemployment reaching record levels and forecasts of a grim economic outlook, the European Commission adopted a new “Employment Package”. Building on the Employment Guidelines, this consisted of a Communication ‘Towards a job-rich recovery’31 and a series of Staff Working Documents which identify actions requiring particular emphasis in order to put employment reforms in motion.
Flexicurity is mentioned in the Communication as “an important policy milestone in building dynamic labour markets” by putting Member States on “a firm path of integrated structural labour market reforms”. While acknowledging that, during the crisis, the move toward “greater flexibility and security” has often stalled, the Communication identifies measures which can help MS proceed with flexicurity-style reforms while adjusting to the crisis. These include, among others, creative forms of company restructuring to limit job losses and shift
29 COM( 2010)682 final 30 The other priorities of the flagship initiative are equipping people with the right skills for employment, improving job quality and working conditions and supporting job creation. 31 Commission Communication “Towards a job-rich recovery” Strasbourg, 18.4.2012 COM(2012) 173 final.
Evaluation of flexicurity (2007-2010): final report
20
displaced workers to different jobs, pooling resources by groups of employers, and the use of internal flexibility mechanisms (such as short-time working arrangements) in the context of social dialogue.
The role of flexicurity in generating employment and economic growth is explored in greater detail in the Commission Staff Working Document, ‘Open, dynamic and inclusive labour markets’.32 This document reviews the integration of flexicurity in national policies so far and identifies five country clusters which share commonalities in their approach to flexicurity. Through an analysing of the labour market performance of these country clusters, the document concludes that countries that reformed their systems with a focus on both flexibility and security performed better. The document also finds that internal flexibility measures are as important as external ones and that the involvement of social partners is a crucial ingredient for successful reforms.
The evaluation findings presented in the following sections of the final report should help to inform the process of further flexicurity policy development by providing information on the following questions:
▪ Given public budgetary constraints, how have governments implemented flexicurity pathways and did the flexicurity approach remain valid in the crisis context?
▪ What was the role of the social dialogue in implementing flexicurity? Have reforms been adopted following negotiations, how do social partners perceive flexicurity and what is the role of social partners in implementing flexicurity?
▪ Has the pre-2007 situation changed – have countries changed their flexicurity regime/cluster during this period?
32 Commission Staff Working Document on “open, dynamic and inclusive labour markets” accompanying the above Communication (SWD(2012) 97 final).

Evaluation of flexicurity (2007-2010): final report
21
4 Impact of the Communication and Common Principles on national policy making
4.1 Introduction
In this section, the impact of the first phase of the EU’s flexicurity initiative on national policy making is analysed. The analysis is based on:
▪ 2008-2010 National Reform Programmes (NRPs) which were launched by the Member States in 2008 and were expected to respond, inter alia, to the EU initiative of flexicurity launched in 2007,
▪ Views of stakeholders expressed through case study research in 12 countries,
▪ Relevant findings from the country case studies.
The analysis in this section focuses on whether, and to what extent, the EU’s flexicurity initiative has had an impact on:
▪ The emergence of integrated flexicurity approaches at national level,
▪ Policy and political debates at national level,
▪ Monitoring and governance arrangements,
▪ The implementation of major employment and social policy reforms after 2007, including policies adopted in order to mitigate the impact of the crisis.
It then assesses the main strengths and weakness of the different national approaches to flexicurity (or, where explicit flexicurity policies do not exist, to the main flexicurity-relevant challenges).
4.2 Emergence of flexicurity as an overarching strategy combining the four elements
4.2.1 The balance in the national policy making between improving flexibility and security
The Figure below shows divided stakeholder views as to whether flexicurity in their countries is implemented as a balanced approach between the four key components. Almost an equal number of stakeholders agreed and disagreed with such statement, indicating the diverging views on the balanced approaches to flexicurity in their countries. Government and employer organisation representatives were more positive about the balance, and trade unions and independent experts more critical as to whether such balanced approach is indeed implemented.
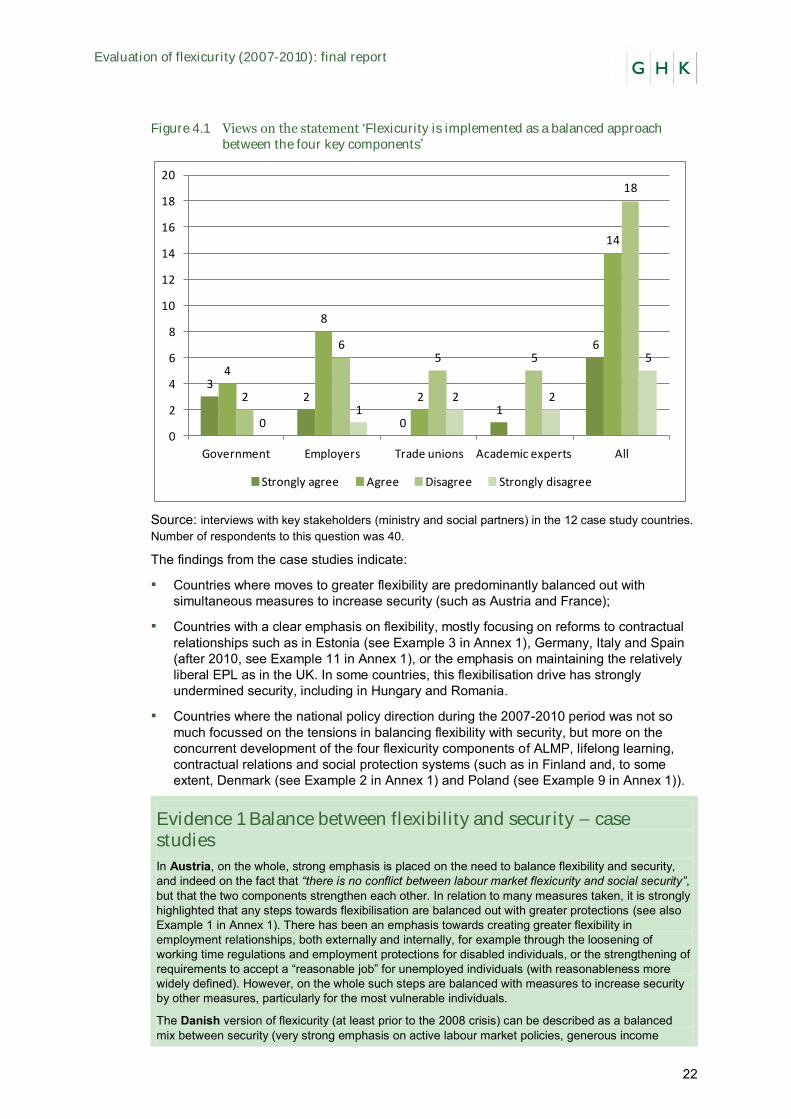
Evaluation of flexicurity (2007-2010): final report
22
Figure 4.1 Views on the statement ‘Flexicurity is implemented as a balanced approach between the four key components’
Source: interviews with key stakeholders (ministry and social partners) in the 12 case study countries. Number of respondents to this question was 40.
The findings from the case studies indicate:
▪ Countries where moves to greater flexibility are predominantly balanced out with simultaneous measures to increase security (such as Austria and France);
▪ Countries with a clear emphasis on flexibility, mostly focusing on reforms to contractual relationships such as in Estonia (see Example 3 in Annex 1), Germany, Italy and Spain (after 2010, see Example 11 in Annex 1), or the emphasis on maintaining the relatively liberal EPL as in the UK. In some countries, this flexibilisation drive has strongly undermined security, including in Hungary and Romania.
▪ Countries where the national policy direction during the 2007-2010 period was not so much focussed on the tensions in balancing flexibility with security, but more on the concurrent development of the four flexicurity components of ALMP, lifelong learning, contractual relations and social protection systems (such as in Finland and, to some extent, Denmark (see Example 2 in Annex 1) and Poland (see Example 9 in Annex 1)).
Evidence 1 Balance between flexibility and security – case studies
In Austria, on the whole, strong emphasis is placed on the need to balance flexibility and security, and indeed on the fact that “there is no conflict between labour market flexicurity and social security”, but that the two components strengthen each other. In relation to many measures taken, it is strongly highlighted that any steps towards flexibilisation are balanced out with greater protections (see also Example 1 in Annex 1). There has been an emphasis towards creating greater flexibility in employment relationships, both externally and internally, for example through the loosening of working time regulations and employment protections for disabled individuals, or the strengthening of requirements to accept a “reasonable job” for unemployed individuals (with reasonableness more widely defined). However, on the whole such steps are balanced with measures to increase security by other measures, particularly for the most vulnerable individuals.
The Danish version of flexicurity (at least prior to the 2008 crisis) can be described as a balanced mix between security (very strong emphasis on active labour market policies, generous income
32
01
6
4
8
2
14
2
65 5
18
01
2 2
5
0
2
4
6
8
10
12
14
16
18
20
Government Employers Trade unions Academic experts All
Strongly agree Agree Disagree Strongly disagree
Evaluation of flexicurity (2007-2010): final report
23
support for unemployed individuals, high participation in LLL) and flexibility (less stringent EPL and relative ease of hiring and firing). The positive international and European interest in the Danish model of flexicurity since the early 2000s has led to growing attention to this balance among national political actors and the social partners in Denmark. One outcome has been a generally increasing approval of the existing unemployment benefit system, which has previously been under attack for being too generous. However, under the influence of 2008 crisis, this changed in the sense of challenging the consensus behind the Danish version of flexicurity. There have been views expressed in the public debate, especially by academic experts, that the Danish labour market did not fare so well in the crisis precisely because of the ease of firing that companies had when faced with diminished demand. Moreover, in 2010, the unemployment benefit duration has been halved (from 4 to 2 years) – and was seen, especially by the trade unions, as a major challenge to income security. In turn, the 2010 round of collective bargaining saw calls for more and increased job security from trade unions – which would mean significant changes to EPL in Denmark.
In Estonia, in the national policy all four components of flexicurity are considered, but there is quite a strong bias towards flexibility due to the low levels of social security protection and financing of ALMP and limited opportunities for adults to participate in job-related training and in formal education. The new Employment Contracts Act which liberalized regulations regarding redundancies (decrease in severance payments and notice periods) was supposed to increase unemployment insurance benefits for the unemployed but this was postponed because of the crisis (see Example 3 in Annex 1).
In Finland, the component which has arguably received the most attention has been lifelong learning, with social protection systems arguably receiving the least. However, these differences in levels of attention have been small: all four components of flexicurity have been implemented through numerous measures, usually incrementally (see also Example 4 in Annex 1).
In France, separate measures introduced in recent years have aimed to strengthen flexibility (especially facilitation of atypical contracts) and security (especially reforms to ALMPs and training systems which have improved opportunities for employees and jobseekers). It is difficult to establish which of these aspects has enjoyed more attention, although rarely have the measures been seen as promoting both flexibility and security at the same time (for exception see Example 5 in Annex 1).
In Germany, the Hartz reforms focused on increasing flexibility of employment contracts and increasing conditionality of unemployment benefits. In this respect, the security dimensions, including Germany’s unemployment benefit system and pension system, were weakened. However, given the strength of these security aspects in Germany relative to that of other countries, employers feel that the balance that was struck was fair. This is not the view of German trade union representatives, however, who feel that the reforms have sidelined important security components such as deficiencies in adult education, insufficient benefit levels and the rise of precarious jobs.
In Hungary, reforms since 2010 – in particular, measures to reduce employment protection legislation combined with severe cuts in welfare benefits – have been strongly skewed towards flexibility at the expense of security. The modest achievements made with regard to lifelong learning as a result of the education reforms pursued between 2003 and 2010 were undermined after 2010 when investment in training and competence development in vocational schools were reduced.
In Italy, the reforms introduced in the last decade have aimed mostly at increasing flexibility, but they have been partial in the sense of only affecting jobs on the labour market ‘periphery’. The security side of Italy’s labour market has been weakened as a result, as the partial flexibilisation measures have not been accompanied by corresponding changes to Italy’s unemployment benefit system. As a result, this remains highly fragmented and disadvantages workers on fixed-term and atypical employment contracts.
In Poland, on-going reforms refer to all four components of flexicurity. Reforms were taken first in the areas of lifelong learning and effective active labour market policies and subsequently complemented with measures relating to flexible and reliable contractual arrangements and modern social security systems (see also Example 9 in Annex 1).
In Romania, a similar shift in approach took place, with cautious measures to increase both flexicurity and security abandoned after 2010 in favour of a drastic flexibilisation drive in early 2011 which severely undermined security.
Views on the balance between flexibility and security in Spain differ. The Spanish labour market has been described as too rigid and too flexible at the same time. In addition, ‘flexicurity measures’ have not achieved any trade-off between security and flexibility, as measures increasing flexibility or security have been taken separately and have affected different types of contracts. In 2006, reforms
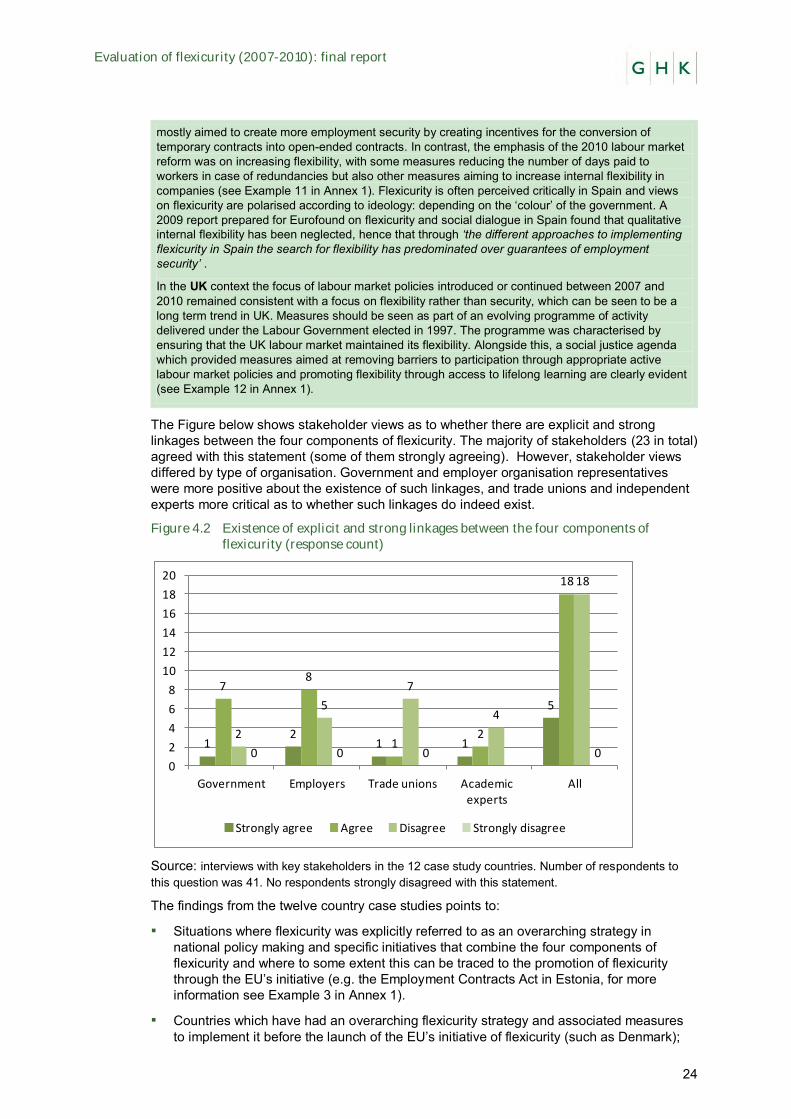
Evaluation of flexicurity (2007-2010): final report
24
mostly aimed to create more employment security by creating incentives for the conversion of temporary contracts into open-ended contracts. In contrast, the emphasis of the 2010 labour market reform was on increasing flexibility, with some measures reducing the number of days paid to workers in case of redundancies but also other measures aiming to increase internal flexibility in companies (see Example 11 in Annex 1). Flexicurity is often perceived critically in Spain and views on flexicurity are polarised according to ideology: depending on the ‘colour’ of the government. A 2009 report prepared for Eurofound on flexicurity and social dialogue in Spain found that qualitative internal flexibility has been neglected, hence that through ‘the different approaches to implementing flexicurity in Spain the search for flexibility has predominated over guarantees of employment security’ .
In the UK context the focus of labour market policies introduced or continued between 2007 and 2010 remained consistent with a focus on flexibility rather than security, which can be seen to be a long term trend in UK. Measures should be seen as part of an evolving programme of activity delivered under the Labour Government elected in 1997. The programme was characterised by ensuring that the UK labour market maintained its flexibility. Alongside this, a social justice agenda which provided measures aimed at removing barriers to participation through appropriate active labour market policies and promoting flexibility through access to lifelong learning are clearly evident (see Example 12 in Annex 1).
The Figure below shows stakeholder views as to whether there are explicit and strong linkages between the four components of flexicurity. The majority of stakeholders (23 in total) agreed with this statement (some of them strongly agreeing). However, stakeholder views differed by type of organisation. Government and employer organisation representatives were more positive about the existence of such linkages, and trade unions and independent experts more critical as to whether such linkages do indeed exist.
Figure 4.2 Existence of explicit and strong linkages between the four components of flexicurity (response count)
Source: interviews with key stakeholders in the 12 case study countries. Number of respondents to this question was 41. No respondents strongly disagreed with this statement.
The findings from the twelve country case studies points to:
▪ Situations where flexicurity was explicitly referred to as an overarching strategy in national policy making and specific initiatives that combine the four components of flexicurity and where to some extent this can be traced to the promotion of flexicurity through the EU’s initiative (e.g. the Employment Contracts Act in Estonia, for more information see Example 3 in Annex 1).
▪ Countries which have had an overarching flexicurity strategy and associated measures to implement it before the launch of the EU’s initiative of flexicurity (such as Denmark);
12
1 1
5
78
12
18
2
5
7
4
18
0 0 0 00
2
4
6
8
10
12
14
16
18
20
Government Employers Trade unions Academic experts
All
Strongly agree Agree Disagree Strongly disagree
Evaluation of flexicurity (2007-2010): final report
25
▪ Countries where moves to provide a coherent policy mix consisting of the four elements of flexicurity are evident, even though they might not be explicitly always labelled as ‘flexicurity’ in the national debate (Austria, see also information on Example 1 in Annex 1).
▪ Countries where all four components of flexicurity have been pursued through policy initiatives but where inter-linkages between them have been weak or absent altogether (Finland, France).
▪ Countries with a strong emphasis on one or more component(s) of flexicurity in national policy making (such as the focus on flexibility in Germany, Italy, Spain and the UK). In Hungary and Romania this bias towards flexibility has occurred to the detriment of security. In Spain and to some extent Germany and Italy, the EU’s initiative can be considered to have provided some impetus for the increased debate about balancing flexibility and security. In the UK, Hungary and Romania, such an impact cannot be detected.
Evidence 2 Flexicurity as an overarching strategy – case studies
In Austria, there is a significant degree of interlinkage between the four components of flexicurity. This is exemplified by the fact that some measures alternately appear as related to different flexicurity components in the NRP; for example the training guarantees can be listed as a lifelong learning or active labour market policy measure and the social security coverage for self-employed and freelancers is mentioned under contractual arrangements and social security measures. It is in the areas of lifelong learning and social security modernisation that there has been the greatest renewed policy emphasis as a result of the EU flexicurity strategy. Although efforts and expenditure may have focussed (particularly in the crisis years) on ALMP measures, there is arguably greater policy stability in this area, whereas responses to the policy challenges in the field of LLL and social security took longer to develop, and are in some cases not yet finalised and in need of further work (e.g. the lifelong learning strategy). Flexicurity considerations feature highly in collective bargaining and because of the strong interlinkages of social partners in policy making the focus here has been rather similar.
Denmark has had a deliberate combination of the four components of flexicurity, even though they have evolved historically at different times and ways and they have not been explicitly labelled as flexicurity prior to the mid-2000s. The policies and measures across the four components were hence evident in the national policy before the 2007 COM. Since 2007, the main changes occurring were due to the influence of the crisis and the need to consolidate the public budgets.
In Estonia, different opinions emerged linked to the coherence between the four components of flexicurity: government representatives argued that all components are taken into account in the policy making process and that the connections between them are thoroughly analysed whereas the social partner perspective was that the four components of flexicurity have been dealt with rather separately and that this is a serious shortcoming. The first Estonian policy document to tie together the four major elements of flexicurity was the explanatory note to the new Employment Contracts Act (in 2008, see Example 3 in Annex 1). As the unemployment insurance came into force in 2002 and labour market services were reformed in 2006, the 2008 act dealt mostly with individual labour relations. The original act i.e. the one accepted by social partners, addressed also the security of workers during unemployment with a more generous unemployment insurance benefits system but these changes were cancelled as a crisis measure. In addition, the Act also increased the opportunities for lifelong learning.
In Finland all four components of flexicurity have been addressed in significant ways (as mentioned in the previous evidence box). However, after 2009, this has not happened under the banner of flexicurity and, in practice, few attempts have been made to create linkages between the components.
In France, an important attempt to integrate all four components of flexicurity took place in 2008, in the national intersectoral agreement on the modernisation of the labour market signed that year (see Example 5 in Annex 1 for more information). This involved agreements concerning new contractual arrangements, strengthened vocational training, reforms to unemployment benefits and ALMPs. However, the law adopted on the back of this agreement only affected contractual arrangements. The economic crisis is said to have complicated efforts to implement an over-arching strategy, and after 2008, social dialogue in France has tended to focus on individual labour market challenges,
Evaluation of flexicurity (2007-2010): final report
26
without adopting an explicitly holistic approach.
In Germany, the components of flexicurity introduced in recent reforms have not been considered as an over-arching strategy (under the banner of flexicurity or under any other banner). Instead, they have been introduced through separate policy initiatives in order to tackle what are perceived as discrete challenges: the flexibilisation of work contracts in order to generate new jobs, the reform of pensions to stabilise public finances in light of population ageing, etc. Other important components, such as lifelong learning, have not been emphasised.
In Hungary, there is neither an explicit flexicurity strategy nor a programme to formulate or implement any of its basic components in detail. Although most of the priorities of flexicurity have been mentioned in various government plans, these are not coordinated in an explicit and deliberate way.
In Italy, an over-arching strategy for the implementation of flexicurity does not exist. In recent years, there has been a bias towards increasing contractual flexibility (albeit only on the margins of the labour market). Other components of flexicurity, including reforms of unemployment benefits, lifelong learning and ALMPs, have been weak or non-existent and no attempt has been made to link them to the introduction of new contractual arrangements.
In Poland, on-going reforms refer to all four components of flexicurity (see also Example 9 in Annex 1). Reforms were first adopted in the areas of lifelong learning and effective active labour market policies, subsequently complemented with measures relating to flexible and reliable contractual arrangements and modern social security systems.
In Romania, reforms adopted before 2008 aimed at strengthening a number of flexicurity components, including contractual flexibility, ALMPs and lifelong learning. However, these initiatives did not have a significant impact. They were also not introduced under the banner of flexicurity and were adopted independently of each other. After 2008, under the influence of an austerity package, many of these measures have been scaled back, with spending on ALMPs and vocational training at an all-time low.
Flexicurity has not been considered as a genuinely integrated strategy in Spain. Most of the public debate and the measures taken by the government have been linked to the first component of flexicurity, i.e. contractual arrangements. According to the 2009 report on flexicurity in social dialogue, Spanish trade unions consider that of the four components of flexicurity policies, active employment policies was least developed and hence should be given priority in the future is, as the level of expenditure on active policies in Spain is too low.
Elements of each of the four components of flexicurity were evident in UK policy prior to the 2007 Communication. Policies introduced or continued between 2007 and 2010 should be seen as part of an evolving programme of activity delivered under the Labour Government since1997.
4.2.2 Summary
In terms of balancing flexibility and security, a continuum of approaches was noted, from countries where moves to more flexibility are predominantly balanced with simultaneous measures to increase security (such as Austria and France); to countries with clear emphasis on flexibility. Examples are reforms of contractual relationships as in Estonia (see Example 3 in Annex 1) or the 2010 labour market reform in Spain (see Example 11 in Annex 1), or the emphasis on maintaining the relatively liberal EPL as in the UK. In some countries, the post 2010 increased flexibility drive has strongly undermined security, including Hungary and Romania. There are also examples of countries where the national policy direction during the 2007-2010 period was not so much focussed on the tensions in balancing flexibility with security, but more on the concurrent development of the four flexicurity components of ALMP, LLL, contractual relations and social protection systems (such as in Finland, and to some extent Denmark and Poland).
The variety of national approaches to flexicurity seen in the country case studies begs the question of whether there is an optimum combination of flexibility and security. This question will be taken up in the concluding section of the report, once the labour market outcomes associated with the particular combinations of flexibility and security have been analysed. At this stage, it is already possible to conclude, however, that the existence of the common flexicurity principles calling for a deliberate combination and policy mix simultaneously
Evaluation of flexicurity (2007-2010): final report
27
reforming several elements has not been translated into a widespread adoption of the classic flexicurity approach across the Member States.
4.3 Impact of flexicurity on national political and policy debates
4.3.1 The isolated articulation of Common Principles in key national policy documents
The 2008-2010 National Reform Programmes (NRPs) in all 27 Member States have been reviewed to identify their stated approach to flexicurity. Most NRPs make reference to flexicurity. A certain number of NRPs also explicitly refer to the common principles of flexicurity (e.g. IT, UK). Only one NRP (LU) does not contain any explicit reference to the concept of flexicurity or its development at the EU level; the Spanish implementation report for 2008 linked to the 2005-2008 NRP does not explicitly refer to flexicurity but to the balance between flexibility and security.
A common trend in the NRPs is to mention the EU’s flexicurity initiative in the introduction as one of a series of policy developments at the EU level. Some references to flexicurity are also introduced in some NRPs in relation to Country Specific Recommendations (ES, FR, NL).
In most NRPs, references to flexicurity are contained in the employment section. In some NRPs, a specific chapter is devoted to flexicurity within the employment section (AT, BE, DK).
There are no links to flexicurity in the other sections of the NRPs33 which could be relevant across the other flexicurity components. This includes the sections on investment in human capital (relevant to LLL), macro-economic policies (relevant to the financing of flexicurity policies), social policies (relevant to the modernisation of social protection systems). Often the flexicurity-relevant EU policy documents referenced in the NRPs are the Council conclusions from 2007 and 2008 (rather than the June 2007 communication).
In a number of countries, the need to develop a flexicurity approach is clearly recognised (BG, CY, LV, SI) and flexicurity is identified as a strategic priority to support employment generation (CZ, DE). Some NRPs refer to the existing national flexicurity model (AT, DK, FI), or state that the national position on flexicurity, or the strategic flexicurity framework or flexicurity pathway is gradually being developed (EL, MT, RO).
Some measures outlined are presented as part of an integrated flexicurity approach (BE, PL, PT, SE).
In addition, as mentioned above, a number of NRPs include measures that are relevant to flexicurity, although not explicitly labelled as ‘flexicurity’ (ES, LU, PL).
Further information on the NRP analysis can be found in Table A2.1 in Annex 2.
The evidence collected from the twelve country case studies points to three tendencies related to the status of the flexicurity principles in the national policy documents (note the analysis thus far in this subsection is based primarily on NRPs):
▪ Embedded: Explicit, discrete references to flexicurity as a cross-cutting strategy in the employment part of the NRP with several of its elements being developed or planned for development (for example, Austria, Denmark, Finland, Hungary, Romania);
▪ Acknowledged: References to flexicurity exist in the employment part of the NRP, but there is no articulation of a comprehensive approach across the four components or eight principles to tackle the main labour market challenges (for example, Estonia, France, Germany, Italy, UK).
▪ Implicit: Explicit references to flexicurity do not exist and no attempt has been made to relate particular measures to the concept or the Common Principles, although flexicurity is clearly relevant to the challenges described (Spain).
33 Usually, NRPs consist of three parts – macro-economic, micro-economic and employment.
Evaluation of flexicurity (2007-2010): final report
28
Further information is provided in the evidence box below.
Evidence 3 Status of flexicurity in key national policy documents
The Austrian 2008-2010 NRP is explicit in its assertion of being a leading Member State on flexicurity. While flexicurity is referred to variously in the 2008-2010 NRP, and the report contains a separate section entitled “joint flexicurity principles”, no specific “pathway” is described with regard to the emphasis of the measures taken.
The Danish 2008-2010 NRP has a separate section within the employment and labour market part devoted to the continued development of the flexicurity model, which outlines specific areas upon which the Danish flexicurity model is concentrated (flexible employment and dismissal regulations; income-replacing benefits (unemployment benefits or social assistance) upon unemployment; a comprehensive active labour market policy; and education, including adult vocational education). It goes on to state that the need for development of the flexicurity model is evaluated on an ongoing basis. While the NRP recalls that the European joint indicators for monitoring and measuring of the development of the flexicurity elements show high values for the input and process indicators in Denmark, it does not explicitly reference the four flexicurity components or common principles.
In Estonia, the 2008-2010 NRP and other policy documents have referred to flexicurity. Both the NRP and the explanatory note of the new Employment Contracts Act state that flexicurity is a means to reinforce the implementation of the Lisbon Strategy, amongst other things by combining flexibility and security. The four major components—flexible and reliable contractual arrangements, comprehensive lifelong learning strategies, effective active labour market policies, and modern, adequate and sustainable social protection systems—are also referenced as the main components of flexicurity in the explanatory note of the new Employment Contracts Act.
In Finland, the 2008-2010 NRP refers to a ‘Finnish flexicurity model’ which aims to secure speedy transitions between jobs, facilitate transitions from unemployment into the labour market, and strengthen the quality of working life, which is deemed to be a key factor in extending working careers and improving competitiveness. It also had a separate annex dedicated to the Finnish model of flexicurity. It should be mentioned, however, that the references to flexicurity disappeared in the 2011 NRP.
In the French NRP, explicit references are made to the concept of flexicurity in relation to the reform of PES and the objective of ‘promoting worker mobility, strengthening career security’. However, the Common Principles are not mentioned in the document. A number of objectives highlighted in the NRP are relevant to flexicurity but are not described as such. These include increasing lifelong learning, encouraging ‘active lives’ and guaranteeing gender equality at work.
In the German 2008-2010 NRP, flexicurity is identified as a strategic priority in relation to the reduction of unemployment and reform of German labour law. The NRP also reviews a number of flexicurity-related measures without referring to them explicitly as a flexicurity approach. This includes a commitment to eliminating gender-specific pay differences by improving childcare services, and long-term measures in the area of education and vocational training, with a particular focus on ensuring the upward mobility of young people.
The Hungarian NRP includes explicit reference to flexicurity. The employment section of the NRP is organised around the four components of flexicurity with a series of measures outlined in respect of each.
In Italy, the concept of flexicurity is mentioned explicitly in the executive summary of the NRP. The document also explains how the Common Principles have been implemented in the Italian context, focusing in particular on improving the framework for protecting the unemployed, vocational training to improve the employability of workers, and enhancing the role of PES to provide active labour market policies.
In Poland, the development of the flexicurity concept is reflected in the section on employment and labour market in the Polish NRP. Some actions announced under the Priority ‘Active Society’ are not explicitly labelled as flexicurity but are related to the individual components of flexicurity. The 2009 Report on the Implementation of the NRP discusses significant issues related with the implementation of an integrated model of flexicurity. However, issues related to the flexibility of forms and time of work or systemic solutions for work-life balance are inadequately emphasised in the NRP and subsequent implementation reports.
In Romania, the NRP refers to the development of a national position on flexicurity. This includes, as priorities, lifelong learning and ALMPs, social dialogue and collective bargaining in the implementation of reforms, flexibilisation of labour relations and diversification of the financial basis of the pension system.
In Spain, the national arrangements giving effect to the Common Principles are not explained in detail in the 2008 and 2009 implementation reports related to the 2005-2008 NRP. The flexicurity related challenges are
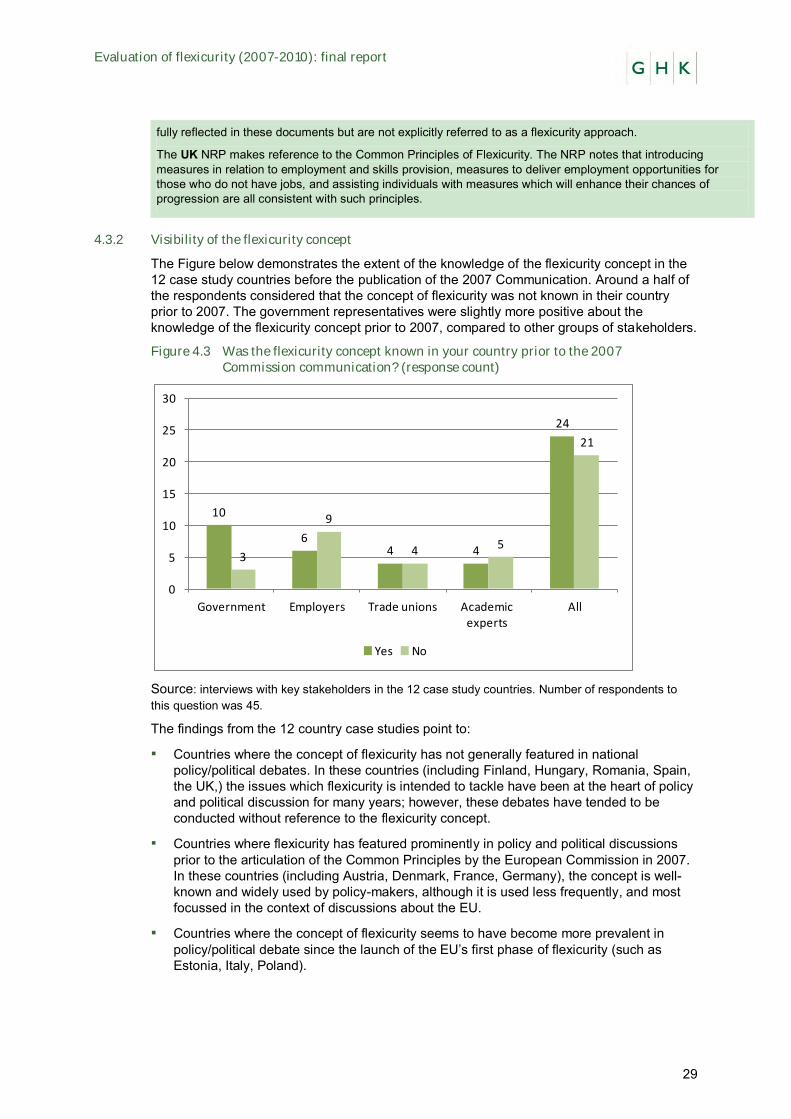
Evaluation of flexicurity (2007-2010): final report
29
fully reflected in these documents but are not explicitly referred to as a flexicurity approach.
The UK NRP makes reference to the Common Principles of Flexicurity. The NRP notes that introducing measures in relation to employment and skills provision, measures to deliver employment opportunities for those who do not have jobs, and assisting individuals with measures which will enhance their chances of progression are all consistent with such principles.
4.3.2 Visibility of the flexicurity concept
The Figure below demonstrates the extent of the knowledge of the flexicurity concept in the 12 case study countries before the publication of the 2007 Communication. Around a half of the respondents considered that the concept of flexicurity was not known in their country prior to 2007. The government representatives were slightly more positive about the knowledge of the flexicurity concept prior to 2007, compared to other groups of stakeholders.
Figure 4.3 Was the flexicurity concept known in your country prior to the 2007 Commission communication? (response count)
Source: interviews with key stakeholders in the 12 case study countries. Number of respondents to this question was 45.
The findings from the 12 country case studies point to:
▪ Countries where the concept of flexicurity has not generally featured in national policy/political debates. In these countries (including Finland, Hungary, Romania, Spain, the UK,) the issues which flexicurity is intended to tackle have been at the heart of policy and political discussion for many years; however, these debates have tended to be conducted without reference to the flexicurity concept.
▪ Countries where flexicurity has featured prominently in policy and political discussions prior to the articulation of the Common Principles by the European Commission in 2007. In these countries (including Austria, Denmark, France, Germany), the concept is well-known and widely used by policy-makers, although it is used less frequently, and most focussed in the context of discussions about the EU.
▪ Countries where the concept of flexicurity seems to have become more prevalent in policy/political debate since the launch of the EU’s first phase of flexicurity (such as Estonia, Italy, Poland).
10
64 4
24
3
9
4 5
21
0
5
10
15
20
25
30
Government Employers Trade unions Academic experts
All
Yes No
Evaluation of flexicurity (2007-2010): final report
30
Evidence 4 Flexicurity in national policy/political debates
In Austria, the rationale behind the flexicurity concept is considered to have been very much prevalent in policy making, even before the formulation of the Common Principles, without the term being used. Since then the use of the term has become widespread in the political debate (both at government level and among the social partners) and is seen to have strongly influenced policy innovation. The “historical attachment” to the rationale behind the flexicurity principles is partly attributed to the strong involvement of social partner organisations in decision making at all levels and the resulting emphasis on achieving a workable balance between flexibility and security.
In Denmark flexicurity has featured prominently in policy and political discussions prior to the articulation of the Common Principles by the European Commission in 2007. Although it is not used that often in discussions about the EU, EU discussions on flexicurity may have contributed to strengthening awareness within Denmark of the importance of seeing flexicurity as a mix of policies, which have historically enjoyed considerable support among in Denmark. In the context of the economic crisis, it is possible that a more conflictual discourse on flexicurity may be emerging, as trade unions have begun to voice concerns about certain aspects of the Danish flexicurity model – particularly its relatively liberal EPL – which is considered to have contributed to the negative consequences on employment during the economic downturn.
In Estonia, the concept of flexicurity has featured in key Estonian policy documents since 2007, including the explanatory note of the new Employment Contracts Act (2008) and in the 2011 Government Coalition Treaty. However, in Estonia the issues that flexicurity measures are intended to tackle are more prevalent than discussion of the concept itself. Moreover, the inclusion of references to flexicurity in Estonian policy documents has not resulted in a widespread awareness or understanding of the concept. For instance, the interconnections between flexicurity’s four components are said to be poorly understood even by Estonian policy-makers.
In Finland, the concept of flexicurity has had a relatively superficial and temporary impact on political discussions. The issues it encompasses have long been present in Finnish political debates however and there is a remarkable consensus over how they should be addressed. During a brief interlude after 2007, Finnish policy-makers used the flexicurity concept to assemble and clarify policies and initiatives that had long been in operation, especially those aimed at strengthening employment transitions, helping the inactive re-enter working life and improving the quality of work (this peaked in 2009, with a “Flexicurity Declaration” by the Finnish government). This interlude ended with the escalating global economic crisis, when the term flexicurity was replaced by Finland’s traditional discourse on the Nordic welfare society and its re-invention.
In France, the concept of flexicurity was present in national debates prior to the launch of the Common Principles. However, references to flexicurity have tended to focus on its separate components, with the exception of the period 2007-2008 when attempts were made to create an integrated approach through social dialogue, building on the concept of ‘securing working pathways’. These efforts stalled with the onset of the global economic crisis and today there is still no consensus on a national flexicurity approach.
In Germany, the notion of combining flexibility and security entered political debates at the end of the 1990s, inspired by developments in Denmark. By the time the Commission launched its flexicurity initiative in 2007, the concept was well known in public and academic debates. However, the discussions have been shaped by reactions to the Danish model of flexicurity, rather than to the Common Principles. German stakeholders have tended to be sceptical of the relevance of the Danish approach to flexicurity for Germany. Instead, efforts have been made to define a German “pathway to flexicurity”, one which emphasises internal flexibilisation (especially flexible working-time and wage flexibility) rather than external flexibilisation, although elements of the latter have also been adopted in the so-called “Hartz reforms”. According to representatives of the federal Government, the debate about flexicurity at the EU level helped to put German notions of flexibility in a wider context, highlighting its interlinkages with other areas.
In Hungary, the government has rarely addressed the concept of flexicurity in political debates or policy plans, although NGOs and opposition parties have referred to it more often. When it has been cited, it has been in relation to its separate components rather than as an integrated policy approach. The major reforms that have been adopted in recent years have not been discussed in the context of flexicurity.
In Italy, the concept of flexicurity entered the political debate after the launch of the Commission’s Common Principles. Although there is widespread understanding of the importance of balancing
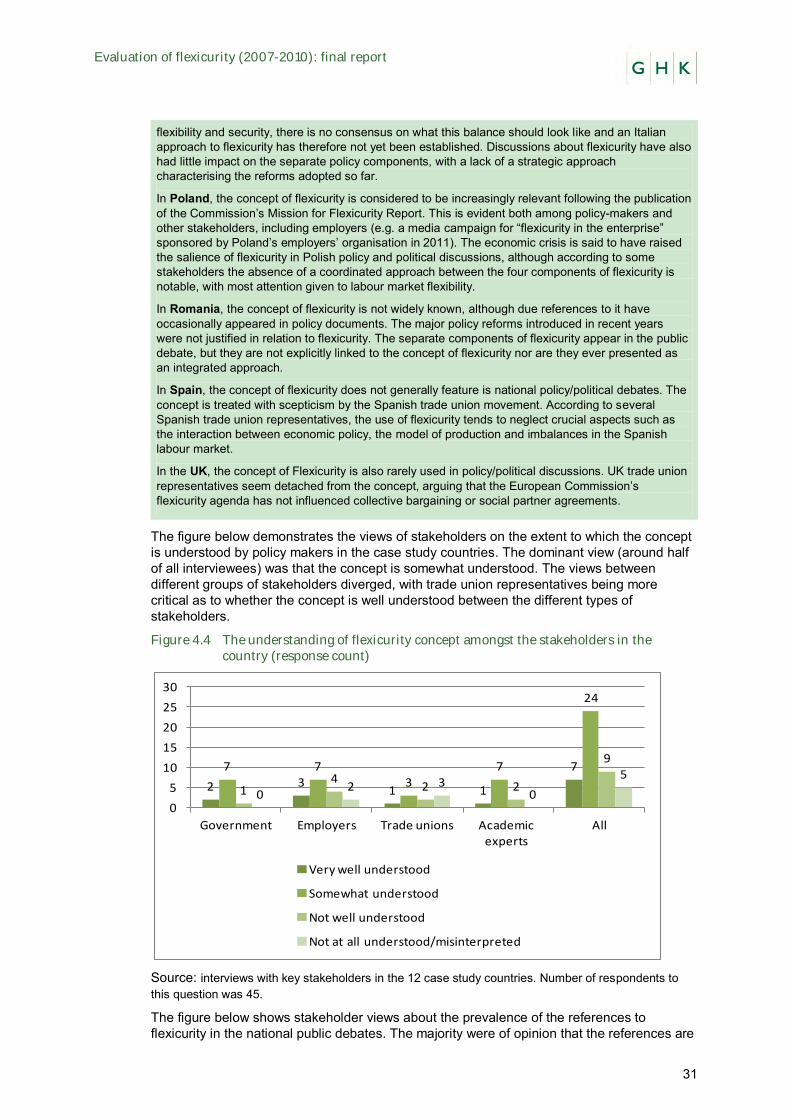
Evaluation of flexicurity (2007-2010): final report
31
flexibility and security, there is no consensus on what this balance should look like and an Italian approach to flexicurity has therefore not yet been established. Discussions about flexicurity have also had little impact on the separate policy components, with a lack of a strategic approach characterising the reforms adopted so far.
In Poland, the concept of flexicurity is considered to be increasingly relevant following the publication of the Commission’s Mission for Flexicurity Report. This is evident both among policy-makers and other stakeholders, including employers (e.g. a media campaign for “flexicurity in the enterprise” sponsored by Poland’s employers’ organisation in 2011). The economic crisis is said to have raised the salience of flexicurity in Polish policy and political discussions, although according to some stakeholders the absence of a coordinated approach between the four components of flexicurity is notable, with most attention given to labour market flexibility.
In Romania, the concept of flexicurity is not widely known, although due references to it have occasionally appeared in policy documents. The major policy reforms introduced in recent years were not justified in relation to flexicurity. The separate components of flexicurity appear in the public debate, but they are not explicitly linked to the concept of flexicurity nor are they ever presented as an integrated approach.
In Spain, the concept of flexicurity does not generally feature is national policy/political debates. The concept is treated with scepticism by the Spanish trade union movement. According to several Spanish trade union representatives, the use of flexicurity tends to neglect crucial aspects such as the interaction between economic policy, the model of production and imbalances in the Spanish labour market.
In the UK, the concept of Flexicurity is also rarely used in policy/political discussions. UK trade union representatives seem detached from the concept, arguing that the European Commission’s flexicurity agenda has not influenced collective bargaining or social partner agreements.
The figure below demonstrates the views of stakeholders on the extent to which the concept is understood by policy makers in the case study countries. The dominant view (around half of all interviewees) was that the concept is somewhat understood. The views between different groups of stakeholders diverged, with trade union representatives being more critical as to whether the concept is well understood between the different types of stakeholders.
Figure 4.4 The understanding of flexicurity concept amongst the stakeholders in the country (response count)
Source: interviews with key stakeholders in the 12 case study countries. Number of respondents to this question was 45.
The figure below shows stakeholder views about the prevalence of the references to flexicurity in the national public debates. The majority were of opinion that the references are
2 31 1
77 73
7
24
14
2 2
9
02 3
0
5
0
5
10
15
20
25
30
Government Employers Trade unions Academic experts
All
Very well understood
Somewhat understood
Not well understood
Not at all understood/misinterpreted
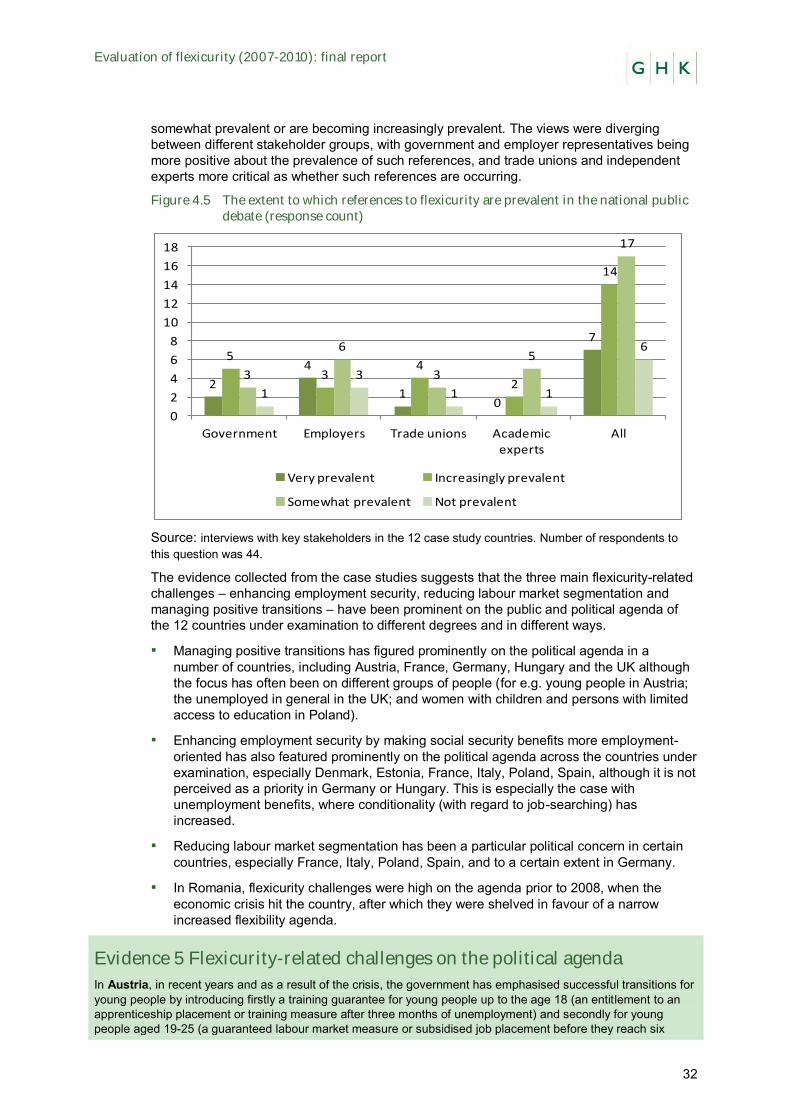
Evaluation of flexicurity (2007-2010): final report
32
somewhat prevalent or are becoming increasingly prevalent. The views were diverging between different stakeholder groups, with government and employer representatives being more positive about the prevalence of such references, and trade unions and independent experts more critical as whether such references are occurring.
Figure 4.5 The extent to which references to flexicurity are prevalent in the national public debate (response count)
Source: interviews with key stakeholders in the 12 case study countries. Number of respondents to this question was 44.
The evidence collected from the case studies suggests that the three main flexicurity-related challenges – enhancing employment security, reducing labour market segmentation and managing positive transitions – have been prominent on the public and political agenda of the 12 countries under examination to different degrees and in different ways.
▪ Managing positive transitions has figured prominently on the political agenda in a number of countries, including Austria, France, Germany, Hungary and the UK although the focus has often been on different groups of people (for e.g. young people in Austria; the unemployed in general in the UK; and women with children and persons with limited access to education in Poland).
▪ Enhancing employment security by making social security benefits more employment-oriented has also featured prominently on the political agenda across the countries under examination, especially Denmark, Estonia, France, Italy, Poland, Spain, although it is not perceived as a priority in Germany or Hungary. This is especially the case with unemployment benefits, where conditionality (with regard to job-searching) has increased.
▪ Reducing labour market segmentation has been a particular political concern in certain countries, especially France, Italy, Poland, Spain, and to a certain extent in Germany.
▪ In Romania, flexicurity challenges were high on the agenda prior to 2008, when the economic crisis hit the country, after which they were shelved in favour of a narrow increased flexibility agenda.
Evidence 5 Flexicurity-related challenges on the political agenda
In Austria, in recent years and as a result of the crisis, the government has emphasised successful transitions for young people by introducing firstly a training guarantee for young people up to the age 18 (an entitlement to an apprenticeship placement or training measure after three months of unemployment) and secondly for young people aged 19-25 (a guaranteed labour market measure or subsidised job placement before they reach six
2
4
10
7
5
34
2
14
3
6
3
5
17
1
3
1 1
6
0
2
4
6
8
10
12
14
16
18
Government Employers Trade unions Academic experts
All
Very prevalent Increasingly prevalent
Somewhat prevalent Not prevalent
Evaluation of flexicurity (2007-2010): final report
33
month of unemployment). Another focus in Austria has been on reducing segmentation by extending social insurance protections to self-employed workers and freelancers.
In Denmark, the debates have focused primarily on two main issues. Firstly, the consequences of recent changes in the Danish unemployment benefit system for income security for certain groups of the population. These changes include the introduction of collective pension schemes, which mean in practice that groups who are more affected by unemployment will have lower incomes when they retire, and the lowering of the gross replacement rates in the unemployment benefit system. These developments are compounded as a growing number of workers are not members of an unemployment insurance fund, which means they are not eligible for any benefits at all if they become unemployed. The second major focus of Danish labour market policy debates has been on the ability of Danish jobcentres to implement Active Labour Market Policies with sufficient efficiency during a period of rapidly rising unemployment (see Example 2 in Annex 1).
In Estonia, political debates have recently centred on the introduction of greater labour market flexibility. It took various rounds of amendments before the Estonian parliament was able to pass the new Employment Contracts Act, which allows employers and employees more freedom to negotiate contracts and reduce severance payments (see Example 3 in Annex 1). Discussions about income security have also been high on Estonia’s political agenda, especially concerning the financial viability of Estonia’s unemployment insurance funds during the economic downturn. This resulted in the adoption of a number of measures which terminated or postponed entitlements for certain groups. The development of ALMPs and increasing access to lifelong learning, both of them financed via the European Social Fund, have also been high on the political agenda.
In Finland, three main flexicurity-related challenges have been high on the agenda for a number of years, also prior to the Commission’s flexicurity initiative. The Finnish programme “Change Security”, introduced in 2006, ushered in a series of measures aimed at achieving more efficient transitions between jobs and from unemployment back into the labour market through improved coordination between the social partners, the unemployed and public authorities (see Example 4 in Annex 1). Finland is also building a modern guidance network for adult education and reformed the unemployment benefit and pension systems.
In France, the main flexicurity-related challenges have also been high on the agenda, although not always under the banner of flexicurity. This includes the need to address segmentation and improving employment security and job transitions through reforms of the PES, strengthening vocational training, and ensuring that rights to training and other professional mobility paths are attached to individuals rather than to their jobs.
In Germany, managing positive transitions has been high on the policy agenda. This challenge has two main facets. Firstly, following the partial flexibilisation of the German labour market during the Hartz reforms, there is a need to improve the transition between temporary and permanent employment. It appears that ALMPs are not always helpful in this respect as they often involve the creation of temporary jobs which are then not easy to convert into permanent ones. The social partners feel that not enough is being done about this labour market ‘segmentation’, although for very different reasons. Employers want to see general EPL loosened, whereas trade unions want to limit the possibilities for the use of fixed-term contracts. The other facet relates to facilitating transitions for more vulnerable groups, including people with low levels of education, women and the elderly. This is being done through a combination of measures, including ALMPs, vocational training and pension reforms. Strengthening employment security is not perceived as a high priority.
In Italy, tackling the segmented labour market has been on the political agenda for a number of years prior to 2007. However, there is disagreement as to the role of flexibilisation measures in this regard: employers feel that more flexibility is needed, while the unions argue that the (partial) flexibilisation already adopted has created the segmentation. Strengthening employment security has been a key priority: prior to 2007, attempts were made to introduce a universal unemployment benefit system to cover those vulnerable groups who are not currently covered, but these were not passed. During the economic crisis, expenditure shifted from ALMPs to passive labour market policies.
In Hungary, strengthening positive transitions has been high on the policy agenda, although it has not been discussed in relation to flexicurity. The discussions have focused mostly on the weakness of Hungary’s lifelong learning policies including inadequate skills matching and low participation in adult education. Employment security has received little attention in spite of the deficiencies in Hungary’s ALMPs and unemployment benefit system, which provides few incentives for the unemployed to rejoin the labour market (for an initiative to attract disabled workers see Example 7 in Annex 1). The exception was the discussions regarding the drastic reduction in employment protection following the adoption of a new labour code in 2011-12.
In Poland, the three main flexicurity challenges have all figured prominently in recent political debates. Reducing labour market segmentation by reforming Poland’s social protection system is possibly the most prominent issue at present, followed by the question of how to manage positive transitions for certain vulnerable groups, in particular women with children and persons with limited access to education. Recent years have seen a gradual strengthening in the role of the social partners and other stakeholders in these discussions, a positive
Evaluation of flexicurity (2007-2010): final report
34
development which may help to ensure flexicurity-related issues remain at the top of the political debate (see also Example 9 in Annex 1).
In Romania, the challenges at the top of the agenda changed radically as a result of the economic crisis. Prior to the crisis, employment security and strengthening transitions were high priorities and measures were in place to strengthen employment rights (through the adoption of a Labour Code in 2003) and to increase investment in adult education and active employment measures. However, when the crisis struck, these measures were shelved and the emphasis shifted almost exclusively to external flexibilisation through the reform of the Labour Code.
In Spain, debates have focused consistently on the need to tackle the country’s deeply segmented labour market and the high rates of temporary employment which continue to undermine employment security for large numbers of people. A series of reforms aimed at reducing segmentation have succeeded each other without much effect since 1996. Reforming Spain’s outdated unemployment benefit system has also been the subject of intense debate, with a widely discussed proposal to introduce an insurance-based system which would provide incentives for job mobility. The reform of public employment services, which currently manage less than 10% of all job offers, have also figured prominently in Spanish public debate.
In the UK, the debate on managing positive transitions has focused in particular on securing the involvement of employers in the development and implementation of policy, particularly that covering education, training and active labour market measures. One manifestation of this debate has focused on the UK’s apprenticeship system, which lacks both volume and quality. Following the creation of a Sector Skills Development Agency in the early 2000s, successive governments have attempted to engage employers in the determination and delivery of skills, with varying degrees of success.
4.3.3 Summary
Flexicurity has been relevant to political discussions in the 12 countries under investigation, notwithstanding the different policy challenges and policy frameworks which they face. In some countries, the flexicurity agenda has injected the policy debate with new proposals for reform. In other countries where awareness of the need for a balanced mix of measures has long existed, the EU’s flexicurity agenda may have served to highlight the continuing need to address the balance between different components of labour market policy.
On the other hand, during the economic downturn, in many countries the “security” side of the flexicurity concept has tended to stall and political debates on the flexicurity agenda (or on the issues contained in the flexicurity agenda), led primarily by trade union representatives, have become increasingly conflictual. This appears to be less prevalent in some countries with strong traditions of social partnership where in recent years significant progress has indeed been in achieving greater labour market flexibility without undermining employment security. Within the context of the Open Method of Co-ordination, it is left to the process of defining the Country Specific Recommendations to reinforce the message about the need for a balanced application of the flexibility and security components and the need for a holistic consideration of the four pillars of flexicurity. Further efforts may be required to demonstrate, on the basis of policy examples, the costs and benefits of various flexicurity measures and their “win-win” potential, in relation to the underlying economic situation.
In most NRPs, references to flexicurity are contained in the employment section. None of the other sections of these documents reference flexicurity, even though these sections touch on topics relevant to the flexicurity components. There is also a tendency to see flexicurity in more narrow labour law and contractual arrangement terms than a concept to better achieve employment and income security while maintaining flexibility in the labour market. The implementation of flexicurity as integrated policy mix also needs to include a focus on economic and regional policy approaches – a link which is rarely made in NRPs.
4.4 Governance and monitoring structures for flexicurity policies
4.4.1 The presence and status of monitoring arrangements for flexicurity policies
The analysis of Member States’ 2008-2010 NRPs shows that flexicurity-specific monitoring structures have not been developed in the Member States. However, performance concerning individual flexicurity-related measures and indicators was reported in Member
Evaluation of flexicurity (2007-2010): final report
35
States’ annual progress reports in the NRP monitoring process. It needs to be borne in mind though that in some countries with strong policy monitoring traditions, monitoring arrangements exist and cover the main flexicurity related policies. This is less evident in other countries with less embedded culture of monitoring and evaluating policies.
This is largely confirmed by the case study findings which indicate that separate flexicurity-specific implementation monitoring structures do not exist and the relevant policies / measures would be (or not) evaluated and monitored depending on the national institutional traditions. Monitoring of flexicurity is thus dependant on the national context and their tradition of policy monitoring and evaluation, which differs across the case study countries. Thus, the influence of the third common principle on effective monitoring of the progress of flexicurity cannot be traced in most case study countries in the sense of generating new momentum at the national level for increased monitoring/evaluation of public policies. However, interesting developments are noted, for example, in Poland where the social partners have undertaken studies, conferences and projects to reflect on the implementation of flexicurity in Poland.
Overall, what has been found useful in some countries (e.g. Estonia) is to have, in general, an articulated clear framework with clear targets, deadlines and budgets to focus the monitoring of the whole of the NRP.
Evidence 6 Monitoring of flexicurity related policies– case studies
There is a strong emphasis on policy monitoring in general in Austria, whereby flexicurity-related policies are evaluated as well. This is exemplified by the so-called “Data warehouse” of the PES which can provide access to detailed data on the ALMPs participants and their destinations and broader labour market trends. The Austrian system of data monitoring allows the combination of PES data with social security and other personal data This makes it possible to link the cost of particular measures with labour market outcomes, allowing for cost comparisons between different measures. However, in mainly links active labour market policy and social protection indicators and focuses less on lifelong learning and EPL indicators.
In Denmark, 2008-2010 NRP states that “The Government evaluates the need for development of the (flexicurity) model on an ongoing basis in order to ensure that persons who can work do get a job.” This occurs in the general framework of monitoring and evaluating the flexicurity related policies at the national level.
In Estonia, since flexicurity is not implemented as a specific strategy that has its own action plan and specified targets, there is no monitoring system that can be considered to be a “flexicurity governance system”. Nevertheless, the NRP outlines flexicurity related activities and sets clear targets, deadlines and budgets for them, hence can be used to monitor flexicurity policies in Estonia. An evaluation of the new Employment Contracts Act is expected in 2012.
In Finland, there is no specific flexicurity governance framework, since flexicurity is not a governing principle in the country (with the exception of the brief 2009 interlude). However, effective structures for monitoring the performance of policies associated with flexicurity, including contractual arrangements, lifelong learning, ALMPs and social security, have existed for a long time (prior to the Commission’s 2007 flexicurity initiative), thus ensuring that flexicurity-related policies and measures are monitored.
In France, a monitoring structure specific for flexicurity policies does not exist. However, there have been a few initiatives to study the implementation of flexicurity in France, including the establishment of a ‘mission on the French flexicurity model’ and a 2010 parliamentary report on the activities of this mission.
In Germany, there is no systematic and regular monitoring of the flexicurity indicators. However, different aspects of flexicurity have been analysed in yearly or ad hoc reports published by the social partners, including different federal ministries and research institutes led by employer or trade union federations.
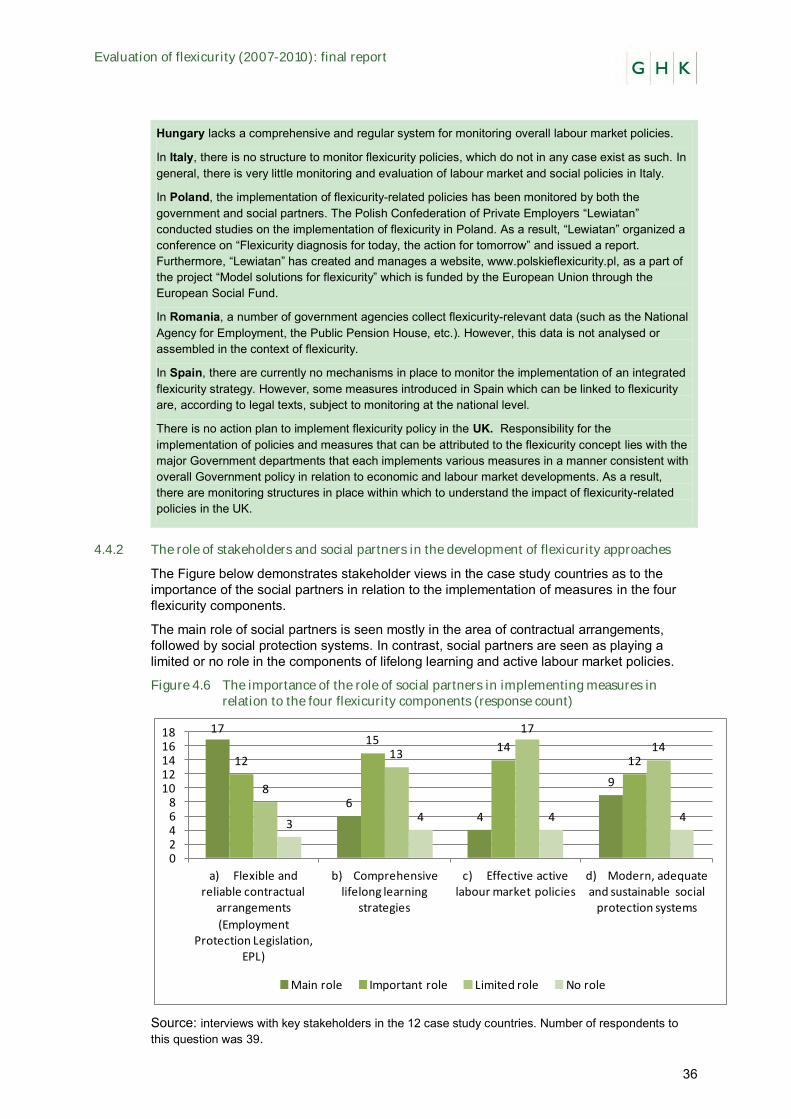
Evaluation of flexicurity (2007-2010): final report
36
Hungary lacks a comprehensive and regular system for monitoring overall labour market policies.
In Italy, there is no structure to monitor flexicurity policies, which do not in any case exist as such. In general, there is very little monitoring and evaluation of labour market and social policies in Italy.
In Poland, the implementation of flexicurity-related policies has been monitored by both the government and social partners. The Polish Confederation of Private Employers “Lewiatan” conducted studies on the implementation of flexicurity in Poland. As a result, “Lewiatan” organized a conference on “Flexicurity diagnosis for today, the action for tomorrow” and issued a report. Furthermore, “Lewiatan” has created and manages a website, www.polskieflexicurity.pl, as a part of the project “Model solutions for flexicurity” which is funded by the European Union through the European Social Fund.
In Romania, a number of government agencies collect flexicurity-relevant data (such as the National Agency for Employment, the Public Pension House, etc.). However, this data is not analysed or assembled in the context of flexicurity.
In Spain, there are currently no mechanisms in place to monitor the implementation of an integrated flexicurity strategy. However, some measures introduced in Spain which can be linked to flexicurity are, according to legal texts, subject to monitoring at the national level.
There is no action plan to implement flexicurity policy in the UK. Responsibility for the implementation of policies and measures that can be attributed to the flexicurity concept lies with the major Government departments that each implements various measures in a manner consistent with overall Government policy in relation to economic and labour market developments. As a result, there are monitoring structures in place within which to understand the impact of flexicurity-related policies in the UK.
4.4.2 The role of stakeholders and social partners in the development of flexicurity approaches
The Figure below demonstrates stakeholder views in the case study countries as to the importance of the social partners in relation to the implementation of measures in the four flexicurity components.
The main role of social partners is seen mostly in the area of contractual arrangements, followed by social protection systems. In contrast, social partners are seen as playing a limited or no role in the components of lifelong learning and active labour market policies.
Figure 4.6 The importance of the role of social partners in implementing measures in relation to the four flexicurity components (response count)
Source: interviews with key stakeholders in the 12 case study countries. Number of respondents to this question was 39.
17
64
9
12
1514
12
8
13
17
14
34 4 4
02468
1012141618
a) Flexible and reliable contractual
arrangements
(Employment Protection Legislation,
EPL)
b) Comprehensive lifelong learning
strategies
c) Effective active labour market policies
d) Modern, adequate and sustainable social
protection systems
Main role Important role Limited role No role
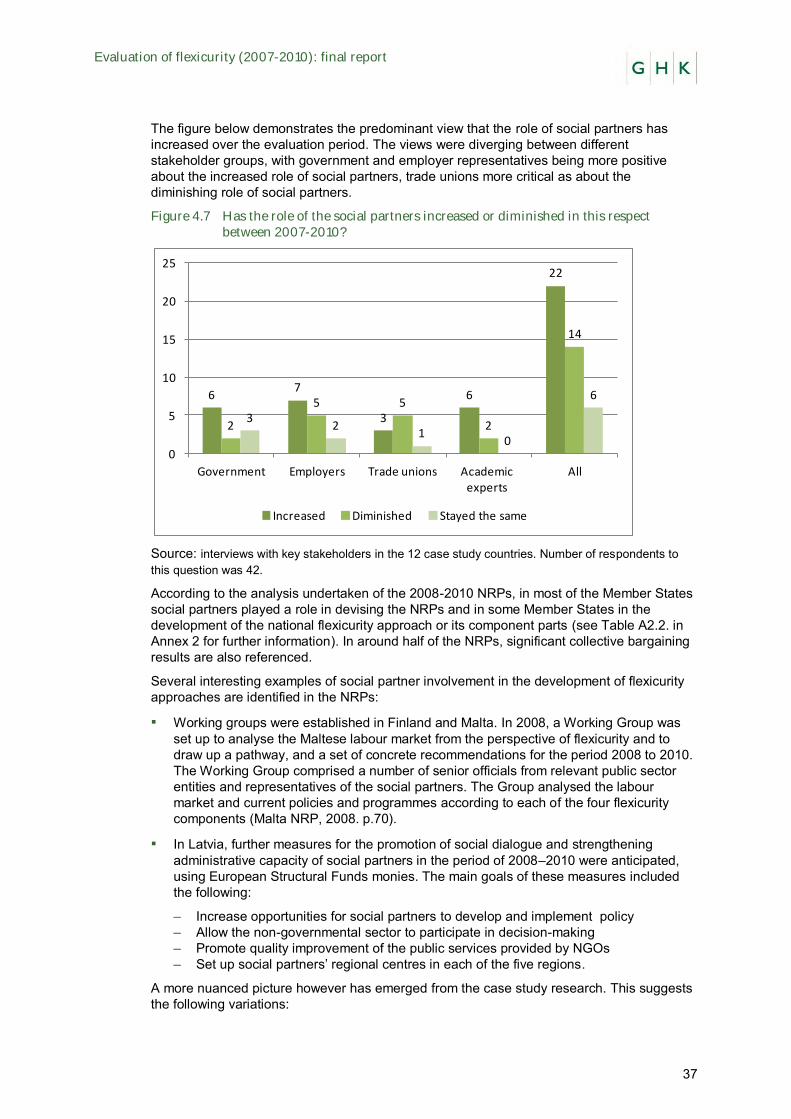
Evaluation of flexicurity (2007-2010): final report
37
The figure below demonstrates the predominant view that the role of social partners has increased over the evaluation period. The views were diverging between different stakeholder groups, with government and employer representatives being more positive about the increased role of social partners, trade unions more critical as about the diminishing role of social partners.
Figure 4.7 Has the role of the social partners increased or diminished in this respect between 2007-2010?
Source: interviews with key stakeholders in the 12 case study countries. Number of respondents to this question was 42.
According to the analysis undertaken of the 2008-2010 NRPs, in most of the Member States social partners played a role in devising the NRPs and in some Member States in the development of the national flexicurity approach or its component parts (see Table A2.2. in Annex 2 for further information). In around half of the NRPs, significant collective bargaining results are also referenced.
Several interesting examples of social partner involvement in the development of flexicurity approaches are identified in the NRPs:
▪ Working groups were established in Finland and Malta. In 2008, a Working Group was set up to analyse the Maltese labour market from the perspective of flexicurity and to draw up a pathway, and a set of concrete recommendations for the period 2008 to 2010. The Working Group comprised a number of senior officials from relevant public sector entities and representatives of the social partners. The Group analysed the labour market and current policies and programmes according to each of the four flexicurity components (Malta NRP, 2008. p.70).
▪ In Latvia, further measures for the promotion of social dialogue and strengthening administrative capacity of social partners in the period of 2008–2010 were anticipated, using European Structural Funds monies. The main goals of these measures included the following:
– Increase opportunities for social partners to develop and implement policy – Allow the non-governmental sector to participate in decision-making – Promote quality improvement of the public services provided by NGOs – Set up social partners’ regional centres in each of the five regions.
A more nuanced picture however has emerged from the case study research. This suggests the following variations:
67
3
6
22
2
5 5
2
14
32
10
6
0
5
10
15
20
25
Government Employers Trade unions Academic experts
All
Increased Diminished Stayed the same
Evaluation of flexicurity (2007-2010): final report
38
▪ In some countries, social partners have played a strong role in the development of the main flexicurity-type measures at the national level, usually in line with their traditionally strong involvement in policy making (Austria, Germany, Finland, France, see Examples of policies from these countries in Annex 1).
▪ In other countries, social dialogue played a role; however, in the implementation of key reforms, the government pressed ahead bypassing decisions previously agreed through social dialogue and/or ignoring the objections of social partners (e.g. Estonia, Spain, Italy).
▪ In certain countries, social dialogue has been weak or non-existent (e.g. Romania, Hungary).
Evidence 7 Role of social partners in the development of a flexicurity approach
Austria also has a strong tradition of social dialogue and many of the measures included in the NRPs have their origins in agreements between the social partners, subsequently taken on board by government.
In Estonia, where the most widespread public debate with explicit references to flexicurity was held during the preparation and negotiations over the new Employment Contracts Act. The draft law was accompanied by a tripartite agreement between employers, employees and the Government. Later (during the economic crisis), the government breached this agreement and some important elements of the agreement (e.g. rise of unemployment insurance payments) were not enacted. The social partners were consulted during the preparation of NRP as well as in implementing all major labour market reforms. It is, however, fair to say that social dialogue is not regular and government occasionally ignores the views from the council of social partners.
Germany is well known for its strong social dialogue approach. Social dialogue can be regarded as one of the main reasons for the focus on internal flexibility in Germany’s approach to flexicurity. The social partners play a key role in implementing internal flexibility and employment security through collective bargaining.
In the development of the Danish model, the social partnership has been indispensable. Indeed, all stakeholders interviewed for this evaluation put forward a view that the social partnership is one of key driving forces behind the successes of the Danish model. Strong social partnership is seen as equipping the model to deal with the challenges in a balanced way which is close to the world of work in the real economy.
In Finland, a country where consensual politics is the norm, the role of social partners is very important in the formulation of policies, including those policies that are relevant to the flexicurity agenda.
In France, social partners have a less prominent role in the formulation of policies than other institutions, including the state and legislature, although they have traditionally helped to manage the implementation of some flexicurity-relevant policies (especially those concerning vocational training and social insurance). Discussions concerning a French approach to flexicurity have largely been driven by the social partners, in particular by France’s main employer federation (MEDEF), although the trade unions have also been important (while avoiding the term flexicurity in favour of “securing career pathways”).
In Hungary and Romania, the government regularly consulted the social partners prior to 2010, although this rarely influenced policy-making. However, after 2010, a drastic change of course took place and the social partners became largely marginalised. In both countries this has led to social tensions and anti-government protests.
In Italy, the social partners have traditionally co-managed vocational training and social insurance schemes and, through collective bargaining, have succeeded in influencing policy-making. However, given the absence of an Italian approach to flexicurity, their role has not been important in this regard.
In Poland the social partners have become more active and involved in the reflections on and development of the flexicurity approach. A number of activities have been implemented to support this (such as studies, reports, conferences). Although the link is very tentative, the recent years have
Evaluation of flexicurity (2007-2010): final report
39
also witnessed the increasing prominence of social partnership in the formulation of the national policy (e.g. the main anti-crisis package was agreed through the mechanism of social partnership).
In Spain in 2009, consultation processes with social partners were launched by the government but as no agreement was reached during the process, the Government designed the content of the recovery measures alone (Real Decree 2/2009). Similarly, the discussion with social partners launched under the framework of the preparation of the 2010 labour market reform did not lead to any agreement; the content of the labour market reform was hence essentially based on the Royal Decree-Law 10/2010 of 16 of June again was simply taken by the Government.
The situation in the UK is characterised by the lack of formal tripartite dialogue; most reform initiatives are government led, with only weak involvement of social consultation. Most initiatives in the UK which follow and/or address certain aspects or principles of flexicurity are government led, and the engagement and involvement of social partners is through the routine processes of policy consultation. Typically, there is a twelve week consultation process during which time anyone can submit responses to a series of consultation questions. Individual unions, the Trade Union Congress (TUC), and relevant employer representative bodies present their views which are summarised and publicly reported.
4.4.3 Summary
No separate monitoring structures exist focussed specifically on the implementation of flexicurity approaches/pathways. The monitoring of flexicurity is thus dependant on the national context and tradition of policy monitoring and evaluation, which differs across the case study countries, reflecting the variation across the 27 Member States. Thus, the influence of the third common principle calling for effective monitoring of flexicurity progress cannot be traced in most case study countries. However, some interesting practices are noted in some case study countries and in Member States where data monitoring and evaluation is strong, the absence of a specific flexicurity monitoring strategy may as such not be a problem. Of greater concern is the widespread absence of evaluative data monitoring in many Member States.
In most of the Member States social partners played a role in devising the NRPs and in some Member States in the development of the national flexicurity approach or its elements. A more nuanced picture is emerging from the case study research. On one hand, in some countries social partners have had a strong role in the development of the main flexicurity-type measures at the national level (such as Austria, Germany, Finland and France). In other countries, social dialogue did play a role but in the implementation of key reforms the government pressed ahead bypassing the social dialogue results achieved so far or the views of social partners (e.g. Estonia, Spain and Italy). Finally, in a number of countries, the economic crisis has seen social partners marginalised completely (Hungary and Romania).
Notwithstanding these different experiences even in countries with strong traditions of social partnership, it remains important that social partner involvement in shaping the agenda continues to be conditioned by the strength and embeddedness of these organisations in the decision making process, which historically varies significantly from country to country. Further capacity building is clearly required in a number of countries to realise the aspiration of social partner involvement. An assessment of the impact of strong tripartism, for example in the running of labour market institutions such as the PES, might contribute to a better understanding of beneficial impact (or otherwise) of such arrangements on flexicurity policy and labour market outcomes.
Thus, the existence of the common flexicurity principle calling for the involvement of social partners in the design and implementation of flexicurity policies cannot clearly be linked to an enhanced role of social partners in the development of national policy (with the possible exception of Poland, although causality is difficult to establish).
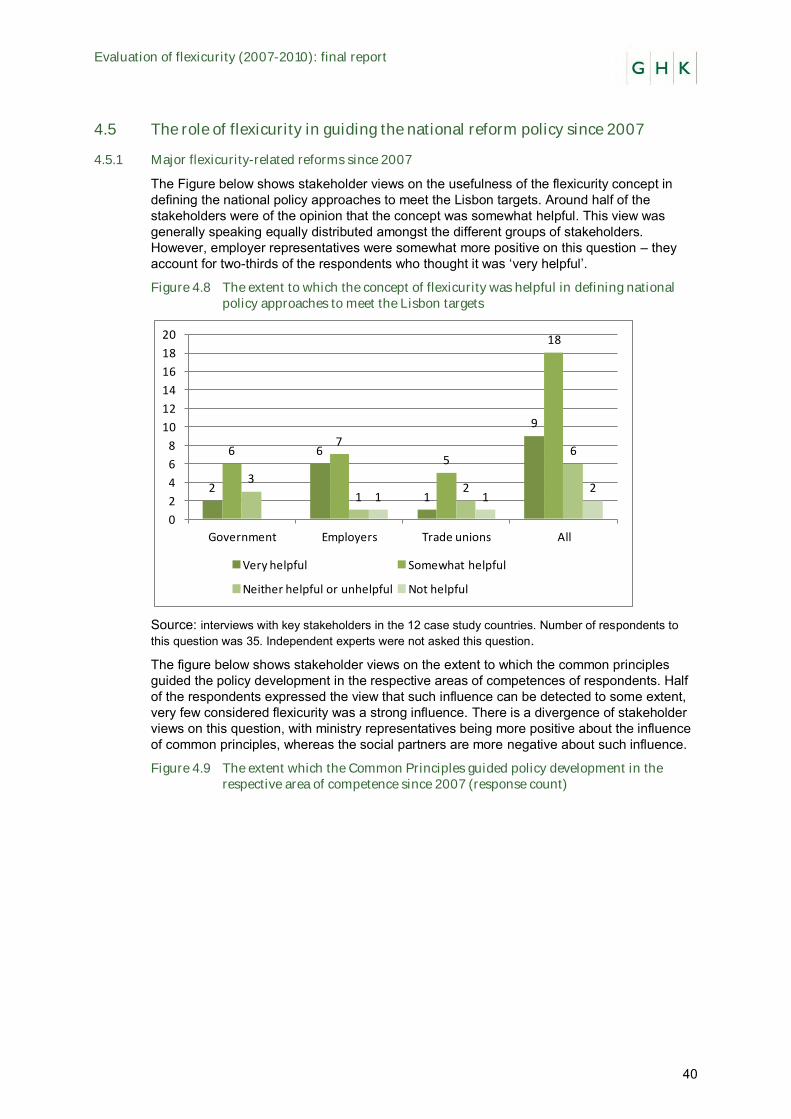
Evaluation of flexicurity (2007-2010): final report
40
4.5 The role of flexicurity in guiding the national reform policy since 2007
4.5.1 Major flexicurity-related reforms since 2007
The Figure below shows stakeholder views on the usefulness of the flexicurity concept in defining the national policy approaches to meet the Lisbon targets. Around half of the stakeholders were of the opinion that the concept was somewhat helpful. This view was generally speaking equally distributed amongst the different groups of stakeholders. However, employer representatives were somewhat more positive on this question – they account for two-thirds of the respondents who thought it was ‘very helpful’.
Figure 4.8 The extent to which the concept of flexicurity was helpful in defining national policy approaches to meet the Lisbon targets
Source: interviews with key stakeholders in the 12 case study countries. Number of respondents to this question was 35. Independent experts were not asked this question.
The figure below shows stakeholder views on the extent to which the common principles guided the policy development in the respective areas of competences of respondents. Half of the respondents expressed the view that such influence can be detected to some extent, very few considered flexicurity was a strong influence. There is a divergence of stakeholder views on this question, with ministry representatives being more positive about the influence of common principles, whereas the social partners are more negative about such influence.
Figure 4.9 The extent which the Common Principles guided policy development in the respective area of competence since 2007 (response count)
2
6
1
9
67
5
18
3
12
6
1 12
0
2
4
6
8
10
12
14
16
18
20
Government Employers Trade unions All
Very helpful Somewhat helpful
Neither helpful or unhelpful Not helpful
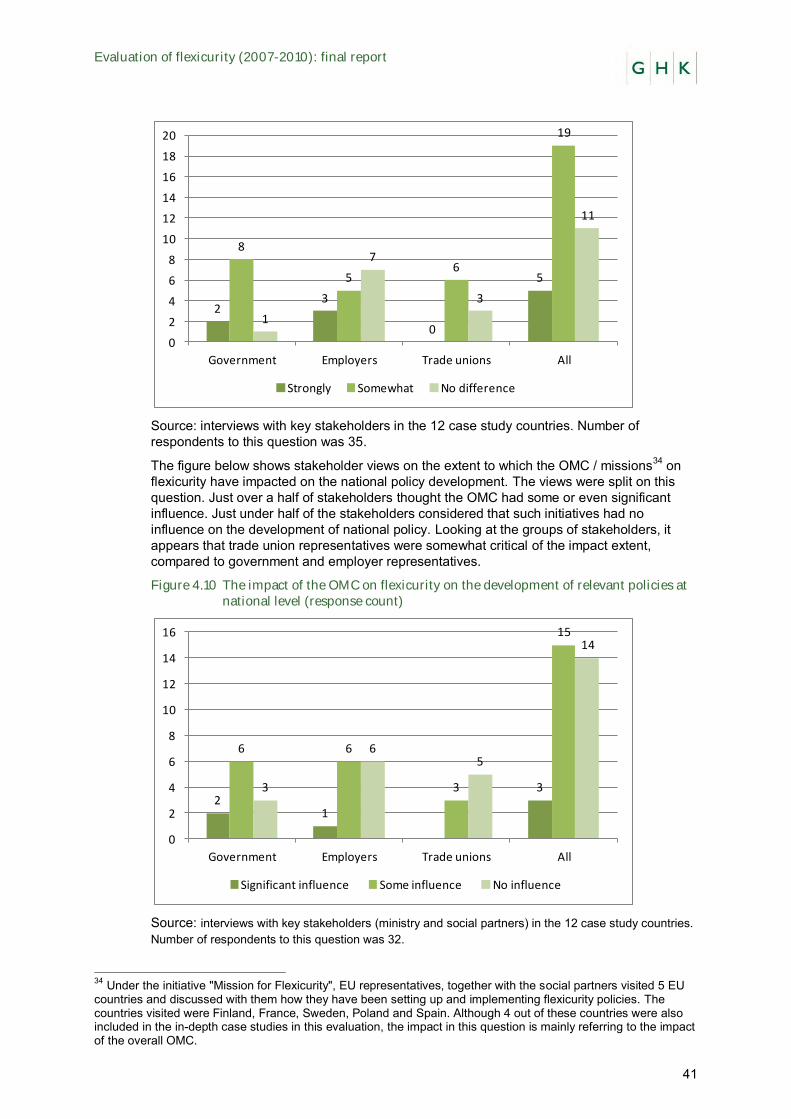
Evaluation of flexicurity (2007-2010): final report
41
Source: interviews with key stakeholders in the 12 case study countries. Number of respondents to this question was 35.
The figure below shows stakeholder views on the extent to which the OMC / missions34 on flexicurity have impacted on the national policy development. The views were split on this question. Just over a half of stakeholders thought the OMC had some or even significant influence. Just under half of the stakeholders considered that such initiatives had no influence on the development of national policy. Looking at the groups of stakeholders, it appears that trade union representatives were somewhat critical of the impact extent, compared to government and employer representatives.
Figure 4.10 The impact of the OMC on flexicurity on the development of relevant policies at national level (response count)
Source: interviews with key stakeholders (ministry and social partners) in the 12 case study countries. Number of respondents to this question was 32.
34 Under the initiative "Mission for Flexicurity", EU representatives, together with the social partners visited 5 EU countries and discussed with them how they have been setting up and implementing flexicurity policies. The countries visited were Finland, France, Sweden, Poland and Spain. Although 4 out of these countries were also included in the in-depth case studies in this evaluation, the impact in this question is mainly referring to the impact of the overall OMC.
23
0
5
8
56
19
1
7
3
11
0
2
4
6
8
10
12
14
16
18
20
Government Employers Trade unions All
Strongly Somewhat No difference
21
3
6 6
3
15
3
65
14
0
2
4
6
8
10
12
14
16
Government Employers Trade unions All
Significant influence Some influence No influence
Evaluation of flexicurity (2007-2010): final report
42
As shown in table 4.1 below, in most of the case study countries there have been significant initiatives and policy reforms implemented across the four component parts of flexicurity, in an attempt to reform the contractual arrangements, increase the impact of ALMPs, the participation in LLL and modernise the social security systems. The initiation of some of these reforms pre-date the launch of the EU’s first phase flexicurity initiative, and hence it is difficult to say which measures would or would not have been implemented without the EU focus on flexicurity. With most developments initiated after 2007, one of the key driving forces for reform was the need to respond to the rapidly unfolding economic crisis – rather than the EU’s flexicurity initiative. This is manifested in the hiatus of policy activity in some countries (and policy reversals in other countries) during the years 2009 and 2010 – when the impact of the crisis was severe in most of the case study countries.
However, what is clear is that flexicurity has been high on the political agenda and has provided an impetus to the debate at least in some case study countries.
Evidence 8 Impact of flexicurity on the major policy reforms 2007-2010
In Austria, the flexicurity focus (together with other EU initiatives, for example on LLL) facilitated debate on securing less protected employment relationships and pushing forward the debate on lifelong learning.
In Denmark, the impact of EU focus on flexicurity on post-2007 reforms in the country is perhaps most nuanced. The positive international and European interest in the Danish model of flexicurity has led to a growing attention to and appreciation of its core elements as a balance between flexibility (less stringent EPL) and security (generous income support, high participation and costs of LLL, strong ALMP) among national political actors and the social partners in Denmark. Under the influence of 2008 crisis, this changed in the sense of challenging the consensus behind the Danish version of flexicurity. There have been views expressed that the Danish labour market did not fare so well in the crisis precisely because of the Danish version of flexicurity – and especially the ease of firing that companies had when faced with diminished demand. In this respect, having the EU focus on flexicurity and awareness of other combinations of flexicurity which were responding better to the impacts of the crisis (e.g. the use of STWA in Germany) helped to inform the debate about the development of policies in Denmark. Such self reflection is consistent with the maturity of flexicurity as a concept in Denmark and a commitment to continuous improvement.
In Estonia, evidence indicates that the debate on flexicurity as an approach to achieve good labour market performance and foster competitiveness emerged mainly by the EU initiative. The different components of flexicurity were developed in a loosely connected manner before 2007 though they did not have an overarching general framework.
The major reforms carried out in France since 2007 built on the intersectoral agreement on modernising the labour market (reached in 2008, see Example 5 in Annex 1), which has been considered as a first outline of a French approach to flexicurity. The reforms involved aspects of all four main flexicurity components, including modernisation of income support benefits in order to allow them to be combined with work, forms of internal and external flexibilisation and improved support for job seekers and vocational training. However, no clear linkages have been made between these initiatives.
In Germany, a number of major policy reforms consistent with flexicurity have been introduced since 2007 but it is difficult to establish whether the EU’s flexicurity initiative had any influence on them. The most important flexibilisation reforms affecting employment contracts were introduced prior to 2007 (in the context of the Hartz Reforms) and the important number of social security reforms was the result of long-lasting debates and increasing pressure from demographic change. Similarly, the lifelong learning initiatives and ALMPs had already been implemented prior to 2007 and were merely extensions of the earlier programmes (see Example 6 in Annex 1).
In Hungary and Romania, the major reforms took place after 2010 and were not framed in the context of flexicurity. Instead they were driven by the urgent demands of the economic crisis, in an attempt to instil confidence in nervous investors.
In Italy, the concept of flexicurity appears to have influenced policy debates after 2007, but it had little effect on policy development in large part because the latter was mostly influenced by the developing economic crisis and related budget constraints. The exception was the Protocol on Pensions, Employment and Competitiveness 2007, which introduced a number of flexicurity-inspired reforms to Italy’s social security system.
In Poland, the concept of flexicurity was totally unknown before 2007 and it is still only known to a limited extent
Evaluation of flexicurity (2007-2010): final report
43
after this time. The debate on flexicurity in Poland only started with the publication of the Commission’s Communication in 2007 and is still not widespread (to date there is no Polish term for “flexicurity” and the key stakeholders rarely mention flexicurity when talking about labour market reforms).
In Spain, the first phase of the EU flexicurity initiative has had a limited impact on the national debate in the sense of leading to major reforms addressing the key challenges in the labour market. It did however open and provided impetus for the debate on the fundamental challenges facing the Spanish labour market and provided additional legitimacy to the discussions on the ‘right’ balance between flexibility and security in the labour market.
In the UK, the concept of flexicurity does not feature in the key national policy documents nor is it mentioned in the public debates and discussions about labour market reforms.
Although the current evaluation has focussed on the 2007-2010 period, a number of key policy reforms highly pertinent to the challenges of flexicurity were instigated in several Member States since 2010:
▪ In Italy, in March 2012 a draft bill on the fundamental reform of the labour market has been presented to the Parliament. The bill aims at favouring a more even distribution of employment protection, at increasing the efficiency and fairness of the unemployment benefit system and active labour market policies, at more effectively tackling the use of atypical contracts for eluding tax and contribution duties, and at modifying the conditions of individual firings. The reform introduces disincentives against temporary contracts and measures to combat the abuse of non-dependent work by firms. Exit flexibility is to be reformed through revising Article 18 of the Workers’ Statute regulating wrongful individual dismissals in firms with more than 15 employees. For collective dismissals, the draft law aims to simplify procedural obligations and reduce costs to employers. The reform also envisages an integrated and more comprehensive insurance-based system of unemployment benefits to be introduced as from 2017.
▪ In Spain, a comprehensive labour market reform was approved in mid-February 2012. The four most relevant elements of the reform are: a profound change of the collective bargaining process; the introduction of internal flexibility that allows employers to substantially modify working conditions (including wages); easing of firing; and improvement of training for workers. Active and passive labour market policies have been mixed in an innovative new open-ended contract. However, in light of the current economic recession, in the short term, it seems unlikely that the law will be able to prevent the loss of jobs and it has provoked social unrest and a general strike.
▪ In the UK, a proposal was put forward in 2011 to extend the employment qualifying period to bring claims against unfair dismissal from 1 to 2 years. By barring workers from being able to take action against unfair dismissal claims against their employers for the first two years, the coalition government follows a route of labour law reform that has been described by the prime minister as making sure “that employment law will not long be seen as a barrier to growth”. The initiative which in May 2011 was under formal consultation is a part of a broader reform package targeting the employment tribunal system that according to the government is "costly and time-consuming".
Based on the findings above and the evidence presented in Table 4.1 below, the impact of EU’s focus on flexicurity since 2008 as a mechanism for major reforms in the Member States can be conceptualised in terms of a continuum of influence:
▪ At one end of this continuum, the Commission’s flexicurity initiative acted to inspire the policy debate and resulted in the spirit of flexicurity being considered in the reforms implemented (e.g. in Austria, Estonia, Poland, France).
▪ At the other end of the spectrum, the Commission’s flexicurity initiative had a very limited influence on reforms, which were driven by contextual economic and political factors e.g. Denmark, where reforms have been driven by debates about existing policies in the context of the economic downturn; Germany, where the reforms have mostly been driven by demographic changes; Finland, where the reforms have been inspired by pre-existing concerns about reinventing the Nordic social model; the UK, where social partners have

Evaluation of flexicurity (2007-2010): final report
44
had a very limited influence; and Romania and Hungary, where reforms have been driven entirely by the crisis agenda.
▪ Finally, situated somewhere in between these two points, there are countries where the flexicurity initiative has had some impact, although this has been limited (e.g. Spain and Italy).
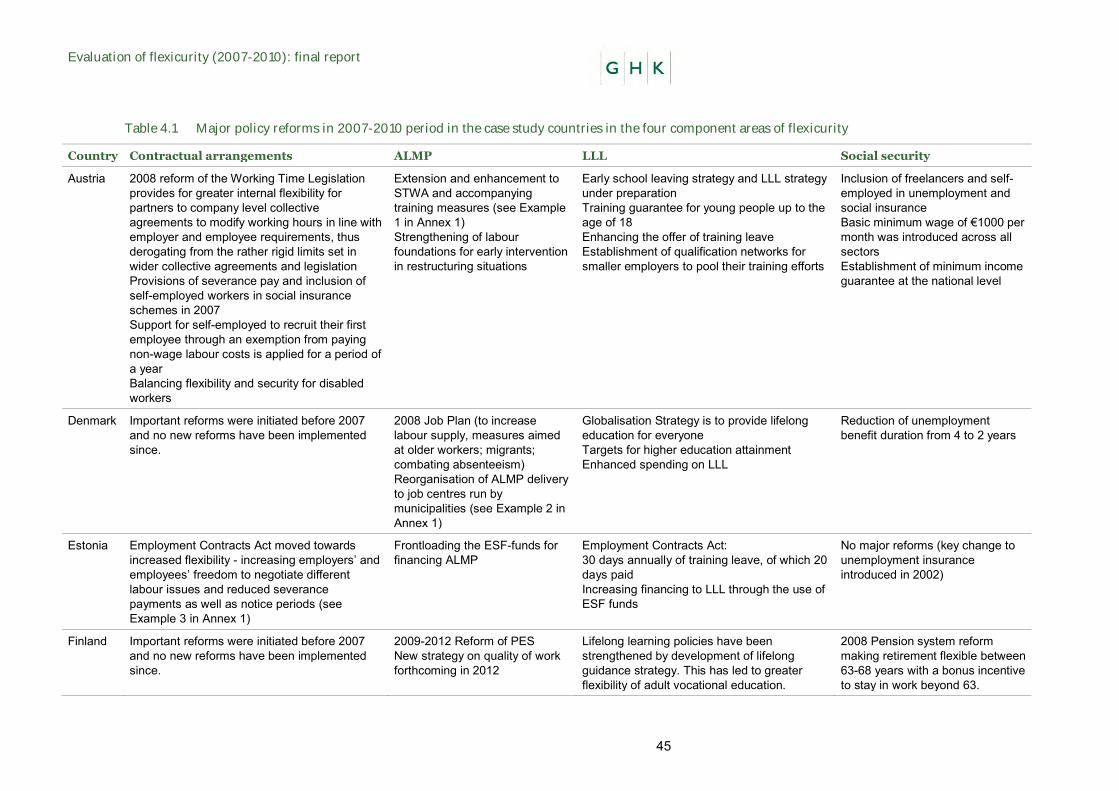
Evaluation of flexicurity (2007-2010): final report
45
Table 4.1 Major policy reforms in 2007-2010 period in the case study countries in the four component areas of flexicurity
Country Contractual arrangements ALMP LLL Social security
Austria 2008 reform of the Working Time Legislation provides for greater internal flexibility for partners to company level collective agreements to modify working hours in line with employer and employee requirements, thus derogating from the rather rigid limits set in wider collective agreements and legislation Provisions of severance pay and inclusion of self-employed workers in social insurance schemes in 2007 Support for self-employed to recruit their first employee through an exemption from paying non-wage labour costs is applied for a period of a year Balancing flexibility and security for disabled workers
Extension and enhancement to STWA and accompanying training measures (see Example 1 in Annex 1) Strengthening of labour foundations for early intervention in restructuring situations
Early school leaving strategy and LLL strategy under preparation Training guarantee for young people up to the age of 18 Enhancing the offer of training leave Establishment of qualification networks for smaller employers to pool their training efforts
Inclusion of freelancers and self-employed in unemployment and social insurance Basic minimum wage of €1000 per month was introduced across all sectors Establishment of minimum income guarantee at the national level
Denmark Important reforms were initiated before 2007 and no new reforms have been implemented since.
2008 Job Plan (to increase labour supply, measures aimed at older workers; migrants; combating absenteeism) Reorganisation of ALMP delivery to job centres run by municipalities (see Example 2 in Annex 1)
Globalisation Strategy is to provide lifelong education for everyone Targets for higher education attainment Enhanced spending on LLL
Reduction of unemployment benefit duration from 4 to 2 years
Estonia Employment Contracts Act moved towards increased flexibility - increasing employers’ and employees’ freedom to negotiate different labour issues and reduced severance payments as well as notice periods (see Example 3 in Annex 1)
Frontloading the ESF-funds for financing ALMP
Employment Contracts Act: 30 days annually of training leave, of which 20 days paid Increasing financing to LLL through the use of ESF funds
No major reforms (key change to unemployment insurance introduced in 2002)
Finland Important reforms were initiated before 2007 and no new reforms have been implemented since.
2009-2012 Reform of PES New strategy on quality of work forthcoming in 2012
Lifelong learning policies have been strengthened by development of lifelong guidance strategy. This has led to greater flexibility of adult vocational education.
2008 Pension system reform making retirement flexible between 63-68 years with a bonus incentive to stay in work beyond 63.
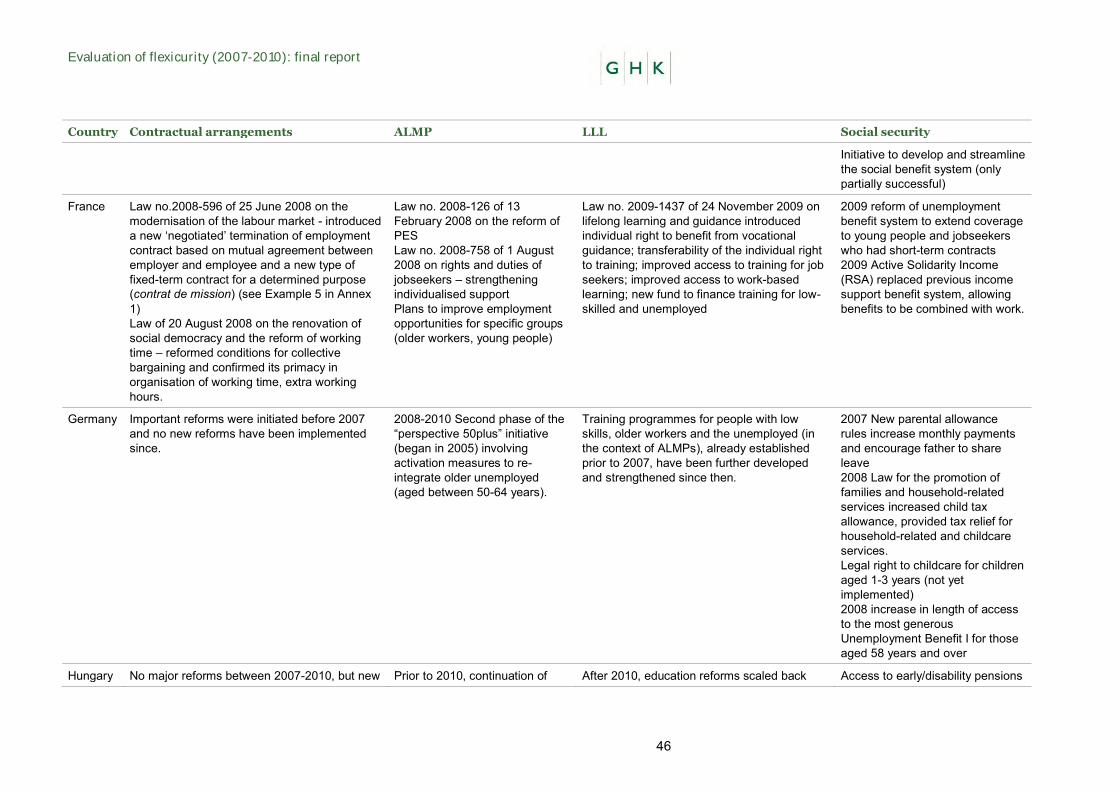
Evaluation of flexicurity (2007-2010): final report
46
Country Contractual arrangements ALMP LLL Social security
Initiative to develop and streamline the social benefit system (only partially successful)
France Law no.2008-596 of 25 June 2008 on the modernisation of the labour market - introduced a new ‘negotiated’ termination of employment contract based on mutual agreement between employer and employee and a new type of fixed-term contract for a determined purpose (contrat de mission) (see Example 5 in Annex 1) Law of 20 August 2008 on the renovation of social democracy and the reform of working time – reformed conditions for collective bargaining and confirmed its primacy in organisation of working time, extra working hours.
Law no. 2008-126 of 13 February 2008 on the reform of PES Law no. 2008-758 of 1 August 2008 on rights and duties of jobseekers – strengthening individualised support Plans to improve employment opportunities for specific groups (older workers, young people)
Law no. 2009-1437 of 24 November 2009 on lifelong learning and guidance introduced individual right to benefit from vocational guidance; transferability of the individual right to training; improved access to training for job seekers; improved access to work-based learning; new fund to finance training for low-skilled and unemployed
2009 reform of unemployment benefit system to extend coverage to young people and jobseekers who had short-term contracts 2009 Active Solidarity Income (RSA) replaced previous income support benefit system, allowing benefits to be combined with work.
Germany Important reforms were initiated before 2007 and no new reforms have been implemented since.
2008-2010 Second phase of the “perspective 50plus” initiative (began in 2005) involving activation measures to re-integrate older unemployed (aged between 50-64 years).
Training programmes for people with low skills, older workers and the unemployed (in the context of ALMPs), already established prior to 2007, have been further developed and strengthened since then.
2007 New parental allowance rules increase monthly payments and encourage father to share leave 2008 Law for the promotion of families and household-related services increased child tax allowance, provided tax relief for household-related and childcare services. Legal right to childcare for children aged 1-3 years (not yet implemented) 2008 increase in length of access to the most generous Unemployment Benefit I for those aged 58 years and over
Hungary No major reforms between 2007-2010, but new Prior to 2010, continuation of After 2010, education reforms scaled back Access to early/disability pensions
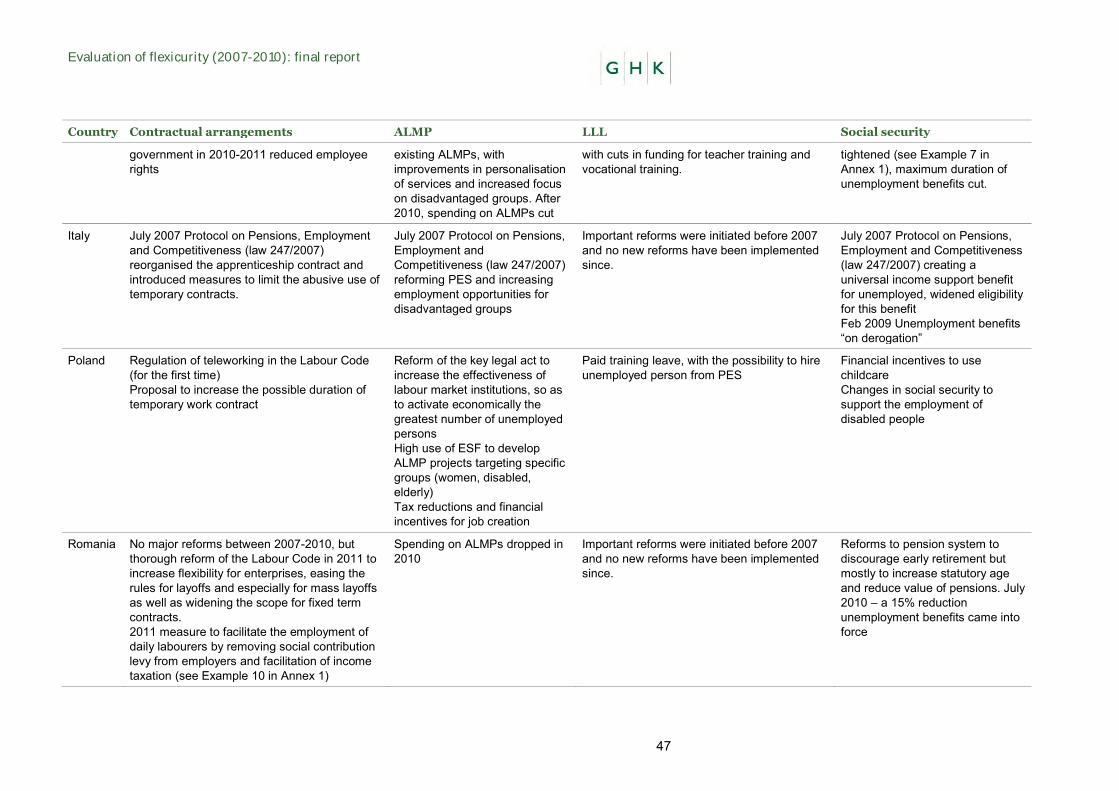
Evaluation of flexicurity (2007-2010): final report
47
Country Contractual arrangements ALMP LLL Social security
government in 2010-2011 reduced employee rights
existing ALMPs, with improvements in personalisation of services and increased focus on disadvantaged groups. After 2010, spending on ALMPs cut
with cuts in funding for teacher training and vocational training.
tightened (see Example 7 in Annex 1), maximum duration of unemployment benefits cut.
Italy July 2007 Protocol on Pensions, Employment and Competitiveness (law 247/2007) reorganised the apprenticeship contract and introduced measures to limit the abusive use of temporary contracts.
July 2007 Protocol on Pensions, Employment and Competitiveness (law 247/2007) reforming PES and increasing employment opportunities for disadvantaged groups
Important reforms were initiated before 2007 and no new reforms have been implemented since.
July 2007 Protocol on Pensions, Employment and Competitiveness (law 247/2007) creating a universal income support benefit for unemployed, widened eligibility for this benefit Feb 2009 Unemployment benefits “on derogation”
Poland Regulation of teleworking in the Labour Code (for the first time) Proposal to increase the possible duration of temporary work contract
Reform of the key legal act to increase the effectiveness of labour market institutions, so as to activate economically the greatest number of unemployed persons High use of ESF to develop ALMP projects targeting specific groups (women, disabled, elderly) Tax reductions and financial incentives for job creation
Paid training leave, with the possibility to hire unemployed person from PES
Financial incentives to use childcare Changes in social security to support the employment of disabled people
Romania No major reforms between 2007-2010, but thorough reform of the Labour Code in 2011 to increase flexibility for enterprises, easing the rules for layoffs and especially for mass layoffs as well as widening the scope for fixed term contracts. 2011 measure to facilitate the employment of daily labourers by removing social contribution levy from employers and facilitation of income taxation (see Example 10 in Annex 1)
Spending on ALMPs dropped in 2010
Important reforms were initiated before 2007 and no new reforms have been implemented since.
Reforms to pension system to discourage early retirement but mostly to increase statutory age and reduce value of pensions. July 2010 – a 15% reduction unemployment benefits came into force
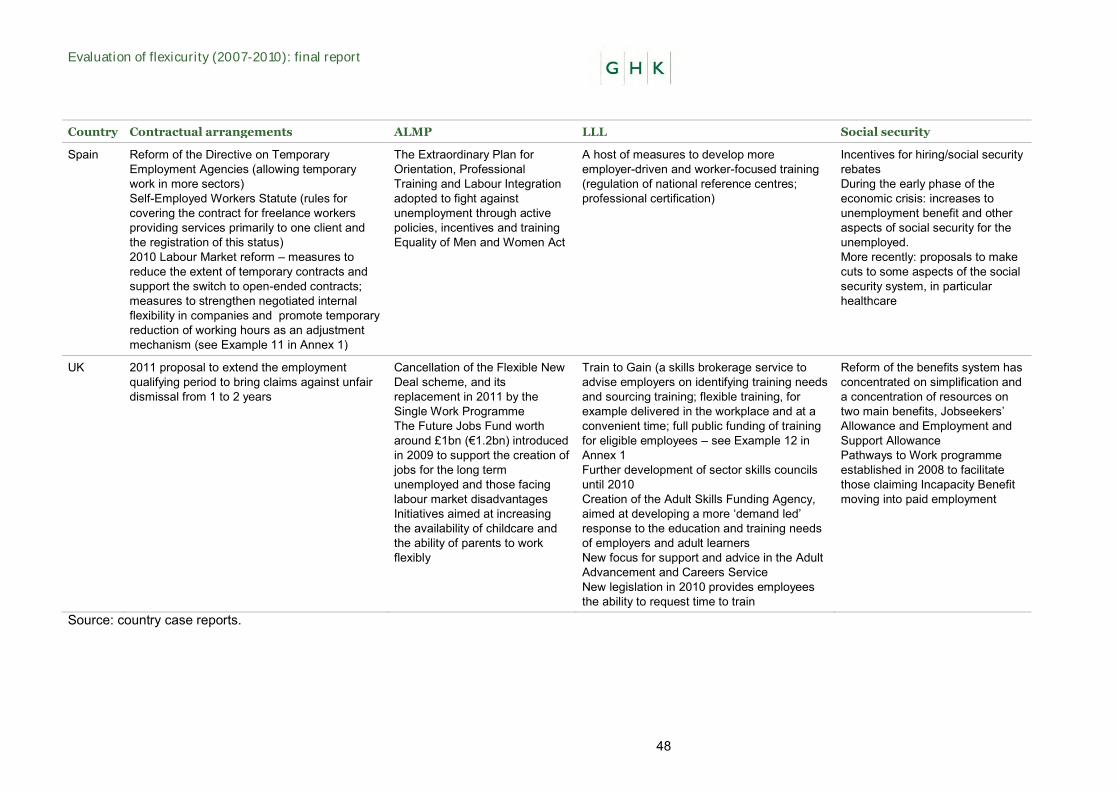
Evaluation of flexicurity (2007-2010): final report
48
Country Contractual arrangements ALMP LLL Social security
Spain Reform of the Directive on Temporary Employment Agencies (allowing temporary work in more sectors) Self-Employed Workers Statute (rules for covering the contract for freelance workers providing services primarily to one client and the registration of this status) 2010 Labour Market reform – measures to reduce the extent of temporary contracts and support the switch to open-ended contracts; measures to strengthen negotiated internal flexibility in companies and promote temporary reduction of working hours as an adjustment mechanism (see Example 11 in Annex 1)
The Extraordinary Plan for Orientation, Professional Training and Labour Integration adopted to fight against unemployment through active policies, incentives and training Equality of Men and Women Act
A host of measures to develop more employer-driven and worker-focused training (regulation of national reference centres; professional certification)
Incentives for hiring/social security rebates During the early phase of the economic crisis: increases to unemployment benefit and other aspects of social security for the unemployed. More recently: proposals to make cuts to some aspects of the social security system, in particular healthcare
UK 2011 proposal to extend the employment qualifying period to bring claims against unfair dismissal from 1 to 2 years
Cancellation of the Flexible New Deal scheme, and its replacement in 2011 by the Single Work Programme The Future Jobs Fund worth around £1bn (€1.2bn) introduced in 2009 to support the creation of jobs for the long term unemployed and those facing labour market disadvantages Initiatives aimed at increasing the availability of childcare and the ability of parents to work flexibly
Train to Gain (a skills brokerage service to advise employers on identifying training needs and sourcing training; flexible training, for example delivered in the workplace and at a convenient time; full public funding of training for eligible employees – see Example 12 in Annex 1 Further development of sector skills councils until 2010 Creation of the Adult Skills Funding Agency, aimed at developing a more ‘demand led’ response to the education and training needs of employers and adult learners New focus for support and advice in the Adult Advancement and Careers Service New legislation in 2010 provides employees the ability to request time to train
Reform of the benefits system has concentrated on simplification and a concentration of resources on two main benefits, Jobseekers’ Allowance and Employment and Support Allowance Pathways to Work programme established in 2008 to facilitate those claiming Incapacity Benefit moving into paid employment
Source: country case reports.
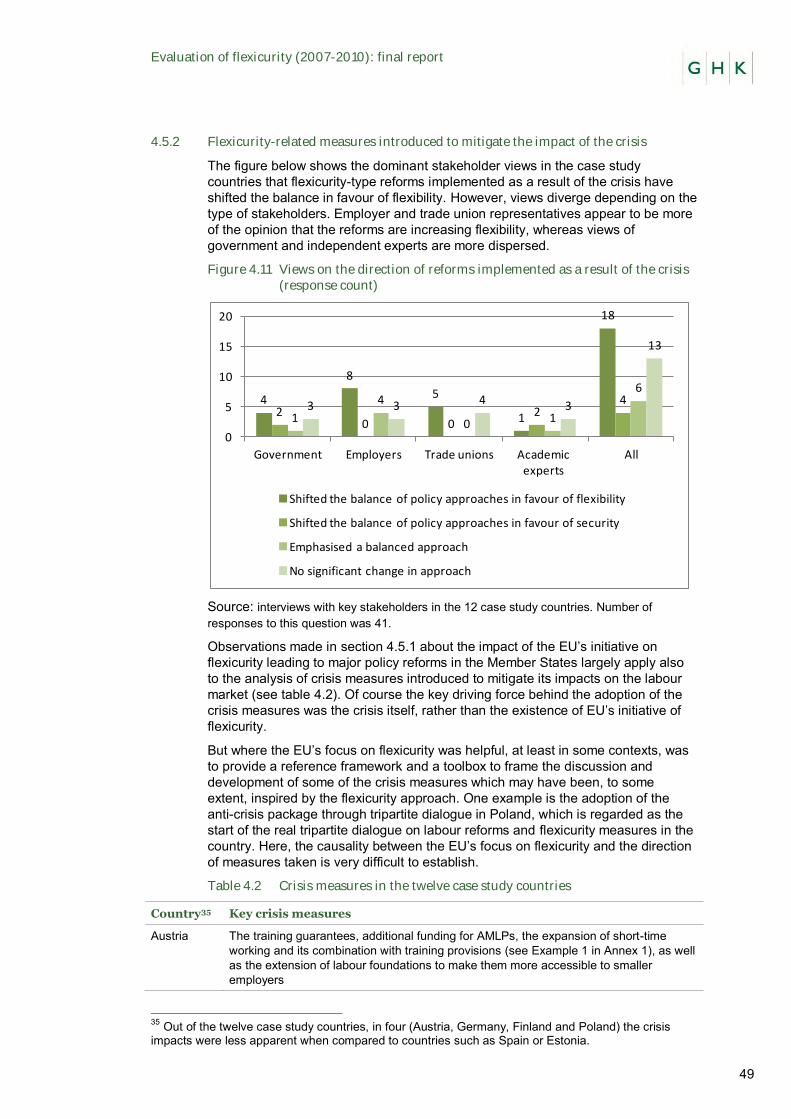
Evaluation of flexicurity (2007-2010): final report
49
4.5.2 Flexicurity-related measures introduced to mitigate the impact of the crisis
The figure below shows the dominant stakeholder views in the case study countries that flexicurity-type reforms implemented as a result of the crisis have shifted the balance in favour of flexibility. However, views diverge depending on the type of stakeholders. Employer and trade union representatives appear to be more of the opinion that the reforms are increasing flexibility, whereas views of government and independent experts are more dispersed.
Figure 4.11 Views on the direction of reforms implemented as a result of the crisis (response count)
Source: interviews with key stakeholders in the 12 case study countries. Number of responses to this question was 41.
Observations made in section 4.5.1 about the impact of the EU’s initiative on flexicurity leading to major policy reforms in the Member States largely apply also to the analysis of crisis measures introduced to mitigate its impacts on the labour market (see table 4.2). Of course the key driving force behind the adoption of the crisis measures was the crisis itself, rather than the existence of EU’s initiative of flexicurity.
But where the EU’s focus on flexicurity was helpful, at least in some contexts, was to provide a reference framework and a toolbox to frame the discussion and development of some of the crisis measures which may have been, to some extent, inspired by the flexicurity approach. One example is the adoption of the anti-crisis package through tripartite dialogue in Poland, which is regarded as the start of the real tripartite dialogue on labour reforms and flexicurity measures in the country. Here, the causality between the EU’s focus on flexicurity and the direction of measures taken is very difficult to establish.
Table 4.2 Crisis measures in the twelve case study countries
Country35 Key crisis measures
Austria The training guarantees, additional funding for AMLPs, the expansion of short-time working and its combination with training provisions (see Example 1 in Annex 1), as well as the extension of labour foundations to make them more accessible to smaller employers
35 Out of the twelve case study countries, in four (Austria, Germany, Finland and Poland) the crisis impacts were less apparent when compared to countries such as Spain or Estonia.
4
8
5
1
18
20 0
24
1
4
0 1
6
3 3 4 3
13
0
5
10
15
20
Government Employers Trade unions Academic experts
All
Shifted the balance of policy approaches in favour of flexibility
Shifted the balance of policy approaches in favour of security
Emphasised a balanced approach
No significant change in approach
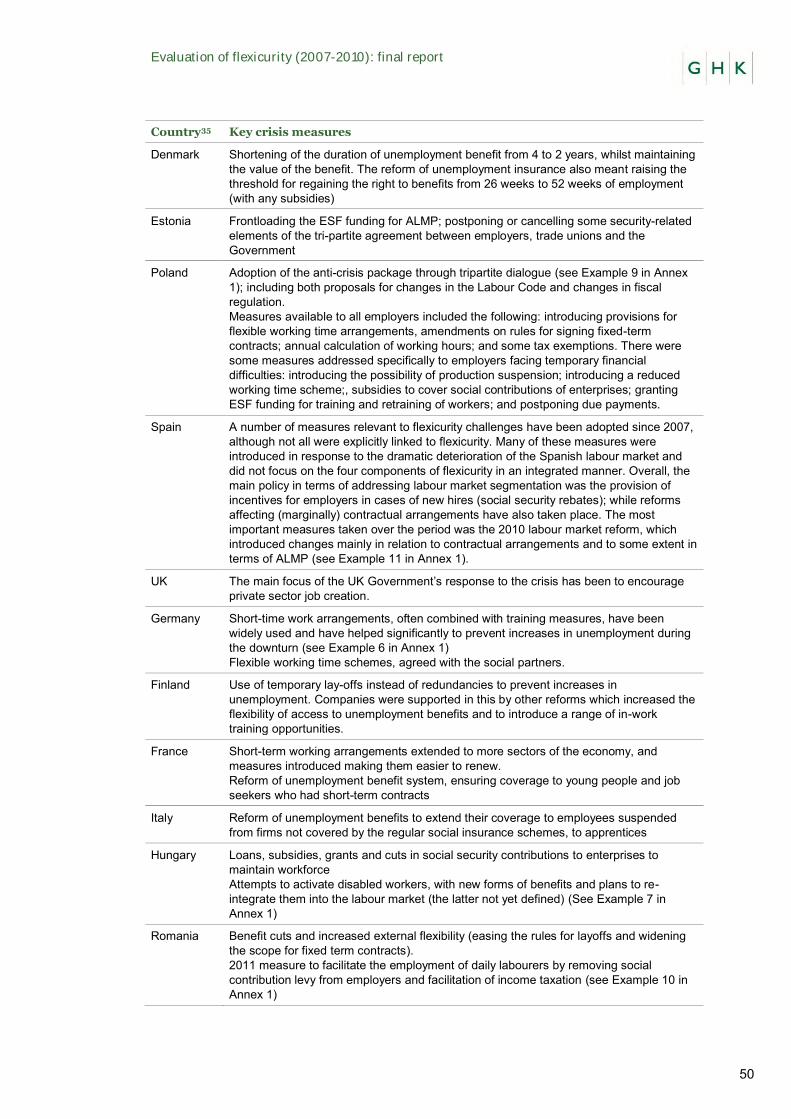
Evaluation of flexicurity (2007-2010): final report
50
Country35 Key crisis measures
Denmark Shortening of the duration of unemployment benefit from 4 to 2 years, whilst maintaining the value of the benefit. The reform of unemployment insurance also meant raising the threshold for regaining the right to benefits from 26 weeks to 52 weeks of employment (with any subsidies)
Estonia Frontloading the ESF funding for ALMP; postponing or cancelling some security-related elements of the tri-partite agreement between employers, trade unions and the Government
Poland Adoption of the anti-crisis package through tripartite dialogue (see Example 9 in Annex 1); including both proposals for changes in the Labour Code and changes in fiscal regulation. Measures available to all employers included the following: introducing provisions for flexible working time arrangements, amendments on rules for signing fixed-term contracts; annual calculation of working hours; and some tax exemptions. There were some measures addressed specifically to employers facing temporary financial difficulties: introducing the possibility of production suspension; introducing a reduced working time scheme;, subsidies to cover social contributions of enterprises; granting ESF funding for training and retraining of workers; and postponing due payments.
Spain A number of measures relevant to flexicurity challenges have been adopted since 2007, although not all were explicitly linked to flexicurity. Many of these measures were introduced in response to the dramatic deterioration of the Spanish labour market and did not focus on the four components of flexicurity in an integrated manner. Overall, the main policy in terms of addressing labour market segmentation was the provision of incentives for employers in cases of new hires (social security rebates); while reforms affecting (marginally) contractual arrangements have also taken place. The most important measures taken over the period was the 2010 labour market reform, which introduced changes mainly in relation to contractual arrangements and to some extent in terms of ALMP (see Example 11 in Annex 1).
UK The main focus of the UK Government’s response to the crisis has been to encourage private sector job creation.
Germany Short-time work arrangements, often combined with training measures, have been widely used and have helped significantly to prevent increases in unemployment during the downturn (see Example 6 in Annex 1) Flexible working time schemes, agreed with the social partners.
Finland Use of temporary lay-offs instead of redundancies to prevent increases in unemployment. Companies were supported in this by other reforms which increased the flexibility of access to unemployment benefits and to introduce a range of in-work training opportunities.
France Short-term working arrangements extended to more sectors of the economy, and measures introduced making them easier to renew. Reform of unemployment benefit system, ensuring coverage to young people and job seekers who had short-term contracts
Italy Reform of unemployment benefits to extend their coverage to employees suspended from firms not covered by the regular social insurance schemes, to apprentices
Hungary Loans, subsidies, grants and cuts in social security contributions to enterprises to maintain workforce Attempts to activate disabled workers, with new forms of benefits and plans to re-integrate them into the labour market (the latter not yet defined) (See Example 7 in Annex 1)
Romania Benefit cuts and increased external flexibility (easing the rules for layoffs and widening the scope for fixed term contracts). 2011 measure to facilitate the employment of daily labourers by removing social contribution levy from employers and facilitation of income taxation (see Example 10 in Annex 1)
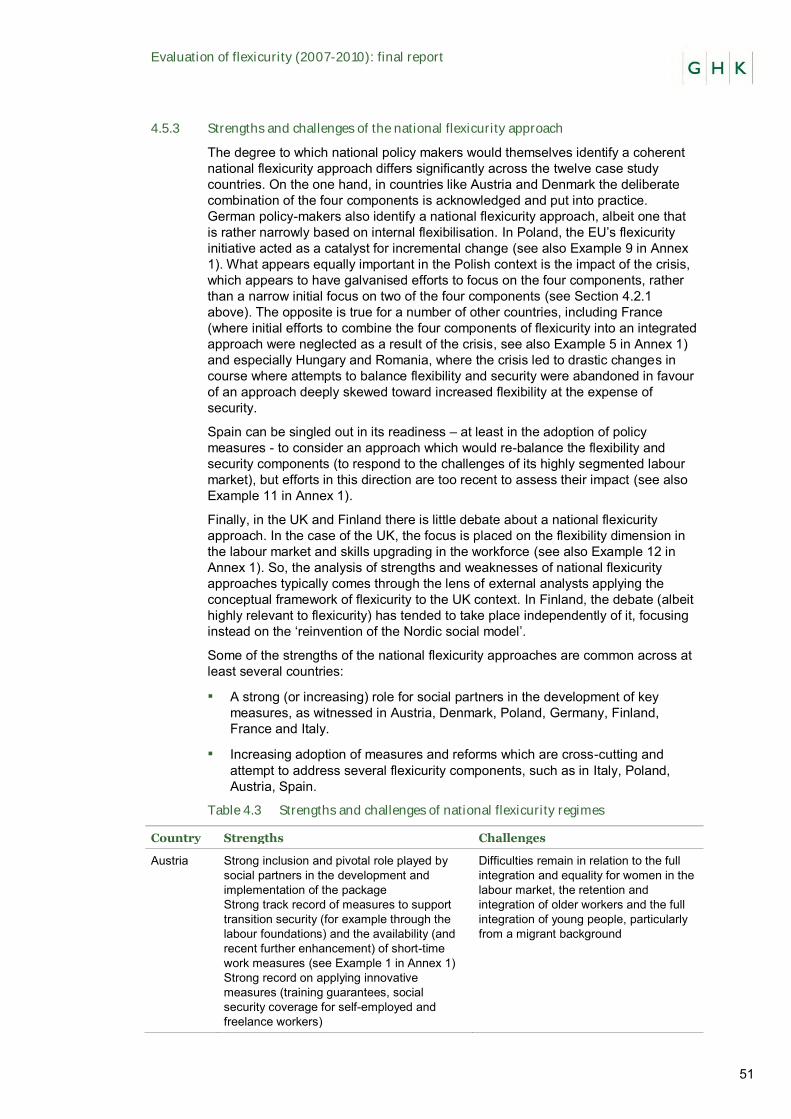
Evaluation of flexicurity (2007-2010): final report
51
4.5.3 Strengths and challenges of the national flexicurity approach
The degree to which national policy makers would themselves identify a coherent national flexicurity approach differs significantly across the twelve case study countries. On the one hand, in countries like Austria and Denmark the deliberate combination of the four components is acknowledged and put into practice. German policy-makers also identify a national flexicurity approach, albeit one that is rather narrowly based on internal flexibilisation. In Poland, the EU’s flexicurity initiative acted as a catalyst for incremental change (see also Example 9 in Annex 1). What appears equally important in the Polish context is the impact of the crisis, which appears to have galvanised efforts to focus on the four components, rather than a narrow initial focus on two of the four components (see Section 4.2.1 above). The opposite is true for a number of other countries, including France (where initial efforts to combine the four components of flexicurity into an integrated approach were neglected as a result of the crisis, see also Example 5 in Annex 1) and especially Hungary and Romania, where the crisis led to drastic changes in course where attempts to balance flexibility and security were abandoned in favour of an approach deeply skewed toward increased flexibility at the expense of security.
Spain can be singled out in its readiness – at least in the adoption of policy measures - to consider an approach which would re-balance the flexibility and security components (to respond to the challenges of its highly segmented labour market), but efforts in this direction are too recent to assess their impact (see also Example 11 in Annex 1).
Finally, in the UK and Finland there is little debate about a national flexicurity approach. In the case of the UK, the focus is placed on the flexibility dimension in the labour market and skills upgrading in the workforce (see also Example 12 in Annex 1). So, the analysis of strengths and weaknesses of national flexicurity approaches typically comes through the lens of external analysts applying the conceptual framework of flexicurity to the UK context. In Finland, the debate (albeit highly relevant to flexicurity) has tended to take place independently of it, focusing instead on the ‘reinvention of the Nordic social model’.
Some of the strengths of the national flexicurity approaches are common across at least several countries:
▪ A strong (or increasing) role for social partners in the development of key measures, as witnessed in Austria, Denmark, Poland, Germany, Finland, France and Italy.
▪ Increasing adoption of measures and reforms which are cross-cutting and attempt to address several flexicurity components, such as in Italy, Poland, Austria, Spain.
Table 4.3 Strengths and challenges of national flexicurity regimes
Country Strengths Challenges
Austria Strong inclusion and pivotal role played by social partners in the development and implementation of the package Strong track record of measures to support transition security (for example through the labour foundations) and the availability (and recent further enhancement) of short-time work measures (see Example 1 in Annex 1) Strong record on applying innovative measures (training guarantees, social security coverage for self-employed and freelance workers)
Difficulties remain in relation to the full integration and equality for women in the labour market, the retention and integration of older workers and the full integration of young people, particularly from a migrant background
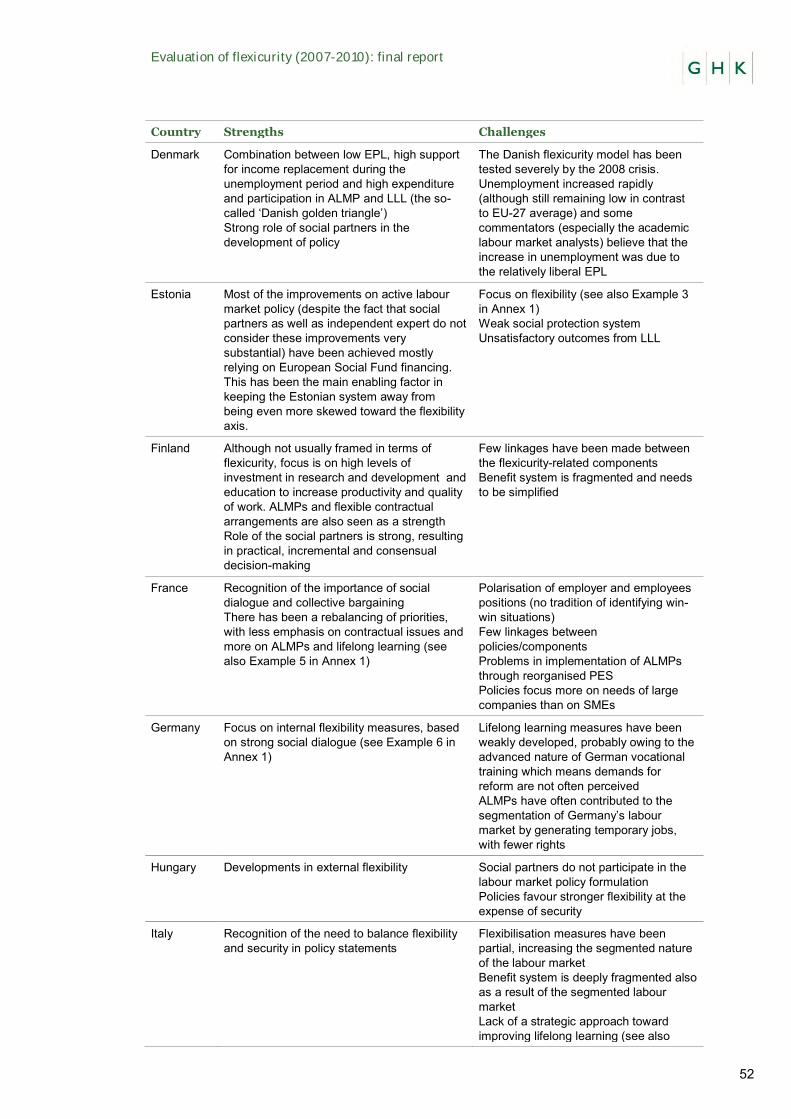
Evaluation of flexicurity (2007-2010): final report
52
Country Strengths Challenges
Denmark Combination between low EPL, high support for income replacement during the unemployment period and high expenditure and participation in ALMP and LLL (the so-called ‘Danish golden triangle’) Strong role of social partners in the development of policy
The Danish flexicurity model has been tested severely by the 2008 crisis. Unemployment increased rapidly (although still remaining low in contrast to EU-27 average) and some commentators (especially the academic labour market analysts) believe that the increase in unemployment was due to the relatively liberal EPL
Estonia Most of the improvements on active labour market policy (despite the fact that social partners as well as independent expert do not consider these improvements very substantial) have been achieved mostly relying on European Social Fund financing. This has been the main enabling factor in keeping the Estonian system away from being even more skewed toward the flexibility axis.
Focus on flexibility (see also Example 3 in Annex 1) Weak social protection system Unsatisfactory outcomes from LLL
Finland Although not usually framed in terms of flexicurity, focus is on high levels of investment in research and development and education to increase productivity and quality of work. ALMPs and flexible contractual arrangements are also seen as a strength Role of the social partners is strong, resulting in practical, incremental and consensual decision-making
Few linkages have been made between the flexicurity-related components Benefit system is fragmented and needs to be simplified
France Recognition of the importance of social dialogue and collective bargaining There has been a rebalancing of priorities, with less emphasis on contractual issues and more on ALMPs and lifelong learning (see also Example 5 in Annex 1)
Polarisation of employer and employees positions (no tradition of identifying win-win situations) Few linkages between policies/components Problems in implementation of ALMPs through reorganised PES Policies focus more on needs of large companies than on SMEs
Germany Focus on internal flexibility measures, based on strong social dialogue (see Example 6 in Annex 1)
Lifelong learning measures have been weakly developed, probably owing to the advanced nature of German vocational training which means demands for reform are not often perceived ALMPs have often contributed to the segmentation of Germany’s labour market by generating temporary jobs, with fewer rights
Hungary Developments in external flexibility Social partners do not participate in the labour market policy formulation Policies favour stronger flexibility at the expense of security
Italy Recognition of the need to balance flexibility and security in policy statements
Flexibilisation measures have been partial, increasing the segmented nature of the labour market Benefit system is deeply fragmented also as a result of the segmented labour market Lack of a strategic approach toward improving lifelong learning (see also
Evaluation of flexicurity (2007-2010): final report
53
Country Strengths Challenges
Example 8 in Annex 1) Regional variations in ALMPs remain significant
Poland Increasing role of social partners Combinations of several components of flexicurity in recent reforms (see Example 9 in Annex 1) Increasing ALMP; increased targeting
Need for better coordination between different components of flexicurity
Romania Progress made in terms of external flexibility Social partners do not have a strong role in policy formulation Policies are deeply skewed toward flexibility at the expense of security
Spain Recent reforms attempting to combine the components of flexicurity (2010 labour market reform, which introduced changes mainly in relation to contractual arrangements and to some extent in terms of ALMP, see Example 11 in Annex 1)
Lack of equilibrium between security and flexibility Inability of undertaken reforms to reduce labour market segmentation Very centralised collective bargaining Lack of longer-term strategic planning
UK Focus on skills upgrading came from the recognition that low levels of domestic skills were a threat to UK global economic competitiveness as low-wage economies were becoming stronger due to reduced trade barriers and higher skill levels, leading to the loss UK jobs through offshoring, particularly in low value manufacturing (see Example 12 in Annex 1)
Policies implemented prior to, and between, 2008-2010 were pursued in order to enable businesses to operate in as flexible of an environment as possible. Increased focus on conditionality in the benefits system, particularly in the new Work Programme illustrates a desire to lower social security spending and to reduce the overall burden on the state. Challenge is also the reliance on the private sector to generate jobs, which has been limited (particularly in the context of a double dip recession).
4.5.4 Summary
In all the case study countries there have been significant initiatives and policy reforms implemented across the four components of flexicurity, in an attempt to reform the contractual arrangements, increase the impact of ALMPs, the participation in LLL and modernise the social security systems. The initiation of some of these reforms pre-date the launch of the EU’s first phase of flexicurity, and hence it is difficult to say which measures would or would not have been implemented without the EU focus on flexicurity. With most of the developments initiated after 2007, one of the key driving forces for reform was the need to respond to rapidly unfolding economic crisis. This is manifest in the hiatus of policy activity (and in some cases policy reversals) during the years 2009 and 2010 – when the impacts of the crisis have become severe in most of the case study countries.
However, as mentioned above, the key challenges related to flexicurity have been high on the political agenda and the flexicurity concept has provided an impetus to the debate at least in some case study countries reviewed.
Therefore, the impact of EU’s focus on flexicurity since 2008 to spur major reforms in the Member States can be conceptualised in terms of a continuum of influence from being a relatively important inspiration and innovation in the debate and encouraging policy-makers to acknowledge the interconnectedness of the four main flexicurity components (examples of Austria, Estonia, Poland, France) to having more limited impact but still fostering the debate (example of Spain, Italy) to
Evaluation of flexicurity (2007-2010): final report
54
having very limited influence (examples of Denmark, UK, and, after 2010, in Hungary and Romania).
In the context of the crisis measures, the EU’s focus on flexicurity was helpful, at least in some contexts, in providing a reference framework and a toolbox to frame the discussion and development of some of the crisis measures which could have been to some extent inspired by the flexicurity approach (e.g. the adoption of the anti-crisis package through tripartite dialogue in Poland is regarded as the start of the real tripartite dialogue on labour reforms and flexicurity measures in the country; it also addresses several flexicurity elements). Here, the causality between the EU’s focus on flexicurity and the direction of measures taken is however very difficult to establish. In other countries, however, the impact of the crisis has been so severe (such as Romania and Hungary), that policy developments have been driven entirely by emergency measures.
4.6 Summary of overall findings
4.6.1 Impact on articulation of flexicurity as overarching strategy combining the four components
In terms of balancing flexibility and security, a continuum of approaches was noted, from countries where moves to more flexibility are predominantly balanced out with simultaneous measures to increase security (such as Austria and France); to countries with clear emphasis on flexibility. Examples are reforms of contractual relationships as in Estonia or the 2010 labour market reform in Spain, or the emphasis on maintaining the relatively liberal EPL as in the UK. In some countries, the flexibilisation drive (after 2010) has strongly undermined security, including Romania and Hungary. There are also examples of countries where the national policy direction during the 2007-2010 period was not so much focussed on the tensions in balancing flexibility with security, but more on the concurrent development of the four flexicurity components of ALMP, LLL, contractual relations and social protection systems (such as in Finland, to some extent, Denmark and Poland).
To sum up, the existence of the common flexicurity principles calling for a deliberate combination and policy mix simultaneously reforming several elements has not been translated into a widespread adoption of spirit of the classic flexicurity approach across the Member States.
4.6.2 Impact on policy/political debates
The vast majority of NRPs (which were conceived as a key policy framework to drive national reforms) have a reference to flexicurity and state that their approach to flexicurity is integrated and reflects the articulation of the EU’s focus on flexicurity. In most NRPs, however, references to flexicurity are only contained in the employment section. There are no links to flexicurity in the other sections of the NRPs, even though these sections touch on topics relevant to the flexicurity components. There is also a tendency to see flexicurity in more narrow labour law and contractual arrangement terms than a concept to better achieve employment and income security while maintaining flexibility in the labour market. The implementation of flexicurity as integrated policy mix also needs to include a focus on economic and regional policy approaches – a link which is rarely made in NRPs.
There are countries which have treated flexicurity as a cross-cutting strategy in the employment part of the NRP with several of its elements being developed or planned for development (for example, Austria, Denmark, Finland, Romania, Hungary). In other countries, there is little articulation of comprehensive approach across the four components or eight principles to tackle the main labour market challenges (for example, Estonia, UK, Spain).
Evaluation of flexicurity (2007-2010): final report
55
Flexicurity has been relevant to political discussions in the 12 case study countries under investigation, notwithstanding the different policy challenges and policy frameworks which they face. Thus, in countries like Poland, Hungary, Romania and Spain, where unemployment has historically been tackled by means of passive income support, the flexicurity agenda has injected the policy debate with new proposals for reform. In countries like Denmark, Finland, UK and Germany, on the other hand, where awareness of activation measures has long existed, the EU’s flexicurity agenda may have served to highlight the continuing need to address the balance between different components of labour market policy. In Austria, it is considered to have given new impetus to the debate on modernising social security systems and lifelong learning, which had not previously featured as strongly on the policy agenda.
On the other hand, during the economic downturn, in many countries (including Spain, Italy, France, Romania and Hungary) the “security” side of the flexicurity concept has tended to stall and political debates on the flexicurity agenda (or on the issues contained in the flexicurity agenda), led primarily by trade union representatives, have become increasingly conflictual. This appears to be less prevalent in some countries with strong traditions of social partnership, such as in Austria, Germany and Finland, where in recent years significant progress has indeed been in achieving greater labour market flexibility without undermining employment security. Having said that Voss, Dornelas, Wild and Kwiatiewicz (2011)36 argue that in Denmark - a country historically dominated by strong social partnership and the primacy of collective bargaining - trade unions have in recent years become increasingly concerned about labour market reforms eroding long established components of the Danish “Golden Triangle”.
Within the context of the Open Method of Co-ordination, it is left to the process of defining the Country Specific Recommendations to reinforce the message about the need for a balanced application of the flexibility and security components and the need for a holistic consideration of the four pillars of flexicurity. Further efforts may be required to demonstrate, on the basis of policy examples, the costs and benefits of various flexicurity measures and their “win-win” potential, regardless of the underlying economic situation.
4.6.3 Impact on development of monitoring and governance structures
No separate monitoring structures exist focussed specifically on the implementation of flexicurity approach/pathway in the Member States. The monitoring of flexicurity is thus dependant on the national context and tradition of policy monitoring and evaluation, which differs across the case study countries. Thus, the influence of the third common principle calling for effective monitoring of flexicurity progress cannot be traced in most case study countries. However, some interesting practices are noted in some case study countries and in Member States where data monitoring and evaluation is strong, the absence of a specific flexicurity monitoring strategy may as such not be a problem. Of greater concern is the widespread absence of evaluative data and monitoring in many Member States.
In most of the Member States social partners played a role in devising the NRPs and in some Member States in the development of the national flexicurity approach or its elements. A more nuanced picture is emerging from the case study research. On one hand, in some countries social partners have had a strong role in the development of the main flexicurity-type measures at the national level (such as Austria, Germany, Finland and France, see policy Examples from these countries in Annex 1). In other countries, social dialogue did play a role but in the implementation of key reforms the government pressed ahead bypassing the social dialogue results achieved so far or the views of social partners (e.g. Estonia, Spain
36 Voss, Dornelas, Wild and Kwiatiewicz (2011), Social partners and flexicurity in contemporary labour markets (2011), see http://www.erc-online.eu/content/default.asp?PageName=OpenFile&DocID=28804
Evaluation of flexicurity (2007-2010): final report
56
and Italy). Finally, in a number of countries, the economic crisis has seen social partners marginalised completely (Hungary and Romania).
Notwithstanding these different experiences even in countries with strong traditions of social partnership, it remains important that social partner involvement in shaping the agenda continues to be conditioned by the strength and embeddedness of these organisations in the decision making process, which historically varies significantly from country to country. Further capacity building is clearly required in a number of countries to realise the aspiration of social partner involvement. An assessment of the impact of strong tripartism, for example in the running of labour market institutions such as the PES, might contribute to a better understanding of beneficial impact (or otherwise) of such arrangements on flexicurity policy and labour market outcomes.
Thus, the existence of the common principle calling for the involvement of social partners in the design and implementation of flexicurity policies cannot be traced to an enhanced role of social partners in the development of national policy (with the possible exception of Poland, although causality is difficult to establish).
4.6.4 The impact on guiding the national policy reforms
In all the case countries there have been significant initiatives and policy reforms implemented across the four component parts of flexicurity, in an attempt to reform the contractual arrangements, increase the impact of ALMPs, the participation in LLL and modernise the social security systems. The initiation of some of these reforms pre-date the launch of the EU’s first phase of flexicurity, and hence it is difficult to say which measures would or would not have been implemented without the EU focus on flexicurity. With most of the developments initiated after 2007, one of the key driving forces for reform was the need to respond to rapidly unfolding economic crisis. This is manifest in the hiatus of policy activity (and in some cases policy reversals) during the years 2009 and 2010 – when the impacts of the crisis have become severe in most of the case study countries.
However, as mentioned above, the key challenges related to flexicurity have been high on the political agenda and the flexicurity concept has provided an impetus to the debate at least in some case study countries reviewed.
Therefore, the impact of EU’s focus on flexicurity since 2008 to spur major reforms in the Member States can be conceptualised in terms of a continuum of influence from being a relatively important inspiration and innovation in the debate and encouraging policy-makers to acknowledge the interconnectedness of the four main flexicurity components (examples of Austria, Estonia, Poland, France) to having more limited impact but still fostering the debate (example of Spain, Italy) to having very limited influence (examples of Denmark, UK, and, especially after 2010, in Hungary and Romania).
In the context of the crisis measures, the EU’s focus on flexicurity was helpful, at least in some contexts, in providing a reference framework and a toolbox to frame the discussion and development of some of the crisis measures which could have been to some extent inspired by the flexicurity approach (e.g. the adoption of the anti-crisis package through tripartite dialogue in Poland is regarded as the start of the real tripartite dialogue on labour reforms and flexicurity measures in the country; it also addresses several flexicurity elements). Here, the causality between the EU’ focus on flexicurity and the direction of measures taken is however very difficult to establish. In other countries, however, the impact of the crisis has been so severe (such as Romania and Hungary), that policy developments have been driven entirely by emergency measures.
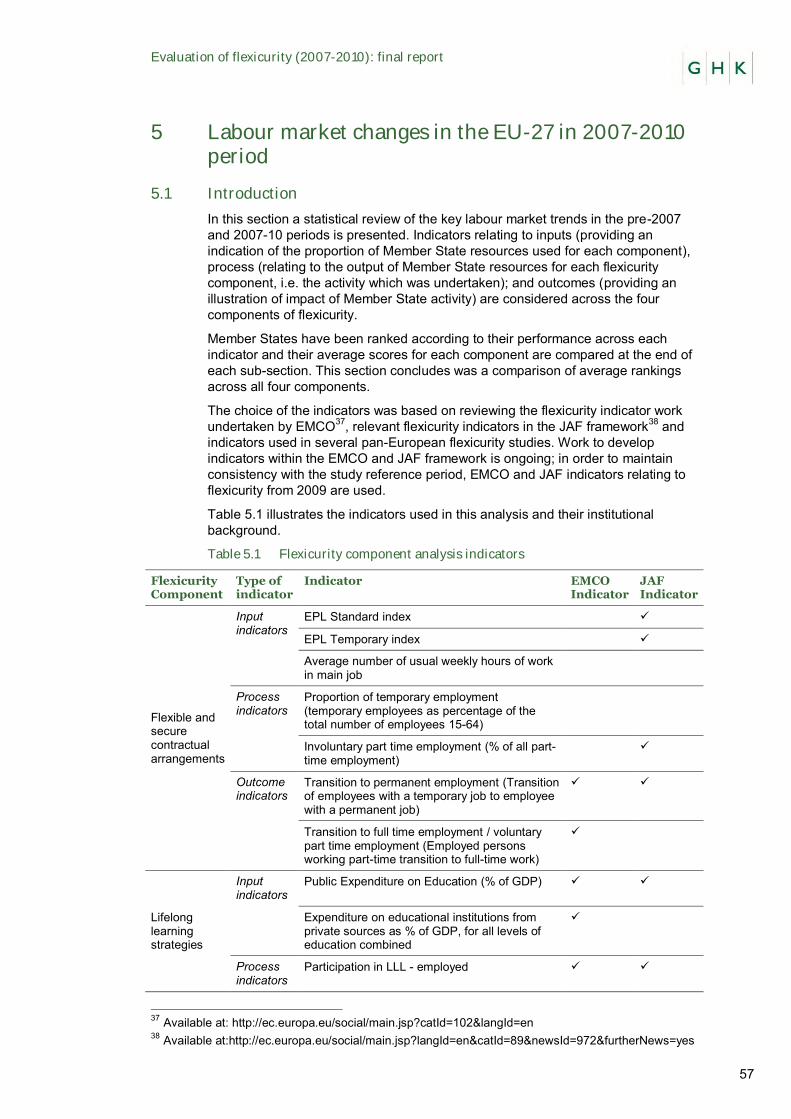
Evaluation of flexicurity (2007-2010): final report
57
5 Labour market changes in the EU-27 in 2007-2010 period
5.1 Introduction
In this section a statistical review of the key labour market trends in the pre-2007 and 2007-10 periods is presented. Indicators relating to inputs (providing an indication of the proportion of Member State resources used for each component), process (relating to the output of Member State resources for each flexicurity component, i.e. the activity which was undertaken); and outcomes (providing an illustration of impact of Member State activity) are considered across the four components of flexicurity.
Member States have been ranked according to their performance across each indicator and their average scores for each component are compared at the end of each sub-section. This section concludes was a comparison of average rankings across all four components.
The choice of the indicators was based on reviewing the flexicurity indicator work undertaken by EMCO37, relevant flexicurity indicators in the JAF framework38 and indicators used in several pan-European flexicurity studies. Work to develop indicators within the EMCO and JAF framework is ongoing; in order to maintain consistency with the study reference period, EMCO and JAF indicators relating to flexicurity from 2009 are used.
Table 5.1 illustrates the indicators used in this analysis and their institutional background.
Table 5.1 Flexicurity component analysis indicators
Flexicurity Component
Type of indicator
Indicator EMCO Indicator
JAF Indicator
Flexible and secure contractual arrangements
Input indicators
EPL Standard index
EPL Temporary index
Average number of usual weekly hours of work in main job
Process indicators
Proportion of temporary employment (temporary employees as percentage of the total number of employees 15-64)
Involuntary part time employment (% of all part-time employment)
Outcome indicators
Transition to permanent employment (Transition of employees with a temporary job to employee with a permanent job)
Transition to full time employment / voluntary part time employment (Employed persons working part-time transition to full-time work)
Lifelong learning strategies
Input indicators
Public Expenditure on Education (% of GDP)
Expenditure on educational institutions from private sources as % of GDP, for all levels of education combined
Process indicators
Participation in LLL - employed
37 Available at: http://ec.europa.eu/social/main.jsp?catId=102&langId=en 38 Available at:http://ec.europa.eu/social/main.jsp?langId=en&catId=89&newsId=972&furtherNews=yes

Evaluation of flexicurity (2007-2010): final report
58
Flexicurity Component
Type of indicator
Indicator EMCO Indicator
JAF Indicator
Participation in LLL - unemployed
Participation in LLL - inactive
Outcome indicators
Educational attainment - Tertiary education
Labour transition by pay level
Effective active labour market policies
Input indicators
ALMP Expenditure (percentage of GDP, categories 2-739)
Number of persons in active LMP (cat 2-7) as % of all participants in LMP (cat 1-9)
Process indicators
Employment rate (female)
Employment rate (male)
Employment rate (youth)
Employment rate (older workers)
Difference between number of hours worked by males and number of hours worked by females
Outcome indicators
Unemployment duration (LTU as % of all unemployment)
Unemployment rate (youth)
Unemployment rate (female)
Unemployment rate (older workers)
Modern social security systems
Input indicators
Expenditure on passive LMP (% of GDP, categories 8-940)
Expenditure on social protection overall (% of GDP)
Process indicators
Employment rate of females aged 20-49 without children
Employment rate of females aged 20-49 with 1 child less than 6 years old
Formal childcare, children less than 3 years (1-29 hours)
Formal childcare, children less than 3 years (30+ hours)
39 Training; Job rotation and job sharing; Employment incentives, Supported employment and rehabilitation, Direct job creation, Start-up incentives. 40 Out-of-work income maintenance and support; Early retirement.
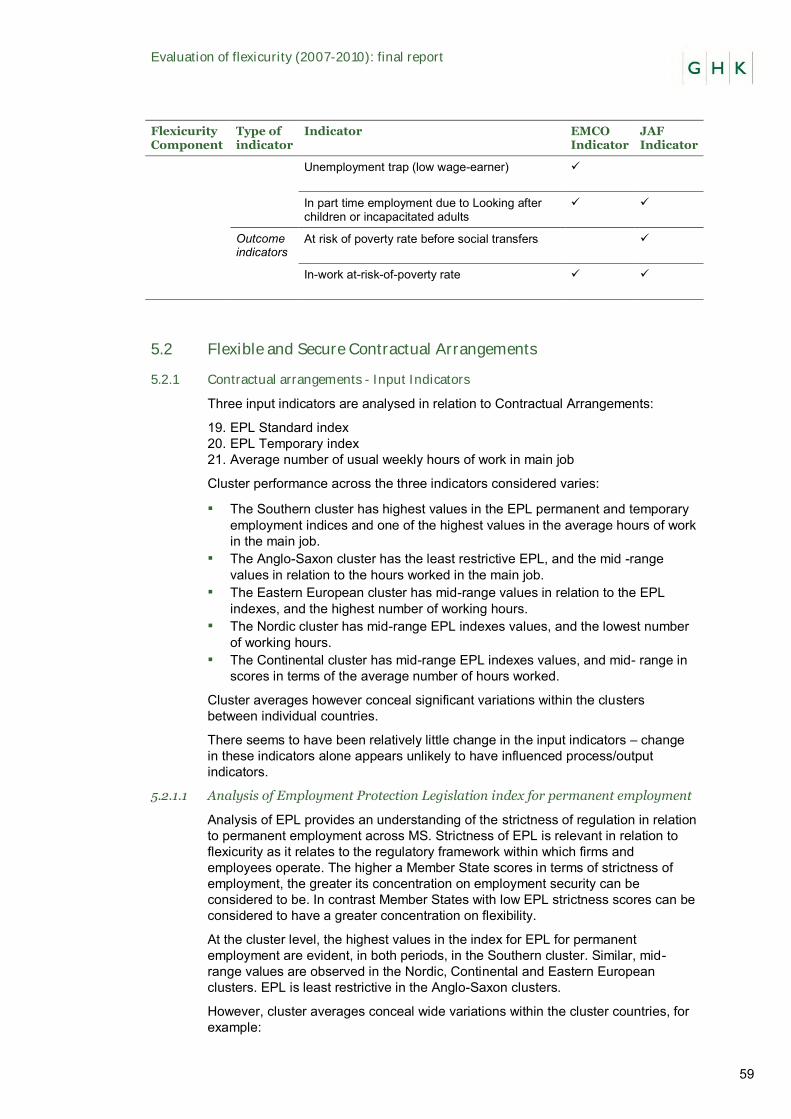
Evaluation of flexicurity (2007-2010): final report
59
Flexicurity Component
Type of indicator
Indicator EMCO Indicator
JAF Indicator
Unemployment trap (low wage-earner)
In part time employment due to Looking after children or incapacitated adults
Outcome indicators
At risk of poverty rate before social transfers
In-work at-risk-of-poverty rate
5.2 Flexible and Secure Contractual Arrangements
5.2.1 Contractual arrangements - Input Indicators
Three input indicators are analysed in relation to Contractual Arrangements:
19. EPL Standard index 20. EPL Temporary index 21. Average number of usual weekly hours of work in main job
Cluster performance across the three indicators considered varies:
▪ The Southern cluster has highest values in the EPL permanent and temporary employment indices and one of the highest values in the average hours of work in the main job.
▪ The Anglo-Saxon cluster has the least restrictive EPL, and the mid -range values in relation to the hours worked in the main job.
▪ The Eastern European cluster has mid-range values in relation to the EPL indexes, and the highest number of working hours.
▪ The Nordic cluster has mid-range EPL indexes values, and the lowest number of working hours.
▪ The Continental cluster has mid-range EPL indexes values, and mid- range in scores in terms of the average number of hours worked.
Cluster averages however conceal significant variations within the clusters between individual countries.
There seems to have been relatively little change in the input indicators – change in these indicators alone appears unlikely to have influenced process/output indicators.
5.2.1.1 Analysis of Employment Protection Legislation index for permanent employment
Analysis of EPL provides an understanding of the strictness of regulation in relation to permanent employment across MS. Strictness of EPL is relevant in relation to flexicurity as it relates to the regulatory framework within which firms and employees operate. The higher a Member State scores in terms of strictness of employment, the greater its concentration on employment security can be considered to be. In contrast Member States with low EPL strictness scores can be considered to have a greater concentration on flexibility.
At the cluster level, the highest values in the index for EPL for permanent employment are evident, in both periods, in the Southern cluster. Similar, mid-range values are observed in the Nordic, Continental and Eastern European clusters. EPL is least restrictive in the Anglo-Saxon clusters.
However, cluster averages conceal wide variations within the cluster countries, for example:
Evaluation of flexicurity (2007-2010): final report
60
▪ In the Southern cluster, the EPL index for Italy is at a comparable level to the values observed in the Nordic, Continental and Eastern European clusters.
▪ The scores for Denmark (Nordic cluster) and Belgium (Continental cluster) are similar to the scores for the two countries in the Anglo-Saxon cluster.
There is very little change in this indicator at the individual country or cluster level across the pre and post 2007 period.
5.2.1.2 Analysis of EPL index for temporary employment
The analysis of EPL provides an understanding of the strictness of regulation in relation to temporary employment across Member States.
At the cluster level, the highest scores in the index for employment protection legislation for temporary employment in both periods, are evident in the Southern cluster, followed by Continental, Nordic and Eastern European clusters. As with the standard employment index, EPL is least restrictive in the Anglo-Saxon cluster.
However, cluster averages conceal wide variations between the countries, for example:
▪ The high scores for Belgium, France and Luxembourg, from the Continental cluster, are similar to the high scores exhibited in the Southern cluster.
▪ The scores in the Czech Republic and Slovakia are close to the low scores evident in the Anglo-Saxon cluster.
Slight changes have occurred in this indicator pre and post 2007 period at the country and cluster levels. Typically change has tightened EPL for temporary workers, partly as a result of the introduction of relevant EU legislation (though not in the Southern cluster).
5.2.1.3 Analysis of hours worked in the main job
An analysis of the average number of hours worked in the main job provides an illustration of the average weekly duration of employment across Member States.
At the cluster level, the highest average hours worked in the main job, across both periods, are evident in the Eastern European cluster and the Southern cluster. The Continental and Anglo-Saxon clusters exhibit very similar values. The lowest number of hours is worked in the Nordic cluster.
The cluster averages conceal variations between clusters as follows:
▪ The high index value in Greece (Southern cluster) stands out and is slightly higher than the high values exhibited in the Eastern European cluster.
▪ The Netherlands has the lowest number of hours worked in the Nordic cluster.
Slight changes have occurred in this indicator between pre and post 2007 period, both for clusters and individual countries. These changes have typically resulted in a reduction in the hours of work in the main job. This trend is observable in all clusters, with the reduction being most pronounced in the Anglo-Saxon cluster. This can primarily be attributed to the impact of the economic crisis.
5.2.2 Contractual arrangements - Process Indicators
Two process indicators are analysed in relation to Contractual arrangements:
22. Proportion of temporary employment (temporary employees as percentage of the total number of employees 15-64)41
23. Involuntary part-time employment (% of all part-time employment)
Cluster performance across the two process indicators considered varies:
41 This indicator includes fixed-term employment as well as temporary agency work and time limited employment contracts among apprentices.
Evaluation of flexicurity (2007-2010): final report
61
▪ The Southern cluster has the highest scores relating to the proportion of temporary employment and involuntary part-time employment (together with the Eastern European cluster).
▪ The Anglo-Saxon cluster has the lowest proportion of temporary employment and one of the lowest proportions of involuntary part-time employment.
▪ The Eastern European cluster has mid-range scores for temporary employment and one of the highest proportions of involuntary part-time employment.
▪ The Nordic cluster has one of the highest proportions of temporary employment but one of the lower proportions of involuntary part-time employment.
▪ The Continental cluster has mid-range scores for of temporary employment and one of the lower proportions of involuntary part-time employment.
Cluster averages however conceal significant variations within the clusters between individual countries.
Evidence suggests that there seems to have been some change in the process indicators between the pre and post 2007 periods:
▪ The proportion of temporary employment has increased post-2007, across all clusters except the Eastern European cluster.
▪ The proportion of involuntary part-time employment has increased post-2007 in the Continental, Anglo-Saxon and Southern clusters, and decreased in the Nordic and Eastern European clusters.
5.2.2.1 These changes can again be linked to the impact of the economic crisis.Analysis of temporary employment incidence
This indicator provides an understanding of the proportion of all employment performed on a temporary basis (see footnote 37 below).
For both periods, at the cluster level, the highest proportions of temporary employment are evident in the Southern cluster, followed closely by the Nordic cluster. Similar, mid-range proportions are observed in the Continental and Eastern European clusters. The proportion of temporary employment is lowest in the Anglo-Saxon cluster.
However, cluster averages conceal wide variations between the countries in the same cluster, as for example:
▪ In the Nordic cluster, temporary employment in Denmark is significantly lower in comparison to other countries in the cluster.
▪ In the Continental cluster, the values for Germany and France are significantly higher compared to other countries in the cluster. Luxembourg in contrast has a low proportion of temporary employment at levels similar to those for the two Anglo-Saxon cluster countries.
▪ The proportion of temporary employment in some Southern cluster countries (e.g. MT) and Eastern European countries (EE, LT and RO) is as low and on par with values in the Anglo-Saxon cluster.
There is some change in this indicator pre- and post-2007, both at the level of clusters and individual countries. The proportion of temporary employment has increased very marginally post-2007, across all clusters except the Eastern European cluster. Significant decreases of temporary employment are observed in Spain and significant increases are observed in Poland, the Netherlands and Portugal (all from already high base figures).
5.2.2.2 Analysis of involuntary part-time employment
This indicator provides an illustration of the share of employment in part-time positions that is taken up by those who would prefer to work full-time.
Evaluation of flexicurity (2007-2010): final report
62
Across both periods, at the cluster level, the highest proportions of involuntary part-time employment as a percentage of all part-time employment are evident in the Southern and Eastern European clusters. The other clusters exhibit similar proportions (around 17-18%) in the post-2007 period. Involuntary part-time employment has grown in the Continental, Southern and Anglo-Saxon clusters, though has fallen slightly in the Nordic cluster and more dramatically in the Eastern European cluster.
The cluster averages conceal wide variations between the countries within the same cluster as follows:
▪ Variations within the Eastern European cluster range from very low proportions of involuntary part-time employment in Slovenia and Slovakia to some of the highest values in the EU in Bulgaria, Romania and Latvia (in the pre 2007 period).
▪ Variations in the Nordic cluster range from the very low proportion of involuntary part-time employment in the Netherlands to high values in Finland and Sweden.
There is some change in this indicator in the pre- and post-2007 period, across clusters and at the country level. The proportion of involuntary part-time employment has increased post-2007 in the Continental, Anglo-Saxon and Southern clusters, and decreased in the Nordic and Eastern European clusters. Significant decreases of involuntary part-time employment are noted in Bulgaria, Lithuania, Latvia and Finland. Significant increases are observed in the Anglo-Saxon cluster (Ireland, UK), Germany, Southern cluster countries (Spain, Italy and Portugal) and in Hungary and Slovakia among the Eastern European countries.
5.2.3 Contractual arrangements - Outcome Indicators
Two outcome indicators are analysed in relation to Contractual arrangements:
24. Transition to permanent employment (Transition of employees with a temporary job to employee with a permanent job)
25. Transition to full time employment / voluntary part time employment (Employed persons working part-time transition to full-time work)
Cluster performance across the two outcome indicators considered varies:
▪ The Southern cluster has one of the lowest levels of transitions to permanent employment and mid-range transitions to full-time employment.
▪ The Anglo-Saxon cluster has one of the lowest levels for both indicators - transitions to permanent employment and transitions to full-time employment.
▪ The Eastern European cluster has the highest level for both indicators - transitions to permanent employment and transitions to full-time employment.
▪ The Nordic cluster has mid-range scores for both indicators - transitions to permanent employment and transitions to full-time employment.
▪ The Continental cluster has mid-range transitions to permanent employment and one of the lowest levels of transitions to full-time employment.
As with other indicators, the cluster averages conceal significant variations within the clusters between individual countries.
5.2.3.3 Analysis of the transition from temporary to permanent employment
Analysis of the transition from temporary to permanent employment is an important indicator in relation to the Contractual Arrangements’ component of flexicurity. Permanent employment provides greater legal protections for employees; transitions from temporary to permanent employment contracts are, therefore, considered a positive labour market outcome.
Evaluation of flexicurity (2007-2010): final report
63
Consideration of the pre-2007 period is only possible using data for one year, 2006. Using this year as a baseline and comparing it with the post-2007 period, the following observations can be made:
▪ For both the Nordic and Southern clusters there was a reduction in -0.3 percentage points when the 2006 baseline is compared to the post-2007 period.
▪ There were slight increases in the rate for the Anglo Saxon and Southern clusters. the largest increase, however, was in the Continental cluster (+7.0 percentage points)
Considering the post-2007 period, at the cluster level, transitions to permanent employment highest in the Eastern European cluster. This is followed by the Continental and Nordic clusters, which show similar levels of transitions. Transitions to permanent employment are lowest in the Anglo-Saxon and Southern clusters.
However, cluster averages conceal wide variations between countries, as for example:
▪ Variations within the Eastern European cluster range from very low levels of transitions in Poland to the highest levels in the EU in Romania and Estonia.
▪ Variations in transitions into permanent work vary enormously in the Continental cluster. France is at one end of the spectrum where transitions are low while the transition rate in Luxembourg is high: just over half of all employees in temporary jobs make the transition into a permanent job.
▪ Variations in the Nordic cluster range from low levels of transitions in Finland to very high levels of transitions in Sweden and the Netherlands.
▪ In the Southern cluster, transition levels in Italy are higher than of other countries in the cluster, at a level comparable with some of the high performers in the Eastern European cluster.
5.2.3.4 Analysis of the transition from part time to full-time employment
Transition from part-time employment to full-time employment is considered an important outcome indicator in relation to the Contractual Arrangements component of flexicurity due to the fact that it is illustrative of a contractual arrangements regime which facilitates transition to full-time employment.
Consideration of the pre-2007 period is only possible using data for one year, 2006. Using this year as a baseline and comparing it with the post-2007 period, the following observations can be made. In the Nordic and Southern clusters the rate of transitions from part-time to full-time employment increased when the 2006 baseline is compared with the 2007-10 average. In the Continental and Eastern Europe clusters the rate decreased. Data is not available for the Anglo Saxon cluster.
Considering the post-2007 period, at the cluster level, transitions to full-time employment are highest in the Eastern European cluster. This is followed by Southern and Nordic cluster, which show similar levels of transitions (around 23-25%). The lowest (and similar) levels of transitions are demonstrated in the Continental and Anglo-Saxon clusters (data in this cluster available only for the UK).
As with the majority of the other indicators, cluster averages conceal wide variations between the countries, for example:
▪ Variations within the Eastern European cluster range from very low levels of transitions in the Czech Republic and Slovakia to the highest values in the EU in Latvia and Lithuania.
▪ Variations in the Nordic cluster range from low levels of transitions in the Netherlands to very high levels of transitions in Denmark and Finland.
Evaluation of flexicurity (2007-2010): final report
64
▪ In the Southern cluster, transitions vary from low levels in Portugal to relatively high levels in Spain, Malta and Greece.
5.2.4 Relationship between input and process / outcome indicators
The Table below summarises the performance of clusters across the input and process / outcome indicators.
It shows that at the cluster level:
▪ In the Southern cluster highly restrictive EPL for both temporary and permanent workers and long working hours are associated with high levels of precarious employment and low transitions from precarious to more stable employment.
▪ In the Anglo-Saxon cluster some of the least restrictive EPL is associated with a low incidence of precarious employment coupled with very low transition rates from precarious to more stable employment.
▪ In the Eastern European cluster: mid-range EPL is associated with middle to high levels of precarious employment. In contrast to the Southern cluster, transitions from precarious to stable employment are very high.
▪ In the Nordic cluster: mid range EPL and low working hours are associated with a high incidence of temporary employment. However part-time employment appears to be voluntary rather than involuntary and transitions to stable employment are mid-range.
▪ In the Continental cluster: mid-range EPL and mid- range numbers of working hours are associated with mid-range incidence of temporary employment. Involuntary part-time employment is at lower levels. Transitions to stable employment are at the low - mid-range levels.
Table 5.2 Performance of clusters in relation to input and process / outcome indicators
Input indicators – no
change pre and post
2007
Process indicators – overall
increase
Outcome indicators –
lack of trend data
Southern Highest values in EPL permanent and temporary employment indexes One of the highest values in the average hours of work in the main job
Highest values in the proportion of temporary employment and involuntary part-time employment (together with Eastern European cluster)
One of the lowest levels of transitions to permanent employment and middle-range level of transitions to full-time employment
Anglo-
Saxon
Least restrictive EPL, and the middle-range value in relation to the hours worked in the main job
The lowest proportion of temporary employment and one of the lowest proportion of involuntary part-time employment
One of the lowest levels on both indicators - transitions to permanent employment and transitions to full-time employment
Eastern Middle-range values in relation to the EPL indexes, and the highest number of working hours
Middle-range proportion of temporary employment and one of the highest proportions of involuntary part-time employment
Highest level on both indicators - transitions to permanent employment and transitions to full-time employment
Nordic Mid-range EPL indexes values, and the lowest number of working hours
One of the highest proportion of temporary employment but one of the lower proportions of involuntary part-time employment
Middle-range values on both indicators - transitions to permanent employment and transitions to full-time employment
Continental Mid-range EPL indexes values, and the middle range in terms of average number of hours worked
Middle-range proportion of temporary employment and one of the lower proportions of involuntary part-time employment
Middle-range transitions to permanent employment and one of the lowest levels of transitions to full-time
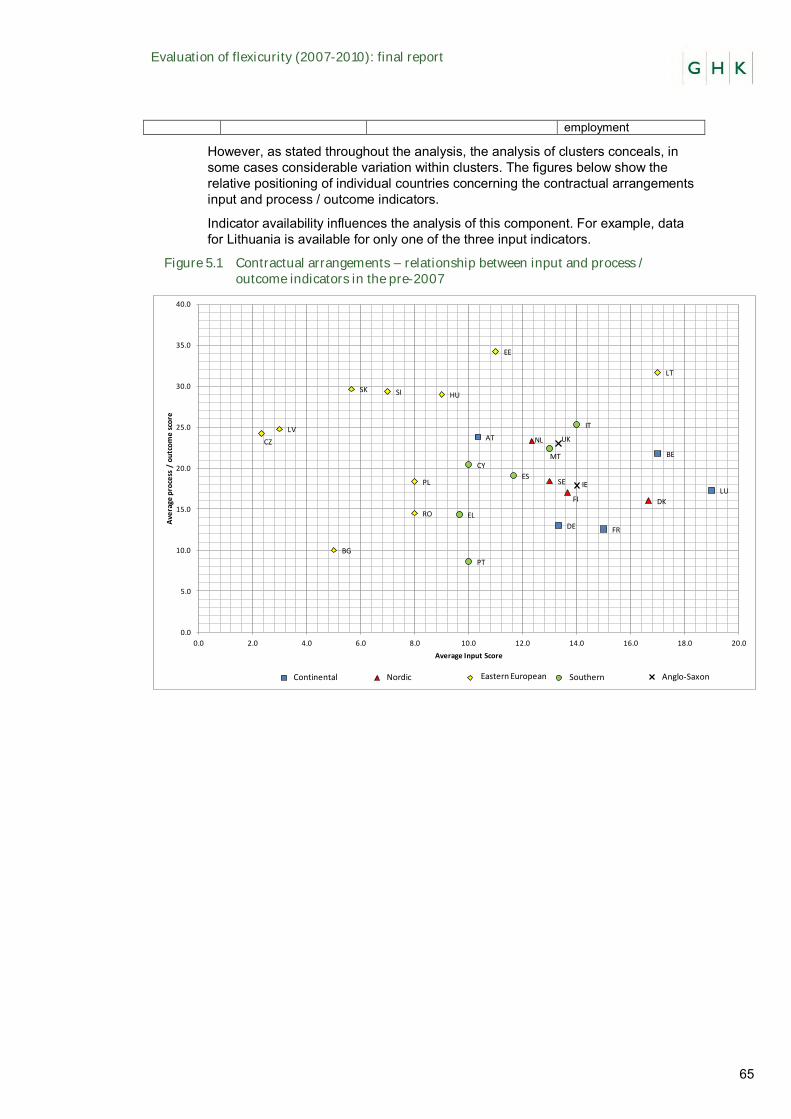
Evaluation of flexicurity (2007-2010): final report
65
employment
However, as stated throughout the analysis, the analysis of clusters conceals, in some cases considerable variation within clusters. The figures below show the relative positioning of individual countries concerning the contractual arrangements input and process / outcome indicators.
Indicator availability influences the analysis of this component. For example, data for Lithuania is available for only one of the three input indicators.
Figure 5.1 Contractual arrangements – relationship between input and process / outcome indicators in the pre-2007
AT
BE
BG
CY
CZ
DK
EE
FI
FRDE
EL
HU
IE
ITLV
LT
LU
MT
NL
PL
PT
RO
SK SI
ESSE
UK
0.0
5.0
10.0
15.0
20.0
25.0
30.0
35.0
40.0
0.0 2.0 4.0 6.0 8.0 10.0 12.0 14.0 16.0 18.0 20.0
Ave
rage
pro
cess
/ o
utc
om
e s
core
Average Input Score
19.0 12.3 7.0 11.7 13.3Continental SouthernEastern EuropeanNordic Anglo-Saxon
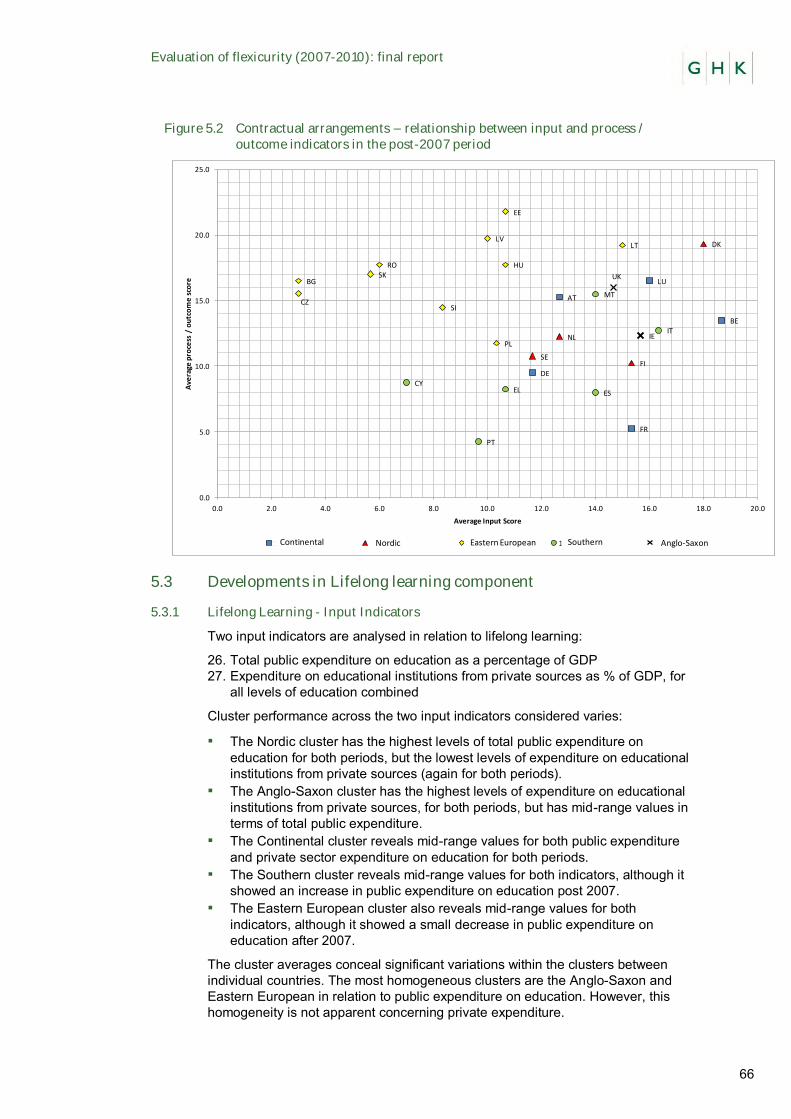
Evaluation of flexicurity (2007-2010): final report
66
Figure 5.2 Contractual arrangements – relationship between input and process / outcome indicators in the post-2007 period
5.3 Developments in Lifelong learning component
5.3.1 Lifelong Learning - Input Indicators
Two input indicators are analysed in relation to lifelong learning:
26. Total public expenditure on education as a percentage of GDP 27. Expenditure on educational institutions from private sources as % of GDP, for
all levels of education combined
Cluster performance across the two input indicators considered varies:
▪ The Nordic cluster has the highest levels of total public expenditure on education for both periods, but the lowest levels of expenditure on educational institutions from private sources (again for both periods).
▪ The Anglo-Saxon cluster has the highest levels of expenditure on educational institutions from private sources, for both periods, but has mid-range values in terms of total public expenditure.
▪ The Continental cluster reveals mid-range values for both public expenditure and private sector expenditure on education for both periods.
▪ The Southern cluster reveals mid-range values for both indicators, although it showed an increase in public expenditure on education post 2007.
▪ The Eastern European cluster also reveals mid-range values for both indicators, although it showed a small decrease in public expenditure on education after 2007.
The cluster averages conceal significant variations within the clusters between individual countries. The most homogeneous clusters are the Anglo-Saxon and Eastern European in relation to public expenditure on education. However, this homogeneity is not apparent concerning private expenditure.
AT
BE
BG
CY
CZ
DK
EE
FI
FR
DE
EL
HU
IEIT
LVLT
LU
MT
NLPL
PT
ROSK
SI
ES
SE
UK
0.0
5.0
10.0
15.0
20.0
25.0
0.0 2.0 4.0 6.0 8.0 10.0 12.0 14.0 16.0 18.0 20.0
Ave
rage
pro
cess
/ o
utc
om
e s
core
Average Input Score
16.0 12.7 8.3 14.0 14.7Continental SouthernEastern EuropeanNordic Anglo-Saxon
Evaluation of flexicurity (2007-2010): final report
67
Cyprus represents a clear country-outlier in respect of the input indicators for lifelong learning, showing values which are on par with the Nordic cluster (on public expenditure) and with the Anglo-Saxon cluster (on private expenditure).
The only significant change in the input indicators concerns the Anglo-Saxon level of private expenditure on education institutions, which increased dramatically after 2007 (on account of the UK) and the Southern cluster’s public expenditure on education (especially Cyprus and Malta), which increased after 2007 while the level in most other countries fell.
5.3.1.5 Analysis of total public expenditure on education
Analysis of public expenditure on education provides an indication of the level of expenditure as a share of GDP that Member States devote to education of citizens. This indicator is directly related to flexicurity because it provides an indication of the level of prioritisation that education is given within each Member State in relation to other forms of Government spending.
At the cluster level, the highest levels of public expenditure on education, for both periods, are found in the Nordic cluster. Similar, mid-range levels are seen in the Continental, Anglo-Saxon, Southern and Eastern European clusters, with the lowest levels occurring, before 2007, in the Anglo-Saxon and Southern clusters. Although the levels of expenditure do not change significantly in most countries post 2007, the lowest average levels of spending switch to the Southern and Eastern European clusters after that year.
However, the cluster averages conceal large variations between the countries in the same cluster, for example:
▪ Cyprus in the Southern cluster is on the level with values observed in the Nordic cluster
▪ The country with the lowest total public expenditure on education (especially after 2007) is Luxembourg in the Continental cluster
The least variations among countries are seen in the Anglo-Saxon and Eastern European clusters.
As stated above, levels of spending do not change significantly across the two periods (both at the cluster and at the individual country level) but while spending in the majority of countries typically declines, in nine countries it increases. This is the case for the Anglo-Saxon cluster as a whole and for one or more countries in the other four clusters.
5.3.1.6 Analysis of expenditure on educational institutions from private sources for all levels of education combined
This indicator provides an illustration of the expenditure on education by private enterprise (expressed as a share of GDP). This illustrates the level of workforce development funded through the private sector and is therefore of direct relevance to the lifelong learning component of flexicurity.
At the cluster level, the highest levels of spending on educational institutions from private sources occur within the Anglo-Saxon cluster for both periods, followed by the Continental and Southern clusters before 2007 and the Southern cluster alone after 2007. The lowest values for this indicator are seen in the Nordic cluster for both periods.
However, once again, the cluster averages conceal wide variations between the countries in the same cluster, for example:
▪ Cyprus in the Southern cluster had the highest value for this indicator pre 2007, and shifts to second place (after the UK) only when the value for the UK increases by more than 75% post 2007.
Evaluation of flexicurity (2007-2010): final report
68
▪ The Netherlands in the Nordic cluster is almost on par with Germany in the Continental cluster and the UK in the Anglo-Saxon cluster pre 2007.
▪ Low values for this cluster (i.e. 0.2% of GDP or less) are visible in Greece and Portugal in the Southern cluster (prior to 2007), on par with Finland and Sweden in the Nordic cluster.
Only slight changes have occurred between the two periods at the cluster level. However, at the country level, the changes have often been greater. This is especially the case for the UK, where expenditure on educational institutions from private sources increased by almost 1 per cent of GDP (representing an increase of about 75%). Significant changes between the two periods were also recorded for Malta (where expenditure declined by about 50%) and Portugal (where expenditure increased by more than 100%).
5.3.2 Lifelong Leaning - Process Indicators
Three process indicators are analysed in relation to lifelong learning:
28. Participation in education and training: Employed persons 29. Participation in education and training: Unemployed persons 30. Participation in education and training: Inactive persons
Cluster performance across the three process indicators considered indicates considerable regularity:
▪ The Nordic cluster has the highest values of participation in education and training for employed, unemployed and inactive persons.
▪ The Anglo-Saxon cluster also has high values of participation in education and training for employed, unemployed and inactive persons, but it is the only cluster which registers declines in value for the three indicators post 2007.
▪ The Continental cluster shows mid-range values of participation in education and training for employed, unemployed and inactive persons, although its performance is worse in respective of inactive persons.
▪ The Southern and Eastern European clusters have low participation rates in education and training for employed, unemployed and inactive persons, although the Southern cluster in particular increases in value after 2007.
Cluster averages however conceal significant variations within the clusters between individual countries.
In terms of country outliers, Slovenia stands out as consistently outperforming the other countries in the Eastern European cluster.
Most of the clusters/countries show an increase in value for all three process indicators after 2007, except for the Anglo-Saxon cluster (as a result of the UK’s performance) where levels fell considerably.
5.3.2.7 Analysis of employed persons’ participation in education and training
The participation of employed persons in education and training provides a direct illustration of the level of engagement in education and training of the workforce, this indicator is therefore directly relevant to the lifelong learning component of flexicurity.
At the cluster level, the highest levels of participation in education and training among employed persons are found in the Nordic cluster followed by the Anglo-Saxon cluster, for both periods. The Continental cluster shows mid-range values for the two periods, with the Southern and Eastern European clusters both showing low values for this indicator, in both periods.
Most of the cluster averages conceal wide variations between the countries, for example:
Evaluation of flexicurity (2007-2010): final report
69
▪ The UK in the Anglo-Saxon cluster has levels of participation in education and training among employed persons that are higher than most countries in the Nordic cluster.
▪ Slovenia in the Eastern European cluster has levels of participation on a par with some of the Nordic countries, exceeding the levels evident in the Continental countries.
▪ Greece (in the Southern cluster), Bulgaria and Romania (both in the Eastern European cluster) have very similar, low levels.
At the cluster level the biggest change between the pre and post 2007 period took place in the Nordic cluster, which registered a considerable increase. The only cluster where the level of participation declined after 2007 was the Anglo-Saxon one. At the country level, the majority of countries registered an increase between the two periods, the only exceptions being Belgium (in the Continental cluster), the UK (in the Anglo-Saxon cluster), Hungary, Latvia and Slovakia (in the Eastern European cluster), where participation levels decreased.
5.3.2.8 Analysis of unemployed persons’ participation in education and training
This indicator provides an understanding of the level of engagement in lifelong learning among the unemployed.
At the cluster level, the highest levels of participation in education and training among unemployed persons were registered, in both periods, in the Nordic cluster. High levels of participation among this group were also registered in the Anglo-Saxon cluster although not as high as in the Nordic cluster. The Continental and Southern cluster indicated mid-range levels of participation, followed by the Eastern European cluster, where levels were lowest.
The averages for the clusters conceal significant variations between the countries within each cluster, as for instance:
▪ Ireland (in the Anglo-Saxon cluster) is on a par with a number of countries in the Southern and Eastern European cluster.
▪ Slovenia (in the Eastern European cluster) has higher levels of participation than many countries in the Continental and Southern clusters.
At the cluster level, only the Anglo-Saxon cluster registered a decrease in the level of participation in education and training among unemployed persons after 2007. At the country level, the levels of participation did not change significantly for most countries after 2007, with the exception of Denmark, Austria and Luxembourg and to a lesser extent Spain and Slovenia (where levels rose considerably) and the UK (where levels fell considerably).
5.3.2.9 Analysis of participation in education and training among inactive persons
This indicator provides an understanding of the level of engagement in lifelong learning among those who are inactive.
At the cluster level, participation in education and training among inactive persons is highest, in both periods, in the Nordic cluster. The Anglo-Saxon cluster shows the next highest values, although these are considerably lower than the Nordic high levels of participation in the Nordic cluster. The remaining clusters have relatively low values for this indicator.
The cluster averages reveal some important variations between the countries in two of the clusters:
▪ The UK in the Anglo-Saxon cluster participation is similar to the values observed in the Nordic cluster, while Ireland is similar to the values evident in the Continental cluster countries.
▪ The Netherlands in the Nordic cluster is also closer in value to the Continental countries than to the other countries in the Nordic cluster.
Evaluation of flexicurity (2007-2010): final report
70
At the cluster level, there has been very little change in this indicator between the pre and post 2007 period. However, at the level of countries, Sweden in the Nordic cluster and the UK in the Anglo-Saxon cluster experienced a sharp decline in value after 2007, whereas Denmark in the Nordic cluster witnessed a considerable increase.
5.3.3 Lifelong Learning - Outcomes
Two outcome indicators are analysed in relation to lifelong learning:
31. Educational attainment - Tertiary education , age group 15-64 32. % of people with no income ongoing transition to the 1st income decile
The cluster performance across the two outcome indicators shows a number of similarities but also some variations.
▪ The Nordic cluster has the highest values for both indicators in both periods. However, its performance is considerably higher relative to the other clusters for the rate of transition of people with no income moving into the 1st income decile than for the level of tertiary educational attainment.
▪ The Anglo-Saxon cluster has very high values for tertiary educational attainment, but middle-range (or even low values before 2007) for the percentage of people who moved up from no income to the 1st income decile.
▪ The Continental cluster has mid-range values for the level of tertiary educational attainment and for the percentage of people moving from no income to the 1st income decile.
▪ The Southern cluster has low-to-medium-range values for the level of tertiary educational attainment and low-range values for the percentage of people moving from no income to the 1st income decile.
▪ The Eastern European cluster has low-to-medium-range values for the level of tertiary educational attainment and low-range values for the percentage of people moving from no income to the 1st income decile.
The cluster averages conceal some significant variations between the individual countries.
In terms of country outliers, Estonia and Latvia outperform the other countries in the Eastern European cluster on tertiary educational attainment but not in respect of the percentage of people moving up an income decile from no income.
The change pre-and post-2007 is more marked with regard to tertiary education levels across the five clusters than it is with regard to the movement of people from no income to the 1st income decile.
5.3.3.10 Analysis of tertiary educational attainment (15-64 year olds)
This indicator provides an analysis of the share of tertiary educational attainment among those aged 15 to 64.
At the cluster level, the highest values of tertiary educational attainment can be found in the Nordic cluster (prior to 2007) and in the Anglo-Saxon cluster (after 2007). The values for both of these clusters are very similar. The Continental cluster also exhibits high levels of tertiary educational attainment among the working age population, albeit lower than the previously-mentioned clusters. The Southern and Eastern European clusters are below the EU-27 average, but the distance between them and the high-performing cluster is smaller than for the lifelong learning input and process indicators.
The Southern and Eastern European cluster averages conceal significant differences between countries, for example:
▪ Cyprus and Spain in the Southern cluster have values that are higher than the average of the Continental cluster.
Evaluation of flexicurity (2007-2010): final report
71
▪ Estonia and Lithuania in the Eastern European cluster have values that are higher than the average of the Continental cluster.
The values of tertiary educational attainment increase perceptibly for all clusters post 2007. This is also the case at the country level, with the exception of a small number of countries, including Austria, Germany and Denmark, where the increase is smaller.
5.3.3.11 Analysis of transition rates to 1 income decile among persons with no income
This indicator illustrates the labour market outcomes impacting on income levels, more specifically the % of people with no income undergoing transition to 1st income decile. This is an important indicator of labour market dynamism.
At the cluster level, the numbers of people who rose to the 1st income decile from no income were highest, for both periods, in the Nordic cluster. Before 2007, the next highest values were visible in the Continental cluster, but this position was occupied by the Anglo-Saxon cluster post 2007. The Southern and Eastern European clusters both exhibit low-range values for the two periods, although there is little difference between their values and the Continental and Anglo-Saxon values.
The averages for the clusters conceal considerable variations between countries for this indicator, in particular:
▪ Denmark within the Nordic cluster after 2007 when its value almost trebles, in contrast to the values for the Netherlands and Sweden also in the Nordic cluster which decrease post 2007.
▪ Bulgaria and Latvia in the Eastern European cluster, whose values are more than double the average of their cluster.
At the cluster level, the change in values pre- and post-2007 is most perceptible in the Nordic and Anglo-Saxon clusters (increase). The values of the other clusters do not significantly change. In the case of the Southern and Eastern European clusters, the change post 2007, albeit not significant in size, is in a downward direction.
5.3.4 Relationship between input and process / outcome indicators
The table below summarises the performance of clusters across the input and process/outcome indicators.
It shows that, at the cluster level:
▪ The Nordic cluster shows that the highest values of public expenditure on education and low levels of expenditure on educational institutions from private sources are associated with the highest levels of participation in education and training among employed, unemployed and inactive persons, high levels of tertiary-level educational attainment and high levels of movement upward from no income to the 1st income decile.
▪ The Angle-Saxon cluster: displays the highest values of expenditure on educational institutions from private sources and mid-range values of public expenditure on education are associated with high levels participation in education and training among employed, unemployed and inactive persons pre-2007, but declining values post-2007.
▪ The Continental cluster: shows mid-range values for both public expenditure on education and expenditure on educational institutions from private sources are linked to mid-range values of participation in education and training among employed, unemployed and inactive persons, mid-range values for the level of tertiary educational attainment and for the movement from no income to the 1st income decile.
Evaluation of flexicurity (2007-2010): final report
72
▪ The Southern cluster: shows mid-range values for both public expenditure and private sector expenditure on educational institutions (albeit with an increase in public expenditure on education post 2007) which are associated with low levels of participation in education and training employed, unemployed and inactive persons, low-to-medium range values for the level of tertiary educational attainment and low values for movement from no income to the 1st income decile.
▪ The Eastern European cluster: displays middle-range values for both public expenditure and private sector expenditure on educational institutions (albeit with a decrease in public expenditure on education post 2007) which are associated with low levels of participation in education and training employed, unemployed and inactive persons and low-to-medium range values for the level of tertiary educational attainment and low values for movement from no income to the 1st income decile.
Table 5.3 Performance of clusters in relation to input and process / outcome indicators
Input indicators – some
change pre and post 2007
(visible increases in Anglo-
Saxon and Southern)
Process indicators –
overall increase (except for
the UK)
Outcome indicators – lack
of trend data (partial
increase)
Nordic Highest values in public expenditure on education Lowest values in expenditure on educational institutions from private sources
Highest values of participation in education and training for employed, unemployed and inactive persons
Highest values for tertiary-level educational attainment and for movement from no income to 1 income decile (except after 2007 taken over by Anglo-Saxon cluster)
Anglo-
Saxon
Highest values of expenditure on educational institutions from private sources (especially after 2007) but middle-range values of public expenditure on education
High values of participation in education and training for employed, unemployed and inactive persons but the values decline across all three indicators post 2007
Very high values for tertiary level educational attainment (highest after 2007) but middle-range (or even low pre 2007) values for movement from no income to 1 income decile
Continental Middle-range values for both public expenditure and private sector expenditure on educational institutions
Middle-range values of participation in education and training for employed, unemployed and inactive persons
Middle-range values for the level of tertiary educational attainment and for movement from no income to 1 income decile
Southern Middle-range values for both public expenditure and private sector expenditure on educational institutions, although increase in public expenditure on education post 2007
Low levels of participation in education and training employed, unemployed and inactive persons
Low-to-medium range values for the level of tertiary educational attainment and low values for movement from no income to 1 income decile
Eastern Middle-range values for both public expenditure and private sector expenditure on educational institutions, although, although small decrease in public expenditure on education post 2007
Low levels of participation in education and training for unemployed, employed and inactive persons
Low-to-medium range values for the level of tertiary educational attainment and low values for movement from no income to 1 income decile
However, such cluster level analysis conceals the variations within the clusters. The figures below show the relative positioning of individual countries on the lifelong learning input and process / outcome indicators.
Indicator availability influences the analysis of some indicators in this component. This is especially the case for the output indicator concerning the percentage of
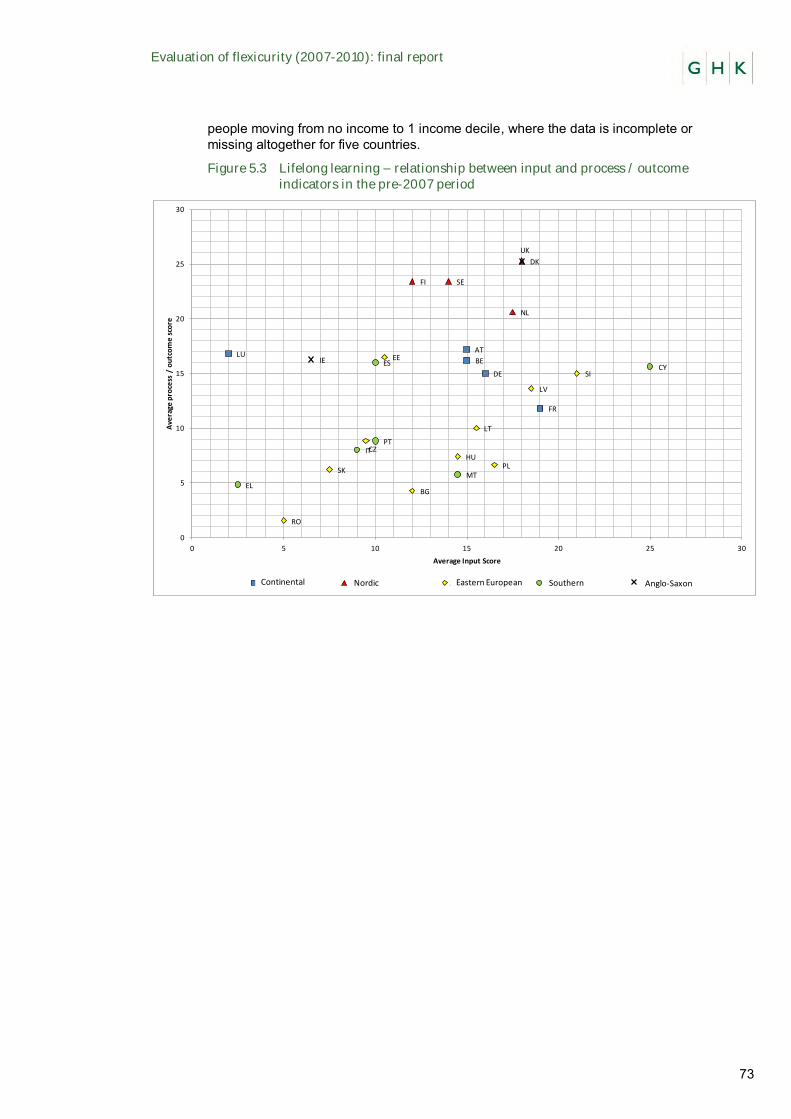
Evaluation of flexicurity (2007-2010): final report
73
people moving from no income to 1 income decile, where the data is incomplete or missing altogether for five countries.
Figure 5.3 Lifelong learning – relationship between input and process / outcome indicators in the pre-2007 period
AT
BE
BG
CY
CZ
DK
EE
FI
FR
DE
EL
HU
IE
IT
LV
LT
LU
MT
NL
PL
PT
RO
SK
SI
ES
SE
UK
0
5
10
15
20
25
30
0 5 10 15 20 25 30
Ave
rage
pro
cess
/ o
utc
om
e s
core
Average Input Score
2 17.5 21 10 18Continental SouthernEastern EuropeanNordic Anglo-Saxon
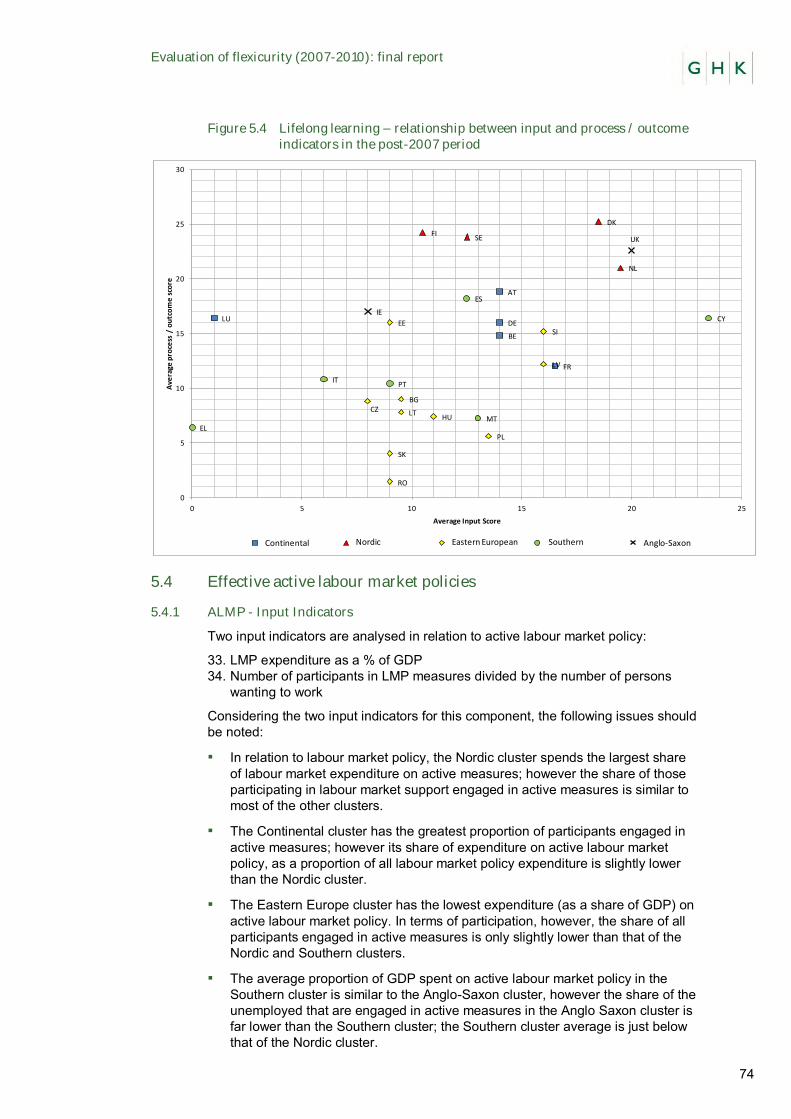
Evaluation of flexicurity (2007-2010): final report
74
Figure 5.4 Lifelong learning – relationship between input and process / outcome indicators in the post-2007 period
5.4 Effective active labour market policies
5.4.1 ALMP - Input Indicators
Two input indicators are analysed in relation to active labour market policy:
33. LMP expenditure as a % of GDP 34. Number of participants in LMP measures divided by the number of persons
wanting to work
Considering the two input indicators for this component, the following issues should be noted:
▪ In relation to labour market policy, the Nordic cluster spends the largest share of labour market expenditure on active measures; however the share of those participating in labour market support engaged in active measures is similar to most of the other clusters.
▪ The Continental cluster has the greatest proportion of participants engaged in active measures; however its share of expenditure on active labour market policy, as a proportion of all labour market policy expenditure is slightly lower than the Nordic cluster.
▪ The Eastern Europe cluster has the lowest expenditure (as a share of GDP) on active labour market policy. In terms of participation, however, the share of all participants engaged in active measures is only slightly lower than that of the Nordic and Southern clusters.
▪ The average proportion of GDP spent on active labour market policy in the Southern cluster is similar to the Anglo-Saxon cluster, however the share of the unemployed that are engaged in active measures in the Anglo Saxon cluster is far lower than the Southern cluster; the Southern cluster average is just below that of the Nordic cluster.
AT
BE
BG
CY
CZ
DK
EE
FI
FR
DE
EL
HU
IE
IT
LV
LT
LU
MT
NL
PL
PT
RO
SK
SI
ES
SE UK
0
5
10
15
20
25
30
0 5 10 15 20 25
Ave
rage
pro
cess
/ o
utc
om
e s
core
Average Input Score
1 20 16 13 20Continental SouthernEastern EuropeanNordic Anglo-Saxon
Evaluation of flexicurity (2007-2010): final report
75
5.4.1.12 Analysis of LMP expenditure as % of GDP
This indicator analyses the share of Member State GDP spend on active labour market policy. This is an important input indicator in relation to ALMP as it illustrates the level of expenditure specifically targeted on increasing the employment rate and activating unemployed individuals.
At the cluster level it is clear that, for both the pre-2007 and post-2007 time periods, the share of GDP spent on active labour market policies in the Nordic cluster was higher than for any other cluster. Within the cluster there were significant reductions in labour market policy expenditure between the two periods in both the Netherlands and Sweden.
The Continental and Anglo Saxon clusters exhibit the most significant intra-cluster variation, with the widest difference between Belgium and Luxembourg (Continental cluster) and the UK and Ireland (Anglo Saxon cluster).
In both the Nordic and Continental clusters there is a reduction in average ALMP spending (as a share of GDP) when the pre-2007 average is compared with the post-2007 average. For all other clusters there is no change in the average between the two time-periods. However, despite the cluster average remaining unchanged, there was a significant increase in LMP expenditure in Poland when the post 2007 period is compared with the pre-2007 period.
5.4.1.13 Analysis of the number of persons in active LMP (cat 2-7) as % of all participants in LMP (cat 1-9)
This indicator illustrates the share of ALMP expenditure that is specifically targeted on measures designed to promote employment through active measures, it is therefore an important input indicator in relation to ALMP for Member States.
Considering the share of persons in active LMP as a proportion of all LMP participants provides a somewhat mixed picture. The following issues are noteworthy:
▪ The proportion of those engaged in such policies is highest in Eastern Europe for the pre-2007 period, closely followed by the Continental and Nordic clusters. During the post-2007 period, however, the proportions increased at a greater rate in both the Nordic and Continental clusters. As a result, by the end of this period, each of these two clusters (the Nordic and Continental) had a larger share of persons in the active labour market category 2-7 provision than the Eastern European cluster did.
▪ There are a number of countries for which there is significant change between their pre-2007 period rate and their post-2007 rate. For example there were significant reductions in Ireland, Italy, Hungary, Bulgaria, Slovakia and Slovenia. In contrast there were significant increases in Denmark, Luxembourg, Cyprus and Poland.
5.4.2 ALMP - Process Indicators
Five process indicators are analysed in relation ALMP:
35. Employment rate: females 36. Employment rate: males 37. Employment rate: youth 38. Employment rate: older workers 39. Difference between number of actual weekly hours of work in main job for
males and females
The following issues are evident in relation to cluster performance across the five process indicators:
▪ The Southern cluster has the lowest female employment rate.
Evaluation of flexicurity (2007-2010): final report
76
▪ The Anglo-Saxon cluster has the greatest difference in the number of hours worked between male and female workers.
▪ The Eastern European cluster has a particularly low youth employment rate; however, in contrast to all other clusters, the rate increased when the pre-2007 and post-2007 periods are compared (albeit by only 0.2 percentage points).
▪ The Nordic cluster has the highest male and female employment rates. Youth employment and the employment rate for older workers is also highest in the Nordic cluster.
▪ For the Continental cluster the female employment rate increased at the greatest rate when the pre-2007 and post-2007 averages are considered.
There are some noteworthy variations within the clusters between individual Member States. For example:
▪ The average employment rate for older workers increased across all clusters (and in all Member States, with the exception of Denmark, Malta and Portugal);
▪ The employment rate for older workers is significantly higher in Sweden than in other Member States in the Nordic cluster;
▪ Within the Southern cluster the employment rate for older workers in Cyprus is notably higher than other Member States in the cluster
5.4.2.14 Analysis of the employment rate for females (15-64)
This indicator illustrates the employment rate for working age females across Member States.
At the cluster level the female employment rate is significantly higher in the Nordic cluster than any other cluster; this is the case in both the pre-2007 and post-2007 periods. Within the Nordic cluster, the Member State with the lowest female employment rate is Finland; however the rate in Finland for both the pre-2007 and post-2007 period is higher than any other non Nordic cluster Member State.
For all clusters the average female employment rate increased in the post-2007 period, compared to the pre-2007 period. In a small number of countries, however, the female employment rate marginally reduced when the two periods are compared (Sweden, UK and Romania).
The female employment rate is lowest in the Southern cluster. The cluster contains the three Member States with the lowest female employment rates for both periods (Malta, Italy and Greece). Whilst the average rate increased when the pre-2007 and post-2007 periods are compared for this cluster, it remains significantly lower than the closest cluster (5.8 percentage points lower than the Eastern Europe cluster).
5.4.2.15 Analysis of the employment rate for males (15-64)
This indicator illustrates the employment rate for working age males across Member States.
Across all flexicurity clusters there is significantly less variation in the employment rate for males than there is for females. As with the employment rate for females, however, the highest employment rate average remains in the Nordic cluster. The male employment rate for the Anglo Saxon cluster is the same as the Nordic cluster for the pre-2007 period, but the Anglo Saxon cluster average fell by -3.5 pp in the post-2007 period. In contrast the Nordic cluster average increased when the same comparison is made (by +0.2 pp.). The following intra-cluster observations are worthy of note:
▪ The employment rate in only one Member State in the Nordic Cluster declines when the pre-2007 and post-2007 comparison is made (Denmark, by 0.9pp.).
Evaluation of flexicurity (2007-2010): final report
77
▪ There were some notable increases in the male employment rate within the Eastern Europe cluster (Bulgaria, Czech Republic, Estonia when the post 2007 period is compared with the pre-2007 period).
▪ Within the Continental cluster Austria has the highest male employment rate, followed by Germany. The average employment rate for males increased in the post 2007 period for both of these Member States compared to the pre-2007 period. In contrast the male employment rate fell slightly in France and Luxembourg, it remained stable in Belgium.
▪ Between 2007 and 2010, the average male employment rate fell in all of the Southern cluster Member States, with the exception of Greece, where the male employment rate rose slightly.
5.4.2.16 Youth employment rate
This indicator illustrates the employment rate for young people (aged 15-24) across MS. This indicator is important in relation to ALMP because it illustrates the extent to which policies are impacting on young people.
The youth employment rate reduced across the EU when the post-2007 average is compared to the pre-2007 average (down from 36.2 percent to 35 percent). Reductions were most significant in the Anglo Saxon cluster, where the rate fell by 5.4 percentage points. In the Southern cluster the rate fell by 3.4 percentage points and there was a modest reduction (of 0.7 percentage points) in the Nordic cluster. In contrast there were increases in both the Continental and Eastern Europe clusters (each of 0.2 percentage points).
The youth employment rate average is highest in the Nordic cluster for both the pre- and post-2007 periods. This is, however, largely due to the very high rates in Denmark and the Netherlands. Indeed the youth employment rate in both Finland and Sweden is closer to the EU average. It is also notable that within the Continental cluster Austria and Germany have significantly higher youth employment rates than the other Member States in that cluster, the rates in Belgium, France and Luxembourg are closer to those in the average for the Eastern Europe cluster. All of the countries identified as having high youth employment rates are those with strong apprenticeship systems.
For all Member States within the Southern cluster the average youth employment rate fell when the pre-2007 period is compared to the post-2007 period. Malta still maintained a far more significant youth employment rate than other Member States in this cluster however (for the 2007-10 period the youth employment rate in Malta was ten percentage points higher than the EU average). Within the Eastern Europe cluster the youth employment rate reduced in four Member States (the Czech Republic, Hungary, Romania and Slovakia) and increased in the 6 others when the averages for the two periods are considered.
5.4.2.17 Employment rate for older workers
This indicator illustrates the employment rate for older workers (aged 55-64) across Member States. This indicator is important in relation to ALMP because it illustrates the extent to which policies are impacting on older workers.
In common with the youth employment rate, the employment rate for older workers is highest in the Nordic and Anglo Saxon clusters. Comparing the pre-2007 and post-2007 periods, the average employment rate for older workers increased across all clusters (and in all Member States, with the exception of Denmark, Malta and Portugal). The most significant increase, when the pre-2007 and post-2007 periods are compared is in the Continental cluster (+7.9 percentage points), however the average rate remains lowest in this cluster. The following intra-cluster issues are also evident:
▪ The employment rate for older workers is significantly higher in Sweden than in other Member States in the Nordic cluster; although the increase in the
Evaluation of flexicurity (2007-2010): final report
78
average rate in the Netherlands between 2007 and 2010 means that the divergence in rates within the cluster was smaller in the post-2007 period than the pre-2007 period.
▪ Within the Continental cluster the employment rate for older workers in Germany rose to a greater degree than in other Member States when the two periods are compared. There remains significant variance between the rates within this cluster however.
▪ The rates within the UK and Ireland remain similar, the average for each of these two Member States increased by approximately 2.5 percentage points when the pre and post 2007 periods are compared.
▪ Within the Southern cluster the rate in Cyprus is notably higher than other Member States, the average rate also increased by more than five percentage points when the pre-2007 and post 2007 periods are compared.
▪ The average employment rate for older workers in the Eastern European cluster increased by 6.8 percentage points when the averages for the pre-2007 and post-2007 periods are compared. The greatest increases were in Bulgaria and Slovakia.
5.4.2.18 Average number of hours worked
This indicator provides a comparison for the average number of hours worked by males and females in each Member State, calculating the difference between the two averages.
Data for the average number of hours worked, segmented by gender is not available for the pre-2007 period. Considering the period 2008 to 2010, it is noticeable that the greatest difference in the number of hours worked is in the Anglo Saxon cluster, within which the rates for UK and Ireland are similar. The cluster with the smallest difference in the number of hours worked for males and females is the Eastern Europe group. Within the Eastern Europe group the lowest differences are in Bulgaria, Lithuania, Latvia and Romania; each of which has fewer than two hours difference in the average number of hours worked by males and female workers.
Within the Nordic cluster there are similarities in the patterns of differences between Denmark, Finland and Sweden. The Netherlands, however, has the greatest differences in the average number of hours worked by males and females. The Southern cluster average is closest to the EU average for this indicator.
5.4.3 ALMP – Outcome indicators
Two outcome indicators are analysed in relation to ALMP:
40. LTU as % of all unemployment 41. Unemployment rate (youth) 42. Unemployment Rate (female) 43. Unemployment rate (older workers)
The following issues are evident in relation to cluster performance across the four process indicators:
▪ The Southern cluster has the highest rate of youth unemployment in the post-2007 period.
▪ The Anglo-Saxon cluster was the only cluster within which the average rate of female unemployment increased between the two periods.
▪ The Eastern European cluster has the highest rate of long term unemployment. This was the only cluster for which the average youth unemployment rate reduced when the pre-2007 and post-2007 periods are compared.
▪ The Nordic cluster has the lowest rate of long term unemployment, the lowest rate of youth unemployment, the lowest rate of female unemployment, and, as one might expect the lowest overall rate of unemployment.
Evaluation of flexicurity (2007-2010): final report
79
There are some noteworthy variations within the clusters between individual Member States. For example:
▪ In terms of long term unemployment Lithuania, Poland and Romania each reduced their LTU rate by approximately 20 percentage points when the pre-2007 and post-2007 periods are compared, whereas the rate in Hungary increased by +1.9 percentage points.
▪ Within the Nordic cluster Sweden was the only Member State where the average female unemployment rate increased between the two periods. Additionally, in contrast to all other Member States in the cluster, the unemployment rate in the Netherlands increased when the pre-2007 and post-2007 periods are compared.
▪ There was considerable variance within the Eastern Europe cluster. For half of the Member States in the cluster the overall unemployment rate increased, whereas for the other half it contracted.
5.4.3.19 Analysis of the long term unemployment (LTU) employment rate
This indicator analyses the share of long-term unemployment (12 months or more) relative to total unemployment. This is an important outcome indicator in relation to ALMP as it illustrates the extent to which successful outcomes have been achieved (where the rate is low) and where ALMP measures have been less successful (where the rate is high).
Issues of LTU are most significant in the Eastern Europe, Southern and Continental clusters, the average rate for each of these clusters is above the EU average. The Eastern Europe cluster, however, witnessed the greatest reduction when the pre-2007 and post-2007 periods are considered (-11.6 percentage points). The Anglo Saxon cluster was the only cluster within which LTU increased when the two time periods are compared. The Nordic LTU rate is lowest for both the pre-2007 and post-2007 periods.
The following intra-cluster issues are also evident:
▪ Within the Nordic cluster the LTU rate is highest in the Netherlands; however it decreased for all Member States when the averages for the pre-2007 and post-2007 periods are compared.
▪ The average for the Continental cluster LTU increased from the pre-2007 level due to rises in Austria, France and Luxembourg. LTU fell in Belgium and Germany.
▪ LTU rose in both Ireland and the UK when the pre-2007 and post-2007 periods are compared. The increase was greatest in the UK (+3.3 percentage points, compared to 0.7 percentage points in Ireland).
▪ The LTU rate reduced in all of the Southern cluster countries, with the exception of Portugal and Malta, for which there were increases in the average rates (+1.4 percentage points for Malta, and +6.3 percentage points for Portugal)
▪ The greatest reductions in the average LTU rates for the two periods considered were in Lithuania, Poland and Romania (each of which reduced their LTU rate by approximately 20 percentage points). In contrast, the only Member State in this cluster that experienced an increase in LTU when the pre-2007 and post-2007 periods are considered was Hungary (+1.9 percentage points).
5.4.3.20 Analysis of the youth unemployment rate
This indicator illustrates the share of young people in each Member State that are out of work and actively seeking employment. It is therefore an important ALMP outcome indicator due to the fact that it indicates the number of individuals
Evaluation of flexicurity (2007-2010): final report
80
engaged in such measures that have yet to find employment, as well as showing the ease of transition of young people from education to employment.
The youth unemployment rate increased in all clusters when the average rates for the pre-2007 and post-2007 periods are compared, with the exception of the Eastern Europe cluster, within which the average rate reduced by 3.1 percentage points. In the post-2007 period youth unemployment was lowest in the Continental cluster, however the rate increased by 1.8 percentage points, compared to an increase of only 0.8 percentage points in the Nordic cluster. As a result the Nordic cluster average replaced the Continental cluster as the cluster with the lowest rate of youth unemployment in the post-2007 period.
Comparing the pre-2007 and post-2007 periods, the largest increase in the youth unemployment rate was in the Anglo Saxon cluster (+8.0 percentage points). For the post-2007 period, the youth unemployment rate is most significant in the Southern cluster. In the pre-2007 period the Eastern Europe cluster had the largest average unemployment rate.
The following intra-cluster developments are also noteworthy:
▪ The greatest reductions in the average youth unemployment rates for the two periods considered were in Bulgaria, Poland and Slovakia (-17.0; -12.0; -8.0 percentage points respectively). In contrast, there were increases in the average youth unemployment rates for the two periods in Estonia, Hungary and Latvia in the Eastern Europe cluster.
▪ Within the Anglo Saxon cluster the youth unemployment rate in both the UK and Ireland increased, however the increase was much greater in Ireland (+10.7 percentage points) than in the UK increase (+5.3 percentage points).
▪ In the Nordic cluster there were also varying degrees and trends. In Finland, for example, the youth unemployment rate reduced by -6.4 percentage points, compared to an increase in Sweden of +6.5 percentage points. There were modest increases in both Denmark and the Netherlands.
▪ Within the Continental cluster the youth unemployment rate is highest in Belgium and France, there was a slight increase in the rate for both of these Member States when the pre-2007 and post-2007 periods are compared; in contrast there was a slight decline in the rate in Germany.
5.4.3.21 Analysis of the female unemployment rate
This indicator illustrates the share of working age females in each Member State that are out of work and actively seeking employment. It is therefore an important ALMP outcome indicator due to the fact that it indicates the number of individuals engaged in such measures that have yet to find employment, as well as being a function of labour market dynamism and economic trends.
When the pre-2007 and post-2007 averages are compared, the average EU female unemployment rate reduced by -1.1 percentage points. The most significant reduction was in the Eastern Europe cluster (-2.6 percentage points), however, this cluster remains the cluster within which female unemployment is highest (10.2% average in the post-2007 period). The only cluster within which the average rate of female unemployment increased between the two periods was the Anglo Saxon cluster (an increase of 2.0 percentage points). In the post-2007 period the Anglo Saxon cluster had had the lowest average for female unemployment, in the post-2007 period, however, the Nordic cluster had the lowest average female unemployment rate.
The following intra-cluster developments are also evident:
▪ There were significant decreases in the average female unemployment rate in Bulgaria, Poland and Slovakia when the two periods are compared. There was a slight increase in female unemployment in Latvia and a large increase in Hungary.
Evaluation of flexicurity (2007-2010): final report
81
▪ Within the Nordic cluster Sweden was the only Member State within which the average female unemployment rate increased between the two periods.
▪ Within the Continental cluster Luxembourg was the only Member State within which the average female unemployment rate increased between the two periods.
▪ Within the Southern cluster Spain and Portugal were the only Member States within which the average female unemployment rate increased between the two periods
▪ Within the Eastern Europe cluster Hungary and Latvia were the only Member States where the average female unemployment rate increased between the two periods.
5.4.4 The relationship between input and process / outcome indicators
The table below summarises the performance of clusters across the input and process / outcome indicators.
Table 5.4 Performance of clusters in relation to input and process / outcome indicators
Input indicators Process indicators Outcome indicators
Southern Mid-range level of share of GDP spent on ALMP, mid-range for share of ALMP recipients engaged in category 2-7.
Mid-range male and lowest female employment rate, second lowest youth employment rate, mid-range older workers employment rate, mid-range difference between male and female average hours worked
Mid-range LTU rate, highest youth and female unemployment rates and second highest unemployment rate.
Anglo-
Saxon
Mid-range level of share of GDP spent on ALMP, mid-range for share of ALMP recipients engaged in category 2-7.
Middle-range male and second highest female employment rate, second highest youth and older worker employment rates, highest difference between male and female average hours worked
Mid-range LTU, youth, female and overall unemployment rates
Eastern Lowest level of share of GDP spent on ALMP, mid-range for share of ALMP recipients engaged in category 2-7.
Mid-range female and lowest male employment rates, lowest youth employment rate, mid-range older workers employment rate, lowest difference between male and female average hours worked
Highest LTU rate, second highest youth and female unemployment rates, highest unemployment rate.
Nordic Highest share of GDP spent on ALMP, second highest share of ALMP recipients engaged in category 2-7.
Highest female and male employment rate, highest youth and older workers employment rates, mid-range difference between male and female average hours worked
Lowest for all indicators
Continental High share of GDP spent on ALMP, highest share of ALMP recipients engaged in category 2-7.
Middle-range male and female employment rate, middle-range youth and older workers employment rates, second highest difference between male and female average hours worked
Mid-range for LTU, second lowest youth unemployment rate, mid-range for female and overall unemployment rates.
However, such cluster level analysis conceals the variations within the clusters. The figures below show the relative positioning of individual countries on the lifelong learning input and process / outcome indicators.
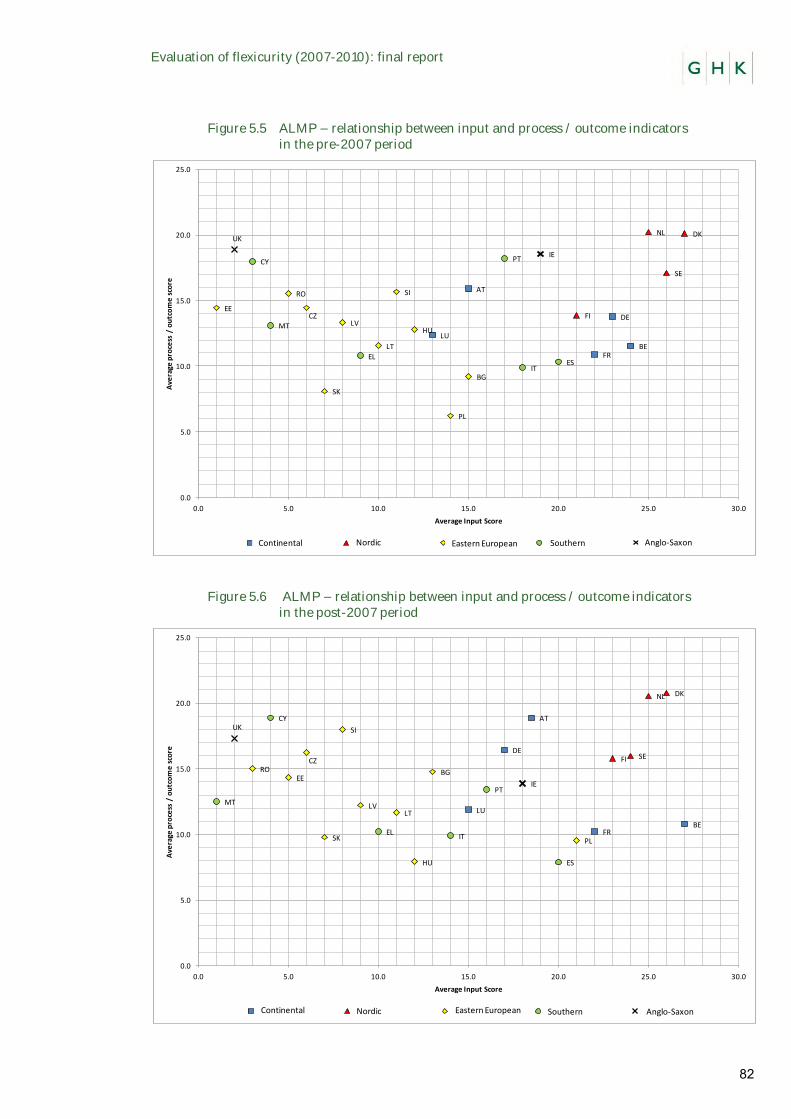
Evaluation of flexicurity (2007-2010): final report
82
Figure 5.5 ALMP – relationship between input and process / outcome indicators in the pre-2007 period
Figure 5.6 ALMP – relationship between input and process / outcome indicators in the post-2007 period
AT
BE
BG
CY
CZ
DK
EEFI
FR
DE
EL
HU
IE
IT
LV
LT
LUMT
NL
PL
PT
RO
SK
SI
ES
SE
UK
0.0
5.0
10.0
15.0
20.0
25.0
0.0 5.0 10.0 15.0 20.0 25.0 30.0
Ave
rage
pro
cess
/ o
utc
om
e s
core
Average Input Score
13.0 25.0 11.0 20.0 2.0Continental SouthernEastern EuropeanNordic Anglo-Saxon
AT
BE
BG
CY
CZ
DK
EE
FI
FR
DE
EL
HU
IE
IT
LVLT LU
MT
NL
PL
PT
RO
SK
SI
ES
SE
UK
0.0
5.0
10.0
15.0
20.0
25.0
0.0 5.0 10.0 15.0 20.0 25.0 30.0
Ave
rage
pro
cess
/ o
utc
om
e s
core
Average Input Score
15.0 25.0 8.0 20.0 2.0Continental SouthernEastern EuropeanNordic Anglo-Saxon
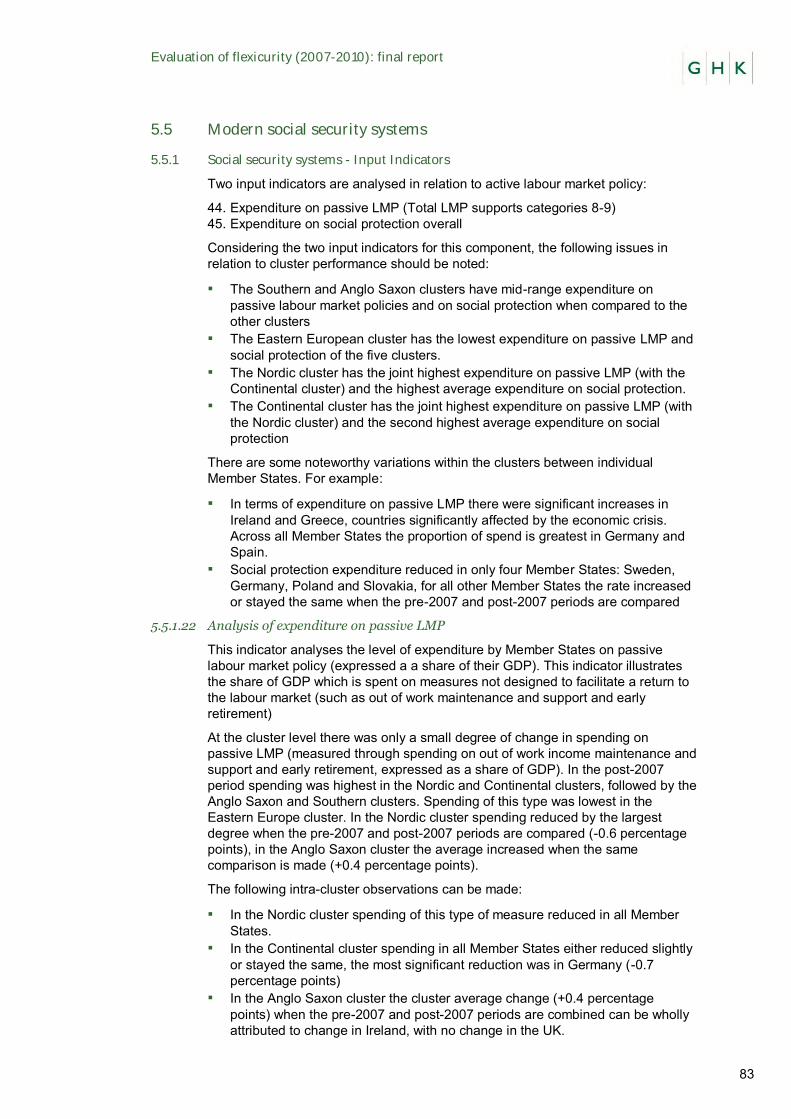
Evaluation of flexicurity (2007-2010): final report
83
5.5 Modern social security systems
5.5.1 Social security systems - Input Indicators
Two input indicators are analysed in relation to active labour market policy:
44. Expenditure on passive LMP (Total LMP supports categories 8-9) 45. Expenditure on social protection overall
Considering the two input indicators for this component, the following issues in relation to cluster performance should be noted:
▪ The Southern and Anglo Saxon clusters have mid-range expenditure on passive labour market policies and on social protection when compared to the other clusters
▪ The Eastern European cluster has the lowest expenditure on passive LMP and social protection of the five clusters.
▪ The Nordic cluster has the joint highest expenditure on passive LMP (with the Continental cluster) and the highest average expenditure on social protection.
▪ The Continental cluster has the joint highest expenditure on passive LMP (with the Nordic cluster) and the second highest average expenditure on social protection
There are some noteworthy variations within the clusters between individual Member States. For example:
▪ In terms of expenditure on passive LMP there were significant increases in Ireland and Greece, countries significantly affected by the economic crisis. Across all Member States the proportion of spend is greatest in Germany and Spain.
▪ Social protection expenditure reduced in only four Member States: Sweden, Germany, Poland and Slovakia, for all other Member States the rate increased or stayed the same when the pre-2007 and post-2007 periods are compared
5.5.1.22 Analysis of expenditure on passive LMP
This indicator analyses the level of expenditure by Member States on passive labour market policy (expressed a a share of their GDP). This indicator illustrates the share of GDP which is spent on measures not designed to facilitate a return to the labour market (such as out of work maintenance and support and early retirement)
At the cluster level there was only a small degree of change in spending on passive LMP (measured through spending on out of work income maintenance and support and early retirement, expressed as a share of GDP). In the post-2007 period spending was highest in the Nordic and Continental clusters, followed by the Anglo Saxon and Southern clusters. Spending of this type was lowest in the Eastern Europe cluster. In the Nordic cluster spending reduced by the largest degree when the pre-2007 and post-2007 periods are compared (-0.6 percentage points), in the Anglo Saxon cluster the average increased when the same comparison is made (+0.4 percentage points).
The following intra-cluster observations can be made:
▪ In the Nordic cluster spending of this type of measure reduced in all Member States.
▪ In the Continental cluster spending in all Member States either reduced slightly or stayed the same, the most significant reduction was in Germany (-0.7 percentage points)
▪ In the Anglo Saxon cluster the cluster average change (+0.4 percentage points) when the pre-2007 and post-2007 periods are combined can be wholly attributed to change in Ireland, with no change in the UK.
Evaluation of flexicurity (2007-2010): final report
84
▪ When the pre-2007 and post-2007 periods are compared there are quite similar changes between Member States in the Southern cluster (changes range from -0.4 percentage points to +0.4 percentage points).
▪ In the Eastern Europe cluster there was considerable variance in the observable trends. Whilst in eight of the ten Member States the proportion of spending on passive LMP increased, it did decline significantly in Poland and Romania.
5.5.1.23 Analysis of expenditure on social protection
This indicator illustrates the percentage of Member State GDP that is spent on social protection.
An analysis of the total expenditure, expressed as a percentage of GDP, for the five clusters illustrates that, for the post-2007 period the Nordic cluster had the highest average expenditure, followed by the Continental, Anglo Saxon and Southern clusters. As with the proportion of spend on passive labour market policy, the average spend for the Eastern Europe cluster is the lowest. This is consistent with the order of ranking for the pre-2007 period.
Across the pre- and post-2007 period, all clusters increased the proportion of spend on social protection. The most significant rates of change were in the Anglo Saxon cluster (+4.4 percentage points) and the Southern cluster (+3.2 percentage points).
At the Member State level, the following issues are worthy of note:
▪ Social protection expenditure reduced in only four Member States: Sweden, Germany, Poland and Slovakia, for all other Member States the rate increased or stayed the same across the pre-2007 and post-2007 periods.
▪ The most significant increases in expenditure in this area were in Ireland (+8.0 percentage points) and Lithuania (+4.3 percentage points).
5.5.2 Social security - Process Indicators
Six process indicators are analysed in relation social security:
46. Employment rate of females aged 20-49 without children 47. Employment rate of females aged 20-49 with 1 child less than 6 years old 48. Formal childcare, children less than 3 years (1-29 hours) 49. Formal childcare, children less than 3 years (30+ hours) 50. Unemployment trap (low wage-earner) 51. In part time employment due to Looking after children or incapacitated adults
Considering the six process indicators for this component, the following issues should be noted:
▪ The Southern cluster has by far the lowest female employment rate for females aged 20-49 without children, the cluster has a mid-range employment rate for females aged 20-49 with 1 child. The cluster has a low level average use of childcare (1-29 hours, age of children less than 3 years). The cluster can be considered to have a mid-range average for use of childcare for more than 30 hours. The cluster can be considered a mid-range performer in terms of the unemployment trap (low wage earners). The Southern cluster has the second lowest average for the rate of people in part-time work due to looking after children or incapacitated adults
▪ The Eastern European cluster has a mid-range employment rate for females aged 20-49 without children but has the lowest average employment rate for females aged 20-49 with 1 child. The cluster has the lowest level average use of childcare (1-29 hours, age of children less than 3 years). The cluster has a low average for use of childcare for more than 30 hours. The Eastern Europe cluster performs most poorly in relation to the unemployment trap (low wage
Evaluation of flexicurity (2007-2010): final report
85
earners). The Eastern Europe cluster has the lowest average for the rate of people in part-time work due to looking after children or incapacitated adults.
▪ The Nordic cluster has the highest cluster average employment rate of females aged 20-49 without children. The Nordic cluster average is the second highest employment rate for females aged 20-49 with 1 child. The Nordic cluster has the second highest average use of childcare (1-29 hours, age of children less than 3 years). Use of childcare for more than 30 hours is most significant in the Nordic cluster. The cluster has the lowest average unemployment trap (low wage earners) across all clusters. The cluster has a mid-range average for the rate of people in part-time work due to looking after children or incapacitated adults.
▪ The Anglo Saxon cluster has the second highest average employment rate of females aged 20-49 without children and a mid-range average in terms of the employment rate for females aged 20-49 with 1 child. The Anglo Saxon cluster has the highest average level of use of formal childcare (1-29 hours, age of children less than 3 years). The average for the Anglo Saxon cluster is the lowest in relation to use of formal childcare (30+ hours). The cluster can be considered a mid-range performer in terms of the unemployment trap (low wage earners). The cluster has a mid-range average for the rate of people in part-time work due to looking after children or incapacitated adults.
▪ The Continental cluster can be considered to have a mid-range employment rate of females aged 20-49 without children. The Continental cluster has the highest employment rate for females aged 20-49 with 1 child. The Continental cluster has a mid-range level of use of formal childcare (1-29 hours, age of children less than 3 years). The cluster can be considered to have a mid-range average for use of childcare for more than 30 hours. The Continental cluster performs poorly in terms of the unemployment trap (low wage earners). The Continental cluster has the highest average for the rate of people in part-time work due to looking after children or incapacitated adults.
There are some noteworthy variations within the clusters between individual Member States. For example:
▪ In the Eastern Europe cluster, 5 Member States increased their female employment rate for females aged 20-49 without children, whilst in the other five employment rates contracted. There was also significant variance in the Southern cluster for this indicator when the pre-2007 and post-2007 periods are compared.
▪ Data Analysis of the use of formal childcare (1-29 hours, age of children less than 3 years) at Member State level illustrates a significant degree of intra-cluster variance in all clusters, the only cluster within which all Member States trends are similar is the Anglo Saxon cluster.
▪ In terms of the use of formal childcare (30+ hours) the following key points are evident: – As noted above, there is a significantly high average use of childcare for
more than 30 hours in Denmark, for the post-2007 period the average rate is slightly more than double that of any other Member State.
– Within the Continental cluster there are significantly high rates for Belgium, France and Luxembourg. Conversely the rate in Austria is among the lowest in Europe, the same as Poland, Slovakia and Romania (just 2% for the post-2007 period).
▪ In relation to the average rate of people in part-time work due to looking after children or incapacitated adults, the rate increased most significantly within the Nordic cluster. It increased most sharply in the Netherlands (+23.8 percentage points).
Evaluation of flexicurity (2007-2010): final report
86
5.5.2.24 Analysis of the female employment rate (females aged 20-49 without children)
This indicator analyses the female employment rate for females without children across all Member States.
With regards to the employment rate of females aged 20-49 without children, the highest cluster average employment rate for this indicator is in the Nordic cluster, however the Anglo Saxon is very close to the Nordic average. In the pre-2007 period the Anglo Saxon cluster had the highest average rate for this indicator. The Continental cluster has the third highest average for this indicator, followed by the Eastern Europe cluster. The Southern cluster has by far the lowest female employment rate in this category.
Considered at the Member State level there are some interesting examples of intra-cluster variation:
▪ In the Eastern Europe cluster, 5 Member States increased their employment rate in this category, whilst in the other five employment rates contracted. The percentage point change in averages ranged from +6.5, in the case of Poland, through to 3.1 percentage points in the case of Lithuania.
▪ Similarly there was some variance in the Member State averages in the Southern cluster when the pre-2007 and post-2007 periods are compared. (+4.9 percentage point change in Malta, compared to -0.6 percentage point change in Spain)
▪ The changes on average change were very similar within the Nordic and Continental clusters, where all Member States increased their female employment rate; and in the Anglo Saxon cluster, where both the UK and Ireland averages contracted.
5.5.2.25 Analysis of the female employment rate (females aged 20-49 with 1 child)
This indicator analyses the female employment rate for females aged 20-49 with 1 child less than 6 years old. This indicator is important in relation to social security systems as it illustrates the extent to which systems are in place which facilitate and support return to employment.
Considering the employment rate of females aged 20-49 with 1 child less than 6 years old it is immediately evident that the performance of the Continental cluster is much stronger than for the previous indicator. The Continental cluster has the highest employment rate in this category. Furthermore this was also the case for the pre-2007 period. The Nordic cluster average is the second highest for this indicator, followed by the Anglo Saxon cluster. In contrast to the previous indicator, the Southern cluster has a higher average for this indicator than the Eastern Europe cluster.
When individual Member State performance is considered there is slightly more variance in terms of the intra-cluster performance:
▪ Whilst full data is not available for the Nordic cluster, it can be noted that the rate of change when the pre-2007 and post-2007 periods are compared varies between Finland (-0.3 percentage point change) and Sweden (+4.4 percentage point change)
▪ Within the Continental cluster there is also some variance in terms of the performance of Luxembourg, within which the employment rate for this category contracts (by -0.5 percentage points), for all other Member States in the cluster the rate increases.
▪ There is also variance within the Southern and Eastern Europe cluster.
5.5.2.26 Analysis of the use of formal childcare (1-29 hours, age of children less than 3 years)
This indicator analyses the extent to which formal childcare is accessed, for between 1 and 29 hours per week, by those with children that are less than 3 years
Evaluation of flexicurity (2007-2010): final report
87
of age. This indicator illustrates the extent to which childcare is available and accessed by parents, enabling them to take up employment or participate in ALMP and/or education.
Regarding the use of formal childcare (1-29 hours, age of children less than 3 years), the following cluster level issues should be noted:
▪ The Anglo Saxon cluster has the highest average level of use of formal childcare for this category (23.3% for the post-2007 Period). The Anglo Saxon cluster also had the highest average for the post-2007 period, however increases in this indicator when the pre-2007 and post-2007 periods are compared has widened the gap between the Anglo Saxon cluster and the other clusters.
▪ The Nordic cluster has the second highest average use of childcare for this category, and the Continental has the third highest. For both of these clusters the average percentage point increase when the pre-2007 and post-2007 periods are compared was +0.5.
▪ The Southern and Eastern Europe clusters have far lower levels of use of formal childcare for this category, Eastern Europe has the lowest rate and the increase in its rate was the smallest when the pre-2007 and post-2007 periods are compared (+0.3 percentage points).
Considering the data at Member State level for use of formal childcare (1-29 hours, age of children less than 3 years) illustrates a significant degree of intra-cluster variance in all clusters, the only cluster within which all Member States trends are similar is the Anglo Saxon cluster.
5.5.2.27 Analysis of the use of formal childcare (30+ hours)
This indicator analyses the extent to which formal childcare is accessed, for between 1 and 29 hours per week, by those with children that are less than 3 years of age. This indicator illustrates the extent to which childcare is available and accessed by parents, enabling them to take up employment or participate in ALMP and/or education.
At the cluster level the data for average use of formal childcare for more than 30 hours presents a slightly different picture. The average for the Anglo Saxon cluster is the lowest of all clusters for this indicator, in contrast to its position as the highest ranked cluster in relation to use of formal childcare for 1-29 hours. This is the case for both the pre-2007 and post 2007 periods examined. Use of childcare for more than 30 hours is most significant in the Nordic cluster (although this is clearly driven by the very high rate in Denmark). The rates in the Southern and Continental clusters are very similar.
At the Member State level the following should be noted:
▪ As noted above, there is a significantly high average use of childcare for more than 30 hours in Denmark, for the post-2007 period the average rate is slightly more than double that of any other Member State.
▪ Within the Continental cluster there are significantly high rates for Belgium, France and Luxembourg. Conversely the rate in Austria is among the lowest in Europe, the same as Poland, Slovakia and Romania (just 2% for the post-2007 period).
▪ There is also significant variance in the Southern cluster, averages range from 4% in Malta through to 30% in Portugal.
▪ In the Eastern Europe cluster the range is also wide, from 0% in Czech Republic through to 27% in Slovenia.
5.5.2.28 Analysis of the unemployment trap (low wage earners)
This indicator illustrates the extent to which there is an incentive for those out of work to take up employment, i.e. it measures the percentage of gross earnings
Evaluation of flexicurity (2007-2010): final report
88
which is “taxed away” through higher tax and social security contributions and the withdrawal of unemployment and other benefits when an unemployed person returns to employment. It is therefore an important indicator in relation to social secturity and its contribution to employment outcomes.
Consideration of the unemployment trap indicator for low wage earners illustrates that the cluster which performs most poorly in this indicator is the Eastern Europe cluster, whereas the cluster which performs best is the Nordic cluster. Interestingly, the Southern and Continental clusters had the same pre-2007 averages for this indicator, for the post-2007 period; however, the Southern cluster reduced its average to a lower average than the Continental cluster (75.6% compared to 77.2%).
Analysis of the individual performance of Member States illustrates the following key points:
▪ There was significant variance within the Nordic cluster when the pre-2007 and post-2007 periods are compared. In Finland, for example, the rate increased by +9.8 percentage points, compared to a reduction of -9.3 percentage points in Sweden.
▪ There was a closer correlation in terms of percentage point change in the Continental cluster, but there was significant variation within the Anglo Saxon cluster (in the UK the rate fell by -1.5 percentage points, compared to an increase of +13.0 percentage points in the Ireland).
▪ There was also significant variance in the percentage point change rates of change in the Southern and Eastern Europe clusters. the most significant changes, when the pre-2007 and post-2007 periods are compared, was within Latvia (+18.3 percentage points)
5.5.2.29 Analysis of the reasons for part-time employment (Looking after children or incapacitated adults)
This indicator measures the share of those in part-time employment that state the reason for this is due to looking after children or incapacitated adults. This indicator is important in the context of social security systems due to the fact that it illustrates the extent to which Member State systems act to support full-time employment.
Considering where the reason for part-time employment is looking after children or incapacitated adults, the performance of clusters varies considerably. During the post-2007 period the cluster with the highest rate for this indicator was the Continental cluster (25.8%), whereas the lowest was the Eastern Europe cluster (7.3%). For all clusters the average rate for this indicator declined between the pre-2007 and post-2007 periods, with the exception of the Continental cluster (+7.0 percentage points). There was a decline in the EU average of -0.2 percentage points over the same period.
Within clusters there are also a number of issues to note:
▪ Within the Nordic cluster the rate increased for all Member States. It increased most significantly, however, in the Netherlands (+23.8 percentage points).
▪ Intra-cluster variance was most significant in the Continental cluster. The rates of changed varied from -27.4 percentage points, in the case of Germany, to +19.3 percentage points, in the case of France.
▪ The smallest degree of variance can be observed within the Anglo Saxon cluster, where both the UK and Ireland witnessed small degrees of change, each were subject to modest reductions in their rates for this indicator.
▪ Within the Southern cluster the rate for three Member States reduced and increased for the remaining three when the pre-2007 and post-2007 periods are compared. The rate of change varied from -7.3 percentage points in the case of Italy to +7.9 percentage points in the case of Cyprus.
Evaluation of flexicurity (2007-2010): final report
89
▪ There was less variance in the Eastern Europe cluster, which continued to have a significantly lower rate for this indicator than the other clusters.
5.5.3 Social security - outcome indicators
Two outcome indicators are analysed in relation to social security:
52. At risk of poverty rate before social transfers 53. In-work at-risk-of-poverty
Considering the two outcome indicators for this component, the following issues should be noted:
▪ The Southern cluster has the lowest at risk of poverty rate before social transfers of all clusters; however it has the highest in-work at-risk-of poverty rate.
▪ The Anglo-Saxon cluster has the second highest at risk of poverty rate before social transfers of all clusters and a mid-range at-risk-of poverty rate.
▪ The Eastern European cluster has a mid-range at risk of poverty rate before social transfers of all clusters. the cluster has the second highest in-work at-risk-of poverty rate.
▪ The Nordic cluster has a mid-range at risk of poverty rate before social transfers of all clusters and the lowest in-work at-risk-of poverty rate.
▪ The Continental cluster has the highest at risk of poverty rate before social transfers of all clusters and a mid-range at-risk-of poverty rate.
There are some noteworthy variations within the clusters between individual Member States. For example:
▪ In terms of the at risk of poverty rate before social transfers the most significant intra-cluster variances can be found in the Southern and Eastern Europe clusters.
▪ The in-wok at-risk-of-poverty rate is noticeably higher in Romania than in any other member State.
5.5.3.30 Analysis of the at risk of poverty rate before social transfers
This indicator measures the share of the working age population considered at risk of poverty (those less with less than 60 % of the national median equivalised disposable income) before social transfers.
Considering the at risk of poverty rate before social transfers, it is notable that there is significantly less variation between clusters than for most other indicators examined for this component. The Average rate for the post-2007 period is highest in the Continental cluster, followed by the Anglo Saxon cluster, with the lowest rate in the Southern cluster. What is also noticeable is that the rate has increased for all clusters when the pre-2007 and post-2007 periods are compared.
In terms of intra-cluster trends the following developments are worthy of note:
▪ Within the Nordic cluster all Member States at risk of poverty rate before social transfers average rates increased when the pre-2007 and post-2007 periods are compared. Increases were most significant in Finland (+5.4 percentage points) and the Netherlands (+4.6 percentage points)
▪ Within the Continental cluster each Member State increased its rate. Within the Anglo Saxon cluster both the UK and Ireland increased their rates when the two periods are compared, however there was more variance in this cluster than the Continental cluster (+9.4 percentage points in the case of Ireland and just +3.8 percentage points in the case of the UK)
▪ The most significant intra-cluster variances can be found in the Southern and Eastern Europe clusters. Within the Southern cluster the rate of change between the pre-2007 and post-2007 periods varied from +11.4 percentage
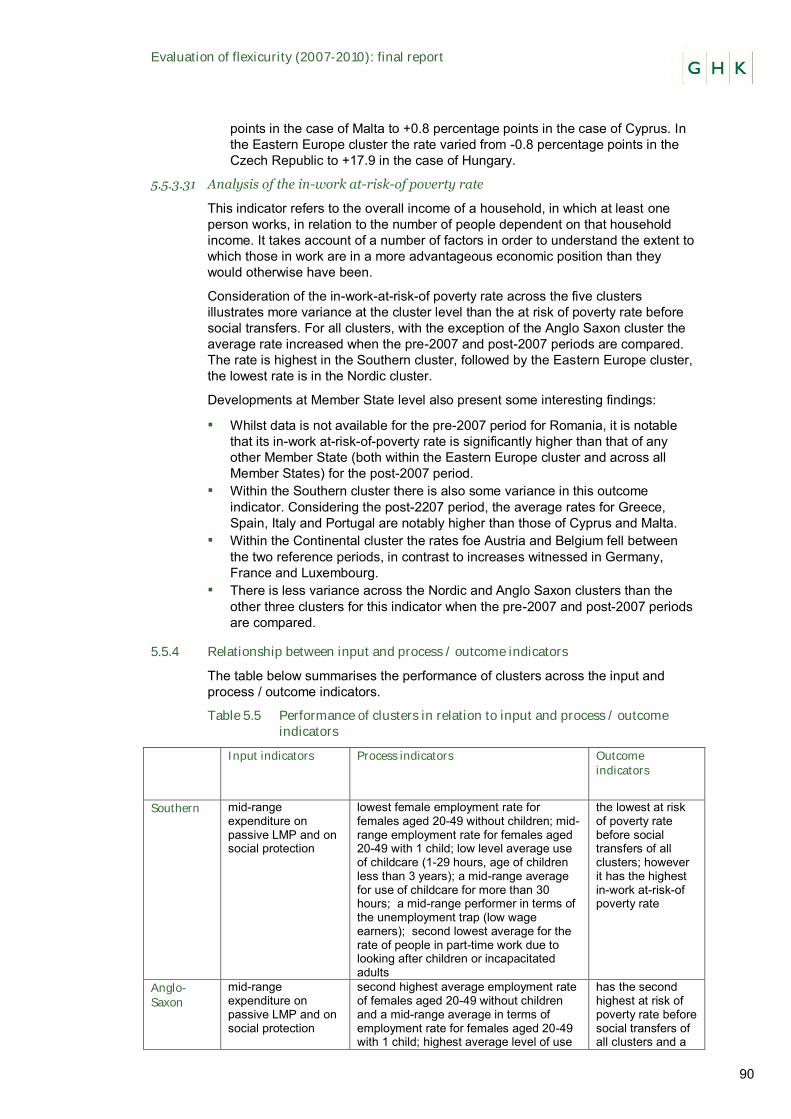
Evaluation of flexicurity (2007-2010): final report
90
points in the case of Malta to +0.8 percentage points in the case of Cyprus. In the Eastern Europe cluster the rate varied from -0.8 percentage points in the Czech Republic to +17.9 in the case of Hungary.
5.5.3.31 Analysis of the in-work at-risk-of poverty rate
This indicator refers to the overall income of a household, in which at least one person works, in relation to the number of people dependent on that household income. It takes account of a number of factors in order to understand the extent to which those in work are in a more advantageous economic position than they would otherwise have been.
Consideration of the in-work-at-risk-of poverty rate across the five clusters illustrates more variance at the cluster level than the at risk of poverty rate before social transfers. For all clusters, with the exception of the Anglo Saxon cluster the average rate increased when the pre-2007 and post-2007 periods are compared. The rate is highest in the Southern cluster, followed by the Eastern Europe cluster, the lowest rate is in the Nordic cluster.
Developments at Member State level also present some interesting findings:
▪ Whilst data is not available for the pre-2007 period for Romania, it is notable that its in-work at-risk-of-poverty rate is significantly higher than that of any other Member State (both within the Eastern Europe cluster and across all Member States) for the post-2007 period.
▪ Within the Southern cluster there is also some variance in this outcome indicator. Considering the post-2207 period, the average rates for Greece, Spain, Italy and Portugal are notably higher than those of Cyprus and Malta.
▪ Within the Continental cluster the rates foe Austria and Belgium fell between the two reference periods, in contrast to increases witnessed in Germany, France and Luxembourg.
▪ There is less variance across the Nordic and Anglo Saxon clusters than the other three clusters for this indicator when the pre-2007 and post-2007 periods are compared.
5.5.4 Relationship between input and process / outcome indicators
The table below summarises the performance of clusters across the input and process / outcome indicators.
Table 5.5 Performance of clusters in relation to input and process / outcome indicators
Input indicators Process indicators Outcome
indicators
Southern mid-range expenditure on passive LMP and on social protection
lowest female employment rate for females aged 20-49 without children; mid-range employment rate for females aged 20-49 with 1 child; low level average use of childcare (1-29 hours, age of children less than 3 years); a mid-range average for use of childcare for more than 30 hours; a mid-range performer in terms of the unemployment trap (low wage earners); second lowest average for the rate of people in part-time work due to looking after children or incapacitated adults
the lowest at risk of poverty rate before social transfers of all clusters; however it has the highest in-work at-risk-of poverty rate
Anglo-
Saxon
mid-range expenditure on passive LMP and on social protection
second highest average employment rate of females aged 20-49 without children and a mid-range average in terms of employment rate for females aged 20-49 with 1 child; highest average level of use
has the second highest at risk of poverty rate before social transfers of all clusters and a
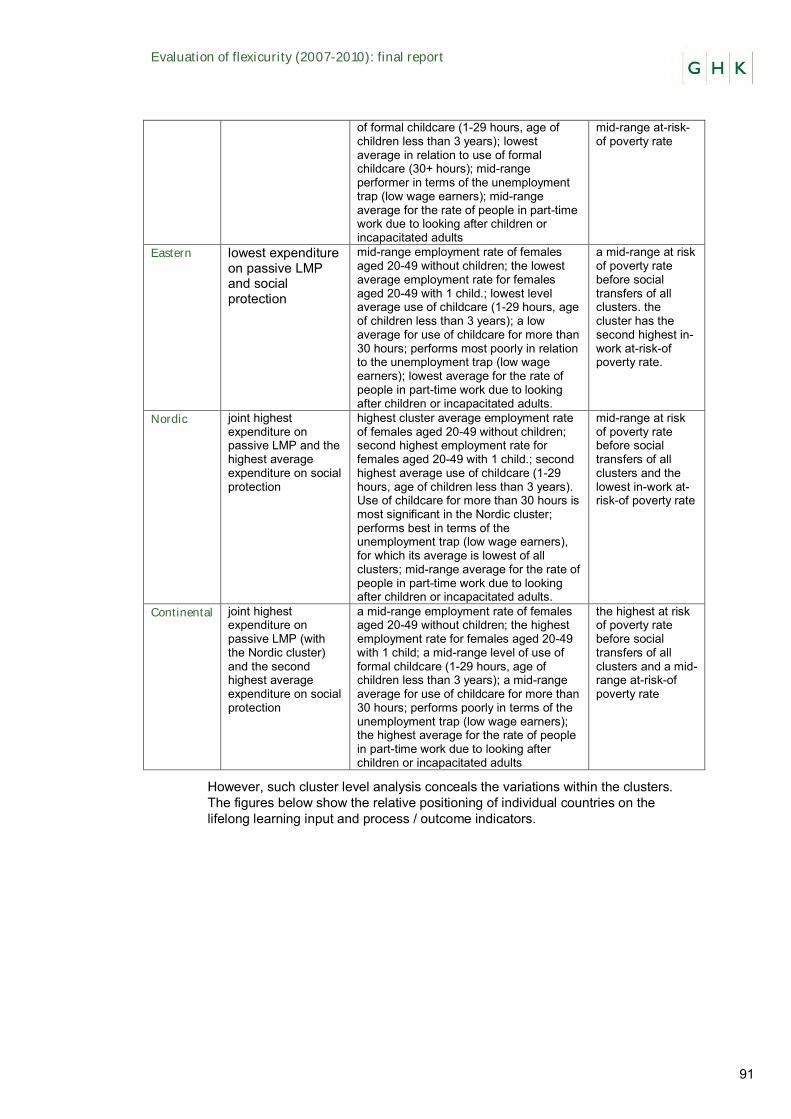
Evaluation of flexicurity (2007-2010): final report
91
of formal childcare (1-29 hours, age of children less than 3 years); lowest average in relation to use of formal childcare (30+ hours); mid-range performer in terms of the unemployment trap (low wage earners); mid-range average for the rate of people in part-time work due to looking after children or incapacitated adults
mid-range at-risk-of poverty rate
Eastern lowest expenditure on passive LMP and social protection
mid-range employment rate of females aged 20-49 without children; the lowest average employment rate for females aged 20-49 with 1 child.; lowest level average use of childcare (1-29 hours, age of children less than 3 years); a low average for use of childcare for more than 30 hours; performs most poorly in relation to the unemployment trap (low wage earners); lowest average for the rate of people in part-time work due to looking after children or incapacitated adults.
a mid-range at risk of poverty rate before social transfers of all clusters. the cluster has the second highest in-work at-risk-of poverty rate.
Nordic joint highest expenditure on passive LMP and the highest average expenditure on social protection
highest cluster average employment rate of females aged 20-49 without children; second highest employment rate for females aged 20-49 with 1 child.; second highest average use of childcare (1-29 hours, age of children less than 3 years). Use of childcare for more than 30 hours is most significant in the Nordic cluster; performs best in terms of the unemployment trap (low wage earners), for which its average is lowest of all clusters; mid-range average for the rate of people in part-time work due to looking after children or incapacitated adults.
mid-range at risk of poverty rate before social transfers of all clusters and the lowest in-work at-risk-of poverty rate
Continental joint highest expenditure on passive LMP (with the Nordic cluster) and the second highest average expenditure on social protection
a mid-range employment rate of females aged 20-49 without children; the highest employment rate for females aged 20-49 with 1 child; a mid-range level of use of formal childcare (1-29 hours, age of children less than 3 years); a mid-range average for use of childcare for more than 30 hours; performs poorly in terms of the unemployment trap (low wage earners); the highest average for the rate of people in part-time work due to looking after children or incapacitated adults
the highest at risk of poverty rate before social transfers of all clusters and a mid-range at-risk-of poverty rate
However, such cluster level analysis conceals the variations within the clusters. The figures below show the relative positioning of individual countries on the lifelong learning input and process / outcome indicators.
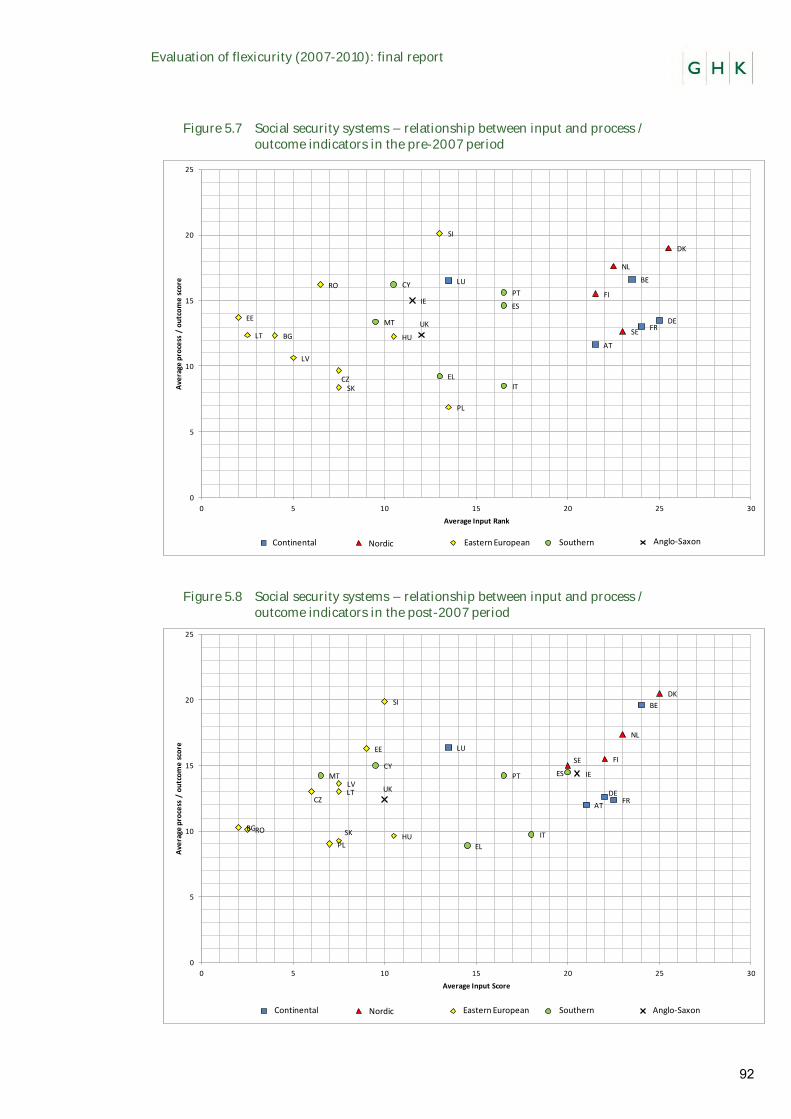
Evaluation of flexicurity (2007-2010): final report
92
Figure 5.7 Social security systems – relationship between input and process / outcome indicators in the pre-2007 period
Figure 5.8 Social security systems – relationship between input and process / outcome indicators in the post-2007 period
AT
BE
BG
CY
CZ
DK
EE
FI
FRDE
EL
HU
IE
IT
LV
LT
LU
MT
NL
PL
PTRO
SK
SI
ES
SEUK
0
5
10
15
20
25
0 5 10 15 20 25 30
Ave
rage
pro
cess
/ o
utc
om
e s
core
Average Input Rank
14 23 13 17 12Continental SouthernEastern EuropeanNordic Anglo-Saxon
AT
BE
BG
CY
CZ
DK
EE
FI
FRDE
ELHU
IE
IT
LVLT
LU
MT
NL
PL
PT
RO SK
SI
ES
SE
UK
0
5
10
15
20
25
0 5 10 15 20 25 30
Ave
rage
pro
cess
/ o
utc
om
e s
core
Average Input Score
14 23 10 20 10Continental SouthernEastern EuropeanNordic Anglo-Saxon
Evaluation of flexicurity (2007-2010): final report
93
5.6 Analysis of the relationship between all input and process / outcome indicators
The two figures below show an aggregate view of the relationship between input and process / outcome indicators across the four flexicurity components. In total, 34 indicators were considered across the four flexicurity components. Member States were ranked according to their performance on each indicator, the rankings averaged across the inputs and process / outcome indicators (for a fuller description of the approach see Annex 5). The reliability of this calculation needs to be treated with caution bearing in mind the methodological limitations of such an approach.
In the pre-2007 period, some commonalities can be detected in the Nordic, Continental, Southern (with Greece as an outlier) and the Anglo-Saxon clusters. Performance of the Member States in the Eastern European cluster is more dispersed, with Estonia, Slovenia and to some extent Poland acting as outliers.
The analysis of country positions in the pre-2007 period shows that:
▪ Relatively low scores on flexicurity input indicators are generally associated with lower scores on process / outcome indicators . Estonia is an outlier: input scores are low, but the process / outcome indicators are in the mid range.
▪ Mid range input indicator scores are associated with more dispersed process / outcome indicators. In some countries mid range inputs are associated with mid range process / outcome indicators (AT, SI, UK, IE, CY, LU) whereas in other countries mid range input scores are associated with lower level process / outcome scores (IT, PL, PT, HU, MT).
▪ Relatively high input indicator scores are associated with a range of process / outcome indicators. In some countries, high scorings on input indicators are associated with high scores on process / outcome indicators (DK, NL), whereas for others the process / outcome indicators are in the mid range (BE, DE, SE, FI). In one case high inputs are linked to low level process / outcome scores (FR).
In the post-2007 period, clustering is somewhat less obvious. The Northern and Continental clusters (France excepted) are largely homogenous. Countries in the Southern, Anglo-Saxon and Eastern European clusters are however significantly dispersed.
The analysis of country positions in the post-2007 period shows that:
▪ Relatively low scores on flexicurity input indicators are associated with dispersed scorings on process / outcome indicators. Low input scores are associated with: – Low scoring on process / outcome indicators in Slovakia and Romania, – Mid range scores on process / outcome indicators in Bulgaria, Malta and
the Czech Republic – High level scores on process / outcome indicators in Estonia.
▪ Mid range scores on flexicurity input indicators are also associated with dispersed scores on process / outcome indicators. Mid-range inputs scores are linked with: – Lower level process / outcome scorings in Italy, Greece and Portugal – Mid range process / outcome indicators in Cyprus, Luxembourg, Latvia and
Lithuania – Higher level scorings on process / outcome indicators (SI, UK).
▪ Relatively high scores on flexicurity input indicators are also associated with more dispersed process / outcome indicators, though the variation is less apparent than in the other clusters. High input scores are linked with: – Lower level process / outcome indicators in France
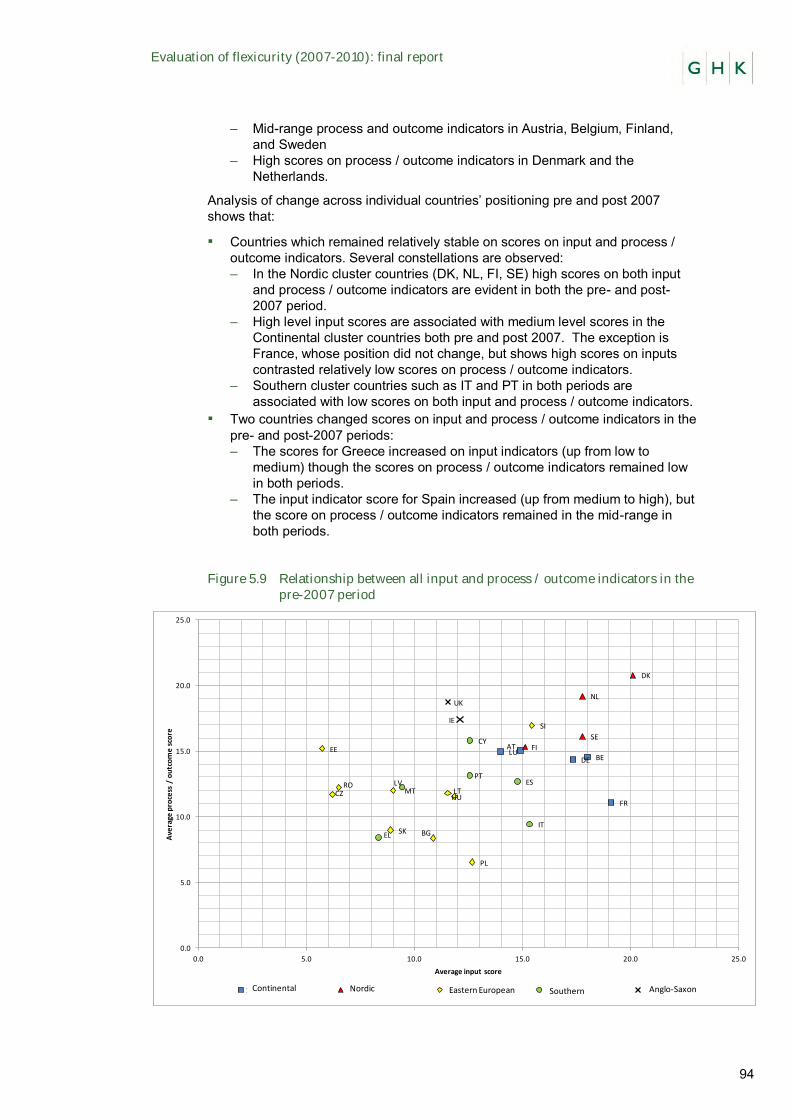
Evaluation of flexicurity (2007-2010): final report
94
– Mid-range process and outcome indicators in Austria, Belgium, Finland, and Sweden
– High scores on process / outcome indicators in Denmark and the Netherlands.
Analysis of change across individual countries’ positioning pre and post 2007 shows that:
▪ Countries which remained relatively stable on scores on input and process / outcome indicators. Several constellations are observed: – In the Nordic cluster countries (DK, NL, FI, SE) high scores on both input
and process / outcome indicators are evident in both the pre- and post-2007 period.
– High level input scores are associated with medium level scores in the Continental cluster countries both pre and post 2007. The exception is France, whose position did not change, but shows high scores on inputs contrasted relatively low scores on process / outcome indicators.
– Southern cluster countries such as IT and PT in both periods are associated with low scores on both input and process / outcome indicators.
▪ Two countries changed scores on input and process / outcome indicators in the pre- and post-2007 periods: – The scores for Greece increased on input indicators (up from low to
medium) though the scores on process / outcome indicators remained low in both periods.
– The input indicator score for Spain increased (up from medium to high), but the score on process / outcome indicators remained in the mid-range in both periods.
Figure 5.9 Relationship between all input and process / outcome indicators in the pre-2007 period
AT
BE
BG
CY
CZ
DK
EE FI
FR
DE
EL
HU
IE
IT
LVLT
LU
MT
NL
PL
PTRO
SK
SI
ES
SE
UK
0.0
5.0
10.0
15.0
20.0
25.0
0.0 5.0 10.0 15.0 20.0 25.0
Ave
rage
pro
cess
/ o
utc
om
e s
core
Average input score
14.0 17.8 15.4 14.8 11.6Anglo-SaxonContinental SouthernEastern EuropeanNordic
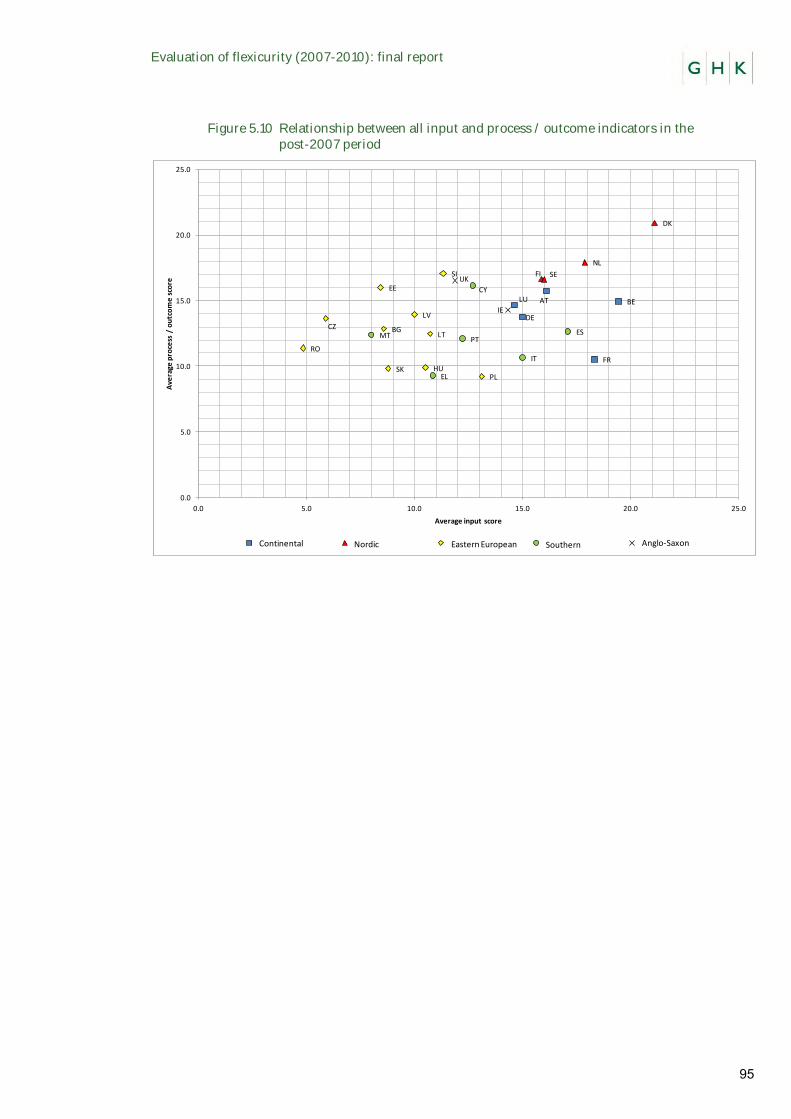
Evaluation of flexicurity (2007-2010): final report
95
Figure 5.10 Relationship between all input and process / outcome indicators in the post-2007 period
AT BE
BG
CY
CZ
DK
EE
FI
FR
DE
ELHU
IE
IT
LV
LT
LU
MT
NL
PL
PTRO
SK
SI
ES
SEUK
0.0
5.0
10.0
15.0
20.0
25.0
0.0 5.0 10.0 15.0 20.0 25.0
Ave
rage
pro
cess
/ o
utc
om
e s
core
Average input score
14.6 17.9 11.3 17.1 11.9Continental SouthernEastern EuropeanNordic Anglo-Saxon
Evaluation of flexicurity (2007-2010): final report
96
6 Impact of the implemented integrated flexicurity policies on labour market outcomes
6.1 Introduction
This section considers the impacts on labour market outcomes of implemented flexicurity related policies in the EU Member States in the evaluation reference period 2007-2010.
The analysis in this section builds on the assessment presented in section 4 of the impact of the EU’s focus on flexicurity on national policy making and the analysis of key macro-economic and labour market developments in section 5. The available evidence on the impacts of implemented flexicurity policies on labour market outcomes links to evaluation question 4 (see section 1 for further information) and is analysed by considering impacts on:
▪ Increasing employment security; ▪ facilitation of employment transitions; ▪ reducing labour market segmentation; and, ▪ reducing gender disparities.
The section then considers other macro level trends influencing the labour market developments and concludes by offering summary observations and findings. Key trend level is analysed in summary form, full underlying data analysis is provided in section 5 and annex 4.
6.2 To what extent have implemented flexicurity policies strengthened employment security?
One of the anticipated impacts of integrated flexicurity policies is their contribution to strengthening employment security, articulated the security of overall employment as opposed to security of individual jobs and is expressed through the flexible and secure contractual arrangements for all workers in employment and the successes of transitions throughout the working life. The broader definition of employment security includes trends in the overall employment and unemployment rates, demonstrating the success of labour markets in ensuring employment.
6.2.1 Key trends in employment security – pre and post 2007
Key trends in the key employment security indicators below show that the extent of employment (as opposed to individual job security) security can be broadly seen as a continuum of relatively high employment security in the Nordic and Continental clusters (high overall employment rate, high female employment rate, low unemployment total and youth unemployment rates, low long-term unemployment rate), middle-level employment security witnessed in Anglo-Saxon (a cluster with also least restrictive Employment Protection legislation) and Eastern European clusters and low level of employment security in the Southern cluster.
Overall, at the cluster level, 3 employment security indicators have improved in the post-2007 period (employment rate, female employment rate, long-term unemployment) and 2 indicators have deteriorated (overall unemployment rate and youth unemployment). This indicates a dispersed development in the employment security dimension – some aspects of it improving, some deteriorating.
The prominent trend in employment security dimension in the post-2007 period is the deteriorating position of the Anglo-Saxon cluster. It had, compared with other clusters, the largest increase in the youth unemployment rate and was the only cluster within which LTU increased when the two time periods are compared.
Evaluation of flexicurity (2007-2010): final report
97
The highest employment rates are observed in Nordic, Anglo-Saxon and Continental clusters, followed by Southern and Eastern European clusters – in both the pre- and post-2007 period. Notable is that across clusters – except for the two countries in the Anglo-Saxon cluster – the employment rate has slightly increased in the post 2007 period.
At the cluster level the female employment rate is significantly higher in the Nordic cluster than any other cluster; this is the case in both the pre-2007 and post-2007 periods. For all clusters the average female employment rate increased in the post-2007 period, compared to the pre-2007 period. In a small number of countries, however, the female employment rate marginally reduced when the two periods are compared (Sweden, UK and Romania).
The female employment rate is lowest in the Southern cluster in both pre- and post-2007 periods. The cluster contains the three Member States with the lowest female employment rates for both periods (Malta, Italy and Greece). Whilst the average rate increased when the pre-2007 and post-2007 periods are compared for this cluster, it remains significantly lower than the closest cluster (5.8 percentage points lower than the Eastern Europe cluster).
The highest unemployment rates are observed in Eastern European and Southern clusters, followed by the Anglo-Saxon, Nordic, and Continental clusters – in both the pre- and post-2007 period. Across both periods, it was lowest in the Nordic cluster and highest in the Eastern European cluster. However, during the post-2007 period, the unemployment rate has decreased significantly in the Eastern European cluster. Unemployment has fallen, albeit at a lower level in the Nordic and Continental clusters. Unemployment has increased in the Anglo-Saxon and Southern clusters. However, looking at individual countries in the Southern cluster, the situation in this cluster varies significantly a marked increase in unemployment in Spain and Portugal, to decreases witnessed in Greece, Italy and Malta.
The youth unemployment rate increased in all clusters when the average rates for the pre-2007 and post-2007 periods are compared, with the exception of the Eastern Europe cluster, within which the average rate reduced by 3.1 percentage points. In the post-2007 period youth unemployment was lowest in the Continental cluster, however the rate increased by 1.8 percentage points, compared to an increase of only 0.8 percentage points in the Nordic cluster. As a result the Nordic cluster average replaced the Continental cluster as the cluster with the lowest rate of youth unemployment in the post-2007 period.
Comparing the pre-2007 and post-2007 periods, the largest increase in the youth unemployment rate was in the Anglo Saxon cluster (+8.0 percentage points). For the post-2007 period, the youth unemployment rate is highest in the Southern cluster. In the pre-2007 period the Eastern Europe cluster had the largest average unemployment rate.
Issues of long-term unemployment are most significant in the Eastern Europe, Southern and Continental clusters, the average rate for each of these clusters is above the EU average. The Eastern Europe cluster, however, witnessed the greatest reduction when the pre-2007 and post-2007 periods are considered (-11.6 percentage points). The Anglo Saxon cluster was the only cluster within which LTU increased when the two time periods are compared. The Nordic LTU rate is lowest for both the pre-2007 and post-2007 periods.
At the cluster level, the highest values in the index for employment protection legislation for permanent employment are evident, in both periods, in the Southern cluster. Similar, mid-range values are observed in the Nordic, Continental and Eastern European clusters. EPL is least restrictive in the Anglo-Saxon clusters. At the cluster level, the highest scores in the index for employment protection legislation for temporary employment in both periods, are evident in
Evaluation of flexicurity (2007-2010): final report
98
the Southern cluster, followed by Continental, Nordic and Eastern European clusters. As with the standard employment index, EPL is least restrictive in the Anglo-Saxon cluster. There is very little change in both of these indicators at the individual country or cluster level across the pre and post 2007 period, but it needs to be borne in mind that the latest EPL index data is from 2008.
6.2.2 Impact of flexicurity policies on employment security
With regard to the promotion of employment security, there is limited evidence from national research suggesting that the implemented flexicurity measures during the evaluation reference period had a significant impact in this area. This is, at least in part, due to the negative effects of the economic crisis on net labour demand (due to reductions in public spending and job losses in both the public and private sectors). The impact of the crisis has seen a drastic reduction of available job opportunities, the scale of which negated the impact of policy measures taken to strengthen employment security.
The box below shows the variety of approaches adopted to employment security in the case study countries in the evaluation period.
In some case study countries, changes to labour law provisions on contractual arrangements occurred in the 2007-2010 period. In flexicurity terms, such changes can be classified as moves towards increased flexibility in contractual arrangements (Estonia, France, Romania, Spain) or changes where moves to increased flexibility in contractual arrangements are balanced more with concurrent increases in security elements (Austria, Poland).
In a number of case study countries, no key changes to contractual arrangements in labour law occurred in the 2007-2010 period (Denmark, Germany, Finland, Hungary, UK). Here, employment security was supported through a number of other types of measures.
As well as changes in labour law, other flexicurity policies supporting employment security have been introduced. Overall, in the context of changing labour markets, the measures which seemed to have more positive impact on containing unemployment and maintaining employment security were company ‘internal’ flexicurity measures (Austria, Germany, Finland), and, to some extent, increased focus on ALMPs (Denmark and to some extent Estonia and Poland) or upskilling and retraining of the workforce (UK).
Box 6.1 - Evidence of impacts of flexicurity policies on employment security from case studies
In Austria, in the area of labour law reform, the emphasis has been to combining greater flexibility with greater portability of benefits and protections and the extension of social security benefits to new groups of workers (including the self-employed). In most initiatives there have been specific attempts to balance improved flexibility with the introduction of elements of security.
The limited impact of the economic crisis (in comparison with many other EU countries) on employment security can be attributed in part to the role of company ‘internal’ flexicurity mechanisms such as short-time work arrangements (see Example 1 in Annex 1). Initial research indicates that such measures may have safeguarded between 7,000 and 9,000 jobs. Additionally, the increase in expenditure on AMLPs more widely had the effect of mitigating overall unemployment rates during the crisis. Indeed this contributed to the rather rapid employment rate recovery in 2010/2011.
In Denmark, no key changes to the labour law have been implemented in the evaluation period. The unemployment rate increased from 3.4% in 2008 to 7.6% in 2010, but remained low in comparison to the EU-27 average. This suggests that the Danish model of flexicurity, which is characterised by relatively low employment protection legislation, followed market conditions allowing unemployment to markedly rise (in the Danish context) during the economic crisis. The key policy answer was to continue applying the active labour market policies to the increasing pool of unemployed. This
Evaluation of flexicurity (2007-2010): final report
99
increased costs in this area and has led to a debate on the sustainability of existing provisions.
In Estonia, trade unions consider that the overall flexicurity approach and the change towards increased flexibility did not bring about any improvement in employment security (on the contrary), while consulted employers’ representative and government officials considered that measures taken in 2009 increased the resilience of companies to the negative impacts of the crisis. Active labour market measures (like the increasing of the share of wage subsidies) may have provided some alleviation to rising unemployment.
In Finland, the most important flexible arrangement was to use temporary lay-offs instead of redundancies. In tackling the 2008 crisis, temporary lay-offs rose from 10,000 to 80,000, and have subsequently fallen as the economy has improved. The government introduced measures to support temporary lay-offs in terms of changes in unemployment benefits. Change Security, the measure introduced before the crisis and the concept of flexicurity, was further enhanced (see Example 4 in Annex 1).
In France, the introduction and practical implementation of the ‘negotiated termination’ of contract (by mutual agreement between employers and employees) has introduced more flexibility in labour law (see Example 5 in Annex 1). However, this might be an incentive for employers to recruit employees under an open-ended contract instead of via fixed-term contracts. The number of negotiated termination of contracts has grown very quickly since the introduction of this new provision in 2008 (as part of the law on the modernisation of the labour market, see Example 5 in Annex 1). In 2010, negotiated termination’ accounted for approximately 10% of all permanent contracts ended in 2010 compared to 59% for resignations, 9.8% for dismissals for economic reasons and 21% for other dismissals). This represents approximately 20,000 cases per month, on average.
Measures taken to promote internal flexibility have had some impact although their take-up is modest compared to the situation in other countries. In 2009, the number of non-worked hours effectively subsidised corresponded to 50,000 full time equivalent jobs. The reduction in hours worked had not been the main solution chosen by French employers to reduce their production levels and adjust their cost during the downturn. Instead, the main variable of adjustment used by companies was the non-renewal of fixed-term contracts and a sharp decrease in the use of temporary agency work.
In Germany, the strategy of increasing internal flexibility has increased employment stability for core workers, while the reverse is true for the peripheral workers. Segmentation lines deepened. Major reforms were implemented prior to 2007 in the context of the Hartz Reforms (temporary work agencies, small part-time work (Mini-jobs) and the law on part-time and temporary work. No major reforms have been introduced since the Hartz Reforms.
In Hungary, crisis measures introduced in 2009 are likely to have prevented some job loss, but their efficiency was considered poor in comparison to measures adopted elsewhere in the EU. Short time work schemes (financed through the ESF central budget) aimed to increase or preserve labour demand had limited effectiveness. Hungary also spent up to 225 billion HUF (EUR 787 million) in 2010 on the reduction of labour costs (the employers’ social security contribution rate decreased by 5 percentage points and the lump sum health contribution was abolished). This was estimated to increase employment by 0.3–2.8 per cent in the short run and by 0.5–1 per cent in the long run.
In Poland, some changes to contractual arrangements occurred in the reference period. The “Anti-crisis package” (March 2009, see Example 9 in Annex 1) agreed by the social partners resulted in an “Anti-crisis law” (June 2009) introduced changes to labour law such as extending the working time settlement period up to 12 months, at most, different times of starting and finishing work on particular working days, limitations in the employment of one employee on temporary contract up to 2 years, maximum. The act also introduced internal flexibility measures aimed at helping enterprises survive the economic downturn without dismissing employees. This included supporting shortening working time through providing 70% of unemployment benefit, co-financing qualifications of employees by refunding up to 80% of the costs of training). Employer social security contributions have been lowered in order to improve their ability to create/retain jobs. However, the impact of the measures has been modest, with only 634 enterprises taking advantage of the possibilities within the law by mid-2010.
In Romania, the reform of Labour Code has increased flexibility for enterprises: easing the rules for layoffs and especially for mass lay-offs as well as widening the scope for fixed term contracts (while
Evaluation of flexicurity (2007-2010): final report
100
maintaining equivalence of rights between fixed term and permanent contract holders). Measures have been taken to make it easier to hire (legally) daily labourers (especially by removing social insurance contributions from employers), see Example 10 in Annex 1. However, the statistics suggest that there was more job mobility prior to these increased flexibility measures.
In Spain, measures to promote the conversion of temporary into open-ended contracts had a limited impact on increasing the levels of employment security. Measures such as temporary lay-offs and short-time working arrangements have not been used to a large extent during the crisis, as companies have adjusted their activity levels through external flexibility (non-renewal of temporary contracts and dismissals) resulting in high levels of unemployment.
A key element of UK policy in this respect has been to maintain high levels of contractual flexibility for employers to maintain labour market dynamism. No key changes to the labour law occurred in the evaluation period, but the new coalition government in January 2011 announced a proposal to increase the qualifying period for unfair dismissal claims from one to two years of employment. If implemented, this would be a move to towards further reductions of security.
Some measures which were designed to enhance employment security through up-skilling and providing companies and individuals with a better understanding of how training can improve productivity and profitability (see Example 6 in Annex 1 for further information). It is also worthy of note that a range of examples of ad hoc short-time working arrangements were established, mainly in larger companies, as a result of dialogue between employers and employee representatives, although there was no nation-wide scheme established to support transitions to short-time working.
6.3 Flexicurity measures and the facilitation of employment transitions
One of the anticipated impacts of integrated flexicurity policies is their contribution to facilitating employment transitions, articulated as both transitions from precarious to stable employment and overall labour market transitions. To some extent, the level of employment transitions is also captured in the discussion in the previous section on employment security dimension. Hence, in this section, the focus is on the transitions from precarious to more stable employment.
Employment related transitions are articulated as follows:
▪ From education to the labour market (evidenced through youth employment / unemployment rate)
▪ From unemployment to employment (evidenced through the extent of long-term unemployment indicator)
▪ From job to job (evidenced through the general unemployment rate insofar as successful job to job transitions should be reflected in the low unemployment rates)
▪ From one employment status to another (to permanent; to full-time employment).
6.3.1 Trends in employment transitions
It is difficult to compare key trends in the transitions from precarious to more stable employment in the pre and post 2007 period due to limited data availability in the pre-2007 period.
In the post-2007 period, highest levels of transitions to more stable employment are witnessed in the Eastern European cluster. On the other end of the scale, the lowest levels of transitions are in the Anglo-Saxon cluster, but here the extent of precarious employment is also one of the lowest. The other clusters – Continental, Southern and Nordic – occupy a somewhat middle ground in terms of the transitions to more stable employment.
Key trends in the transitions from precarious to more stable employment are:
Evaluation of flexicurity (2007-2010): final report
101
▪ Considering the post-2007 period, at the cluster level, transitions from temporary to permanent employment highest in the Eastern European cluster. This is followed by the Continental and Nordic clusters, which show similar levels of transitions. Transitions to permanent employment are lowest in the Anglo-Saxon and Southern clusters. This low level of transitions has different significance in the two clusters. Southern cluster has the highest incidence of temporary employment amongst the clusters, Anglo-Saxon the lowest.
▪ Considering the post-2007 period, at the cluster level, transitions from part-time to full-time employment are highest in the Eastern European cluster. This is a positive development, as this cluster (together with the Southern cluster) has the highest incidence of involuntary part-time employment. The middle range level of transitions is in the Southern and Nordic clusters, which show similar levels of transitions (around 23-25%). The lowest (and similar) levels of transitions are demonstrated in the Continental and Anglo-Saxon clusters (data in this cluster available only for the UK).
Key trends in the general employment transitions are as follows (see also previous section):
▪ The youth unemployment rate increased in all clusters when the average rates for the pre-2007 and post-2007 periods are compared, with the exception of the Eastern Europe cluster, within which the average rate reduced by 3.1 percentage points. In the post-2007 period youth unemployment was lowest in the Continental cluster, however the rate increased by 1.8 percentage points, compared to an increase of only 0.8 percentage points in the Nordic cluster. As a result the Nordic cluster average replaced the Continental cluster as the cluster with the lowest rate of youth unemployment in the post-2007 period. Comparing the pre-2007 and post-2007 periods, the largest increase in the youth unemployment rate was in the Anglo Saxon cluster (+8.0 percentage points). For the post-2007 period, the youth unemployment rate is highest in the Southern cluster. In the pre-2007 period the Eastern Europe cluster had the largest average unemployment rate.
▪ Issues of long-term unemployment are most significant in the Eastern Europe, Southern and Continental clusters, the average rate for each of these clusters is above the EU average. The Eastern Europe cluster, however, witnessed the greatest reduction when the pre-2007 and post-2007 periods are considered (-11.6 percentage points). The Anglo Saxon cluster was the only cluster within which LTU increased when the two time periods are compared. The Nordic LTU rate is lowest for both the pre-2007 and post-2007 periods.
▪ The highest unemployment rates are observed in Eastern European and Southern clusters, followed by the Anglo-Saxon, Nordic, and Continental clusters – in both the pre and post 2007 period. Across both periods, it was lowest in the Nordic cluster and highest in the Eastern European cluster. However, during the post 2007 period, the unemployment rate has decreased significantly in the Eastern European cluster. Unemployment has fallen, albeit at a lower level in the Nordic and Continental clusters. Unemployment has increased in the Anglo-Saxon and Southern clusters.
6.3.2 Impact of flexicurity policies on employment transitions
Employment transitions have become much more difficult in most of the countries considered, due to the deterioration of the economy and rise of unemployment after 2008.
The direct influence of flexicurity policies on the extent of employment transitions is difficult to assess.
The impact of introducing and /or strengthening more holistic and integrated policy approaches facilitating employment transitions has been noted in a number of case study countries (Austria, Finland).
Evaluation of flexicurity (2007-2010): final report
102
What is also observed is that in a number of countries the absence of integrated flexicurity approaches is considered to have contributed to low levels of transitions witnessed in the crisis (Estonia, Romania, Spain).
Box 6.2 - Evidence of impact of flexicurity policies on employment transitions in case studies
Denmark had less stringent EPL compared to the EU average, high expenditure and participation in LLL and ALMP measures – a combination which did not change during the evaluation reference period. The key change in the flexicurity model was the halving of the unemployment benefit duration from 4 to 2 years. The extent to which this combination facilitated employment transitions in the context of economic crisis is interpreted differently. On one hand, doubling of unemployment rate is seen as proof that the model was struggling to provide employment in the absence of strong macro-economic climate and low aggregate demand for labour. On the other hand, the decreasing long-term unemployment in the evaluation period in Denmark would indicate that transitions from unemployment to employment were still – albeit to a reduced extent - taking place even in the context of the economic crisis. Moreover, the model can be considered to be performing well in the sense of enabling voluntary job transitions – with the number of people changing jobs still significant in the times of the crisis42 (Eurostat data on transitions by type of contract is patchy for Denmark).
In Estonia, the impact of recent measures loosening EPL – a key change in the national flexicurity approach - on facilitating employment transitions has not been assessed yet (see also more information in Example 3 in Annex 1).
The case study research in Spain and Estonia suggests that stakeholders are of the view that the low level of employment transitions during the economic crisis may have been further exacerbated by underinvestment in ALMP. This would point to the absence of integrated flexicurity approaches hindering successful employment transitions in the countries.
In contrast, a number of strengthened / newly introduced more integrated flexicurity type measures have contributed to facilitate employment transitions in Austria in the evaluation period:
▪ From school to the labour market: the provision of a training guarantee and support for company and supra company apprenticeships has ensured that many young people, who might otherwise not have found placements could be trained and made a successful transition to the labour market.
▪ From unemployment to employment: the increase in expenditure of AMLPs will also have had the effect of reducing overall unemployment rates during the crisis.
▪ From job to job: Labour Foundations have had an important role to play in facilitating transitions. Analyses have shown that such measures have high success rates in re-integrating workers rapidly into the labour market.
▪ From an employment status to another: the newly introduced measures for wider social security coverage for self-employed and freelance workers aimed to ease transitions between different types of employment although no data are available yet to assess their impact.
In Germany, most reforms have taken place after 2007 in the flexicurity component of modern, adequate and sustainable social protection systems. This included pension reform “Pensions at the age of 67” (Rente mit 67), parental allowance, legal right to child-care for children aged between 1 and 3 years (not implemented yet); the lengthening of the entitlement period to the more generous unemployment benefit I in 2008 (from 18 to 24 months). In relation to flexible and reliable contractual arrangements, major reforms have been implemented prior to 2007 in the context of the Hartz Reforms (temporary work agencies, small part-time work (Mini-jobs), law on part-time and temporary work (Teilzeit- und Befristungsgesetz). No major reform was introduced since then. In relation to comprehensive lifelong learning strategies, further training programmes for the low-skilled and older workers have been implemented (although this was set up before 2007); and further developing and strengthening further training measures among ALMPs. ALMPs are an important pillar of the German
42 One interviewee quoted statistics that before the economic crisis around 1/3 of the labour force changed jobs every year. In the crisis years, this was around 20% of the labour force changing jobs every year.
Evaluation of flexicurity (2007-2010): final report
103
flexicurity approach. As noted above, further training measures were expanded. ALMP designed to encourage gradual part-time or phased retirement (Altersteilzeit) was removed at the end of 2009. ALMPs have been increasingly focused on older workers.
There are no evaluations examining this question in Hungary. Based on a superficial review of aggregate statistical data, the increase in the activity rate of older workers may have been partly induced by welfare cuts (rising levels of education being another cause), but possibly more by delaying exits rather than facilitating re-entry to the labour market. The latter is unlikely as the long-term unemployment rate rose to almost 50%.
In the UK, comparison of the data relating to temporary employment illustrates the fact that temporary employment is a far less significant feature of the UK labour market than the average for the EU. The proportion of those employed on temporary contracts in the UK in 2010 was less than half the EU average (13.9% in the EU compared to 6.6% in the UK). Indeed between 2001 and 2010 temporary employment has fallen in the UK compared to a rise of nearly 2% in the EU. However there was a slight increase (+0.7%) in the proportion of temporary workers in the UK from 2008 to 2010, compared to a reduction of -0.2% in the EU over the same period.
In Finland, the initiatives facilitating transitions have been:
- Strategy of life-long guidance has been adopted in 2010, and guidance competencies have been fostered in different institutions of education and in PES;
- Job-to-job in Change Security (see Example 4 in Annex 1);
- Possibility for voluntary studies while on unemployment benefits;
- Occupational convergence training.
In France, the crisis has had a very strong impact on the labour market with massive rises in the number of jobseekers and greater risks of long-term employment. Against this background, the creation of a new single body (Pole Emploi) in charge of unemployment benefits and placement services has met with operational difficulties and the impact of the greater focus on activation and individualisation cannot be measured. A key flexicurity measure was the introduction of strengthened support for workers made redundant in case of collective dismissals (CTP). According to available research, the CTP achieves better quantitative employment outcomes than the CRP (a similar scheme offering less intensive support): 55% of individuals who started to benefit from a CRP across France in the second half of 2006 were reintegrated into ‘sustainable employment’ (13 to 18 months after the end of support measures), this rate dropped to 45% for dismissed workers not eligible to strengthened support. In addition, the employment outcomes obtained by CTP are better than those achieved by ‘redeployment units’ (cellules de reclassement) that employers have to put in place as part of a plan to safeguard employment in the case of dismissals of more than 50 employees.
Approaches taken to flexicurity in Romania have not managed to facilitate transitions or make them more attractive. Labour market policies pursued before 2007 were not in any way responsible for the fact that job churning was made more dynamic than in the post 2007 period. It was the simple effect of the economic boom experienced for a brief period in the last twenty years by the Romanian economy, a highly volatile economy, which in those good times managed to attract some amount of investment, judged of course by its modest size.
6.4 The impact of flexicurity measures on labour market segmentation
One of the anticipated impacts of integrated flexicurity policies is their contribution to reducing labour market segmentation, articulated as the situation with significant inequalities between ‘insiders’ and ‘outsiders’ in the labour market in terms of job protection, social security coverage, and access to training. Gender-based segmentation is analysed in the subsequent section on gender disparities.
6.4.1 Trends in labour market segmentation
For both periods, at the cluster level, the highest proportions of temporary employment are evident in the Southern cluster, followed closely by the Nordic
Evaluation of flexicurity (2007-2010): final report
104
cluster. Similar, mid-range proportions are observed in the Continental and Eastern European clusters. The proportion of temporary employment is lowest in the Anglo-Saxon cluster.
There is some change in this indicator pre and post 2007, both at the level of clusters and individual countries. The proportion of temporary employment has increased post-2007, across all clusters except the Eastern European cluster. Significant decreases of temporary employment are observed in Spain and significant increases are observed in Poland, the Netherlands and Portugal (all from already high base figures).
Across both periods, at the cluster level, the highest proportions of involuntary part-time employment as a percentage of all part-time employment are evident in the Southern and Eastern European clusters. The other clusters exhibit similar proportions (around 17-18%) in the post-2007 period. Involuntary part-time employment has grown in the Continental, Southern and Anglo-Saxon clusters, though has fallen slightly in the Nordic cluster and more dramatically in the Eastern European cluster. Significant decreases of involuntary part-time employment are noted in Bulgaria, Lithuania, Latvia and Finland. Significant increases are observed in the Anglo-Saxon cluster (Ireland, UK), Germany, Southern cluster countries (Spain, Italy and Portugal) and in Hungary and Slovakia among the Eastern European countries.
6.4.2 Impact of flexicurity policies on labour market segmentation
The extent of labour market segmentation differs between the case study countries, reflecting the wider differences between the national labour markets in the EU.
In countries with a relatively small extent of labour market segmentation (Denmark, Finland, Romania, Estonia) relatively few measures have been adopted post 2007, and in general it was considered too early to see their impact reflected in the labour market segmentation indicators due to policy lag effect.
In countries with significant extent of labour market segmentation between insiders (workers on permanent contracts) and outsiders (workers on more precarious contracts) (Spain, Italy, Germany) flexicurity related measures have been adopted and /or intensified. The impacts have been varied. The intensified use of increasing internal flexibility through increased use of short-term work in Germany has increased the employment stability of core workers, while the reverse is true for the peripheral workers. In Spain, the reduction in the number of temporary workers is attributed more towards the economic downturn during which companies first made temporary workers redundant, rather than policy measures attempting to reduce labour market segmentation.
Finally, countries where labour market segmentation affects more specific socio-economic groups (migrants, women) (for example, Austria) have taken measures to address specific problems facing such groups. However, segmentation trends in such countries did not witness substantial improvements.
Overall, the most significant factor impacting on changes to the labour market segmentation trends during the period considered was the economic crisis, rather than the mix of flexicurity measures adopted.
Box 6.3 - Evidence of impact of flexicurity policies on labour market segmentation from case studies
In countries with no reversing or worsening trends in existing types of segmentation despite policies enacted / in place:
▪ In Germany, the strategy of increasing internal flexibility through increased use of short-term work
Evaluation of flexicurity (2007-2010): final report
105
has increased the employment stability of core workers (see Example 6 in Annex 1), while the reverse is true for the peripheral workers. Segmentation lines deepened. It is noticeable that since the labour market reforms of 2005, in-work at-risk of poverty has risen dramatically (from 4.8% to 7.2%). Past and recent pension reforms have already raised employment rates of older workers. The recently introduced pension reforms and reforms of labour market policies are quite likely to extend the average exit age.
▪ In Spain, there was a significant reduction in the number of temporary jobs during the crisis, however anecdotal evidence from the case study research suggests that the rate is likely to increase again when the economy economic growth resumes, as temporality remains a significant structural feature of the Spanish labour market. The impact of measures to promote conversion from temporary contract to permanent contracts (such as hiring incentives) has been limited, (the transition rate from temporary to permanent employment fell from 30.2% in 2006 to 17.9% in 2009). According to the information collected from Ministry representatives, an initial assessment conducted in October 2011 suggested that both costs and impacts of hiring incentives introduced by the 2010 labour market reform (see Example 5 in Annex 1; together with emergency measures of February 2011) were not substantial; such incentives have most frequently been used by smaller companies.
▪ In France, arguably, the introduction and practical implementation of the ‘negotiated termination’ has introduced more flexibility in labour law and might be an incentive for employers to recruit employees under an open-ended contract instead of a fixed-term contract. The number of negotiated termination of contracts has grown very quickly since the introduction of this new provision in 2008 (as part of the law on the modernisation of the labour market). In 2010, negotiated termination’ accounted for about 10% of all permanent contracts ended in 2010 compared to 59% for resignations, 9.8% for dismissals for economic reasons and 21% for other dismissals). This represents about 20.000 cases per month, in average.
▪ In the UK, existing challenges related to segmentation of some groups on the labour market have deteriorated since 2008; the specific measures implemented have been established to tackle these issues have not been able to mitigate the negative trends. There are significant segmentation challenges in the UK labour market, in particular with regards to youth unemployment, female workers and ethnic minorities. It would appear that since 2008 crisis these challenges have become more significant.
Countries with little / very specific segmentation affecting certain specific groups and no specific new post 2007 measures targeting segmentation:
▪ In Denmark, although labour market segmentation is not viewed as significant - prior to the crisis, the combination of the different components of flexicurity had worked to prevent the emergence of such segmentation - labour market segmentation indicators have worsened since 2008. This could indicate that the Danish model of flexicurity has not been able to prevent the negative impact of the economic crisis, although some small changes have been introduced in relation to the income security for unemployed (which has been reduced) and EPL (a minor element of severance pay for blue-collar workers was introduced in collective agreements in 2010).
▪ In Finland, there have not been major changes concerning labour market segmentation policies in the period under examination. The major segmentation issues of Finland are a) the gender segmentation of economies, where men dominate industries, and women services particularly public services in health and education, and b) the rise of the ‘youth issue’, where young people have difficulties in entering the labour market, and sustaining a job, and ending up in precarious situations in terms of work and income. The local government reform is a major reform addressing the public services, and the recent Youth Guarantee the question of NEETs. There is rising concern of a possibility of a segregation of the labour market in terms of permanent vs. temporary/short term labour market, but this is not a big issue, and contracts concerning temporary work have been improved, as have the safety-nets of self-employment. Incremental improvements, not directly linked to flexicurity as such, have been introduced in temporary contracts, SME and self-employment security, modernisation of PES services, introduction of a special Youth Guarantee for jobs or education, and others.
Evaluation of flexicurity (2007-2010): final report
106
▪ In Romania, there is no evidence of segmentation between permanent and temporary / part-time workers, at least to date with regard to salaries, to rights concerning lay-offs or access to training. There is nevertheless evidence of segmentation when it comes to the access to unemployment insurance. The fact the recent changes to the labour code have increased the scope for determined duration contracts which employers might be tempted to use so as to limit the less than useful hoarding of labour in times of market uncertainty might enhance this particular type of segmentation in the future and might even lead to an increase in cases where reaching the statutory retirement age might not entitle a worker to old age pension.
In other countries, the impact of some measures could be potentially positive but has not yet been assessed:
▪ In Estonia, the flows from atypical contracts to full time open-ended contracts have been quite high and the changes made with the reform (new Labour Contract Act, see Example 3 in Annex 1) should in theory foster them even further.
▪ In Hungary, the changes to the labour code (which reduced (already relatively lax) employment protection and curbed union rights) are too recent for their effects to be evaluated.
▪ In Austria, where labour market segmentation is not a prominent issue, it is too soon to assess the impact of measures relating to deregulation of EPL and to security for self-employed and freelance workers.
6.5 The impact of flexicurity measures on gender disparities
One of the anticipated impacts of integrated flexicurity policies is their contribution to reducing gender disparities, articulated as disparities in the employment situation between men and women.
6.5.1 Trends in gender disparities
In terms of gender disparities, some indicators are showing improvements in the post-2007 period (overall female employment rate, employment rate of women with 1 child), other indicators have shown little improvements (the use of formal childcare, working part-time due to childcare).
At the cluster level the female employment rate is significantly higher in the Nordic cluster than any other cluster; this is the case in both the pre-2007 and post-2007 periods. For all clusters the average female employment rate increased in the post-2007 period, compared to the pre-2007 period. In a small number of countries, however, the female employment rate marginally reduced when the two periods are compared (Sweden, UK and Romania).
The female employment rate is lowest in the Southern cluster in both pre and post 2007 periods. The cluster contains the three Member States with the lowest female employment rates for both periods (Malta, Italy and Greece). Whilst the average rate increased when the pre-2007 and post-2007 periods are compared for this cluster, it remains significantly lower than the closest cluster (5.8 percentage points lower than the Eastern Europe cluster).
Looking the employment rates of females (aged 20-49) with one child, these are highest in the Continental cluster, followed by Nordic and Anglo-Saxon clusters. The lowest rates are in the Eastern European and Southern clusters. Across all clusters, the rate has increased in the post-2007 period.
Considering where the reason for part-time employment is looking after children or incapacitated adults, the performance of clusters varies considerably. During the post-2007 period the cluster with the highest rate for this indicator was the Continental cluster (25.8%), whereas the lowest was the Eastern Europe cluster (7.3%). For all clusters the average rate for this indicator declined between
Evaluation of flexicurity (2007-2010): final report
107
the pre-2007 and post-2007 periods, with the exception of the Continental cluster (+7.0 percentage points). There was a decline in the EU average of -0.2 percentage points over the same period, but this disguises increases in the Nordic cluster and decreases in the remaining clusters.
Regarding the use of formal childcare (age of children less than 3 years) at the EU-27 level both full-time and part-time use indicators have remained stable at EU-27 level.
6.5.2 Impact of flexicurity policies on gender disparities
There is little evidence available on the impact of flexicurity measures on the reduction of gender disparities in the countries considered.
Gender inequalities remain a very important problem in terms of female labour market participation and employment rate (although the employment rate for males has been more negatively impacted during the economic crisis than has the employment rate for females in several countries), gender pay gap and reconciliation of work and family life.
In countries which have enacted measures aiming to address gender inequalities they are not necessarily linked with flexicurity approach, but are more part of the general gender equality strategy.
In countries with relatively small extent of gender disparities (Denmark, Estonia, Finland, Romania, UK, France) the following are observed:
▪ In Denmark, measures taken to improve equal opportunities and work-life balance, including relevant collective social partner agreements, have a long history and tradition and the extent to which they can be attributed to the influence of flexicurity debate in the country is probably limited.
▪ In Estonia, while some flexicurity related measures aimed to support reconciliation of work and family life (e.g. longer unemployment insurance qualification periods for people in parental leave), issues such as the gender pay gap have not received a prominent role in the flexicurity debate.
▪ In Finland, equal access to work is in quite good shape in Finland, with equal access and employment rates to full employment, backed up by advanced Nordic family policies, which have been further improved.Finland is in many ways a forerunner and a high performer in gender equality, especially in terms of women’s high (full-time) participation rate in working life, and in societal affairs in general. Also re-cently the perspective and special needs of men have gained more attention, partly also due to the debate around paternity leave. A comprehensive Gender Equality Report was given in October 2010 by the National Government for the first time in Finland October 2010, outlining equality affairs until 2020, and approved in Parliamentary debate. Conjointly, a broad working group submitted proposals for renewal of parental leaves by the end of 2010, to form the basis of policy measures in the present government term (after the general elections of March 2011). The proposals by the working group will in all probability extend the paternity leave and make it more flexible. So Finland is at the moment quite active concerning equality issues.
▪ In France, no significant new gender equality policies are observed in the period under consideration.
▪ In Romania, changes to parental leave system have been introduced whereby mothers can choose between staying one year at home with full compensation or staying two years but with reduced compensation. Recently it has become mandatory for the parent who did not apply for leave to take one month of the leave so as to encourage also fathers to take care of their children.
Evaluation of flexicurity (2007-2010): final report
108
Countries with significant gender disparities, and which enacted measures to reduce gender disparities have witnessed the following trends: ▪ In Austria, another form of segmentation – that between men and women in
the labour market is considered to remain an important challenge because despite changes in parental leave and child care allowance regulation, women continue to shoulder most of the childcare burden. As a result they are over-represented in part-time work and a significant gender pay gap remains. The reform of the parental leave and child care allowance regulations has failed to have any significant impact on gender disparities.
▪ In Germany two new policy measures have been introduced. The new parental allowance launched in 2007 has been a key element of the German family policy. Due to higher monthly payments in comparison to the former legislation it is easier for parents to spend the first year after birth at home to take care of the child. A positive momentum is the fact that parental allowance encourages father to reduce employment for child care. This also facilitates the re-entrance into the labour market for mothers. However, effects on employment of young mothers strongly depend on the provision of child care facilities rather than public transfers. Stronger employment effects can therefore be expected from the governmental plans to expand child care facilities until 2013 and ensure a legal right to child-care for children aged between 1 and 3 years (not implemented yet).
▪ In Hungary, in 2009, the Bajnai government passed a law that would have cut the duration of the flat rate parental leave (GYES) to 2 years as of 2012, and have also initiated minor improvements in the provision of day care services for children under 3. The Orbán government has revoked this law and reinstated GYES to last until the child turns 3. In other respects however, they have followed the same course: reducing administrative restrictions for nurseries/ kindergartens, cutting paid holiday for mothers returning from maternity leave (in order to reduce discrimination), and increasing the ceiling on parents’ fees for nurseries (as an incentive to increasing supply). In a somewhat controversial measure they also made kindergarten mandatory from the age of 3, so that disadvantaged children have better access to early childhood development.
6.6 The key macro-economic trends
6.6.1 Introduction
This section considers a range of macroeconomic indicators in order to better understand the conditions within which flexicurity input, process and outcomes took place, both prior to 2007 and during the period 2007 to 2010. It is important to understand the macroeconomic context alongside flexicurity indicators in order to achieve a full understanding of the climate within which outcomes were achieved. Due to the wide ranging influences on the Government policy of Member States it is important to examine a wide range of macroeconomic indicators to provide as full of an understanding of their relative strengths and weaknesses.
Macroeconomic analysis is also important in terms of identify and asses the significance of the relative long-term strengths and weaknesses of Member States. Examining macroeconomic trend alongside flexicurity input and outcome indicators is also important in order to understand whether approaches to flexicurity taken by Member States or macroeconomic trends are the most important factors in achieving flexicurity outcomes. Macroeconomic analysis is integrated with flexicurity policy approaches and inputs in Chapter 7 of this report.
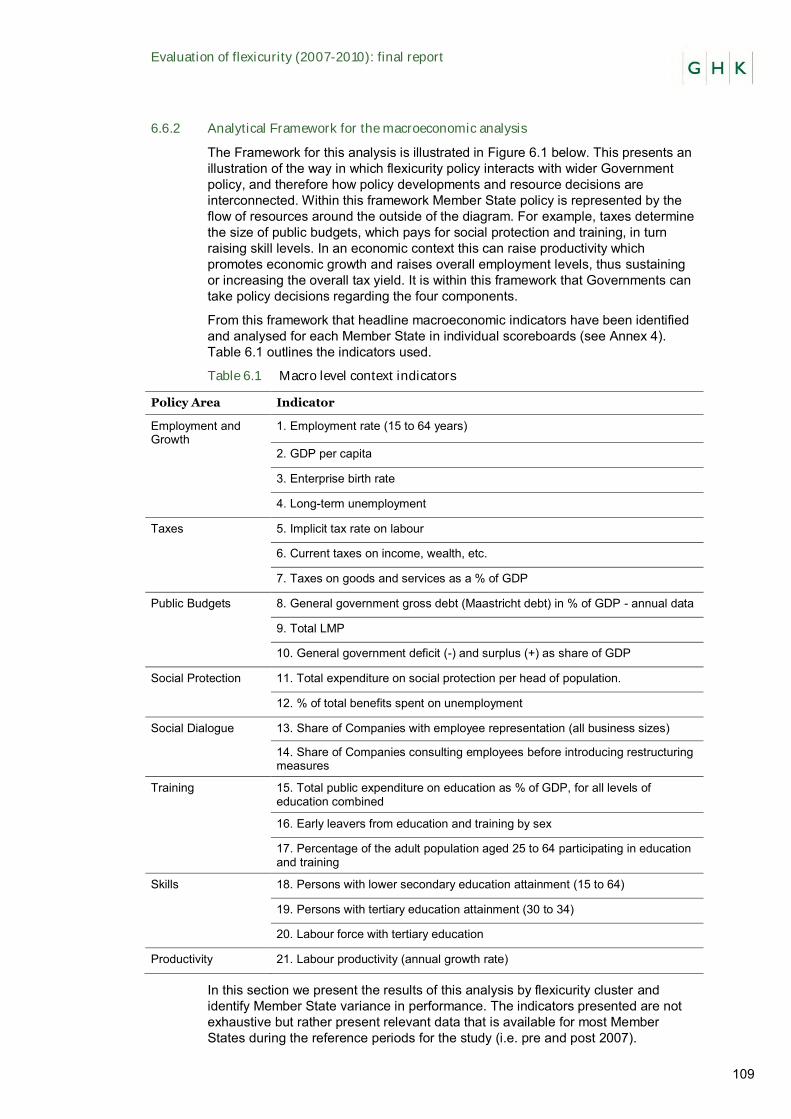
Evaluation of flexicurity (2007-2010): final report
109
6.6.2 Analytical Framework for the macroeconomic analysis
The Framework for this analysis is illustrated in Figure 6.1 below. This presents an illustration of the way in which flexicurity policy interacts with wider Government policy, and therefore how policy developments and resource decisions are interconnected. Within this framework Member State policy is represented by the flow of resources around the outside of the diagram. For example, taxes determine the size of public budgets, which pays for social protection and training, in turn raising skill levels. In an economic context this can raise productivity which promotes economic growth and raises overall employment levels, thus sustaining or increasing the overall tax yield. It is within this framework that Governments can take policy decisions regarding the four components.
From this framework that headline macroeconomic indicators have been identified and analysed for each Member State in individual scoreboards (see Annex 4). Table 6.1 outlines the indicators used.
Table 6.1 Macro level context indicators
Policy Area Indicator
Employment and Growth
1. Employment rate (15 to 64 years)
2. GDP per capita
3. Enterprise birth rate
4. Long-term unemployment
Taxes 5. Implicit tax rate on labour
6. Current taxes on income, wealth, etc.
7. Taxes on goods and services as a % of GDP
Public Budgets 8. General government gross debt (Maastricht debt) in % of GDP - annual data
9. Total LMP
10. General government deficit (-) and surplus (+) as share of GDP
Social Protection 11. Total expenditure on social protection per head of population.
12. % of total benefits spent on unemployment
Social Dialogue 13. Share of Companies with employee representation (all business sizes)
14. Share of Companies consulting employees before introducing restructuring measures
Training 15. Total public expenditure on education as % of GDP, for all levels of education combined
16. Early leavers from education and training by sex
17. Percentage of the adult population aged 25 to 64 participating in education and training
Skills 18. Persons with lower secondary education attainment (15 to 64)
19. Persons with tertiary education attainment (30 to 34)
20. Labour force with tertiary education
Productivity 21. Labour productivity (annual growth rate)
In this section we present the results of this analysis by flexicurity cluster and identify Member State variance in performance. The indicators presented are not exhaustive but rather present relevant data that is available for most Member States during the reference periods for the study (i.e. pre and post 2007).
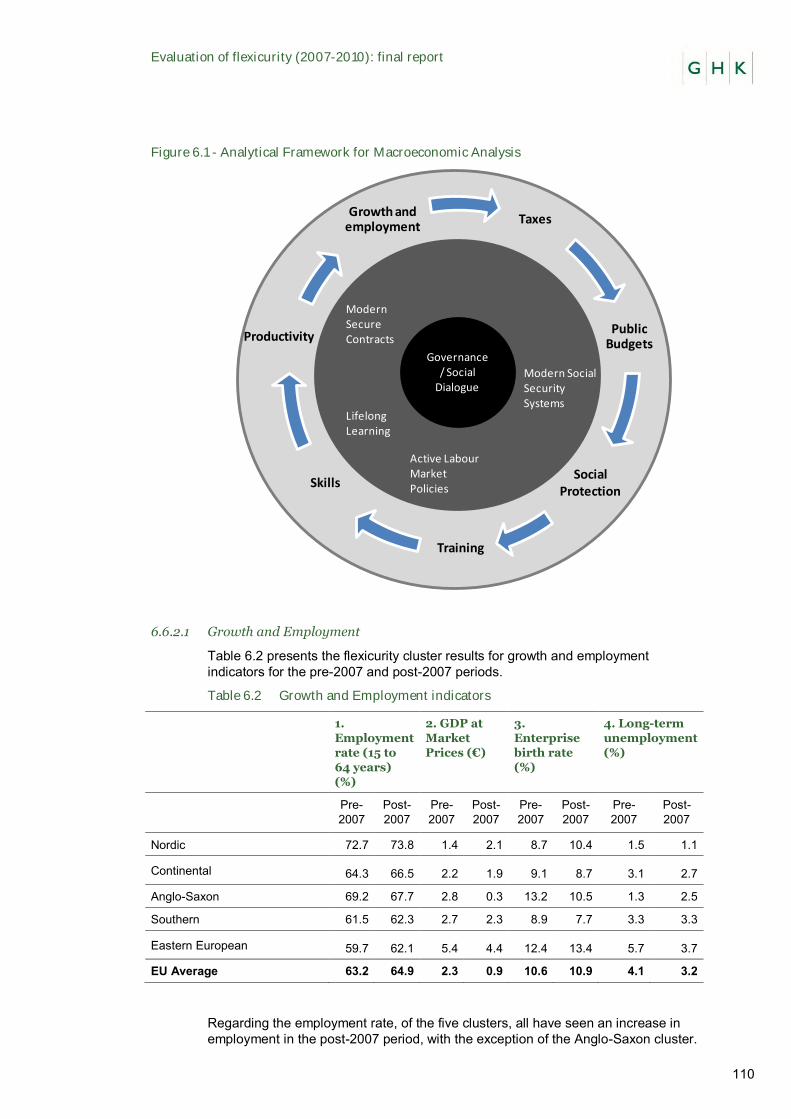
Evaluation of flexicurity (2007-2010): final report
110
Figure 6.1 - Analytical Framework for Macroeconomic Analysis
6.6.2.1 Growth and Employment
Table 6.2 presents the flexicurity cluster results for growth and employment indicators for the pre-2007 and post-2007 periods.
Table 6.2 Growth and Employment indicators
1.
Employment
rate (15 to
64 years)
(%)
2. GDP at
Market
Prices (€)
3.
Enterprise
birth rate
(%)
4. Long-term
unemployment
(%)
Pre-2007
Post-2007
Pre-2007
Post-2007
Pre-2007
Post-2007
Pre-2007
Post-2007
Nordic 72.7 73.8 1.4 2.1 8.7 10.4 1.5 1.1
Continental 64.3 66.5 2.2 1.9 9.1 8.7 3.1 2.7
Anglo-Saxon 69.2 67.7 2.8 0.3 13.2 10.5 1.3 2.5
Southern 61.5 62.3 2.7 2.3 8.9 7.7 3.3 3.3
Eastern European 59.7 62.1 5.4 4.4 12.4 13.4 5.7 3.7
EU Average 63.2 64.9 2.3 0.9 10.6 10.9 4.1 3.2
Regarding the employment rate, of the five clusters, all have seen an increase in employment in the post-2007 period, with the exception of the Anglo-Saxon cluster.
Taxes
Public Budgets
Social Protection
Training
Skills
Productivity
Growth and employment
Governance/ Social
Dialogue
Modern Secure Contracts
Lifelong Learning
Active Labour Market Policies
Modern Social Security Systems
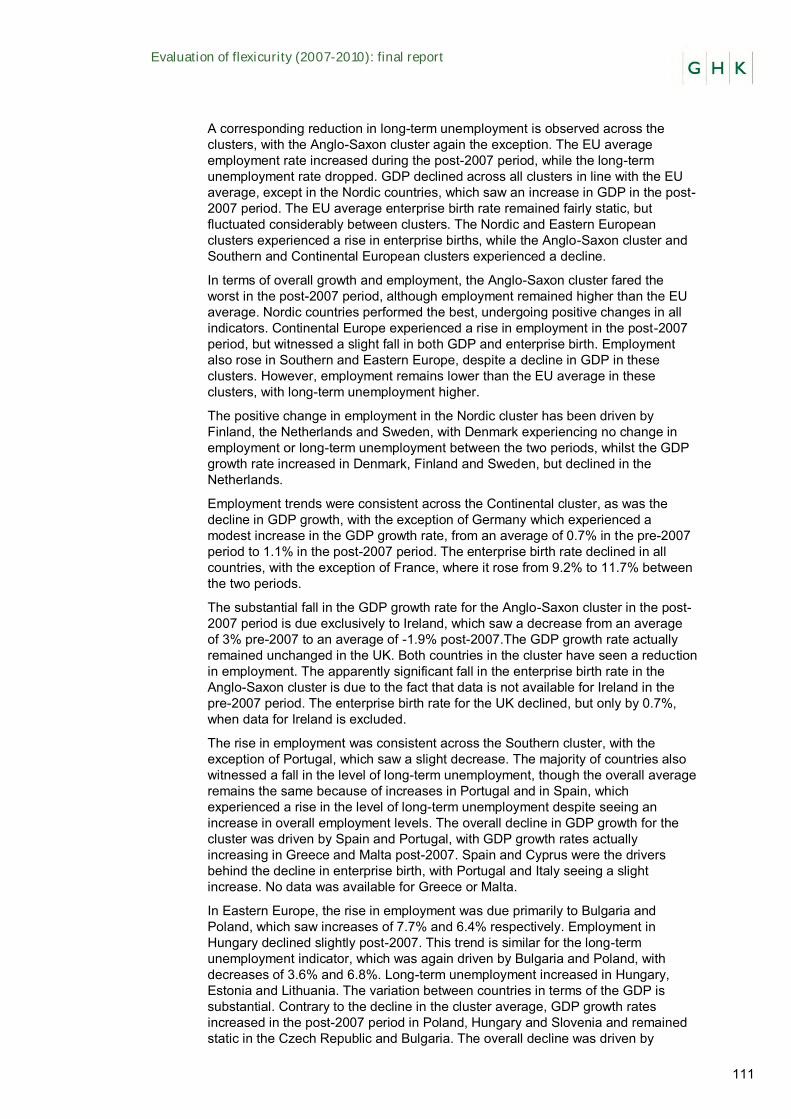
Evaluation of flexicurity (2007-2010): final report
111
A corresponding reduction in long-term unemployment is observed across the clusters, with the Anglo-Saxon cluster again the exception. The EU average employment rate increased during the post-2007 period, while the long-term unemployment rate dropped. GDP declined across all clusters in line with the EU average, except in the Nordic countries, which saw an increase in GDP in the post-2007 period. The EU average enterprise birth rate remained fairly static, but fluctuated considerably between clusters. The Nordic and Eastern European clusters experienced a rise in enterprise births, while the Anglo-Saxon cluster and Southern and Continental European clusters experienced a decline.
In terms of overall growth and employment, the Anglo-Saxon cluster fared the worst in the post-2007 period, although employment remained higher than the EU average. Nordic countries performed the best, undergoing positive changes in all indicators. Continental Europe experienced a rise in employment in the post-2007 period, but witnessed a slight fall in both GDP and enterprise birth. Employment also rose in Southern and Eastern Europe, despite a decline in GDP in these clusters. However, employment remains lower than the EU average in these clusters, with long-term unemployment higher.
The positive change in employment in the Nordic cluster has been driven by Finland, the Netherlands and Sweden, with Denmark experiencing no change in employment or long-term unemployment between the two periods, whilst the GDP growth rate increased in Denmark, Finland and Sweden, but declined in the Netherlands.
Employment trends were consistent across the Continental cluster, as was the decline in GDP growth, with the exception of Germany which experienced a modest increase in the GDP growth rate, from an average of 0.7% in the pre-2007 period to 1.1% in the post-2007 period. The enterprise birth rate declined in all countries, with the exception of France, where it rose from 9.2% to 11.7% between the two periods.
The substantial fall in the GDP growth rate for the Anglo-Saxon cluster in the post-2007 period is due exclusively to Ireland, which saw a decrease from an average of 3% pre-2007 to an average of -1.9% post-2007.The GDP growth rate actually remained unchanged in the UK. Both countries in the cluster have seen a reduction in employment. The apparently significant fall in the enterprise birth rate in the Anglo-Saxon cluster is due to the fact that data is not available for Ireland in the pre-2007 period. The enterprise birth rate for the UK declined, but only by 0.7%, when data for Ireland is excluded.
The rise in employment was consistent across the Southern cluster, with the exception of Portugal, which saw a slight decrease. The majority of countries also witnessed a fall in the level of long-term unemployment, though the overall average remains the same because of increases in Portugal and in Spain, which experienced a rise in the level of long-term unemployment despite seeing an increase in overall employment levels. The overall decline in GDP growth for the cluster was driven by Spain and Portugal, with GDP growth rates actually increasing in Greece and Malta post-2007. Spain and Cyprus were the drivers behind the decline in enterprise birth, with Portugal and Italy seeing a slight increase. No data was available for Greece or Malta.
In Eastern Europe, the rise in employment was due primarily to Bulgaria and Poland, which saw increases of 7.7% and 6.4% respectively. Employment in Hungary declined slightly post-2007. This trend is similar for the long-term unemployment indicator, which was again driven by Bulgaria and Poland, with decreases of 3.6% and 6.8%. Long-term unemployment increased in Hungary, Estonia and Lithuania. The variation between countries in terms of the GDP is substantial. Contrary to the decline in the cluster average, GDP growth rates increased in the post-2007 period in Poland, Hungary and Slovenia and remained static in the Czech Republic and Bulgaria. The overall decline was driven by
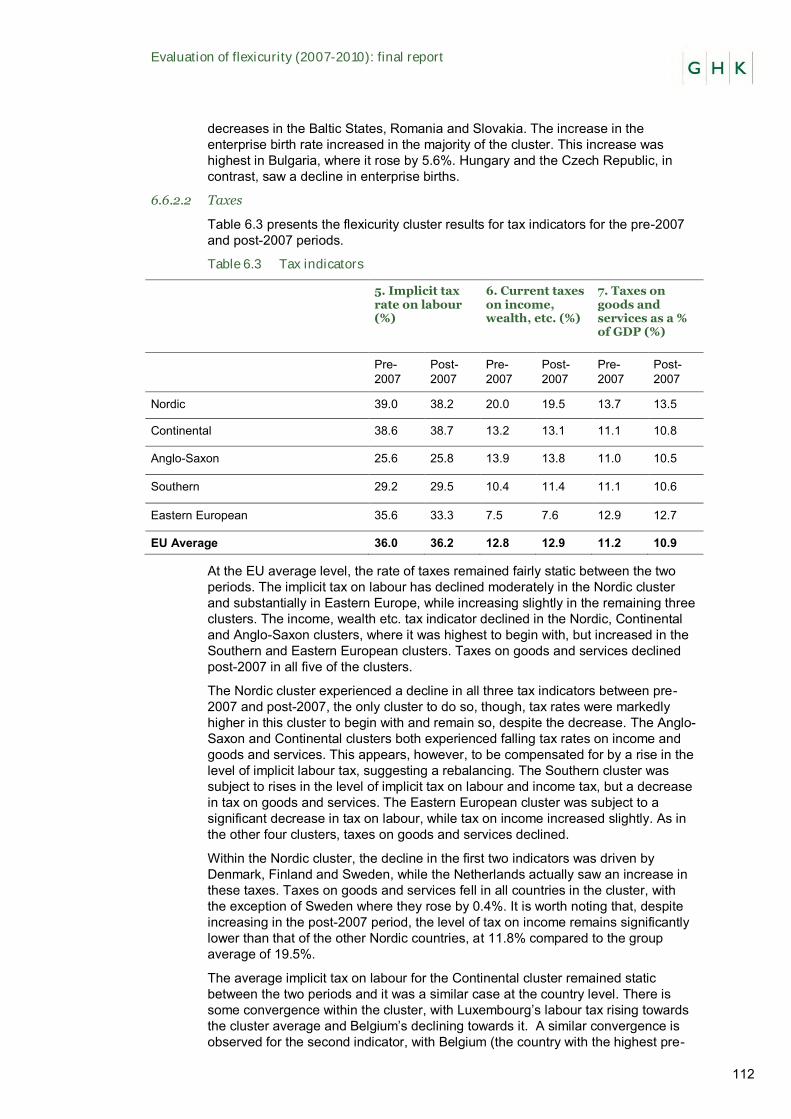
Evaluation of flexicurity (2007-2010): final report
112
decreases in the Baltic States, Romania and Slovakia. The increase in the enterprise birth rate increased in the majority of the cluster. This increase was highest in Bulgaria, where it rose by 5.6%. Hungary and the Czech Republic, in contrast, saw a decline in enterprise births.
6.6.2.2 Taxes
Table 6.3 presents the flexicurity cluster results for tax indicators for the pre-2007 and post-2007 periods.
Table 6.3 Tax indicators
5. Implicit tax rate on labour (%)
6. Current taxes on income, wealth, etc. (%)
7. Taxes on goods and services as a % of GDP (%)
Pre-2007
Post-2007
Pre-2007
Post-2007
Pre-2007
Post-2007
Nordic 39.0 38.2 20.0 19.5 13.7 13.5
Continental 38.6 38.7 13.2 13.1 11.1 10.8
Anglo-Saxon 25.6 25.8 13.9 13.8 11.0 10.5
Southern 29.2 29.5 10.4 11.4 11.1 10.6
Eastern European 35.6 33.3 7.5 7.6 12.9 12.7
EU Average 36.0 36.2 12.8 12.9 11.2 10.9
At the EU average level, the rate of taxes remained fairly static between the two periods. The implicit tax on labour has declined moderately in the Nordic cluster and substantially in Eastern Europe, while increasing slightly in the remaining three clusters. The income, wealth etc. tax indicator declined in the Nordic, Continental and Anglo-Saxon clusters, where it was highest to begin with, but increased in the Southern and Eastern European clusters. Taxes on goods and services declined post-2007 in all five of the clusters.
The Nordic cluster experienced a decline in all three tax indicators between pre-2007 and post-2007, the only cluster to do so, though, tax rates were markedly higher in this cluster to begin with and remain so, despite the decrease. The Anglo-Saxon and Continental clusters both experienced falling tax rates on income and goods and services. This appears, however, to be compensated for by a rise in the level of implicit labour tax, suggesting a rebalancing. The Southern cluster was subject to rises in the level of implicit tax on labour and income tax, but a decrease in tax on goods and services. The Eastern European cluster was subject to a significant decrease in tax on labour, while tax on income increased slightly. As in the other four clusters, taxes on goods and services declined.
Within the Nordic cluster, the decline in the first two indicators was driven by Denmark, Finland and Sweden, while the Netherlands actually saw an increase in these taxes. Taxes on goods and services fell in all countries in the cluster, with the exception of Sweden where they rose by 0.4%. It is worth noting that, despite increasing in the post-2007 period, the level of tax on income remains significantly lower than that of the other Nordic countries, at 11.8% compared to the group average of 19.5%.
The average implicit tax on labour for the Continental cluster remained static between the two periods and it was a similar case at the country level. There is some convergence within the cluster, with Luxembourg’s labour tax rising towards the cluster average and Belgium’s declining towards it. A similar convergence is observed for the second indicator, with Belgium (the country with the highest pre-
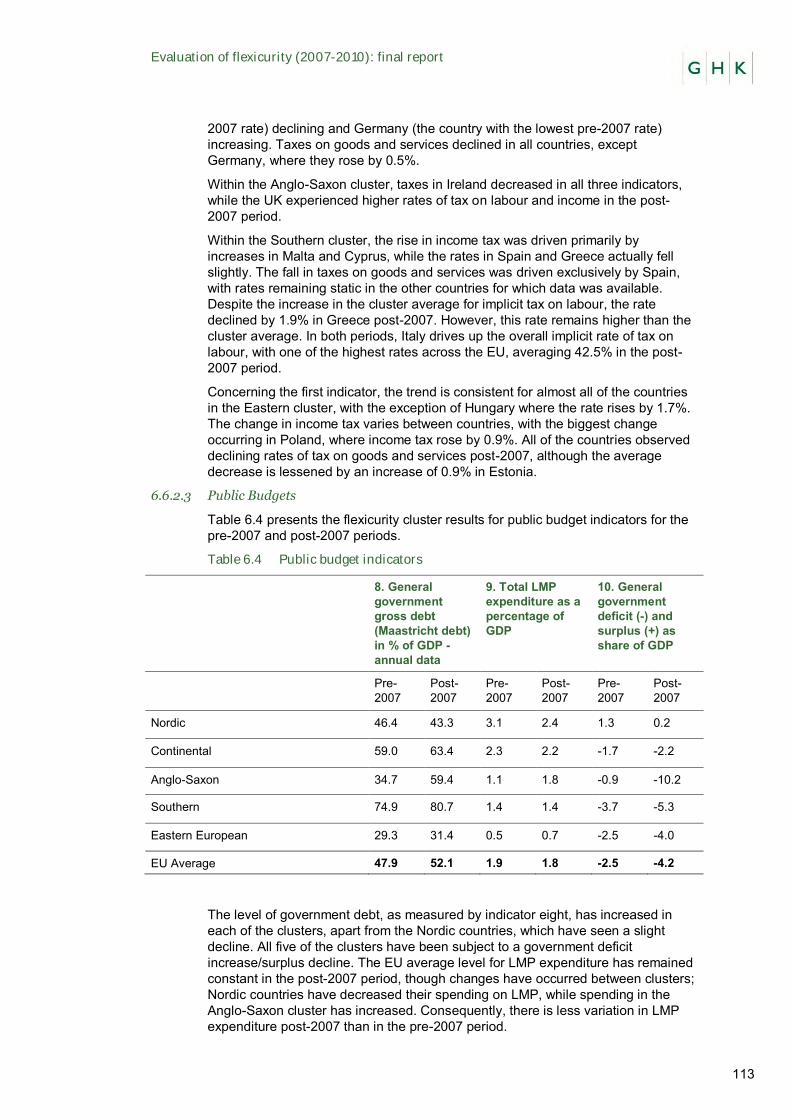
Evaluation of flexicurity (2007-2010): final report
113
2007 rate) declining and Germany (the country with the lowest pre-2007 rate) increasing. Taxes on goods and services declined in all countries, except Germany, where they rose by 0.5%.
Within the Anglo-Saxon cluster, taxes in Ireland decreased in all three indicators, while the UK experienced higher rates of tax on labour and income in the post-2007 period.
Within the Southern cluster, the rise in income tax was driven primarily by increases in Malta and Cyprus, while the rates in Spain and Greece actually fell slightly. The fall in taxes on goods and services was driven exclusively by Spain, with rates remaining static in the other countries for which data was available. Despite the increase in the cluster average for implicit tax on labour, the rate declined by 1.9% in Greece post-2007. However, this rate remains higher than the cluster average. In both periods, Italy drives up the overall implicit rate of tax on labour, with one of the highest rates across the EU, averaging 42.5% in the post-2007 period.
Concerning the first indicator, the trend is consistent for almost all of the countries in the Eastern cluster, with the exception of Hungary where the rate rises by 1.7%. The change in income tax varies between countries, with the biggest change occurring in Poland, where income tax rose by 0.9%. All of the countries observed declining rates of tax on goods and services post-2007, although the average decrease is lessened by an increase of 0.9% in Estonia.
6.6.2.3 Public Budgets
Table 6.4 presents the flexicurity cluster results for public budget indicators for the pre-2007 and post-2007 periods.
Table 6.4 Public budget indicators
8. General government gross debt (Maastricht debt) in % of GDP - annual data
9. Total LMP expenditure as a percentage of GDP
10. General government deficit (-) and surplus (+) as share of GDP
Pre-2007
Post-2007
Pre-2007
Post-2007
Pre-2007
Post-2007
Nordic 46.4 43.3 3.1 2.4 1.3 0.2
Continental 59.0 63.4 2.3 2.2 -1.7 -2.2
Anglo-Saxon 34.7 59.4 1.1 1.8 -0.9 -10.2
Southern 74.9 80.7 1.4 1.4 -3.7 -5.3
Eastern European 29.3 31.4 0.5 0.7 -2.5 -4.0
EU Average 47.9 52.1 1.9 1.8 -2.5 -4.2
The level of government debt, as measured by indicator eight, has increased in each of the clusters, apart from the Nordic countries, which have seen a slight decline. All five of the clusters have been subject to a government deficit increase/surplus decline. The EU average level for LMP expenditure has remained constant in the post-2007 period, though changes have occurred between clusters; Nordic countries have decreased their spending on LMP, while spending in the Anglo-Saxon cluster has increased. Consequently, there is less variation in LMP expenditure post-2007 than in the pre-2007 period.
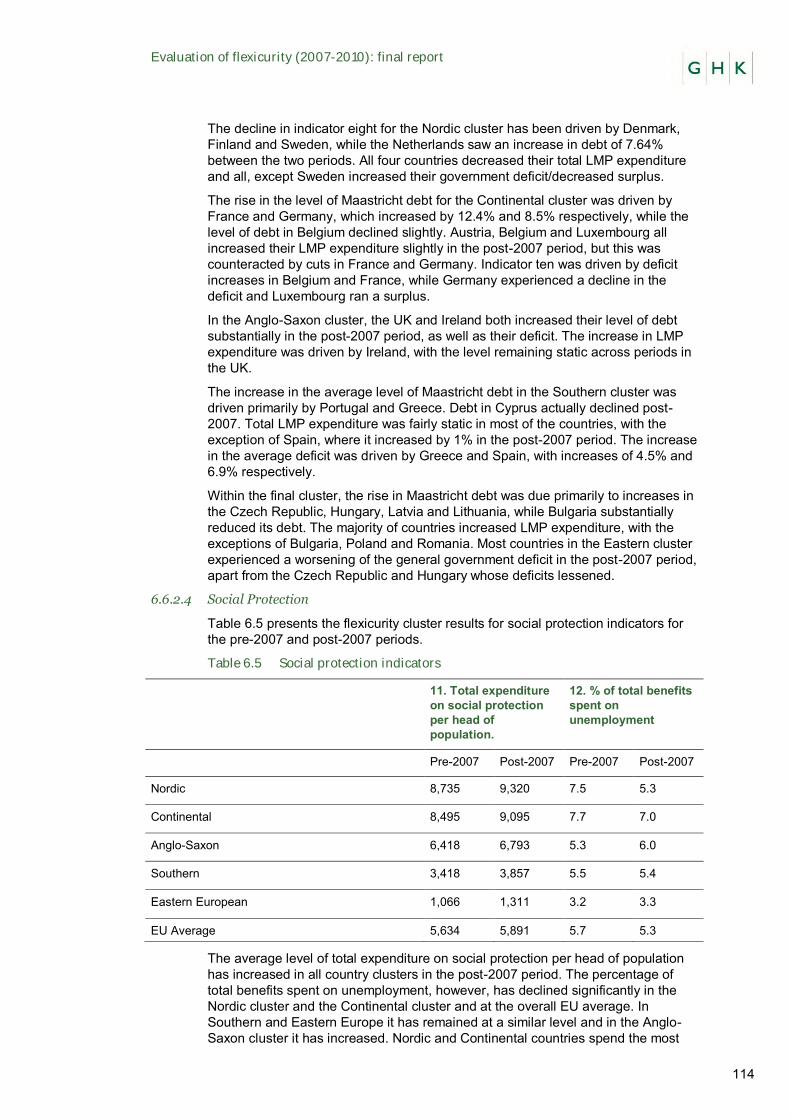
Evaluation of flexicurity (2007-2010): final report
114
The decline in indicator eight for the Nordic cluster has been driven by Denmark, Finland and Sweden, while the Netherlands saw an increase in debt of 7.64% between the two periods. All four countries decreased their total LMP expenditure and all, except Sweden increased their government deficit/decreased surplus.
The rise in the level of Maastricht debt for the Continental cluster was driven by France and Germany, which increased by 12.4% and 8.5% respectively, while the level of debt in Belgium declined slightly. Austria, Belgium and Luxembourg all increased their LMP expenditure slightly in the post-2007 period, but this was counteracted by cuts in France and Germany. Indicator ten was driven by deficit increases in Belgium and France, while Germany experienced a decline in the deficit and Luxembourg ran a surplus.
In the Anglo-Saxon cluster, the UK and Ireland both increased their level of debt substantially in the post-2007 period, as well as their deficit. The increase in LMP expenditure was driven by Ireland, with the level remaining static across periods in the UK.
The increase in the average level of Maastricht debt in the Southern cluster was driven primarily by Portugal and Greece. Debt in Cyprus actually declined post-2007. Total LMP expenditure was fairly static in most of the countries, with the exception of Spain, where it increased by 1% in the post-2007 period. The increase in the average deficit was driven by Greece and Spain, with increases of 4.5% and 6.9% respectively.
Within the final cluster, the rise in Maastricht debt was due primarily to increases in the Czech Republic, Hungary, Latvia and Lithuania, while Bulgaria substantially reduced its debt. The majority of countries increased LMP expenditure, with the exceptions of Bulgaria, Poland and Romania. Most countries in the Eastern cluster experienced a worsening of the general government deficit in the post-2007 period, apart from the Czech Republic and Hungary whose deficits lessened.
6.6.2.4 Social Protection
Table 6.5 presents the flexicurity cluster results for social protection indicators for the pre-2007 and post-2007 periods.
Table 6.5 Social protection indicators
11. Total expenditure on social protection per head of population.
12. % of total benefits spent on unemployment
Pre-2007 Post-2007 Pre-2007 Post-2007
Nordic 8,735 9,320 7.5 5.3
Continental 8,495 9,095 7.7 7.0
Anglo-Saxon 6,418 6,793 5.3 6.0
Southern 3,418 3,857 5.5 5.4
Eastern European 1,066 1,311 3.2 3.3
EU Average 5,634 5,891 5.7 5.3
The average level of total expenditure on social protection per head of population has increased in all country clusters in the post-2007 period. The percentage of total benefits spent on unemployment, however, has declined significantly in the Nordic cluster and the Continental cluster and at the overall EU average. In Southern and Eastern Europe it has remained at a similar level and in the Anglo-Saxon cluster it has increased. Nordic and Continental countries spend the most
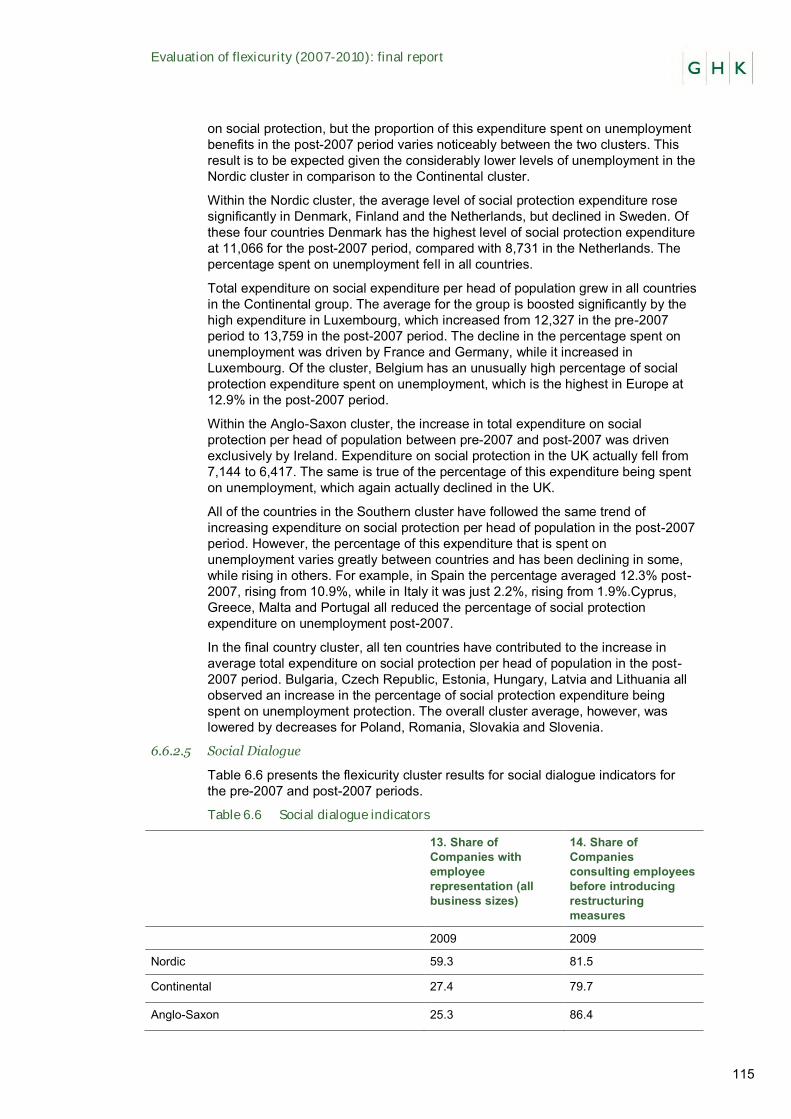
Evaluation of flexicurity (2007-2010): final report
115
on social protection, but the proportion of this expenditure spent on unemployment benefits in the post-2007 period varies noticeably between the two clusters. This result is to be expected given the considerably lower levels of unemployment in the Nordic cluster in comparison to the Continental cluster.
Within the Nordic cluster, the average level of social protection expenditure rose significantly in Denmark, Finland and the Netherlands, but declined in Sweden. Of these four countries Denmark has the highest level of social protection expenditure at 11,066 for the post-2007 period, compared with 8,731 in the Netherlands. The percentage spent on unemployment fell in all countries.
Total expenditure on social expenditure per head of population grew in all countries in the Continental group. The average for the group is boosted significantly by the high expenditure in Luxembourg, which increased from 12,327 in the pre-2007 period to 13,759 in the post-2007 period. The decline in the percentage spent on unemployment was driven by France and Germany, while it increased in Luxembourg. Of the cluster, Belgium has an unusually high percentage of social protection expenditure spent on unemployment, which is the highest in Europe at 12.9% in the post-2007 period.
Within the Anglo-Saxon cluster, the increase in total expenditure on social protection per head of population between pre-2007 and post-2007 was driven exclusively by Ireland. Expenditure on social protection in the UK actually fell from 7,144 to 6,417. The same is true of the percentage of this expenditure being spent on unemployment, which again actually declined in the UK.
All of the countries in the Southern cluster have followed the same trend of increasing expenditure on social protection per head of population in the post-2007 period. However, the percentage of this expenditure that is spent on unemployment varies greatly between countries and has been declining in some, while rising in others. For example, in Spain the percentage averaged 12.3% post-2007, rising from 10.9%, while in Italy it was just 2.2%, rising from 1.9%.Cyprus, Greece, Malta and Portugal all reduced the percentage of social protection expenditure on unemployment post-2007.
In the final country cluster, all ten countries have contributed to the increase in average total expenditure on social protection per head of population in the post-2007 period. Bulgaria, Czech Republic, Estonia, Hungary, Latvia and Lithuania all observed an increase in the percentage of social protection expenditure being spent on unemployment protection. The overall cluster average, however, was lowered by decreases for Poland, Romania, Slovakia and Slovenia.
6.6.2.5 Social Dialogue
Table 6.6 presents the flexicurity cluster results for social dialogue indicators for the pre-2007 and post-2007 periods.
Table 6.6 Social dialogue indicators
13. Share of Companies with employee representation (all business sizes)
14. Share of Companies consulting employees before introducing restructuring measures
2009 2009
Nordic 59.3 81.5
Continental 27.4 79.7
Anglo-Saxon 25.3 86.4
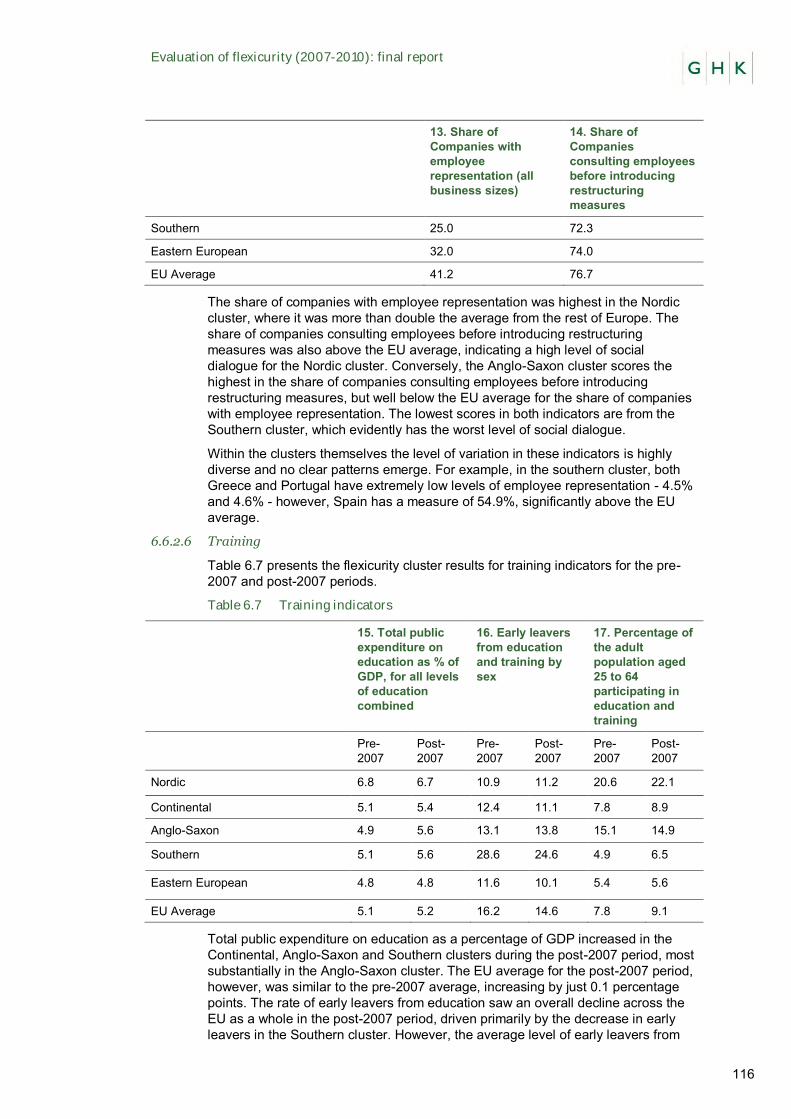
Evaluation of flexicurity (2007-2010): final report
116
13. Share of Companies with employee representation (all business sizes)
14. Share of Companies consulting employees before introducing restructuring measures
Southern 25.0 72.3
Eastern European 32.0 74.0
EU Average 41.2 76.7
The share of companies with employee representation was highest in the Nordic cluster, where it was more than double the average from the rest of Europe. The share of companies consulting employees before introducing restructuring measures was also above the EU average, indicating a high level of social dialogue for the Nordic cluster. Conversely, the Anglo-Saxon cluster scores the highest in the share of companies consulting employees before introducing restructuring measures, but well below the EU average for the share of companies with employee representation. The lowest scores in both indicators are from the Southern cluster, which evidently has the worst level of social dialogue.
Within the clusters themselves the level of variation in these indicators is highly diverse and no clear patterns emerge. For example, in the southern cluster, both Greece and Portugal have extremely low levels of employee representation - 4.5% and 4.6% - however, Spain has a measure of 54.9%, significantly above the EU average.
6.6.2.6 Training
Table 6.7 presents the flexicurity cluster results for training indicators for the pre-2007 and post-2007 periods.
Table 6.7 Training indicators
15. Total public expenditure on education as % of GDP, for all levels of education combined
16. Early leavers from education and training by sex
17. Percentage of the adult population aged 25 to 64 participating in education and training
Pre-2007
Post-2007
Pre-2007
Post-2007
Pre-2007
Post-2007
Nordic 6.8 6.7 10.9 11.2 20.6 22.1
Continental 5.1 5.4 12.4 11.1 7.8 8.9
Anglo-Saxon 4.9 5.6 13.1 13.8 15.1 14.9
Southern 5.1 5.6 28.6 24.6 4.9 6.5
Eastern European 4.8 4.8 11.6 10.1 5.4 5.6
EU Average 5.1 5.2 16.2 14.6 7.8 9.1
Total public expenditure on education as a percentage of GDP increased in the Continental, Anglo-Saxon and Southern clusters during the post-2007 period, most substantially in the Anglo-Saxon cluster. The EU average for the post-2007 period, however, was similar to the pre-2007 average, increasing by just 0.1 percentage points. The rate of early leavers from education saw an overall decline across the EU as a whole in the post-2007 period, driven primarily by the decrease in early leavers in the Southern cluster. However, the average level of early leavers from
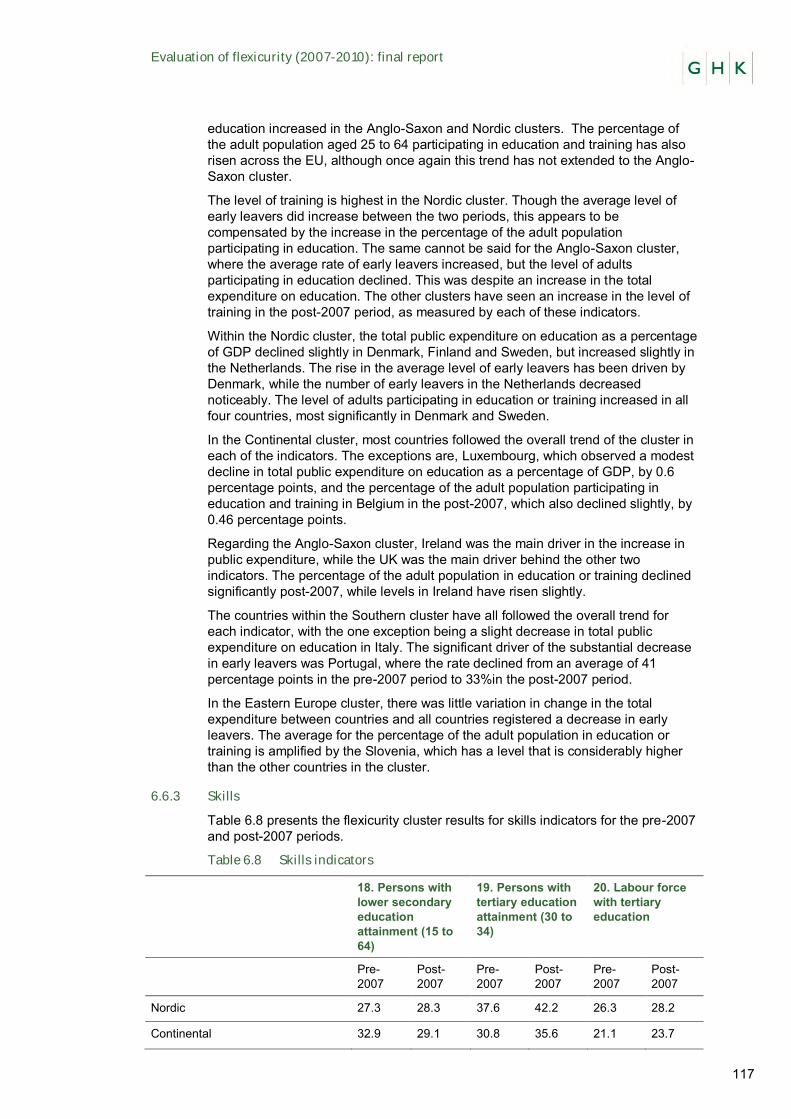
Evaluation of flexicurity (2007-2010): final report
117
education increased in the Anglo-Saxon and Nordic clusters. The percentage of the adult population aged 25 to 64 participating in education and training has also risen across the EU, although once again this trend has not extended to the Anglo-Saxon cluster.
The level of training is highest in the Nordic cluster. Though the average level of early leavers did increase between the two periods, this appears to be compensated by the increase in the percentage of the adult population participating in education. The same cannot be said for the Anglo-Saxon cluster, where the average rate of early leavers increased, but the level of adults participating in education declined. This was despite an increase in the total expenditure on education. The other clusters have seen an increase in the level of training in the post-2007 period, as measured by each of these indicators.
Within the Nordic cluster, the total public expenditure on education as a percentage of GDP declined slightly in Denmark, Finland and Sweden, but increased slightly in the Netherlands. The rise in the average level of early leavers has been driven by Denmark, while the number of early leavers in the Netherlands decreased noticeably. The level of adults participating in education or training increased in all four countries, most significantly in Denmark and Sweden.
In the Continental cluster, most countries followed the overall trend of the cluster in each of the indicators. The exceptions are, Luxembourg, which observed a modest decline in total public expenditure on education as a percentage of GDP, by 0.6 percentage points, and the percentage of the adult population participating in education and training in Belgium in the post-2007, which also declined slightly, by 0.46 percentage points.
Regarding the Anglo-Saxon cluster, Ireland was the main driver in the increase in public expenditure, while the UK was the main driver behind the other two indicators. The percentage of the adult population in education or training declined significantly post-2007, while levels in Ireland have risen slightly.
The countries within the Southern cluster have all followed the overall trend for each indicator, with the one exception being a slight decrease in total public expenditure on education in Italy. The significant driver of the substantial decrease in early leavers was Portugal, where the rate declined from an average of 41 percentage points in the pre-2007 period to 33%in the post-2007 period.
In the Eastern Europe cluster, there was little variation in change in the total expenditure between countries and all countries registered a decrease in early leavers. The average for the percentage of the adult population in education or training is amplified by the Slovenia, which has a level that is considerably higher than the other countries in the cluster.
6.6.3 Skills
Table 6.8 presents the flexicurity cluster results for skills indicators for the pre-2007 and post-2007 periods.
Table 6.8 Skills indicators
18. Persons with lower secondary education attainment (15 to 64)
19. Persons with tertiary education attainment (30 to 34)
20. Labour force with tertiary education
Pre-2007
Post-2007
Pre-2007
Post-2007
Pre-2007
Post-2007
Nordic 27.3 28.3 37.6 42.2 26.3 28.2
Continental 32.9 29.1 30.8 35.6 21.1 23.7
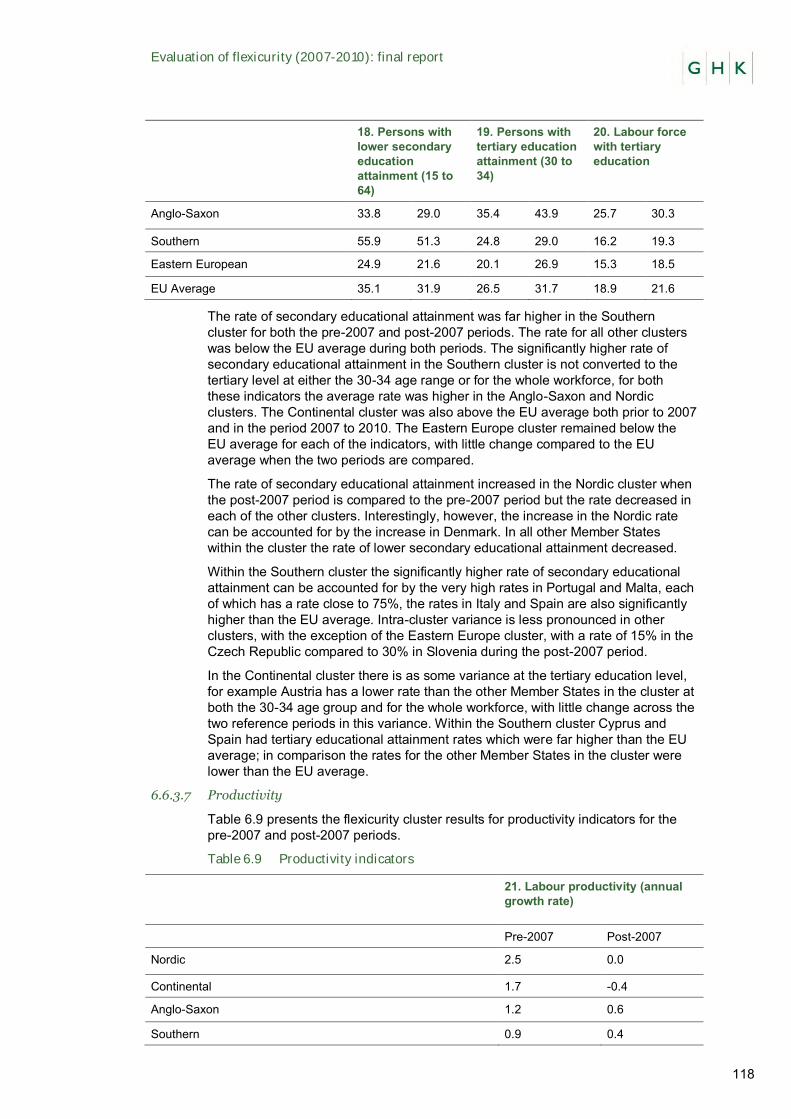
Evaluation of flexicurity (2007-2010): final report
118
18. Persons with lower secondary education attainment (15 to 64)
19. Persons with tertiary education attainment (30 to 34)
20. Labour force with tertiary education
Anglo-Saxon 33.8 29.0 35.4 43.9 25.7 30.3
Southern 55.9 51.3 24.8 29.0 16.2 19.3
Eastern European 24.9 21.6 20.1 26.9 15.3 18.5
EU Average 35.1 31.9 26.5 31.7 18.9 21.6
The rate of secondary educational attainment was far higher in the Southern cluster for both the pre-2007 and post-2007 periods. The rate for all other clusters was below the EU average during both periods. The significantly higher rate of secondary educational attainment in the Southern cluster is not converted to the tertiary level at either the 30-34 age range or for the whole workforce, for both these indicators the average rate was higher in the Anglo-Saxon and Nordic clusters. The Continental cluster was also above the EU average both prior to 2007 and in the period 2007 to 2010. The Eastern Europe cluster remained below the EU average for each of the indicators, with little change compared to the EU average when the two periods are compared.
The rate of secondary educational attainment increased in the Nordic cluster when the post-2007 period is compared to the pre-2007 period but the rate decreased in each of the other clusters. Interestingly, however, the increase in the Nordic rate can be accounted for by the increase in Denmark. In all other Member States within the cluster the rate of lower secondary educational attainment decreased.
Within the Southern cluster the significantly higher rate of secondary educational attainment can be accounted for by the very high rates in Portugal and Malta, each of which has a rate close to 75%, the rates in Italy and Spain are also significantly higher than the EU average. Intra-cluster variance is less pronounced in other clusters, with the exception of the Eastern Europe cluster, with a rate of 15% in the Czech Republic compared to 30% in Slovenia during the post-2007 period.
In the Continental cluster there is as some variance at the tertiary education level, for example Austria has a lower rate than the other Member States in the cluster at both the 30-34 age group and for the whole workforce, with little change across the two reference periods in this variance. Within the Southern cluster Cyprus and Spain had tertiary educational attainment rates which were far higher than the EU average; in comparison the rates for the other Member States in the cluster were lower than the EU average.
6.6.3.7 Productivity
Table 6.9 presents the flexicurity cluster results for productivity indicators for the pre-2007 and post-2007 periods.
Table 6.9 Productivity indicators
21. Labour productivity (annual growth rate)
Pre-2007 Post-2007
Nordic 2.5 0.0
Continental 1.7 -0.4
Anglo-Saxon 1.2 0.6
Southern 0.9 0.4
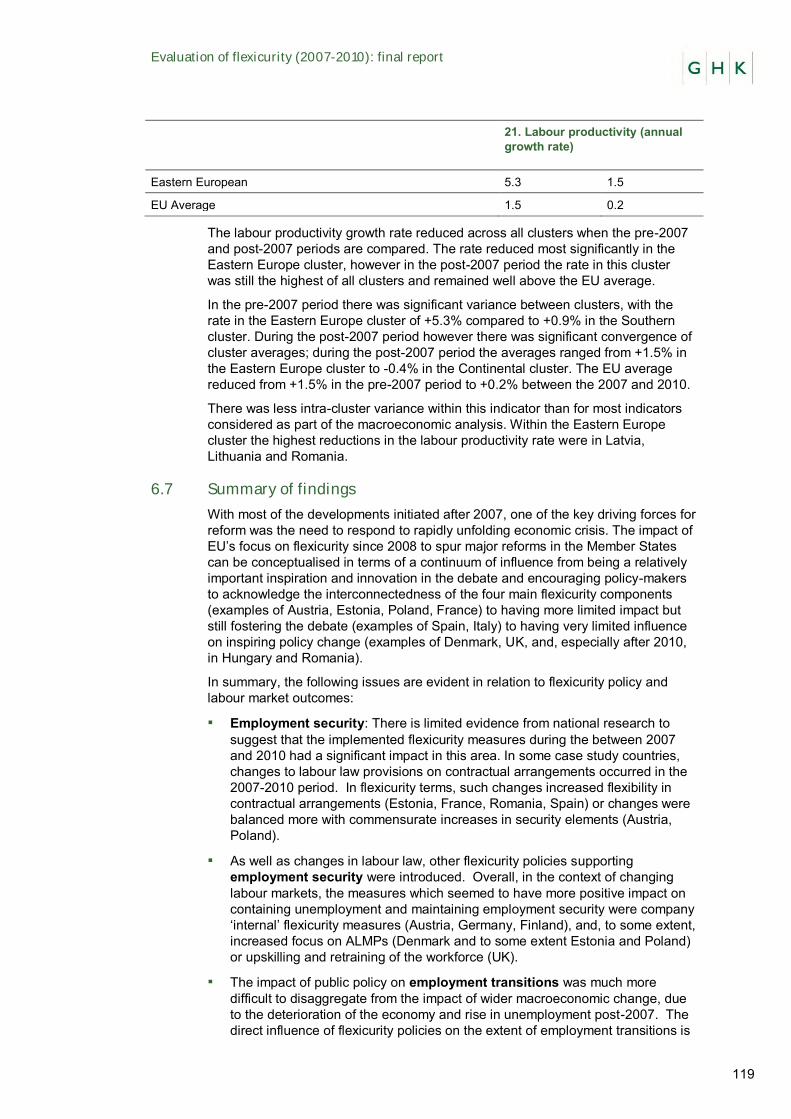
Evaluation of flexicurity (2007-2010): final report
119
21. Labour productivity (annual growth rate)
Eastern European 5.3 1.5
EU Average 1.5 0.2
The labour productivity growth rate reduced across all clusters when the pre-2007 and post-2007 periods are compared. The rate reduced most significantly in the Eastern Europe cluster, however in the post-2007 period the rate in this cluster was still the highest of all clusters and remained well above the EU average.
In the pre-2007 period there was significant variance between clusters, with the rate in the Eastern Europe cluster of +5.3% compared to +0.9% in the Southern cluster. During the post-2007 period however there was significant convergence of cluster averages; during the post-2007 period the averages ranged from +1.5% in the Eastern Europe cluster to -0.4% in the Continental cluster. The EU average reduced from +1.5% in the pre-2007 period to +0.2% between the 2007 and 2010.
There was less intra-cluster variance within this indicator than for most indicators considered as part of the macroeconomic analysis. Within the Eastern Europe cluster the highest reductions in the labour productivity rate were in Latvia, Lithuania and Romania.
6.7 Summary of findings
With most of the developments initiated after 2007, one of the key driving forces for reform was the need to respond to rapidly unfolding economic crisis. The impact of EU’s focus on flexicurity since 2008 to spur major reforms in the Member States can be conceptualised in terms of a continuum of influence from being a relatively important inspiration and innovation in the debate and encouraging policy-makers to acknowledge the interconnectedness of the four main flexicurity components (examples of Austria, Estonia, Poland, France) to having more limited impact but still fostering the debate (examples of Spain, Italy) to having very limited influence on inspiring policy change (examples of Denmark, UK, and, especially after 2010, in Hungary and Romania).
In summary, the following issues are evident in relation to flexicurity policy and labour market outcomes:
▪ Employment security: There is limited evidence from national research to suggest that the implemented flexicurity measures during the between 2007 and 2010 had a significant impact in this area. In some case study countries, changes to labour law provisions on contractual arrangements occurred in the 2007-2010 period. In flexicurity terms, such changes increased flexibility in contractual arrangements (Estonia, France, Romania, Spain) or changes were balanced more with commensurate increases in security elements (Austria, Poland).
▪ As well as changes in labour law, other flexicurity policies supporting employment security were introduced. Overall, in the context of changing labour markets, the measures which seemed to have more positive impact on containing unemployment and maintaining employment security were company ‘internal’ flexicurity measures (Austria, Germany, Finland), and, to some extent, increased focus on ALMPs (Denmark and to some extent Estonia and Poland) or upskilling and retraining of the workforce (UK).
▪ The impact of public policy on employment transitions was much more difficult to disaggregate from the impact of wider macroeconomic change, due to the deterioration of the economy and rise in unemployment post-2007. The direct influence of flexicurity policies on the extent of employment transitions is
Evaluation of flexicurity (2007-2010): final report
120
therefore difficult to assess. However, the impact of introducing and /or strengthening more holistic and integrated policy approaches facilitating employment transitions was noted in a number of case study countries (Austria, Finland). What is also observed is that in a number of countries the absence of integrated flexicurity approaches is considered to have contributed to low levels of transitions witnessed in the crisis (Estonia, Romania, Spain).
▪ In terms of gender disparities there is little evidence available on the impact of flexicurity measures on the reduction of gender disparities in the countries considered.
▪ Despite the limited conclusions that can be drawn from the evidence available it is to be noted that, given the potential impact of flexicurity policy on wage distribution and inequality there may be longer-term impacts on wage formation and distribution. These impacts should be considered in future monitoring and evaluation activity
Consultations with stakeholders as part of this study indicated that, in most cases the most significant factor impacting on changes to the labour trends during the period considered was the economic crisis, rather than the mix of flexicurity measures adopted. This is due to the fact that the crisis resulted in an immediate contraction in economic growth and an adverse impact on Government spending, and therefore, the ability of Governments to increase flexicurity-related inputs. This impacted Member States in different ways, as outlined above. Macroeconomic performance and flexicurity inputs and outcomes are considered in more detail in the next section of this report.
Evaluation of flexicurity (2007-2010): final report
121
7 Relationships between the flexicurity policies, macro economic performance and labour market outcomes
7.1 Introduction
This section provides a synthetic analysis of flexicurity-related input and outcome data alongside policy developments in the Member States and the wider macroeconomic data. In doing so, it brings together the findings from the policy analysis regarding changes in the flexicurity policy framework, data on flexicurity inputs and outputs and data on macro-economic trends which can influence – and serve to explain some of the outcomes. The aim of the section is highlight which factors have been most significant in influencing flexicurity outcomes observed in the Member States post 2007 (flexicurity policy, inputs or macro-economic factors). It also considers cases where specific flexicurity policies can be judged to have contributed to certain outcomes – particularly in those countries where these might be less expected when looking at macro-economic developments (e.g. which countries have emerged more quickly or successfully from the crisis because of flexicurity measures they introduced).
Full individual Member State scoreboards are provided in Annex 4 of this report. A summary table with key trends observed in the individual Member State’s scoreboards is provided in Annex 5 to this report.
7.2 Overview analysis
The tables overleaf provide a synthetic overview of the key trends observed in 27 EU Member State macro-economic and flexicurity scoreboards presented in Annex 4 and the analysis of the national trajectories presented in Annex 5.
Table 7.1 presents the following:
▪ Flexicurity outcome change – both the position of a Member State relative to the EU-27 average in the 2007-2010 period and direction of change in flexicurity outcomes in the 2007-2010 period compared to pre-2007 period.
▪ Macro-economic change - both the position of a Member State relative to the EU-27 average in the 2007-2010 period and direction of change in macro-economic developments in the 2007-2010 period compared to pre-2007 period.
Table 7.2 presents the comparisons of changes in flexicurity inputs and outcomes in the 2007-2010 period compared to pre-2007 period for the Member States.
The analysis in the subsequent sections is undertaken by considering trends and patterns in each of the five flexicurity clusters.
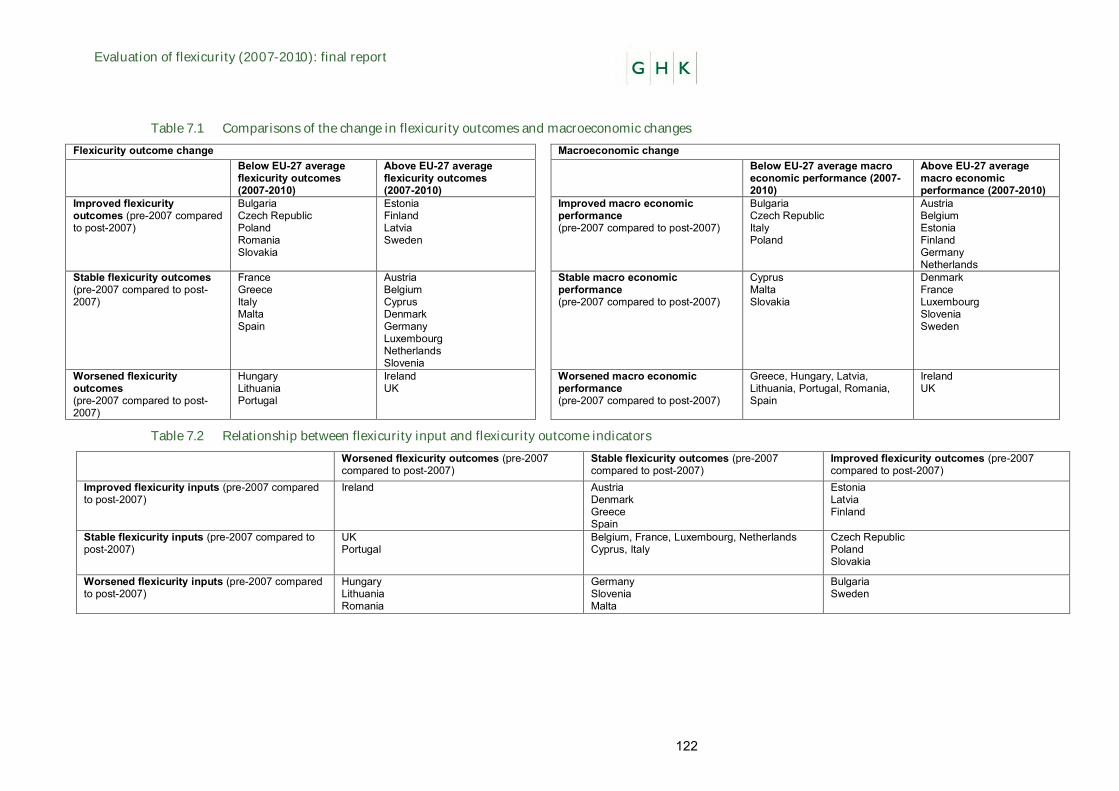
Evaluation of flexicurity (2007-2010): final report
122
Table 7.1 Comparisons of the change in flexicurity outcomes and macroeconomic changes
Flexicurity outcome change Macroeconomic change Below EU-27 average
flexicurity outcomes (2007-2010)
Above EU-27 average flexicurity outcomes (2007-2010)
Below EU-27 average macro economic performance (2007-2010)
Above EU-27 average macro economic performance (2007-2010)
Improved flexicurity outcomes (pre-2007 compared to post-2007)
Bulgaria Czech Republic Poland Romania Slovakia
Estonia Finland Latvia Sweden
Improved macro economic performance (pre-2007 compared to post-2007)
Bulgaria Czech Republic Italy Poland
Austria Belgium Estonia Finland Germany Netherlands
Stable flexicurity outcomes (pre-2007 compared to post-2007)
France Greece Italy Malta Spain
Austria Belgium Cyprus Denmark Germany Luxembourg Netherlands Slovenia
Stable macro economic performance (pre-2007 compared to post-2007)
Cyprus Malta Slovakia
Denmark France Luxembourg Slovenia Sweden
Worsened flexicurity outcomes (pre-2007 compared to post-2007)
Hungary Lithuania Portugal
Ireland UK
Worsened macro economic performance (pre-2007 compared to post-2007)
Greece, Hungary, Latvia, Lithuania, Portugal, Romania, Spain
Ireland UK
Table 7.2 Relationship between flexicurity input and flexicurity outcome indicators
Worsened flexicurity outcomes (pre-2007 compared to post-2007)
Stable flexicurity outcomes (pre-2007 compared to post-2007)
Improved flexicurity outcomes (pre-2007 compared to post-2007)
Improved flexicurity inputs (pre-2007 compared to post-2007)
Ireland Austria Denmark Greece Spain
Estonia Latvia Finland
Stable flexicurity inputs (pre-2007 compared to post-2007)
UK Portugal
Belgium, France, Luxembourg, Netherlands Cyprus, Italy
Czech Republic Poland Slovakia
Worsened flexicurity inputs (pre-2007 compared to post-2007)
Hungary Lithuania Romania
Germany Slovenia Malta
Bulgaria Sweden
Evaluation of flexicurity (2007-2010): final report
123
7.3 Analysis of the trends in the Nordic cluster
The following Member State developments are evident when considering the macroeconomic position and flexicurity-related policy prior to 2007 and during the 2007 to 2010 period:
▪ Denmark: When the two periods are compared, flexicurity outcomes remained stable relative to the EU average, in the context of increasing flexicurity inputs and stable macro-economic performance. Denmark did remain above average for the vast majority of macroeconomic indicators. The Danish model of flexicurity during 2007 to 2010 can be characterised as a balanced approach, with some movement post-2010 to introducing greater flexibility as a response to the economic crisis. A sustained economic crisis with rising unemployment levels can put flexicurity models such as the Danish model under significant pressure as the costs of supporting extensive ALMPs rise.
▪ In Finland, there was no significant change in the policy approach toward flexicurity between 2007 and 2010. A balanced approach between flexibility and security has been a common issue for a long time, aligned with the Nordic societal model. The core elements of the approach to flexicurity are engagement of social partners and the importance of lifelong learning. Between 2007 and 2010 there was an increase in relation to flexicurity inputs with associated improved flexicurity outcome indicators in the context of improved macroeconomic indicators.
▪ The Netherlands witnessed improved macro-economic performance indicators compared to the EU average. The flexicurity outcomes have remained stable, in the context of stable flexicurity inputs.
▪ In Sweden macroeconomic performance was stable when compared with the EU average, and for most macroeconomic indicators Sweden was above the EU average both prior to 2007 and afterwards. There was a decline in flexicurity input indicators; however, flexicurity outcome indicators improved relative to the EU average. This improvement was most notable in Social Security outcome indicators, though ALMP and LLL outcome indicators also increased relative to the EU average.
7.3.1 Conclusions
The approach to flexicurity in the Nordic cluster has usually been considered as being balanced between security and flexibility, with Denmark and the Netherlands considered as forerunners of balanced flexicurity approaches in the EU. The policy mix does not appear to have changed significantly in the 2007-2010 period, though there has been some movement toward flexibility in Denmark during the post-2010 period.
In all the cluster countries flexicurity outcomes in the 2007-2010 period either improved or remained stable. This is in the context of predominantly positive or stable macro-economic trends in the cluster countries and predominantly positive or stable flexicurity inputs (with the exception of Sweden).
This means that in the Nordic cluster the flexicurity input, outcome indicators and macroeconomic indicators remained stable or improved (with some exceptions), reflecting the possibility that their economies and flexicurity models developed in such a way prior to 2007 that they were more able to absorb external economic shocks and deliver more positive labour market outcomes than other Member States with different approaches.
Evaluation of flexicurity (2007-2010): final report
124
7.4 Analysis of the trends in the Continental cluster
The following Member State developments are evident when considering the macroeconomic position and flexicurity-related policy prior to 2007 and during the 2007 to 2010 period:
▪ In Austria there was no change from the policy baseline position with the national debate on flexicurity evident in the introduction of a significant number of new measures between 2007 and 2010. Austria had an improved macro economic performance during this period. Small increases, relative to the EU average, in flexicurity input indicators contributed to maintaining stable flexicurity outcome indicators. Increased volume of the measures such as short-term work and training during the crisis did help some workers to maintain their jobs but could not help to increase flexicurity outcome indicators across the board.
▪ In France there has been no change in the framework of flexicurity policy, with a clear concentration on security as an approach to tackle the problem of persistently high unemployment rates which disproportionately impacts young people and increases labour market segmentation. The period 2007 to 2010 was characterised by relatively stable input indicators when compared to EU averages. In the context of stable macroeconomic conditions, maintaining stable investment in flexicurity policies can be associated with maintaining stable flexicurity outcomes in the 2007-2010 period.
▪ In Germany the flexicurity policy framework remained stable between 2007 and 2010, following the development path established prior to this period. There was a slight improvement of the economic position during this period, and Germany remained above EU-27 average for the vast majority of macroeconomic indicators. Despite worsening flexicurity inputs, flexicurity outcomes have remained stable in Germany.
▪ In Belgium stable flexicurity input indicators (particularly in social security and lifelong learning expenditure) contributed to maintaining stable flexicurity outcome indicators in the context of a relatively stable macro-economic situation.
▪ In Luxembourg a relatively stable economic situation is observed together with stable flexicurity inputs and flexicurity outcomes in the evaluation period.
7.4.1 Conclusions
In summary, it can be observed that for Member States in the continental cluster there was a relatively mixed level of change in flexicurity input and outcome indicators.
In relation to macro-economic performance, the Continental cluster countries had either improved or stable macro-economic indicators, all of which were above EU-27 average in the post-2007 period. Four out of five Continental cluster countries (Germany being the exception) had either improved or stable flexicurity inputs. All five cluster countries maintained stable flexicurity outcomes, which in four countries remained above the EU-27 average (except France).
This means that in the Continental cluster the flexicurity inputs and macroeconomic indicators have remained stable or improved (with some exceptions), with flexicurity outcomes remaining stable at a level above the EU-average.
From a policy perspective, the maintenance of a balanced approach to flexibility is noticeable with a concentration on security during the 2007 to 2010 period, particularly in Austria. In this country, it is noted that explicit reference has been made to the fact that certain measures were introduced to promote greater
Evaluation of flexicurity (2007-2010): final report
125
flexibility (e.g. the abolition for special employment protection for disabled workers) and incorporate a balance to protect workers from employers abuse, a security balance, (e.g. heavier fines for employers not meeting their quota for the employment of disabled individuals).
There are indications that increased flexibility as a response to the crisis has played an increasing role post-2010 in the case of Austria but this has been balanced with measures aimed at maintaining employment security. In contrast there has been movement towards measures aimed at increased security in France as a response to the economic crisis.
7.5 Analysis of the trends in Anglo-Saxon cluster
The following Member State developments are evident when considering the macroeconomic position and flexicurity-related policy prior to 2007 and during the 2007 to 2010 period:
▪ In the UK the worsening economic position between 2007 and 2010 did not affect flexicurity inputs which remained stable due to relative increases in Lifelong Learning and Contractual Arrangements which outweighed relative reductions in Active Labour Market Policy and Social Security inputs. However, flexicurity outcomes worsened in the UK in this period. There was little change in the principled UK approach to flexicurity issues with a continued emphasis on labour market flexibility and the lifelong learning.
▪ The overall macroeconomic position of Ireland was stronger than the EU average prior to 2007. A worsening economic position between 2007and 2010 did not affect flexicurity inputs which increased most notably in relation to Social Security, but despite this, Ireland had worsening flexicurity outcome indicators. There were no changes in flexicurity policy from the baseline, suggesting that changes in indicators were largely driven by the scale of economic trends.
7.5.1 Conclusions
Both cluster countries experienced worsening economic performance in the post-2007 period. The worsening macroeconomic indicators were reflected in Ireland by an increased level of expenditure toward flexicurity-related measures, this happened to a lesser degree in the UK yet outcome indicators did not deteriorate to the same extent. This potentially highlights that a concentration on flexibility in the UK was advantageous during the period 2007 to 2010, however this has proven less clear in the case of Ireland where economic decline was significantly greater.
In relation to flexicurity inputs, the positions diverge insofar as Ireland improved flexicurity inputs, whereas they remained stable in the UK. Both countries have experienced worsening flexicurity outcomes.
This means in the Anglo-Saxon cluster worsening macro-economic performance, worsening flexicurity outcomes but stable or improving flexicurity inputs are observed.
Post-2010 a number of challenges emerged in both of these Member States. As with most Member States these challenges are related to the global economic crisis and resulted in reduced public sector spending with reduced market demand. In the UK context change has been accelerated by a concentration on Government deficit reduction through significant resource cuts across a range of flexicurity-related inputs and a renewed focus on increasing flexibility for employers through deregulation.
Evaluation of flexicurity (2007-2010): final report
126
7.6 Analysis of the trends in Southern Cluster
The following Member State developments are evident when considering the macroeconomic position and flexicurity-related policy prior to 2007 and during the 2007 to 2010 period:
▪ Italy: Both flexicurity input and outcome indicators remained stable and slightly below the EU average. This is despite the macro-economic indicators improving during this period relative to the EU average. However, significant regional disparities persist alongside devolved decision making structures. Italy has not moved into a different flexicurity pathway, which in Italy is characterised by strong emphasis on employment security.
▪ Spain: There was an improvement in flexicurity input indicators in Spain relative to the EU average. However this did not translate into an improvement in output indicators, which remained stable and below the EU average. This could be due to worsening macroeconomic indicators relative to the EU average. Spain has not moved into a different flexicurity pathway, the pathway remains one characterised by a strong emphasis on employment security.
▪ Portugal: Flexicurity input indicators remained relatively stable when compared with the pre-2007 period; however there was a worsening of flexicurity outcome indicators. The macroeconomic indicator performance has worsened in the 2007-2010 period.
▪ Greece: There was a small increase in flexicurity input indicators relative to the EU average; outcome indicators were relatively stable despite worsening macroeconomic indicators.
▪ Malta: Despite worsening (and relatively low) flexicurity input indicators, flexicurity outcome indicators have remained stable compared to the EU average. This could have influenced by stable macro-economic development in the post-2007 period.
▪ Cyprus: A relative stable development of flexicurity input indicators was followed by a stable development in outcome indicators. This occurred in the context of stable macroeconomic performance compared with the EU average.
7.6.1 Conclusions
Macroeconomic indicators were below the EU average in all the Southern cluster countries prior to 2007. This remained the case between 2007 and 2010, despite relative improvement in Spain, Malta and Italy, both of which remain significantly impacted by the global economic crisis and requirements to reduce Government expenditure in the post-2010 period.
For most of the Member States in the Southern cluster it is also evident that there was a relative stability in flexicurity outcome indicators when compared with the EU average (with the exception of Portugal which worsened). This is in the position where all the flexicurity outcome indicators remained below EU-27 average for the Southern cluster countries. Flexicurity inputs have remained either improved or remained stable.
This means that in the Southern cluster, we observe a mix of economic performances, improving or stable flexicurity inputs and stable, below-average flexicurity outcomes.
In the case of Italy it is interesting to note that the approach to flexicurity has not changed significantly. The role of social partners has, however, increased though with results which are too early to assess. In the case of Spain, flexibility has remained a key concern of the government as a mechanism through which the impacts of the global economic crisis can be addressed. Further it is noted that the
Evaluation of flexicurity (2007-2010): final report
127
role of social partners has diminished during the crisis as the Government has emergency measures.
7.7 Analysis of the trends in Eastern European cluster
The following Member State developments are evident when considering the macroeconomic position and flexicurity-related policy prior to 2007 and during the 2007 to 2010 period:
▪ In Estonia there was a small increase in macroeconomic performance, with above the EU average during the 2007 to 2010 period. This relatively improved macroeconomic performance coupled with increases in expenditure did translate into proportionately improved output indicators.
▪ In Hungary there was no significant policy change coupled with worsening macroeconomic performance, worsening flexicurity input indicators and worsening flexicurity outcomes.
▪ In Poland there was a relatively stable level of flexicurity input indicators, whilst there was a relative improvement in the flexicurity outcomes and improvement of the macroeconomic position of Poland. From a policy perspective, the balance has tipped towards flexibility for employers rather than job security – and the economic downturn perhaps accelerated this tendency. In general, Poland has made considerable efforts to reflect on the flexicurity pathway in the country, also increasing the involvement of social partners in key policy decisions (see also Annex 1 Interesting Practice examples for further information on the anti-crisis package in Poland).
▪ In Romania declining macroeconomic performance was coupled with a decline in flexicurity input and declining flexicurity outcomes. Flexicurity policy has shifted towards greater flexibility.
▪ In Bulgaria there was a small improvement in macroeconomic indicators, relative to the EU average. The overall position of Bulgaria in this respect, however, remained weak. Flexicurity related outcome indicator performance has improved, but remained below EU-27 average. The flexicurity inputs have worsened.
▪ In the Czech Republic there was a relative improvement in the macroeconomic performance, however as with Bulgaria this did prove sufficient to improve flexicurity outcome in the context of stable flexicurity inputs.
▪ In Latvia there was a declining (and still below average) macroeconomic performance. However, we also observe increasing flexicurity input indicators and outcome indicators.
▪ In Lithuania in the context of worsening macroeconomic performance, a decrease in flexicurity input indicators led to worsening flexicurity outcomes.
▪ Slovenia saw stability in macroeconomic performance but this was insufficient to improve flexicurity outcome indicators in the context of declining input indicators.
▪ In Slovakia there was stability in economic performance between the two periods. However this was coupled with improvements in flexicurity outcome indicators in the context of stable inputs indicators.
7.7.1 Conclusions
For the majority of Member States in the Eastern Europe cluster flexicurity policy has to be considered against a background of macroeconomic conditions that were far worse than the EU average both prior to 2007 and in the period from 2007 to 2010.
Evaluation of flexicurity (2007-2010): final report
128
Three countries have improved macro-economic performance (Bulgaria, Czech Republic, Estonia, Poland), in two countries it was stable (Slovakia, Slovenia) and in five it has declined (Hungary, Latvia, Lithuania, Romania, Slovakia).
In the vast majority of Eastern European cluster countries flexicurity outcome indicators improved relative to the EU average (Estonia, Latvia, Czech Republic, Poland, Slovakia, Bulgaria, Romania), in Slovenia flexicurity outcome indicators remained stable and in Hungary they worsened.
Two countries have improved flexicurity inputs (Estonia, Latvia), three countries have stable flexicurity inputs (Czech Republic, Poland and Slovakia) and in five countries they have declined (Hungary, Lithuania, Slovenia, Bulgaria, Romania).
This means that in the Eastern European cluster no clear-cut patterns emerge as trends in macro-economic and flexicurity indicators are mixed.
7.8 Summary conclusions
7.8.1 The performance of countries using different flexicurity models in the crisis situation – are there any models that do perform better short term (or longer term) and do any policies specifically stand out as being supportive of this performance?
Analysis presented in this section does not allow the identification of clear-cut trends whereby all countries in five flexicurity clusters have identical economic and labour market development patterns. In each cluster, there are exceptions and outliers to the generalised cluster pattern identified (with the exception of the Eastern European cluster where no majority-pattern is visible). Hence, the analysis below needs to be treated with this caveat in the absence of clear-cut trends.
Bearing in mind the exceptions of individual countries identified in each cluster, it is however possible to identify that, broadly speaking, clusters which are usually associated with more balanced approaches to flexicurity challenges have been experiencing mostly stable or improving flexicurity outcomes in the climate of stable and/or improving economic performance:
▪ In the Nordic cluster the flexicurity input, outcome indicators and macroeconomic indicators remained stable or improved (with some exceptions), reflecting the possibility that their economies and flexicurity models are more able to absorb external economic shocks and deliver more positive labour market outcomes. In the 2007-2010 period, the policy emphasis has continued to be placed on the AMLPs, with reforms to further enhance their effectiveness which can be considered to contribute to the stability of flexicurity outcomes in the context of global economic downturn (see also Annex 1 Interesting Practice examples for further information on the reform of ALMPs in Denmark and the reform of Change Security to help restructuring in Finland).
▪ In the Continental cluster the flexicurity inputs and macroeconomic indicators remained stable or improved (with some exceptions), with flexicurity outcomes remaining stable at a level above the EU-average. In terms of the policy mix, in the 2007-2010 period, the countries in this cluster have used short-term working arrangements and continued emphasis on training to deal successfully with the consequences of global economic downturn (see also Annex 1 Interesting Practice examples for further information on short-term work in Austria and Germany).
In contrast, the clusters of countries which are usually associated with less balanced approaches to flexicurity (increased emphasis on security in the Southern cluster; increased emphasis on flexibility in the Anglo-Saxon cluster) have experienced worsening or stable flexicurity outcomes and typically a climate of worsening economic performance:
Evaluation of flexicurity (2007-2010): final report
129
▪ In the Anglo-Saxon cluster the worsening macroeconomic performance, worsening flexicurity outcomes but stable or improving flexicurity inputs are observed. In this cluster, the policy choices have continued to be towards the increased flexibility in the labour market and further upskilling and training of the workforce (see also Annex 1 Interesting Practice examples for further information on Train to Gain in the UK). However, this cannot be demonstrated to have helped to improve flexicurity outcomes in the immediate short-term.
▪ In the Southern cluster, we observe a mix of economic performances, improving or stable flexicurity inputs and stable, below-average flexicurity outcomes. The countries in this cluster are usually characterised by strong emphasis on labour market security, even though changes to this emphasis are observed, especially after 2010 (see also Annex 1 Interesting Practice examples for further information on the labour market reform in Spain). Initiatives to upskill and re-train the workforce are also a common policy in this cluster see also Annex 1 Interesting Practice examples for further information on the inter-professional funds in Italy).
7.8.2 What are the main factors driving flexicurity outcome indicators – what is the impact of flexicurity policies and what is the impact of macro-economic changes?
The question of attribution of causality behind the patterns of flexicurity outcomes is challenging as no clear-cut patterns are identified in the analysis. It also needs to be borne in mind that the rises in flexicurity input indicators are partly influenced by rising demand for such support measures in the times of economic downturn (so do not necessarily show increased spend per individual or on new measures).
Eight countries are identified as achieving improved flexicurity outcomes (see table 7.2). They are distributed between three countries with improved flexicurity inputs, three with stable flexicurity inputs and two worsening flexicurity inputs. In seven out of the eight countries the macro-economic performance has either improved (Estonia, Finland, Czech Republic, Poland, Bulgaria) or remained stable (Slovakia, Sweden). Only in one county with improved flexicurity outcomes a worsening macro-economic performance is observed (Latvia where flexicurity inputs have improved).
Six countries are identified as having worsened flexicurity outcomes (see table 7.2). In all of them, economic performance has worsened. In contrast, the direction of flexicurity inputs change is distributed between improving (Ireland), stable (UK, Portugal) and declining (Romania, Hungary, Lithuania).
13 countries are identified as having stable flexicurity outcomes (see table 7.2). In relation to flexicurity inputs change, most countries with stable flexicurity outcomes have either improved flexicurity inputs (Austria, Denmark, Greece, Spain) or maintained stable flexicurity inputs (Belgium, France, Luxembourg, Netherlands, Cyprus, Italy). Only in three countries, despite worsening flexicurity inputs, the flexicurity outcomes have remained stable (Germany, Slovenia, Malta; all countries with improving or stable macro-economic performance). In 5 out of 13 countries with stable flexicurity outcomes the macro-economic performance improved (Austria, Belgium, Netherlands, Italy, Germany), in 2 countries it declined (Greece, Spain) and in 6 countries it has remained stable (Denmark, France, Luxembourg, Cyprus, Slovenia, Malta). Hence, the stability in flexicurity outcomes is predominantly associated with stable and improving macro-economic performance.
This shows that changes in flexicurity inputs alone do not explain the patterns and variations in flexicurity outcomes. In all three groups of stable, worsening and improving flexicurity outcomes, flexicurity inputs are distributed between stable, worsening and improving. Only in the group of countries with stable flexicurity outcomes a certain predominance of stable or improved flexicurity inputs is observed. However, in this group most of the countries also had an improved or stable macro-economic performance.
Evaluation of flexicurity (2007-2010): final report
130
So the direction of macro-economic change appears to be a more important factor in influencing the change in flexicurity outcomes. In the group of countries with improved flexicurity outcomes the majority of them had either improved or stable macro-economic performance. In the group of countries with worsened flexicurity outcomes, all of them had worsened macro-economic performance. Notably, all of the countries with worsened flexicurity outcomes are not considered to have balanced flexicurity approaches.
We should also note that this analysis compares a period of widespread economic growth in the EU (the pre-2007 period) with a period of economic contraction (2007 to 2010), which either formally included or was to lead to a turbulent recession for most Member States. The results outlined above may therefore be seen as an analysis of how well prepared flexicurity inputs and macroeconomic conditions left Member States in relation to managing economic contraction, and what the results of this were. This evidence does not yet illustrate which flexicurity pathways will result in stimulating the necessary conditions for growth and job creation which are associated with favourable flexicurity outcomes.
Evaluation of flexicurity (2007-2010): final report
131
8 Conclusions and policy messages
As a concept based on a balanced mix of social, education and labour market policies, flexicurity emerged during the 1990s in Denmark and the Netherlands during a period of economic growth. In both countries, it has been shaped by the long-term development of various aspects of employment, social and education / training policies. In practice, in both countries the functioning of flexicurity as a balanced approach across the four components has required high levels of government spending (generous unemployment benefits combined with ALMPs, lifelong learning, hiring subsidies). These particular approaches to flexicurity are predicated on significant government investment and an assumption that an economy can return to growth and employment creation (with the support of government policy) relatively rapidly.
The conclusions of the evaluation are presented by key evaluation questions and sub-questions.
8.1 EQ1: Whether and to what extent have Member States put into practice the Common Principles?
8.1.1 Have Member States outlined in their National Reform Programmes the national arrangements giving effect to the Common Principles?
In most NRPs, references to flexicurity are contained in the employment section. None of the other sections of these documents reference flexicurity, even though these sections touch on topics relevant to the flexicurity components. There is also a tendency to see flexicurity in more narrow labour law and contractual arrangement terms than a concept to better achieve employment and income security while maintaining flexibility in the labour market. The implementation of flexicurity as an integrated policy mix also needs to include a focus on economic and regional policy approaches – a link which is rarely made in the NRPs.
▪ It is therefore recommended that Member States be advised to take on board the link between actions on the four flexibility pillars (and balance between then) in the entire NRP document, to establish the link between these and regional and macroeconomic policies.
8.1.2 To what extent has the concept of flexicurity been addressed in the national policy/political debates?
At least some Member States have considered how flexicurity relates to their labour market conditions and in doing so have developed a version of flexicurity that is relevant to their labour market (though not necessarily corresponding to one of the defined pathways). As a result, the impact of flexicurity differs across Member States.
One of the key findings which emerge from the review of the country case studies is the value of the OMC process in the context of the EU’s flexicurity initiative. This is as true for countries that are yet to begin to build an integrated approach to flexicurity as it is for countries that have already developed one. For both groups of countries, the Commission’s flexicurity initiative and OMC process has mostly led to changes at the level of the political debate and agenda setting. Member States have identified political priorities, however, the crisis has affected the level of resources available to implement policy measures to effect change.
For the first group of countries, the EU initiative has served to heighten awareness of the interlinkages between flexibility and security measures (Spain, Italy, Estonia, Poland). For the second group (countries which already have integrated approaches, whether under the flexicurity banner or not) the EU initiative has served to provide examples of countries which implement flexicurity differently,
Evaluation of flexicurity (2007-2010): final report
132
thus facilitating a process of internal reflection which is a key step in the policy cycle in the move towards policy improvements. It has also helped to build and reinforce consensus behind existing integrated national approaches.
▪ In order to place greater emphasis on the need for a balanced approach and the advantages of balanced policy measures, the OMC (and linked national level dissemination) could take on board specific policy examples, strengthening the link between mutual learning and country specific recommendations.
8.1.3 To what extent have the flexicurity-related challenges (notably enhancing employment security, reducing labour market segmentation and managing positive transitions) been on the public and political agenda?
Flexicurity has been relevant to political discussions in the Member States, notwithstanding the different policy challenges and policy frameworks which they face. In some countries, the flexicurity agenda has injected the policy debate with new proposals for reform. In other countries where awareness of the need for a balanced mix of measures has long existed, the EU’s flexicurity agenda may have served to highlight the continuing need to address the balance between different components of labour market policy.
On the other hand, during the economic downturn, in many countries the “security” side of the flexicurity concept has tended to stall and political debates on the flexicurity agenda (or on the issues contained in the flexicurity agenda), led primarily by trade union representatives, have become increasingly conflictual. This appears to be less prevalent in some countries with strong traditions of social partnership where in recent years significant progress has indeed been in achieving greater labour market flexibility without significantly undermining employment security. Within the context of the Open Method of Co-ordination, it is left to the process of defining the Country Specific Recommendations to reinforce the message about the need for a balanced application of the flexibility and security components and the need for a holistic consideration of the four pillars of flexicurity. Further efforts may be required to demonstrate, on the basis of policy examples, the costs and benefits of various flexicurity measures and their “win-win” potential, in relation to the underlying economic situation.
8.1.4 Has there been a balanced approach concerning improving flexibility and security at the same time? Has there been a bias towards one of these key aspects?
Because of the freedom provided to Member States to shape the concept according to their particular models, priorities and challenges, the same level of emphasis has not been placed on all aspects of flexicurity. Sometimes components which would have warranted attention have not been significantly addressed and measures to enhance flexibility have not been counterbalanced with initiatives to enhance security. As the only mechanism for responding to Member State initiatives in this area is currently through the Country Specific Recommendations, flexicurity-relevant efforts to ensure a more balanced approach are now mediated through a complex process at EU level. European monitoring processes also highlight a lack interconnectedness between economic and employment priorities and actions, demonstrated by the lack of reference to flexicurity anywhere other than in the employment part of the NRPs, as mentioned above. As the experience of a number of countries has shown, the closer involvement of all stakeholders, including social partners at the national level, can contribute to working towards greater balance and attention to all components in the policy design phase at the national level. However, as already indicated, recent years have also shown that the debate around aspects of flexicurity during times of austerity can also lead to more conflictual policy discussions between social partners and the government.
The affordability of security is a key concern given the erosion of public budgets since the crisis and this is a particular problem linked to internal and external
Evaluation of flexicurity (2007-2010): final report
133
flexicurity where the increasing numbers of dismissed workers mean the public budgets need to cope with the additional costs of assuring income and transition security. Additionally, the time lag involved in reaping the benefits of policies linked to lifelong learning or the wider coverage of atypical workers by social security arrangements makes it difficult to discern any immediate (positive) effects of such approaches.
▪ Greater emphasis needs to be placed, both through the country specific recommendations and through an evidence based approaches to transnational policy exchange, on the advantages of a balanced approach of measures as well as greater involvement of key stakeholders (such as social partners) in policy making.
8.1.5 Has flexicurity been considered as an over-arching strategy, i.e. is there a deliberate combination of the (four) components or have they been treated in a rather separate way? Has there been a bias towards one or some of the components?
Across the EU, the concept of flexicurity has been considered as an integrated strategy and a combination of several policy strands, at least to a certain extent. The four component parts of flexicurity have been implemented, though not necessarily in a deliberate combination or balanced fashion, and at the Member State level measures are not always clearly linked to the concept of flexicurity.
In terms of balancing flexibility and security, a continuum of approaches was noted, from countries where moves to more flexibility are predominantly balanced with simultaneous measures to increase security (such as Austria and France); to countries with clear emphasis on flexibility. In some countries, the increased flexibility drive post-2010 has strongly undermined security, including in Hungary and Romania. There are also examples of countries where the national policy direction during the 2007-2010 period was not so much focussed on the tensions in balancing flexibility with security, but more on the concurrent development of the four flexicurity components of ALMP, LLL, contractual relations and social protection systems (such as in Finland, and to some extent Denmark and Poland).
8.1.6 Have policies been introduced to reduce segmentation? Has the enhancement of contractual flexibility been ensured and accompanied by measures to secure transitions from job to job?
The evidence on the extent to which flexicurity has helped to overcome labour market segmentation in Member States is limited. Segmentation has increased in many countries, particularly as a result of the increasing use of temporary employment (in itself often the result of a liberalisation of EPL for fixed-term contracts). Although countries such as Spain and Austria have sought to provide greater protections for some workers on atypical contracts, this does not necessarily have the effect of limiting high level recourse to such forms of employment or significantly greater protection for such flexible workers and the effects of improved security take more time to emerge (as entitlements are built up over time).
8.1.7 To what extent have policies been introduced to promote equal access to quality employment for women and men and measures offered to reconcile work, family and private life?
In terms of gender disparities, some indicators are showing improvements in the post-2007 period (overall female employment rate, employment rate of women with 1 child), other indicators have shown little improvements (the use of formal childcare, working part-time due to childcare).
There is little evidence available on the impact of flexicurity measures on the reduction of gender disparities in the countries considered.
Evaluation of flexicurity (2007-2010): final report
134
Gender inequalities remain a very important problem in terms of female labour market participation and employment rates (although the employment rate for males has been more negatively impacted during the economic crisis than has the employment rate for females in several countries), the gender pay gap and reconciliation of work and family life.
In countries which have enacted measures aiming to address gender inequalities, they are not necessarily linked with flexicurity approaches, but are more likely to be part of a wider general gender equality strategy.
▪ A clearer policy link should be established between flexicurity measures and measures to support gender equality, as in most Member States, this is not currently the case.
8.1.8 Which major reforms, inspired by flexicurity, have been introduced or announced? Were these measures costly/cost-effective? Were they relevant/appropriate for all labour market groups?
Significant initiatives and policy reforms have been implemented across the four component parts of flexicurity. That said, some of these reforms pre-date the launch of the EU’s first phase of flexicurity. It is difficult to say which measures would or would not have been implemented in the absence of the EU’s focus on flexicurity. However, what is clear is that the discussions of the individual component parts of flexicurity have been high on the political agenda. In some countries, there is a sense that the EU flexicurity agenda has ensured that some components, which had previously received less attention, have been subject to discussion and reform. In a number of countries, the EU flexicurity agenda has also contributed to more attention being paid to the need to take further components into account in a more balanced policy approach.
Therefore, the impact of EU’s focus on flexicurity since 2007 to spur major reforms in the Member States can be conceptualised in terms of a continuum of influence from being a relatively important inspiration and innovation in the debate and leading to at least considering the spirit of flexicurity in the reforms implemented (examples of Austria, Estonia, Poland) to having more limited impact but still fostering the debate (example of Spain, Italy) to having very limited influence (examples of Denmark, Germany, Romania, Hungary, the UK - although for very different reasons).
In the case of Denmark and Germany, the limited impact of the EU’s flexicurity initiative must be understood in the context of the important steps already taken in these countries (prior to 2007) toward implementing an integrated national flexicurity approach. In Hungary and Romania, the EU’s limited impact results from the combination of three contextual factors: the economic crisis, which removed any possibilities to finance integrated flexicurity policies; the constellation of political forces (weak social partners; and frequent changes in government); and weaknesses in the legislative framework (for instance, the recent adoption of a labour code in Romania, which made it easy for the government to override security concerns in favour of a narrow ‘flexibilisation’ drive).
8.1.9 What flexicurity-type measures have been introduced to mitigate the impact of the crisis?
In the context of the crisis measures, the EU’s focus on flexicurity was helpful, at least in some contexts, in providing a reference framework and a toolbox to frame the discussion and development of some of the crisis measures which could have been to some extent inspired by the flexicurity approach (e.g. the adoption of the anti-crisis package through tripartite dialogue in Poland is regarded as the start of the real tripartite dialogue on labour reforms and flexicurity measures in the country; it also addresses several flexicurity elements). Here, the causality between the EU’s focus on flexicurity and the direction of measures taken is
Evaluation of flexicurity (2007-2010): final report
135
however very difficult to establish. In other countries, however, the impact of the crisis has been so severe (such as Romania and Hungary), that policy developments have been driven entirely by emergency measures.
▪ Our evidence suggests that a balanced approach to flexicurity measures could assist countries to exit from the crisis. However, the experience of many Member States shows that many planned flexicurity measures had to be put on hold as a result of the crisis, or policy shifts towards greater flexibility occurred. A greater link with the marcoeconomic policy framework and outcome evaluation could support the message that both should not be regarded in isolation, but as mutually supportive.
8.2 EQ2: Whether and to what extent did Member States develop their own 'flexicurity pathways'?
8.2.1 Has a 'national flexicurity pathway', i.e. an explicit strategy combining the four flexicurity components been developed in a deliberate way?
In terms of balancing flexibility and security, a continuum of approaches was noted, from countries where moves to more flexibility are predominantly balanced out with simultaneous measures to increase security (such as Austria and France); to countries with clear emphasis on flexibility. Examples are reforms of contractual relationships as in Estonia or the 2010 labour market reform in Spain, or the emphasis on maintaining the relatively liberal EPL as in the UK. In some countries, the flexibilisation drive (after 2010) has strongly undermined security, including Romania and Hungary. There are also examples of countries where the national policy direction during the 2007-2010 period was not so much focussed on the tensions in balancing flexibility with security, but more on the concurrent development of the four flexicurity components of ALMP, LLL, contractual relations and social protection systems (such as in Finland, to some extent, Denmark and Poland).
To sum up, the existence of the common flexicurity principles calling for a deliberate combination and policy mix simultaneously reforming several elements has not been translated into a widespread adoption of spirit of the classic flexicurity approach across the Member States.
▪ The conclusion can be drawn that even in the absence of a defined pathway, countries can be working towards a more balanced approach and that the idea of an identified pathway may indeed be counterproductive, as it can make it too easy for countries to reject working towards approaches which they consider to be incompatible with their current models.
8.2.2 To what extent have Member States used the model pathways proposed by the Commission?
Flexicurity pathways have been relevant to political discussions in the Member States, notwithstanding the different policy challenges and policy frameworks which they face. Thus, in countries like Poland, Hungary, Romania and Spain, where unemployment has historically been tackled by means of passive income support, the flexicurity agenda has injected the policy debate with new proposals for reform. In countries like Denmark, Finland, UK and Germany, on the other hand, where awareness of activation measures has long existed, the EU’s flexicurity agenda may have served to highlight the continuing need to address the balance between different components of labour market policy. In Austria, it is considered to have given new impetus to the debate on modernising social security systems and lifelong learning, which had not previously featured as strongly on the policy agenda. However, explicit adoption of a model pathway proposed by the Commission has not been detected amongst the Member States. It was more the
Evaluation of flexicurity (2007-2010): final report
136
case that the description of flexicurity pathways and components served as inspiration for debate and discussions.
8.2.3 Which aspects are regarded as strengths/weaknesses in the national approaches to the implementation of the flexicurity principles by the stakeholders?
The degree to which national policy makers would themselves identify a coherent national flexicurity approach differs significantly across the Member States. On the one hand, in countries like Austria and Denmark the deliberate combination of the four components is acknowledged and put into practice. German policy-makers also identify a national flexicurity approach, albeit one that is rather narrowly based on internal flexibilisation. In Poland, the EU’s flexicurity initiative acted as a catalyst for incremental change. The opposite is true for a number of other countries, including France (where initial efforts to combine the four components of flexicurity into an integrated approach were neglected as a result of the crisis) and especially Hungary and Romania, where the crisis led to drastic changes in course where attempts to balance flexibility and security were abandoned in favour of an approach deeply skewed toward increased flexibility at the expense of security.
Spain can be singled out in its readiness – at least in the adoption of policy measures - to consider an approach which would re-balance the flexibility and security components (to respond to the challenges of its highly segmented labour market), but efforts in this direction are too recent to assess their impact. Finally, in the UK and Finland there is little debate about a national flexicurity approach. In the case of the UK, the focus is placed on the flexibility dimension in the labour market and skills upgrading in the workforce (see also Example 12 in Annex 1). So, the analysis of strengths and weaknesses of national flexicurity approaches typically comes through the lens of external analysts applying the conceptual framework of flexicurity to the UK context. In Finland, the debate (albeit highly relevant to flexicurity) has tended to take place independently of it, focusing instead on the ‘reinvention of the Nordic social model’.
▪ Some of the strengths of the national flexicurity approaches are common across at least several countries: – A strong (or increasing) role for social partners in the development of key
measures, as witnessed in Austria, Denmark, Poland, Germany, Finland, France and Italy.
– Increasing adoption of measures and reforms which are cross-cutting and attempt to address several flexicurity components, such as in Italy, Poland, Austria, Spain.
8.3 EQ3: Whether and to what extent have Member States put into practice appropriate governance mechanisms?
8.3.1 To what extent have the various stakeholders, notably the social partners, been involved in the development of the national pathway? Has it been subject to public debate?
In most of the Member States social partners played a role in devising the NRPs and in some Member States in the development of the national flexicurity approach or its elements. A more nuanced picture is emerging from the case study research. On the one hand, in some countries social partners have had a strong role in the development of the main flexicurity-type measures at the national level (such as Austria, Germany, Finland and France). In other countries, social dialogue did play a role but in the implementation of key reforms the government pressed ahead bypassing the social dialogue results achieved so far or the views of social partners (e.g. Estonia, Spain and Italy). Finally, in a number of countries, the economic crisis has seen social partners marginalised completely (Hungary and Romania).
Evaluation of flexicurity (2007-2010): final report
137
Notwithstanding these different experiences even in countries with strong traditions of social partnership, it remains important that social partner involvement in shaping the agenda continues to be conditioned by the strength and embeddedness of these organisations in the decision making process, which historically varies significantly from country to country. Further capacity building is clearly required in a number of countries to realise the aspiration of social partner involvement. An assessment of the impact of strong tripartism, for example in the running of labour market institutions such as the PES, might contribute to a better understanding of beneficial impact (or otherwise) of such arrangements on flexicurity policy and labour market outcomes.
Thus, the existence of the common flexicurity principle calling for the involvement of social partners in the design and implementation of flexicurity policies cannot clearly be linked to an enhanced role of social partners in the development of national policy (with the possible exception of Poland, although causality is difficult to establish).
▪ It is therefore necessary to further emphasise the added value of strong social partner involvement and where necessary to build relevant capacity and establish appropriate frameworks at the national level.
8.3.2 Is the implementation of integrated flexicurity policies monitored? How? What kind of monitoring mechanisms have been put in place?
Specific flexicurity-specific monitoring structures have not been developed in the Member States. However, performance concerning individual flexicurity-related measures and indicators was reported in Member States’ annual progress reports in the NRP monitoring process. It needs to be borne in mind though that in some countries with strong policy monitoring traditions, monitoring arrangements exist and cover the main flexicurity related policies. This is less evident in other countries with less embedded culture of monitoring and evaluating policies.
The relevant policies / measures would be (or not) evaluated and monitored depending on the national institutional traditions. Monitoring of flexicurity is thus dependant on the national context and their tradition of policy monitoring and evaluation, which differs across the case study countries. Thus, the influence of the third common principle on effective monitoring of the progress of flexicurity cannot be traced in most case study countries in the sense of generating new momentum at the national level for increased monitoring/evaluation of public policies. However, interesting developments are noted, for example, in Poland where the social partners have undertaken studies, conferences and projects to reflect on the implementation of flexicurity in Poland.
▪ Overall, what has been found useful in some countries (e.g. Estonia) is to have, in general, an articulated clear framework with clear targets, deadlines and budgets to focus the monitoring of the whole of the NRP.
8.4 EQ4: What has been the impact of the implemented integrated flexicurity policies at EU and national level concerning the objectives of flexicurity and the Lisbon Strategy?
The evaluation did not identify clear-cut trends whereby all countries in five flexicurity have identical economic and labour market development patterns. In each cluster, there are exceptions and outliers to the generalised cluster pattern identified (with the exception of the Eastern European cluster where no majority-pattern is visible). Hence, the analysis below needs to be treated with this caveat of the absence of clear-cut trends.
Bearing in mind the exceptions of individual countries identified in each cluster, it is however possible to identify that, broadly speaking, clusters which are usually associated with more balanced approaches to flexicurity challenges have
Evaluation of flexicurity (2007-2010): final report
138
been experiencing mostly stable or improving flexicurity outcomes in the climate of stable and/or improving economic performance:
▪ In the Nordic cluster the flexicurity input, outcome indicators and macroeconomic indicators have remained stable or improved (with some exceptions), reflecting the possibility that their economies and flexicurity models are more able to absorb external economic shocks and deliver more positive labour market outcomes. In the 2007-2010 period, the policy emphasis has continued to be placed on the AMLPs, with reforms to further enhance their effectiveness which can be considered to contribute to the stability of flexicurity outcomes in the context of global economic downturn (see also Annex 1 Interesting Practice examples for further information on the reform of ALMPs in Denmark and the reform of Change Security to help restructuring in Finland).
▪ In the Continental cluster the flexicurity inputs and macroeconomic indicators have remained stable or improved (with some exceptions), with flexicurity outcomes remaining stable at a level above the EU-average. In terms of the policy mix, in the 2007-2010 period, the countries in this cluster have used short-term working arrangements and continued emphasis on training to deal successfully with the consequences of global economic downturn.
In contrast, the clusters of countries which are usually associated with less balanced approaches to flexicurity (increased emphasis on security in the Southern; increased emphasis on flexibility in the Anglo-Saxon) have experienced worsening or stable flexicurity outcomes and typically a climate of worsening economic performance:
▪ In the Anglo-Saxon cluster the worsening macro-economic performance, worsening flexicurity outcomes but stable or improving flexicurity inputs are observed. In this cluster, the policy choices have continued to be towards the increased flexibility in the labour market and further upskilling and training of the workforce. However, this cannot be demonstrated to have helped to improve flexicurity outcomes in the immediate short-term.
▪ In the Southern cluster, we observe a mix of economic performances, improving or stable flexicurity inputs and stable, below-average flexicurity outcomes. The countries in this cluster are usually characterised by strong emphasis on labour market security, even though changes to this emphasis are observed, especially after 2010. Initiatives to upskill and re-train the workforce are also a common policy in this cluster.
The question of attribution of causality behind the patterns of flexicurity outcomes is challenging as no clear-cut patterns are identified in the analysis. It also needs to be borne in mind that the rises in flexicurity input indicators are partly influenced by rising demand for such support measures in the times of economic downturn (so do not necessarily show increased spend per individual or on new measures).
Eight countries are identified as achieving improved flexicurity outcomes. They are distributed between three countries having improved flexicurity inputs, three having stable flexicurity inputs and two worsening flexicurity inputs. In seven out of the eight countries the macro-economic performance has either improved (Estonia, Finland, Czech Republic, Poland, Bulgaria) or remained stable (Slovakia, Sweden). Only in one county with improved flexicurity outcomes a worsening macro-economic performance is observed (Latvia where flexicurity inputs have improved).
Six countries are identified as having worsened flexicurity outcomes. In all of them, economic performance has worsened. In contrast, the direction of flexicurity inputs change is distributed between improving (Ireland), stable (UK, Portugal) and declining (Romania, Hungary, Lithuania).
Evaluation of flexicurity (2007-2010): final report
139
13 countries are identified as having stable flexicurity outcomes. In relation to flexicurity inputs change, most countries with stable flexicurity outcomes have either improved flexicurity inputs (Austria, Denmark, Greece, Spain) or maintained stable flexicurity inputs (Belgium, France, Luxembourg, Netherlands, Cyprus, Italy). Only in three countries, despite worsening flexicurity inputs, the flexicurity outcomes have remained stable (Germany, Slovenia, Malta; all countries with improving or stable macro-economic performance). In 5 out of 13 countries with stable flexicurity outcomes the macro-economic performance has improved (Austria, Belgium, Netherlands, Italy, Germany), in 2 countries it has declined (Greece, Spain) and in 6 countries it has remained stable (Denmark, France, Luxembourg, Cyprus, Slovenia, Malta). Hence, the stability in flexicurity outcomes is predominantly associated with stable and improving macro-economic performance.
This shows that changes in flexicurity inputs alone do not explain the patterns and variations in flexicurity outcomes. In all three groups of stable, worsening and improving flexicurity outcomes, flexicurity inputs are distributed between stable, worsening and improving. Only in the group of countries with stable flexicurity outcomes a certain predominance of stable or improved flexicurity inputs is observed. However, in this group most of the countries also had an improved or stable macro-economic performance.
So the direction of macro-economic change appears to be a more important factor in influencing the change in flexicurity outcomes. In the group of countries with improved flexicurity outcomes the majority of them had either improved or stable macro-economic performance. In the group of countries with worsened flexicurity outcomes, all of them had worsened macro-economic performance. Notably, all of the countries with worsened flexicurity outcomes are not considered to have balanced flexicurity approaches.
▪ These conclusions appear to indicate not only a link between balanced flexicurity approaches and more robust performance and ability to exit the crisis, but also highlight the critical link with overall macro-economic performance indicators. Both serve to emphasise our previously mentioned policy lessons of the need to integrate ‘flexicurity’ into all considerations of the NRP and the importance of demonstrating through evaluation evidence and concrete policy examples the beneficial outcomes of such approaches.
8.4.1 To what extent have integrated flexicurity policies increased adaptability, employment and social cohesion?
The experience of the countries suggests that moves toward a better balance between flexibility and security were derailed in many countries as a result of the economic crisis. In other countries, the economic crisis had more subtle effects, including changes to the order of priorities on the national policy agenda. In this context, there is a notable disjuncture between the policy objectives on the political agenda in many countries and the major policy reforms that were actually implemented in those countries. The two flexicurity components that suffered most in this regard have been LLL and the modernisation of social security systems. These are both components that are potentially resource intensive. While logic dictates that one might offer education and training during an economic downturn in preparation for the upturn, one needs the resources to fund such measures. Similarly, resources earmarked for modernising social security systems will be diverted to providing security for the unemployed. It is also notable that investment in ALMPs can become more costly during such periods (due to higher demand) without immediately improving labour market outcomes. However, some studies have shown that in the longer term such investments do lead to more sustainable labour market integration.
Evaluation of flexicurity (2007-2010): final report
140
What is clear is that the crisis fundamentally changed the context in which flexicurity policies operate and has offset the positive impact of some measures. The internal flexicurity measures implemented in Austria have been successful in containing unemployment and maintaining employment security while keeping long term unemployment manageable and ensuring training opportunities for individuals who are out of work. However, these are not the types of labour market outcomes that one might have expected when the first phase of flexicurity was introduced in 2007.
In other countries, the crisis has ushered in fundamental structural reforms which might not otherwise have been carried through, including measures to reduce labour market segmentation and ensuring that adequate social protection systems are in place. Hence, one might conclude that flexicurity provided the impetus for tackling structural problems whereas the crisis speeded up the implementation process. That said, while the question of structural reform has moved up the political agenda, the extent to which such wide-reaching reforms have been implemented remains unclear. One wonders whether the lack of an integrated flexicurity approach intensified the impact of the crisis, for example in Spain.
Fundamentally, this question remains difficult to answer given the time lag between measuring input and output indicators in the evaluation reference period. The fact that the analysis presented in this report examines labour market outcomes which occurred during a global economic downturn raises the issue that, in the face of such significant market forces, the full benefits of flexicurity policy could not be understood. Furthermore, a more longitudinal analysis of input and outcomes may be appropriate in future.
8.4.2 To what extent have integrated flexicurity policies strengthened employment security?
Key trends in the key employment security indicators show that the extent of employment (as opposed to individual job security) security can be broadly seen as a continuum of relatively high employment security in the Nordic and Continental clusters (high overall employment rate, high female employment rate, low unemployment total and youth unemployment rates, low long-term unemployment rate), middle-level employment security witnessed in Anglo-Saxon (a cluster with also least restrictive Employment Protection legislation) and Eastern European clusters and low level of employment security in the Southern cluster.
Overall, at the cluster level, 3 employment security indicators have improved in the post-2007 period (employment rate, female employment rate, long-term unemployment) and 2 indicators have deteriorated (overall unemployment rate and youth unemployment). This indicates a dispersed development in the employment security dimension.
With regard to the promotion of employment security, there is limited evidence from national research suggesting that the implemented flexicurity measures during the evaluation reference period had a significant impact in this area. This is, at least in part, due to the negative effects of the economic crisis on net labour demand (due to reductions in public spending and job losses in both the public and private sectors). The impact of the crisis has seen a drastic reduction of available job opportunities, the scale of which negated the impact of policy measures taken to strengthen employment security.
8.4.3 To what extent have integrated flexicurity policies facilitated transitions?
In the post-2007 period, highest levels of transitions to more stable employment are witnessed in the Eastern European cluster. On the other end of the scale, the lowest levels of transitions are in the Anglo-Saxon cluster, but here the extent of precarious employment is also one of the lowest. The other clusters – Continental,
Evaluation of flexicurity (2007-2010): final report
141
Southern and Nordic – occupy a somewhat middle ground in terms of the transitions to more stable employment.
Employment transitions have become much more difficult in most of the countries considered, due to the deterioration of the economy and rise of unemployment after 2008. The direct influence of flexicurity policies on the extent of employment transitions is difficult to assess. The impact of introducing and /or strengthening more holistic and integrated policy approaches facilitating employment transitions has been noted in a number of case study countries (Austria, Finland). What is also observed is that in a number of countries the absence of integrated flexicurity approaches is considered to have contributed to low levels of transitions witnessed in the crisis (Estonia, Romania, Spain).
8.4.4 To what extent have integrated flexicurity policies reduced labour market segmentation?
For both periods, at the cluster level, the highest proportions of temporary employment are evident in the Southern cluster, followed closely by the Nordic cluster. Similarly, mid-range proportions are observed in the Continental and Eastern European clusters. The proportion of temporary employment is lowest in the Anglo-Saxon cluster.
There is some change in this indicator pre and post 2007, both at the level of clusters and individual countries. The proportion of temporary employment has increased post-2007, across all clusters except the Eastern European cluster. Significant decreases of temporary employment are observed in Spain and significant increases are observed in Poland, the Netherlands and Portugal (all from already high base figures).
Across both periods, at the cluster level, the highest proportions of involuntary part-time employment as a percentage of all part-time employment are evident in the Southern and Eastern European clusters. The other clusters exhibit similar proportions (around 17-18%) in the post-2007 period. Involuntary part-time employment has grown in the Continental, Southern and Anglo-Saxon clusters, though has fallen slightly in the Nordic cluster and more dramatically in the Eastern European cluster. Significant decreases of involuntary part-time employment are noted in Bulgaria, Lithuania, Latvia and Finland. Significant increases are observed in the Anglo-Saxon cluster (Ireland, UK), Germany, Southern cluster countries (Spain, Italy and Portugal) and in Hungary and Slovakia among the Eastern European countries.
The evidence on the extent to which flexicurity has helped to overcome labour market segmentation in Member States is limited. In countries with a relatively small level of labour market segmentation (Denmark, Finland, Romania, Estonia) relatively few measures have been adopted post 2007, and in general it was considered too early to see their impact reflected in the labour market segmentation indicators due to policy lag effect.
In countries with significant extent of labour market segmentation between insiders (workers on permanent contracts) and outsiders (workers on more precarious contracts) (Spain, Italy, Germany) flexicurity related measures have been adopted and /or intensified. The impacts have been varied. The intensified use of increasing internal flexibility through increased use of short-term work in Germany has increased the employment stability of core workers, while the reverse is true for the peripheral workers. In Spain, the reduction in the number of temporary workers is attributed more towards the economic downturn during which companies first made temporary workers redundant, rather than policy measures attempting to reduce labour market segmentation.
Finally, countries where labour market segmentation affects more specific socio-economic groups (migrants, women) (for example, Austria) have taken measures
Evaluation of flexicurity (2007-2010): final report
142
to address specific problems facing such groups. However, segmentation trends in such countries did not witness substantial improvements.
Overall, the most significant factor impacting on changes to the labour market segmentation trends during the period considered was the economic crisis, rather than the mix of flexicurity measures adopted.
8.5 Flexibility and security: mutually supportive or working in opposition?
Conceptually, the component parts of flexicurity are simple: it comprises two elements - flexibility and security - and the policy measures that support its implementation – active labour market policies, flexible and secure contractual arrangements, modern social security systems and effective lifelong learning strategies.
The analysis presented in this report indicates that flexicurity has evolved into a complex concept / ideology that has moved away from its mutually supportive core principles of flexibility and security. Currently, flexicurity and security appear in opposition, hence, the concerns of the social partners at the onset of the June 2007 Communication have been realised. The crisis has acted as a catalyst to this end, where limited budgets means that the provision of security has been squeezed, while increasing flexibility is pushed through to support competitiveness. The message of the need for a balanced approach appears less evident in many Member States.
Although a number of countries, including Denmark, Austria and Finland, have implemented innovative policies in these areas, other countries which had discussed reforms, or the need for reforms, in these areas did not implement them, or only did so in a limited way. These include Spain, Estonia and Italy (where fundamental changes to the unemployment benefit system that have been discussed have been subsequently scaled back, but then not introduced) and Romania and Hungary (where the weaknesses of adult education and the need to improve skills matching have been high on the policy agenda, but no major policies have been implemented in these areas.)
Those countries which have been able to implement an integrated approach to flexicurity most effectively have relied to a great extent on the adoption of internal flexibility measures. Employers in Germany, Austria and France, have all been encouraged to retain employees with shorter working hours/reduced salaries. This has lessened the social security burden on the state while acting as a mechanism for reducing the risk of increasing unemployment for individuals affected by redundancies. This can be considered as a ‘policy on / policy off’ approach, where the burden of belt-tightening associated with the economic downturn is shared across stakeholders (the employer, the social partners and employees) rather than simply left to the government to pay through the benefits system and for the employee/unemployed individual to suffer as a result of reduced income..
However, the adoption of internal flexibility measures depends on a number of pre-conditions which may not be present in all countries. These include:
(a) The size of companies: in some countries like Italy and to a certain degree Spain, companies are too small to be able to afford these measures (unless there is a mutualised system, such as in Sweden and Italy, where all employers share the costs (of job security councils) ;
(b) Social dialogue: employees and trade unions need to agree to these measures. In countries without a strong tradition of social dialogue, a conflictual relationship between employers and employees can prevent such agreements;
(c) A history or tradition of internal flexibility: in Germany, Austria and France internal flexibility existed prior to 2007 and prior to the economic crisis. Familiarity
Evaluation of flexicurity (2007-2010): final report
143
breeds trust and without this, social partners are unlikely to reach agreements. A key issue, particularly in the French system was retrenchment and an increase in conflictual relations.
(d) The state of the economy: internal flexibility measures need to be adopted before downward economic spiral has progressed too far. They are not an option of last resort. Internal flexibility measures also rely on a relatively rapid return to growth as they can otherwise become unsustainable. It has also been argued that such measures can protect employment in occupations, sectors and companies which are no longer competitive and can stall necessary/natural restructuring and the emergence of new and more competitive sectors and businesses.
▪ The variations in policy approach seen in the case study countries raise the question whether there is a particular optimum combination of flexicurity and security: – Too much bias toward flexibility or security renders problematic outcomes.
The former was seen in Hungary and Romania. The latter (arguably) in Spain and Italy (with flexibility increased but only on the periphery of the labour market).
– However, the precise balance between flexibility and security seems less important than the need for linkages between the four component parts of flexicurity. Increased disillusionment in Denmark seems to stem from social partners protesting against steps taken on the flexibility side without corresponding reforms to security side. However, Denmark already seems to adopt a ‘policy on / policy off’ approach as EPL has been tightened following the crisis.
8.6 Is there a place for flexicurity in current labour market policy making?
Flexicurity is relevant as it provides a holistic framework for labour market policy. However, at present there is some evidence to suggest that the national policy making process in many Member States is being shaped by other factors and is only subsequently ‘retro-fitted’ into the EU’s broad-ranging flexicurity framework. Moreover, the evidence on the extent to which flexicurity has helped to increase monitoring and self-evaluation of public policies in Member States is limited.
A key concern, however, is that flexicurity appears to have lost its way:
▪ The combination of broad concepts, communicated as component parts, common principles, clusters and the choice afforded to Member States to select their own flexicurity pathways means that the flexicurity framework has become unnecessarily complicated. Hence, there is merit in considering whether the flexicurity framework needs to be more specific, target-driven and more easily communicated to its audience.
▪ While the Polish and Estonian case studies demonstrate that flexicurity has acted as a catalyst for social partner engagement, the erosion of social partners’ contributions to decision making is evident elsewhere in Europe.
▪ Some countries (and indeed the European level discussions) demonstrate that a concept itself can become “toxic” to the policy debate and it may therefore be better to communicate the message for a balanced policy approach in different terms.
Evaluation of flexicurity (2007-2010): final report
144
▪ Looking forward, there is merit in ensuring that there is a better grasp of full implications of flexicurity as a balanced of policy approach that is used consistently across all EC communications that acts to cement the understanding of the concept across the Member States. In practical terms, a simplification of the component parts of flexicurity, coupled with simplified common principles, agreement on a limited number of key indicators and a flexicurity OMC can go some way towards cementing understanding of flexicurity and its relevance to policy making.
Evaluation of flexicurity (2007-2010): final report
145
9 Recommendations
Recommendation 1 Bring the debate and lessons from the implementation of flexicurity from a conceptual to practical
The lessons regarding win-win situations resulting from the holistic combination of balanced flexibility and security approaches involving the different components of flexicurity would benefit from being concretised with the use of evaluated practice examples. Our evaluation has shown that, notwithstanding the exceptions of individual countries identified in each cluster, it is however possible to identify that, broadly speaking, clusters which are usually associated with more balanced approaches to flexicurity challenges have been experiencing mostly stable or improving flexicurity outcomes in the climate of stable and/or improving economic performance. In contrast, the clusters of countries which are usually associated with less balanced approaches to have experienced worsening or stable flexicurity outcomes and typically a climate of worsening economic performance. This type of message is worth highlighting and should be underpinned through ongoing assessment and evaluation. Similarly, the types of interesting practice example highlighted as case studies in our research, as well as other policy approaches emphasised as being supportive of positive outcomes are worthy of further dissemination and review.
While it is understood that national practices successfully balancing flexibility and security are not readily transferable (as they are rooted in different policy contexts), they can nonetheless provide important policy lessons for other Member States. This can be achieved in several ways. An effective approach would be through the preparation of detailed case studies, with a representative coverage of practice focussing (but not necessarily exclusively relating to) different components of flexicurity, for example facilitation of employment transitions through improving the job matching process. The presentation of such cases could form the basis of a series of “flexicurity peer reviews” involving a range of stakeholders including ministry representatives, social partners and independent experts.
Such an approach could further the debate on effective approaches without getting lost in the “flexicurity” terminology and could help to remove some of the ideological obstacles surrounding the concept. In presenting the anticipated nine case studies it will be useful to “dejargonise” them to ensure that they are readily communicable to a wider audience. They should also assist in bring together key national stakeholders at the European level to discuss these issues in more practical terms and, crucially, to enhance capacity building in countries to design appropriate pathways to flexicurity and suitable implementation mechanisms to support reforms.
Recommendation 2 Stress balanced approached of policies promoting flexibility and security in labour markets
While very helpful at the conceptual level, the use of the term “flexicurity” has not been entirely helpful in all Member States to foster a meaningful national debate as it is often considered remote from the actual policy design and implementation and can have a polarising effect on stakeholders. It may be more helpful to refer to a balanced approach to policy promoting flexibility and security on the labour market. Although it may appear purely semantic, a greater emphasis on balance can help to restrict approaches which could be considered to focus too prominently either on the flexibility or security aspects of the labour market.
A number of potential suggestions include:
Evaluation of flexicurity (2007-2010): final report
146
▪ Shift the emphasis from flexicurity (which is the outputs / component parts) to ‘mutual responsibility’ which emphasises the process of getting to the outputs. Mutual responsibility is picked up re. managing transitions in the Employment Package, it captures action across stakeholders, provides a means through which social partners are re-engaged and brings in responsibilities for the citizen (which seems key in the internal flexicurity approach). In terms of the macro-economic dimension the term ‘informed choices’ could also be useful. In order to ensure that the dialogue between stakeholders is transparent, then there is a need to ensure that there’s an evidence base to inform decision making.
▪ Another working concept is “dynamic equilibrium”. “Dynamic” provides a link to the labour market and wider economic context (and acknowledges that change happens – which can be positive or negative – e.g. the crisis, technological change, globalisation). “Equilibrium” encapsulates the systems and policy measures that facilitates a return to equilibrium – which again can work both ways in the economic cycle.
It must be noted that, regardless of the tem used, a rebranding of the term “flexicurity” may not alone address some of the misconceptions regarding its usage. Further effort is required in order to establish guidance in balancing flexibility with strengthened employment security, income stabilisation and income security in the application of flexicurity policies
Recommendation 3 Emphasising the link between a balanced approach to flexibility and security and the wider economic policy framework
Our analysis not only indicates the potentially beneficial impact of a balanced approach to flexibility and security and the different pillars of flexibility and security, but also between employment policy and economic policy. Although it remains challenging to establish clear causality between policy and outcome, it is evident that that wider economic and labour market conditions have a critical influence on policy outcomes and greater attention should therefore be paid to the interaction between economic and labour market policy. Although this is highlighted on paper in the processes and outputs of the European semester at EU level, the link is currently less evident in the National Reform Programmes and ought to be emphasised further.
Recommendation 4 Make better use of the Open Method of Co-ordination to emphasise flexicurity related policy recommendations
In order to support Recommendation 1, consideration of further use of the instruments of the OMC to demonstrate balanced and successful flexicurity approaches and their impact on assisting countries to deal with the impact of the economic crisis should be considered. The available processes of mutual learning could be activated to follow up on any relevant Country Specific Recommendations and provide policy inspiration to countries where a balanced approach is currently less evident. This could also serve to demonstrate the potential win-win of strong economic and labour market policy co-ordination.
Recommendation 5 Demonstrate the added value of the strong involvement of social partners
Evaluation of flexicurity (2007-2010): final report
147
Our report has clearly highlighted the positive role played by social partner organisations in working towards a suitable, balanced flexicurity approach at Member State level. Despite the strong emphasis placed on social partner involvement by the Council in its recommendations, our review has shown that this currently remains far from being a reality in many countries. Further action is therefore required at Member State level to foster and achieve this greater involvement, including through capacity building as well as the establishment of suitable avenues for interaction.
Recommendation 6 More “telling” and monitoring of indicators
Significant work has been carried out to define key indicators which reflect the impact of policy and practice in relation to flexicurity. This work is very helpful to develop a more academic and long-term perspective of outcomes. However, the detailed and complex nature of such processes means that key messages can easily get lost.
Efforts could therefore be undertaken to select the most “telling” indicators to be monitored more regularly to provide assessment of the key policies and their impact on labour market outcomes. In some fields, this may require a European level analysis of policy outcomes. A dialogue process for European labour market research is in place through the European Research Dialogue process which could be utilised to support such efforts. As well, an indicators handbook that updates the publication ‘Monitoring and analysis of Flexicurity polices’ could usefully help key stakeholders interpret data and indicators and help them use the results to inform future practice.
In the next version of the final report, more policy based recommendations linked to the key evaluation questions and the recommendations of the Employment Package will be added. For example:
▪ Commission to assist in developing national pathways and job plans;
▪ Country specific recommendations can be used to highlight imbalances in flexicurity approaches;
▪ Improvement of benchmarking systems and scoreboards (also monitored through Country specific recommendations);
▪ Emphasise if results show that better balance between flexibility and security and mix of measures in the 4 pillars produces better labour market outcomes;
▪ Comment (if possible) on impact of different governance arrangements and social partner involvement – also how this could be improved at European level.
Evaluation of flexicurity (2007-2010): final report
148
ANNEXES The following annexes are provided separately to the report.
▪ Annex 1 – interesting practice examples from the 12 case study countries,
▪ Annex 2 – the analysis of NRPs,
▪ Annex 3 – methodological description of statistical analysis.
▪ Annex 4 – full data analysis results with macro-economic and flexicurity scoreboards for 27 EU Member States.
▪ Annex 5 – summary table of the key trends observed in the macro-economic and flexicurity scoreboards of 27 EU Member States.
1
Evaluation of flexicurity 2007-2010: Final Report
Annexes 1-3 Annex 1 Interesting practice fiches ....................................................................... 2
Annex 2 NRP analysis............................................................................................ 17
Annex 3 Full analysis of labour market trends .................................................... 23

2
Annex 1 Interesting practice fiches
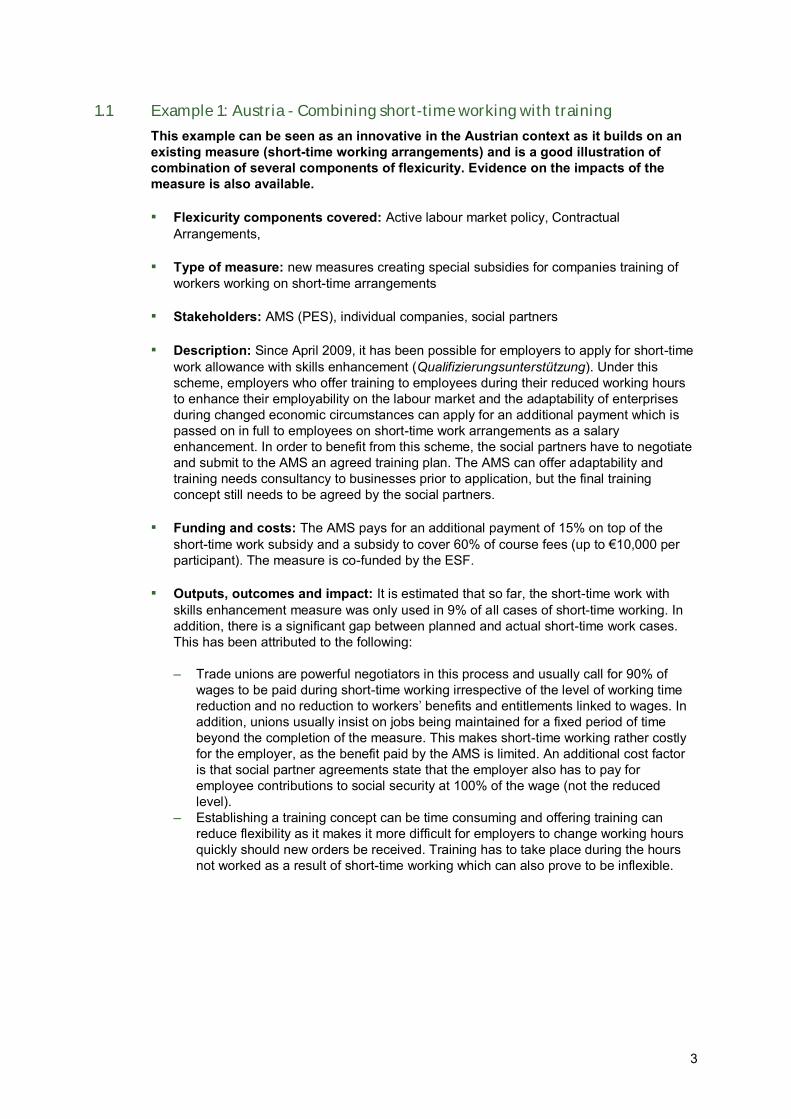
3
1.1 Example 1: Austria - Combining short-time working with training
This example can be seen as an innovative in the Austrian context as it builds on an existing measure (short-time working arrangements) and is a good illustration of combination of several components of flexicurity. Evidence on the impacts of the measure is also available. ▪ Flexicurity components covered: Active labour market policy, Contractual
Arrangements,
▪ Type of measure: new measures creating special subsidies for companies training of workers working on short-time arrangements
▪ Stakeholders: AMS (PES), individual companies, social partners
▪ Description: Since April 2009, it has been possible for employers to apply for short-time
work allowance with skills enhancement (Qualifizierungsunterstützung). Under this scheme, employers who offer training to employees during their reduced working hours to enhance their employability on the labour market and the adaptability of enterprises during changed economic circumstances can apply for an additional payment which is passed on in full to employees on short-time work arrangements as a salary enhancement. In order to benefit from this scheme, the social partners have to negotiate and submit to the AMS an agreed training plan. The AMS can offer adaptability and training needs consultancy to businesses prior to application, but the final training concept still needs to be agreed by the social partners.
▪ Funding and costs: The AMS pays for an additional payment of 15% on top of the short-time work subsidy and a subsidy to cover 60% of course fees (up to €10,000 per participant). The measure is co-funded by the ESF.
▪ Outputs, outcomes and impact: It is estimated that so far, the short-time work with
skills enhancement measure was only used in 9% of all cases of short-time working. In addition, there is a significant gap between planned and actual short-time work cases. This has been attributed to the following:
– Trade unions are powerful negotiators in this process and usually call for 90% of
wages to be paid during short-time working irrespective of the level of working time reduction and no reduction to workers’ benefits and entitlements linked to wages. In addition, unions usually insist on jobs being maintained for a fixed period of time beyond the completion of the measure. This makes short-time working rather costly for the employer, as the benefit paid by the AMS is limited. An additional cost factor is that social partner agreements state that the employer also has to pay for employee contributions to social security at 100% of the wage (not the reduced level).
– Establishing a training concept can be time consuming and offering training can reduce flexibility as it makes it more difficult for employers to change working hours quickly should new orders be received. Training has to take place during the hours not worked as a result of short-time working which can also prove to be inflexible.
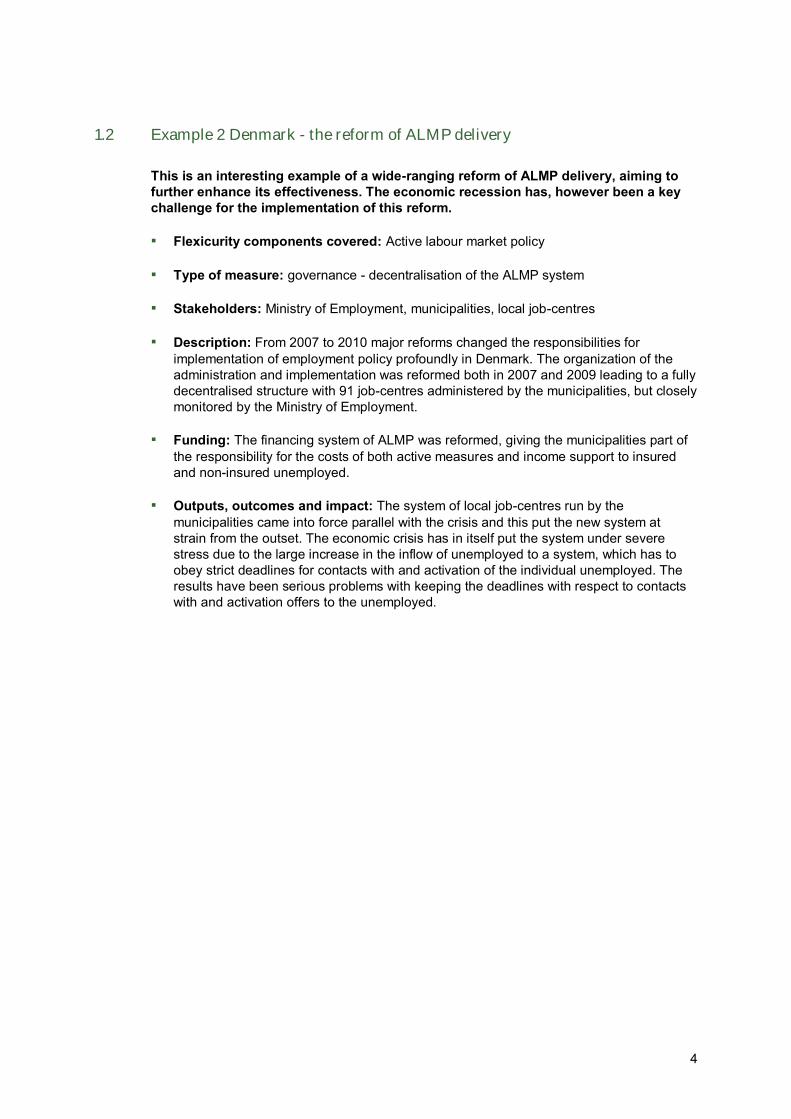
4
1.2 Example 2 Denmark - the reform of ALMP delivery
This is an interesting example of a wide-ranging reform of ALMP delivery, aiming to further enhance its effectiveness. The economic recession has, however been a key challenge for the implementation of this reform.
▪ Flexicurity components covered: Active labour market policy
▪ Type of measure: governance - decentralisation of the ALMP system
▪ Stakeholders: Ministry of Employment, municipalities, local job-centres
▪ Description: From 2007 to 2010 major reforms changed the responsibilities for
implementation of employment policy profoundly in Denmark. The organization of the administration and implementation was reformed both in 2007 and 2009 leading to a fully decentralised structure with 91 job-centres administered by the municipalities, but closely monitored by the Ministry of Employment.
▪ Funding: The financing system of ALMP was reformed, giving the municipalities part of the responsibility for the costs of both active measures and income support to insured and non-insured unemployed.
▪ Outputs, outcomes and impact: The system of local job-centres run by the municipalities came into force parallel with the crisis and this put the new system at strain from the outset. The economic crisis has in itself put the system under severe stress due to the large increase in the inflow of unemployed to a system, which has to obey strict deadlines for contacts with and activation of the individual unemployed. The results have been serious problems with keeping the deadlines with respect to contacts with and activation offers to the unemployed.
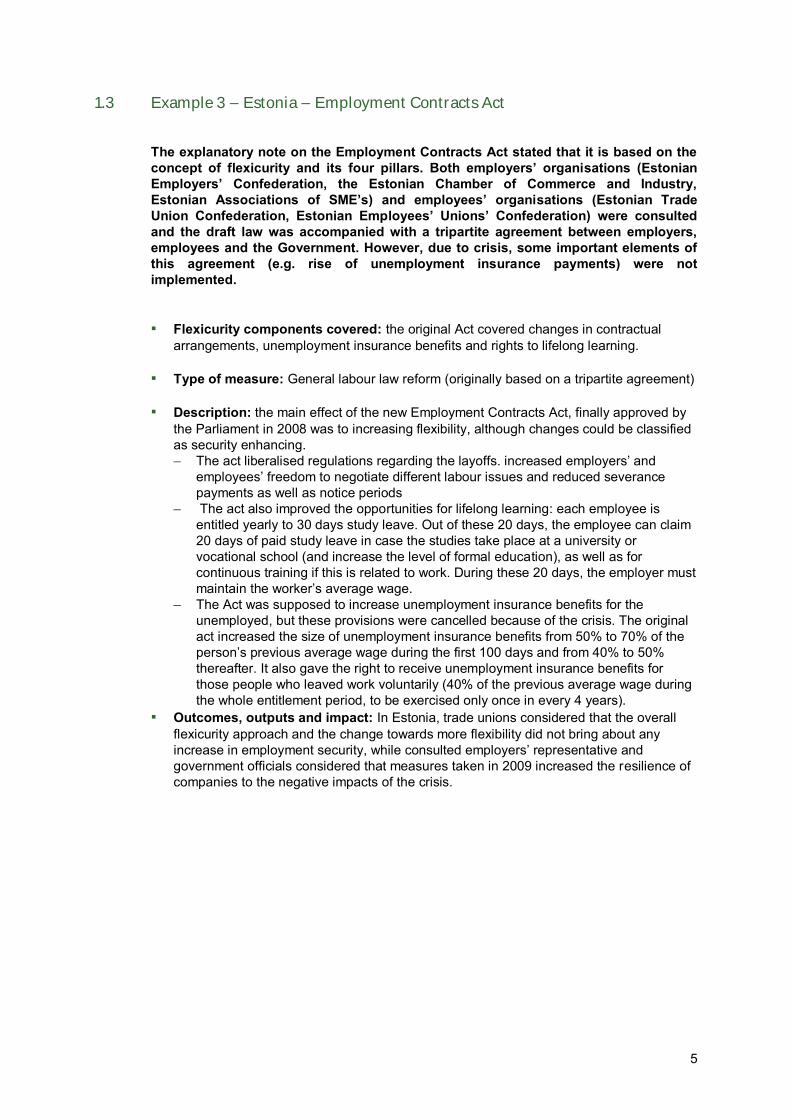
5
1.3 Example 3 – Estonia – Employment Contracts Act
The explanatory note on the Employment Contracts Act stated that it is based on the concept of flexicurity and its four pillars. Both employers’ organisations (Estonian Employers’ Confederation, the Estonian Chamber of Commerce and Industry, Estonian Associations of SME’s) and employees’ organisations (Estonian Trade Union Confederation, Estonian Employees’ Unions’ Confederation) were consulted and the draft law was accompanied with a tripartite agreement between employers, employees and the Government. However, due to crisis, some important elements of this agreement (e.g. rise of unemployment insurance payments) were not implemented.
▪ Flexicurity components covered: the original Act covered changes in contractual arrangements, unemployment insurance benefits and rights to lifelong learning.
▪ Type of measure: General labour law reform (originally based on a tripartite agreement)
▪ Description: the main effect of the new Employment Contracts Act, finally approved by the Parliament in 2008 was to increasing flexibility, although changes could be classified as security enhancing. – The act liberalised regulations regarding the layoffs. increased employers’ and
employees’ freedom to negotiate different labour issues and reduced severance payments as well as notice periods
– The act also improved the opportunities for lifelong learning: each employee is entitled yearly to 30 days study leave. Out of these 20 days, the employee can claim 20 days of paid study leave in case the studies take place at a university or vocational school (and increase the level of formal education), as well as for continuous training if this is related to work. During these 20 days, the employer must maintain the worker’s average wage.
– The Act was supposed to increase unemployment insurance benefits for the unemployed, but these provisions were cancelled because of the crisis. The original act increased the size of unemployment insurance benefits from 50% to 70% of the person’s previous average wage during the first 100 days and from 40% to 50% thereafter. It also gave the right to receive unemployment insurance benefits for those people who leaved work voluntarily (40% of the previous average wage during the whole entitlement period, to be exercised only once in every 4 years).
▪ Outcomes, outputs and impact: In Estonia, trade unions considered that the overall flexicurity approach and the change towards more flexibility did not bring about any increase in employment security, while consulted employers’ representative and government officials considered that measures taken in 2009 increased the resilience of companies to the negative impacts of the crisis.
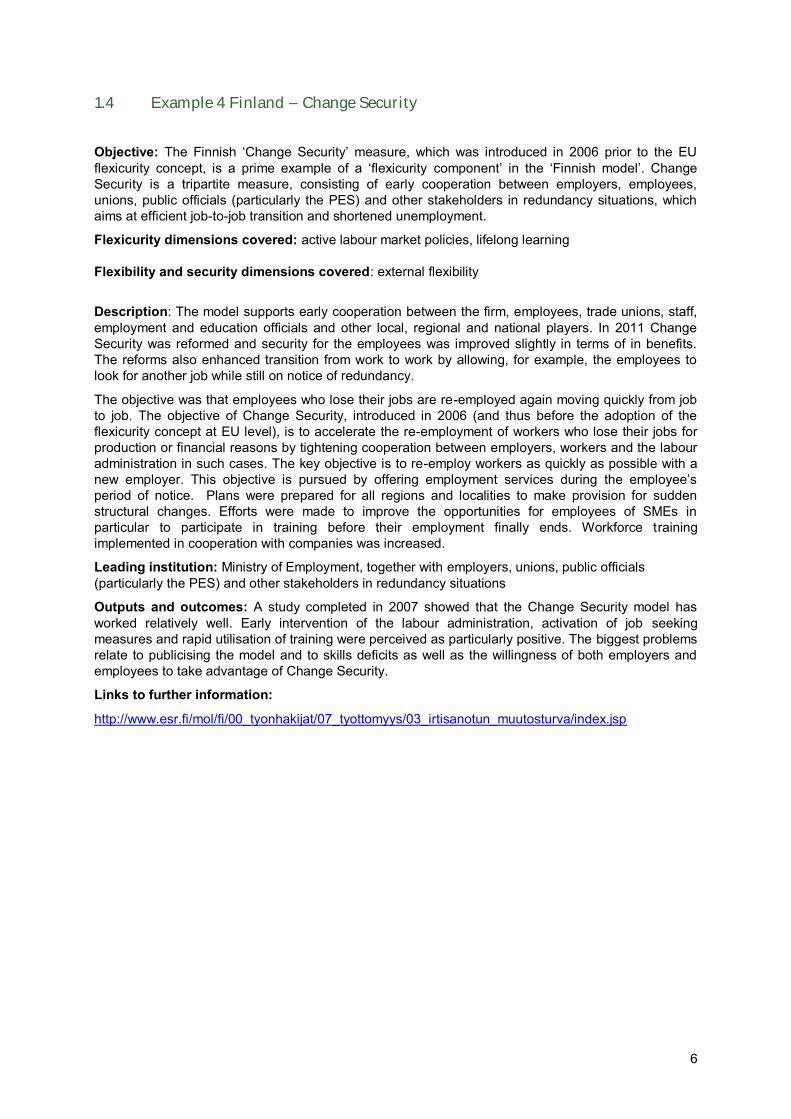
6
1.4 Example 4 Finland – Change Security
Objective: The Finnish ‘Change Security’ measure, which was introduced in 2006 prior to the EU flexicurity concept, is a prime example of a ‘flexicurity component’ in the ‘Finnish model’. Change Security is a tripartite measure, consisting of early cooperation between employers, employees, unions, public officials (particularly the PES) and other stakeholders in redundancy situations, which aims at efficient job-to-job transition and shortened unemployment.
Flexicurity dimensions covered: active labour market policies, lifelong learning
Flexibility and security dimensions covered: external flexibility
Description: The model supports early cooperation between the firm, employees, trade unions, staff, employment and education officials and other local, regional and national players. In 2011 Change Security was reformed and security for the employees was improved slightly in terms of in benefits. The reforms also enhanced transition from work to work by allowing, for example, the employees to look for another job while still on notice of redundancy.
The objective was that employees who lose their jobs are re-employed again moving quickly from job to job. The objective of Change Security, introduced in 2006 (and thus before the adoption of the flexicurity concept at EU level), is to accelerate the re-employment of workers who lose their jobs for production or financial reasons by tightening cooperation between employers, workers and the labour administration in such cases. The key objective is to re-employ workers as quickly as possible with a new employer. This objective is pursued by offering employment services during the employee’s period of notice. Plans were prepared for all regions and localities to make provision for sudden structural changes. Efforts were made to improve the opportunities for employees of SMEs in particular to participate in training before their employment finally ends. Workforce training implemented in cooperation with companies was increased.
Leading institution: Ministry of Employment, together with employers, unions, public officials (particularly the PES) and other stakeholders in redundancy situations
Outputs and outcomes: A study completed in 2007 showed that the Change Security model has worked relatively well. Early intervention of the labour administration, activation of job seeking measures and rapid utilisation of training were perceived as particularly positive. The biggest problems relate to publicising the model and to skills deficits as well as the willingness of both employers and employees to take advantage of Change Security.
Links to further information:
http://www.esr.fi/mol/fi/00_tyonhakijat/07_tyottomyys/03_irtisanotun_muutosturva/index.jsp
7
1.5 Example 5 - France – 2008 inter-sectoral agreement on modernisation of labour market
The national intersectoral agreement on the modernisation of the labour market signed on 11 January 2008 represented a significant achievement as it covered, unlike most previous intersectoral agreements, different policy areas. The agreement was labelled by some as the first illustration of flexicurity “a la francaise’.
Objective: The agreement had two objectives, both calling for interventions in different fields/flexicurity components:
▪ To facilitate hiring and improving career pathways (with respect to contractual arrangements, vocational guidance, labour market entry of young people, continuous training and skills development, geographical mobility, the anticipation of employment or skill needs at company level);
▪ To make contracts more secure and improve transitions back to employment (with respect to contractual arrangements, access to training of employees and jobseekers, unemployment benefits and ALMP).
Description: in the areas mentioned above, the agreement lays down a number of general principles (for example, it states that the open-ended contract should remain the main form of employment relationship), provides suggestions and indicates when further intersectoral negotiation should take place. One of the areas covered by the January 2008 intersectoral agreement was the reform of vocational training. The agreement introduced the principle of the transferability of the individual right to training (Droit individual a la formation, DIF) between contracts and under certain conditions (e.g. a right to training acquired under a previous contract can only be exercised during the first two years of the contract). The national intersectoral agreement on modernising the labour market of 11 January 2008 was signed by four trade unions (CFDT, CFE-CGC, CFTC and CGT-FO1) and by three employers’ organisations (MEDEF, CGPME and UPA2). Results and outcomes: The national intersectoral agreement of 11 January 2008 was regarded by all main trade unions except CGT (which did not sign it) as progress towards making career paths more secure. While this agreement could have marked a first step towards an integrated approach of flexicurity, it is important to note that the 2008 law on the modernisation of the labour market only transposed the parts of the above mentioned agreement relating to contractual arrangements. The law n° 2008-596 of 25 June 2008 on the modernisation of the labour market (transposing in law some of the clauses of the national intersectoral agreement of 11 January 2008) has introduced the following provisions: ▪ A new type of ‘negotiated’ termination of the employment contract based on mutual
agreement between the employer and the employee and under the control of local administrative authorities (Direction Départementale du travail, de l’emploi et de la formation professionnelle). This new type of termination of contract is a based on a mutual agreement between the employer and employee and can be used as alternative to a lay-off or to a resignation.
▪ A new type of fixed-term contract for a specific purpose (contrat de mission): the duration of the employment relationship is not specified in the contract, the contract ends when the specific task is achieved).
1 CFDT: Confédération française démocratique du travail, CFE-CGC : Confédération française de l'encadrement - Confédération générale des cadres, CFTC : Confédération Française des Travailleurs Chrétiens, CGT-FO : Confédération Générale du Travail Force Ouvrière 2 MEDEF: Mouvement des entreprises de France, CGPME : Confédération générale du patronat des petites et moyennes enterprises, UPA: Union Professionnelle Artisanale

8
After the January 2008 agreement, social dialogue has tended to come back to a more traditional “silo approach” where different negotiation processes focusing on specific topics in parallel (the third section of the agreement on the role of collective bargaining planned indeed that further negotiations at the intersectoral and sectoral level should take place regarding different points mentioned in the agreement).
Further information:
http://www.eurofound.europa.eu/eiro/2008/02/articles/fr0802049i.htm
9
1.6 Example 6 - Germany – short-term work and flexible working arrangement schemes
In Germany, short-time work (Kurzarbeit) has been a widely used and successful instrument to cope with the negative labour demand effects of the crisis. The scheme is relatively more generous in Germany compared with other countries. Objective: to respond to changes in economic demand by reducing the number of working hours coupled with the respective reduction of the pay without instigating formal redundancies in the enterprise Flexicurity dimensions covered: contractual arrangements, social security, lifelong learning, active labour markets policies Flexibility and security dimensions covered: internal flexibility Description: Short-time work was only one element of working-time flexibilisation. Flexible working-time arrangement schemes – negotiated between the social partners - were even more important. About 1/3 of adjustments occurred through the short-time work scheme and another 2/3 through flexible working-time schemes (Voss et al., 2011 and interview with the external expert). There is a broad consensus between the social partners on strategies to achieve internal flexibilisation and the collective bargaining of working-time flexibilisation is an important element of the German model. Short-time work was in some cases also combined with training measures. In this respect two objectives could be met: improving employment security as well as promoting lifelong learning.
Leading institution: ministry of employment, social partners
Outputs and outcomes: In June 2009, 1.4 million workers were on short-time work with an average reduction of working time by one third. Together with flexible working time arrangements, the volume of hours worked could be reduced by 5% (Vogler-Ludwig, Post-assessment of NRP 2009). The reasons for pursuing this strategy were the following: ▪ The high costs of redundancy payments, and later recruitment and retraining of workers,
when the next economic upswing happens. Therefore, companies preferred to keep their staff, even if they had to bear one-fourth to one-third of the labour costs for the omitted working hours.
▪ Companies experienced skills shortages between 2005 and 2008 and so were reluctant to dismiss their skilled workforce.
▪ Companies may have been able to compensate the costs of short-time work by increasing labour productivity during the shorter working hours.
Links to further information:
The IAB in Germany published a number of papers about Kurzarbeit on various issues including cost sharing between government and employers, the use of Kurzarbeit in different sectors, and the actual reduction in working hours due to Kurzarbeit. An overview of the performance of STWA in France, Germany and Austria is provided by Frenzel/Wilthagen (2010).
10
1.7 Example 7 – Hungary – Initiative to activate disabled workers
One of the most serious labour market problems of Hungary is the situation of disabled workers. Apart from the decline in labour demand, the employment prospects of disabled people have been largely determined by rehabilitation benefits and pensions. The lenient pension policy introduced in order to forestall social discontent at the time of the regime change led to social insurance institutions easily granting early pensions to workers facing insecure prospects of employment. As a result, the number of people under retirement age in receipt of disability pensions rose from 233,000 in 1990 to 352,000 by 1996 and doubled by 2003 (Scharle, 2011). The recent initiative of the Orbán government to activate disabled workers aims to improve the situation by reducing disincentives in the benefit system and encouraging labour demand. The new benefit regulation was adopted by Parliament on the 20 th of December 2011 and came into force on the 1st of January 2012 (Act CXCI, 2011, hereinafter: the Act).
Description The Act can be considered a bold move, since it affects all benefit recipients, rather than only new claimants, as has been the case in most of the reforms in the EU. The new rules are intended to simplify the system of financial provision available to disabled workers and also to stimulate their employment. In order to achieve this, the law merges the various benefit types (more than six different forms) into two main provisions: the rehabilitation allowance for those capable of re-entering the labour market after rehabilitation, and the disability benefit, for those unable to regain their work capacity even after rehabilitation (or if this proves to be too costly). Those falling in the first category are bound to cooperate with special agencies named Rehabilitation Agencies (hereafter referred to as RA), formed on the basis of the earlier special teams of the Public Employment Services,. The recipients of the rehabilitation allowance must participate in trainings or any other rehabilitation services the RA may provide, as well as accepting the job offers by the RA, including public works. The employment of disabled workers is stimulated by the introduction of the sc. rehabilitation card, which entitles the employer to a 27% tax benefit. According to plans the full amount of the subsidy is to be awarded in the first year of employment, 90% in the second year and 80% in the third, which could lead to early dismissals of the disabled workers.
Flexicurity dimensions covered
The new rules may promote lifelong learning by improving access to training programmes for disabled workers. The budget and detailed implementation of this is not yet specified.
The Act improves the efficiency of ALMPs by widening the coverage of ALMP measures (as a consequence of tightening access to disability pension) and strengthening the job search criteria for rehabilitation benefits.
As for the provision of social welfare, the impact of the Act is mixed. While it maintains the provision of income support for those unable to work, the level of the rehabilitation allowance is in some cases even lower than the unemployment benefit. This may not be adequate given that the cost of living tends to be higher for disabled workers compared to able-bodied workers.
The Act does not affect employment protection legislation.
Flexibility and security dimensions covered
The Act promotes flexibility by encouraging the labour force participation of disabled persons and by tightening access to pensions, which typically lead to permanent withdrawal from the labour market. The fact however that the amount of rehabilitation allowance is considerably lower than the disability pension maintains the incentive for workers to seek early retirement. Further, if employed the worker is not entitled to the allowance any longer, which results in a kind of benefit-trap where the worker may prefer the steady and secure rehabilitation allowance to a relatively badly paid and insecure job opportunity.
The security dimension of the reform is somewhat weaker. First, the level of the rehabilitation allowance is very low for some groups (those with a minor loss of work capacity). Second, although the new law acknowledged the need for improving the provision of training programmes and rehabilitation services, it does not specify the resources made available for this, nor the measures that would assure the quality of such services. This may lead to a situation where many people lose their
11
benefits, or have inadequate financial support but without any improvement in their chances of getting a job.
Leading institution
Implementation falls under the competence of specially formed Rehabilitation Agencies. It is the duty of the RAs to ensure rehabilitation services and the access to public employment opportunities. To this end the RAs are to cooperate with the PES offices, employers, recruitment organizations and organizations working in the field of rehabilitation of disabled workers. It is also the duty of the RAs to mediate between the workers and employers.
However there are considerably fewer RAs in Hungary than National Employment Offices (22 RAs on a county level vs. 180 NEOs on small regions level) which is likely to constrain access to their services.
Costs and who pays
The measures are expected to yield some savings to the central budget but some of that may need to be spent on improving the provision of rehabilitation services. The government has not published any detailed plans on this.
Outputs and outcomes Since the reform is rather new and not all its aspects are fully elaborated, outcomes cannot be assessed yet. Given the current low employment rate of disabled people and their low education level, the success of the reform crucially depends on the effect of labour demand incentives and the improvement of rehabilitation services.
Further information
Act N.CXCI on social provisions for disabled persons and the amendment of various laws (A megváltozott munkaképességű személyek ellátásairól és egyes törvények módosításáról szóló 2011. évi CXCI. törvény). http://net.jogtar.hu/jr/gen/getdoc2.cgi?dbnum=1&docid=A1100191.TV
Scharle, A. 2011. The efficiency of employment rehabilitation schemes in Hungary. Budapest Institute. http://www.budapestinstitute.eu/consultancy/prj/The_efficiency_of_employment_rehabilitation_schemes_in_Hungary
12
1.8 Example 8 Italy – Interprofessional Funds for Continuing Training
Objective: Interprofessional Funds are promoted by the social partners in order to enhance continuous training among the workers in a specific sector. The Funds are directly funded by employers and employees. Flexicurity dimensions covered: lifelong learning Flexibility and security dimensions covered: human capital formation Description: the most important Interprofessional Funds are listed below: ▪ FondoImpresa. Established in 2001 through an agreement between the biggest
employers’ and employees’ unions, it is the most important Interprofessional Fund in Italy The Fund aims at financing vocational training at company, sector or territorial level in order to enhance both the competitiveness of companies and to develop employee skills in order to meet employability and adaptability needs. When the crisis hit, Fondimpresa extended its activities and sectors. According to one interviewee, the original scope of this Fund was to support the innovation processes through specific training; however this scope has been considerably extended during the crisis.
▪ Other important Interprofessional Funds are: For.Te (http://www.fondoforte.it) , Fon.Ter
(http://www.fonter.it), Fondoprofessioni (http://www.fondoprofessioni.it), Fon.Coop (http://www.foncoop.coop), Fondir (http://www.foncoop.coop)
Leading institution: sectoral social partners
Costs and who pays: The Funds are directly funded by employers and employees.
Outputs and outcomes: The Fund aims at financing vocational training at company, sector or territorial level in order to enhance both the competitiveness of companies and to develop employee skills in order to meet employability and adaptability needs.
The results of the Fund’s activities are available at the individual Fund level. FondoImpresa had, at the end of 2011, over 100,000 employing 3.8 million workers registered to the Fund.
Links to further information:
http://www.fondimpresa.it/Home/index.html
▪ For.Te (http://www.fondoforte.it) ▪ Fon.Ter (http://www.fonter.it) ▪ Fondoprofessioni (http://www.fondoprofessioni.it) ▪ Fon.Coop (http://www.foncoop.coop) ▪ Fondir (http://www.foncoop.coop)
13
1.9 Example 9 – Poland – 2009 anti-crisis package
The anti-crisis package in Poland is an example of a mix of measures covering several components of flexicurity. Another reason why this is an important development in the national context is that the Act introducing the package of measures was the result of bilateral negotiations. The negotiations of the package clearly showed the need in Poland to discuss provisions for tools to tie work organization, working time and salary to the enterprise economic situation; the final content of the reform did not however include all proposals formulated by social partners. ▪ Flexicurity components covered: Contractual Arrangements (flexible work
arrangements and flexible employment contracts). Social Security, Lifelong learning
▪ Type of measure: general package of measures (partly based on the content of an agreement signed by the Polish social partners)
▪ Description: On 13 March 2009, an agreement on the so called anti-crisis package
signed by social partners. The document included 13 propositions in areas of wages and social benefits, labour market and industrial relations and economic policy and included both proposals for changes in the Labour Code and in fiscal regulation. Eight out of thirteen propositions were included in the draft act adopted by the government at the beginning of June 2009. After a debate held in the Tripartite Commission for Socio-Economic Affairs and social consultations process, some additional changes were introduced and finally the act was passed on the 1st July 2009 to become operational at the end of August 2009. Measures available to all employers were the following: introducing provisions for flexible working time arrangements, amendments on rules for signing fixed-term contracts, annual calculation of working hours and some tax exemptions. Some measures are addressed specially to employers facing temporary financial difficulties: introducing the possibility to production suspension, introducing a reduced working time scheme, subsidies to cover social contributions of enterprises, granting ESF funding for training and retraining of workers and postponing due payments (i.e. to the Guaranteed Employee Benefits Fund, Fundusz Gwarantowanych Świadczeo Pracowniczych, FGŚP).
▪ Outcomes, outputs and impact: Despite the fact that there were only 634 enterprises-beneficiaries till mid-2010, the anti-crisis package seems to be an important development.
14
1.10 Example 10 Romania – encouraging formal employment for daily labourers
Objective: to create a novel and simple legal framework that allows for the employment of daily labourers at low cost for employers and without having to resort to informal arrangements for the employee.
Starting in the summer of 2011, this measure allows for the employment of daily labourers on a quasi-contractual basis, with special registration and no social contribution levy on the incomes earned. The daily labourers cannot be hired however by an employer for more than 60 days continuously. Income taxation of 16% (Romania’s flat rate) nevertheless applies. This truly counts as innovative practice as it eases and formalises the hiring and firing of a category of workers who otherwise were at the mercy of the underground economy. It is interesting to note that income taxation is applied via the simple purchase of a tax/duty stamp which is subsequently applied by the employer into the individual booklet of the daily labourer (a standardised document issued by labour inspectorates).
Flexicurity dimensions covered: Contractual Arrangements & Modern social security systems.
Flexibility and security dimensions covered: Numerical flexibility (external), Labour cost/wage flexibility
Description: Employers are encouraged to hire daily labourers for no more than 60 days continuously. Taxation is applied via the purchase of a simple stamp duty applied into the (standard format) booklet of the daily labourer. The employer is to keep a special register for the purpose subject to regular review by the labour inspectors. Social security contributions are not levied automatically on the payroll of the employer hiring daily labourers but the latter are welcome to contribute voluntarily to any of the mandatory social security schemes.
Leading institution: The Ministry of Labour via the Labour Inspection and its territorial inspectorates.
Costs and who pays: costs are minimal but they have not been assessed.
Outputs and outcomes: higher number of workers in the formal sector, effective, practical prevention of undeclared work and a marginal increase in tax revenue (not yet assessed).
Links to further information: www.inspectiamuncii.ro.
15
1.11 Example 11 – Spain – 2010 labour market reform
The 2010 labour market reform is the most significant measure taken in Spain 2006 with the explicit aim of reducing labour market segmentation since; in addition to introducing some changes in terms of contractual arrangements (including measures to increase the internal flexibility of companies), it also included some measures in the field of ALMP. The reform was however, not favourably welcomed by social partners (a negotiation process took place but was unsuccessful). ▪ Flexicurity components covered: Contractual arrangements (flexible work
arrangements and atypical contracts), Active Labour Market Policies
▪ Type of measure: Reform of labour law and legislation on the labour market relocation service
▪ Description: The content of the Royal Decree-Law 10/2010 of 16 June 2010 on
emergency measures to reform the labour market was approved as a law with minor modifications by the Spanish parliament in September 2010 (Law 35/2010 of 17 September). The law included different sets of measures.
– Measures to reduce temporality on the labour market (Chapter I)
◦ Some measures were retaken relative to fixed-term contracts: gradual increase of firing costs for the employers (up 12 days’ wages instead of 8), to make it comparable with firing costs for open-ended contracts, definition of a maximum length of three years for some types of contracts (contratos por obra o servicio determinado), renewable for 12 months once according to the sectoral collective agreement
◦ In the case of open-ended contracts, the law clarifies the technical, organisational, or productive reasons that would justify collective or individual dismissals and broadens the conditions under which a dismissal can be justified under economic reasons and objective reasons. The notice period of dismissal for objective reasons is reduced from 30 to 15 days and the employer pays 20 (instead of 45) days’ wages of severance pay per year of seniority.
◦ In case of economic dismissals between 18 June 2010 until 31 December 2012, 8 days’ wages per year of seniority are paid by the Salary Guarantee Fund, FOGASA Fondo de Garantia Salarial) instead of the employer.
◦ For special contracts to promote permanent employment, criteria of application are extended to cover new group of beneficiaries;
– Measures to strengthen negotiated internal flexibility in companies and promote temporary reduction of working hours as an adjustment mechanism (Chapter II).
– Measures to promote the employment of young people and of the unemployed (Chapter III): social security rebates for hiring workers under open-ended contracts, for training contracts for unemployed persons and for hiring interns/trainees.
– Measures to improve labour market relocation service (Chapter IV): the reform regulated the role of relocation agencies (private or public bodies which offer labour market relocation services either in cooperation with public employment services or independently.
▪ Outcomes, outputs and impact: The impact of the reform has not been fully assessed
yet but the labour market situation in Spain has continued to deteriorate in the context of the recession. According to the information collected from Ministry representatives, an initial assessment conducted in October 2011 suggested that both costs and impacts of hiring incentives regulated by the 2010 labour market reform (Chapter III) and later on by the emergency measures of February 2011 were not substantial; such incentives have most frequently been used by smaller companies.
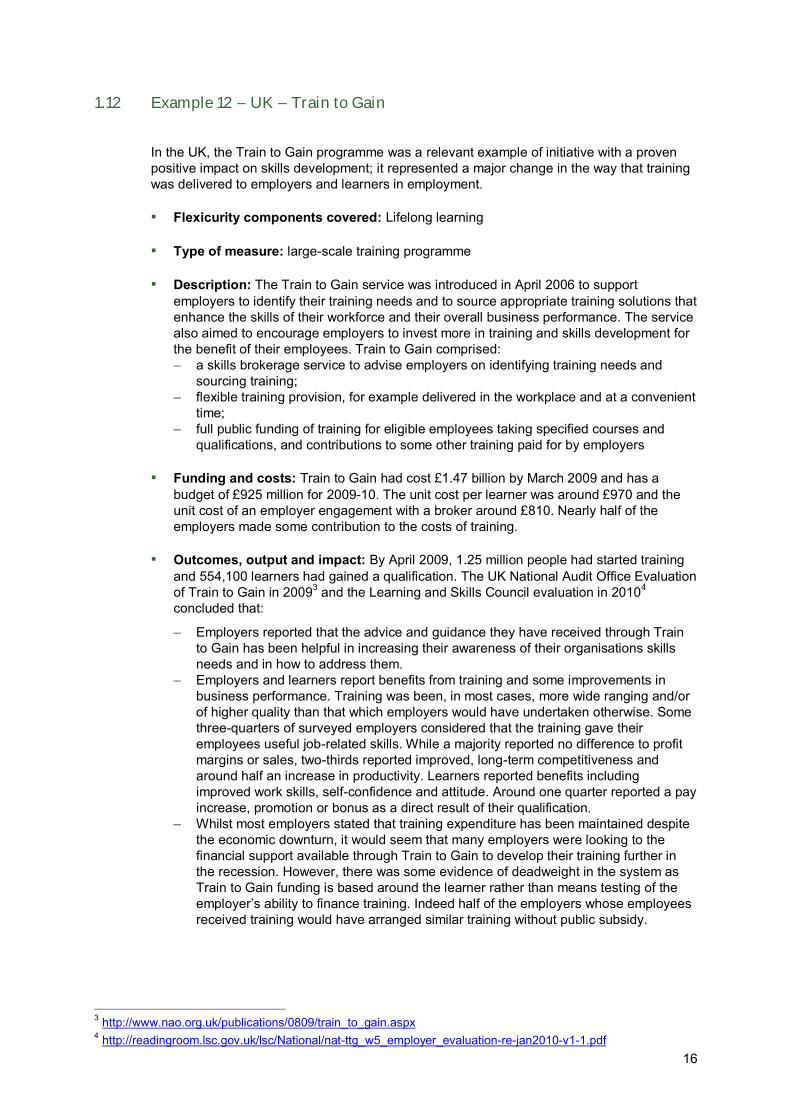
16
1.12 Example 12 – UK – Train to Gain
In the UK, the Train to Gain programme was a relevant example of initiative with a proven positive impact on skills development; it represented a major change in the way that training was delivered to employers and learners in employment. ▪ Flexicurity components covered: Lifelong learning
▪ Type of measure: large-scale training programme ▪ Description: The Train to Gain service was introduced in April 2006 to support
employers to identify their training needs and to source appropriate training solutions that enhance the skills of their workforce and their overall business performance. The service also aimed to encourage employers to invest more in training and skills development for the benefit of their employees. Train to Gain comprised: – a skills brokerage service to advise employers on identifying training needs and
sourcing training; – flexible training provision, for example delivered in the workplace and at a convenient
time; – full public funding of training for eligible employees taking specified courses and
qualifications, and contributions to some other training paid for by employers
▪ Funding and costs: Train to Gain had cost £1.47 billion by March 2009 and has a budget of £925 million for 2009-10. The unit cost per learner was around £970 and the unit cost of an employer engagement with a broker around £810. Nearly half of the employers made some contribution to the costs of training.
▪ Outcomes, output and impact: By April 2009, 1.25 million people had started training
and 554,100 learners had gained a qualification. The UK National Audit Office Evaluation of Train to Gain in 20093 and the Learning and Skills Council evaluation in 20104 concluded that:
– Employers reported that the advice and guidance they have received through Train to Gain has been helpful in increasing their awareness of their organisations skills needs and in how to address them.
– Employers and learners report benefits from training and some improvements in business performance. Training was been, in most cases, more wide ranging and/or of higher quality than that which employers would have undertaken otherwise. Some three-quarters of surveyed employers considered that the training gave their employees useful job-related skills. While a majority reported no difference to profit margins or sales, two-thirds reported improved, long-term competitiveness and around half an increase in productivity. Learners reported benefits including improved work skills, self-confidence and attitude. Around one quarter reported a pay increase, promotion or bonus as a direct result of their qualification.
– Whilst most employers stated that training expenditure has been maintained despite the economic downturn, it would seem that many employers were looking to the financial support available through Train to Gain to develop their training further in the recession. However, there was some evidence of deadweight in the system as Train to Gain funding is based around the learner rather than means testing of the employer’s ability to finance training. Indeed half of the employers whose employees received training would have arranged similar training without public subsidy.
3 http://www.nao.org.uk/publications/0809/train_to_gain.aspx 4 http://readingroom.lsc.gov.uk/lsc/National/nat-ttg_w5_employer_evaluation-re-jan2010-v1-1.pdf
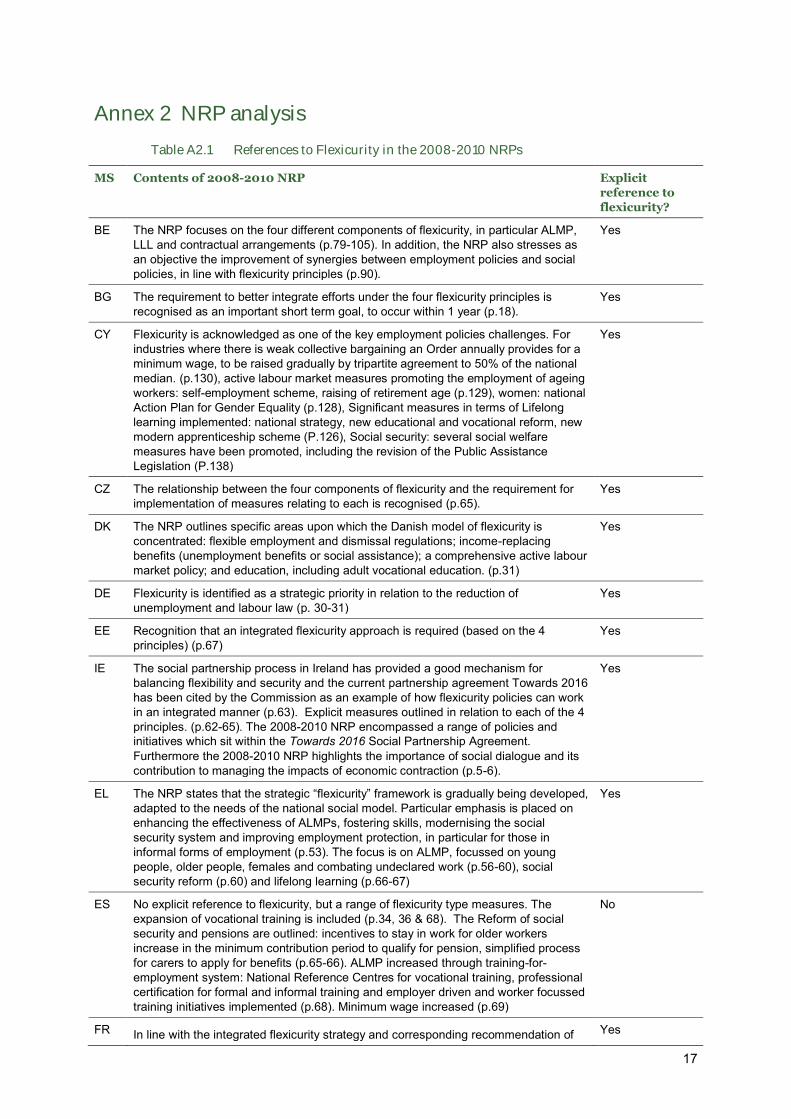
17
Annex 2 NRP analysis
Table A2.1 References to Flexicurity in the 2008-2010 NRPs
MS Contents of 2008-2010 NRP Explicit
reference to
flexicurity?
BE The NRP focuses on the four different components of flexicurity, in particular ALMP, LLL and contractual arrangements (p.79-105). In addition, the NRP also stresses as an objective the improvement of synergies between employment policies and social policies, in line with flexicurity principles (p.90).
Yes
BG The requirement to better integrate efforts under the four flexicurity principles is recognised as an important short term goal, to occur within 1 year (p.18).
Yes
CY Flexicurity is acknowledged as one of the key employment policies challenges. For industries where there is weak collective bargaining an Order annually provides for a minimum wage, to be raised gradually by tripartite agreement to 50% of the national median. (p.130), active labour market measures promoting the employment of ageing workers: self-employment scheme, raising of retirement age (p.129), women: national Action Plan for Gender Equality (p.128), Significant measures in terms of Lifelong learning implemented: national strategy, new educational and vocational reform, new modern apprenticeship scheme (P.126), Social security: several social welfare measures have been promoted, including the revision of the Public Assistance Legislation (P.138)
Yes
CZ The relationship between the four components of flexicurity and the requirement for implementation of measures relating to each is recognised (p.65).
Yes
DK The NRP outlines specific areas upon which the Danish model of flexicurity is concentrated: flexible employment and dismissal regulations; income-replacing benefits (unemployment benefits or social assistance); a comprehensive active labour market policy; and education, including adult vocational education. (p.31)
Yes
DE Flexicurity is identified as a strategic priority in relation to the reduction of unemployment and labour law (p. 30-31)
Yes
EE Recognition that an integrated flexicurity approach is required (based on the 4 principles) (p.67)
Yes
IE The social partnership process in Ireland has provided a good mechanism for balancing flexibility and security and the current partnership agreement Towards 2016 has been cited by the Commission as an example of how flexicurity policies can work in an integrated manner (p.63). Explicit measures outlined in relation to each of the 4 principles. (p.62-65). The 2008-2010 NRP encompassed a range of policies and initiatives which sit within the Towards 2016 Social Partnership Agreement. Furthermore the 2008-2010 NRP highlights the importance of social dialogue and its contribution to managing the impacts of economic contraction (p.5-6).
Yes
EL The NRP states that the strategic “flexicurity” framework is gradually being developed, adapted to the needs of the national social model. Particular emphasis is placed on enhancing the effectiveness of ALMPs, fostering skills, modernising the social security system and improving employment protection, in particular for those in informal forms of employment (p.53). The focus is on ALMP, focussed on young people, older people, females and combating undeclared work (p.56-60), social security reform (p.60) and lifelong learning (p.66-67)
Yes
ES No explicit reference to flexicurity, but a range of flexicurity type measures. The expansion of vocational training is included (p.34, 36 & 68). The Reform of social security and pensions are outlined: incentives to stay in work for older workers increase in the minimum contribution period to qualify for pension, simplified process for carers to apply for benefits (p.65-66). ALMP increased through training-for-employment system: National Reference Centres for vocational training, professional certification for formal and informal training and employer driven and worker focussed training initiatives implemented (p.68). Minimum wage increased (p.69)
No
FR In line with the integrated flexicurity strategy and corresponding recommendation of Yes
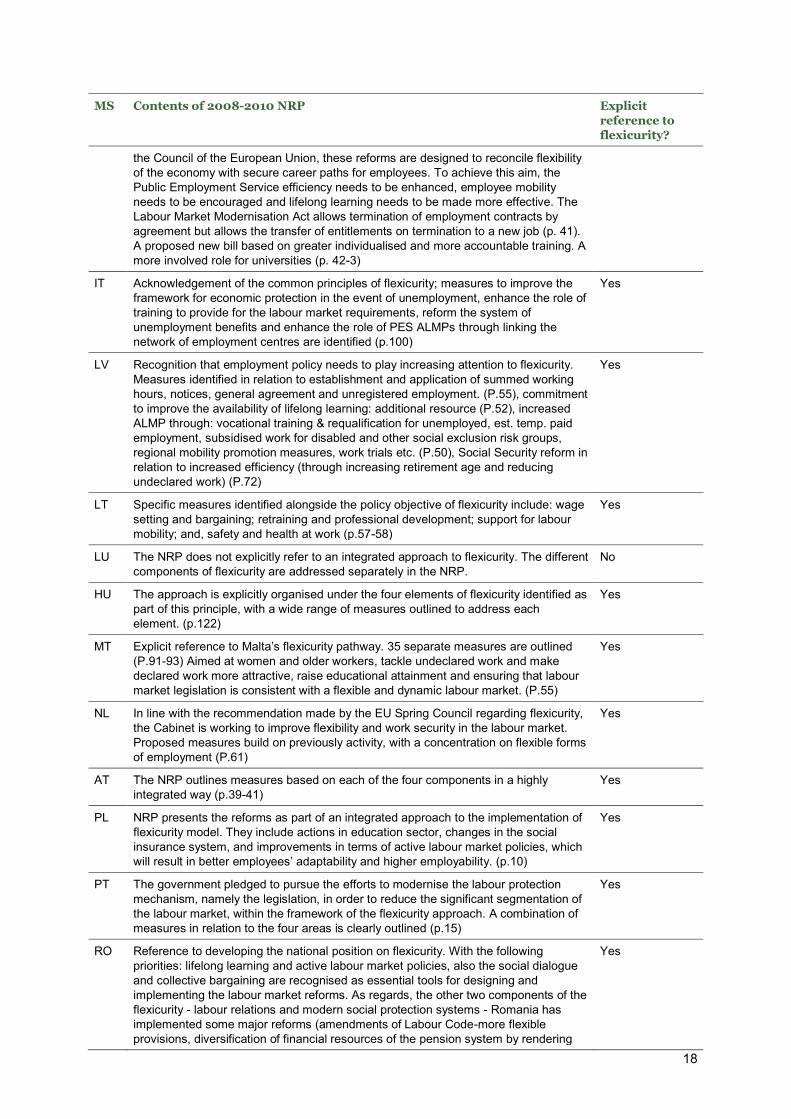
18
MS Contents of 2008-2010 NRP Explicit
reference to
flexicurity?
the Council of the European Union, these reforms are designed to reconcile flexibility of the economy with secure career paths for employees. To achieve this aim, the Public Employment Service efficiency needs to be enhanced, employee mobility needs to be encouraged and lifelong learning needs to be made more effective. The Labour Market Modernisation Act allows termination of employment contracts by agreement but allows the transfer of entitlements on termination to a new job (p. 41). A proposed new bill based on greater individualised and more accountable training. A more involved role for universities (p. 42-3)
IT Acknowledgement of the common principles of flexicurity; measures to improve the framework for economic protection in the event of unemployment, enhance the role of training to provide for the labour market requirements, reform the system of unemployment benefits and enhance the role of PES ALMPs through linking the network of employment centres are identified (p.100)
Yes
LV Recognition that employment policy needs to play increasing attention to flexicurity. Measures identified in relation to establishment and application of summed working hours, notices, general agreement and unregistered employment. (P.55), commitment to improve the availability of lifelong learning: additional resource (P.52), increased ALMP through: vocational training & requalification for unemployed, est. temp. paid employment, subsidised work for disabled and other social exclusion risk groups, regional mobility promotion measures, work trials etc. (P.50), Social Security reform in relation to increased efficiency (through increasing retirement age and reducing undeclared work) (P.72)
Yes
LT Specific measures identified alongside the policy objective of flexicurity include: wage setting and bargaining; retraining and professional development; support for labour mobility; and, safety and health at work (p.57-58)
Yes
LU The NRP does not explicitly refer to an integrated approach to flexicurity. The different components of flexicurity are addressed separately in the NRP.
No
HU The approach is explicitly organised under the four elements of flexicurity identified as part of this principle, with a wide range of measures outlined to address each element. (p.122)
Yes
MT Explicit reference to Malta’s flexicurity pathway. 35 separate measures are outlined (P.91-93) Aimed at women and older workers, tackle undeclared work and make declared work more attractive, raise educational attainment and ensuring that labour market legislation is consistent with a flexible and dynamic labour market. (P.55)
Yes
NL In line with the recommendation made by the EU Spring Council regarding flexicurity, the Cabinet is working to improve flexibility and work security in the labour market. Proposed measures build on previously activity, with a concentration on flexible forms of employment (P.61)
Yes
AT The NRP outlines measures based on each of the four components in a highly integrated way (p.39-41)
Yes
PL NRP presents the reforms as part of an integrated approach to the implementation of flexicurity model. They include actions in education sector, changes in the social insurance system, and improvements in terms of active labour market policies, which will result in better employees’ adaptability and higher employability. (p.10)
Yes
PT The government pledged to pursue the efforts to modernise the labour protection mechanism, namely the legislation, in order to reduce the significant segmentation of the labour market, within the framework of the flexicurity approach. A combination of measures in relation to the four areas is clearly outlined (p.15)
Yes
RO Reference to developing the national position on flexicurity. With the following priorities: lifelong learning and active labour market policies, also the social dialogue and collective bargaining are recognised as essential tools for designing and implementing the labour market reforms. As regards, the other two components of the flexicurity - labour relations and modern social protection systems - Romania has implemented some major reforms (amendments of Labour Code-more flexible provisions, diversification of financial resources of the pension system by rendering
Yes
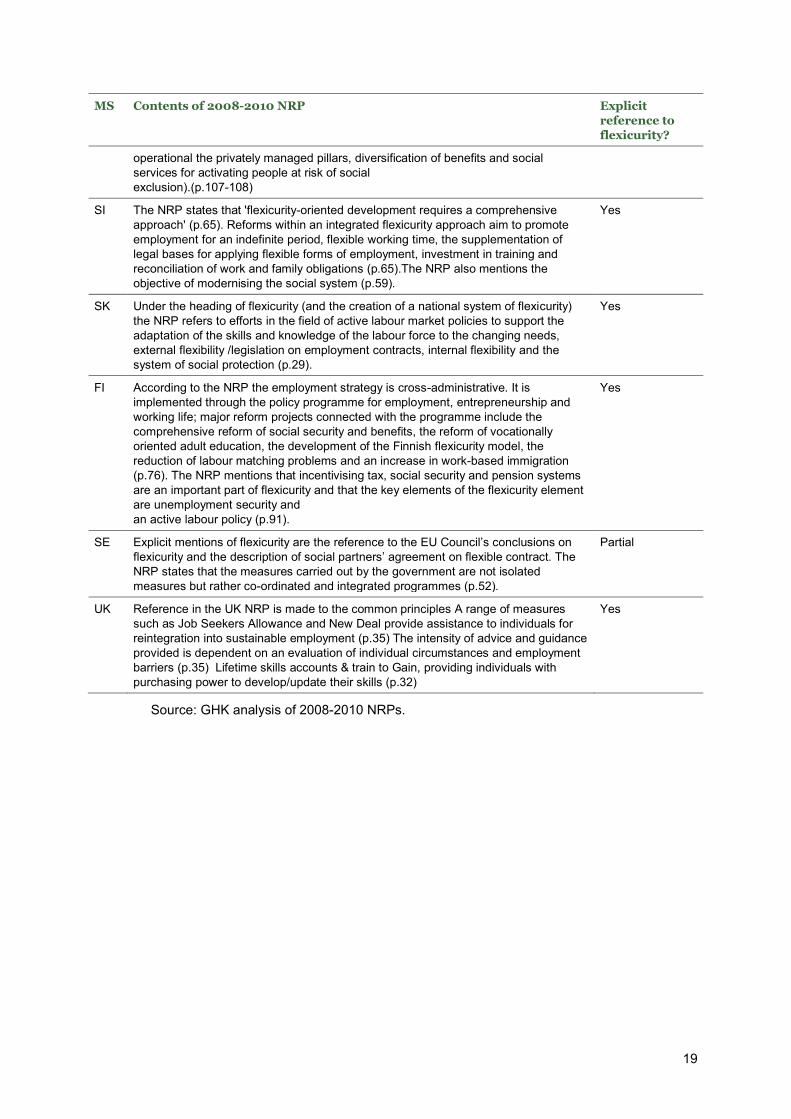
19
MS Contents of 2008-2010 NRP Explicit
reference to
flexicurity?
operational the privately managed pillars, diversification of benefits and social services for activating people at risk of social exclusion).(p.107-108)
SI The NRP states that 'flexicurity-oriented development requires a comprehensive approach' (p.65). Reforms within an integrated flexicurity approach aim to promote employment for an indefinite period, flexible working time, the supplementation of legal bases for applying flexible forms of employment, investment in training and reconciliation of work and family obligations (p.65).The NRP also mentions the objective of modernising the social system (p.59).
Yes
SK Under the heading of flexicurity (and the creation of a national system of flexicurity) the NRP refers to efforts in the field of active labour market policies to support the adaptation of the skills and knowledge of the labour force to the changing needs, external flexibility /legislation on employment contracts, internal flexibility and the system of social protection (p.29).
Yes
FI According to the NRP the employment strategy is cross-administrative. It is implemented through the policy programme for employment, entrepreneurship and working life; major reform projects connected with the programme include the comprehensive reform of social security and benefits, the reform of vocationally oriented adult education, the development of the Finnish flexicurity model, the reduction of labour matching problems and an increase in work-based immigration (p.76). The NRP mentions that incentivising tax, social security and pension systems are an important part of flexicurity and that the key elements of the flexicurity element are unemployment security and an active labour policy (p.91).
Yes
SE Explicit mentions of flexicurity are the reference to the EU Council’s conclusions on flexicurity and the description of social partners’ agreement on flexible contract. The NRP states that the measures carried out by the government are not isolated measures but rather co-ordinated and integrated programmes (p.52).
Partial
UK Reference in the UK NRP is made to the common principles A range of measures such as Job Seekers Allowance and New Deal provide assistance to individuals for reintegration into sustainable employment (p.35) The intensity of advice and guidance provided is dependent on an evaluation of individual circumstances and employment barriers (p.35) Lifetime skills accounts & train to Gain, providing individuals with purchasing power to develop/update their skills (p.32)
Yes
Source: GHK analysis of 2008-2010 NRPs.
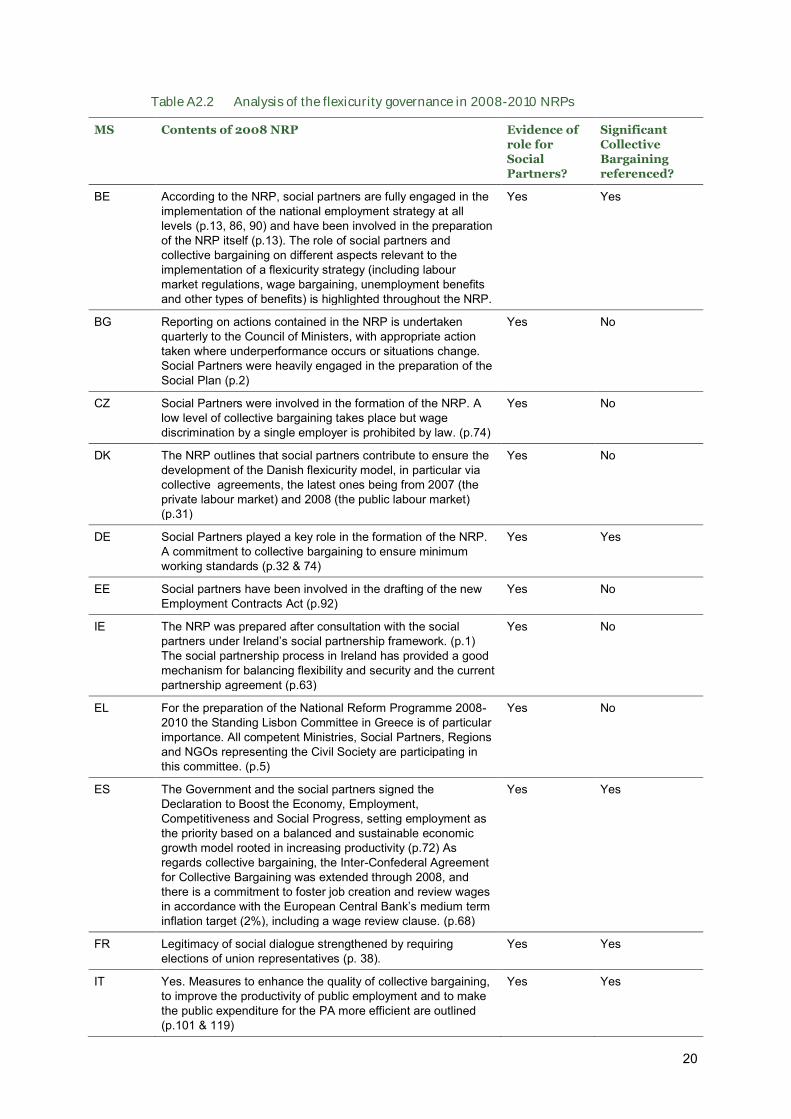
20
Table A2.2 Analysis of the flexicurity governance in 2008-2010 NRPs
MS Contents of 2008 NRP Evidence of
role for
Social
Partners?
Significant
Collective
Bargaining
referenced?
BE According to the NRP, social partners are fully engaged in the implementation of the national employment strategy at all levels (p.13, 86, 90) and have been involved in the preparation of the NRP itself (p.13). The role of social partners and collective bargaining on different aspects relevant to the implementation of a flexicurity strategy (including labour market regulations, wage bargaining, unemployment benefits and other types of benefits) is highlighted throughout the NRP.
Yes Yes
BG Reporting on actions contained in the NRP is undertaken quarterly to the Council of Ministers, with appropriate action taken where underperformance occurs or situations change. Social Partners were heavily engaged in the preparation of the Social Plan (p.2)
Yes No
CZ Social Partners were involved in the formation of the NRP. A low level of collective bargaining takes place but wage discrimination by a single employer is prohibited by law. (p.74)
Yes No
DK The NRP outlines that social partners contribute to ensure the development of the Danish flexicurity model, in particular via collective agreements, the latest ones being from 2007 (the private labour market) and 2008 (the public labour market) (p.31)
Yes No
DE Social Partners played a key role in the formation of the NRP. A commitment to collective bargaining to ensure minimum working standards (p.32 & 74)
Yes Yes
EE Social partners have been involved in the drafting of the new Employment Contracts Act (p.92)
Yes No
IE The NRP was prepared after consultation with the social partners under Ireland’s social partnership framework. (p.1) The social partnership process in Ireland has provided a good mechanism for balancing flexibility and security and the current partnership agreement (p.63)
Yes No
EL For the preparation of the National Reform Programme 2008-2010 the Standing Lisbon Committee in Greece is of particular importance. All competent Ministries, Social Partners, Regions and NGOs representing the Civil Society are participating in this committee. (p.5)
Yes No
ES The Government and the social partners signed the Declaration to Boost the Economy, Employment, Competitiveness and Social Progress, setting employment as the priority based on a balanced and sustainable economic growth model rooted in increasing productivity (p.72) As regards collective bargaining, the Inter-Confederal Agreement for Collective Bargaining was extended through 2008, and there is a commitment to foster job creation and review wages in accordance with the European Central Bank’s medium term inflation target (2%), including a wage review clause. (p.68)
Yes Yes
FR Legitimacy of social dialogue strengthened by requiring elections of union representatives (p. 38).
Yes Yes
IT Yes. Measures to enhance the quality of collective bargaining, to improve the productivity of public employment and to make the public expenditure for the PA more efficient are outlined (p.101 & 119)
Yes Yes
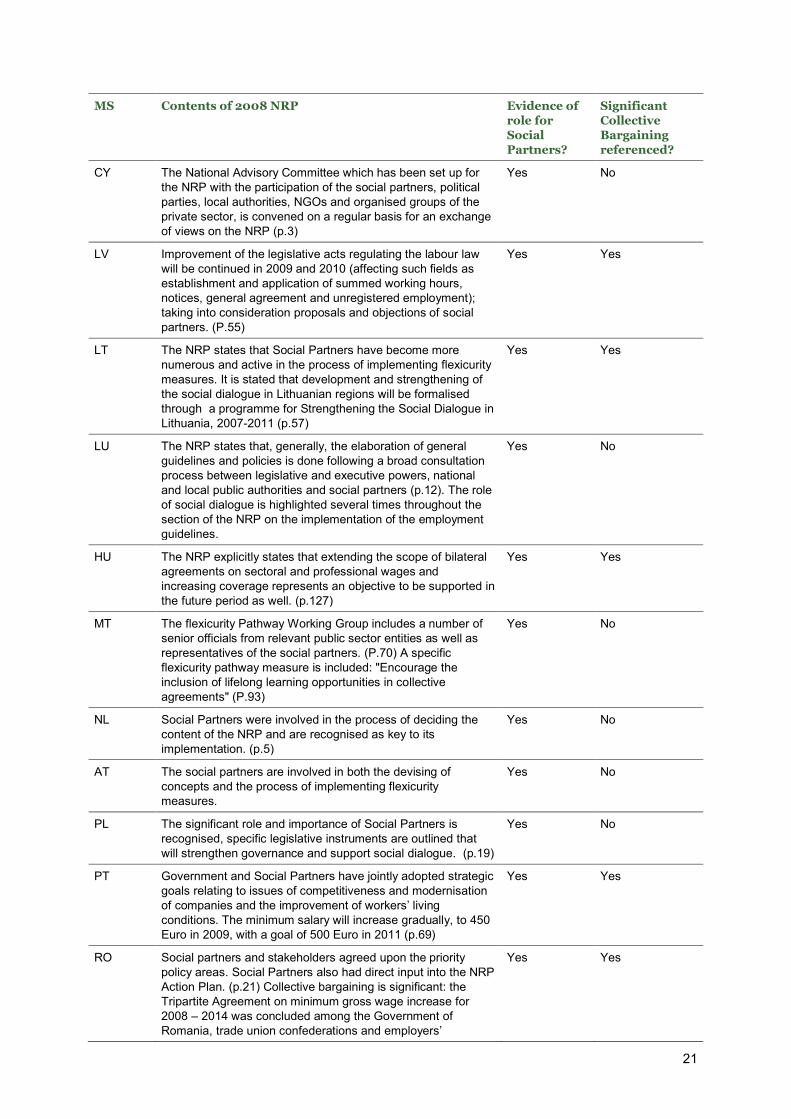
21
MS Contents of 2008 NRP Evidence of
role for
Social
Partners?
Significant
Collective
Bargaining
referenced?
CY The National Advisory Committee which has been set up for the NRP with the participation of the social partners, political parties, local authorities, NGOs and organised groups of the private sector, is convened on a regular basis for an exchange of views on the NRP (p.3)
Yes No
LV Improvement of the legislative acts regulating the labour law will be continued in 2009 and 2010 (affecting such fields as establishment and application of summed working hours, notices, general agreement and unregistered employment); taking into consideration proposals and objections of social partners. (P.55)
Yes Yes
LT The NRP states that Social Partners have become more numerous and active in the process of implementing flexicurity measures. It is stated that development and strengthening of the social dialogue in Lithuanian regions will be formalised through a programme for Strengthening the Social Dialogue in Lithuania, 2007-2011 (p.57)
Yes Yes
LU The NRP states that, generally, the elaboration of general guidelines and policies is done following a broad consultation process between legislative and executive powers, national and local public authorities and social partners (p.12). The role of social dialogue is highlighted several times throughout the section of the NRP on the implementation of the employment guidelines.
Yes No
HU The NRP explicitly states that extending the scope of bilateral agreements on sectoral and professional wages and increasing coverage represents an objective to be supported in the future period as well. (p.127)
Yes Yes
MT The flexicurity Pathway Working Group includes a number of senior officials from relevant public sector entities as well as representatives of the social partners. (P.70) A specific flexicurity pathway measure is included: "Encourage the inclusion of lifelong learning opportunities in collective agreements" (P.93)
Yes No
NL Social Partners were involved in the process of deciding the content of the NRP and are recognised as key to its implementation. (p.5)
Yes No
AT The social partners are involved in both the devising of concepts and the process of implementing flexicurity measures.
Yes No
PL The significant role and importance of Social Partners is recognised, specific legislative instruments are outlined that will strengthen governance and support social dialogue. (p.19)
Yes No
PT Government and Social Partners have jointly adopted strategic goals relating to issues of competitiveness and modernisation of companies and the improvement of workers’ living conditions. The minimum salary will increase gradually, to 450 Euro in 2009, with a goal of 500 Euro in 2011 (p.69)
Yes Yes
RO Social partners and stakeholders agreed upon the priority policy areas. Social Partners also had direct input into the NRP Action Plan. (p.21) Collective bargaining is significant: the Tripartite Agreement on minimum gross wage increase for 2008 – 2014 was concluded among the Government of Romania, trade union confederations and employers’
Yes Yes
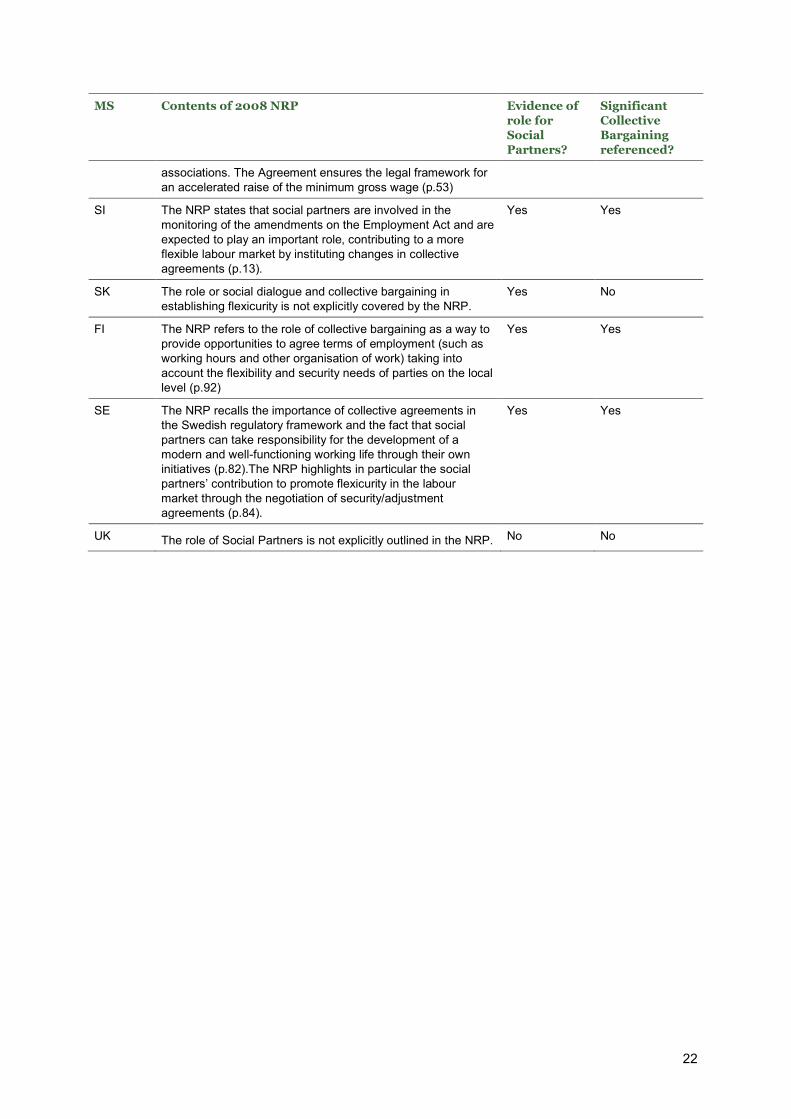
22
MS Contents of 2008 NRP Evidence of
role for
Social
Partners?
Significant
Collective
Bargaining
referenced?
associations. The Agreement ensures the legal framework for an accelerated raise of the minimum gross wage (p.53)
SI The NRP states that social partners are involved in the monitoring of the amendments on the Employment Act and are expected to play an important role, contributing to a more flexible labour market by instituting changes in collective agreements (p.13).
Yes Yes
SK The role or social dialogue and collective bargaining in establishing flexicurity is not explicitly covered by the NRP.
Yes No
FI The NRP refers to the role of collective bargaining as a way to provide opportunities to agree terms of employment (such as working hours and other organisation of work) taking into account the flexibility and security needs of parties on the local level (p.92)
Yes Yes
SE The NRP recalls the importance of collective agreements in the Swedish regulatory framework and the fact that social partners can take responsibility for the development of a modern and well-functioning working life through their own initiatives (p.82).The NRP highlights in particular the social partners’ contribution to promote flexicurity in the labour market through the negotiation of security/adjustment agreements (p.84).
Yes Yes
UK The role of Social Partners is not explicitly outlined in the NRP. No No
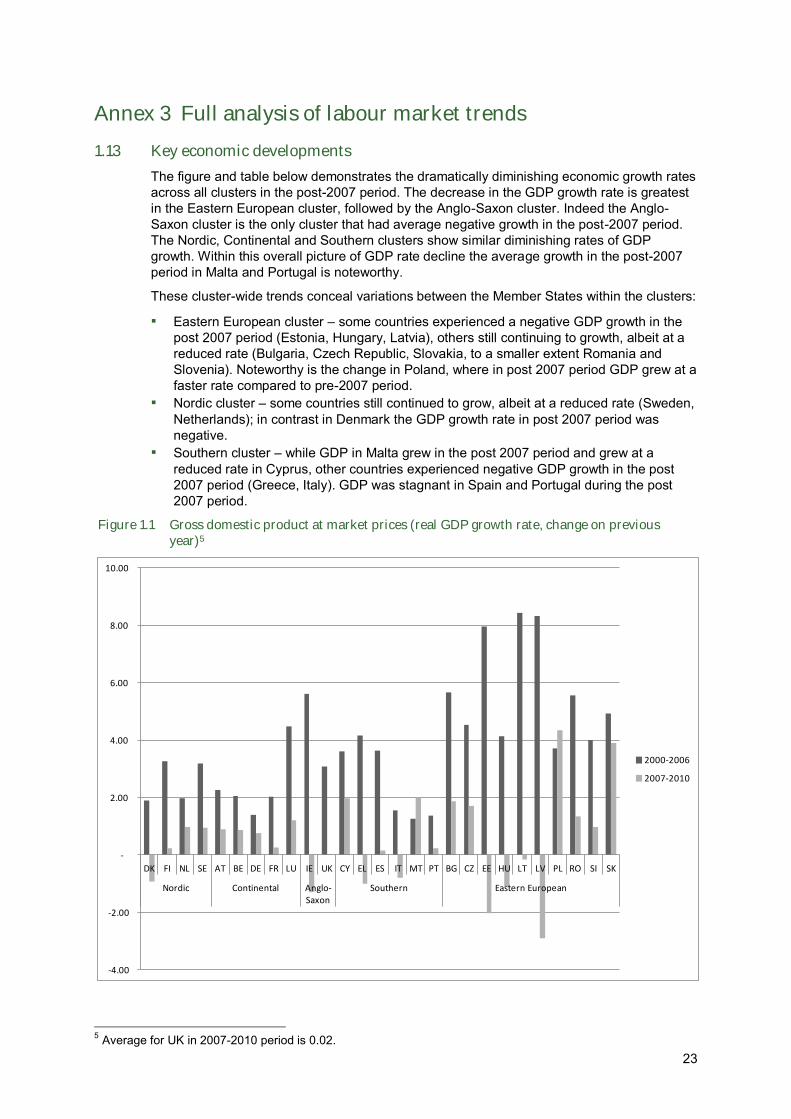
23
Annex 3 Full analysis of labour market trends
1.13 Key economic developments
The figure and table below demonstrates the dramatically diminishing economic growth rates across all clusters in the post-2007 period. The decrease in the GDP growth rate is greatest in the Eastern European cluster, followed by the Anglo-Saxon cluster. Indeed the Anglo-Saxon cluster is the only cluster that had average negative growth in the post-2007 period. The Nordic, Continental and Southern clusters show similar diminishing rates of GDP growth. Within this overall picture of GDP rate decline the average growth in the post-2007 period in Malta and Portugal is noteworthy.
These cluster-wide trends conceal variations between the Member States within the clusters:
▪ Eastern European cluster – some countries experienced a negative GDP growth in the post 2007 period (Estonia, Hungary, Latvia), others still continuing to growth, albeit at a reduced rate (Bulgaria, Czech Republic, Slovakia, to a smaller extent Romania and Slovenia). Noteworthy is the change in Poland, where in post 2007 period GDP grew at a faster rate compared to pre-2007 period.
▪ Nordic cluster – some countries still continued to grow, albeit at a reduced rate (Sweden, Netherlands); in contrast in Denmark the GDP growth rate in post 2007 period was negative.
▪ Southern cluster – while GDP in Malta grew in the post 2007 period and grew at a reduced rate in Cyprus, other countries experienced negative GDP growth in the post 2007 period (Greece, Italy). GDP was stagnant in Spain and Portugal during the post 2007 period.
Figure 1.1 Gross domestic product at market prices (real GDP growth rate, change on previous year)5
5 Average for UK in 2007-2010 period is 0.02.
-4.00
-2.00
-
2.00
4.00
6.00
8.00
10.00
DK FI NL SE AT BE DE FR LU IE UK CY EL ES IT MT PT BG CZ EE HU LT LV PL RO SI SK
Nordic Continental Anglo-Saxon
Southern Eastern European
2000-2006
2007-2010
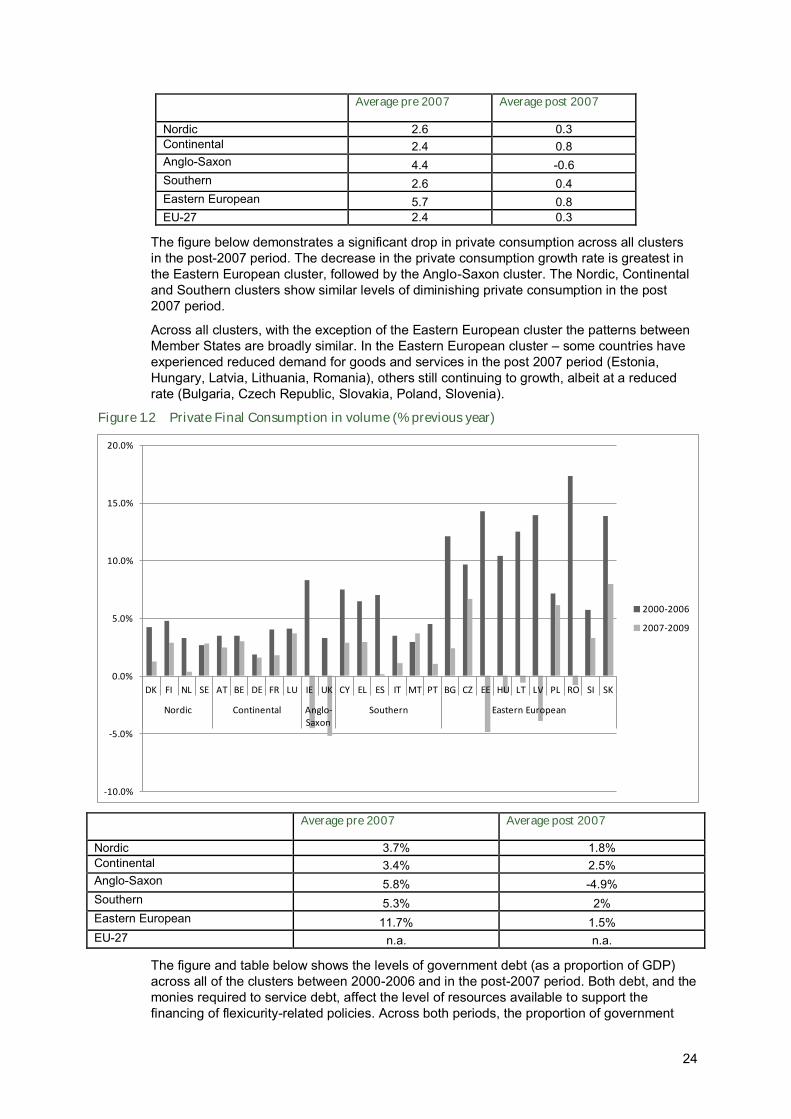
24
Average pre 2007 Average post 2007
Nordic 2.6 0.3 Continental 2.4 0.8 Anglo-Saxon 4.4 -0.6 Southern 2.6 0.4 Eastern European 5.7 0.8 EU-27 2.4 0.3
The figure below demonstrates a significant drop in private consumption across all clusters in the post-2007 period. The decrease in the private consumption growth rate is greatest in the Eastern European cluster, followed by the Anglo-Saxon cluster. The Nordic, Continental and Southern clusters show similar levels of diminishing private consumption in the post 2007 period.
Across all clusters, with the exception of the Eastern European cluster the patterns between Member States are broadly similar. In the Eastern European cluster – some countries have experienced reduced demand for goods and services in the post 2007 period (Estonia, Hungary, Latvia, Lithuania, Romania), others still continuing to growth, albeit at a reduced rate (Bulgaria, Czech Republic, Slovakia, Poland, Slovenia).
Figure 1.2 Private Final Consumption in volume (% previous year)
Average pre 2007 Average post 2007
Nordic 3.7% 1.8% Continental 3.4% 2.5% Anglo-Saxon 5.8% -4.9% Southern 5.3% 2% Eastern European 11.7% 1.5% EU-27 n.a. n.a.
The figure and table below shows the levels of government debt (as a proportion of GDP) across all of the clusters between 2000-2006 and in the post-2007 period. Both debt, and the monies required to service debt, affect the level of resources available to support the financing of flexicurity-related policies. Across both periods, the proportion of government
-10.0%
-5.0%
0.0%
5.0%
10.0%
15.0%
20.0%
DK FI NL SE AT BE DE FR LU IE UK CY EL ES IT MT PT BG CZ EE HU LT LV PL RO SI SK
Nordic Continental Anglo-Saxon
Southern Eastern European
2000-2006
2007-2009
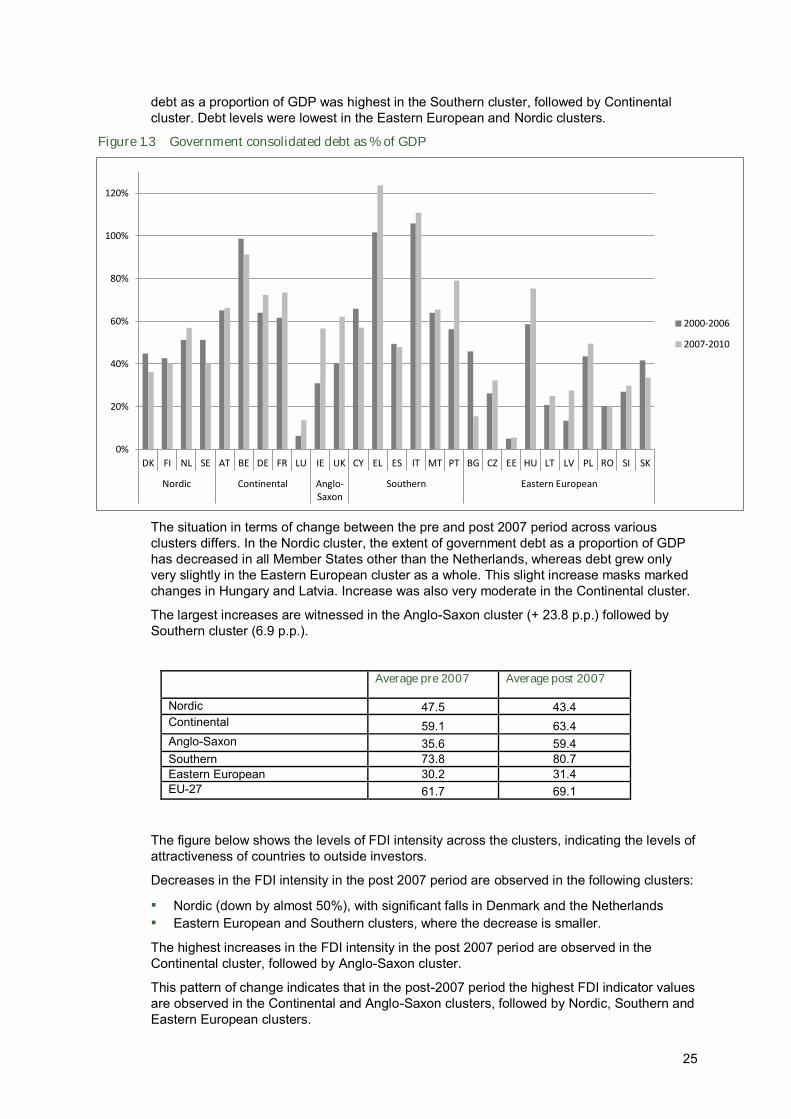
25
debt as a proportion of GDP was highest in the Southern cluster, followed by Continental cluster. Debt levels were lowest in the Eastern European and Nordic clusters.
Figure 1.3 Government consolidated debt as % of GDP
The situation in terms of change between the pre and post 2007 period across various clusters differs. In the Nordic cluster, the extent of government debt as a proportion of GDP has decreased in all Member States other than the Netherlands, whereas debt grew only very slightly in the Eastern European cluster as a whole. This slight increase masks marked changes in Hungary and Latvia. Increase was also very moderate in the Continental cluster.
The largest increases are witnessed in the Anglo-Saxon cluster (+ 23.8 p.p.) followed by Southern cluster (6.9 p.p.).
Average pre 2007 Average post 2007
Nordic 47.5 43.4 Continental 59.1 63.4 Anglo-Saxon 35.6 59.4 Southern 73.8 80.7 Eastern European 30.2 31.4 EU-27 61.7 69.1
The figure below shows the levels of FDI intensity across the clusters, indicating the levels of attractiveness of countries to outside investors.
Decreases in the FDI intensity in the post 2007 period are observed in the following clusters:
▪ Nordic (down by almost 50%), with significant falls in Denmark and the Netherlands ▪ Eastern European and Southern clusters, where the decrease is smaller.
The highest increases in the FDI intensity in the post 2007 period are observed in the Continental cluster, followed by Anglo-Saxon cluster.
This pattern of change indicates that in the post-2007 period the highest FDI indicator values are observed in the Continental and Anglo-Saxon clusters, followed by Nordic, Southern and Eastern European clusters.
0%
20%
40%
60%
80%
100%
120%
DK FI NL SE AT BE DE FR LU IE UK CY EL ES IT MT PT BG CZ EE HU LT LV PL RO SI SK
Nordic Continental Anglo-Saxon
Southern Eastern European
2000-2006
2007-2010
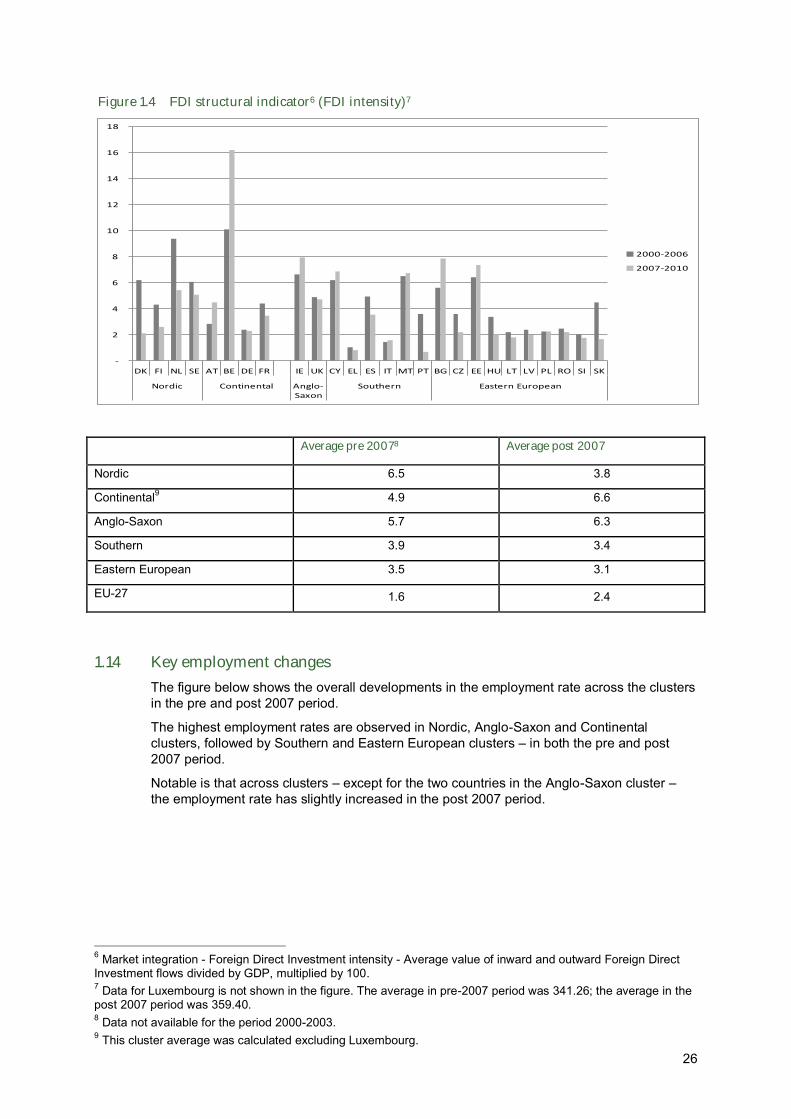
26
Figure 1.4 FDI structural indicator6 (FDI intensity)7
Average pre 20078 Average post 2007
Nordic 6.5 3.8
Continental9 4.9 6.6
Anglo-Saxon 5.7 6.3
Southern 3.9 3.4
Eastern European 3.5 3.1
EU-27 1.6 2.4
1.14 Key employment changes
The figure below shows the overall developments in the employment rate across the clusters in the pre and post 2007 period.
The highest employment rates are observed in Nordic, Anglo-Saxon and Continental clusters, followed by Southern and Eastern European clusters – in both the pre and post 2007 period.
Notable is that across clusters – except for the two countries in the Anglo-Saxon cluster – the employment rate has slightly increased in the post 2007 period.
6 Market integration - Foreign Direct Investment intensity - Average value of inward and outward Foreign Direct Investment flows divided by GDP, multiplied by 100. 7 Data for Luxembourg is not shown in the figure. The average in pre-2007 period was 341.26; the average in the post 2007 period was 359.40. 8 Data not available for the period 2000-2003. 9 This cluster average was calculated excluding Luxembourg.
-
2
4
6
8
10
12
14
16
18
DK FI NL SE AT BE DE FR IE UK CY EL ES IT MT PT BG CZ EE HU LT LV PL RO SI SK
Nordic Continental Anglo-Saxon
Southern Eastern European
2000-2006
2007-2010
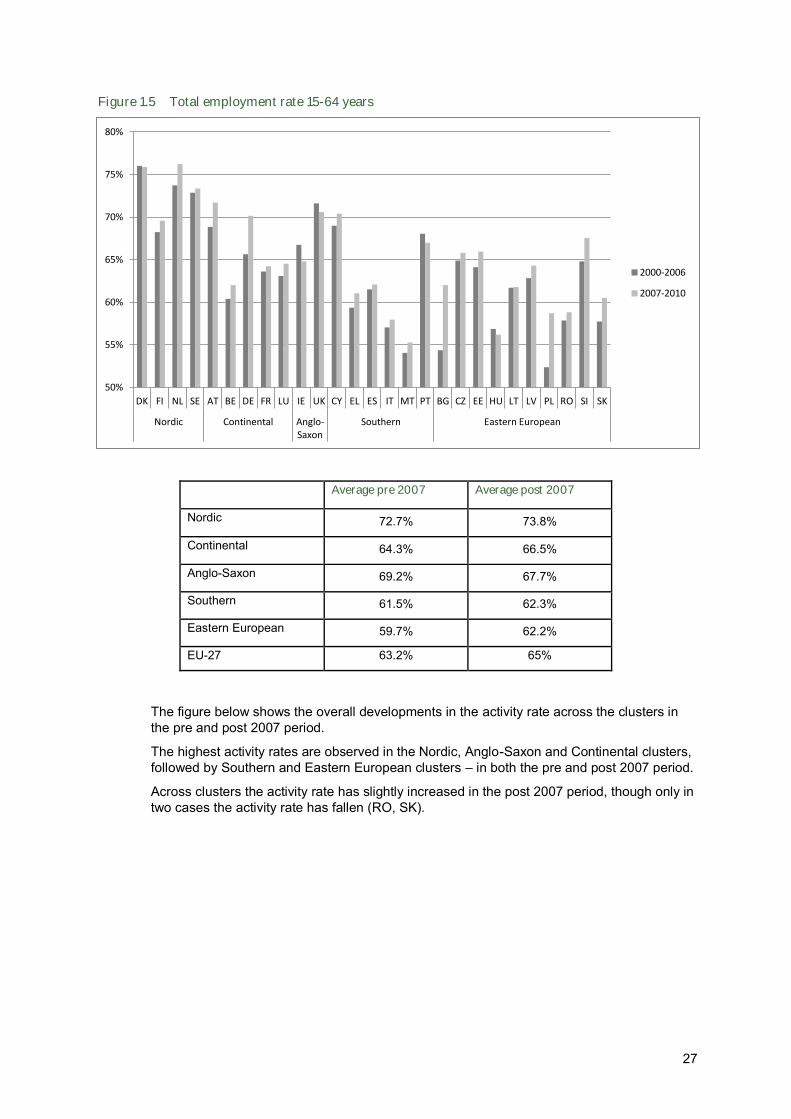
27
Figure 1.5 Total employment rate 15-64 years
Average pre 2007 Average post 2007
Nordic 72.7% 73.8%
Continental 64.3% 66.5%
Anglo-Saxon 69.2% 67.7%
Southern 61.5% 62.3%
Eastern European 59.7% 62.2%
EU-27 63.2% 65%
The figure below shows the overall developments in the activity rate across the clusters in the pre and post 2007 period.
The highest activity rates are observed in the Nordic, Anglo-Saxon and Continental clusters, followed by Southern and Eastern European clusters – in both the pre and post 2007 period.
Across clusters the activity rate has slightly increased in the post 2007 period, though only in two cases the activity rate has fallen (RO, SK).
50%
55%
60%
65%
70%
75%
80%
DK FI NL SE AT BE DE FR LU IE UK CY EL ES IT MT PT BG CZ EE HU LT LV PL RO SI SK
Nordic Continental Anglo-Saxon
Southern Eastern European
2000-2006
2007-2010
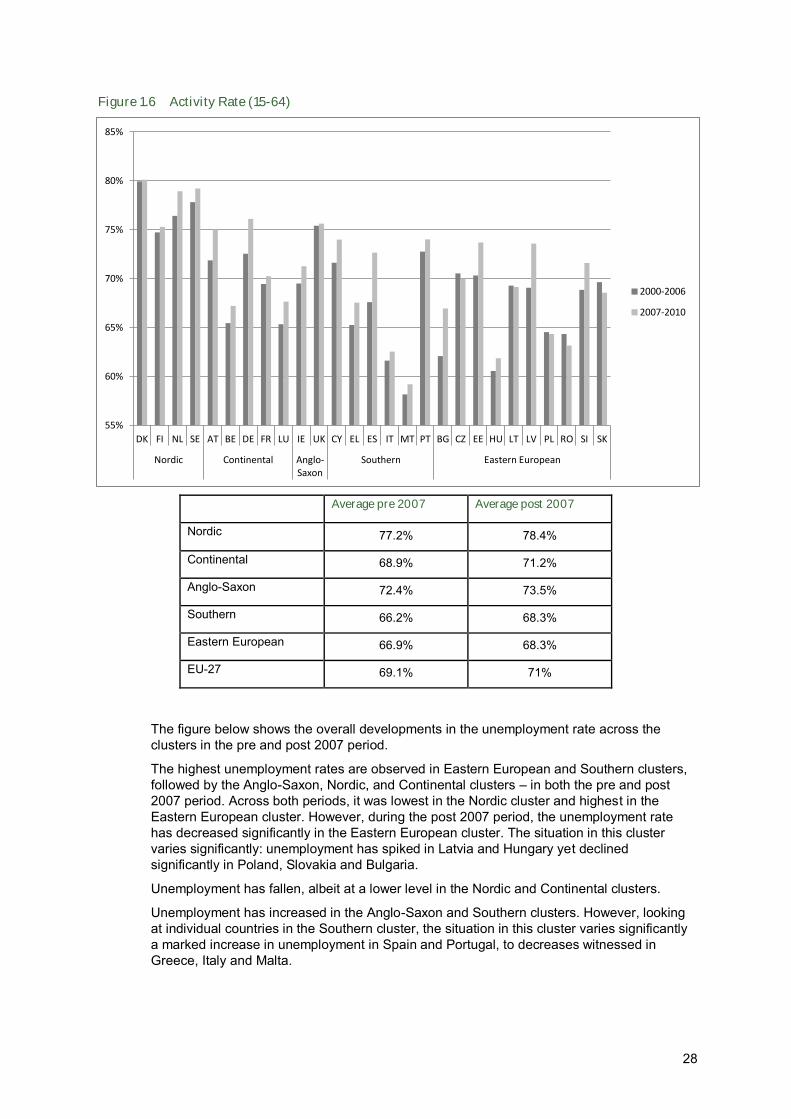
28
Figure 1.6 Activity Rate (15-64)
Average pre 2007 Average post 2007
Nordic 77.2% 78.4%
Continental 68.9% 71.2%
Anglo-Saxon 72.4% 73.5%
Southern 66.2% 68.3%
Eastern European 66.9% 68.3%
EU-27 69.1% 71%
The figure below shows the overall developments in the unemployment rate across the clusters in the pre and post 2007 period.
The highest unemployment rates are observed in Eastern European and Southern clusters, followed by the Anglo-Saxon, Nordic, and Continental clusters – in both the pre and post 2007 period. Across both periods, it was lowest in the Nordic cluster and highest in the Eastern European cluster. However, during the post 2007 period, the unemployment rate has decreased significantly in the Eastern European cluster. The situation in this cluster varies significantly: unemployment has spiked in Latvia and Hungary yet declined significantly in Poland, Slovakia and Bulgaria.
Unemployment has fallen, albeit at a lower level in the Nordic and Continental clusters.
Unemployment has increased in the Anglo-Saxon and Southern clusters. However, looking at individual countries in the Southern cluster, the situation in this cluster varies significantly a marked increase in unemployment in Spain and Portugal, to decreases witnessed in Greece, Italy and Malta.
55%
60%
65%
70%
75%
80%
85%
DK FI NL SE AT BE DE FR LU IE UK CY EL ES IT MT PT BG CZ EE HU LT LV PL RO SI SK
Nordic Continental Anglo-Saxon
Southern Eastern European
2000-2006
2007-2010
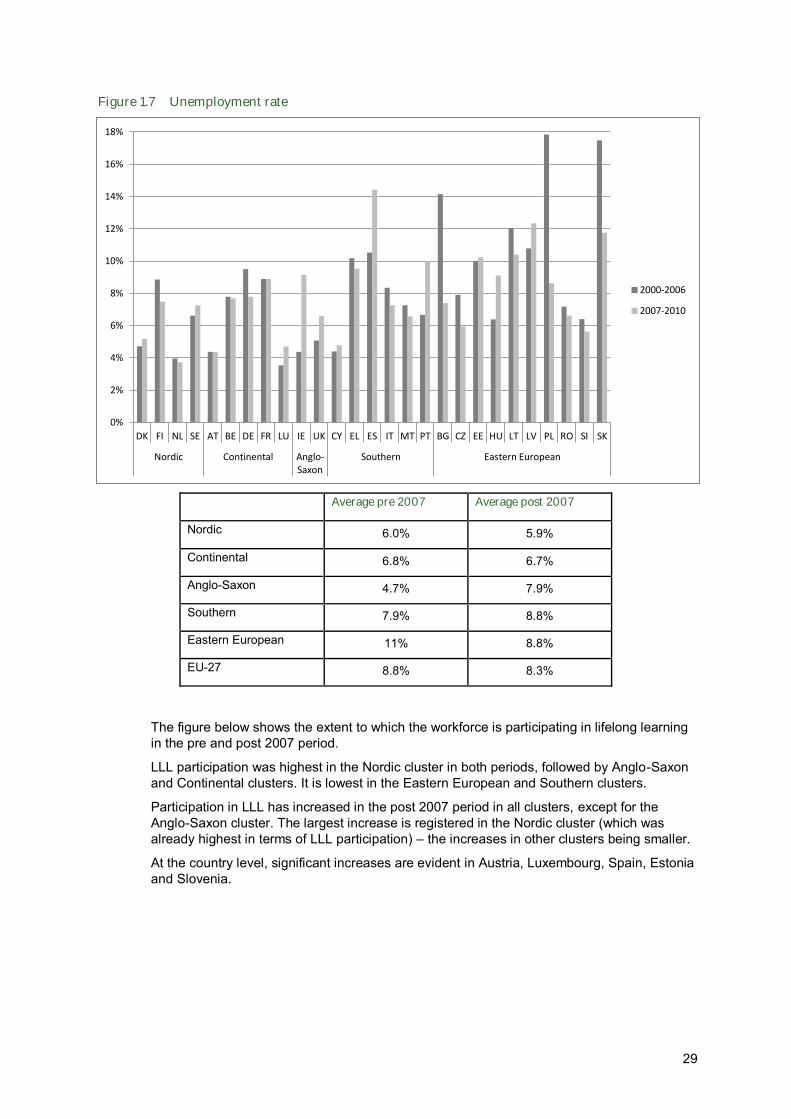
29
Figure 1.7 Unemployment rate
Average pre 2007 Average post 2007
Nordic 6.0% 5.9%
Continental 6.8% 6.7%
Anglo-Saxon 4.7% 7.9%
Southern 7.9% 8.8%
Eastern European 11% 8.8%
EU-27 8.8% 8.3%
The figure below shows the extent to which the workforce is participating in lifelong learning in the pre and post 2007 period.
LLL participation was highest in the Nordic cluster in both periods, followed by Anglo-Saxon and Continental clusters. It is lowest in the Eastern European and Southern clusters.
Participation in LLL has increased in the post 2007 period in all clusters, except for the Anglo-Saxon cluster. The largest increase is registered in the Nordic cluster (which was already highest in terms of LLL participation) – the increases in other clusters being smaller.
At the country level, significant increases are evident in Austria, Luxembourg, Spain, Estonia and Slovenia.
0%
2%
4%
6%
8%
10%
12%
14%
16%
18%
DK FI NL SE AT BE DE FR LU IE UK CY EL ES IT MT PT BG CZ EE HU LT LV PL RO SI SK
Nordic Continental Anglo-Saxon
Southern Eastern European
2000-2006
2007-2010
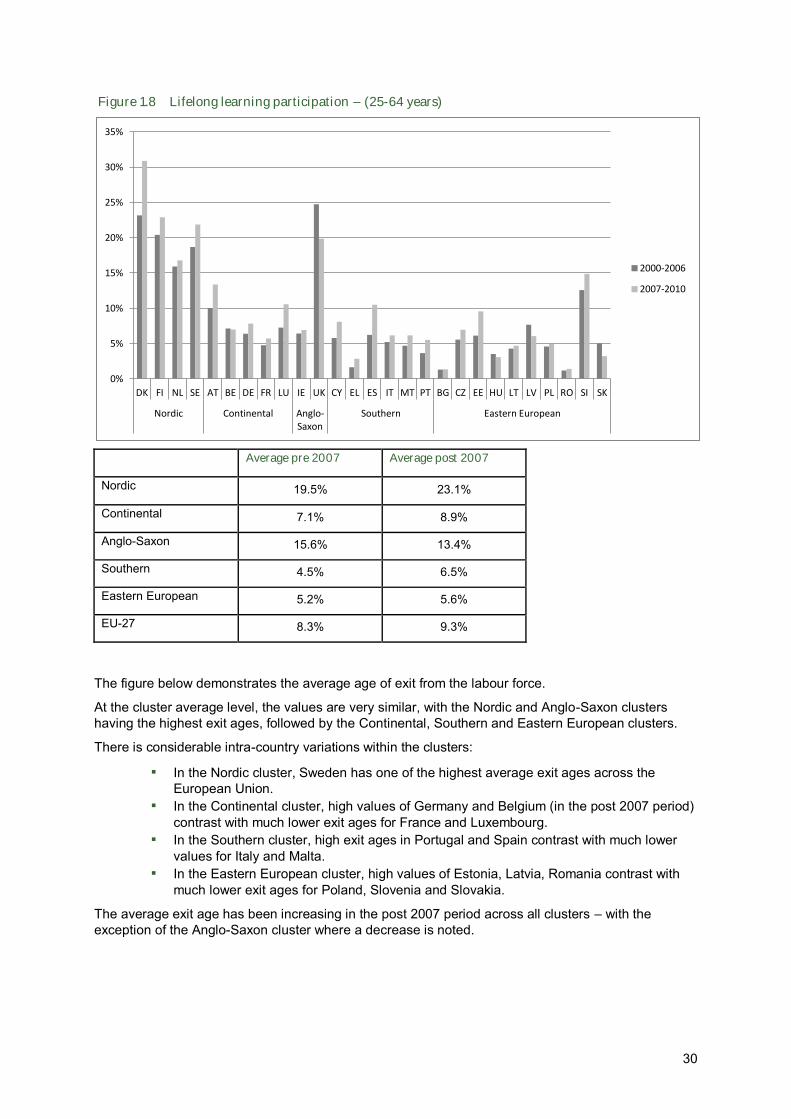
30
Figure 1.8 Lifelong learning participation – (25-64 years)
Average pre 2007 Average post 2007
Nordic 19.5% 23.1%
Continental 7.1% 8.9%
Anglo-Saxon 15.6% 13.4%
Southern 4.5% 6.5%
Eastern European 5.2% 5.6%
EU-27 8.3% 9.3%
The figure below demonstrates the average age of exit from the labour force.
At the cluster average level, the values are very similar, with the Nordic and Anglo-Saxon clusters having the highest exit ages, followed by the Continental, Southern and Eastern European clusters.
There is considerable intra-country variations within the clusters:
▪ In the Nordic cluster, Sweden has one of the highest average exit ages across the European Union.
▪ In the Continental cluster, high values of Germany and Belgium (in the post 2007 period) contrast with much lower exit ages for France and Luxembourg.
▪ In the Southern cluster, high exit ages in Portugal and Spain contrast with much lower values for Italy and Malta.
▪ In the Eastern European cluster, high values of Estonia, Latvia, Romania contrast with much lower exit ages for Poland, Slovenia and Slovakia.
The average exit age has been increasing in the post 2007 period across all clusters – with the exception of the Anglo-Saxon cluster where a decrease is noted.
0%
5%
10%
15%
20%
25%
30%
35%
DK FI NL SE AT BE DE FR LU IE UK CY EL ES IT MT PT BG CZ EE HU LT LV PL RO SI SK
Nordic Continental Anglo-Saxon
Southern Eastern European
2000-2006
2007-2010
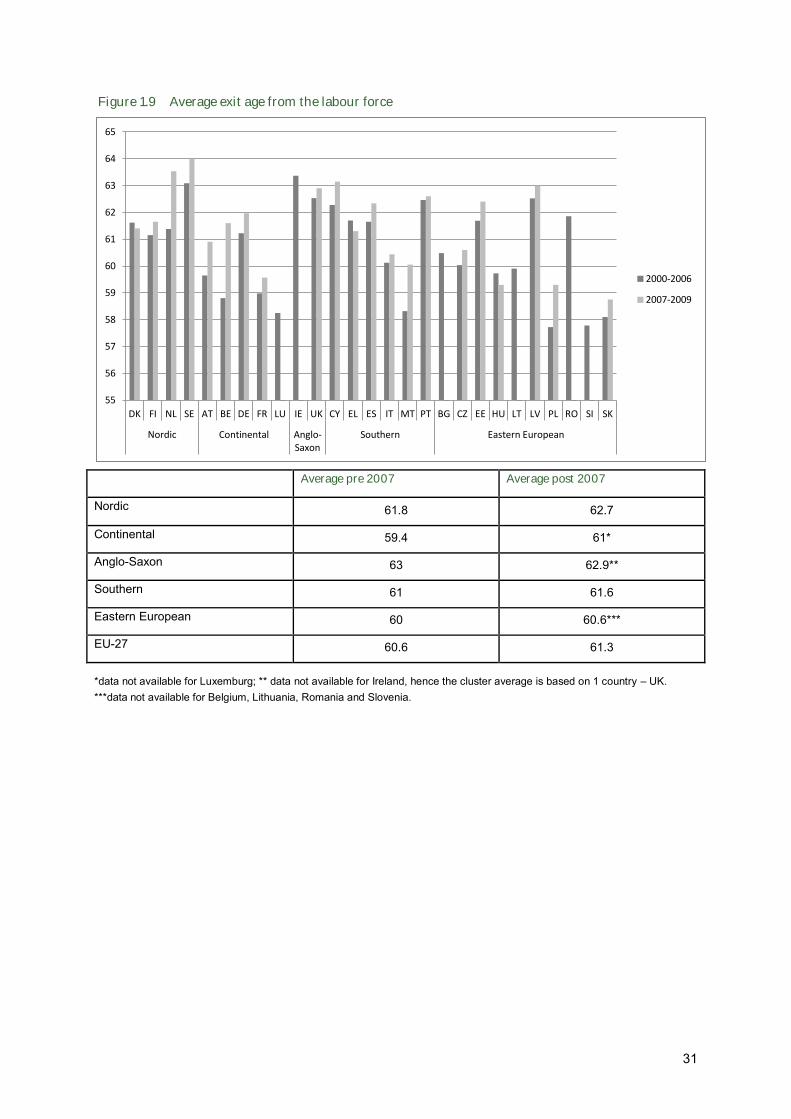
31
Figure 1.9 Average exit age from the labour force
Average pre 2007 Average post 2007
Nordic 61.8 62.7
Continental 59.4 61*
Anglo-Saxon 63 62.9**
Southern 61 61.6
Eastern European 60 60.6***
EU-27 60.6 61.3
*data not available for Luxemburg; ** data not available for Ireland, hence the cluster average is based on 1 country – UK. ***data not available for Belgium, Lithuania, Romania and Slovenia.
55
56
57
58
59
60
61
62
63
64
65
DK FI NL SE AT BE DE FR LU IE UK CY EL ES IT MT PT BG CZ EE HU LT LV PL RO SI SK
Nordic Continental Anglo-Saxon
Southern Eastern European
2000-2006
2007-2009
1
Evaluation of flexicurity 2007-2010: Final Report
Annex 4 – Macro-economic and flexicurity scoreboards of 27 Member States
Index
1 Introduction ...........................................................................................................3
2 Austria ...................................................................................................................8
3 Belgium ............................................................................................................... 16
4 Bulgaria ............................................................................................................... 23
5 Cyprus ................................................................................................................. 30
6 Czech Republic ..................................................................................................... 37
7 Denmark .............................................................................................................. 44
8 Estonia ................................................................................................................. 52
9 Finland ................................................................................................................. 59
10 France .................................................................................................................. 68
11 Germany .............................................................................................................. 76
12 Greece ................................................................................................................. 84
13 Hungary ............................................................................................................... 91
14 Ireland ................................................................................................................. 98
15 Italy ................................................................................................................... 106
16 Latvia ................................................................................................................. 115
17 Lithuania ............................................................................................................ 122
18 Luxembourg ....................................................................................................... 129
19 Malta ................................................................................................................. 136
20 Netherlands ....................................................................................................... 143
21 Poland ............................................................................................................... 150

2
22 Portugal ............................................................................................................. 158
23 Romania ............................................................................................................ 165
24 Slovakia ............................................................................................................. 173
25 Slovenia ............................................................................................................. 180
26 Spain.................................................................................................................. 187
27 Sweden .............................................................................................................. 194
28 UK ...................................................................................................................... 201
3
1 Introduction
1.1 Purpose of the scoreboard analysis
The purpose of this analysis is to consider approaches to flexicurity in individual Member
States through a quantitative and qualitative analysis comparing the pre-2007 and post-2007
periods. This analysis considers flexicurity related policies and issues in individual Member
States by considering the following elements in relation to flexicurity policy:
■ the macroeconomic context within which the Member States make policy decisions;
■ specific flexicurity-related input indicators in relation to the four components of flexicurity
and the most significant policy measures introduced in the Member States; and,
■ specific outcomes and key future challenges in relation to flexicurity policies in the
Member States.
This note provides details regarding the method that has been used to undertake and
present this analysis.
The goal of conducting this country by country analysis is to allow us to assess:
■ What have been the main policies changes in relation to flexicurity policies (more
flexible/less flexible in terms of change from the pre-2007 baseline);
■ Are there any clear patterns emerging regarding Member States’ input and outcome
scores in relation to key flexicurity indicators (e.g. do countries with high input scores
perform better in terms of outcomes and if flexicurity input scores do not show a
consistent link with outcomes, are there other factors, such as economic indicators,
which are stronger determinants of outcomes);
■ Can common patterns be found within flexicurity clusters or are there countries which are
clear outliers in terms of inputs and outcomes; can any countries be considered to have
moved flexicurity regimes;
■ Comparing qualitative information on policy changes with quantitative data, can any
changes in post-2007 indicators be clearly associated with changes in approach in key
flexicurity related policies;
■ What policy lessons can be drawn from this analysis.
1.2 Analytical framework
Framework for this analysis is illustrated by Figure 1.1 below. This presents an
understanding of relevant policy areas and their interconnectedness. It is from this
framework that headline macroeconomic indicators have been identified and analysed in the
following Member State reports. The indicators presented are not exhaustive but rather
present relevant data that is available for most Member States during the reference periods
for the study (i.e. pre and post 2007).
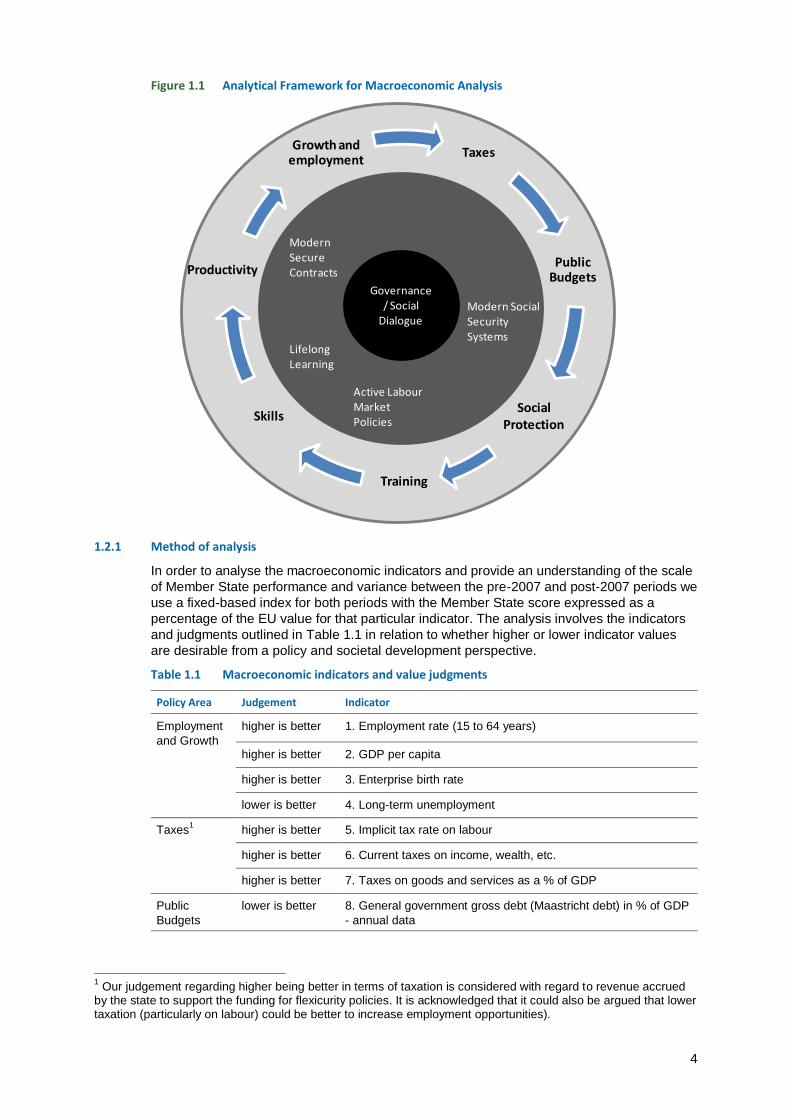
4
Figure 1.1 Analytical Framework for Macroeconomic Analysis
1.2.1 Method of analysis
In order to analyse the macroeconomic indicators and provide an understanding of the scale
of Member State performance and variance between the pre-2007 and post-2007 periods we
use a fixed-based index for both periods with the Member State score expressed as a
percentage of the EU value for that particular indicator. The analysis involves the indicators
and judgments outlined in Table 1.1 in relation to whether higher or lower indicator values
are desirable from a policy and societal development perspective.
Table 1.1 Macroeconomic indicators and value judgments
Policy Area Judgement Indicator
Employment
and Growth
higher is better 1. Employment rate (15 to 64 years)
higher is better 2. GDP per capita
higher is better 3. Enterprise birth rate
lower is better 4. Long-term unemployment
Taxes1 higher is better 5. Implicit tax rate on labour
higher is better 6. Current taxes on income, wealth, etc.
higher is better 7. Taxes on goods and services as a % of GDP
Public
Budgets
lower is better 8. General government gross debt (Maastricht debt) in % of GDP
- annual data
1 Our judgement regarding higher being better in terms of taxation is considered with regard to revenue accrued
by the state to support the funding for flexicurity policies. It is acknowledged that it could also be argued that lower taxation (particularly on labour) could be better to increase employment opportunities).
Taxes
Public Budgets
Social Protection
Training
Skills
Productivity
Growth and employment
Governance/ Social
Dialogue
Modern Secure Contracts
Lifelong Learning
Active Labour Market Policies
Modern Social Security Systems
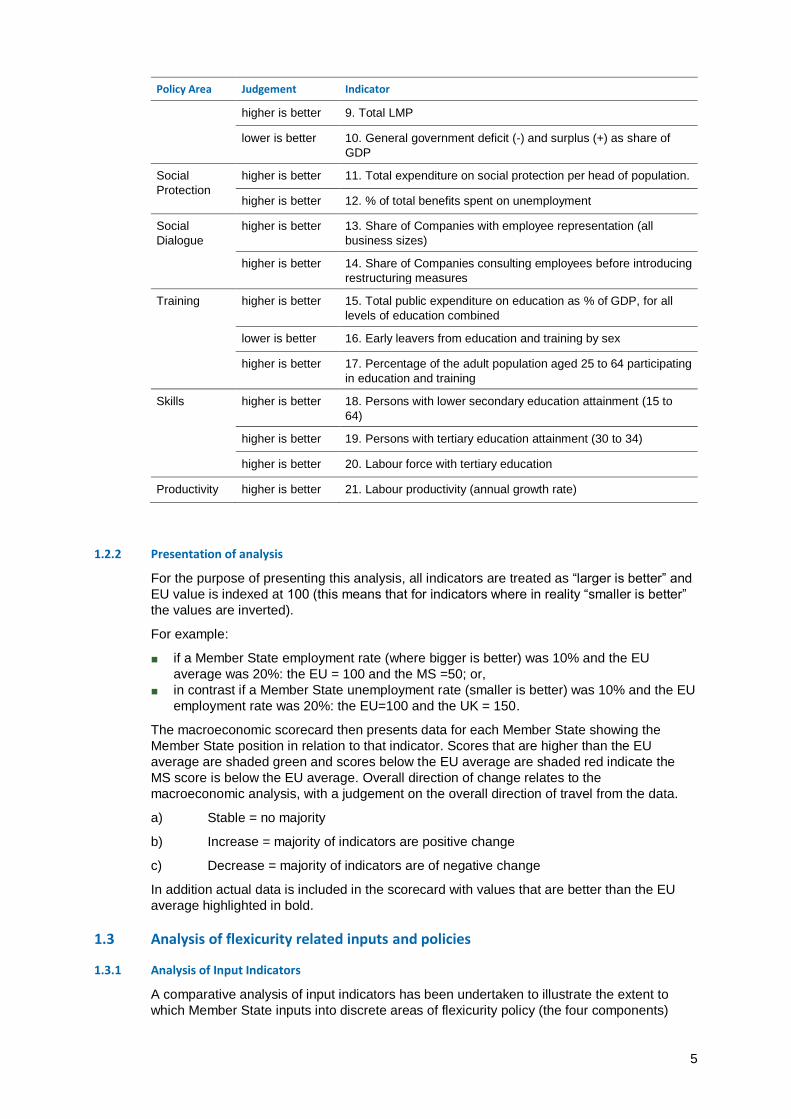
5
Policy Area Judgement Indicator
higher is better 9. Total LMP
lower is better 10. General government deficit (-) and surplus (+) as share of
GDP
Social
Protection
higher is better 11. Total expenditure on social protection per head of population.
higher is better 12. % of total benefits spent on unemployment
Social
Dialogue
higher is better 13. Share of Companies with employee representation (all
business sizes)
higher is better 14. Share of Companies consulting employees before introducing
restructuring measures
Training higher is better 15. Total public expenditure on education as % of GDP, for all
levels of education combined
lower is better 16. Early leavers from education and training by sex
higher is better 17. Percentage of the adult population aged 25 to 64 participating
in education and training
Skills higher is better 18. Persons with lower secondary education attainment (15 to
64)
higher is better 19. Persons with tertiary education attainment (30 to 34)
higher is better 20. Labour force with tertiary education
Productivity higher is better 21. Labour productivity (annual growth rate)
1.2.2 Presentation of analysis
For the purpose of presenting this analysis, all indicators are treated as “larger is better” and
EU value is indexed at 100 (this means that for indicators where in reality “smaller is better”
the values are inverted).
For example:
■ if a Member State employment rate (where bigger is better) was 10% and the EU
average was 20%: the EU = 100 and the MS =50; or,
■ in contrast if a Member State unemployment rate (smaller is better) was 10% and the EU
employment rate was 20%: the EU=100 and the UK = 150.
The macroeconomic scorecard then presents data for each Member State showing the
Member State position in relation to that indicator. Scores that are higher than the EU
average are shaded green and scores below the EU average are shaded red indicate the
MS score is below the EU average. Overall direction of change relates to the
macroeconomic analysis, with a judgement on the overall direction of travel from the data.
a) Stable = no majority
b) Increase = majority of indicators are positive change
c) Decrease = majority of indicators are of negative change
In addition actual data is included in the scorecard with values that are better than the EU
average highlighted in bold.
1.3 Analysis of flexicurity related inputs and policies
1.3.1 Analysis of Input Indicators
A comparative analysis of input indicators has been undertaken to illustrate the extent to
which Member State inputs into discrete areas of flexicurity policy (the four components)
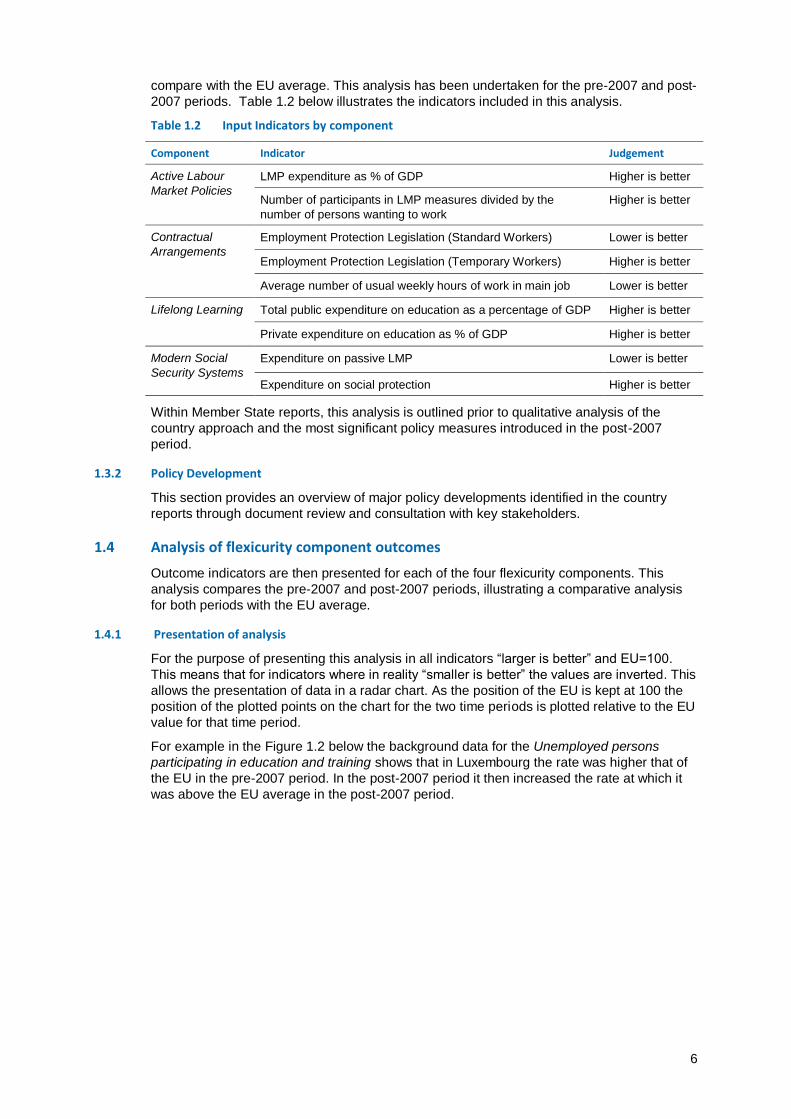
6
compare with the EU average. This analysis has been undertaken for the pre-2007 and post-
2007 periods. Table 1.2 below illustrates the indicators included in this analysis.
Table 1.2 Input Indicators by component
Component Indicator Judgement
Active Labour
Market Policies
LMP expenditure as % of GDP Higher is better
Number of participants in LMP measures divided by the
number of persons wanting to work
Higher is better
Contractual
Arrangements
Employment Protection Legislation (Standard Workers) Lower is better
Employment Protection Legislation (Temporary Workers) Higher is better
Average number of usual weekly hours of work in main job Lower is better
Lifelong Learning Total public expenditure on education as a percentage of GDP Higher is better
Private expenditure on education as % of GDP Higher is better
Modern Social
Security Systems
Expenditure on passive LMP Lower is better
Expenditure on social protection Higher is better
Within Member State reports, this analysis is outlined prior to qualitative analysis of the
country approach and the most significant policy measures introduced in the post-2007
period.
1.3.2 Policy Development
This section provides an overview of major policy developments identified in the country
reports through document review and consultation with key stakeholders.
1.4 Analysis of flexicurity component outcomes
Outcome indicators are then presented for each of the four flexicurity components. This
analysis compares the pre-2007 and post-2007 periods, illustrating a comparative analysis
for both periods with the EU average.
1.4.1 Presentation of analysis
For the purpose of presenting this analysis in all indicators “larger is better” and EU=100.
This means that for indicators where in reality “smaller is better” the values are inverted. This
allows the presentation of data in a radar chart. As the position of the EU is kept at 100 the
position of the plotted points on the chart for the two time periods is plotted relative to the EU
value for that time period.
For example in the Figure 1.2 below the background data for the Unemployed persons
participating in education and training shows that in Luxembourg the rate was higher that of
the EU in the pre-2007 period. In the post-2007 period it then increased the rate at which it
was above the EU average in the post-2007 period.
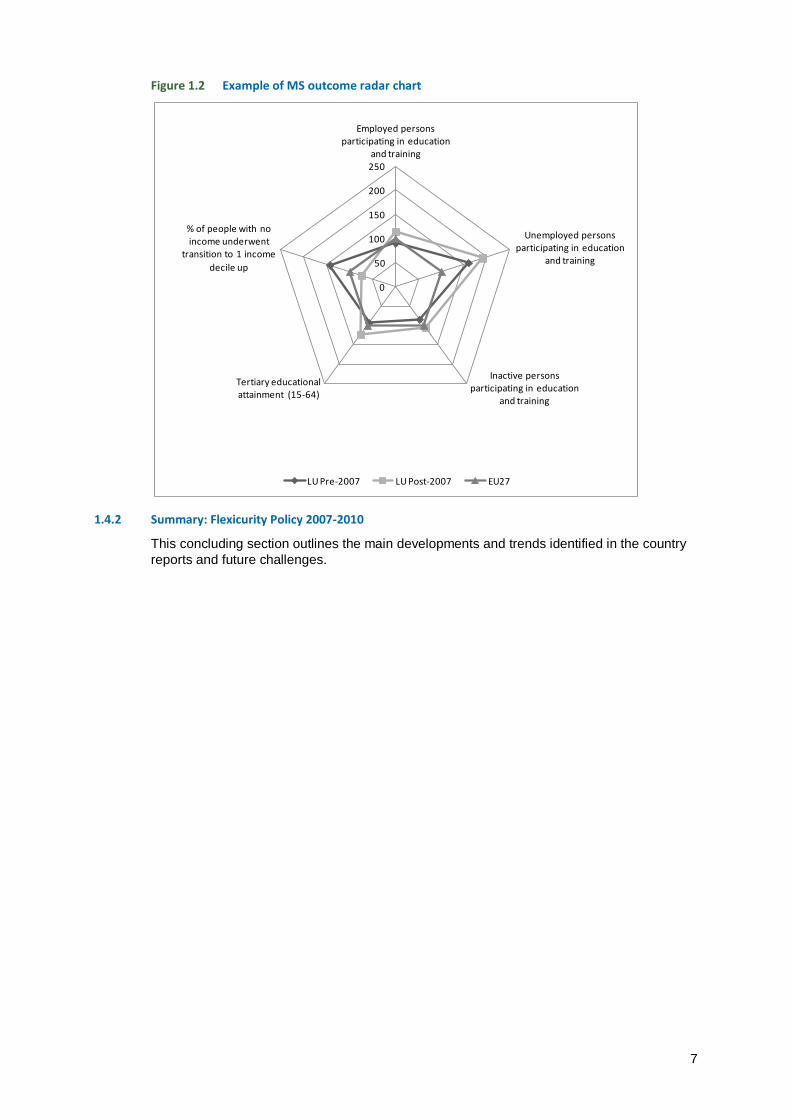
7
Figure 1.2 Example of MS outcome radar chart
1.4.2 Summary: Flexicurity Policy 2007-2010
This concluding section outlines the main developments and trends identified in the country
reports and future challenges.
0
50
100
150
200
250
Employed persons participating in education
and training
Unemployed persons participating in education
and training
Inactive persons participating in education
and training
Tertiary educational attainment (15-64)
% of people with no income underwent
transition to 1 income
decile up
LU Pre-2007 LU Post-2007 EU27

8
2 Austria
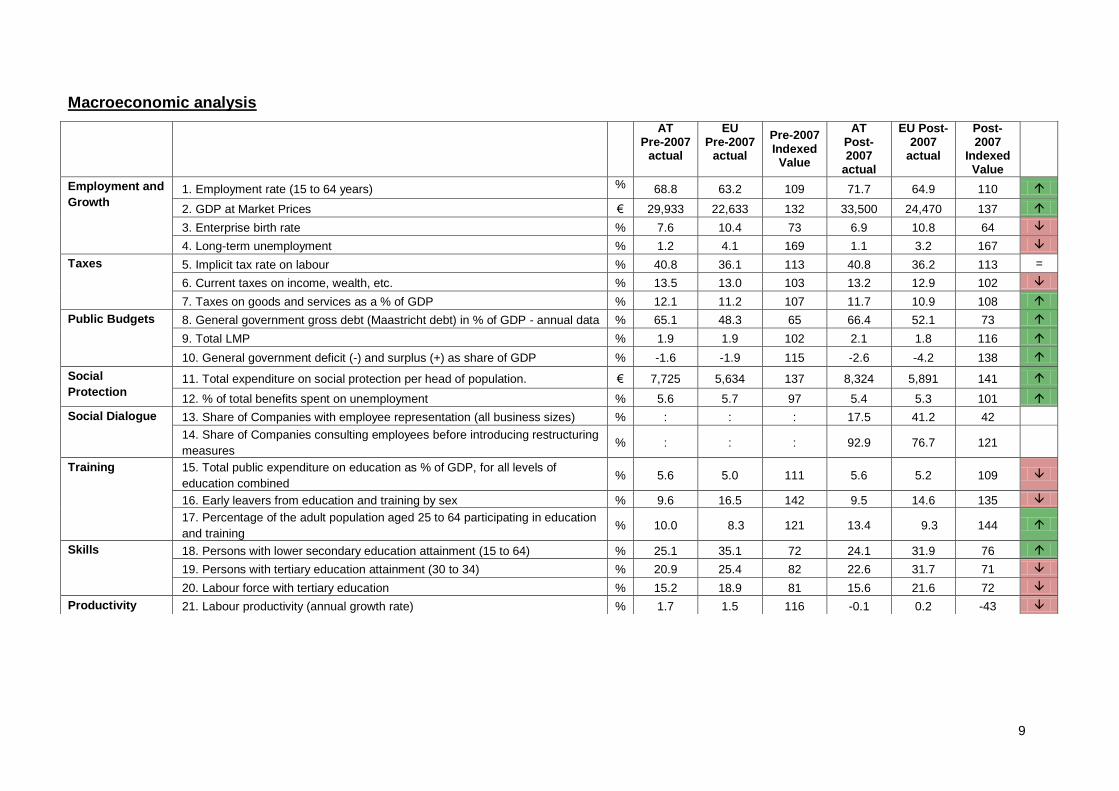
9
Macroeconomic analysis
AT Pre-2007
actual
EU Pre-2007
actual
Pre-2007 Indexed Value
AT Post-2007
actual
EU Post-2007
actual
Post-2007
Indexed Value
Employment and
Growth 1. Employment rate (15 to 64 years) % 68.8 63.2 109 71.7 64.9 110
2. GDP at Market Prices € 29,933 22,633 132 33,500 24,470 137
3. Enterprise birth rate % 7.6 10.4 73 6.9 10.8 64
4. Long-term unemployment % 1.2 4.1 169 1.1 3.2 167
Taxes 5. Implicit tax rate on labour % 40.8 36.1 113 40.8 36.2 113 =
6. Current taxes on income, wealth, etc. % 13.5 13.0 103 13.2 12.9 102
7. Taxes on goods and services as a % of GDP % 12.1 11.2 107 11.7 10.9 108
Public Budgets 8. General government gross debt (Maastricht debt) in % of GDP - annual data % 65.1 48.3 65 66.4 52.1 73
9. Total LMP % 1.9 1.9 102 2.1 1.8 116
10. General government deficit (-) and surplus (+) as share of GDP % -1.6 -1.9 115 -2.6 -4.2 138
Social
Protection 11. Total expenditure on social protection per head of population. € 7,725 5,634 137 8,324 5,891 141
12. % of total benefits spent on unemployment % 5.6 5.7 97 5.4 5.3 101
Social Dialogue 13. Share of Companies with employee representation (all business sizes) % : : : 17.5 41.2 42
14. Share of Companies consulting employees before introducing restructuring
measures % : : : 92.9 76.7 121
Training 15. Total public expenditure on education as % of GDP, for all levels of
education combined % 5.6 5.0 111 5.6 5.2 109
16. Early leavers from education and training by sex % 9.6 16.5 142 9.5 14.6 135
17. Percentage of the adult population aged 25 to 64 participating in education
and training % 10.0 8.3 121 13.4 9.3 144
Skills 18. Persons with lower secondary education attainment (15 to 64) % 25.1 35.1 72 24.1 31.9 76
19. Persons with tertiary education attainment (30 to 34) % 20.9 25.4 82 22.6 31.7 71
20. Labour force with tertiary education % 15.2 18.9 81 15.6 21.6 72
Productivity 21. Labour productivity (annual growth rate) % 1.7 1.5 116 -0.1 0.2 -43
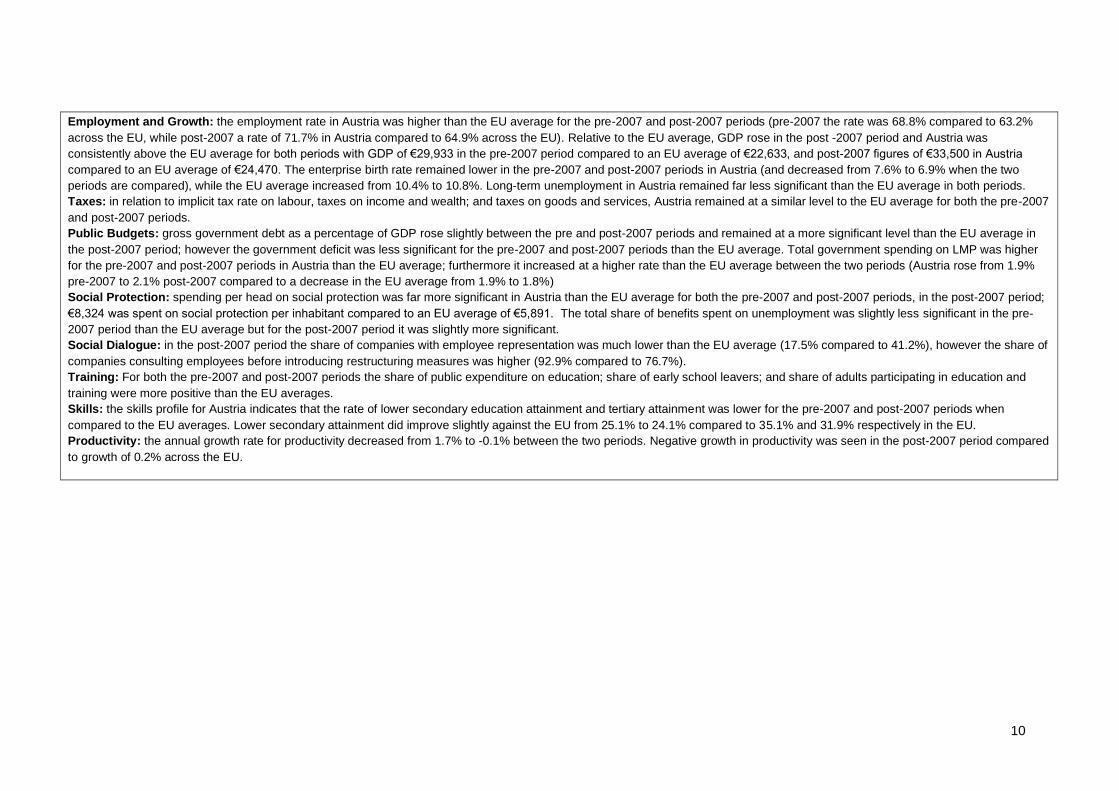
10
Employment and Growth: the employment rate in Austria was higher than the EU average for the pre-2007 and post-2007 periods (pre-2007 the rate was 68.8% compared to 63.2%
across the EU, while post-2007 a rate of 71.7% in Austria compared to 64.9% across the EU). Relative to the EU average, GDP rose in the post -2007 period and Austria was
consistently above the EU average for both periods with GDP of €29,933 in the pre-2007 period compared to an EU average of €22,633, and post-2007 figures of €33,500 in Austria
compared to an EU average of €24,470. The enterprise birth rate remained lower in the pre-2007 and post-2007 periods in Austria (and decreased from 7.6% to 6.9% when the two
periods are compared), while the EU average increased from 10.4% to 10.8%. Long-term unemployment in Austria remained far less significant than the EU average in both periods.
Taxes: in relation to implicit tax rate on labour, taxes on income and wealth; and taxes on goods and services, Austria remained at a similar level to the EU average for both the pre-2007
and post-2007 periods.
Public Budgets: gross government debt as a percentage of GDP rose slightly between the pre and post-2007 periods and remained at a more significant level than the EU average in
the post-2007 period; however the government deficit was less significant for the pre-2007 and post-2007 periods than the EU average. Total government spending on LMP was higher
for the pre-2007 and post-2007 periods in Austria than the EU average; furthermore it increased at a higher rate than the EU average between the two periods (Austria rose from 1.9%
pre-2007 to 2.1% post-2007 compared to a decrease in the EU average from 1.9% to 1.8%)
Social Protection: spending per head on social protection was far more significant in Austria than the EU average for both the pre-2007 and post-2007 periods, in the post-2007 period;
€8,324 was spent on social protection per inhabitant compared to an EU average of €5,891. The total share of benefits spent on unemployment was slightly less significant in the pre-
2007 period than the EU average but for the post-2007 period it was slightly more significant.
Social Dialogue: in the post-2007 period the share of companies with employee representation was much lower than the EU average (17.5% compared to 41.2%), however the share of
companies consulting employees before introducing restructuring measures was higher (92.9% compared to 76.7%).
Training: For both the pre-2007 and post-2007 periods the share of public expenditure on education; share of early school leavers; and share of adults participating in education and
training were more positive than the EU averages.
Skills: the skills profile for Austria indicates that the rate of lower secondary education attainment and tertiary attainment was lower for the pre-2007 and post-2007 periods when
compared to the EU averages. Lower secondary attainment did improve slightly against the EU from 25.1% to 24.1% compared to 35.1% and 31.9% respectively in the EU.
Productivity: the annual growth rate for productivity decreased from 1.7% to -0.1% between the two periods. Negative growth in productivity was seen in the post-2007 period compared
to growth of 0.2% across the EU.
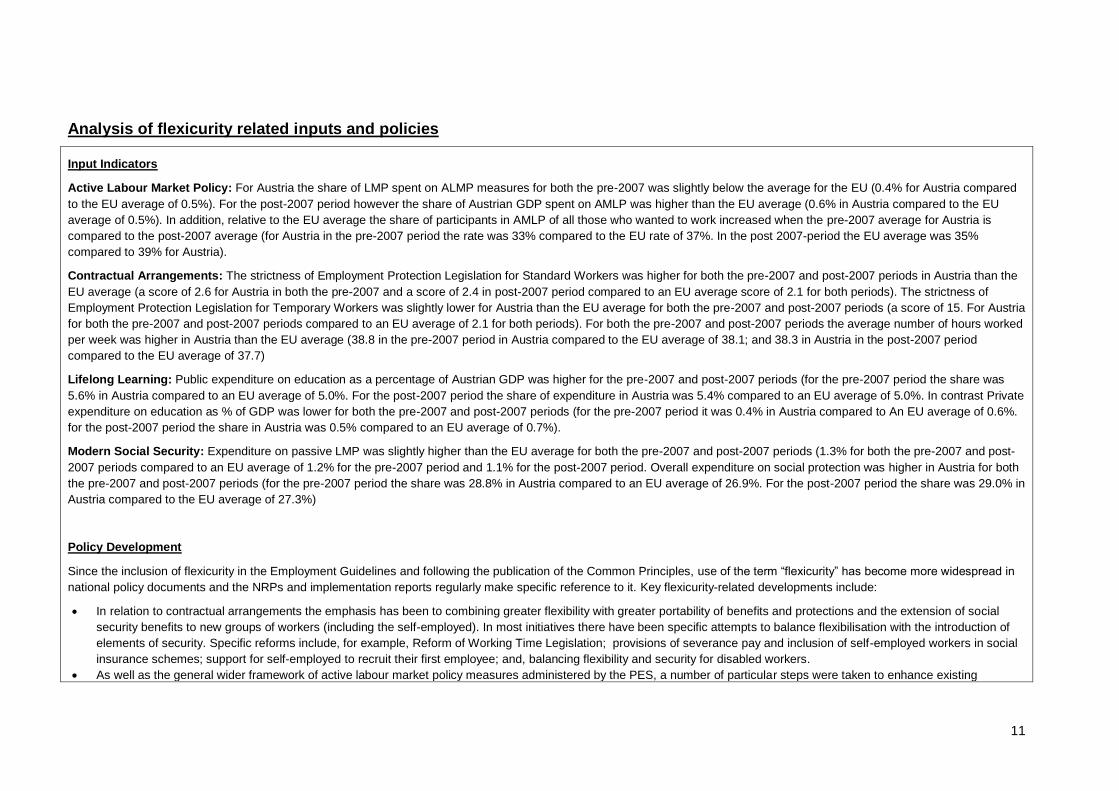
11
Analysis of flexicurity related inputs and policies
Input Indicators
Active Labour Market Policy: For Austria the share of LMP spent on ALMP measures for both the pre-2007 was slightly below the average for the EU (0.4% for Austria compared
to the EU average of 0.5%). For the post-2007 period however the share of Austrian GDP spent on AMLP was higher than the EU average (0.6% in Austria compared to the EU
average of 0.5%). In addition, relative to the EU average the share of participants in AMLP of all those who wanted to work increased when the pre-2007 average for Austria is
compared to the post-2007 average (for Austria in the pre-2007 period the rate was 33% compared to the EU rate of 37%. In the post 2007-period the EU average was 35%
compared to 39% for Austria).
Contractual Arrangements: The strictness of Employment Protection Legislation for Standard Workers was higher for both the pre-2007 and post-2007 periods in Austria than the
EU average (a score of 2.6 for Austria in both the pre-2007 and a score of 2.4 in post-2007 period compared to an EU average score of 2.1 for both periods). The strictness of
Employment Protection Legislation for Temporary Workers was slightly lower for Austria than the EU average for both the pre-2007 and post-2007 periods (a score of 15. For Austria
for both the pre-2007 and post-2007 periods compared to an EU average of 2.1 for both periods). For both the pre-2007 and post-2007 periods the average number of hours worked
per week was higher in Austria than the EU average (38.8 in the pre-2007 period in Austria compared to the EU average of 38.1; and 38.3 in Austria in the post-2007 period
compared to the EU average of 37.7)
Lifelong Learning: Public expenditure on education as a percentage of Austrian GDP was higher for the pre-2007 and post-2007 periods (for the pre-2007 period the share was
5.6% in Austria compared to an EU average of 5.0%. For the post-2007 period the share of expenditure in Austria was 5.4% compared to an EU average of 5.0%. In contrast Private
expenditure on education as % of GDP was lower for both the pre-2007 and post-2007 periods (for the pre-2007 period it was 0.4% in Austria compared to An EU average of 0.6%.
for the post-2007 period the share in Austria was 0.5% compared to an EU average of 0.7%).
Modern Social Security: Expenditure on passive LMP was slightly higher than the EU average for both the pre-2007 and post-2007 periods (1.3% for both the pre-2007 and post-
2007 periods compared to an EU average of 1.2% for the pre-2007 period and 1.1% for the post-2007 period. Overall expenditure on social protection was higher in Austria for both
the pre-2007 and post-2007 periods (for the pre-2007 period the share was 28.8% in Austria compared to an EU average of 26.9%. For the post-2007 period the share was 29.0% in
Austria compared to the EU average of 27.3%)
Policy Development
Since the inclusion of flexicurity in the Employment Guidelines and following the publication of the Common Principles, use of the term “flexicurity” has become more widespread in
national policy documents and the NRPs and implementation reports regularly make specific reference to it. Key flexicurity-related developments include:
In relation to contractual arrangements the emphasis has been to combining greater flexibility with greater portability of benefits and protections and the extension of social
security benefits to new groups of workers (including the self-employed). In most initiatives there have been specific attempts to balance flexibilisation with the introduction of
elements of security. Specific reforms include, for example, Reform of Working Time Legislation; provisions of severance pay and inclusion of self-employed workers in social
insurance schemes; support for self-employed to recruit their first employee; and, balancing flexibility and security for disabled workers.
As well as the general wider framework of active labour market policy measures administered by the PES, a number of particular steps were taken to enhance existing
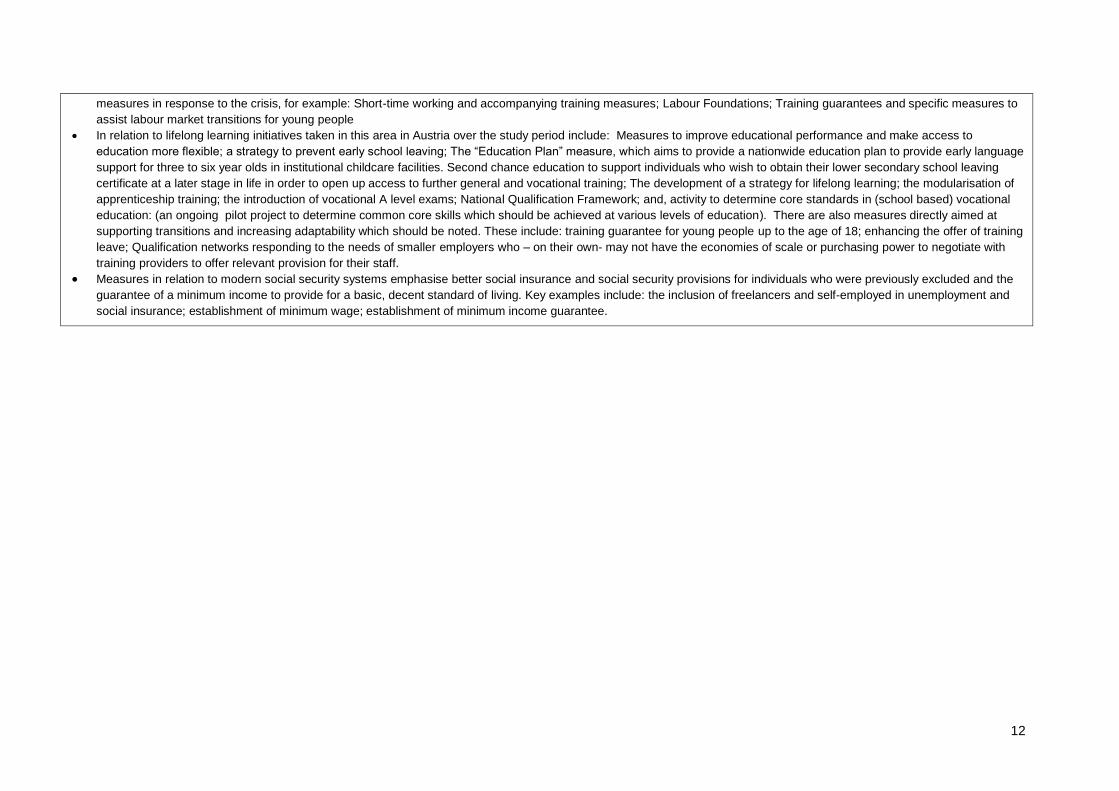
12
measures in response to the crisis, for example: Short-time working and accompanying training measures; Labour Foundations; Training guarantees and specific measures to
assist labour market transitions for young people
In relation to lifelong learning initiatives taken in this area in Austria over the study period include: Measures to improve educational performance and make access to
education more flexible; a strategy to prevent early school leaving; The “Education Plan” measure, which aims to provide a nationwide education plan to provide early language
support for three to six year olds in institutional childcare facilities. Second chance education to support individuals who wish to obtain their lower secondary school leaving
certificate at a later stage in life in order to open up access to further general and vocational training; The development of a strategy for lifelong learning; the modularisation of
apprenticeship training; the introduction of vocational A level exams; National Qualification Framework; and, activity to determine core standards in (school based) vocational
education: (an ongoing pilot project to determine common core skills which should be achieved at various levels of education). There are also measures directly aimed at
supporting transitions and increasing adaptability which should be noted. These include: training guarantee for young people up to the age of 18; enhancing the offer of training
leave; Qualification networks responding to the needs of smaller employers who – on their own- may not have the economies of scale or purchasing power to negotiate with
training providers to offer relevant provision for their staff.
Measures in relation to modern social security systems emphasise better social insurance and social security provisions for individuals who were previously excluded and the
guarantee of a minimum income to provide for a basic, decent standard of living. Key examples include: the inclusion of freelancers and self-employed in unemployment and
social insurance; establishment of minimum wage; establishment of minimum income guarantee.
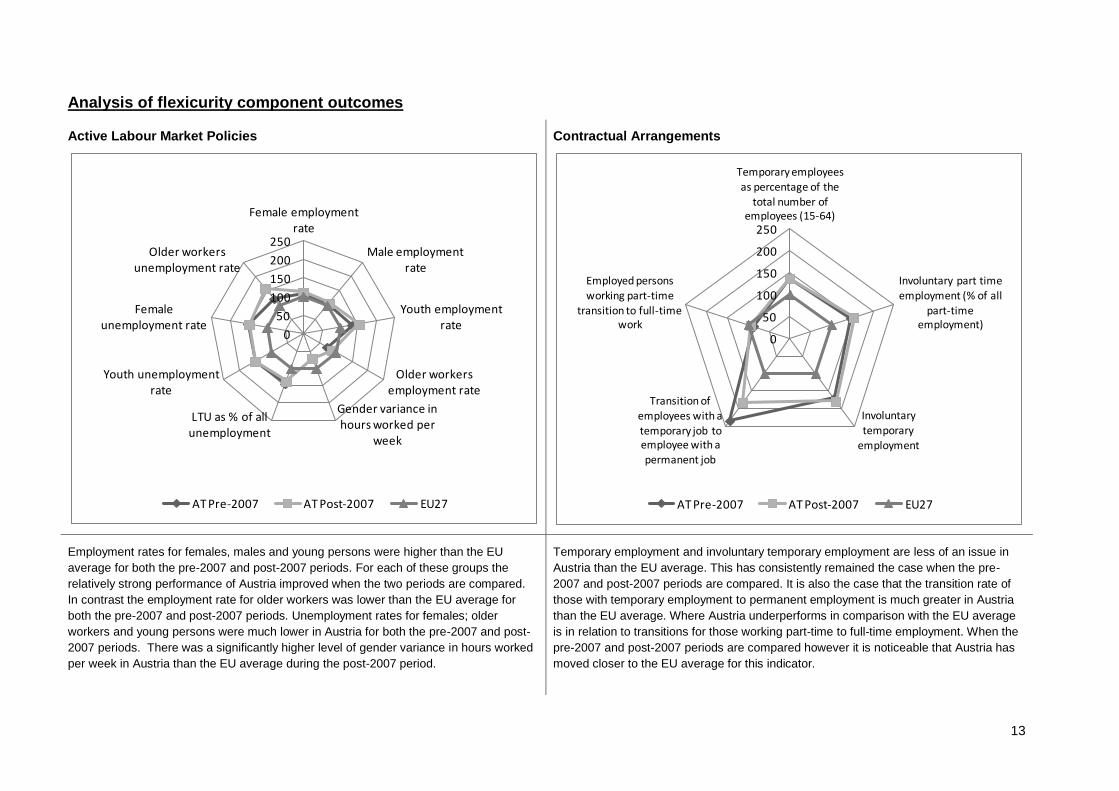
13
Analysis of flexicurity component outcomes
Active Labour Market Policies
Contractual Arrangements
Employment rates for females, males and young persons were higher than the EU
average for both the pre-2007 and post-2007 periods. For each of these groups the
relatively strong performance of Austria improved when the two periods are compared.
In contrast the employment rate for older workers was lower than the EU average for
both the pre-2007 and post-2007 periods. Unemployment rates for females; older
workers and young persons were much lower in Austria for both the pre-2007 and post-
2007 periods. There was a significantly higher level of gender variance in hours worked
per week in Austria than the EU average during the post-2007 period.
Temporary employment and involuntary temporary employment are less of an issue in
Austria than the EU average. This has consistently remained the case when the pre-
2007 and post-2007 periods are compared. It is also the case that the transition rate of
those with temporary employment to permanent employment is much greater in Austria
than the EU average. Where Austria underperforms in comparison with the EU average
is in relation to transitions for those working part-time to full-time employment. When the
pre-2007 and post-2007 periods are compared however it is noticeable that Austria has
moved closer to the EU average for this indicator.
0
50
100
150
200
250
Female employment rate
Male employment rate
Youth employment rate
Older workers employment rate
Gender variance in hours worked per
week
LTU as % of all unemployment
Youth unemployment rate
Female unemployment rate
Older workers unemployment rate
AT Pre-2007 AT Post-2007 EU27
0
50
100
150
200
250
Temporary employees
as percentage of the total number of
employees (15-64)
Involuntary part time employment (% of all
part-time employment)
Involuntary
temporary employment
Transition of employees with a temporary job to employee with a permanent job
Employed persons working part-time
transition to full-time work
AT Pre-2007 AT Post-2007 EU27
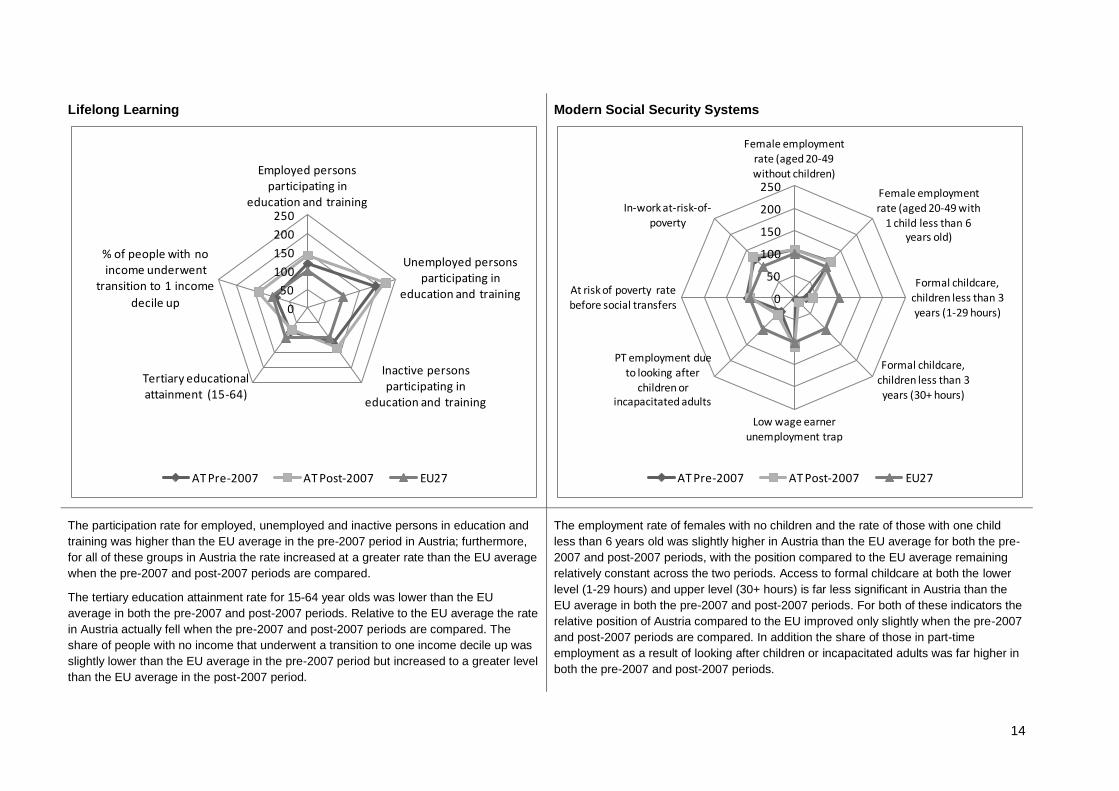
14
Lifelong Learning
Modern Social Security Systems
The participation rate for employed, unemployed and inactive persons in education and
training was higher than the EU average in the pre-2007 period in Austria; furthermore,
for all of these groups in Austria the rate increased at a greater rate than the EU average
when the pre-2007 and post-2007 periods are compared.
The tertiary education attainment rate for 15-64 year olds was lower than the EU
average in both the pre-2007 and post-2007 periods. Relative to the EU average the rate
in Austria actually fell when the pre-2007 and post-2007 periods are compared. The
share of people with no income that underwent a transition to one income decile up was
slightly lower than the EU average in the pre-2007 period but increased to a greater level
than the EU average in the post-2007 period.
The employment rate of females with no children and the rate of those with one child
less than 6 years old was slightly higher in Austria than the EU average for both the pre-
2007 and post-2007 periods, with the position compared to the EU average remaining
relatively constant across the two periods. Access to formal childcare at both the lower
level (1-29 hours) and upper level (30+ hours) is far less significant in Austria than the
EU average in both the pre-2007 and post-2007 periods. For both of these indicators the
relative position of Austria compared to the EU improved only slightly when the pre-2007
and post-2007 periods are compared. In addition the share of those in part-time
employment as a result of looking after children or incapacitated adults was far higher in
both the pre-2007 and post-2007 periods.
0
50
100
150
200
250
Employed persons participating in
education and training
Unemployed persons participating in
education and training
Inactive persons participating in
education and training
Tertiary educational attainment (15-64)
% of people with no income underwent
transition to 1 income
decile up
AT Pre-2007 AT Post-2007 EU27
0
50
100
150
200
250
Female employment rate (aged 20-49 without children)
Female employment rate (aged 20-49 with
1 child less than 6 years old)
Formal childcare, children less than 3 years (1-29 hours)
Formal childcare, children less than 3
years (30+ hours)
Low wage earner unemployment trap
PT employment due to looking after
children or incapacitated adults
At risk of poverty rate before social transfers
In-work at-risk-of-poverty
AT Pre-2007 AT Post-2007 EU27
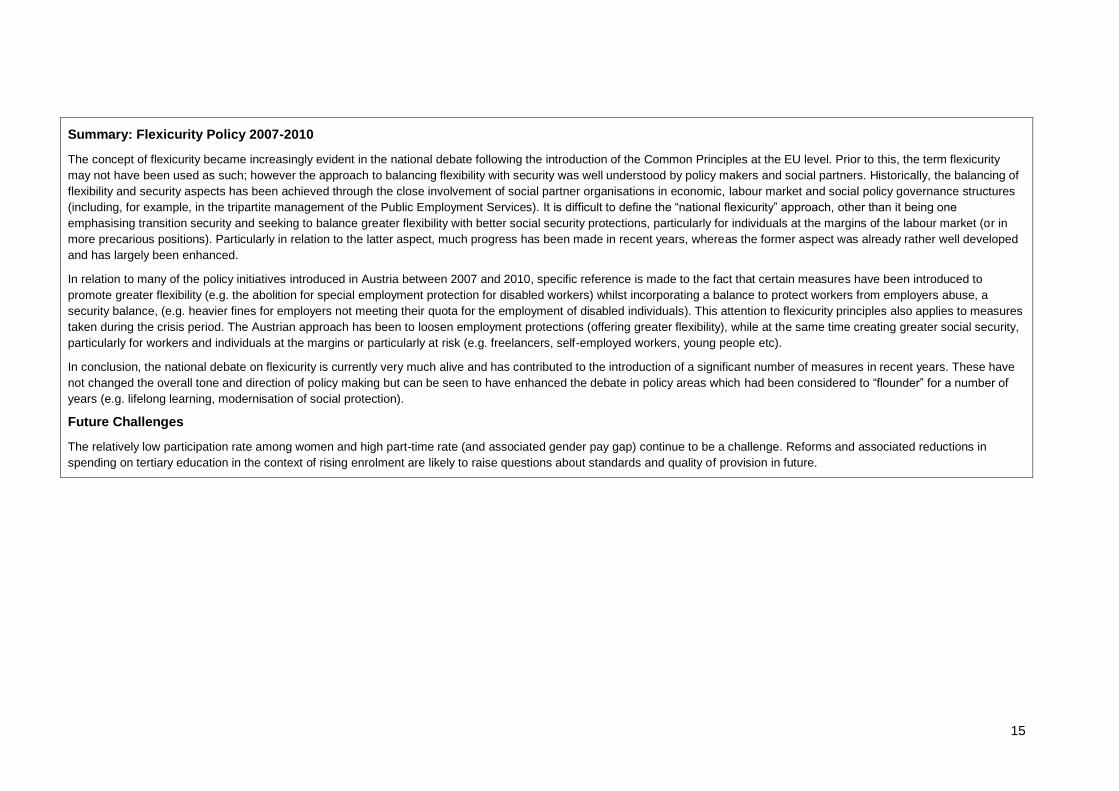
15
Summary: Flexicurity Policy 2007-2010
The concept of flexicurity became increasingly evident in the national debate following the introduction of the Common Principles at the EU level. Prior to this, the term flexicurity
may not have been used as such; however the approach to balancing flexibility with security was well understood by policy makers and social partners. Historically, the balancing of
flexibility and security aspects has been achieved through the close involvement of social partner organisations in economic, labour market and social policy governance structures
(including, for example, in the tripartite management of the Public Employment Services). It is difficult to define the “national flexicurity” approach, other than it being one
emphasising transition security and seeking to balance greater flexibility with better social security protections, particularly for individuals at the margins of the labour market (or in
more precarious positions). Particularly in relation to the latter aspect, much progress has been made in recent years, whereas the former aspect was already rather well developed
and has largely been enhanced.
In relation to many of the policy initiatives introduced in Austria between 2007 and 2010, specific reference is made to the fact that certain measures have been introduced to
promote greater flexibility (e.g. the abolition for special employment protection for disabled workers) whilst incorporating a balance to protect workers from employers abuse, a
security balance, (e.g. heavier fines for employers not meeting their quota for the employment of disabled individuals). This attention to flexicurity principles also applies to measures
taken during the crisis period. The Austrian approach has been to loosen employment protections (offering greater flexibility), while at the same time creating greater social security,
particularly for workers and individuals at the margins or particularly at risk (e.g. freelancers, self-employed workers, young people etc).
In conclusion, the national debate on flexicurity is currently very much alive and has contributed to the introduction of a significant number of measures in recent years. These have
not changed the overall tone and direction of policy making but can be seen to have enhanced the debate in policy areas which had been considered to “flounder” for a number of
years (e.g. lifelong learning, modernisation of social protection).
Future Challenges
The relatively low participation rate among women and high part-time rate (and associated gender pay gap) continue to be a challenge. Reforms and associated reductions in
spending on tertiary education in the context of rising enrolment are likely to raise questions about standards and quality of provision in future.

16
3 Belgium
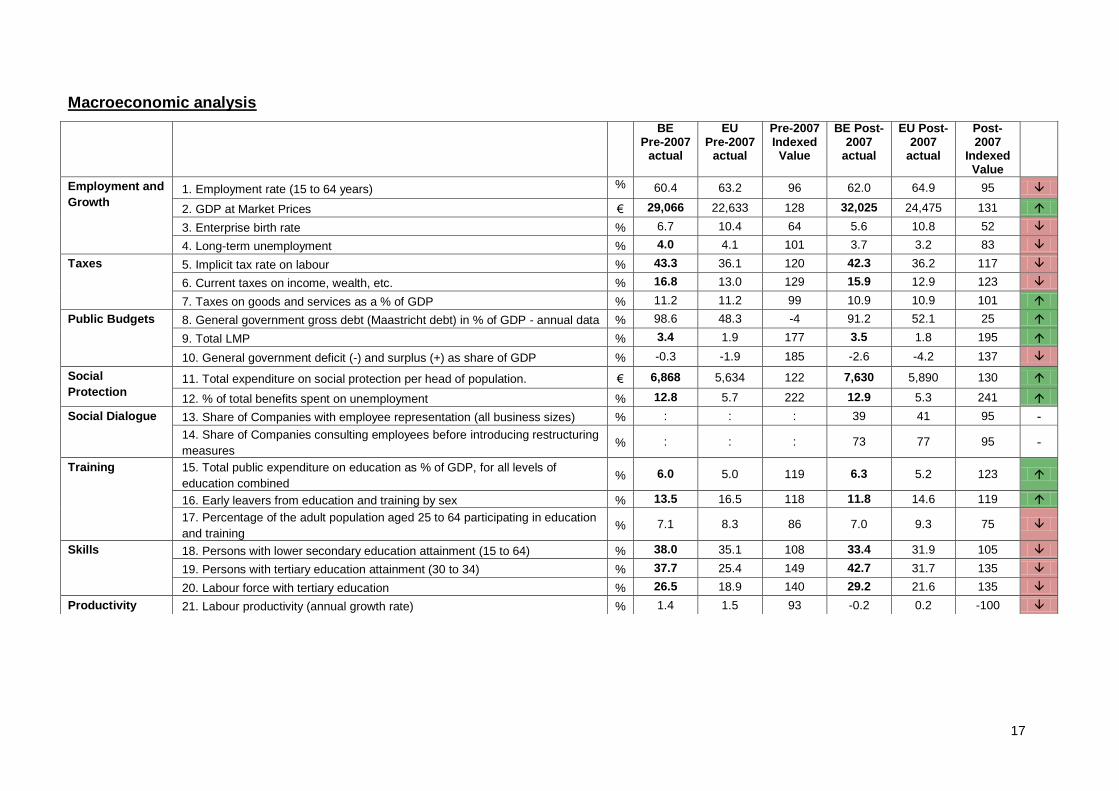
17
Macroeconomic analysis
BE Pre-2007
actual
EU Pre-2007
actual
Pre-2007 Indexed Value
BE Post-2007
actual
EU Post-2007
actual
Post-2007
Indexed Value
Employment and
Growth 1. Employment rate (15 to 64 years) % 60.4 63.2 96 62.0 64.9 95
2. GDP at Market Prices € 29,066 22,633 128 32,025 24,475 131
3. Enterprise birth rate % 6.7 10.4 64 5.6 10.8 52
4. Long-term unemployment % 4.0 4.1 101 3.7 3.2 83
Taxes 5. Implicit tax rate on labour % 43.3 36.1 120 42.3 36.2 117
6. Current taxes on income, wealth, etc. % 16.8 13.0 129 15.9 12.9 123
7. Taxes on goods and services as a % of GDP % 11.2 11.2 99 10.9 10.9 101
Public Budgets 8. General government gross debt (Maastricht debt) in % of GDP - annual data % 98.6 48.3 -4 91.2 52.1 25
9. Total LMP % 3.4 1.9 177 3.5 1.8 195
10. General government deficit (-) and surplus (+) as share of GDP % -0.3 -1.9 185 -2.6 -4.2 137
Social
Protection 11. Total expenditure on social protection per head of population. € 6,868 5,634 122 7,630 5,890 130
12. % of total benefits spent on unemployment % 12.8 5.7 222 12.9 5.3 241
Social Dialogue 13. Share of Companies with employee representation (all business sizes) % : : : 39 41 95 -
14. Share of Companies consulting employees before introducing restructuring
measures % : : : 73 77 95 -
Training 15. Total public expenditure on education as % of GDP, for all levels of
education combined % 6.0 5.0 119 6.3 5.2 123
16. Early leavers from education and training by sex % 13.5 16.5 118 11.8 14.6 119
17. Percentage of the adult population aged 25 to 64 participating in education
and training % 7.1 8.3 86 7.0 9.3 75
Skills 18. Persons with lower secondary education attainment (15 to 64) % 38.0 35.1 108 33.4 31.9 105
19. Persons with tertiary education attainment (30 to 34) % 37.7 25.4 149 42.7 31.7 135
20. Labour force with tertiary education % 26.5 18.9 140 29.2 21.6 135
Productivity 21. Labour productivity (annual growth rate) % 1.4 1.5 93 -0.2 0.2 -100
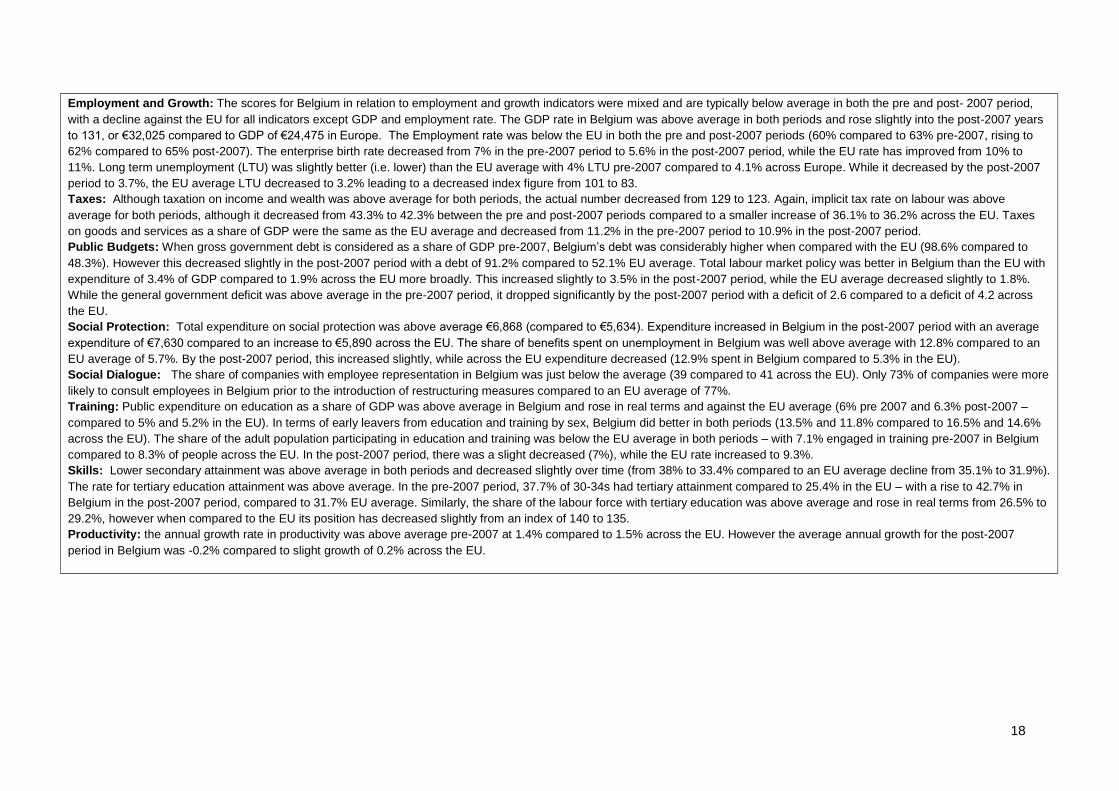
18
Employment and Growth: The scores for Belgium in relation to employment and growth indicators were mixed and are typically below average in both the pre and post- 2007 period,
with a decline against the EU for all indicators except GDP and employment rate. The GDP rate in Belgium was above average in both periods and rose slightly into the post-2007 years
to 131, or €32,025 compared to GDP of €24,475 in Europe. The Employment rate was below the EU in both the pre and post-2007 periods (60% compared to 63% pre-2007, rising to
62% compared to 65% post-2007). The enterprise birth rate decreased from 7% in the pre-2007 period to 5.6% in the post-2007 period, while the EU rate has improved from 10% to
11%. Long term unemployment (LTU) was slightly better (i.e. lower) than the EU average with 4% LTU pre-2007 compared to 4.1% across Europe. While it decreased by the post-2007
period to 3.7%, the EU average LTU decreased to 3.2% leading to a decreased index figure from 101 to 83.
Taxes: Although taxation on income and wealth was above average for both periods, the actual number decreased from 129 to 123. Again, implicit tax rate on labour was above
average for both periods, although it decreased from 43.3% to 42.3% between the pre and post-2007 periods compared to a smaller increase of 36.1% to 36.2% across the EU. Taxes
on goods and services as a share of GDP were the same as the EU average and decreased from 11.2% in the pre-2007 period to 10.9% in the post-2007 period.
Public Budgets: When gross government debt is considered as a share of GDP pre-2007, Belgium’s debt was considerably higher when compared with the EU (98.6% compared to
48.3%). However this decreased slightly in the post-2007 period with a debt of 91.2% compared to 52.1% EU average. Total labour market policy was better in Belgium than the EU with
expenditure of 3.4% of GDP compared to 1.9% across the EU more broadly. This increased slightly to 3.5% in the post-2007 period, while the EU average decreased slightly to 1.8%.
While the general government deficit was above average in the pre-2007 period, it dropped significantly by the post-2007 period with a deficit of 2.6 compared to a deficit of 4.2 across
the EU.
Social Protection: Total expenditure on social protection was above average €6,868 (compared to €5,634). Expenditure increased in Belgium in the post-2007 period with an average
expenditure of €7,630 compared to an increase to €5,890 across the EU. The share of benefits spent on unemployment in Belgium was well above average with 12.8% compared to an
EU average of 5.7%. By the post-2007 period, this increased slightly, while across the EU expenditure decreased (12.9% spent in Belgium compared to 5.3% in the EU).
Social Dialogue: The share of companies with employee representation in Belgium was just below the average (39 compared to 41 across the EU). Only 73% of companies were more
likely to consult employees in Belgium prior to the introduction of restructuring measures compared to an EU average of 77%.
Training: Public expenditure on education as a share of GDP was above average in Belgium and rose in real terms and against the EU average (6% pre 2007 and 6.3% post-2007 –
compared to 5% and 5.2% in the EU). In terms of early leavers from education and training by sex, Belgium did better in both periods (13.5% and 11.8% compared to 16.5% and 14.6%
across the EU). The share of the adult population participating in education and training was below the EU average in both periods – with 7.1% engaged in training pre-2007 in Belgium
compared to 8.3% of people across the EU. In the post-2007 period, there was a slight decreased (7%), while the EU rate increased to 9.3%.
Skills: Lower secondary attainment was above average in both periods and decreased slightly over time (from 38% to 33.4% compared to an EU average decline from 35.1% to 31.9%).
The rate for tertiary education attainment was above average. In the pre-2007 period, 37.7% of 30-34s had tertiary attainment compared to 25.4% in the EU – with a rise to 42.7% in
Belgium in the post-2007 period, compared to 31.7% EU average. Similarly, the share of the labour force with tertiary education was above average and rose in real terms from 26.5% to
29.2%, however when compared to the EU its position has decreased slightly from an index of 140 to 135.
Productivity: the annual growth rate in productivity was above average pre-2007 at 1.4% compared to 1.5% across the EU. However the average annual growth for the post-2007
period in Belgium was -0.2% compared to slight growth of 0.2% across the EU.
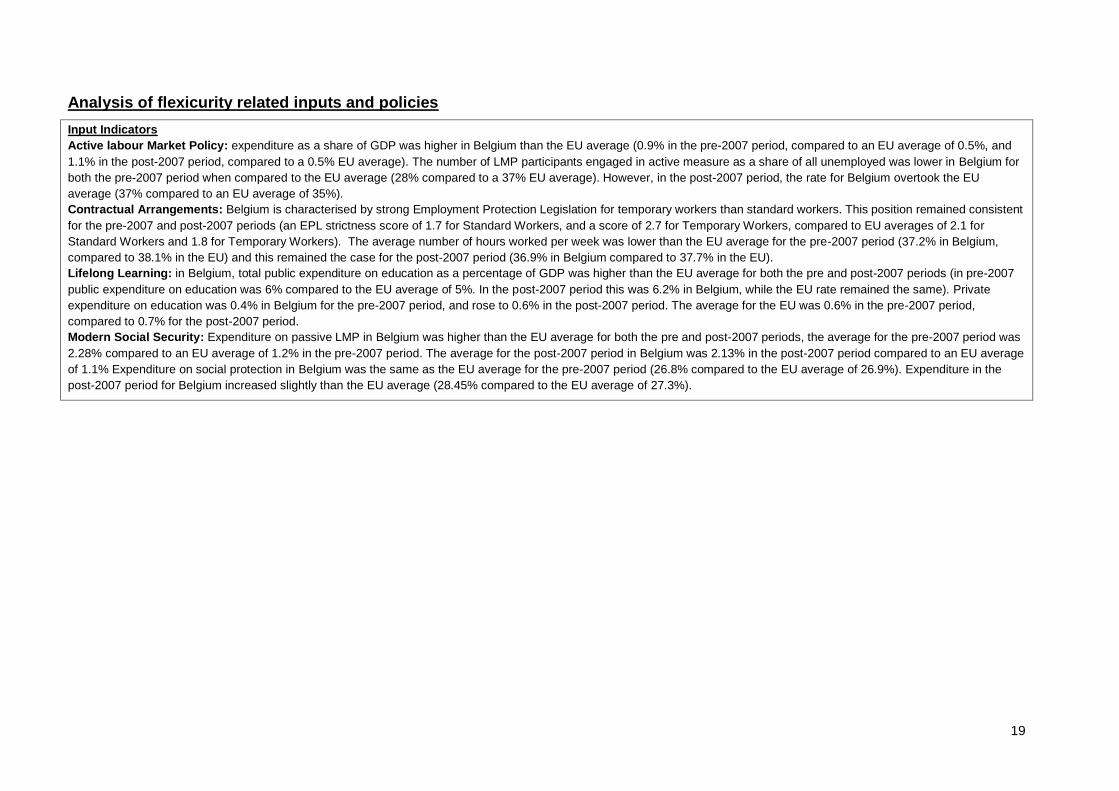
19
Analysis of flexicurity related inputs and policies
Input Indicators
Active labour Market Policy: expenditure as a share of GDP was higher in Belgium than the EU average (0.9% in the pre-2007 period, compared to an EU average of 0.5%, and
1.1% in the post-2007 period, compared to a 0.5% EU average). The number of LMP participants engaged in active measure as a share of all unemployed was lower in Belgium for
both the pre-2007 period when compared to the EU average (28% compared to a 37% EU average). However, in the post-2007 period, the rate for Belgium overtook the EU
average (37% compared to an EU average of 35%).
Contractual Arrangements: Belgium is characterised by strong Employment Protection Legislation for temporary workers than standard workers. This position remained consistent
for the pre-2007 and post-2007 periods (an EPL strictness score of 1.7 for Standard Workers, and a score of 2.7 for Temporary Workers, compared to EU averages of 2.1 for
Standard Workers and 1.8 for Temporary Workers). The average number of hours worked per week was lower than the EU average for the pre-2007 period (37.2% in Belgium,
compared to 38.1% in the EU) and this remained the case for the post-2007 period (36.9% in Belgium compared to 37.7% in the EU).
Lifelong Learning: in Belgium, total public expenditure on education as a percentage of GDP was higher than the EU average for both the pre and post-2007 periods (in pre-2007
public expenditure on education was 6% compared to the EU average of 5%. In the post-2007 period this was 6.2% in Belgium, while the EU rate remained the same). Private
expenditure on education was 0.4% in Belgium for the pre-2007 period, and rose to 0.6% in the post-2007 period. The average for the EU was 0.6% in the pre-2007 period,
compared to 0.7% for the post-2007 period.
Modern Social Security: Expenditure on passive LMP in Belgium was higher than the EU average for both the pre and post-2007 periods, the average for the pre-2007 period was
2.28% compared to an EU average of 1.2% in the pre-2007 period. The average for the post-2007 period in Belgium was 2.13% in the post-2007 period compared to an EU average
of 1.1% Expenditure on social protection in Belgium was the same as the EU average for the pre-2007 period (26.8% compared to the EU average of 26.9%). Expenditure in the
post-2007 period for Belgium increased slightly than the EU average (28.45% compared to the EU average of 27.3%).
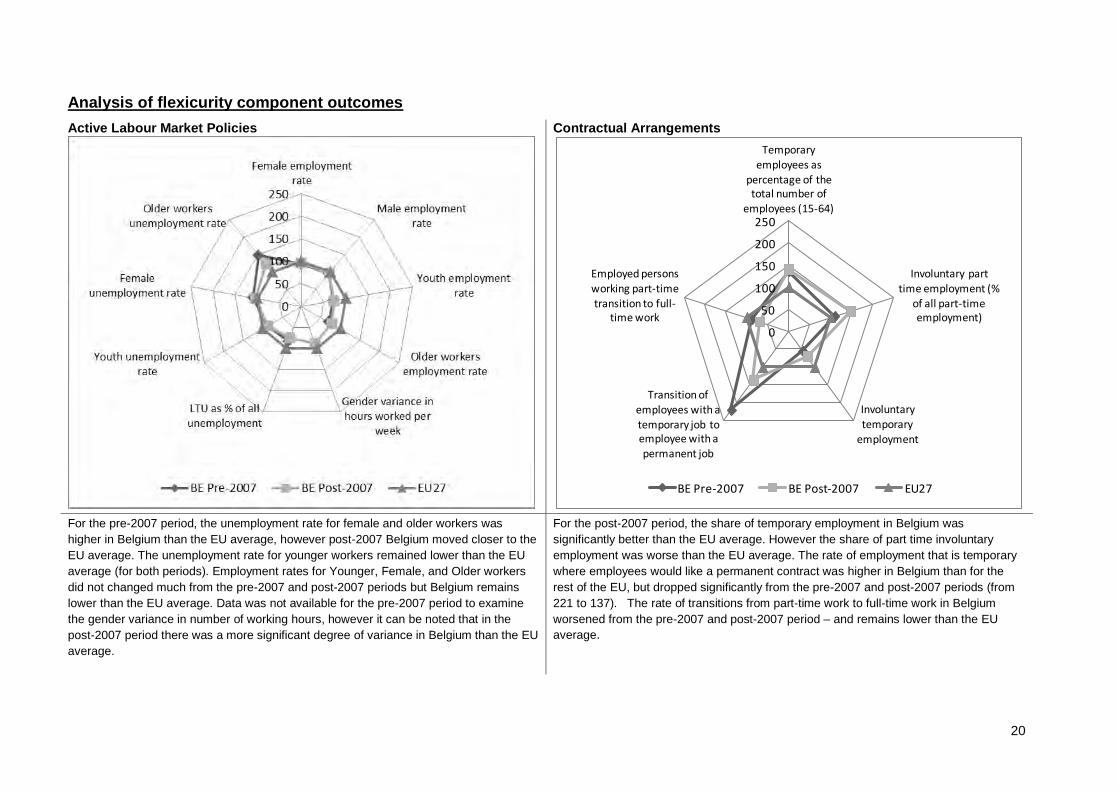
20
Analysis of flexicurity component outcomes
Active Labour Market Policies
Contractual Arrangements
For the pre-2007 period, the unemployment rate for female and older workers was
higher in Belgium than the EU average, however post-2007 Belgium moved closer to the
EU average. The unemployment rate for younger workers remained lower than the EU
average (for both periods). Employment rates for Younger, Female, and Older workers
did not changed much from the pre-2007 and post-2007 periods but Belgium remains
lower than the EU average. Data was not available for the pre-2007 period to examine
the gender variance in number of working hours, however it can be noted that in the
post-2007 period there was a more significant degree of variance in Belgium than the EU
average.
For the post-2007 period, the share of temporary employment in Belgium was
significantly better than the EU average. However the share of part time involuntary
employment was worse than the EU average. The rate of employment that is temporary
where employees would like a permanent contract was higher in Belgium than for the
rest of the EU, but dropped significantly from the pre-2007 and post-2007 periods (from
221 to 137). The rate of transitions from part-time work to full-time work in Belgium
worsened from the pre-2007 and post-2007 period – and remains lower than the EU
average.
0
50
100
150
200
250
Temporary
employees as percentage of the total number of
employees (15-64)
Involuntary part time employment (%
of all part-time employment)
Involuntary temporary
employment
Transition of employees with a temporary job to employee with a permanent job
Employed persons working part-time transition to full-
time work
BE Pre-2007 BE Post-2007 EU27
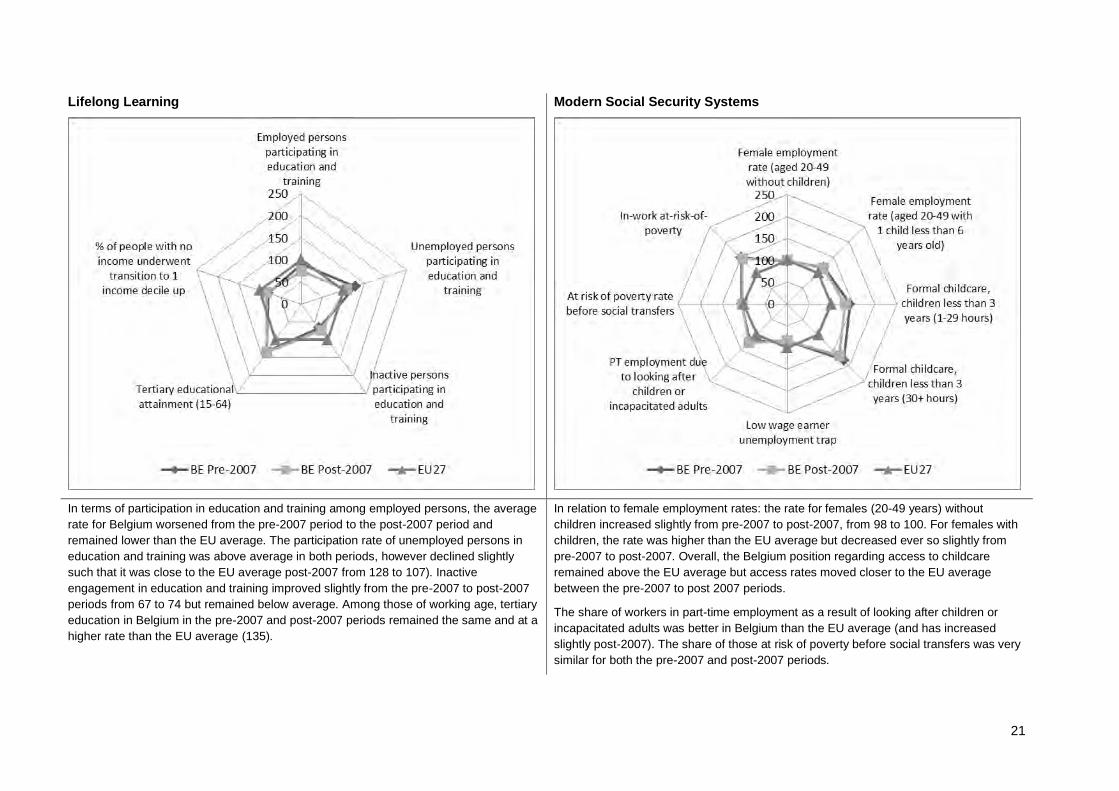
21
Lifelong Learning
Modern Social Security Systems
In terms of participation in education and training among employed persons, the average
rate for Belgium worsened from the pre-2007 period to the post-2007 period and
remained lower than the EU average. The participation rate of unemployed persons in
education and training was above average in both periods, however declined slightly
such that it was close to the EU average post-2007 from 128 to 107). Inactive
engagement in education and training improved slightly from the pre-2007 to post-2007
periods from 67 to 74 but remained below average. Among those of working age, tertiary
education in Belgium in the pre-2007 and post-2007 periods remained the same and at a
higher rate than the EU average (135).
In relation to female employment rates: the rate for females (20-49 years) without
children increased slightly from pre-2007 to post-2007, from 98 to 100. For females with
children, the rate was higher than the EU average but decreased ever so slightly from
pre-2007 to post-2007. Overall, the Belgium position regarding access to childcare
remained above the EU average but access rates moved closer to the EU average
between the pre-2007 to post 2007 periods.
The share of workers in part-time employment as a result of looking after children or
incapacitated adults was better in Belgium than the EU average (and has increased
slightly post-2007). The share of those at risk of poverty before social transfers was very
similar for both the pre-2007 and post-2007 periods.
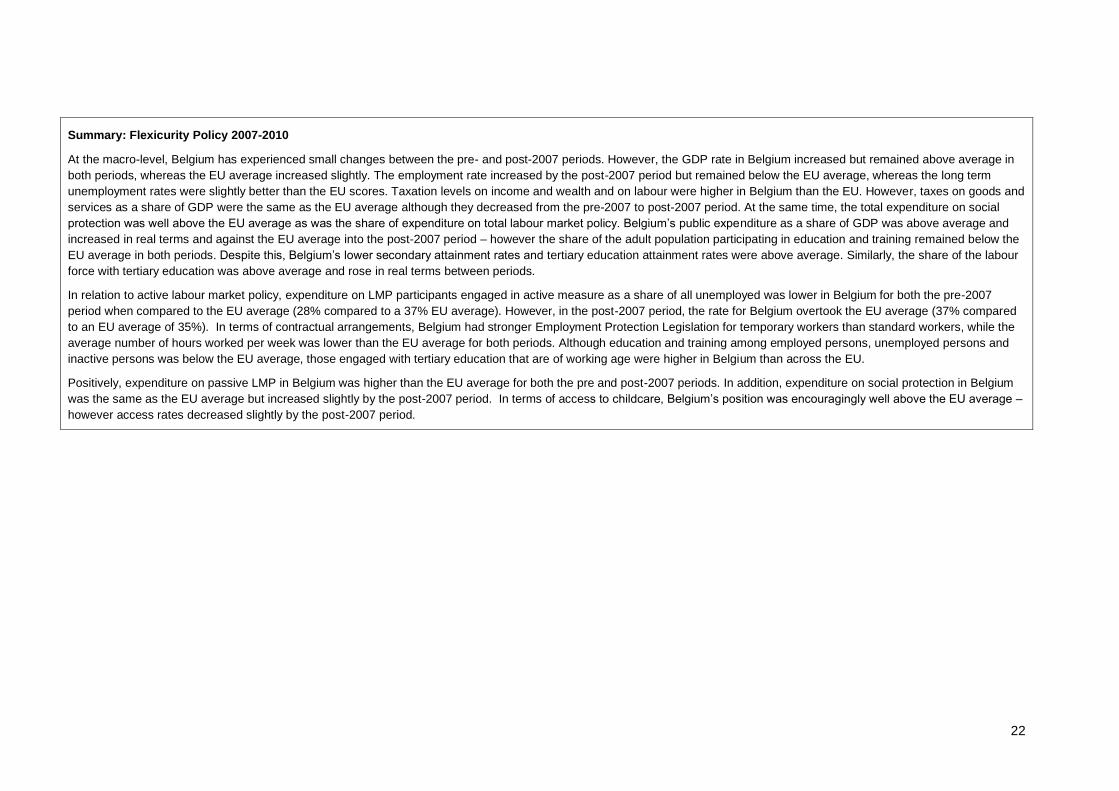
22
Summary: Flexicurity Policy 2007-2010
At the macro-level, Belgium has experienced small changes between the pre- and post-2007 periods. However, the GDP rate in Belgium increased but remained above average in
both periods, whereas the EU average increased slightly. The employment rate increased by the post-2007 period but remained below the EU average, whereas the long term
unemployment rates were slightly better than the EU scores. Taxation levels on income and wealth and on labour were higher in Belgium than the EU. However, taxes on goods and
services as a share of GDP were the same as the EU average although they decreased from the pre-2007 to post-2007 period. At the same time, the total expenditure on social
protection was well above the EU average as was the share of expenditure on total labour market policy. Belgium’s public expenditure as a share of GDP was above average and
increased in real terms and against the EU average into the post-2007 period – however the share of the adult population participating in education and training remained below the
EU average in both periods. Despite this, Belgium’s lower secondary attainment rates and tertiary education attainment rates were above average. Similarly, the share of the labour
force with tertiary education was above average and rose in real terms between periods.
In relation to active labour market policy, expenditure on LMP participants engaged in active measure as a share of all unemployed was lower in Belgium for both the pre-2007
period when compared to the EU average (28% compared to a 37% EU average). However, in the post-2007 period, the rate for Belgium overtook the EU average (37% compared
to an EU average of 35%). In terms of contractual arrangements, Belgium had stronger Employment Protection Legislation for temporary workers than standard workers, while the
average number of hours worked per week was lower than the EU average for both periods. Although education and training among employed persons, unemployed persons and
inactive persons was below the EU average, those engaged with tertiary education that are of working age were higher in Belgium than across the EU.
Positively, expenditure on passive LMP in Belgium was higher than the EU average for both the pre and post-2007 periods. In addition, expenditure on social protection in Belgium
was the same as the EU average but increased slightly by the post-2007 period. In terms of access to childcare, Belgium’s position was encouragingly well above the EU average –
however access rates decreased slightly by the post-2007 period.

23
4 Bulgaria
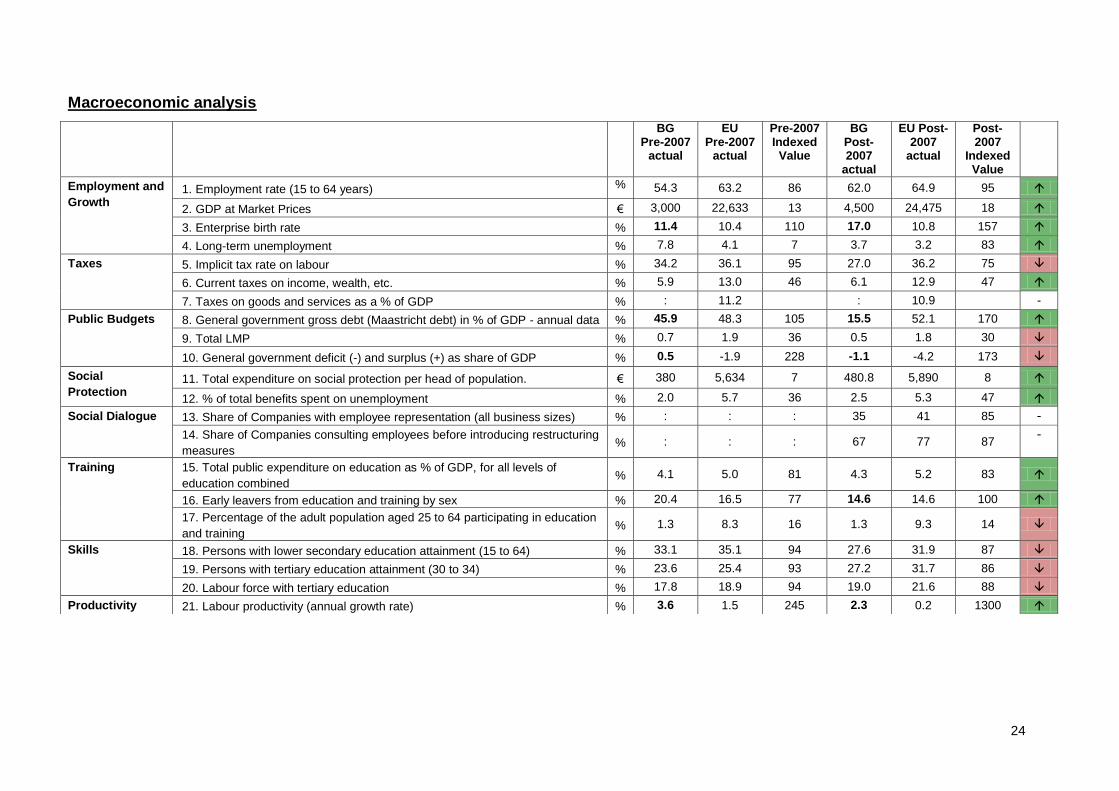
24
Macroeconomic analysis
BG Pre-2007
actual
EU Pre-2007
actual
Pre-2007 Indexed Value
BG Post-2007
actual
EU Post-2007
actual
Post-2007
Indexed Value
Employment and
Growth 1. Employment rate (15 to 64 years) % 54.3 63.2 86 62.0 64.9 95
2. GDP at Market Prices € 3,000 22,633 13 4,500 24,475 18
3. Enterprise birth rate % 11.4 10.4 110 17.0 10.8 157
4. Long-term unemployment % 7.8 4.1 7 3.7 3.2 83
Taxes 5. Implicit tax rate on labour % 34.2 36.1 95 27.0 36.2 75
6. Current taxes on income, wealth, etc. % 5.9 13.0 46 6.1 12.9 47
7. Taxes on goods and services as a % of GDP % : 11.2 : 10.9 -
Public Budgets 8. General government gross debt (Maastricht debt) in % of GDP - annual data % 45.9 48.3 105 15.5 52.1 170
9. Total LMP % 0.7 1.9 36 0.5 1.8 30
10. General government deficit (-) and surplus (+) as share of GDP % 0.5 -1.9 228 -1.1 -4.2 173
Social
Protection 11. Total expenditure on social protection per head of population. € 380 5,634 7 480.8 5,890 8
12. % of total benefits spent on unemployment % 2.0 5.7 36 2.5 5.3 47
Social Dialogue 13. Share of Companies with employee representation (all business sizes) % : : : 35 41 85 -
14. Share of Companies consulting employees before introducing restructuring
measures % : : : 67 77 87
-
Training 15. Total public expenditure on education as % of GDP, for all levels of
education combined % 4.1 5.0 81 4.3 5.2 83
16. Early leavers from education and training by sex % 20.4 16.5 77 14.6 14.6 100
17. Percentage of the adult population aged 25 to 64 participating in education
and training % 1.3 8.3 16 1.3 9.3 14
Skills 18. Persons with lower secondary education attainment (15 to 64) % 33.1 35.1 94 27.6 31.9 87
19. Persons with tertiary education attainment (30 to 34) % 23.6 25.4 93 27.2 31.7 86
20. Labour force with tertiary education % 17.8 18.9 94 19.0 21.6 88
Productivity 21. Labour productivity (annual growth rate) % 3.6 1.5 245 2.3 0.2 1300
25
Employment and Growth: The scores for Bulgaria in relation to employment and growth indicators were mixed. Employment rates were just below average for the pre-2007 period
(54.3%), but increased to 62% in the post-2007 period, compared to an EU average of 63% in the pre-2007 period and 65% in the post-2007 period. The GDP rate was also below the
EU average, at €3,000 compared to €22,633 in Europe in the pre-2007 period. While it increased to €4,500 in the post-2007 period and the European rate increased to €24,475, Bulgaria
remained well below average in both periods. The enterprise birth rate increased from 11.4% in the pre-2007 period to 17% in the post-2007 period and improved considerably compared
to the EU average for the same periods (110 to 157). Long term unemployment was much higher than the EU average in the pre-2007 period (7.8% compared with 4.1%) however it
decreased significantly by the post-2007 period compared to a lower decrease across the EU which meant that Bulgaria’s position was much better post-2007 (scoring 87).
Taxes: Taxation on income and wealth was below the EU average for both periods and improved slightly against the EU from 46 to 47. The implicit tax rate on labour was below average
for both periods and decreased from 34.2% to 27% between the pre and post-2007 periods compared to a smaller increase of 36.1% to 36.2% across the EU. There is no data available
for Bulgaria in relation to taxes on goods and services as a share of GDP but at the EU level it decreased from 11.2% to 10.9% from the pre-2007 period to the post-2007 period.
Public Budgets: When gross government debt is considered as a share of GDP pre-2007, Bulgaria was slightly better than the EU average, with debt of 45.9% compared to 48.3%
across the EU. However this decreased considerably to the post-2007 period with a debt of 15.5% compared to 52.1% EU average. Total labour market policy was worse in Bulgaria
than the EU with expenditure of 0.7% of GDP compared to 0.5% across the EU more broadly. This decreased to 0.5% in the post-2007 period as did the EU average (1.8%). While there
was a general government deficit across the EU pre-2007, the Bulgarian government had a surplus of 0.5%. While in the post-2007 period it decreased to -1.1%, it remained above the
EU average for the period of -4.2%.
Social Protection: Total expenditure on social protection is well below average in the pre-2007 period (€380 compared to the EU average of €5,634). Expenditure in Bulgaria increased
in the post-2007 period with an average expenditure of €480 compared to an increase to €5,890 across the EU. The share of benefits spent on unemployment in Bulgaria is also below
average with 2% compared to an EU average of 5.7%. By the post-2007 period, the share of benefits spent on unemployment increased to 2.5% in Bulgaria, while the expenditure on an
EU level decreased to 5.3%.
Social Dialogue: The share of companies with employee representation in Bulgaria was well below the average in the post-2007 period (35% compared to 41% across the EU). In
addition, only 67% of companies in Bulgaria were likely to consult employees prior to the introduction of restructuring measures compared to an EU average of 77%.
Training: Public expenditure on education as a share of GDP was below average in Bulgaria and while it rose slightly in the post-2007 period it remained below average (4.1% pre 2007
and 4.3% post-2007 – compared to 5% and 5.2% in the EU). The share of the adult population participating in education and training was significantly lower than the EU average in both
periods – with 1.3% engaged in training pre-2007 compared to 8.3% of people across the EU. This remained the same in the post-2007 period, while the EU average increased to 9.3%.
Skills: Lower secondary attainment is below average in both periods and has declined over time (from 33.1% to 27.6% compared to an EU average decline from 35.1% to 31.9%) as is
tertiary education. In the pre-2007 period, 23.6% of 30-34s had tertiary attainment compared to 25.4% in the EU – with a rise to 27.2% in Bulgaria in the post-2007 period, compared to
31.7% EU average. Similarly, the share of the labour force with tertiary education was below average in both period and while it increased in real terms from 17.8% to 19%, due to a
larger increase in the EU average, against the EU its position decreased slightly from an index of 94 to 88.
Productivity: the annual growth rate in productivity was above average pre-2007 at 3.6% compared to 1.5% across the EU. While the average annual growth rate for the post-2007
period in Bulgaria decreased to 2.3%, it remained above average compared to the EU growth rate of 0.2%.
26
Analysis of flexicurity related inputs and policies
Input Indicators
Active labour Market Policy: expenditure as a share of GDP was almost the same in Bulgaria than the EU average (0.4% in the pre-2007 period, compared to an EU average of
0.5%) but dropped slightly in the post-2007 period (0.3% compared to a 0.5% EU average). The number of LMP participants engaged in active measure as a share of all
unemployed was higher in Bulgaria for the pre-2007 period when compared to the EU average (56.8% compared to a 37% EU average). While in the post-2007 period the rate for
Bulgaria dropped slightly, it remained higher than the EU average (48.8% compared to an EU average of 35%).
Contractual Arrangements: there is no data on Employment Protection Legislation for both standard and temporary workers in Bulgaria. The average number of hours worked per
week was higher in Bulgaria than the EU average for the pre-2007 period (41.1 compared to 38.1 in the EU) and this remained the case for the post-2007 period (41.5 in the
Bulgaria, compared to 37.7 in the EU).
Lifelong Learning: in Bulgaria, the total public expenditure on education as a percentage of GDP was lower than the EU average (4.2% compared to 5.0% for the pre-2007 period;
and 4.4% compared to 5.0% in the post-2007 period) Private expenditure on education was 0.7% in Bulgaria for the pre-2007 period, and decreased to 0.6% in the post-2007
period. The average for the EU was 0.6% in the pre-2007 period, compared to 0.7% for the post-2007 period.
Modern Social Security: Expenditure on passive LMP in Bulgaria was lower (i.e. better) than the EU average for both the pre and post-2007 periods. The average for both periods
in Bulgaria was 0.21%, compared to an EU average of 1.2% and 0.23% respectively for the pre and post-2007 periods. Expenditure on social protection in Bulgaria was lower than
the EU average for the pre-2007 and the post-2007 period (14.7% in the pre-2007 period and 15.6% for the post-2007 period compared to an EU average of 27% for both periods).
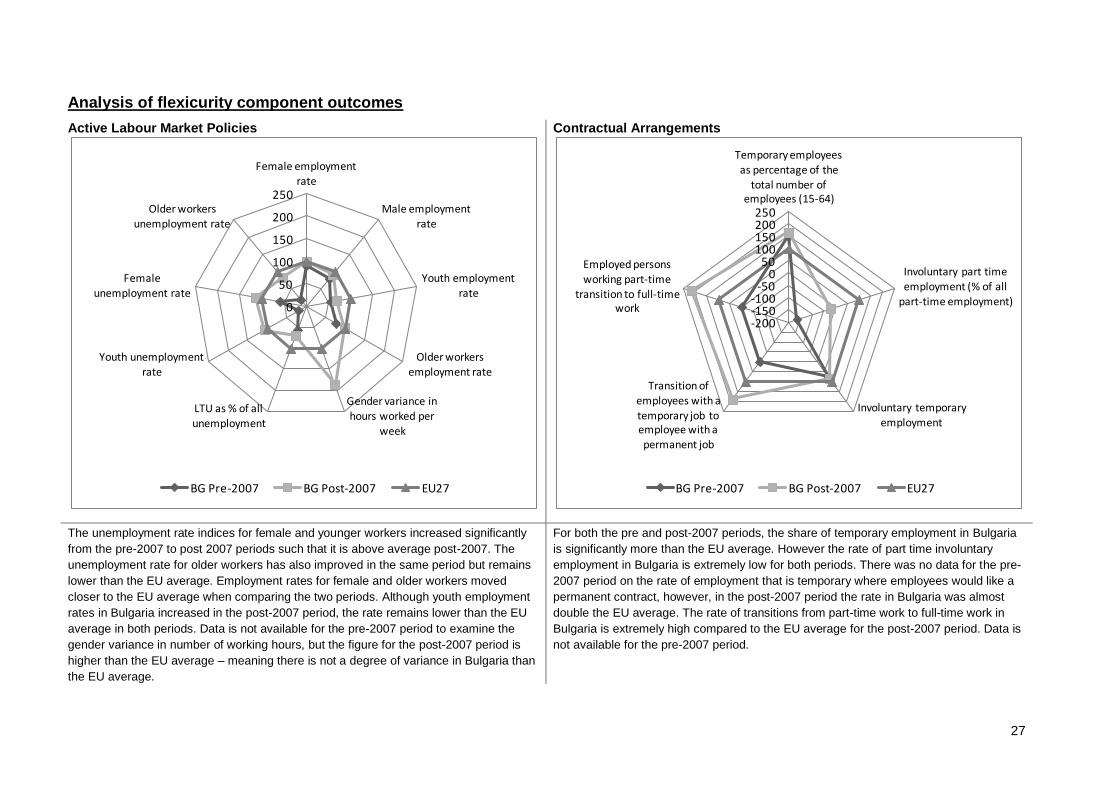
27
Analysis of flexicurity component outcomes
Active Labour Market Policies
Contractual Arrangements
The unemployment rate indices for female and younger workers increased significantly
from the pre-2007 to post 2007 periods such that it is above average post-2007. The
unemployment rate for older workers has also improved in the same period but remains
lower than the EU average. Employment rates for female and older workers moved
closer to the EU average when comparing the two periods. Although youth employment
rates in Bulgaria increased in the post-2007 period, the rate remains lower than the EU
average in both periods. Data is not available for the pre-2007 period to examine the
gender variance in number of working hours, but the figure for the post-2007 period is
higher than the EU average – meaning there is not a degree of variance in Bulgaria than
the EU average.
For both the pre and post-2007 periods, the share of temporary employment in Bulgaria
is significantly more than the EU average. However the rate of part time involuntary
employment in Bulgaria is extremely low for both periods. There was no data for the pre-
2007 period on the rate of employment that is temporary where employees would like a
permanent contract, however, in the post-2007 period the rate in Bulgaria was almost
double the EU average. The rate of transitions from part-time work to full-time work in
Bulgaria is extremely high compared to the EU average for the post-2007 period. Data is
not available for the pre-2007 period.
0
50
100
150
200
250
Female employment rate
Male employment rate
Youth employment
rate
Older workers employment rate
Gender variance in hours worked per
week
LTU as % of all unemployment
Youth unemployment rate
Female
unemployment rate
Older workers unemployment rate
BG Pre-2007 BG Post-2007 EU27
-200-150-100
-500
50100150200250
Temporary employees
as percentage of the total number of
employees (15-64)
Involuntary part time employment (% of all
part-time employment)
Involuntary temporary
employment
Transition of employees with a temporary job to employee with a permanent job
Employed persons working part-time
transition to full-time work
BG Pre-2007 BG Post-2007 EU27
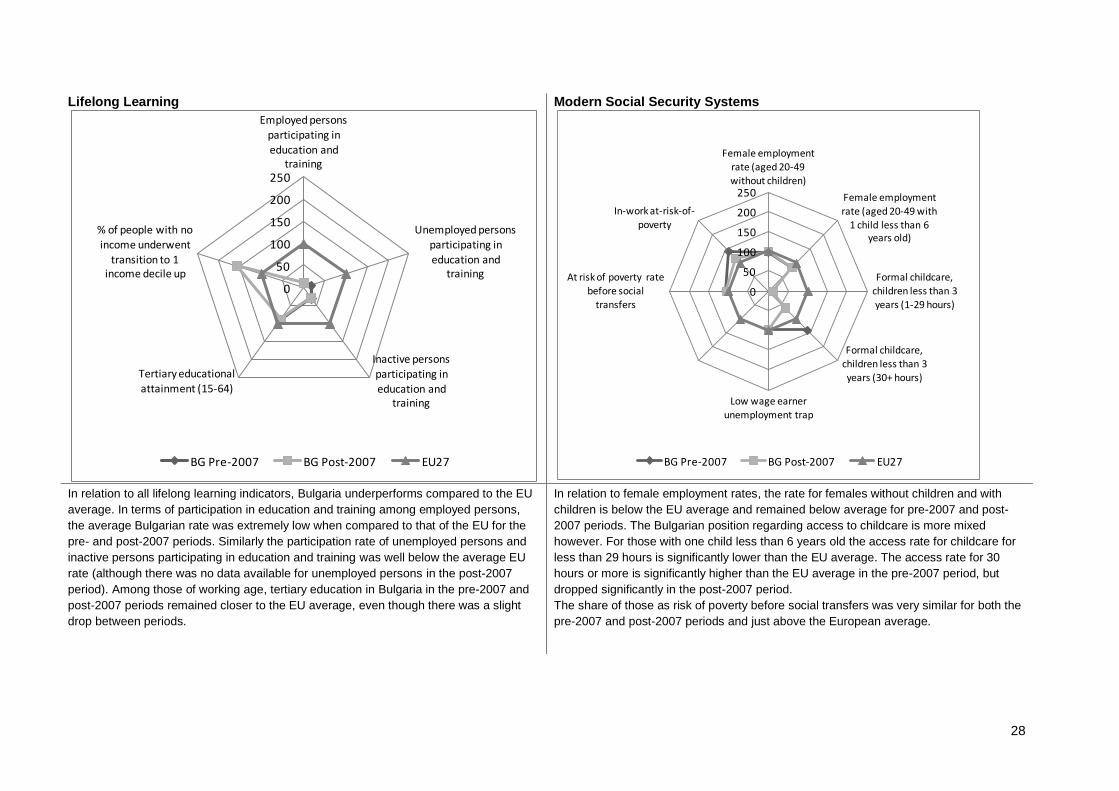
28
Lifelong Learning
Modern Social Security Systems
In relation to all lifelong learning indicators, Bulgaria underperforms compared to the EU
average. In terms of participation in education and training among employed persons,
the average Bulgarian rate was extremely low when compared to that of the EU for the
pre- and post-2007 periods. Similarly the participation rate of unemployed persons and
inactive persons participating in education and training was well below the average EU
rate (although there was no data available for unemployed persons in the post-2007
period). Among those of working age, tertiary education in Bulgaria in the pre-2007 and
post-2007 periods remained closer to the EU average, even though there was a slight
drop between periods.
In relation to female employment rates, the rate for females without children and with
children is below the EU average and remained below average for pre-2007 and post-
2007 periods. The Bulgarian position regarding access to childcare is more mixed
however. For those with one child less than 6 years old the access rate for childcare for
less than 29 hours is significantly lower than the EU average. The access rate for 30
hours or more is significantly higher than the EU average in the pre-2007 period, but
dropped significantly in the post-2007 period.
The share of those as risk of poverty before social transfers was very similar for both the
pre-2007 and post-2007 periods and just above the European average.
0
50
100
150
200
250
Employed persons participating in education and
training
Unemployed persons participating in
education and training
Inactive persons participating in education and
training
Tertiary educational attainment (15-64)
% of people with no income underwent
transition to 1 income decile up
BG Pre-2007 BG Post-2007 EU27
0
50
100
150
200
250
Female employment rate (aged 20-49 without children)
Female employment
rate (aged 20-49 with 1 child less than 6
years old)
Formal childcare,
children less than 3 years (1-29 hours)
Formal childcare, children less than 3
years (30+ hours)
Low wage earner unemployment trap
At risk of poverty rate
before social transfers
In-work at-risk-of-poverty
BG Pre-2007 BG Post-2007 EU27
29
Summary: Flexicurity Policy 2007-2010
Employment rates and GDP in Bulgaria were consistently below the EU average in both periods. In addition, Bulgaria’s LTU rate pre-2007 was higher than the EU average,
however, during the post-2007 period the rate decreased such that it is almost level with the EU average. Despite an increase in taxation on income and wealth, Bulgaria’s rate
remained lower than the EU average in the post-2007 period. This is also true of Bulgaria’s implicit tax rate on labour which still was lower than the EU average in the post-2007
period. In terms of gross government debt, Bulgaria level of debt was considerably lower than the EU average. However, total labour market expenditure expressed as a share of
GDP was much lower in Bulgaria than the EU average. Similarly the level of expenditure on social protection was lower in Bulgaria than the EU, as was the share of benefits spent
on unemployment. Public expenditure on education was also considerably lower than the EU average. Related to this is the low share of people undertaking education at all levels
with low levels of participation amongst adults and low levels of lower secondary and tertiary education attainment.
In relation to Active Labour Market policy, the number of LMP participants engaged in active measure as a share of all unemployed was higher in Bulgaria for the pre-2007 period
than the EU average – while this rate dropped slightly it remained higher than the EU average. Bulgaria had high levels of female and youth unemployment, but at the same time,
employment rates for female and older workers moved closer to the EU rate when the pre-2007 and post-2007 periods are compared. The rate of temporary employment held by
employees that would like a permanent contract was double the EU rate in Bulgaria.
The levels of public and private expenditure on education were lower in Bulgaria for both the pre-2007 and post-2007 periods than the EU average. Rates of participation in
education were extremely low in Belgium among the unemployed during both periods. This was also the case for unemployed persons and inactive persons in the post-2007 period.
The rates of those of working age who participated in tertiary education in Bulgaria was however closer to the EU average.
In relation to modern social security systems, expenditure on passive LMP and social protection was much lower than the EU average post-2007. The rate of access to childcare
was access is much worse than the EU average in Bulgaria in the post-2007 period – in use of childcare for over 30 hours per week this was a significant decline from the pre-2007
period where use of childcare was significantly above average.

30
5 Cyprus
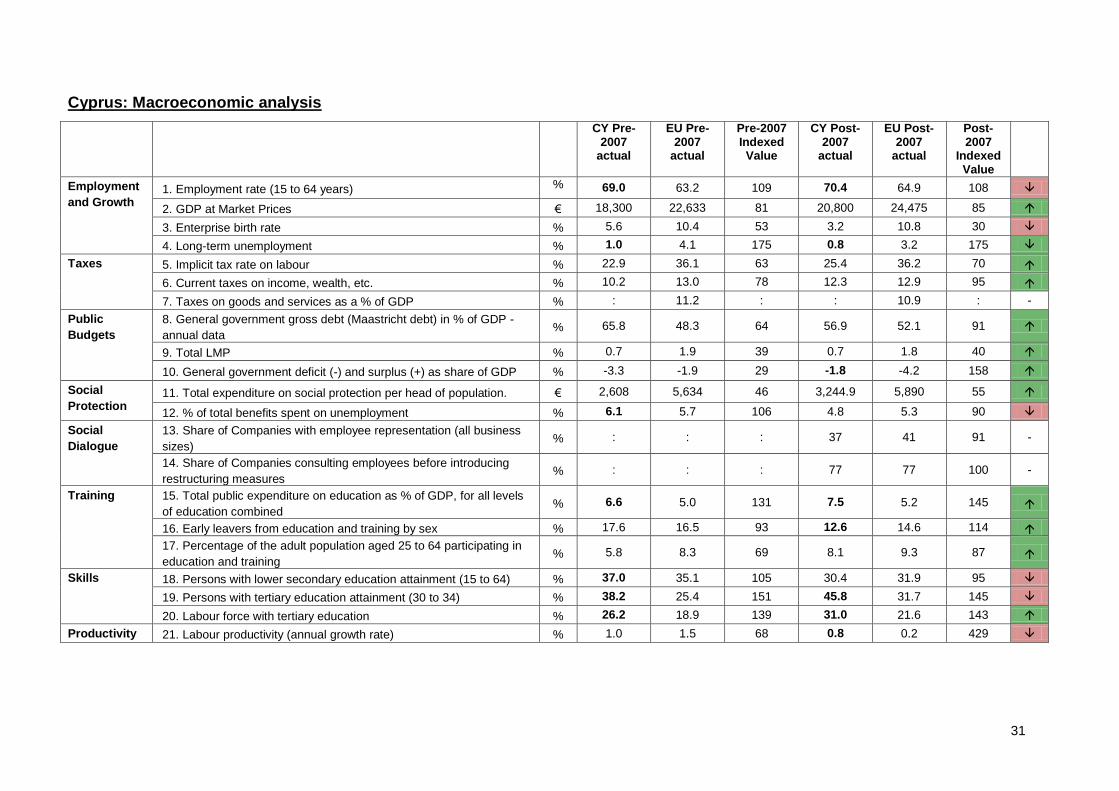
31
Cyprus: Macroeconomic analysis
CY Pre-2007
actual
EU Pre-2007
actual
Pre-2007 Indexed Value
CY Post-2007
actual
EU Post-2007
actual
Post-2007
Indexed Value
Employment
and Growth 1. Employment rate (15 to 64 years) % 69.0 63.2 109 70.4 64.9 108
2. GDP at Market Prices € 18,300 22,633 81 20,800 24,475 85
3. Enterprise birth rate % 5.6 10.4 53 3.2 10.8 30
4. Long-term unemployment % 1.0 4.1 175 0.8 3.2 175
Taxes 5. Implicit tax rate on labour % 22.9 36.1 63 25.4 36.2 70
6. Current taxes on income, wealth, etc. % 10.2 13.0 78 12.3 12.9 95
7. Taxes on goods and services as a % of GDP % : 11.2 : : 10.9 : -
Public
Budgets
8. General government gross debt (Maastricht debt) in % of GDP -
annual data % 65.8 48.3 64 56.9 52.1 91
9. Total LMP % 0.7 1.9 39 0.7 1.8 40
10. General government deficit (-) and surplus (+) as share of GDP % -3.3 -1.9 29 -1.8 -4.2 158
Social
Protection 11. Total expenditure on social protection per head of population. € 2,608 5,634 46 3,244.9 5,890 55
12. % of total benefits spent on unemployment % 6.1 5.7 106 4.8 5.3 90
Social
Dialogue
13. Share of Companies with employee representation (all business
sizes) % : : : 37 41 91 -
14. Share of Companies consulting employees before introducing
restructuring measures % : : : 77 77 100 -
Training 15. Total public expenditure on education as % of GDP, for all levels
of education combined % 6.6 5.0 131 7.5 5.2 145
16. Early leavers from education and training by sex % 17.6 16.5 93 12.6 14.6 114
17. Percentage of the adult population aged 25 to 64 participating in
education and training % 5.8 8.3 69 8.1 9.3 87
Skills 18. Persons with lower secondary education attainment (15 to 64) % 37.0 35.1 105 30.4 31.9 95
19. Persons with tertiary education attainment (30 to 34) % 38.2 25.4 151 45.8 31.7 145
20. Labour force with tertiary education % 26.2 18.9 139 31.0 21.6 143
Productivity 21. Labour productivity (annual growth rate) % 1.0 1.5 68 0.8 0.2 429
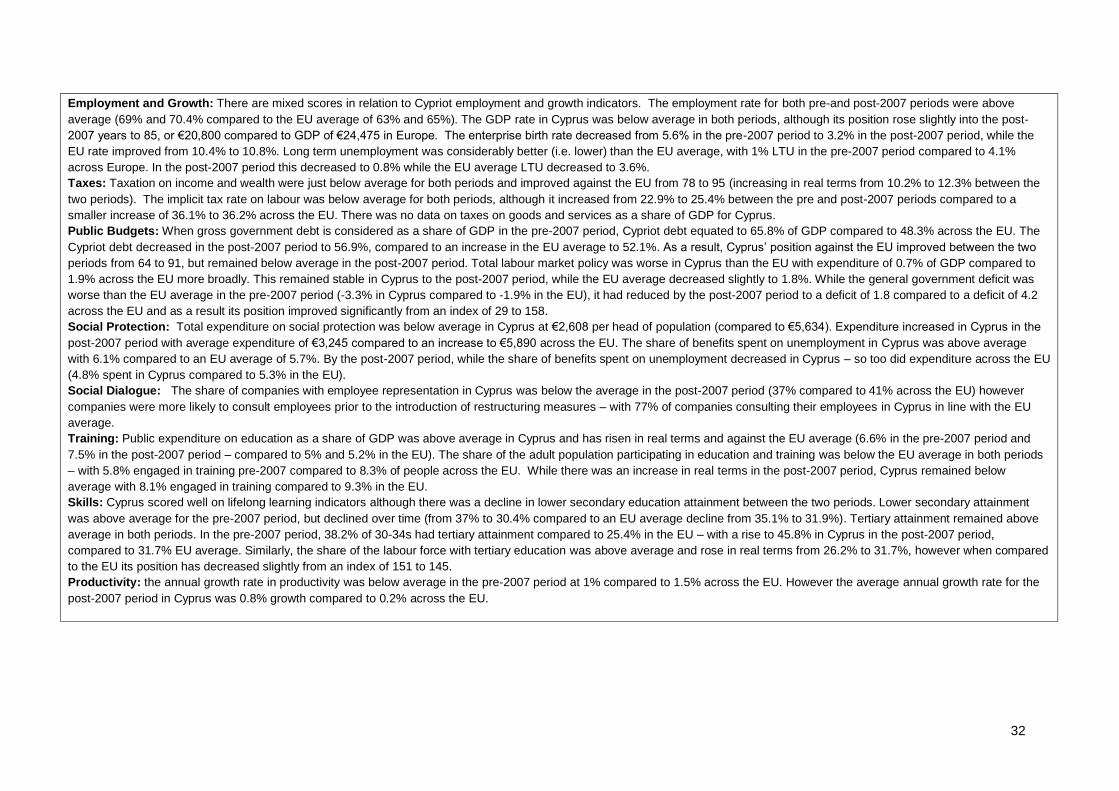
32
Employment and Growth: There are mixed scores in relation to Cypriot employment and growth indicators. The employment rate for both pre-and post-2007 periods were above
average (69% and 70.4% compared to the EU average of 63% and 65%). The GDP rate in Cyprus was below average in both periods, although its position rose slightly into the post-
2007 years to 85, or €20,800 compared to GDP of €24,475 in Europe. The enterprise birth rate decreased from 5.6% in the pre-2007 period to 3.2% in the post-2007 period, while the
EU rate improved from 10.4% to 10.8%. Long term unemployment was considerably better (i.e. lower) than the EU average, with 1% LTU in the pre-2007 period compared to 4.1%
across Europe. In the post-2007 period this decreased to 0.8% while the EU average LTU decreased to 3.6%.
Taxes: Taxation on income and wealth were just below average for both periods and improved against the EU from 78 to 95 (increasing in real terms from 10.2% to 12.3% between the
two periods). The implicit tax rate on labour was below average for both periods, although it increased from 22.9% to 25.4% between the pre and post-2007 periods compared to a
smaller increase of 36.1% to 36.2% across the EU. There was no data on taxes on goods and services as a share of GDP for Cyprus.
Public Budgets: When gross government debt is considered as a share of GDP in the pre-2007 period, Cypriot debt equated to 65.8% of GDP compared to 48.3% across the EU. The
Cypriot debt decreased in the post-2007 period to 56.9%, compared to an increase in the EU average to 52.1%. As a result, Cyprus’ position against the EU improved between the two
periods from 64 to 91, but remained below average in the post-2007 period. Total labour market policy was worse in Cyprus than the EU with expenditure of 0.7% of GDP compared to
1.9% across the EU more broadly. This remained stable in Cyprus to the post-2007 period, while the EU average decreased slightly to 1.8%. While the general government deficit was
worse than the EU average in the pre-2007 period (-3.3% in Cyprus compared to -1.9% in the EU), it had reduced by the post-2007 period to a deficit of 1.8 compared to a deficit of 4.2
across the EU and as a result its position improved significantly from an index of 29 to 158.
Social Protection: Total expenditure on social protection was below average in Cyprus at €2,608 per head of population (compared to €5,634). Expenditure increased in Cyprus in the
post-2007 period with average expenditure of €3,245 compared to an increase to €5,890 across the EU. The share of benefits spent on unemployment in Cyprus was above average
with 6.1% compared to an EU average of 5.7%. By the post-2007 period, while the share of benefits spent on unemployment decreased in Cyprus – so too did expenditure across the EU
(4.8% spent in Cyprus compared to 5.3% in the EU).
Social Dialogue: The share of companies with employee representation in Cyprus was below the average in the post-2007 period (37% compared to 41% across the EU) however
companies were more likely to consult employees prior to the introduction of restructuring measures – with 77% of companies consulting their employees in Cyprus in line with the EU
average.
Training: Public expenditure on education as a share of GDP was above average in Cyprus and has risen in real terms and against the EU average (6.6% in the pre-2007 period and
7.5% in the post-2007 period – compared to 5% and 5.2% in the EU). The share of the adult population participating in education and training was below the EU average in both periods
– with 5.8% engaged in training pre-2007 compared to 8.3% of people across the EU. While there was an increase in real terms in the post-2007 period, Cyprus remained below
average with 8.1% engaged in training compared to 9.3% in the EU.
Skills: Cyprus scored well on lifelong learning indicators although there was a decline in lower secondary education attainment between the two periods. Lower secondary attainment
was above average for the pre-2007 period, but declined over time (from 37% to 30.4% compared to an EU average decline from 35.1% to 31.9%). Tertiary attainment remained above
average in both periods. In the pre-2007 period, 38.2% of 30-34s had tertiary attainment compared to 25.4% in the EU – with a rise to 45.8% in Cyprus in the post-2007 period,
compared to 31.7% EU average. Similarly, the share of the labour force with tertiary education was above average and rose in real terms from 26.2% to 31.7%, however when compared
to the EU its position has decreased slightly from an index of 151 to 145.
Productivity: the annual growth rate in productivity was below average in the pre-2007 period at 1% compared to 1.5% across the EU. However the average annual growth rate for the
post-2007 period in Cyprus was 0.8% growth compared to 0.2% across the EU.
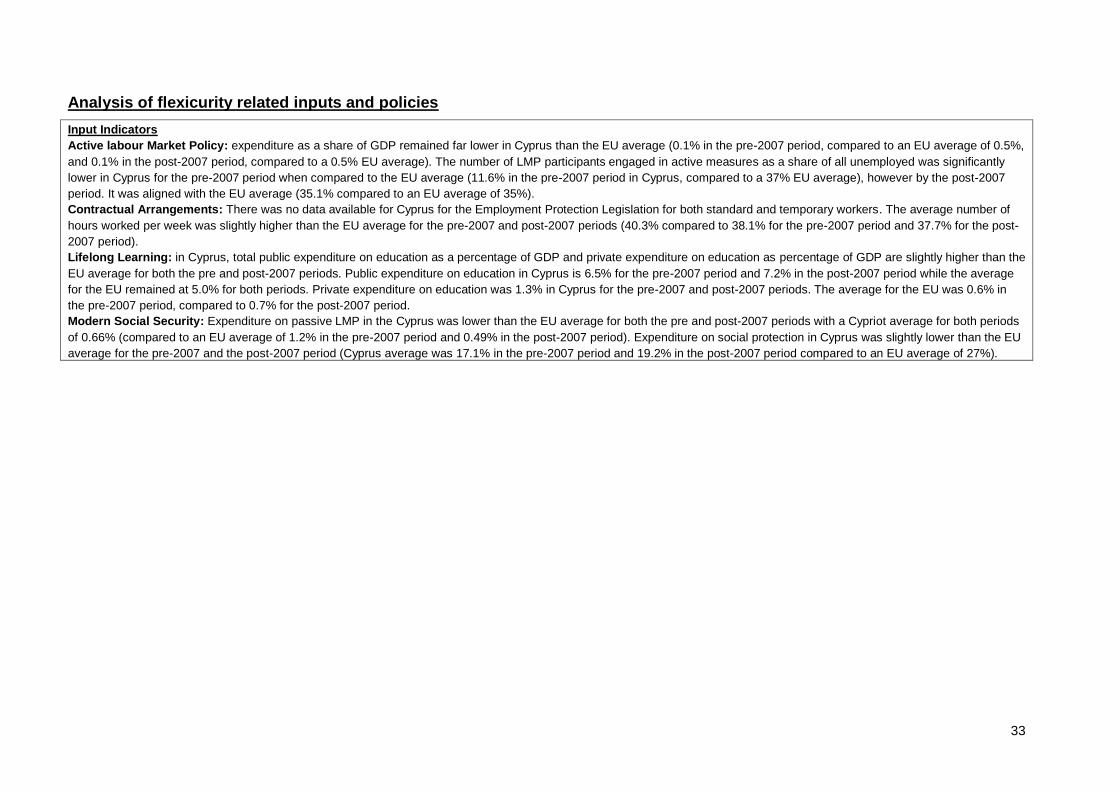
33
Analysis of flexicurity related inputs and policies
Input Indicators
Active labour Market Policy: expenditure as a share of GDP remained far lower in Cyprus than the EU average (0.1% in the pre-2007 period, compared to an EU average of 0.5%,
and 0.1% in the post-2007 period, compared to a 0.5% EU average). The number of LMP participants engaged in active measures as a share of all unemployed was significantly
lower in Cyprus for the pre-2007 period when compared to the EU average (11.6% in the pre-2007 period in Cyprus, compared to a 37% EU average), however by the post-2007
period. It was aligned with the EU average (35.1% compared to an EU average of 35%).
Contractual Arrangements: There was no data available for Cyprus for the Employment Protection Legislation for both standard and temporary workers. The average number of
hours worked per week was slightly higher than the EU average for the pre-2007 and post-2007 periods (40.3% compared to 38.1% for the pre-2007 period and 37.7% for the post-
2007 period).
Lifelong Learning: in Cyprus, total public expenditure on education as a percentage of GDP and private expenditure on education as percentage of GDP are slightly higher than the
EU average for both the pre and post-2007 periods. Public expenditure on education in Cyprus is 6.5% for the pre-2007 period and 7.2% in the post-2007 period while the average
for the EU remained at 5.0% for both periods. Private expenditure on education was 1.3% in Cyprus for the pre-2007 and post-2007 periods. The average for the EU was 0.6% in
the pre-2007 period, compared to 0.7% for the post-2007 period.
Modern Social Security: Expenditure on passive LMP in the Cyprus was lower than the EU average for both the pre and post-2007 periods with a Cypriot average for both periods
of 0.66% (compared to an EU average of 1.2% in the pre-2007 period and 0.49% in the post-2007 period). Expenditure on social protection in Cyprus was slightly lower than the EU
average for the pre-2007 and the post-2007 period (Cyprus average was 17.1% in the pre-2007 period and 19.2% in the post-2007 period compared to an EU average of 27%).
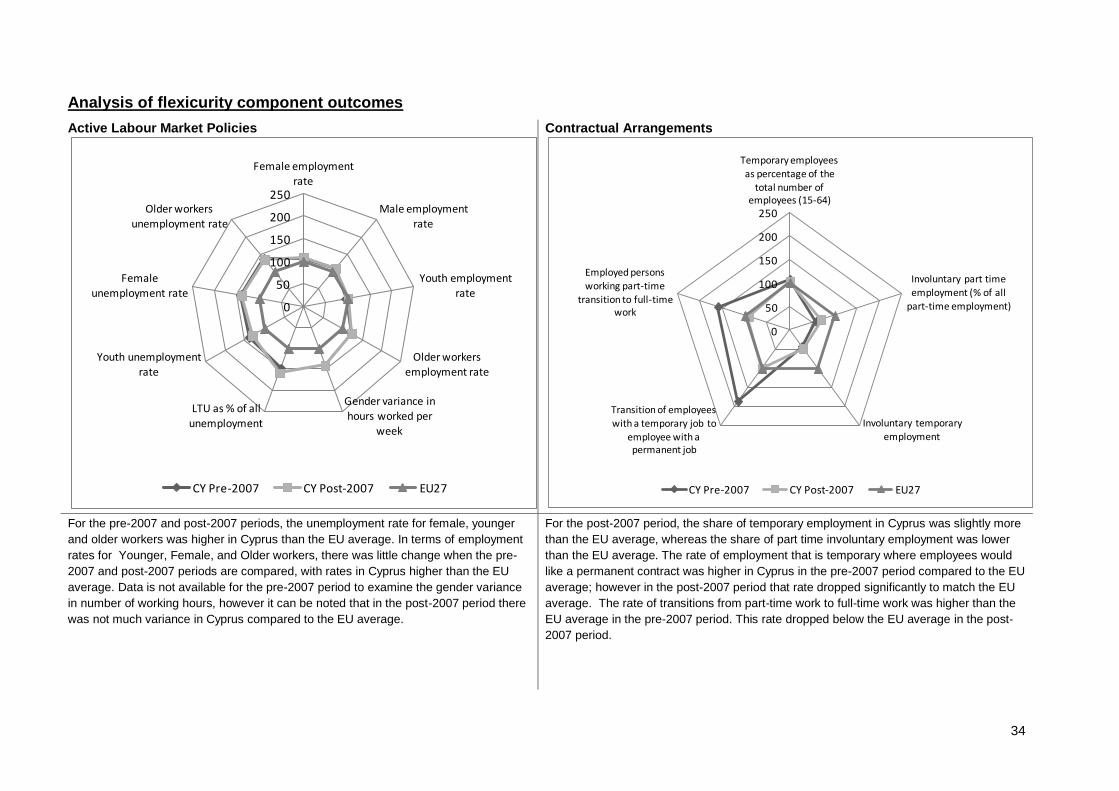
34
Analysis of flexicurity component outcomes
Active Labour Market Policies
Contractual Arrangements
For the pre-2007 and post-2007 periods, the unemployment rate for female, younger
and older workers was higher in Cyprus than the EU average. In terms of employment
rates for Younger, Female, and Older workers, there was little change when the pre-
2007 and post-2007 periods are compared, with rates in Cyprus higher than the EU
average. Data is not available for the pre-2007 period to examine the gender variance
in number of working hours, however it can be noted that in the post-2007 period there
was not much variance in Cyprus compared to the EU average.
For the post-2007 period, the share of temporary employment in Cyprus was slightly more
than the EU average, whereas the share of part time involuntary employment was lower
than the EU average. The rate of employment that is temporary where employees would
like a permanent contract was higher in Cyprus in the pre-2007 period compared to the EU
average; however in the post-2007 period that rate dropped significantly to match the EU
average. The rate of transitions from part-time work to full-time work was higher than the
EU average in the pre-2007 period. This rate dropped below the EU average in the post-
2007 period.
0
50
100
150
200
250
Female employment rate
Male employment rate
Youth employment
rate
Older workers employment rate
Gender variance in hours worked per
week
LTU as % of all unemployment
Youth unemployment rate
Female
unemployment rate
Older workers unemployment rate
CY Pre-2007 CY Post-2007 EU27
0
50
100
150
200
250
Temporary employees as percentage of the
total number of employees (15-64)
Involuntary part time
employment (% of all part-time employment)
Involuntary temporary employment
Transition of employees with a temporary job to
employee with a permanent job
Employed persons
working part-time
transition to full-time work
CY Pre-2007 CY Post-2007 EU27
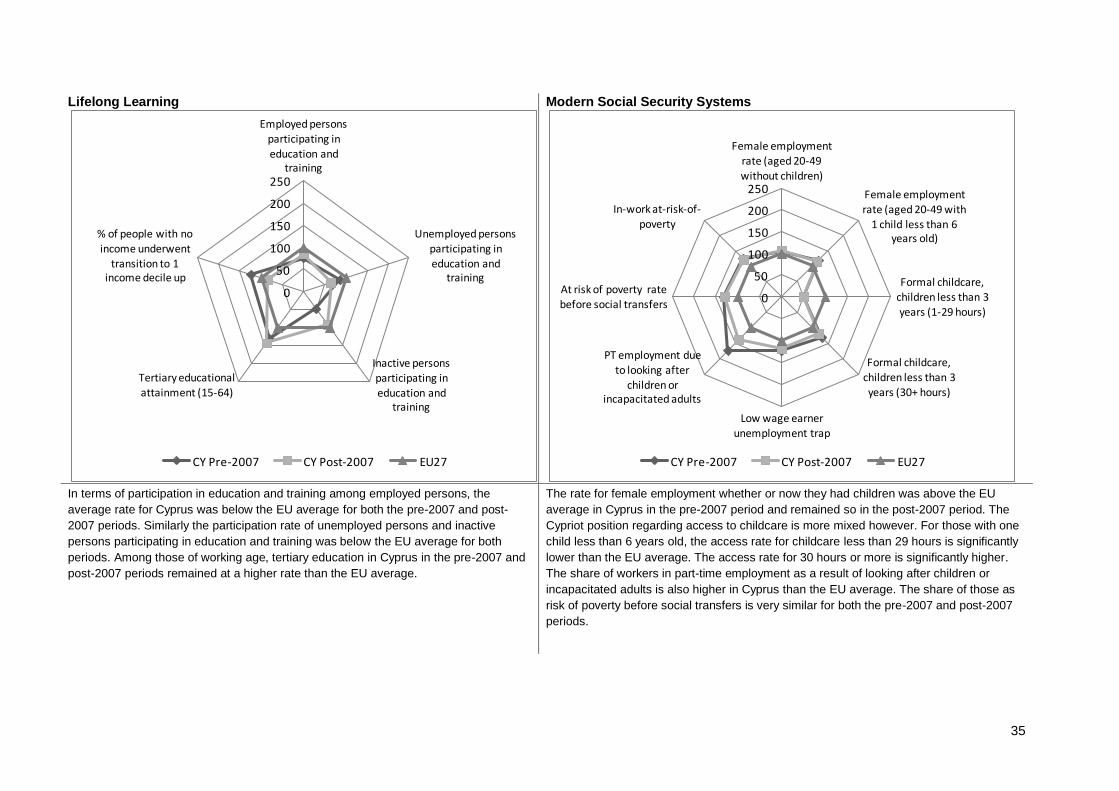
35
Lifelong Learning
Modern Social Security Systems
In terms of participation in education and training among employed persons, the
average rate for Cyprus was below the EU average for both the pre-2007 and post-
2007 periods. Similarly the participation rate of unemployed persons and inactive
persons participating in education and training was below the EU average for both
periods. Among those of working age, tertiary education in Cyprus in the pre-2007 and
post-2007 periods remained at a higher rate than the EU average.
The rate for female employment whether or now they had children was above the EU
average in Cyprus in the pre-2007 period and remained so in the post-2007 period. The
Cypriot position regarding access to childcare is more mixed however. For those with one
child less than 6 years old, the access rate for childcare less than 29 hours is significantly
lower than the EU average. The access rate for 30 hours or more is significantly higher.
The share of workers in part-time employment as a result of looking after children or
incapacitated adults is also higher in Cyprus than the EU average. The share of those as
risk of poverty before social transfers is very similar for both the pre-2007 and post-2007
periods.
0
50
100
150
200
250
Employed persons participating in
education and training
Unemployed persons participating in education and
training
Inactive persons participating in education and
training
Tertiary educational attainment (15-64)
% of people with no income underwent
transition to 1 income decile up
CY Pre-2007 CY Post-2007 EU27
0
50
100
150
200
250
Female employment rate (aged 20-49 without children)
Female employment rate (aged 20-49 with
1 child less than 6 years old)
Formal childcare, children less than 3 years (1-29 hours)
Formal childcare, children less than 3 years (30+ hours)
Low wage earner unemployment trap
PT employment due
to looking after children or
incapacitated adults
At risk of poverty rate before social transfers
In-work at-risk-of-poverty
CY Pre-2007 CY Post-2007 EU27
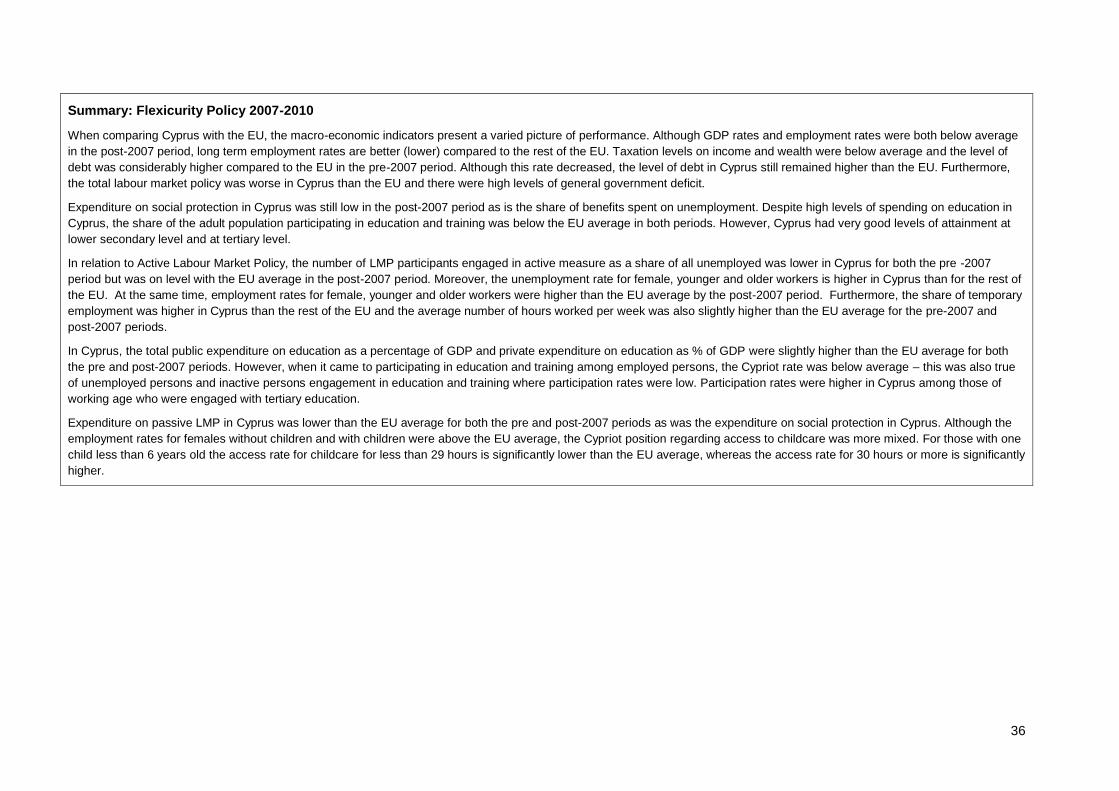
36
Summary: Flexicurity Policy 2007-2010
When comparing Cyprus with the EU, the macro-economic indicators present a varied picture of performance. Although GDP rates and employment rates were both below average
in the post-2007 period, long term employment rates are better (lower) compared to the rest of the EU. Taxation levels on income and wealth were below average and the level of
debt was considerably higher compared to the EU in the pre-2007 period. Although this rate decreased, the level of debt in Cyprus still remained higher than the EU. Furthermore,
the total labour market policy was worse in Cyprus than the EU and there were high levels of general government deficit.
Expenditure on social protection in Cyprus was still low in the post-2007 period as is the share of benefits spent on unemployment. Despite high levels of spending on education in
Cyprus, the share of the adult population participating in education and training was below the EU average in both periods. However, Cyprus had very good levels of attainment at
lower secondary level and at tertiary level.
In relation to Active Labour Market Policy, the number of LMP participants engaged in active measure as a share of all unemployed was lower in Cyprus for both the pre -2007
period but was on level with the EU average in the post-2007 period. Moreover, the unemployment rate for female, younger and older workers is higher in Cyprus than for the rest of
the EU. At the same time, employment rates for female, younger and older workers were higher than the EU average by the post-2007 period. Furthermore, the share of temporary
employment was higher in Cyprus than the rest of the EU and the average number of hours worked per week was also slightly higher than the EU average for the pre-2007 and
post-2007 periods.
In Cyprus, the total public expenditure on education as a percentage of GDP and private expenditure on education as % of GDP were slightly higher than the EU average for both
the pre and post-2007 periods. However, when it came to participating in education and training among employed persons, the Cypriot rate was below average – this was also true
of unemployed persons and inactive persons engagement in education and training where participation rates were low. Participation rates were higher in Cyprus among those of
working age who were engaged with tertiary education.
Expenditure on passive LMP in Cyprus was lower than the EU average for both the pre and post-2007 periods as was the expenditure on social protection in Cyprus. Although the
employment rates for females without children and with children were above the EU average, the Cypriot position regarding access to childcare was more mixed. For those with one
child less than 6 years old the access rate for childcare for less than 29 hours is significantly lower than the EU average, whereas the access rate for 30 hours or more is significantly
higher.

37
6 Czech Republic
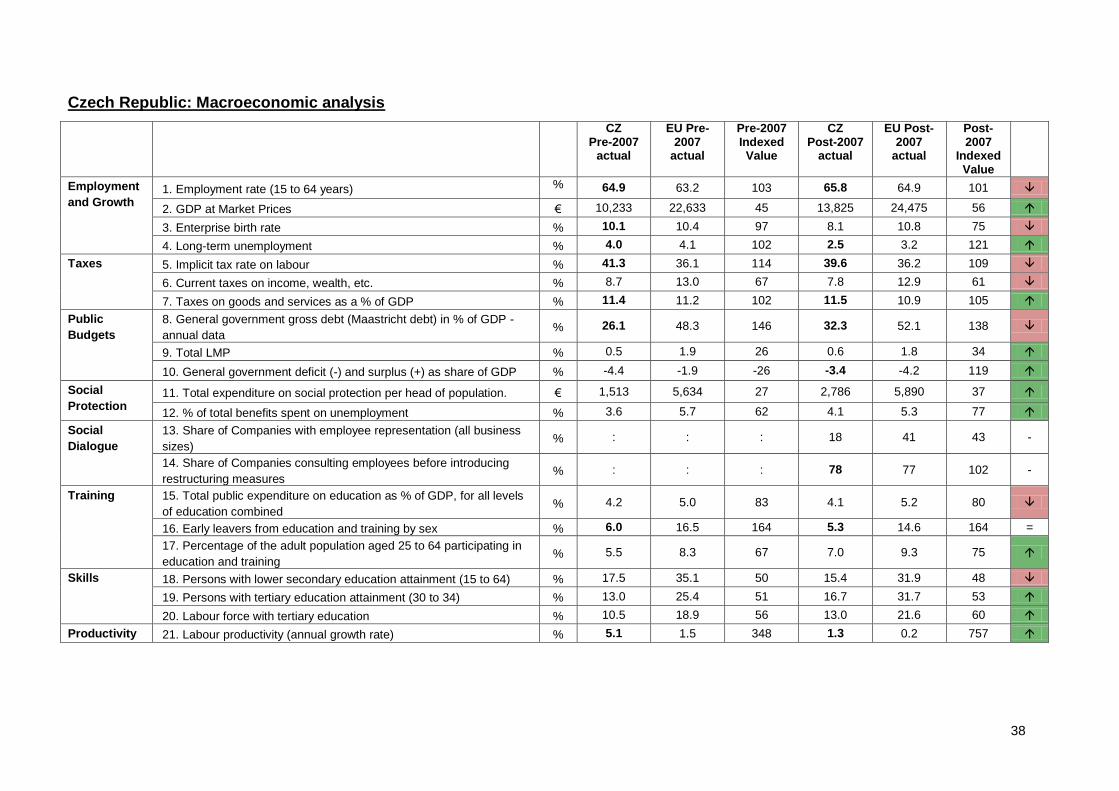
38
Czech Republic: Macroeconomic analysis
CZ Pre-2007
actual
EU Pre-2007
actual
Pre-2007 Indexed Value
CZ Post-2007
actual
EU Post-2007
actual
Post-2007
Indexed Value
Employment
and Growth 1. Employment rate (15 to 64 years) % 64.9 63.2 103 65.8 64.9 101
2. GDP at Market Prices € 10,233 22,633 45 13,825 24,475 56
3. Enterprise birth rate % 10.1 10.4 97 8.1 10.8 75
4. Long-term unemployment % 4.0 4.1 102 2.5 3.2 121
Taxes 5. Implicit tax rate on labour % 41.3 36.1 114 39.6 36.2 109
6. Current taxes on income, wealth, etc. % 8.7 13.0 67 7.8 12.9 61
7. Taxes on goods and services as a % of GDP % 11.4 11.2 102 11.5 10.9 105
Public
Budgets
8. General government gross debt (Maastricht debt) in % of GDP -
annual data % 26.1 48.3 146 32.3 52.1 138
9. Total LMP % 0.5 1.9 26 0.6 1.8 34
10. General government deficit (-) and surplus (+) as share of GDP % -4.4 -1.9 -26 -3.4 -4.2 119
Social
Protection 11. Total expenditure on social protection per head of population. € 1,513 5,634 27 2,786 5,890 37
12. % of total benefits spent on unemployment % 3.6 5.7 62 4.1 5.3 77
Social
Dialogue
13. Share of Companies with employee representation (all business
sizes) % : : : 18 41 43 -
14. Share of Companies consulting employees before introducing
restructuring measures % : : : 78 77 102 -
Training 15. Total public expenditure on education as % of GDP, for all levels
of education combined % 4.2 5.0 83 4.1 5.2 80
16. Early leavers from education and training by sex % 6.0 16.5 164 5.3 14.6 164 =
17. Percentage of the adult population aged 25 to 64 participating in
education and training % 5.5 8.3 67 7.0 9.3 75
Skills 18. Persons with lower secondary education attainment (15 to 64) % 17.5 35.1 50 15.4 31.9 48
19. Persons with tertiary education attainment (30 to 34) % 13.0 25.4 51 16.7 31.7 53
20. Labour force with tertiary education % 10.5 18.9 56 13.0 21.6 60
Productivity 21. Labour productivity (annual growth rate) % 5.1 1.5 348 1.3 0.2 757
39
Employment and Growth: the Czech Republic scores well when employment and growth indicators are considered and all are above average in both the pre and post- 2007 period,
with the exception of GDP. The GDP rate in the Czech Republic is below average in both periods and rose slightly into the post-2007 years to 56, or €13,825 compared to GDP of
€24,475 in Europe. The Employment rate is two percentage points above the EU in pre-2007 (65% compared to 63%), however by post-2007 it had increased slightly to 66% while the
EU average had risen to 65%. The enterprise birth rate decreased in the Czech Republic from 10.1% in the pre-2007 period to 8.1% in the post-2007 period, while the EU rate has
improved from 10 to 11. Long term unemployment is slightly better (i.e. lower) than the EU average with 4.0% LTU pre-2007 compared to 4.1% across Europe. This rate decreased to
2.5% in the post-2007 period, compared to the EU average of 3.2%.
Taxes: Taxation on income and wealth is below average for both periods and has decreased from 8.7% to 7.8% in the Czech Republic but has remained consistent at 13% for both
periods. Implicit tax rate on labour is just above average for both periods, although it has decreased from 41.3% to 39.6% between the pre and post-2007 periods compared to a smaller
increase of 36.1% to 36.2% across the EU. Taxes on goods and services as a share of GDP are just above average – however only slightly with a pre-2007 rate of 11.4% compared to
the EU’s 11.2% and post-2007 rate of 11.5% compared to 10.9% across the EU.
Public Budgets: When gross government debt is considered as a share of GDP pre-2007, the Czech Republic is considered better, with a lower debt of 26.1% compared to 48.3%
across the EU. However this increased in the post-2007 period with a debt of 32.3% compared to 52.1% EU average. Total labour market policy is worse in the Czech Republic than the
EU with expenditure of 0.5% of GDP compared to 1.9% across the EU more broadly. This increased to 0.6 in the post-2007 period, while the EU average decreased slightly to 1.8%.
While the general government deficit was above average in the pre-2007 period, it dropped significantly by post-2007 with a deficit of 3.2 compared to a deficit of 4.2 across the EU.
Social Protection: Total expenditure on social protection is below average €1,513 (compared to €5,634). Expenditure increased in the Czech Republic in the post-2007 period with an
average expenditure of €2,178 compared to an increase to €5,890 across the EU. The share of benefits spent on unemployment in the Czech Republic is also below average with 3.6%
compared to an EU average of 5.7%. By the post-2007 period, while the share of benefits spent on unemployment increased in the Czech Republic, the EU average decreased (4.1%
spent in the Czech Republic compared to 5.3% in the EU).
Social Dialogue: The share of companies with employee representation in the Czech Republic is well below the average (18 compared to 41 across the EU) however companies are
more likely to consult employees prior to the introduction of restructuring measures – 78% of companies consult in the Czech Republic compared to an EU average of 77%.
Training: Public expenditure on education as a share of GDP is below average in the Czech Republic and has decreased in real terms and against the EU average (4.2% pre 2007 and
4.1% post-2007 – compared to 5% and 5.2% in the EU). The share of the adult population participating in education and training is also below the EU average in both periods – with
5.5% engaged in training pre-2007 compared to 8.3% of people across the EU. The rate increased to 7% in the post-2007 period, and remains below average compared to 9.3% in the
EU.
Skills: Lower secondary attainment is below average in both periods and has declined over time (from 17.5% to 15.4% compared to an EU average decline from 35.1% to 31.9%).
Tertiary education attainment is also below average. In the pre-2007 period, 13% of 30-34s had tertiary attainment compared to 25.4% in the EU – with a rise to 16.7% in the Czech
Republic in the post-2007 period, compared to 31.7% EU average. Similarly, the share of the labour force with tertiary education is also below average but has risen in real terms from
10.5% to 13%.
Productivity: the annual growth rate in productivity is above average pre-2007 at 5.1% compared to 1.5% across the EU. However the average for the post-2007 period in the Czech
Republic decreased to 1.3, but remained above average compared to the EU growth rate of 0.2%.
40
Analysis of flexicurity related inputs and policies
Input Indicators
Active labour Market Policy: expenditure as a share of GDP was far lower in the Czech Republic than the EU average (0.1% in the pre-2007 and post-2007 periods). Likewise the
number of LMP participants engaged in active measure as a share of all unemployed was lower in the Czech Republic for both the pre and post-2007 periods when compared to the
EU average (27.8% in the pre-2007 period in the Czech Republic, compared to a 37% EU average; and 28.9% in the Czech Republic for the post-2007 period compared to an EU
average of 35%).
Contractual Arrangements: the Czech Republic is characterised by weak Employment Protection Legislation for standard workers. This position remained consistent for the pre-
2007 and post-2007 periods (an EPL strictness score of less than 1% for Standard Workers for both periods compared to EU averages of 2.1 for Standard Workers). The average
number of hours worked per week was slightly higher than the EU average for the pre-2007 period (41.1 in the Czech Republic, compared to 38.1 in the EU) and this remained the
case for the post-2007 period (41.5 in the Czech Republic, compared to 37.7 in the EU).
Lifelong Learning: in the Czech Republic, total public expenditure on education as a percentage of GDP and private expenditure on education as % of GDP are slightly lower than
the EU average for both the pre and post-2007 periods. Public expenditure on education in the Czech Republic is 4.3% for the pre-2007 period and dropped to 4.1% in the post-
2007 period, the average for the EU remained at 5.0% for both periods. Private expenditure on education was 0.5% in the Czech Republic for the pre-2007 and post-2007 periods.
The average for the EU was 0.6% in the pre-2007 period, compared to 0.7% for the post-2007 period.
Modern Social Security: Expenditure on passive LMP in the Czech Republic was lower than the EU average for both the pre and post-2007 periods, the average for the pre-2007
period and the post-2007 period in the Czech Republic was 0.26% in the pre-2007 period and slightly increased to 0.28% in the post-2007 period, compared to an EU average of
1.2% in the pre-2007 period and 1.1% in the post-2007 period. Expenditure on social protection in the Czech Republic was lower than the EU average for the pre-2007 and the post-
2007 period (for both periods the Czech Republic average was 18% compared to an EU average of 27%).
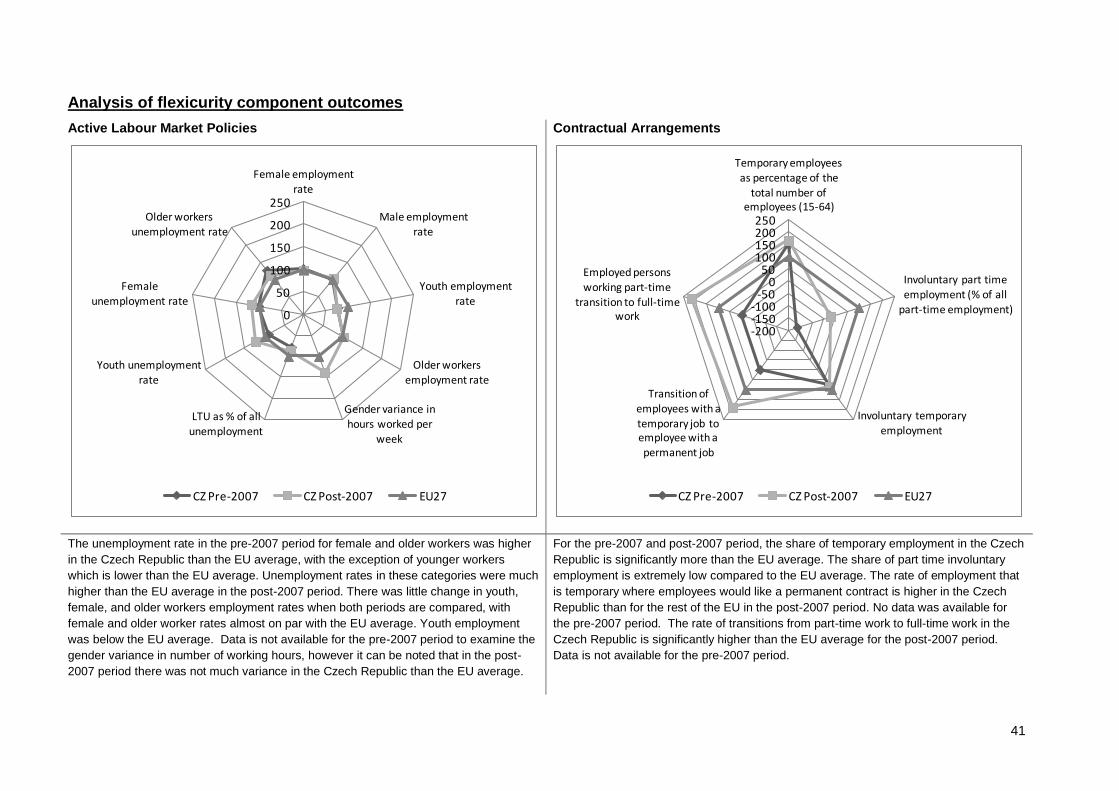
41
Analysis of flexicurity component outcomes
Active Labour Market Policies
Contractual Arrangements
The unemployment rate in the pre-2007 period for female and older workers was higher
in the Czech Republic than the EU average, with the exception of younger workers
which is lower than the EU average. Unemployment rates in these categories were much
higher than the EU average in the post-2007 period. There was little change in youth,
female, and older workers employment rates when both periods are compared, with
female and older worker rates almost on par with the EU average. Youth employment
was below the EU average. Data is not available for the pre-2007 period to examine the
gender variance in number of working hours, however it can be noted that in the post-
2007 period there was not much variance in the Czech Republic than the EU average.
For the pre-2007 and post-2007 period, the share of temporary employment in the Czech
Republic is significantly more than the EU average. The share of part time involuntary
employment is extremely low compared to the EU average. The rate of employment that
is temporary where employees would like a permanent contract is higher in the Czech
Republic than for the rest of the EU in the post-2007 period. No data was available for
the pre-2007 period. The rate of transitions from part-time work to full-time work in the
Czech Republic is significantly higher than the EU average for the post-2007 period.
Data is not available for the pre-2007 period.
0
50
100
150
200
250
Female employment rate
Male employment rate
Youth employment
rate
Older workers employment rate
Gender variance in hours worked per
week
LTU as % of all unemployment
Youth unemployment rate
Female
unemployment rate
Older workers unemployment rate
CZ Pre-2007 CZ Post-2007 EU27
-200-150-100
-500
50100150200250
Temporary employees
as percentage of the total number of
employees (15-64)
Involuntary part time employment (% of all
part-time employment)
Involuntary temporary
employment
Transition of employees with a temporary job to employee with a permanent job
Employed persons working part-time
transition to full-time work
CZ Pre-2007 CZ Post-2007 EU27
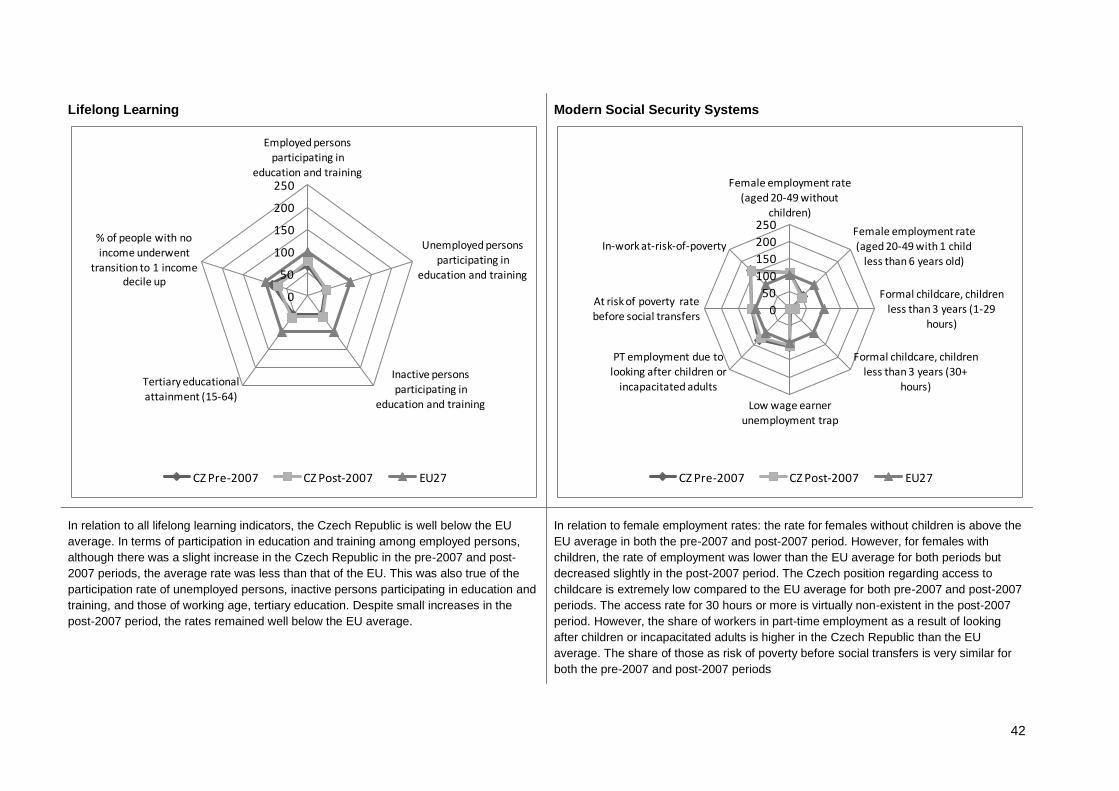
42
Lifelong Learning
Modern Social Security Systems
In relation to all lifelong learning indicators, the Czech Republic is well below the EU
average. In terms of participation in education and training among employed persons,
although there was a slight increase in the Czech Republic in the pre-2007 and post-
2007 periods, the average rate was less than that of the EU. This was also true of the
participation rate of unemployed persons, inactive persons participating in education and
training, and those of working age, tertiary education. Despite small increases in the
post-2007 period, the rates remained well below the EU average.
In relation to female employment rates: the rate for females without children is above the
EU average in both the pre-2007 and post-2007 period. However, for females with
children, the rate of employment was lower than the EU average for both periods but
decreased slightly in the post-2007 period. The Czech position regarding access to
childcare is extremely low compared to the EU average for both pre-2007 and post-2007
periods. The access rate for 30 hours or more is virtually non-existent in the post-2007
period. However, the share of workers in part-time employment as a result of looking
after children or incapacitated adults is higher in the Czech Republic than the EU
average. The share of those as risk of poverty before social transfers is very similar for
both the pre-2007 and post-2007 periods
0
50
100
150
200
250
Employed persons participating in
education and training
Unemployed persons participating in
education and training
Inactive persons
participating in education and training
Tertiary educational attainment (15-64)
% of people with no income underwent
transition to 1 income decile up
CZ Pre-2007 CZ Post-2007 EU27
0
50
100
150
200
250
Female employment rate (aged 20-49 without
children)
Female employment rate
(aged 20-49 with 1 child less than 6 years old)
Formal childcare, children less than 3 years (1-29
hours)
Formal childcare, children less than 3 years (30+
hours)
Low wage earner unemployment trap
PT employment due to looking after children or
incapacitated adults
At risk of poverty rate before social transfers
In-work at-risk-of-poverty
CZ Pre-2007 CZ Post-2007 EU27
43
Summary: Flexicurity Policy 2007-2010
At the macro-economic level, the Czech Republic performs well. The Czech Republic scores well when employment and growth indicators are considered and all are above average
in both the pre and post- 2007 period, with the exception of GDP which was below average. In addition, long term unemployment is better in the Czech Republic than the EU
average for both periods. In terms of taxation, the levels of taxation on income and wealth is below average for both periods, whereas the implicit tax rate on labour and taxes on
goods and services as a share of GDP is just above average for the same time.
The Czech Republic has low levels of gross government debt but total labour market policy is worse compared to the EU. However, the total expenditure on social protection is
below average whereas by the post-2007 period the share of benefits spent on unemployment increased. Public expenditure on education remains below the EU average as does
the share of the adult population participating in education and training. Moreover, the Czech Republic has low levels of lower secondary attainment and tertiary attainment.
In relation to Active labour Market Policy number of LMP participants engaged in active measure as a share of all unemployed was lower in the Czech Republic for both the pre and
post-2007 periods when compared to the EU average. Unemployment rates for female, younger and older workers are higher in the Czech Republic than the EU average.
Furthermore, the Czech Republic is characterised by weak Employment Protection Legislation for standard workers and the average number of hours worked per week was slightly
higher than the EU over the two periods. In terms of lifelong learning, the total public expenditure on education as a percentage of GDP and private expenditure on education as %
of GDP are slightly lower in the Czech Republic than the EU average for both the pre and post-2007 periods. In addition, the Czech Republic is well below the EU average in relation
to all lifelong learning indicators.
When it comes to modern social security systems, the expenditure on passive LMP and on social protection in the Czech Republic was lower than the EU average for both the pre
and post-2007 periods. The rate of employment for females without children is higher in the Czech Republic than those with children. This means that the Czech position regarding
access to childcare is extremely low compared to the EU average – the access rate for 30 hours or more is virtually non-existent. Furthermore, the share of workers in part-time
employment as a result of looking after children or incapacitated adults is higher in the Czech Republic than the EU average.

44
7 Denmark
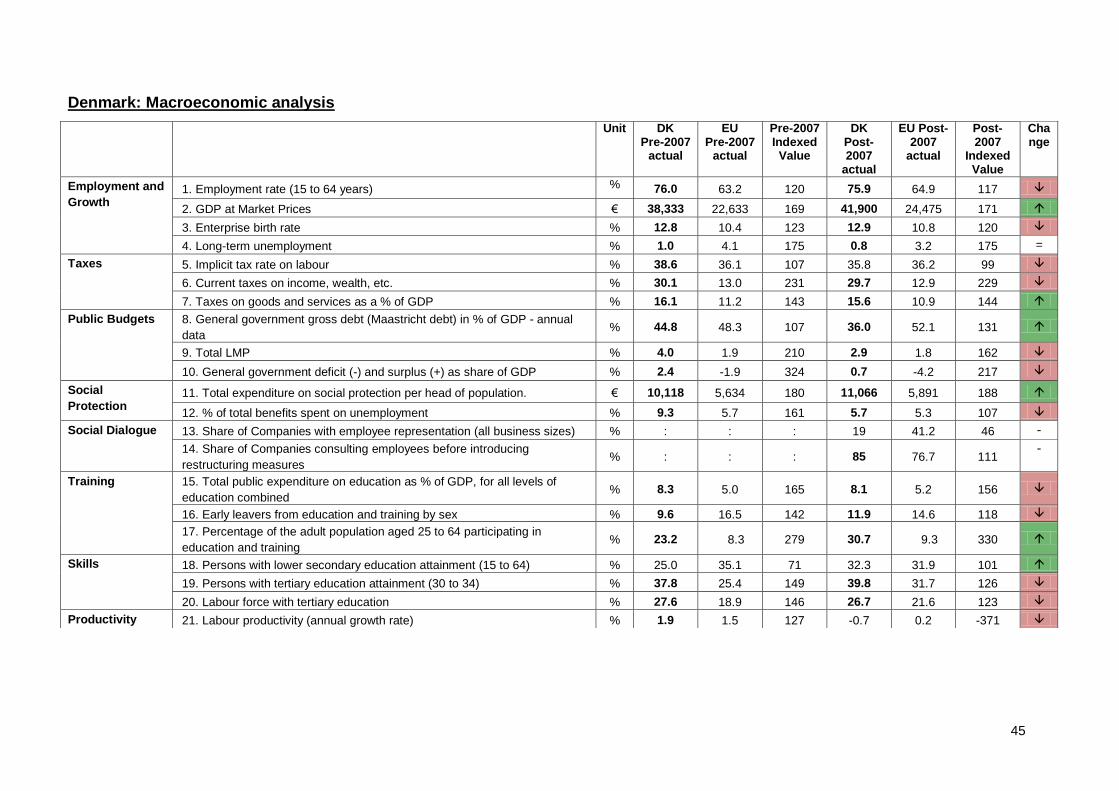
45
Denmark: Macroeconomic analysis
Unit DK Pre-2007
actual
EU Pre-2007
actual
Pre-2007 Indexed Value
DK Post-2007
actual
EU Post-2007
actual
Post-2007
Indexed Value
Change
Employment and
Growth 1. Employment rate (15 to 64 years) % 76.0 63.2 120 75.9 64.9 117
2. GDP at Market Prices € 38,333 22,633 169 41,900 24,475 171
3. Enterprise birth rate % 12.8 10.4 123 12.9 10.8 120
4. Long-term unemployment % 1.0 4.1 175 0.8 3.2 175 =
Taxes 5. Implicit tax rate on labour % 38.6 36.1 107 35.8 36.2 99
6. Current taxes on income, wealth, etc. % 30.1 13.0 231 29.7 12.9 229
7. Taxes on goods and services as a % of GDP % 16.1 11.2 143 15.6 10.9 144
Public Budgets 8. General government gross debt (Maastricht debt) in % of GDP - annual
data % 44.8 48.3 107 36.0 52.1 131
9. Total LMP % 4.0 1.9 210 2.9 1.8 162
10. General government deficit (-) and surplus (+) as share of GDP % 2.4 -1.9 324 0.7 -4.2 217
Social
Protection 11. Total expenditure on social protection per head of population. € 10,118 5,634 180 11,066 5,891 188
12. % of total benefits spent on unemployment % 9.3 5.7 161 5.7 5.3 107
Social Dialogue 13. Share of Companies with employee representation (all business sizes) % : : : 19 41.2 46 -
14. Share of Companies consulting employees before introducing
restructuring measures % : : : 85 76.7 111
-
Training 15. Total public expenditure on education as % of GDP, for all levels of
education combined % 8.3 5.0 165 8.1 5.2 156
16. Early leavers from education and training by sex % 9.6 16.5 142 11.9 14.6 118
17. Percentage of the adult population aged 25 to 64 participating in
education and training % 23.2 8.3 279 30.7 9.3 330
Skills 18. Persons with lower secondary education attainment (15 to 64) % 25.0 35.1 71 32.3 31.9 101
19. Persons with tertiary education attainment (30 to 34) % 37.8 25.4 149 39.8 31.7 126
20. Labour force with tertiary education % 27.6 18.9 146 26.7 21.6 123
Productivity 21. Labour productivity (annual growth rate) % 1.9 1.5 127 -0.7 0.2 -371
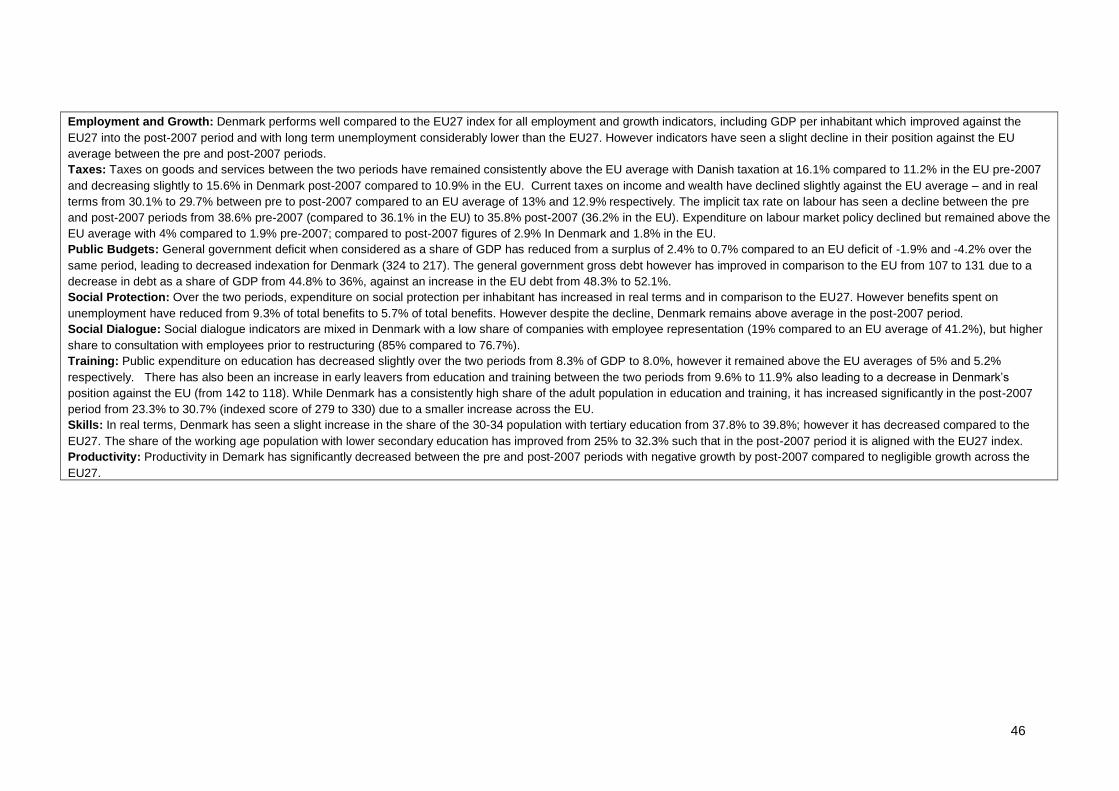
46
Employment and Growth: Denmark performs well compared to the EU27 index for all employment and growth indicators, including GDP per inhabitant which improved against the
EU27 into the post-2007 period and with long term unemployment considerably lower than the EU27. However indicators have seen a slight decline in their position against the EU
average between the pre and post-2007 periods.
Taxes: Taxes on goods and services between the two periods have remained consistently above the EU average with Danish taxation at 16.1% compared to 11.2% in the EU pre-2007
and decreasing slightly to 15.6% in Denmark post-2007 compared to 10.9% in the EU. Current taxes on income and wealth have declined slightly against the EU average – and in real
terms from 30.1% to 29.7% between pre to post-2007 compared to an EU average of 13% and 12.9% respectively. The implicit tax rate on labour has seen a decline between the pre
and post-2007 periods from 38.6% pre-2007 (compared to 36.1% in the EU) to 35.8% post-2007 (36.2% in the EU). Expenditure on labour market policy declined but remained above the
EU average with 4% compared to 1.9% pre-2007; compared to post-2007 figures of 2.9% In Denmark and 1.8% in the EU.
Public Budgets: General government deficit when considered as a share of GDP has reduced from a surplus of 2.4% to 0.7% compared to an EU deficit of -1.9% and -4.2% over the
same period, leading to decreased indexation for Denmark (324 to 217). The general government gross debt however has improved in comparison to the EU from 107 to 131 due to a
decrease in debt as a share of GDP from 44.8% to 36%, against an increase in the EU debt from 48.3% to 52.1%.
Social Protection: Over the two periods, expenditure on social protection per inhabitant has increased in real terms and in comparison to the EU27. However benefits spent on
unemployment have reduced from 9.3% of total benefits to 5.7% of total benefits. However despite the decline, Denmark remains above average in the post-2007 period.
Social Dialogue: Social dialogue indicators are mixed in Denmark with a low share of companies with employee representation (19% compared to an EU average of 41.2%), but higher
share to consultation with employees prior to restructuring (85% compared to 76.7%).
Training: Public expenditure on education has decreased slightly over the two periods from 8.3% of GDP to 8.0%, however it remained above the EU averages of 5% and 5.2%
respectively. There has also been an increase in early leavers from education and training between the two periods from 9.6% to 11.9% also leading to a decrease in Denmark’s
position against the EU (from 142 to 118). While Denmark has a consistently high share of the adult population in education and training, it has increased significantly in the post-2007
period from 23.3% to 30.7% (indexed score of 279 to 330) due to a smaller increase across the EU.
Skills: In real terms, Denmark has seen a slight increase in the share of the 30-34 population with tertiary education from 37.8% to 39.8%; however it has decreased compared to the
EU27. The share of the working age population with lower secondary education has improved from 25% to 32.3% such that in the post-2007 period it is aligned with the EU27 index.
Productivity: Productivity in Demark has significantly decreased between the pre and post-2007 periods with negative growth by post-2007 compared to negligible growth across the
EU27.
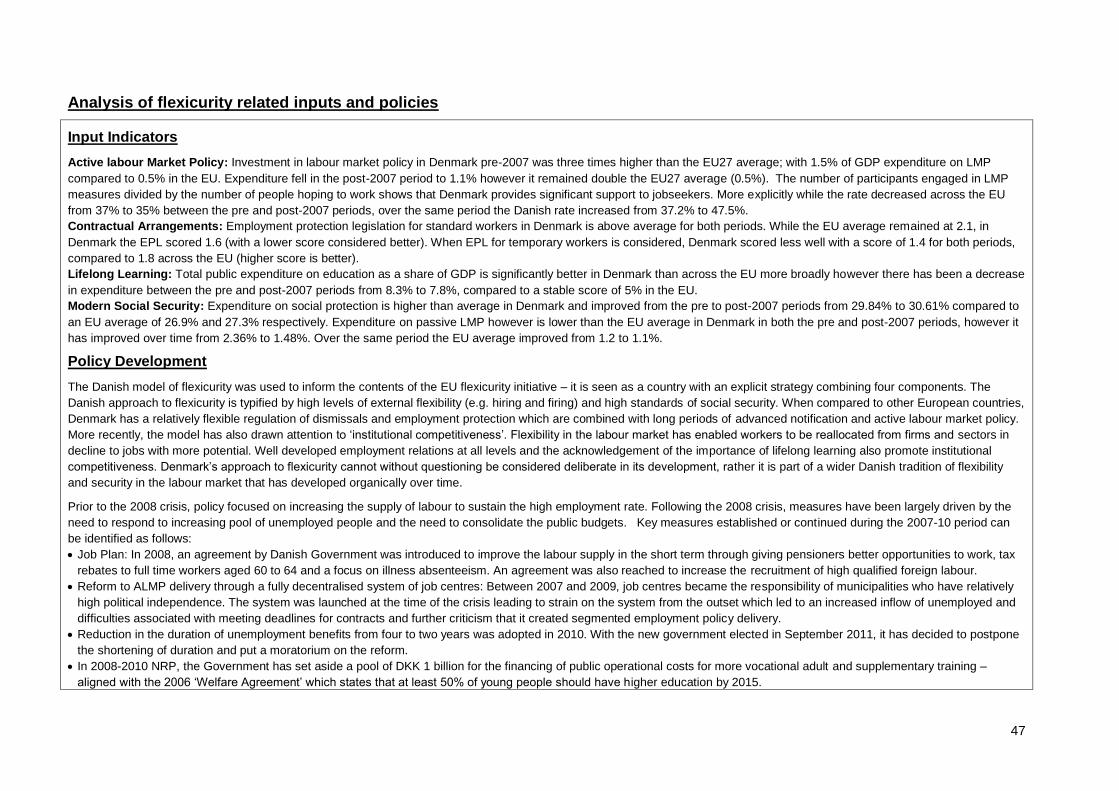
47
Analysis of flexicurity related inputs and policies
Input Indicators
Active labour Market Policy: Investment in labour market policy in Denmark pre-2007 was three times higher than the EU27 average; with 1.5% of GDP expenditure on LMP
compared to 0.5% in the EU. Expenditure fell in the post-2007 period to 1.1% however it remained double the EU27 average (0.5%). The number of participants engaged in LMP
measures divided by the number of people hoping to work shows that Denmark provides significant support to jobseekers. More explicitly while the rate decreased across the EU
from 37% to 35% between the pre and post-2007 periods, over the same period the Danish rate increased from 37.2% to 47.5%.
Contractual Arrangements: Employment protection legislation for standard workers in Denmark is above average for both periods. While the EU average remained at 2.1, in
Denmark the EPL scored 1.6 (with a lower score considered better). When EPL for temporary workers is considered, Denmark scored less well with a score of 1.4 for both periods,
compared to 1.8 across the EU (higher score is better).
Lifelong Learning: Total public expenditure on education as a share of GDP is significantly better in Denmark than across the EU more broadly however there has been a decrease
in expenditure between the pre and post-2007 periods from 8.3% to 7.8%, compared to a stable score of 5% in the EU.
Modern Social Security: Expenditure on social protection is higher than average in Denmark and improved from the pre to post-2007 periods from 29.84% to 30.61% compared to
an EU average of 26.9% and 27.3% respectively. Expenditure on passive LMP however is lower than the EU average in Denmark in both the pre and post-2007 periods, however it
has improved over time from 2.36% to 1.48%. Over the same period the EU average improved from 1.2 to 1.1%.
Policy Development
The Danish model of flexicurity was used to inform the contents of the EU flexicurity initiative – it is seen as a country with an explicit strategy combining four components. The
Danish approach to flexicurity is typified by high levels of external flexibility (e.g. hiring and firing) and high standards of social security. When compared to other European countries,
Denmark has a relatively flexible regulation of dismissals and employment protection which are combined with long periods of advanced notification and active labour market policy.
More recently, the model has also drawn attention to ‘institutional competitiveness’. Flexibility in the labour market has enabled workers to be reallocated from firms and sectors in
decline to jobs with more potential. Well developed employment relations at all levels and the acknowledgement of the importance of lifelong learning also promote institutional
competitiveness. Denmark’s approach to flexicurity cannot without questioning be considered deliberate in its development, rather it is part of a wider Danish tradition of flexibility
and security in the labour market that has developed organically over time.
Prior to the 2008 crisis, policy focused on increasing the supply of labour to sustain the high employment rate. Following the 2008 crisis, measures have been largely driven by the
need to respond to increasing pool of unemployed people and the need to consolidate the public budgets. Key measures established or continued during the 2007-10 period can
be identified as follows:
Job Plan: In 2008, an agreement by Danish Government was introduced to improve the labour supply in the short term through giving pensioners better opportunities to work, tax
rebates to full time workers aged 60 to 64 and a focus on illness absenteeism. An agreement was also reached to increase the recruitment of high qualified foreign labour.
Reform to ALMP delivery through a fully decentralised system of job centres: Between 2007 and 2009, job centres became the responsibility of municipalities who have relatively
high political independence. The system was launched at the time of the crisis leading to strain on the system from the outset which led to an increased inflow of unemployed and
difficulties associated with meeting deadlines for contracts and further criticism that it created segmented employment policy delivery.
Reduction in the duration of unemployment benefits from four to two years was adopted in 2010. With the new government elected in September 2011, it has decided to postpone
the shortening of duration and put a moratorium on the reform.
In 2008-2010 NRP, the Government has set aside a pool of DKK 1 billion for the financing of public operational costs for more vocational adult and supplementary training –
aligned with the 2006 ‘Welfare Agreement’ which states that at least 50% of young people should have higher education by 2015.
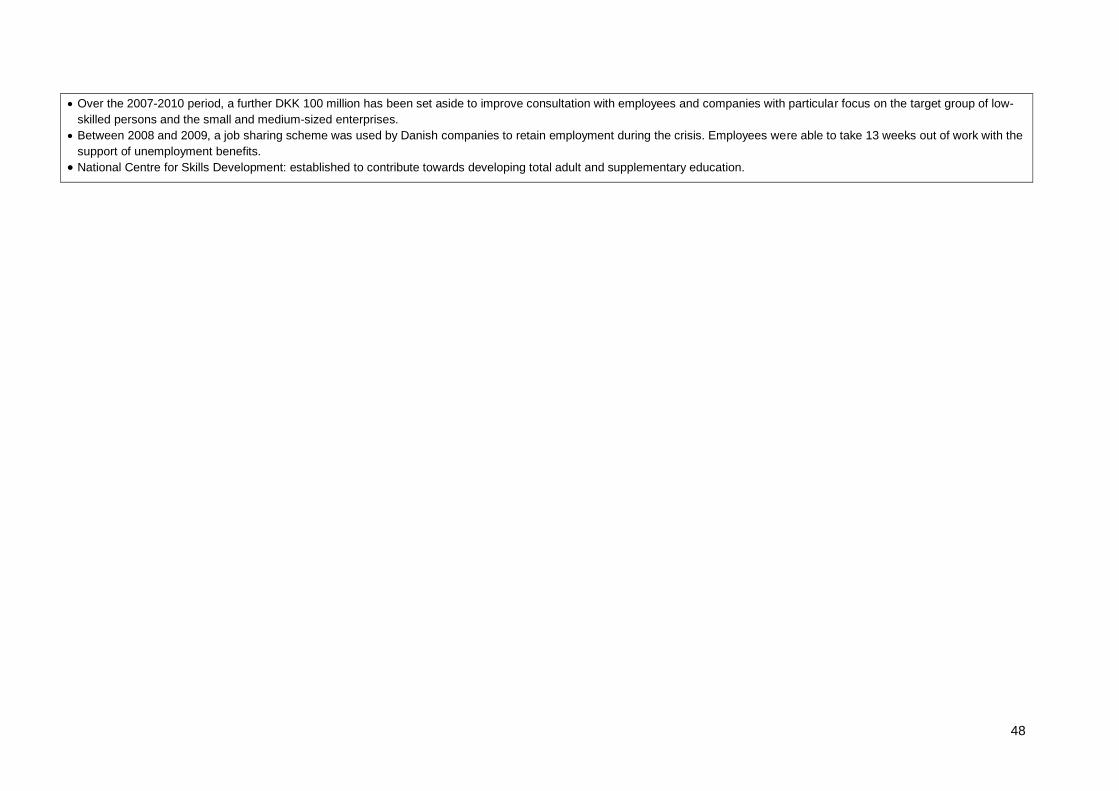
48
Over the 2007-2010 period, a further DKK 100 million has been set aside to improve consultation with employees and companies with particular focus on the target group of low-
skilled persons and the small and medium-sized enterprises.
Between 2008 and 2009, a job sharing scheme was used by Danish companies to retain employment during the crisis. Employees were able to take 13 weeks out of work with the
support of unemployment benefits.
National Centre for Skills Development: established to contribute towards developing total adult and supplementary education.
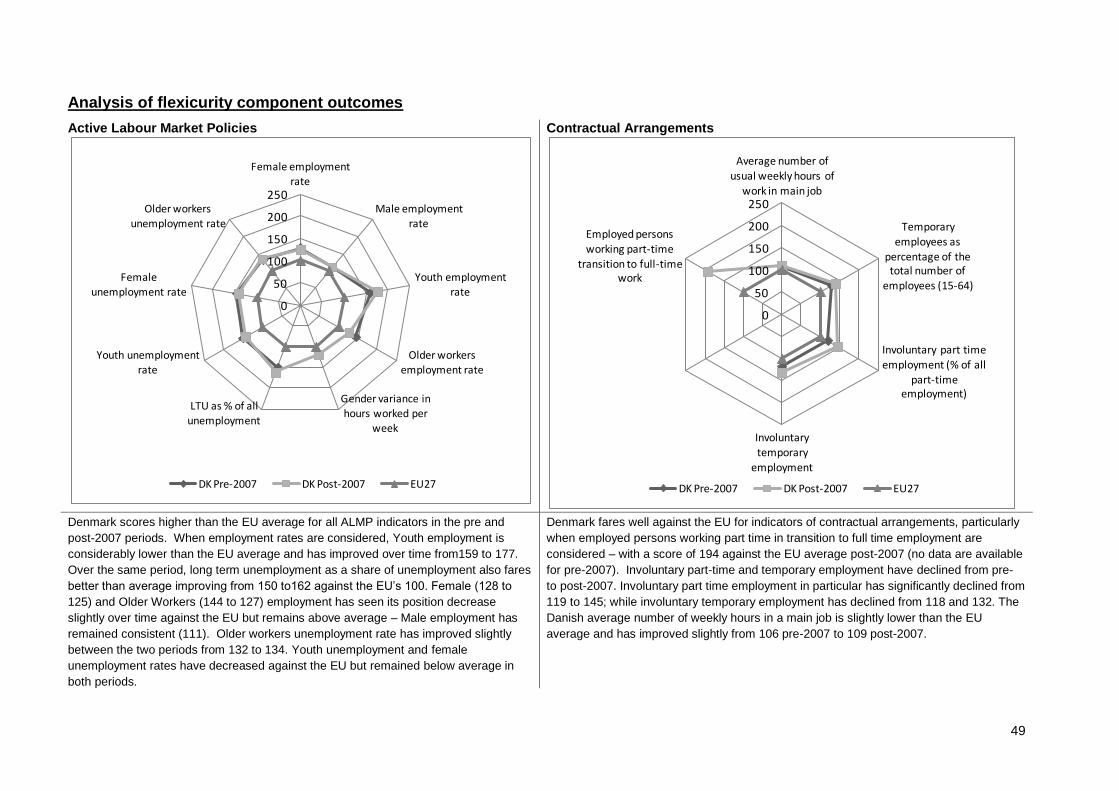
49
Analysis of flexicurity component outcomes
Active Labour Market Policies
Contractual Arrangements
Denmark scores higher than the EU average for all ALMP indicators in the pre and
post-2007 periods. When employment rates are considered, Youth employment is
considerably lower than the EU average and has improved over time from159 to 177.
Over the same period, long term unemployment as a share of unemployment also fares
better than average improving from 150 to162 against the EU’s 100. Female (128 to
125) and Older Workers (144 to 127) employment has seen its position decrease
slightly over time against the EU but remains above average – Male employment has
remained consistent (111). Older workers unemployment rate has improved slightly
between the two periods from 132 to 134. Youth unemployment and female
unemployment rates have decreased against the EU but remained below average in
both periods.
Denmark fares well against the EU for indicators of contractual arrangements, particularly
when employed persons working part time in transition to full time employment are
considered – with a score of 194 against the EU average post-2007 (no data are available
for pre-2007). Involuntary part-time and temporary employment have declined from pre-
to post-2007. Involuntary part time employment in particular has significantly declined from
119 to 145; while involuntary temporary employment has declined from 118 and 132. The
Danish average number of weekly hours in a main job is slightly lower than the EU
average and has improved slightly from 106 pre-2007 to 109 post-2007.
0
50
100
150
200
250
Female employment rate
Male employment
rate
Youth employment rate
Older workers employment rate
Gender variance in hours worked per
week
LTU as % of all unemployment
Youth unemployment rate
Female unemployment rate
Older workers
unemployment rate
DK Pre-2007 DK Post-2007 EU27
0
50
100
150
200
250
Average number of
usual weekly hours of work in main job
Temporary
employees as percentage of the total number of
employees (15-64)
Involuntary part time
employment (% of all part-time
employment)
Involuntary temporary
employment
Employed persons working part-time
transition to full-time work
DK Pre-2007 DK Post-2007 EU27
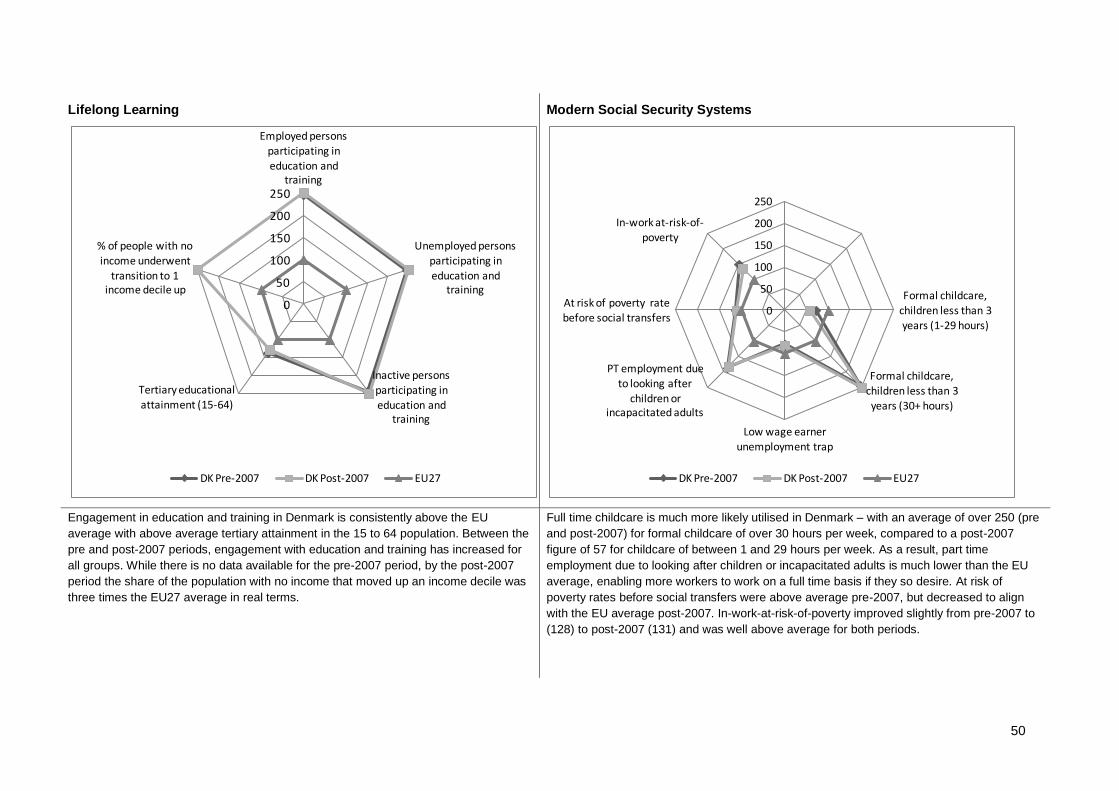
50
Lifelong Learning
Modern Social Security Systems
Engagement in education and training in Denmark is consistently above the EU
average with above average tertiary attainment in the 15 to 64 population. Between the
pre and post-2007 periods, engagement with education and training has increased for
all groups. While there is no data available for the pre-2007 period, by the post-2007
period the share of the population with no income that moved up an income decile was
three times the EU27 average in real terms.
Full time childcare is much more likely utilised in Denmark – with an average of over 250 (pre
and post-2007) for formal childcare of over 30 hours per week, compared to a post-2007
figure of 57 for childcare of between 1 and 29 hours per week. As a result, part time
employment due to looking after children or incapacitated adults is much lower than the EU
average, enabling more workers to work on a full time basis if they so desire. At risk of
poverty rates before social transfers were above average pre-2007, but decreased to align
with the EU average post-2007. In-work-at-risk-of-poverty improved slightly from pre-2007 to
(128) to post-2007 (131) and was well above average for both periods.
0
50
100
150
200
250
Employed persons participating in education and
training
Unemployed persons participating in
education and training
Inactive persons participating in education and
training
Tertiary educational
attainment (15-64)
% of people with no income underwent
transition to 1 income decile up
DK Pre-2007 DK Post-2007 EU27
0
50
100
150
200
250
Formal childcare,
children less than 3 years (1-29 hours)
Formal childcare, children less than 3 years (30+ hours)
Low wage earner unemployment trap
PT employment due to looking after
children or incapacitated adults
At risk of poverty rate before social transfers
In-work at-risk-of-poverty
DK Pre-2007 DK Post-2007 EU27
51
Summary: Flexicurity Policy 2007-2010
The EU initiative has not had a significant impact on Denmark’s flexicurity policy, largely due to Denmark being an exemplar model of flexicurity upon which the EU initiative was
based, i.e. with focus on high inputs to ALMP, labour market support and lifelong learning as well as less stringent employment protection law.
Before the crisis, the focus was on creating labour supply to maintain a high employment rate with investment in an active labour market policy and lifelong learning, however since
2008 boosting labour market demand has been prioritised through expansive fiscal policy. There has been a slight decrease in employment rates, but they are still consistently
above the EU27. A number of policy changes have been made to mitigate the crisis, including shortening the length of unemployment benefit and schemes to enable employees to
leave their jobs for a set period and receive unemployment benefit. A key impact of the crisis however was unemployment which doubled in Denmark between 2008 and 2010,
however between the pre and post-2007 periods, long term unemployment has remained consistent, negligibly reducing. While overall investment in LMP has decreased,
expenditure on social protection per inhabitant has increased in real terms and against the EU27 index.
Some have criticised Denmark’s approach to flexicurity as having a negative impact on the country’s ability to deal with the crisis e.g. through the relative ease at firing employees no
longer in demand. While employment protection legislation for standard workers is above average, employment protection legislation for temporary workers is below the EU average.
However, overall Denmark can be considered as a country with an explicit strategy of combining the four components. The extent to which this combined strategy has been explicitly
and deliberately developed is more questionable.
Future Challenges
Since the onset of the 2008 economic crisis, the key policy consideration in the country was the need to respond to the unfolding crisis, increasing unemployment and to consolidate
the public budgets. Changes occurring to the Danish version of flexicurity were mostly driven by the crisis impacts (such as the decrease of unemployment benefit duration from 4 to
2 years), and the need to consolidate public budgets and to respond to rapidly rising unemployment. Such challenges will remain – at least until Denmark is again on a sustainable
path of economic growth. The challenge is also to ensure that the main institutional characteristics of the Danish flexicurity system will themselves be sustainable, when facing an
economic downturn where the public budgets come under increased strain to finance the high levels of expenditure on ALMP, LLL and passive income supports.

52
8 Estonia
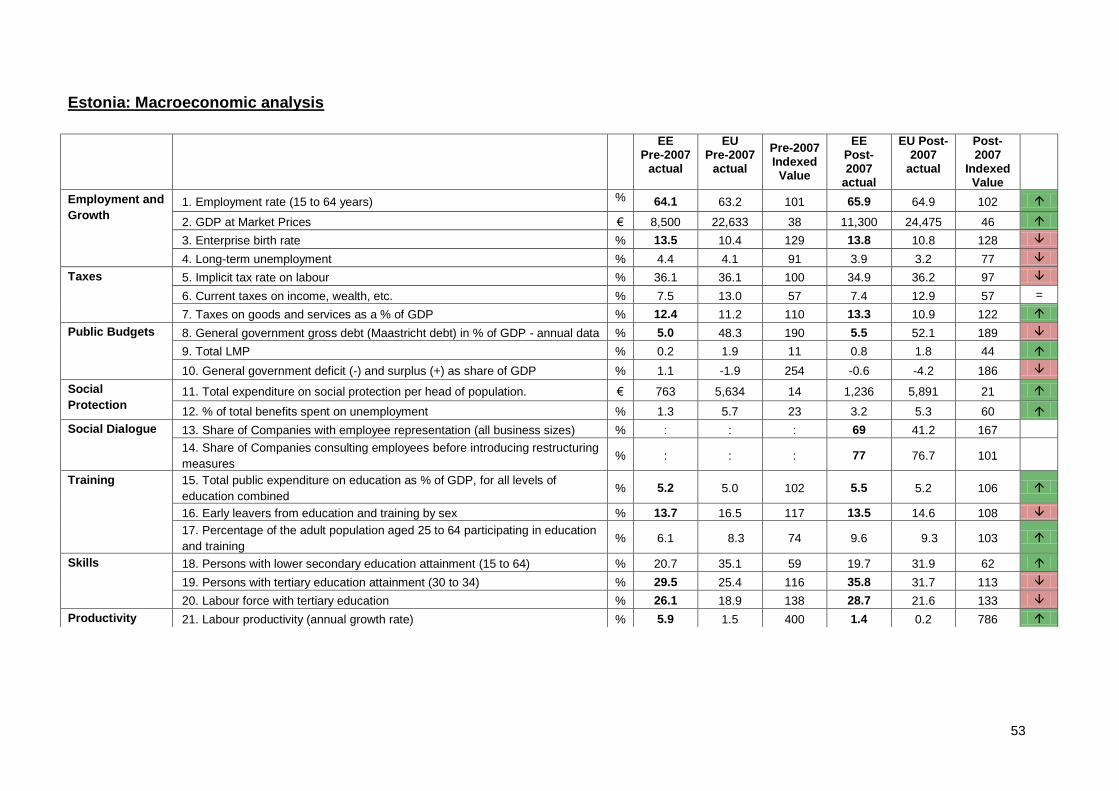
53
Estonia: Macroeconomic analysis
EE Pre-2007
actual
EU Pre-2007
actual
Pre-2007 Indexed Value
EE Post-2007
actual
EU Post-2007
actual
Post-2007
Indexed Value
Employment and
Growth 1. Employment rate (15 to 64 years) % 64.1 63.2 101 65.9 64.9 102
2. GDP at Market Prices € 8,500 22,633 38 11,300 24,475 46
3. Enterprise birth rate % 13.5 10.4 129 13.8 10.8 128
4. Long-term unemployment % 4.4 4.1 91 3.9 3.2 77
Taxes 5. Implicit tax rate on labour % 36.1 36.1 100 34.9 36.2 97
6. Current taxes on income, wealth, etc. % 7.5 13.0 57 7.4 12.9 57 =
7. Taxes on goods and services as a % of GDP % 12.4 11.2 110 13.3 10.9 122
Public Budgets 8. General government gross debt (Maastricht debt) in % of GDP - annual data % 5.0 48.3 190 5.5 52.1 189
9. Total LMP % 0.2 1.9 11 0.8 1.8 44
10. General government deficit (-) and surplus (+) as share of GDP % 1.1 -1.9 254 -0.6 -4.2 186
Social
Protection 11. Total expenditure on social protection per head of population. € 763 5,634 14 1,236 5,891 21
12. % of total benefits spent on unemployment % 1.3 5.7 23 3.2 5.3 60
Social Dialogue 13. Share of Companies with employee representation (all business sizes) % : : : 69 41.2 167
14. Share of Companies consulting employees before introducing restructuring
measures % : : : 77 76.7 101
Training 15. Total public expenditure on education as % of GDP, for all levels of
education combined % 5.2 5.0 102 5.5 5.2 106
16. Early leavers from education and training by sex % 13.7 16.5 117 13.5 14.6 108
17. Percentage of the adult population aged 25 to 64 participating in education
and training % 6.1 8.3 74 9.6 9.3 103
Skills 18. Persons with lower secondary education attainment (15 to 64) % 20.7 35.1 59 19.7 31.9 62
19. Persons with tertiary education attainment (30 to 34) % 29.5 25.4 116 35.8 31.7 113
20. Labour force with tertiary education % 26.1 18.9 138 28.7 21.6 133
Productivity 21. Labour productivity (annual growth rate) % 5.9 1.5 400 1.4 0.2 786
54
Employment and Growth: GDP per inhabitant improved in the post-2007 period from a rate of €8,500 in the pre-2007 period to €11,300 but remained significantly below the EU
averages for the both periods of €22,633 and €24,475. The employment rate was closely aligned with the EU average and improvement slightly in the post-2007 period from 64.1%
(compared to an EU average of 63.2%) compared to 65.9% post-2007 (compared to 64.9%). There was a decrease in long term unemployment from 4.4% in the pre-2007 period to
3.9% in the post-2007 period, due to a greater decrease in the EU average Estonia’s score worsened compared to the EU average. Between the periods, the enterprise birth rate
increased slightly from 13.5% to 13.8% compared to an increase in the EU average from 10.4% to 10.8%.
Taxes: The implicit tax rate on labour has remained relatively unchanged over the period and is aligned with the EU27 average at 36.1% in the post-2007 period, compared to the
EU average of 36.2%. However taxation on goods and services increased from 12.4% to 13.3% compared to a decrease from 11.2% to 10.9% in the EU average. Current taxation
on income and wealth decreased slightly from 7.5% to 7.4%, its position compared to the EU average remained stable with an index of 57 for both periods.
Public Budgets: General government gross debt remained significantly lower than the EU average i.e. 5% in the pre-2007 period and an average of 5.5% in the post-2007 period,
compared to EU averages of 48.3% and 52.1% for the two periods. In the pre-2007 period, Estonia had a general government surplus of 1.1% of GDP, compared to the EU deficit
of -1.9%. By the post-2007 period, Estonia had moved into deficit (-0.6%) however it remained better than the EU with an average of -4.2%. Total LMP expenditure was lower than
the EU average at 0.2% in the pre-2007 compared to the EU average of 1.9%. While it did improve to 0.8% in the post-2007 period, it remained below the EU average of 1.8%.
Social Protection: Estonia fares poorly on social protection indicators, although there was improvement from the pre to post 2007 periods. Expenditure on social protection is
particularly low at just €763 in the pre-2007 period compared to an EU average of €5,634. While it increased to €1,235 in the post-2007 period it remained significantly below the EU
average of €5,891. While there was improvement in the share of benefits spent on unemployment between the pre-2007 and post-2007 periods (increasing from 1.3% to 3.2%) it
remained significantly below the EU average in both periods (the EU average was 5.7% and 5.3% respectively).
Social Dialogue: When companies with employee representation are considered, Estonia performs well (69% in Estonia in the post-2007 periods compared to an EU average of
41.2%). When consultation with employees on restructuring measures is considered it is closely aligned with the EU average (77%).
Training: Public expenditure on education was slightly above average in the pre-2007 period and increased in the post-2007 period (from 5.2% to 5.5%). Engagement of the 25 to
64 population in education increased from below the EU average in the pre-2007 period (6.1% compared to an average of 8.3%) to slightly above the EU average in the post-2007
period (9.6% compared to 9.3% in the EU).
Skills: tertiary educational attainment was above average in Estonia in both the pre-2007 period and the post-2007 period. Attainment among the 30 to 34 population increased
from 29.5% in the pre-2007 period to 35.8% in the post-2007 period, while tertiary attainment had been achieved by 26.1% of the labour force in the pre-2007 period, it had
increased to 28.7% in the post-2007 period. Secondary education attainment has decreased in real terms from 20.7% pre-2007 to 18.7% post-2007.
Productivity: the annual growth rate in labour productivity had decreased from 5.9% in the pre-2007 period to 1.4% in the post-2007 period but remained significantly above the EU
average in both periods.
55
Analysis of flexicurity related inputs and policies
Input Indicators
Active labour Market Policy: ALMP expenditure is significantly poorer in Estonia when compared to the EU27 index, particularly when labour market policy is compared with a
score of 14 in the post-2007 period). While there has been an improvement in both the expenditure indicator and the number of participants engaged in LMP divided by those
wanting employment (scoring 35 in the post-2007 period), both are still below average.
Contractual Arrangements: There was no data available for the pre-2007 contractual arrangement input indicators, however in the post-2007 period employment legislation
protecting temporary workers was almost aligned with the EU27 (97) while legislation for standard workers was slightly below average (83).
Lifelong Learning: Public expenditure on education as a share of GDP is just above the EU27 index and has risen slightly between the pre (5.2) and post-2007 (5.3) periods. Over
the same period, private expenditure on education has dropped from 56 to 41 (0.4 to 0.3) suggesting a negative move away from the average EU position.
Modern Social Security: Expenditure on social protection in Estonia has increased over time and to a greater extent than the EU27 with an index of 114 in the pre-2007 period
compared to 116 post-2007. While there was also improvement between the two periods for expenditure on passive LMP, it was still less than the EU27 (increasing from 72 to 87).
Policy Development
The EU flexicurity initiative has had considerable influence on Estonia’s national policy debate and policy making process. The concept was relatively unknown in Estonia prior to
2007 and while more recently understood in policymaking, it is not widely known among the general public.
The new Employment Contracts Act adopted in 2008 and which came into force in 2009 concerns all four pillars of the concept of flexicurity. The Act increased employers’ and
employee’s freedom to negotiate different labour issues and reduced severance payment as well as notice periods. Other key elements of Estonian policy include:
New employment contract act - including reduction of severance payments and notice periods in case of layoffs;
Abolishment of the fringe benefits tax on work related studies - Payments made by employers for work related studies of their employees no longer taxed;
New study-leave regulation - length of the leave and period of remuneration was extended;
Front-loading ESF funds to finance crisis measures - funding was mainly used for extending wage subsidy and labour market training;
Adjusting the supply of ALMP – most importantly, the wage subsidy measure conditions were simplified to promote job creation, enable skilled people to be quickly placed
in jobs and prevent long-term unemployment;
Improved security of persons on maternity and pregnancy leave, parental leave and adoptive parent’s leave – the eligibility period was extended;
Free training courses for the unemployed at local vocational schools funded by ESF (2009 to 2013).
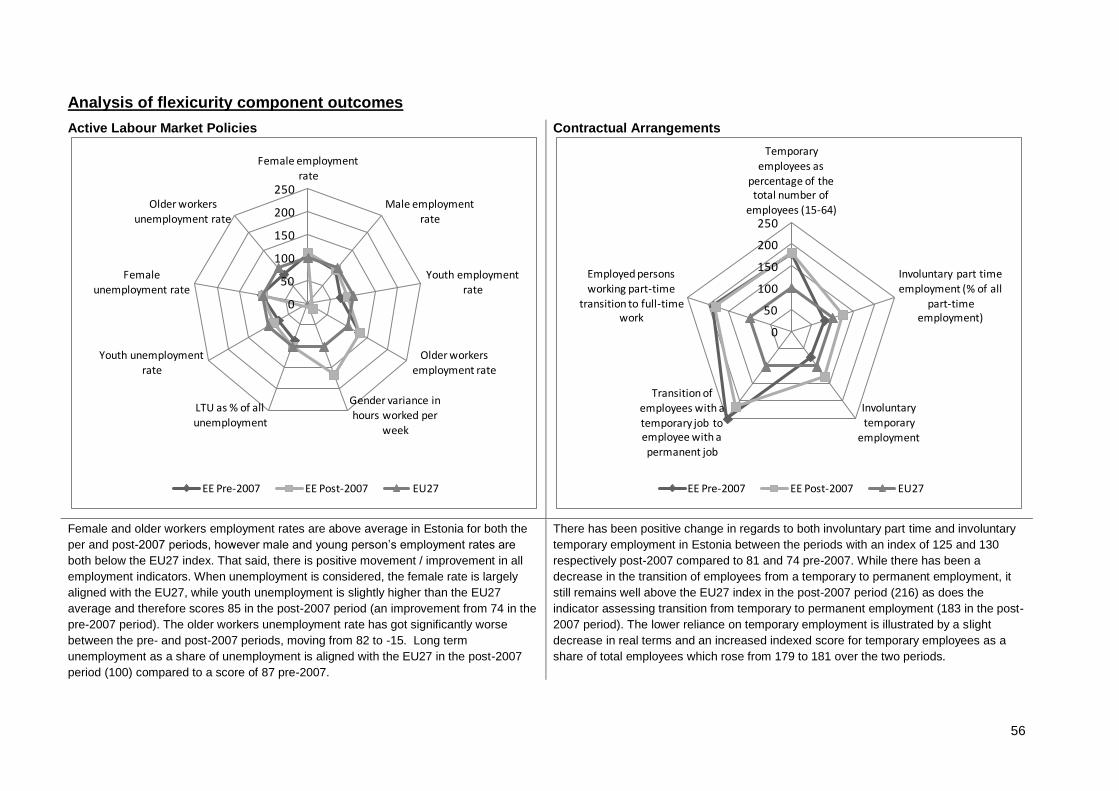
56
Analysis of flexicurity component outcomes
Active Labour Market Policies
Contractual Arrangements
Female and older workers employment rates are above average in Estonia for both the
per and post-2007 periods, however male and young person’s employment rates are
both below the EU27 index. That said, there is positive movement / improvement in all
employment indicators. When unemployment is considered, the female rate is largely
aligned with the EU27, while youth unemployment is slightly higher than the EU27
average and therefore scores 85 in the post-2007 period (an improvement from 74 in the
pre-2007 period). The older workers unemployment rate has got significantly worse
between the pre- and post-2007 periods, moving from 82 to -15. Long term
unemployment as a share of unemployment is aligned with the EU27 in the post-2007
period (100) compared to a score of 87 pre-2007.
There has been positive change in regards to both involuntary part time and involuntary
temporary employment in Estonia between the periods with an index of 125 and 130
respectively post-2007 compared to 81 and 74 pre-2007. While there has been a
decrease in the transition of employees from a temporary to permanent employment, it
still remains well above the EU27 index in the post-2007 period (216) as does the
indicator assessing transition from temporary to permanent employment (183 in the post-
2007 period). The lower reliance on temporary employment is illustrated by a slight
decrease in real terms and an increased indexed score for temporary employees as a
share of total employees which rose from 179 to 181 over the two periods.
0
50
100
150
200
250
Female employment rate
Male employment rate
Youth employment rate
Older workers
employment rate
Gender variance in hours worked per
week
LTU as % of all unemployment
Youth unemployment
rate
Female unemployment rate
Older workers unemployment rate
EE Pre-2007 EE Post-2007 EU27
0
50
100
150
200
250
Temporary
employees as percentage of the total number of
employees (15-64)
Involuntary part time employment (% of all
part-time employment)
Involuntary temporary
employment
Transition of employees with a
temporary job to employee with a permanent job
Employed persons working part-time
transition to full-time work
EE Pre-2007 EE Post-2007 EU27
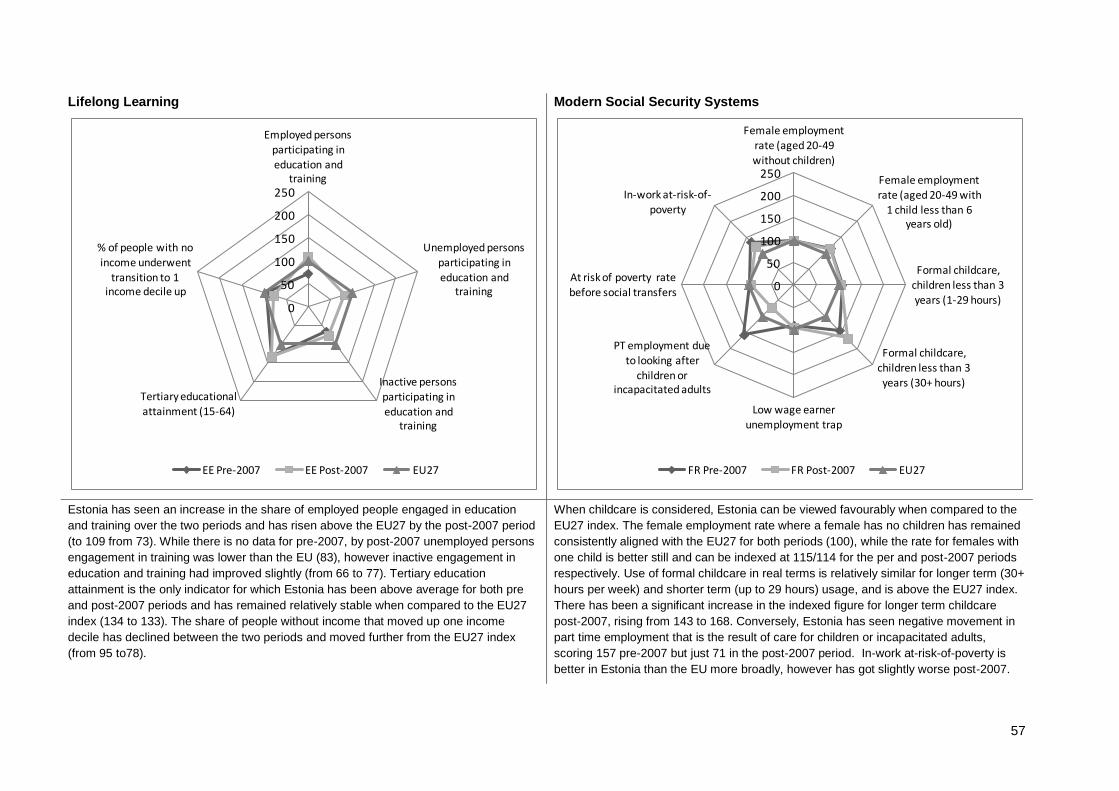
57
Lifelong Learning
Modern Social Security Systems
Estonia has seen an increase in the share of employed people engaged in education
and training over the two periods and has risen above the EU27 by the post-2007 period
(to 109 from 73). While there is no data for pre-2007, by post-2007 unemployed persons
engagement in training was lower than the EU (83), however inactive engagement in
education and training had improved slightly (from 66 to 77). Tertiary education
attainment is the only indicator for which Estonia has been above average for both pre
and post-2007 periods and has remained relatively stable when compared to the EU27
index (134 to 133). The share of people without income that moved up one income
decile has declined between the two periods and moved further from the EU27 index
(from 95 to78).
When childcare is considered, Estonia can be viewed favourably when compared to the
EU27 index. The female employment rate where a female has no children has remained
consistently aligned with the EU27 for both periods (100), while the rate for females with
one child is better still and can be indexed at 115/114 for the per and post-2007 periods
respectively. Use of formal childcare in real terms is relatively similar for longer term (30+
hours per week) and shorter term (up to 29 hours) usage, and is above the EU27 index.
There has been a significant increase in the indexed figure for longer term childcare
post-2007, rising from 143 to 168. Conversely, Estonia has seen negative movement in
part time employment that is the result of care for children or incapacitated adults,
scoring 157 pre-2007 but just 71 in the post-2007 period. In-work at-risk-of-poverty is
better in Estonia than the EU more broadly, however has got slightly worse post-2007.
0
50
100
150
200
250
Employed persons participating in education and
training
Unemployed persons participating in
education and training
Inactive persons
participating in education and
training
Tertiary educational attainment (15-64)
% of people with no income underwent
transition to 1 income decile up
EE Pre-2007 EE Post-2007 EU27
0
50
100
150
200
250
Female employment rate (aged 20-49
without children)
Female employment rate (aged 20-49 with
1 child less than 6 years old)
Formal childcare, children less than 3
years (1-29 hours)
Formal childcare,
children less than 3 years (30+ hours)
Low wage earner unemployment trap
PT employment due to looking after
children or incapacitated adults
At risk of poverty rate
before social transfers
In-work at-risk-of-poverty
FR Pre-2007 FR Post-2007 EU27
58
Summary: Flexicurity Policy 2007-2010
Estonia’s pathway to flexicurity does not follow a specific route as articulated by the EU level, however the EU flexicurity initiative has influenced national policy debate and policy
making processes. However, many of the flexicurity measures were designed prior to 2007 (even if implemented afterwards) and as such a partial flexicurity model was in existence
prior to the launch of the first phase of flexicurity. More specifically however, Social partnership, which is an essential part of flexicurity, is poorly developed in Estonia, and there are
no overarching strategies which guide progress.
Estonian GDP increased slightly when the pre and post-2007 periods are compared, against the EU27 its position significantly improved. Between the periods, while the government
general debt moved from a surplus to a slight deficit, taking into account the overall position across Europe, Estonia remained well above the average. Over the same period the
employment rate remained aligned with that of the EU27.
The share of the adult population engaged in education and training has improved and was, by the post-2007 aligned with the EU27 index, however those with lower secondary
educational attainment remain above average although indicators show that the share of both the adult population and the workforce with tertiary education is consistently better
than the EU average. Post-2007 however the long term unemployment rate declined in both real terms and when its position is compared to that of the average for the EU27, which
are coupled with low labour market policy and social protection indicators (although social protection has improved with an increase in expenditure over time). Youth unemployment
seems to be a significant issue in Estonia, however there has been positive change with a reduction in involuntary temporary and part time employment by the post-2007 period and
significant transition from temporary employment to those in permanent roles. However for the unemployed or inactive, engagement with education and training is much lower than
the EU27 index. While in the pre-2007 period, engagement of employed persons in education was below the EU average, by the post-2007 period it had improved to above the EU
average.
Future Challenges
The four major components of flexicurity—flexible and reliable contractual arrangements, comprehensive lifelong learning strategies, effective active labour market policies, and
modern, adequate and sustainable social protection systems—are addressed as part of the 2008 Employment Contracts Act. It has sought to improve engagement with training,
including the unemployed through ESF funded programmes and also reduced taxation on work related studies paid by employers. However, a number of issues remain which need
to be addressed including increased coverage and access to ALMP, improving the overall employment rate and specifically targeting youth unemployment and long term
unemployment. Similarly, there is a need to improve vertical mobility of the labour market and develop the lifelong learning system which recent changes introduced have started to
address.

59
9 Finland
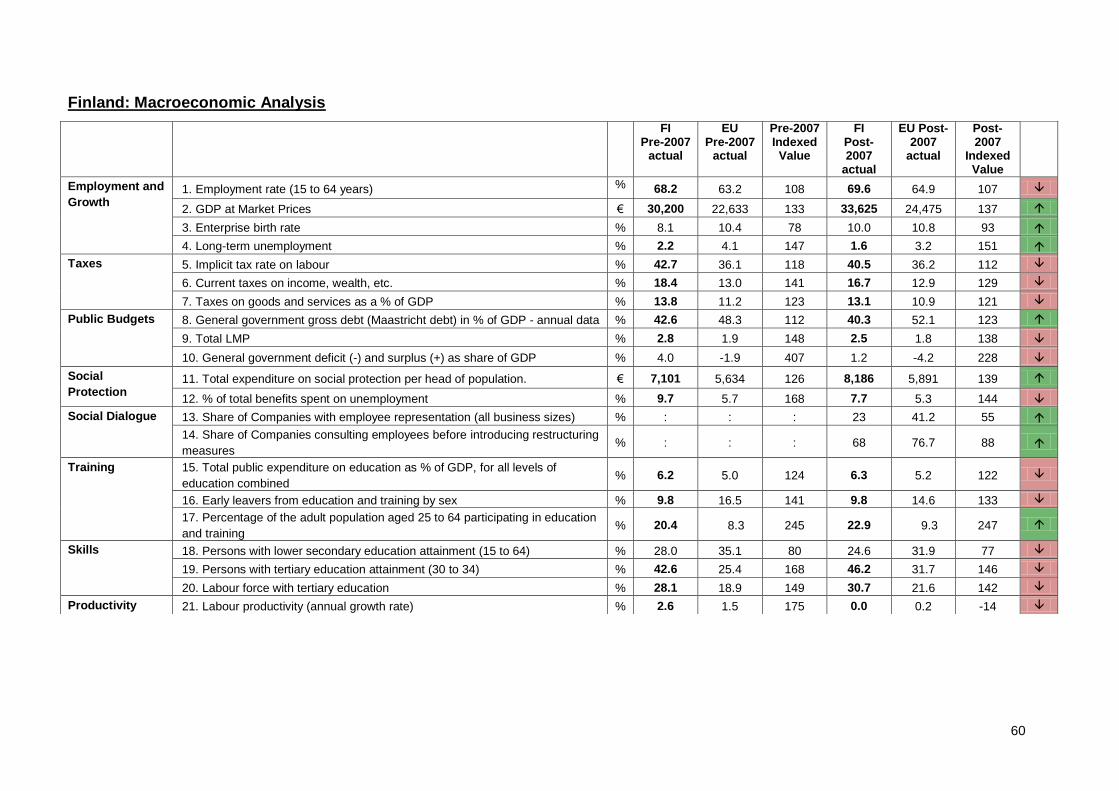
60
Finland: Macroeconomic Analysis
FI Pre-2007
actual
EU Pre-2007
actual
Pre-2007 Indexed Value
FI Post-2007
actual
EU Post-2007
actual
Post-2007
Indexed Value
Employment and
Growth 1. Employment rate (15 to 64 years) % 68.2 63.2 108 69.6 64.9 107
2. GDP at Market Prices € 30,200 22,633 133 33,625 24,475 137
3. Enterprise birth rate % 8.1 10.4 78 10.0 10.8 93
4. Long-term unemployment % 2.2 4.1 147 1.6 3.2 151
Taxes 5. Implicit tax rate on labour % 42.7 36.1 118 40.5 36.2 112
6. Current taxes on income, wealth, etc. % 18.4 13.0 141 16.7 12.9 129
7. Taxes on goods and services as a % of GDP % 13.8 11.2 123 13.1 10.9 121
Public Budgets 8. General government gross debt (Maastricht debt) in % of GDP - annual data % 42.6 48.3 112 40.3 52.1 123
9. Total LMP % 2.8 1.9 148 2.5 1.8 138
10. General government deficit (-) and surplus (+) as share of GDP % 4.0 -1.9 407 1.2 -4.2 228
Social
Protection 11. Total expenditure on social protection per head of population. € 7,101 5,634 126 8,186 5,891 139
12. % of total benefits spent on unemployment % 9.7 5.7 168 7.7 5.3 144
Social Dialogue 13. Share of Companies with employee representation (all business sizes) % : : : 23 41.2 55
14. Share of Companies consulting employees before introducing restructuring
measures % : : : 68 76.7 88
Training 15. Total public expenditure on education as % of GDP, for all levels of
education combined % 6.2 5.0 124 6.3 5.2 122
16. Early leavers from education and training by sex % 9.8 16.5 141 9.8 14.6 133
17. Percentage of the adult population aged 25 to 64 participating in education
and training % 20.4 8.3 245 22.9 9.3 247
Skills 18. Persons with lower secondary education attainment (15 to 64) % 28.0 35.1 80 24.6 31.9 77
19. Persons with tertiary education attainment (30 to 34) % 42.6 25.4 168 46.2 31.7 146
20. Labour force with tertiary education % 28.1 18.9 149 30.7 21.6 142
Productivity 21. Labour productivity (annual growth rate) % 2.6 1.5 175 0.0 0.2 -14
61
Employment and Growth: Finland scores well on employment and growth indicators and is above average for both periods when the employment rate, GDP at market prices and
long term unemployment is considered. GDP has increased between the two periods in real terms from an average of €30,200 to €33,625 with an increased index from 133 to 137.
LTU has improved against the EU and has also reduced in real terms with LTU rate of 2.2% pre-2007 however a rate of 1.6% in the post-2007 period, half the rate realised in the EU
average. However the enterprise birth rate was below average pre-2007 (8.1% compared to 10.4%) and the post-2007 periods (10% compared to 10.8%) however its position
against the EU had improved from 78 to 93.
Taxes: when taxation indicators are considered, Finland remained better than the EU for all indicators, however their position had moved slightly closer to the EU average, due to a
reduction in taxation by post-2007. That said, the implicit tax rate on labour remained at 40.5% compared to 36.2% in the EU in the post-2007 period and current taxation on income
and wealth was 16.7% compared to an EU average of 12.9%. Over the same period, taxation on goods and services was 13.1% of GDP in Finland, compared to 10.9% in the EU.
Public Budgets: the Finnish general government deficit is above average (and therefore better) than the EU in both the pre-2007 and post-2007 periods. In fact, while the EU
average for the government deficit increased to post-2007, in Finland it decreased from 42.6% to 40.5%. Over the same period, expenditure on labour market policy decreased in
real terms and moved closer to the EU average but was still considerable higher than the EU average in the post-2007 period with a share of 2.5% compared to 1.8%. Despite a
general government deficit across the EU in both periods, the Finnish government still had a surplus when GDP is considered as a share of GDP in both periods (4% and 1.2%
respectively) however its position decreased relative to the EU from 402 to 228.
Social Protection: Expenditure on social protection is much higher in Finland and has improved from the pre-2007 period (€7,101) to the post-2007 period (€8,186) with an
improvement in its position against the EU average. Finland also spends more of its benefits on unemployment than the EU average, however less was spent post-2007 (7.7%) than
pre-2007 (9.7%).
Social Dialogue: when social dialogue indicators for post-2007 are considered, Finland does not fare well. In fact just 23% of companies have employee representation compared
to 41.2% across the EU. Similarly, just 68% of companies consulted employees prior to introducing restricting measures, compared to 76.7% compared to an EU average for the
same period.
Training: public expenditure on education is above average in both periods, however dropped slightly when considered against the EU from 124 pre-2007 to 123 post-2008. Early
leavers from education and training is significantly better in Finland and has remained stable at 9.8% over the two periods, compared to a decline from 16.5% to 14.6% in the EU
average. The share of the 25 to 64 population engaging in education and training has improved from 20.4% to 22.9% from pre to post-2007 and is considerably higher than the EU
average for both periods with equivalent EU averages of 8.3% and 9.3% respectively.
Skills: lower secondary education attainment is worse than average and has worsened between the two periods from 28% to 24.6% Tertiary education attainment is better than
average pre-2007 and has increased further in the post-2007 period.
Productivity: the annual growth rate in labour productivity has decreased from 2.6% pre-2007 to 0% post-2007. By post-2007, growth was stationary compared to annual growth of
0.2% across the EU.
62
Analysis of flexicurity related inputs and policies
Input Indicators
Active labour Market Policy: Expenditure on LMP is above average in Finland and has remained consistently above average in both periods at 1.7% of GDP compared t 1.5% EU
average. There is however a below average share of people who are looking for employment involved in LMP measures in Finland in both periods however it rose from 22.6% pre-
2007 to 27.7% post-2007, while there was a decrease in the EU average from 37% to 35%.
Contractual Arrangements: Employment legislation for standard workers is slightly below average in Finland pre-2007 and post-2007 (2.2 compared to an EU average of 2.1),
while legislation for temporary workers is slightly above average pre-2007 (1.9 compared to 1.8 across the EU) and aligned with the EU in the post-2007 period (1.8).
Lifelong Learning: public expenditure on education is consistently above the EU average in Finland although it decreased slightly in the post-2007 period, with 6.2% compared to
5% in the EU pre-2007; and an average of 6% post-2007 compared to 5% in the EU. Conversely, private expenditure on education is sub-average on both periods (for instance
post-2007 it was 0.1% compared to the EU average of 0.7%)
Modern Social Security: Expenditure on passive LMP is significantly below average pre-2007 (index of 36, with a score of 1.97% compared to 1.2% in the EU), however it
improved slightly in the post-2007 period such that against the EU average it scored 63 (1.56% compared to 1.1% in the EU). Expenditure on social protection is slightly below
average pre-2007 (26.0% compared to an EU average of 26.9%) however it was aligned with the EU average in the post-2007 period (27.3%).
Policy Development
While components of flexicurity are addressed in Finnish policy in a comprehensive manner, Flexicurity, although used as a concept in policy making, has not been a strong and
explicit part of policy development and debate. Key to the reinvention of Nordic welfare society has been achieving global competitiveness in a socially and environmentally
sustainable manner and more effective care for and mobilisation of the labour force. Finland started to address elements of flexicurity before they were coined as an EU concept and
as a result there is consensus over key issues. Social partners, despite some difference in opinion, acknowledge the importance of policy that ensures balance between flexibility
and security, while employers often give too much flexibility at the cost of security. However, more recently more common territory has been established. Key elements of policy
development include:
Finland is largely characterised by employment that is full time – with little part time employment, improving the position of temporary work. Finland sits in the middle range
when the ‘strictness’ of hiring and firing is considered with no changes between 2007 and 2010. In order to mitigate the impact of the 2008 crisis, temporary layoffs were
largely promoted with measures introduced to support such temporary lay-offs through changes to unemployment benefits (with one day layoffs able to receive benefits).
The government also offered incentives to companies to avoid layoffs and update staff skills and competences through ‘recruiting training’ (training for recruits, although not
often used during the crisis), ‘change training’ (supporting the upgrading of vocational skills) and ‘company-specific training’ (tailored according to the company and staff
needs).
The ‘Change Security’ measure was introduced in 2005 which helped to ensure that employees that lost their jobs were reemployed quickly through tightened cooperation
between employers, workers and labour administration. To enable this, employment services were offered during a workers’ period of notice and plans were prepared to
make provision for sudden structural changes.
Recent life-long learning guidance strategy is helping to improve the competences of existing VET institutions However the challenge remains as to whether measures are
enough to improve participation in training. Similarly, there needs to be a better interface between adult VET and business to better use vocational training as part of
business development in addition to the positive impact of health and well being at work. Most work to date has focused on flexible arrangements of adult vocational
63
education, while today the focus is moving to get more young people into employment after education;
There have been several ‘waves’ of labour market policy reform and public employment services between 1997-2000 and 2009 to 2012. LMPs focus on enhancing the
quality of work life in general. However the impact of the reforms in the 2007-2010 period are uncertain.
A major initiative was developed to streamline the complex social benefit system in existence in Finland at a time when flexicurity principles were being introduced, however
it was unable to de-fragment the social security/social benefit regime in Finland and led to only partial reform.
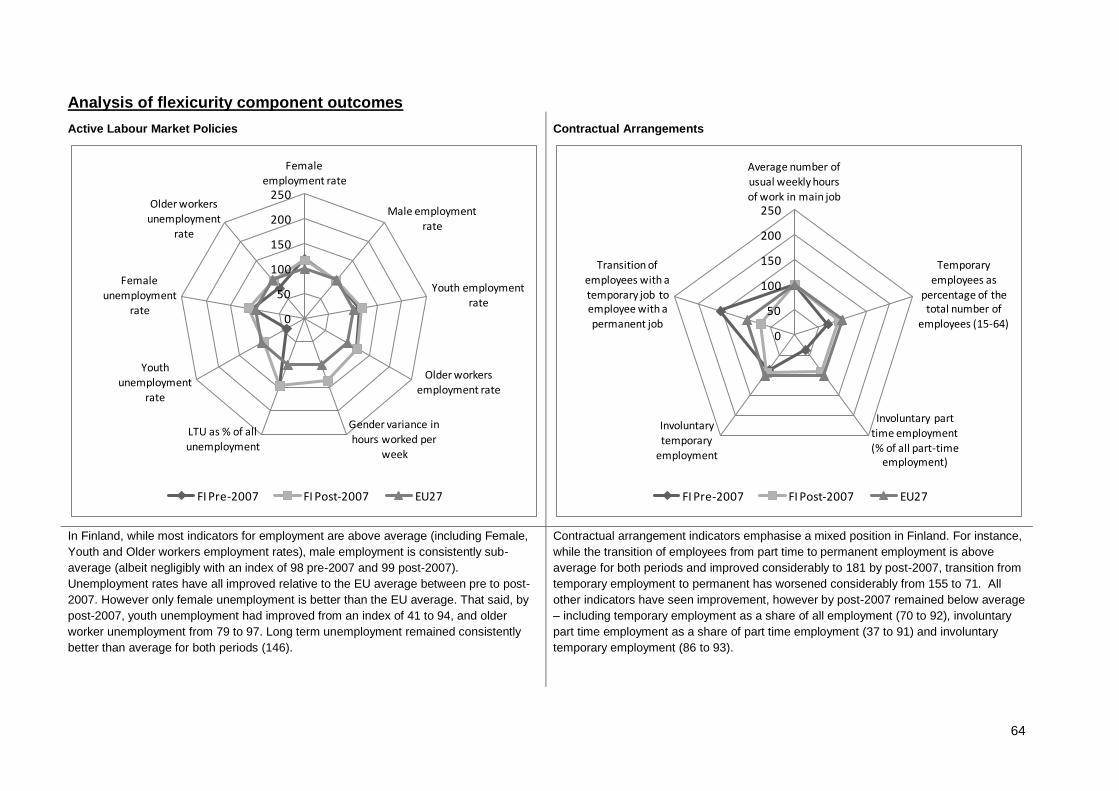
64
Analysis of flexicurity component outcomes
Active Labour Market Policies
Contractual Arrangements
In Finland, while most indicators for employment are above average (including Female,
Youth and Older workers employment rates), male employment is consistently sub-
average (albeit negligibly with an index of 98 pre-2007 and 99 post-2007).
Unemployment rates have all improved relative to the EU average between pre to post-
2007. However only female unemployment is better than the EU average. That said, by
post-2007, youth unemployment had improved from an index of 41 to 94, and older
worker unemployment from 79 to 97. Long term unemployment remained consistently
better than average for both periods (146).
Contractual arrangement indicators emphasise a mixed position in Finland. For instance,
while the transition of employees from part time to permanent employment is above
average for both periods and improved considerably to 181 by post-2007, transition from
temporary employment to permanent has worsened considerably from 155 to 71. All
other indicators have seen improvement, however by post-2007 remained below average
– including temporary employment as a share of all employment (70 to 92), involuntary
part time employment as a share of part time employment (37 to 91) and involuntary
temporary employment (86 to 93).
0
50
100
150
200
250
Female employment rate
Male employment
rate
Youth employment rate
Older workers employment rate
Gender variance in hours worked per
week
LTU as % of all unemployment
Youth unemployment
rate
Female
unemployment rate
Older workers unemployment
rate
FI Pre-2007 FI Post-2007 EU27
0
50
100
150
200
250
Average number of usual weekly hours of work in main job
Temporary employees as
percentage of the total number of
employees (15-64)
Involuntary part time employment (% of all part-time
employment)
Involuntary temporary
employment
Transition of employees with a temporary job to employee with a
permanent job
FI Pre-2007 FI Post-2007 EU27
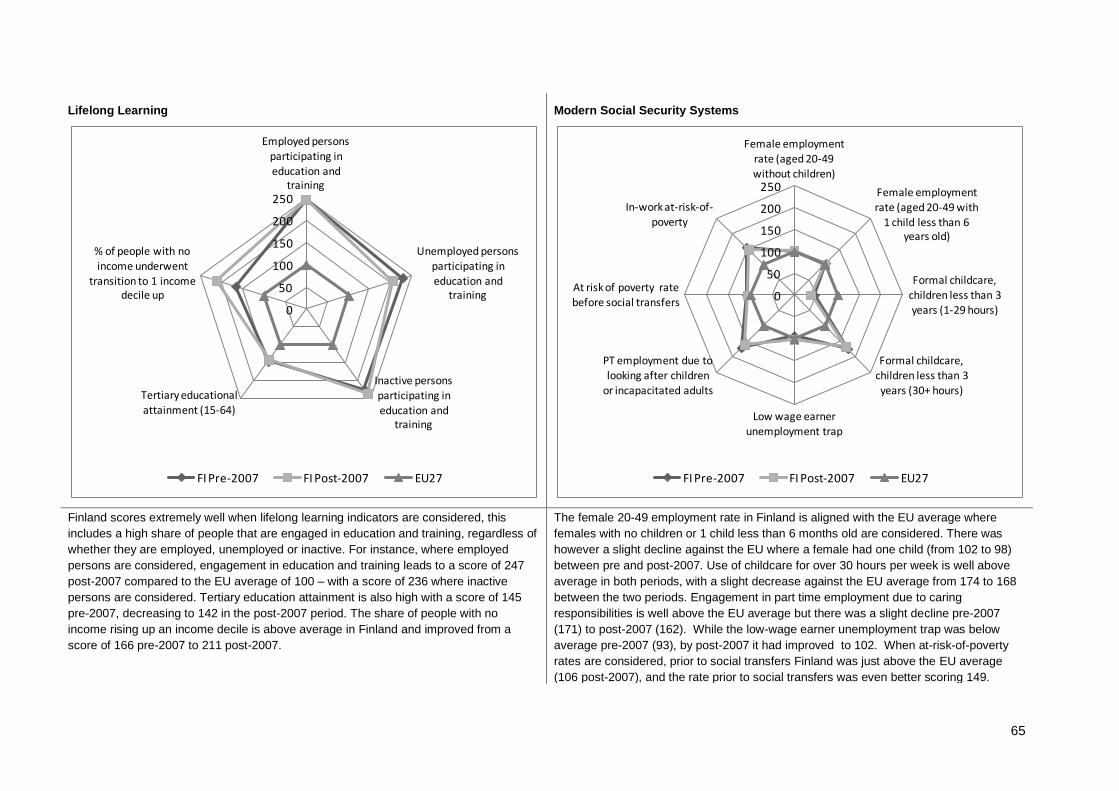
65
Lifelong Learning
Modern Social Security Systems
Finland scores extremely well when lifelong learning indicators are considered, this
includes a high share of people that are engaged in education and training, regardless of
whether they are employed, unemployed or inactive. For instance, where employed
persons are considered, engagement in education and training leads to a score of 247
post-2007 compared to the EU average of 100 – with a score of 236 where inactive
persons are considered. Tertiary education attainment is also high with a score of 145
pre-2007, decreasing to 142 in the post-2007 period. The share of people with no
income rising up an income decile is above average in Finland and improved from a
score of 166 pre-2007 to 211 post-2007.
The female 20-49 employment rate in Finland is aligned with the EU average where
females with no children or 1 child less than 6 months old are considered. There was
however a slight decline against the EU where a female had one child (from 102 to 98)
between pre and post-2007. Use of childcare for over 30 hours per week is well above
average in both periods, with a slight decrease against the EU average from 174 to 168
between the two periods. Engagement in part time employment due to caring
responsibilities is well above the EU average but there was a slight decline pre-2007
(171) to post-2007 (162). While the low-wage earner unemployment trap was below
average pre-2007 (93), by post-2007 it had improved to 102. When at-risk-of-poverty
rates are considered, prior to social transfers Finland was just above the EU average
(106 post-2007), and the rate prior to social transfers was even better scoring 149.
0
50
100
150
200
250
Employed persons
participating in education and
training
Unemployed persons participating in education and
training
Inactive persons participating in education and
training
Tertiary educational attainment (15-64)
% of people with no income underwent
transition to 1 income decile up
FI Pre-2007 FI Post-2007 EU27
0
50
100
150
200
250
Female employment
rate (aged 20-49 without children)
Female employment rate (aged 20-49 with
1 child less than 6 years old)
Formal childcare, children less than 3 years (1-29 hours)
Formal childcare, children less than 3
years (30+ hours)
Low wage earner unemployment trap
PT employment due to looking after children
or incapacitated adults
At risk of poverty rate before social transfers
In-work at-risk-of-poverty
FI Pre-2007 FI Post-2007 EU27
66
Summary: Flexicurity Policy 2007-2010
The impact of flexicurity policy in Finland has been limited – with reforms related to flexicurity concepts visible prior to the concept being introduced. The impact of the concept as EU
policy was limited to a brief attempt to gather policies, stakeholder cooperation, reform initiatives and monitoring under the umbrella of flexicurity. Looking for a balance between
flexibility and security however has been a common ‘thread’ running through Finnish politics for a long time, aligned with the Nordic societal model. That said, the core elements of
the approach to flexicurity approach have been engagement of social partners and the importance of lifelong learning.
The NRP of 2008 to 2010 used the concept, and ‘flexicurity indicators’ were set to follow progress in the key aims of what was called the ‘Finnish flexicurity model’ using the
following categories:
Quicker movement from job to job – good conditions for continuing employment;
Mobilisation of those outside the labour force into work – putting labour resources and expertise to better use;
High quality of working life – a key factor in extending working careers and improving competitiveness. This basic outline monitoring typology was not, however, developed and used. Inputs to flexicurity components are varied. While expenditure on LMP is above average, less of those looking for work are engaged with LMP measures. Unemployment rates in Finland have improved from the pre to post-2007 periods but are still below the EU average post-2007. Long term unemployment however is consistently better than the EU average. In the post-2007 period, expenditure on social protection is aligned with the EU average, as is the employment rate among job seekers of child bearing age (regardless of whether or not they have children). Use of childcare is consistently above average for over 30 hours, while shorter term use of childcare is below average – this could be due to those working in Finland, often doing so for full time hours, or not at all. Finland scores most positively when lifelong learning indicators are considered with public expenditure on education significantly higher than the EU average. As a result, Finland scores well when participation in education and training and tertiary attainment are considered.
Flexicurity principles were acknowledged in Finland prior to their introduction to EU policy and are therefore more attributable to the reinvention of the welfare society than anything
else. A prime example of this is the ‘Change Security’ introduced in 2005 which sought to improve cooperation between employers, employees, unions, public officials and others in
redundancy situations to improve the efficiency of job-to-job transfers and shorten periods of unemployment. In 2011 this was reformed, security measures for employees improved
which improved transitions from work to work through enabling employees to seek employment while on notice of redundancy.
The role of social partners is strong in Finland, with good examples of collaborative policy development. Indeed, Finland has been described as a high trust society where the key
social players including the public and private sectors as well as social partners and NGOs know the ‘rules of the game’, and are capable of achieving social consensus on political
issues relatively easily.
Future Challenges
Finland has so far survived the global crisis quite well, but during the summer 2012 clear signs of deterioration of the situation of export industries, the domestic market and
employment have emerged. With a prolonged global and European depression Finland will be facing a tough near future. Finland has also been following with keen interest how
Denmark (one of the ‘examples’ of flexicurity) has fared against the performance of Germany (a model more difficult and complex to pinpoint).
The stagnated and/or worsening global situation is somewhat reflected in a heating of the political and social partner debate over for instance the Framework Agreement of the Fall
2011. The Framework Agreement is presently a basis for wage agreements and some reforms like the agreement on a three day right for training on-the-job (and also occupational
health measures for those over 55 years), combined with tax reductions for companies. The plan is to have a law in effect on this by 1.1.2013. The debate is about to what extent
67
this is a ‘universal’ right or an option. Against the worsening economic situation, the debate is also about whether to raise wages as agreed in the Framework Agreement (as
preferred by Labour Unions), or to use local solutions to the maximum (as preferred by the employers).
With the present National Government (government term 2011 – 2015), there has been a revival of some degree of using the concept of flexicurity. In the recent Government
Decision of 31st May 2012 on ‘Securing the functionality and supply in the labour market’ , it is reinstated that Finnish work policy consists of three goals: (1) Rapid transition from
job-to-job (based on efficient job brokerage, effective LMP and social security based on incentives to take work), (2) Supporting the renewal of economic and working life ( controlled
restructuring, developing working life and balanced legislation in terms of flexicurity), (3) Mobilising the total workforce potential (long-term increase of labour supply, promoting
vocational and geographical mobility, and preventing exclusion from the labour market).
Also, tied to the above, the government has approved in May 2012 a new comprehensive Strategy for Working life Development which aims at improving the employment rate,
quality of working life, well-being at work and productivity of work, and made a Government Decision in May on a new Working Life Policy, which aims at rising the employment rate
to 72% by 2015, reducing average unemployment from 14 to 12 weeks, and making Finland’s working life quality Europe’s best in 2020.
All in all, the future of flexicurity and the development of the Nordic Model will probably be, even with tensions from time to time, ‘business as usual’, contained in the collaborative
culture of Finland. With an improvement of the global and European economy, the recent national Government initiatives on working life development in Finland might spell a revival
of interest in the flexicurity (‘flexicurity 2.0’) concept and innovations. In order to gain real steering effect, real new innovations need to be explored and discovered concerning the
dynamics of flexibility and security, however.

68
10 France
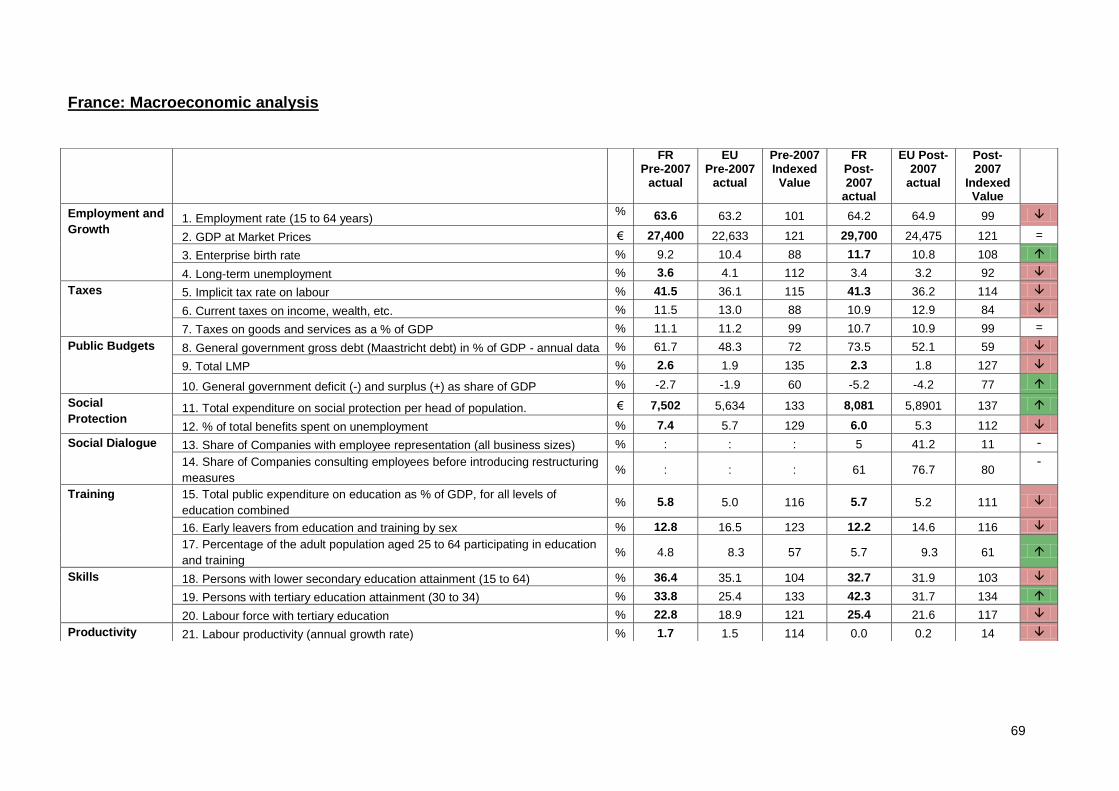
69
France: Macroeconomic analysis
FR Pre-2007
actual
EU Pre-2007
actual
Pre-2007 Indexed Value
FR Post-2007
actual
EU Post-2007
actual
Post-2007
Indexed Value
Employment and
Growth 1. Employment rate (15 to 64 years)
% 63.6 63.2 101 64.2 64.9 99
2. GDP at Market Prices € 27,400 22,633 121 29,700 24,475 121 =
3. Enterprise birth rate % 9.2 10.4 88 11.7 10.8 108
4. Long-term unemployment % 3.6 4.1 112 3.4 3.2 92
Taxes 5. Implicit tax rate on labour % 41.5 36.1 115 41.3 36.2 114
6. Current taxes on income, wealth, etc. % 11.5 13.0 88 10.9 12.9 84
7. Taxes on goods and services as a % of GDP % 11.1 11.2 99 10.7 10.9 99 =
Public Budgets 8. General government gross debt (Maastricht debt) in % of GDP - annual data % 61.7 48.3 72 73.5 52.1 59
9. Total LMP % 2.6 1.9 135 2.3 1.8 127
10. General government deficit (-) and surplus (+) as share of GDP % -2.7 -1.9 60 -5.2 -4.2 77
Social
Protection 11. Total expenditure on social protection per head of population. € 7,502 5,634 133 8,081 5,8901 137
12. % of total benefits spent on unemployment % 7.4 5.7 129 6.0 5.3 112
Social Dialogue 13. Share of Companies with employee representation (all business sizes) % : : : 5 41.2 11 -
14. Share of Companies consulting employees before introducing restructuring
measures % : : : 61 76.7 80
-
Training 15. Total public expenditure on education as % of GDP, for all levels of
education combined % 5.8 5.0 116 5.7 5.2 111
16. Early leavers from education and training by sex % 12.8 16.5 123 12.2 14.6 116
17. Percentage of the adult population aged 25 to 64 participating in education
and training % 4.8 8.3 57 5.7 9.3 61
Skills 18. Persons with lower secondary education attainment (15 to 64) % 36.4 35.1 104 32.7 31.9 103
19. Persons with tertiary education attainment (30 to 34) % 33.8 25.4 133 42.3 31.7 134
20. Labour force with tertiary education % 22.8 18.9 121 25.4 21.6 117
Productivity 21. Labour productivity (annual growth rate) % 1.7 1.5 114 0.0 0.2 14
70
Employment and Growth: GDP per inhabitant when compared to the EU average has remained stagnant in France between the two periods and for both periods, France remained
above the EU average (index of 121). Over the same period the enterprise birth rate has improved from 9.2% to 11.7%, such that by post-2007 the enterprise birth rate was above
average. However, both the employment rate and long term unemployment have seen negative movement from above average pre-2007, to below average post-2007.
Taxes: Implicit tax on labour is consistently above the EU average for both periods, however has moved slightly closer to the index in the post 2007 period (from 115 to 114). Taxation
on goods and services is negligibly below the EU average in both periods, with a rate of 11.1% pre-2007 compared to an 11.2% EU average, and 10.7% post-2007 compared to 10.9%
EU average. Taxation on income and wealth has become slightly less aligned with the index moving 11.5% (compared to 13%) pre-2007, to 10.9% (compared to 12.9% post-2007.
Public Budgets: The government gross debt is worse than the EU average (61.7% and 73.5% from pre to post-2007, compared to 48.3% and 52.1% across Europe) and while the EU
was in deficit in both periods, France is more so. Expenditure on labour market policy has decreased towards the EU27 index between the two periods, but is still above the average in
the post 2007 period with an index of 135 pre-2007 and 127 in the post-2007 period.
Social Protection: Expenditure on social protection has increased in real terms and when considered against the EU from €7,502 to €8,081 (index of 133 to 137 over the two periods).
There has been a decrease in the share of benefits spent on unemployment from 7.4% to 6% over the periods, however when compared to the EU however it remains average.
Social Dialogue: When considered against the OECD countries indexed, there is significantly lower employee representation in France (5% compared to 41.2%). Consultation with
employees prior to restructuring is also below the EU (61% compared to 76.7%).
Training: expenditure on education has decreased in real terms and when considered against the EU27, however it remains above average in the post-2007 period with a share of 5.7%
compared to the EU’s 5.2%. France has less early leavers from education (12.8% pre-2007 and 12.2% post-2007) than the EU average (16.5% pre-2007 and 14.6% post-2007),
however this moved closer to the EU27 in the post-2007 period (from 123 to 116). France has a lower share of 15 to 64 year olds engaged in education and training, however it has
increased slightly between the two periods from 4.8% to 5.7% while the EU average has increased from 8.3% to 9.3%.
Skills: Educational attainment is above average in France, particularly tertiary attainment in the labour force (indexed at 121 pre-2007 and 117 post-2007) and among those aged 30 to
34 (an index of 133 pre-2007 and 134 post-2007).
Productivity: Productivity was above average pre-2007 however has decreased significantly against the EU27 by the post-2007 period from growth of 1.7% to 0.0% growth.
71
Analysis of flexicurity related inputs and policies
Input Indicators
Active labour Market Policy: French expenditure on LMP is higher than the EU27 although there was a slight decrease over the two periods (0.8 to 0.7) compared to no change
across the EU27 (0.5). When the number of participants in LMP measures is considered against the number of people wanting to work, France scores better than the EU27 average
and saw improvement between the pre (38.7) and post-2007 (39.5) periods compared to a decrease in the EU27 (37 to 35).
Contractual Arrangements: Employment Protection Legislation for both standard and temporary workers has remained consistent over the two periods, however when protection
for standard workers is considered there is less protection than across the EU27 more broadly. Conversely, the protection for temporary workers is considerable better in France
than across the EU more broadly.
Lifelong Learning: Expenditure on education as a share of GDP is higher in France than the EU27 with 5.6% of GDP spent on education in the post-2007 compared to 5% across
the EU. There has however been a slight decrease since the pre-2007 period (from 5.8%). Private expenditure has remained consistent across the periods in France (0.6%)
compared to slight increase across the EU27 from 0.6 to 0.7%.
Modern Social Security: Expenditure on passive labour market policy in France is below the EU average although moved closed to the EU27 index in the post 2007 period (from
72 to 87). Expenditure on social protection over the same period increased in both real terms and when compared to the EU27 (114 to 116).
Policy Development
The first phase of the EU flexicurity initiative took place alongside major reforms in France which related to promoting ‘secure working pathways’, as such it is difficult to assess the
impact of the initiative on France’s approach to flexicurity as many ‘flexicurity’ challenges have been high on the policy agenda at a time where it was becoming an increasingly
known concept. As such, even prior to the 2007, flexicurity has been present in national debate and a subject of academic research directly and indirectly (e.g. aligned with the
objective of making professional careers secure).
In 2008 an intersectoral agreement on modernising the labour market was introduced which sought to facilitate hiring, improve career pathways, make contracts more secure and
improve transition back to employment. It was viewed by some as the first illustration of flexicurity “a la francaise’ with a focus on two key elements:
To facilitate hiring and improving career pathways (with respect to contractual arrangements, vocational guidance, labour market entry for young people, continuous training
and skills development, geographical mobility, the anticipation of employment or skill needs at company level);
To make contracts more secure and improve transitions back to employment (with respect to contractual arrangements, access to training of employees and jobseekers,
unemployment benefits and ALMP).
While a first step towards an integrated approach to flexicurity, a balanced and over-arching strategy has not yet been developed. Furthermore, the crisis meant that implementation
of a more overarching strategy for flexicurity became more complicated. Key elements of the French approach introduced through law include:
‘negotiated’ termination of the employment contract based on mutual agreement between the employer and the employee (rather than layoff or resignation, applicable to all
open-ended employment contracts); new type of fixed-term contract for a specific purpose i.e. once a task is completed, employment is terminated (law n° 2008-596
modernisation of the labour market);
individual right to benefit from vocational guidance is recognised and pre-existing individual right to training is reinforced; new intersectoral training fund for making career paths
secure; Improved access to “alternance” training (combination of work-based learning and theoretical training);; improved access to training for jobseekers (law n° 2009-1437
lifelong learning and guidance);
a single body to be in charge of both placement and compensation (law n° 2008-126 reform of public employment)
strengthened focus on individualised support through plans tailored to the person and the definition of a reasonable job offer (law n° 2008-758 rights and duties of jobseekers)
reform of the benefit system for the unemployed (2009) expanded support in favour of young people and jobseekers who had short-term contracts; new benefit called active

72
solidarity income which could be combined with income from work and therefore aims to encourage professional activity.
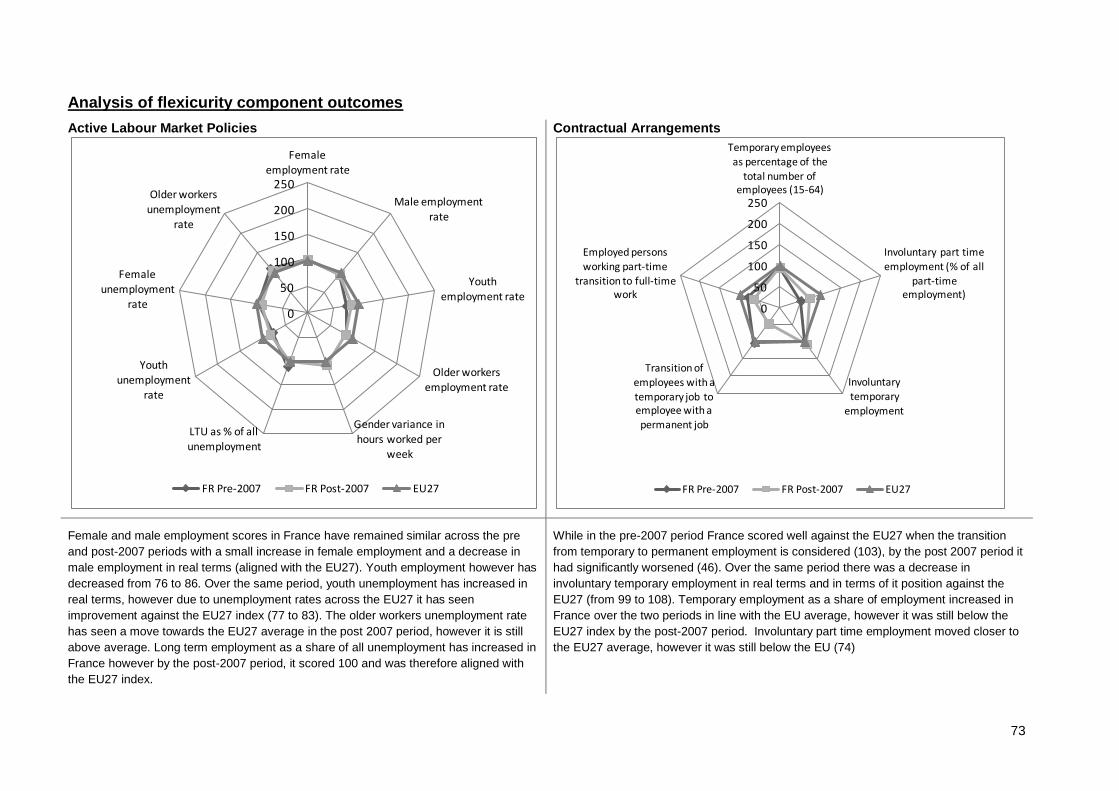
73
Analysis of flexicurity component outcomes
Active Labour Market Policies
Contractual Arrangements
Female and male employment scores in France have remained similar across the pre
and post-2007 periods with a small increase in female employment and a decrease in
male employment in real terms (aligned with the EU27). Youth employment however has
decreased from 76 to 86. Over the same period, youth unemployment has increased in
real terms, however due to unemployment rates across the EU27 it has seen
improvement against the EU27 index (77 to 83). The older workers unemployment rate
has seen a move towards the EU27 average in the post 2007 period, however it is still
above average. Long term employment as a share of all unemployment has increased in
France however by the post-2007 period, it scored 100 and was therefore aligned with
the EU27 index.
While in the pre-2007 period France scored well against the EU27 when the transition
from temporary to permanent employment is considered (103), by the post 2007 period it
had significantly worsened (46). Over the same period there was a decrease in
involuntary temporary employment in real terms and in terms of it position against the
EU27 (from 99 to 108). Temporary employment as a share of employment increased in
France over the two periods in line with the EU average, however it was still below the
EU27 index by the post-2007 period. Involuntary part time employment moved closer to
the EU27 average, however it was still below the EU (74)
0
50
100
150
200
250
Female employment rate
Male employment rate
Youth
employment rate
Older workers employment rate
Gender variance in
hours worked per week
LTU as % of all unemployment
Youth unemployment
rate
Female unemployment
rate
Older workers
unemployment rate
FR Pre-2007 FR Post-2007 EU27
0
50
100
150
200
250
Temporary employees as percentage of the
total number of employees (15-64)
Involuntary part time employment (% of all
part-time employment)
Involuntary temporary
employment
Transition of employees with a
temporary job to employee with a permanent job
Employed persons working part-time
transition to full-time work
FR Pre-2007 FR Post-2007 EU27
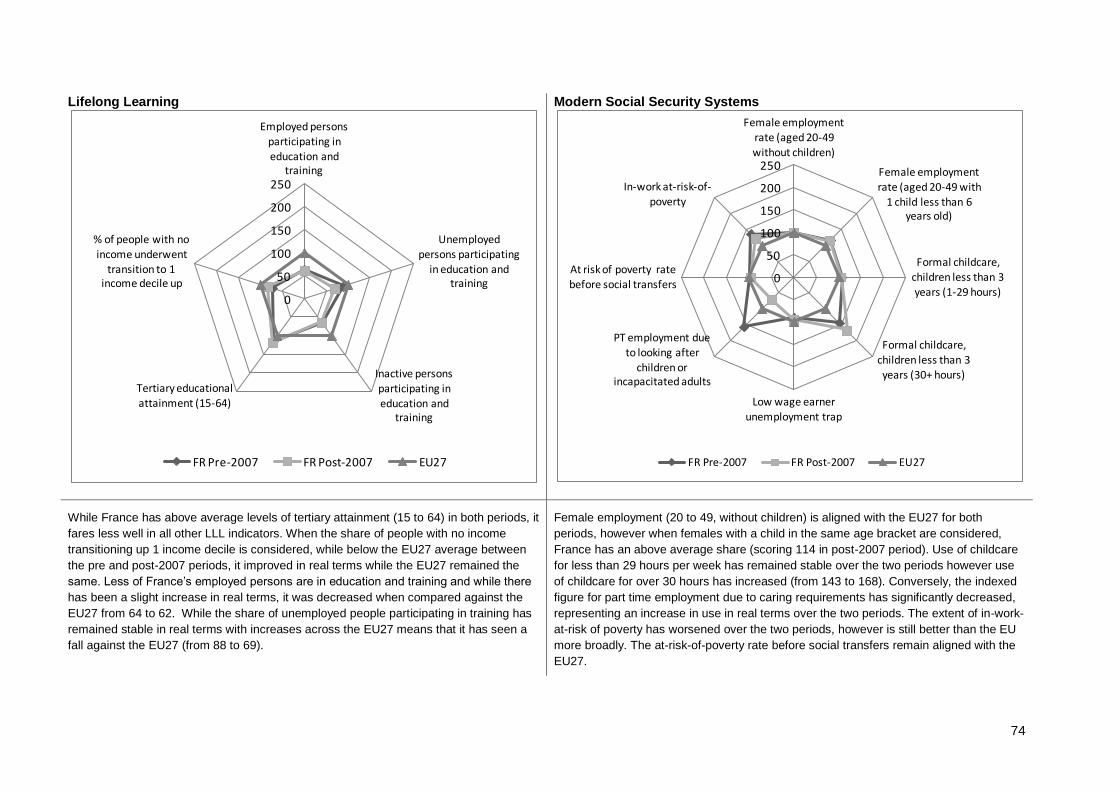
74
Lifelong Learning
Modern Social Security Systems
While France has above average levels of tertiary attainment (15 to 64) in both periods, it
fares less well in all other LLL indicators. When the share of people with no income
transitioning up 1 income decile is considered, while below the EU27 average between
the pre and post-2007 periods, it improved in real terms while the EU27 remained the
same. Less of France’s employed persons are in education and training and while there
has been a slight increase in real terms, it was decreased when compared against the
EU27 from 64 to 62. While the share of unemployed people participating in training has
remained stable in real terms with increases across the EU27 means that it has seen a
fall against the EU27 (from 88 to 69).
Female employment (20 to 49, without children) is aligned with the EU27 for both
periods, however when females with a child in the same age bracket are considered,
France has an above average share (scoring 114 in post-2007 period). Use of childcare
for less than 29 hours per week has remained stable over the two periods however use
of childcare for over 30 hours has increased (from 143 to 168). Conversely, the indexed
figure for part time employment due to caring requirements has significantly decreased,
representing an increase in use in real terms over the two periods. The extent of in-work-
at-risk of poverty has worsened over the two periods, however is still better than the EU
more broadly. The at-risk-of-poverty rate before social transfers remain aligned with the
EU27.
0
50
100
150
200
250
Employed persons participating in education and
training
Unemployed persons participating
in education and training
Inactive persons participating in education and
training
Tertiary educational
attainment (15-64)
% of people with no income underwent
transition to 1 income decile up
FR Pre-2007 FR Post-2007 EU27
0
50
100
150
200
250
Female employment rate (aged 20-49
without children)
Female employment rate (aged 20-49 with
1 child less than 6 years old)
Formal childcare, children less than 3
years (1-29 hours)
Formal childcare,
children less than 3 years (30+ hours)
Low wage earner unemployment trap
PT employment due to looking after
children or incapacitated adults
At risk of poverty rate
before social transfers
In-work at-risk-of-poverty
FR Pre-2007 FR Post-2007 EU27
75
Summary: Flexicurity Policy 2007-2010
As the first phase of the EU flexicurity initiative coincided with a period of intense reforms in France, it is difficult to assess the exact influence of the EU common principles of
flexicurity on changes in the French labour market. Debates relating to flexicurity have increased since 2007 however these are more likely to be due to internal factors, including an
intense period of reform, than due to the EU focus on flexicurity. There is evidence of moves by government to address flexicurity issues such as through policy focused on making
professional careers more secure, more explicitly this focus has been on addressing labour market segmentation, improvement of Public Employment Services, reforming vocational
training and ensuring that training rights/social security benefits are attached to individuals rather than specific posts. Although such recent changes illustrate a move towards a more
overarching flexicurity strategy, e.g. through acknowledgement of the role of social dialogue and collective bargaining and a rebalancing of priorities with less emphasis on
contractual issues and increased focus upon ALMP and LLL, a fully integrated flexicurity model does not yet exist in France.
There is a perception of insecurity in the labour market in France due to persistently high unemployment rates disproportionately affection young people, segmentation between
employment contracts (an an increase in focus on fixed-term contracts and temporary work), the lack of an approach based on lifecycle transitions and persistence of labour market
discrimination. At the macro-level, expenditure on social protection increased between the pre and post-2007 periods however despite an increase in the unemployment rate, the
share of benefits spent on unemployment has decreased against the EU27. Educational attainment is consistently above the EU27 however training among the 25 to 64 population
is considerably worse. Despite the development of the intersectoral agreement on modernising the labour market of 2008 and the 2009 law on lifelong learning and guidance, which
acknowledged the need to improve career pathways, including continuous training and skills development, there is no evidence of this at present when considering the data. In fact,
lifelong learning indicators suggest that in the post-2007 period participation in education and training among employed, unemployed and inactive persons was still much below the
EU27 index.
Future Challenges
Difficulties exist in France in the adoption of a comprehensive ‘flexicurity approach’ due to the ‘silo approach’ in policy making (i.e. different areas still often treated in a
isolated way),, and perhaps as well due to the focus on the needs of larger companies over those of smaller companies and their employees, despite the
concentration of employment in SMEs in France. Although the level of involvement of social partners is strong in France (an act of Parliament on 31 January 2007 on
the modernisation of social dialogue created an obligation for the State to consult social partners on all reforms of labour law), the effective participation of social
partners to the governance of the flexicurity model could be improved. A major challenge in France is also the development of the lifelong learning pillar of flexicurity,
as recent reforms have not succeeded so far in making lifelong learning a reality for all.

76
11 Germany
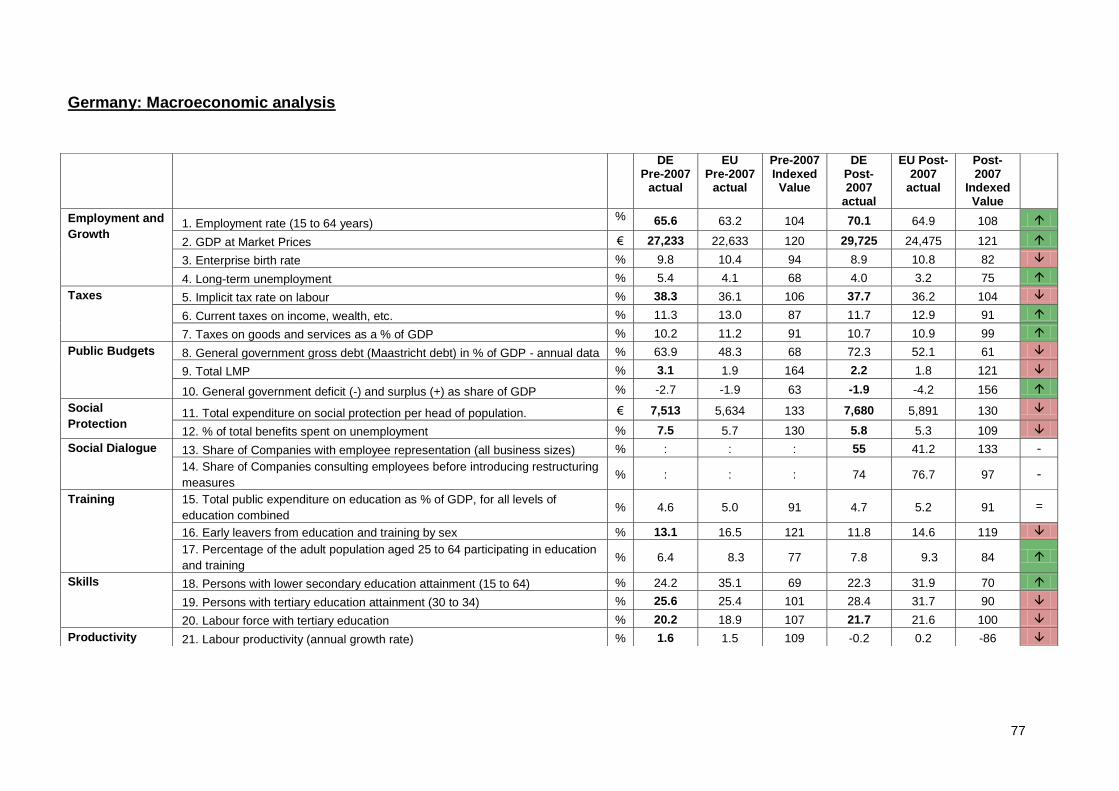
77
Germany: Macroeconomic analysis
DE Pre-2007
actual
EU Pre-2007
actual
Pre-2007 Indexed Value
DE Post-2007
actual
EU Post-2007
actual
Post-2007
Indexed Value
Employment and
Growth 1. Employment rate (15 to 64 years)
% 65.6 63.2 104 70.1 64.9 108
2. GDP at Market Prices € 27,233 22,633 120 29,725 24,475 121
3. Enterprise birth rate % 9.8 10.4 94 8.9 10.8 82
4. Long-term unemployment % 5.4 4.1 68 4.0 3.2 75
Taxes 5. Implicit tax rate on labour % 38.3 36.1 106 37.7 36.2 104
6. Current taxes on income, wealth, etc. % 11.3 13.0 87 11.7 12.9 91
7. Taxes on goods and services as a % of GDP % 10.2 11.2 91 10.7 10.9 99
Public Budgets 8. General government gross debt (Maastricht debt) in % of GDP - annual data % 63.9 48.3 68 72.3 52.1 61
9. Total LMP % 3.1 1.9 164 2.2 1.8 121
10. General government deficit (-) and surplus (+) as share of GDP % -2.7 -1.9 63 -1.9 -4.2 156
Social
Protection 11. Total expenditure on social protection per head of population. € 7,513 5,634 133 7,680 5,891 130
12. % of total benefits spent on unemployment % 7.5 5.7 130 5.8 5.3 109
Social Dialogue 13. Share of Companies with employee representation (all business sizes) % : : : 55 41.2 133 -
14. Share of Companies consulting employees before introducing restructuring
measures % : : : 74 76.7 97 -
Training 15. Total public expenditure on education as % of GDP, for all levels of
education combined % 4.6 5.0 91 4.7 5.2 91 =
16. Early leavers from education and training by sex % 13.1 16.5 121 11.8 14.6 119
17. Percentage of the adult population aged 25 to 64 participating in education
and training % 6.4 8.3 77 7.8 9.3 84
Skills 18. Persons with lower secondary education attainment (15 to 64) % 24.2 35.1 69 22.3 31.9 70
19. Persons with tertiary education attainment (30 to 34) % 25.6 25.4 101 28.4 31.7 90
20. Labour force with tertiary education % 20.2 18.9 107 21.7 21.6 100
Productivity 21. Labour productivity (annual growth rate) % 1.6 1.5 109 -0.2 0.2 -86
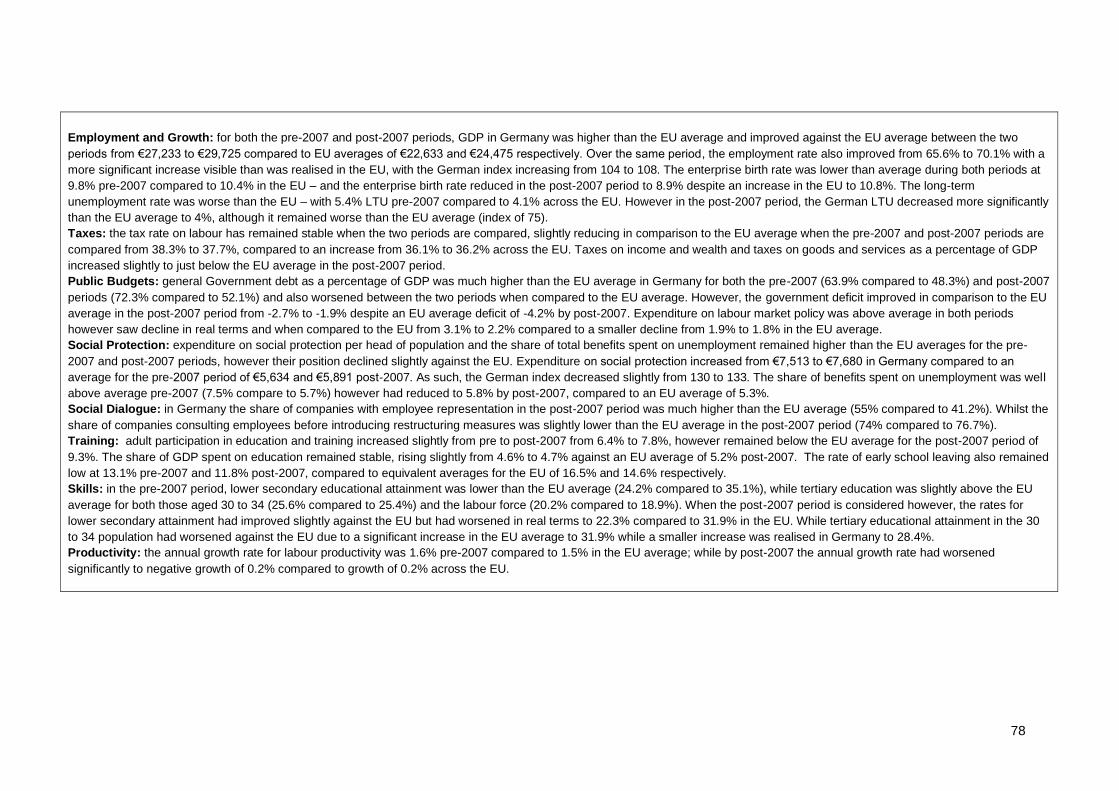
78
Employment and Growth: for both the pre-2007 and post-2007 periods, GDP in Germany was higher than the EU average and improved against the EU average between the two
periods from €27,233 to €29,725 compared to EU averages of €22,633 and €24,475 respectively. Over the same period, the employment rate also improved from 65.6% to 70.1% with a
more significant increase visible than was realised in the EU, with the German index increasing from 104 to 108. The enterprise birth rate was lower than average during both periods at
9.8% pre-2007 compared to 10.4% in the EU – and the enterprise birth rate reduced in the post-2007 period to 8.9% despite an increase in the EU to 10.8%. The long-term
unemployment rate was worse than the EU – with 5.4% LTU pre-2007 compared to 4.1% across the EU. However in the post-2007 period, the German LTU decreased more significantly
than the EU average to 4%, although it remained worse than the EU average (index of 75).
Taxes: the tax rate on labour has remained stable when the two periods are compared, slightly reducing in comparison to the EU average when the pre-2007 and post-2007 periods are
compared from 38.3% to 37.7%, compared to an increase from 36.1% to 36.2% across the EU. Taxes on income and wealth and taxes on goods and services as a percentage of GDP
increased slightly to just below the EU average in the post-2007 period.
Public Budgets: general Government debt as a percentage of GDP was much higher than the EU average in Germany for both the pre-2007 (63.9% compared to 48.3%) and post-2007
periods (72.3% compared to 52.1%) and also worsened between the two periods when compared to the EU average. However, the government deficit improved in comparison to the EU
average in the post-2007 period from -2.7% to -1.9% despite an EU average deficit of -4.2% by post-2007. Expenditure on labour market policy was above average in both periods
however saw decline in real terms and when compared to the EU from 3.1% to 2.2% compared to a smaller decline from 1.9% to 1.8% in the EU average.
Social Protection: expenditure on social protection per head of population and the share of total benefits spent on unemployment remained higher than the EU averages for the pre-
2007 and post-2007 periods, however their position declined slightly against the EU. Expenditure on social protection increased from €7,513 to €7,680 in Germany compared to an
average for the pre-2007 period of €5,634 and €5,891 post-2007. As such, the German index decreased slightly from 130 to 133. The share of benefits spent on unemployment was well
above average pre-2007 (7.5% compare to 5.7%) however had reduced to 5.8% by post-2007, compared to an EU average of 5.3%.
Social Dialogue: in Germany the share of companies with employee representation in the post-2007 period was much higher than the EU average (55% compared to 41.2%). Whilst the
share of companies consulting employees before introducing restructuring measures was slightly lower than the EU average in the post-2007 period (74% compared to 76.7%).
Training: adult participation in education and training increased slightly from pre to post-2007 from 6.4% to 7.8%, however remained below the EU average for the post-2007 period of
9.3%. The share of GDP spent on education remained stable, rising slightly from 4.6% to 4.7% against an EU average of 5.2% post-2007. The rate of early school leaving also remained
low at 13.1% pre-2007 and 11.8% post-2007, compared to equivalent averages for the EU of 16.5% and 14.6% respectively.
Skills: in the pre-2007 period, lower secondary educational attainment was lower than the EU average (24.2% compared to 35.1%), while tertiary education was slightly above the EU
average for both those aged 30 to 34 (25.6% compared to 25.4%) and the labour force (20.2% compared to 18.9%). When the post-2007 period is considered however, the rates for
lower secondary attainment had improved slightly against the EU but had worsened in real terms to 22.3% compared to 31.9% in the EU. While tertiary educational attainment in the 30
to 34 population had worsened against the EU due to a significant increase in the EU average to 31.9% while a smaller increase was realised in Germany to 28.4%.
Productivity: the annual growth rate for labour productivity was 1.6% pre-2007 compared to 1.5% in the EU average; while by post-2007 the annual growth rate had worsened
significantly to negative growth of 0.2% compared to growth of 0.2% across the EU.
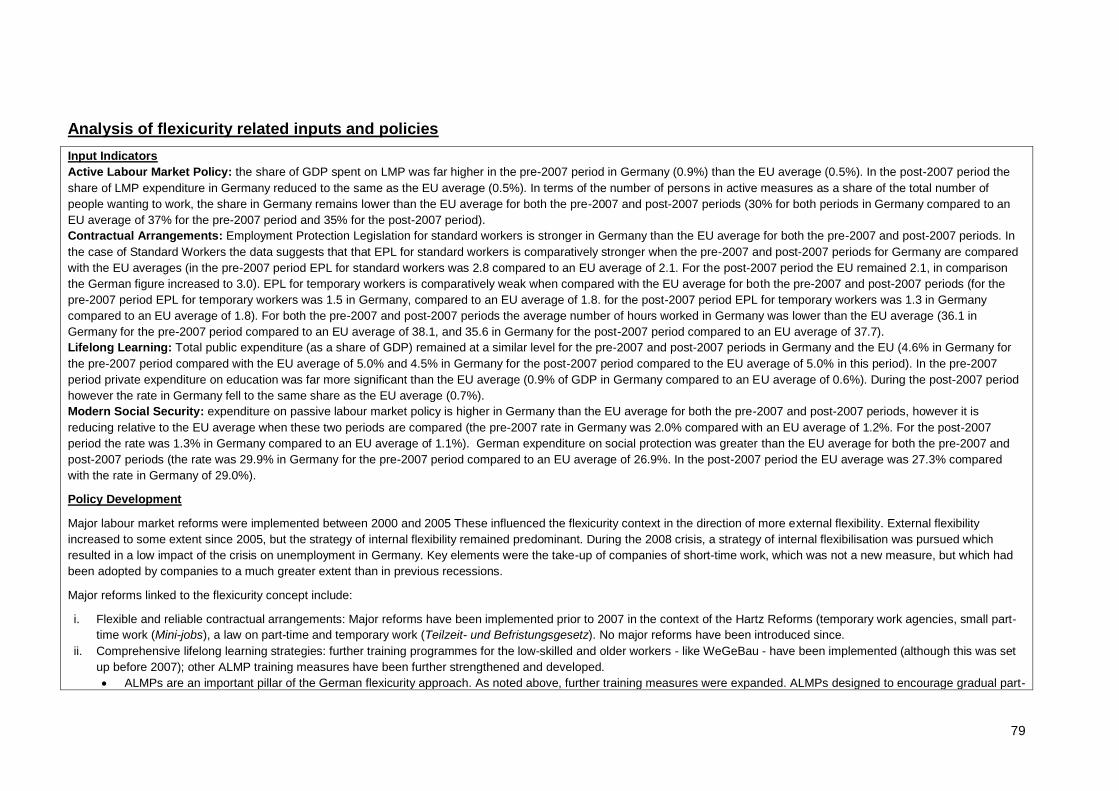
79
Analysis of flexicurity related inputs and policies
Input Indicators
Active Labour Market Policy: the share of GDP spent on LMP was far higher in the pre-2007 period in Germany (0.9%) than the EU average (0.5%). In the post-2007 period the
share of LMP expenditure in Germany reduced to the same as the EU average (0.5%). In terms of the number of persons in active measures as a share of the total number of
people wanting to work, the share in Germany remains lower than the EU average for both the pre-2007 and post-2007 periods (30% for both periods in Germany compared to an
EU average of 37% for the pre-2007 period and 35% for the post-2007 period).
Contractual Arrangements: Employment Protection Legislation for standard workers is stronger in Germany than the EU average for both the pre-2007 and post-2007 periods. In
the case of Standard Workers the data suggests that that EPL for standard workers is comparatively stronger when the pre-2007 and post-2007 periods for Germany are compared
with the EU averages (in the pre-2007 period EPL for standard workers was 2.8 compared to an EU average of 2.1. For the post-2007 period the EU remained 2.1, in comparison
the German figure increased to 3.0). EPL for temporary workers is comparatively weak when compared with the EU average for both the pre-2007 and post-2007 periods (for the
pre-2007 period EPL for temporary workers was 1.5 in Germany, compared to an EU average of 1.8. for the post-2007 period EPL for temporary workers was 1.3 in Germany
compared to an EU average of 1.8). For both the pre-2007 and post-2007 periods the average number of hours worked in Germany was lower than the EU average (36.1 in
Germany for the pre-2007 period compared to an EU average of 38.1, and 35.6 in Germany for the post-2007 period compared to an EU average of 37.7).
Lifelong Learning: Total public expenditure (as a share of GDP) remained at a similar level for the pre-2007 and post-2007 periods in Germany and the EU (4.6% in Germany for
the pre-2007 period compared with the EU average of 5.0% and 4.5% in Germany for the post-2007 period compared to the EU average of 5.0% in this period). In the pre-2007
period private expenditure on education was far more significant than the EU average (0.9% of GDP in Germany compared to an EU average of 0.6%). During the post-2007 period
however the rate in Germany fell to the same share as the EU average (0.7%).
Modern Social Security: expenditure on passive labour market policy is higher in Germany than the EU average for both the pre-2007 and post-2007 periods, however it is
reducing relative to the EU average when these two periods are compared (the pre-2007 rate in Germany was 2.0% compared with an EU average of 1.2%. For the post-2007
period the rate was 1.3% in Germany compared to an EU average of 1.1%). German expenditure on social protection was greater than the EU average for both the pre-2007 and
post-2007 periods (the rate was 29.9% in Germany for the pre-2007 period compared to an EU average of 26.9%. In the post-2007 period the EU average was 27.3% compared
with the rate in Germany of 29.0%).
Policy Development
Major labour market reforms were implemented between 2000 and 2005 These influenced the flexicurity context in the direction of more external flexibility. External flexibility
increased to some extent since 2005, but the strategy of internal flexibility remained predominant. During the 2008 crisis, a strategy of internal flexibilisation was pursued which
resulted in a low impact of the crisis on unemployment in Germany. Key elements were the take-up of companies of short-time work, which was not a new measure, but which had
been adopted by companies to a much greater extent than in previous recessions.
Major reforms linked to the flexicurity concept include:
i. Flexible and reliable contractual arrangements: Major reforms have been implemented prior to 2007 in the context of the Hartz Reforms (temporary work agencies, small part-
time work (Mini-jobs), a law on part-time and temporary work (Teilzeit- und Befristungsgesetz). No major reforms have been introduced since.
ii. Comprehensive lifelong learning strategies: further training programmes for the low-skilled and older workers - like WeGeBau - have been implemented (although this was set
up before 2007); other ALMP training measures have been further strengthened and developed.
ALMPs are an important pillar of the German flexicurity approach. As noted above, further training measures were expanded. ALMPs designed to encourage gradual part-
80
time or phased retirement (Altersteilzeit) were removed at the end of 2009. ALMPs are increasingly focused on older workers (see details below).
Modern, adequate and sustainable social protection systems: this is probably the area where most reforms have taken place since 2007. These changes are the result of
long standing debates and increasing demographic pressure:
iii. Pension reform “Pensions at the age of 67” (Rente mit 67).
iv. Increases in parental allowance.
v. Establishment of the legal right to child-care for children aged between 1 and 3 years (which has not yet been implemented).
vi. The Hartz reforms shortened entitlement period to the more generous unemployment benefit I (from 32 to 18 months). But in 2008 it was lengthened again from a
maximum of 18 months to a maximum of 24 months for those aged 58 years and older (Bäcker et al. 2011).
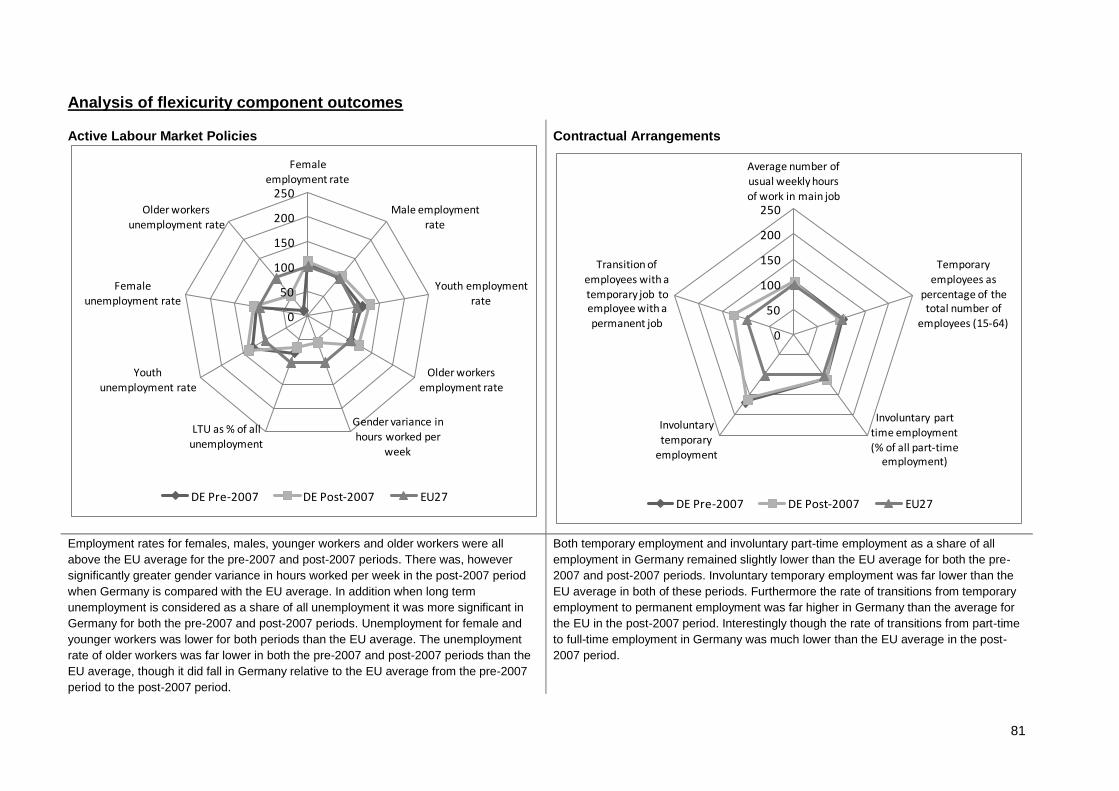
81
Analysis of flexicurity component outcomes
Active Labour Market Policies
Contractual Arrangements
Employment rates for females, males, younger workers and older workers were all
above the EU average for the pre-2007 and post-2007 periods. There was, however
significantly greater gender variance in hours worked per week in the post-2007 period
when Germany is compared with the EU average. In addition when long term
unemployment is considered as a share of all unemployment it was more significant in
Germany for both the pre-2007 and post-2007 periods. Unemployment for female and
younger workers was lower for both periods than the EU average. The unemployment
rate of older workers was far lower in both the pre-2007 and post-2007 periods than the
EU average, though it did fall in Germany relative to the EU average from the pre-2007
period to the post-2007 period.
Both temporary employment and involuntary part-time employment as a share of all
employment in Germany remained slightly lower than the EU average for both the pre-
2007 and post-2007 periods. Involuntary temporary employment was far lower than the
EU average in both of these periods. Furthermore the rate of transitions from temporary
employment to permanent employment was far higher in Germany than the average for
the EU in the post-2007 period. Interestingly though the rate of transitions from part-time
to full-time employment in Germany was much lower than the EU average in the post-
2007 period.
0
50
100
150
200
250
Female employment rate
Male employment
rate
Youth employment rate
Older workers employment rate
Gender variance in
hours worked per week
LTU as % of all unemployment
Youth unemployment rate
Female unemployment rate
Older workers
unemployment rate
DE Pre-2007 DE Post-2007 EU27
0
50
100
150
200
250
Average number of usual weekly hours
of work in main job
Temporary employees as
percentage of the total number of
employees (15-64)
Involuntary part time employment (% of all part-time
employment)
Involuntary temporary
employment
Transition of employees with a
temporary job to employee with a permanent job
DE Pre-2007 DE Post-2007 EU27
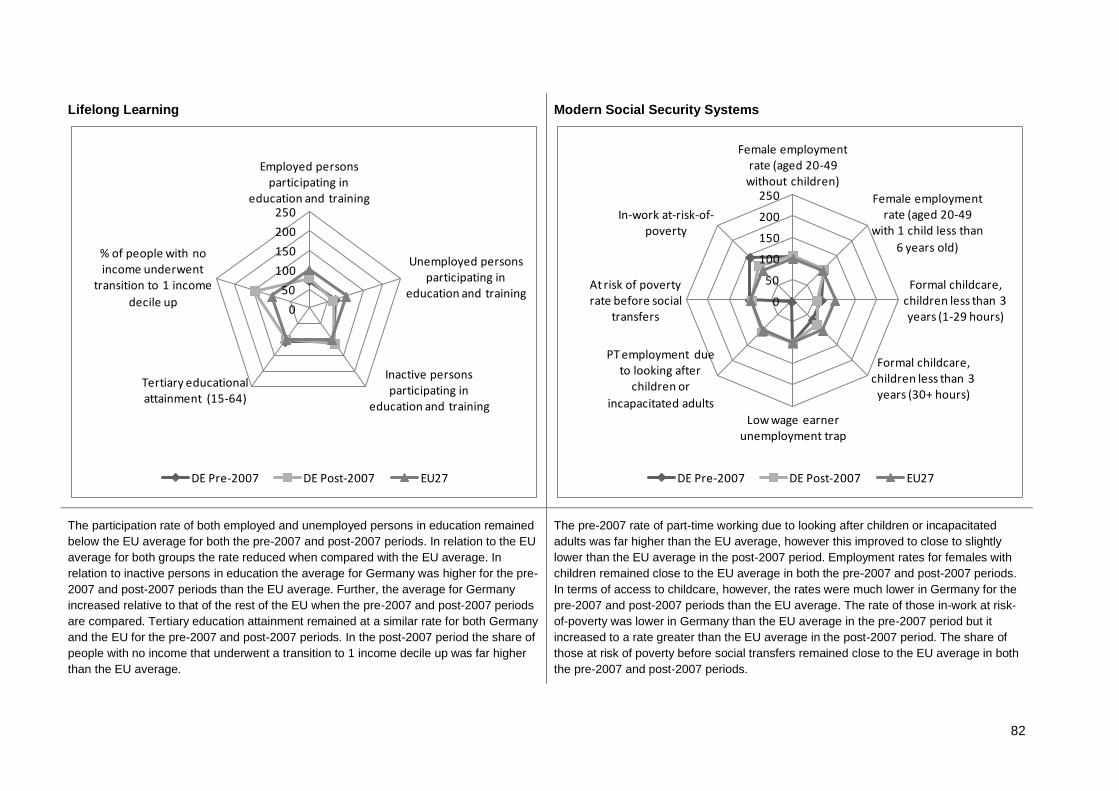
82
Lifelong Learning
Modern Social Security Systems
The participation rate of both employed and unemployed persons in education remained
below the EU average for both the pre-2007 and post-2007 periods. In relation to the EU
average for both groups the rate reduced when compared with the EU average. In
relation to inactive persons in education the average for Germany was higher for the pre-
2007 and post-2007 periods than the EU average. Further, the average for Germany
increased relative to that of the rest of the EU when the pre-2007 and post-2007 periods
are compared. Tertiary education attainment remained at a similar rate for both Germany
and the EU for the pre-2007 and post-2007 periods. In the post-2007 period the share of
people with no income that underwent a transition to 1 income decile up was far higher
than the EU average.
The pre-2007 rate of part-time working due to looking after children or incapacitated
adults was far higher than the EU average, however this improved to close to slightly
lower than the EU average in the post-2007 period. Employment rates for females with
children remained close to the EU average in both the pre-2007 and post-2007 periods.
In terms of access to childcare, however, the rates were much lower in Germany for the
pre-2007 and post-2007 periods than the EU average. The rate of those in-work at risk-
of-poverty was lower in Germany than the EU average in the pre-2007 period but it
increased to a rate greater than the EU average in the post-2007 period. The share of
those at risk of poverty before social transfers remained close to the EU average in both
the pre-2007 and post-2007 periods.
0
50
100
150
200
250
Employed persons participating in
education and training
Unemployed persons participating in
education and training
Inactive persons participating in
education and training
Tertiary educational attainment (15-64)
% of people with no income underwent
transition to 1 income
decile up
DE Pre-2007 DE Post-2007 EU27
0
50
100
150
200
250
Female employment rate (aged 20-49
without children)
Female employment rate (aged 20-49
with 1 child less than
6 years old)
Formal childcare, children less than 3 years (1-29 hours)
Formal childcare, children less than 3
years (30+ hours)
Low wage earner unemployment trap
PT employment due to looking after
children or
incapacitated adults
At risk of poverty rate before social
transfers
In-work at-risk-of-poverty
DE Pre-2007 DE Post-2007 EU27
83
Summary: Flexicurity Policy 2007-2010
The debate on flexicurity at European level and in particular the Danish model of flexicurity received some attention in Germany before the Common Principles were formulated by
the European Commission. A major programme of labour market reforms was introduced between 2000 and 2005. It was against this background that a debate about the need for
more flexible and deregulated labour markets was conducted. Thus, most of the German strategy to flexicurity related issues was decided and implemented prior to 2007. There has
been no significant change in the strategy since 2007.
Concerns about demographic change, more than arguments about flexicurity, appear to have been the driving force for reforms in Germany since 2007. These pressures led to
reforms including a major pension change and the removal of public subsidies to part-time retirement. Further attention was given to age management strategies and new measures
to improve the reconciliation of work and family life and other incentives aiming to increase low fertility rates. Furthermore, demographic pressures have emphasized the need to
better integrate disadvantaged groups into the labour market and realise the full potential of the labour force. The role of social partners in flexicurity related policy discussions has
remained fairly significant and their role in terms of collective bargaining increased in the context of the crisis as internal flexibility was negotiated and implemented by the social
partners.
Internal flexibility was achieved at the time of the crisis through flexible working time schemes, which were introduced by the social partners well before the crisis started. These
actions related to the fact that companies already experienced some skills shortages just prior to the crisis and were particularly interested in keeping their core labour force. Labour
volume was adjusted therefore through working time and not through a reduction in the number of workers.
Future Challenges
As the German economy recovered and since 2010, the challenge of skills shortages has come back onto the political agenda. It is assumed that this will augment in the context of
demographic change.

84
12 Greece
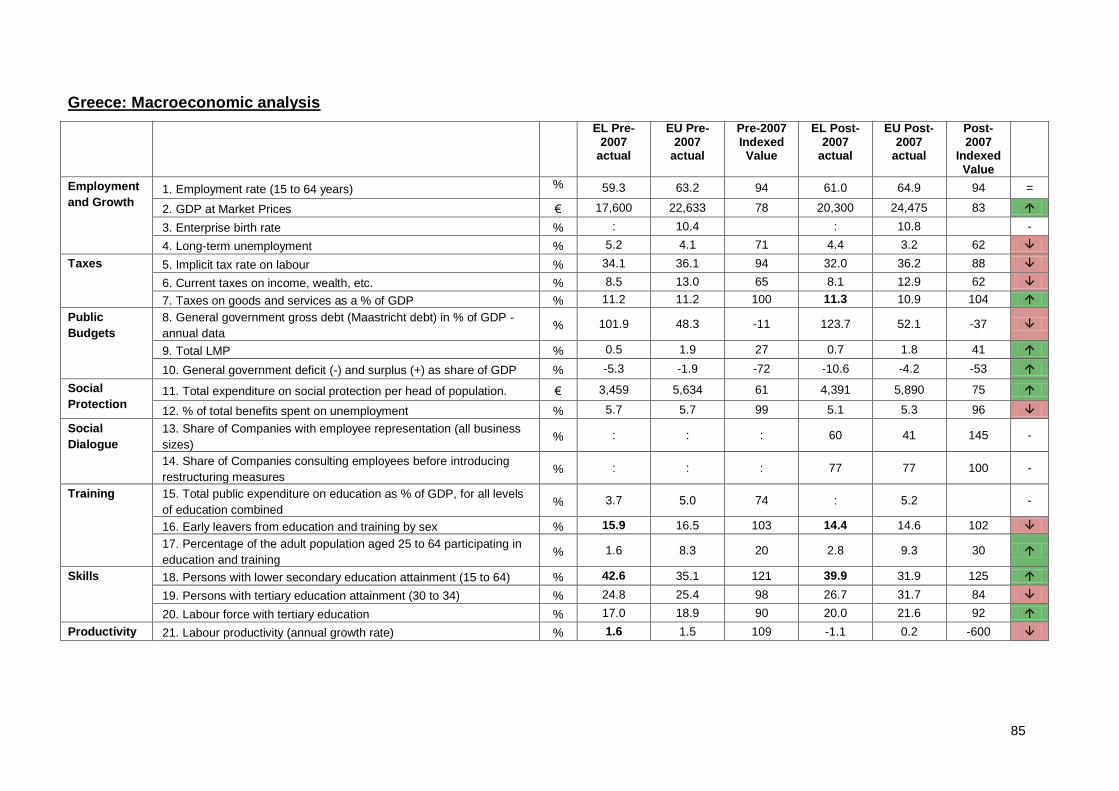
85
Greece: Macroeconomic analysis
EL Pre-2007
actual
EU Pre-2007
actual
Pre-2007 Indexed Value
EL Post-2007
actual
EU Post-2007
actual
Post-2007
Indexed Value
Employment
and Growth 1. Employment rate (15 to 64 years) % 59.3 63.2 94 61.0 64.9 94 =
2. GDP at Market Prices € 17,600 22,633 78 20,300 24,475 83
3. Enterprise birth rate % : 10.4 : 10.8 -
4. Long-term unemployment % 5.2 4.1 71 4.4 3.2 62
Taxes 5. Implicit tax rate on labour % 34.1 36.1 94 32.0 36.2 88
6. Current taxes on income, wealth, etc. % 8.5 13.0 65 8.1 12.9 62
7. Taxes on goods and services as a % of GDP % 11.2 11.2 100 11.3 10.9 104
Public
Budgets
8. General government gross debt (Maastricht debt) in % of GDP -
annual data % 101.9 48.3 -11 123.7 52.1 -37
9. Total LMP % 0.5 1.9 27 0.7 1.8 41
10. General government deficit (-) and surplus (+) as share of GDP % -5.3 -1.9 -72 -10.6 -4.2 -53
Social
Protection 11. Total expenditure on social protection per head of population. € 3,459 5,634 61 4,391 5,890 75
12. % of total benefits spent on unemployment % 5.7 5.7 99 5.1 5.3 96
Social
Dialogue
13. Share of Companies with employee representation (all business
sizes) % : : : 60 41 145 -
14. Share of Companies consulting employees before introducing
restructuring measures % : : : 77 77 100 -
Training 15. Total public expenditure on education as % of GDP, for all levels
of education combined % 3.7 5.0 74 : 5.2 -
16. Early leavers from education and training by sex % 15.9 16.5 103 14.4 14.6 102
17. Percentage of the adult population aged 25 to 64 participating in
education and training % 1.6 8.3 20 2.8 9.3 30
Skills 18. Persons with lower secondary education attainment (15 to 64) % 42.6 35.1 121 39.9 31.9 125
19. Persons with tertiary education attainment (30 to 34) % 24.8 25.4 98 26.7 31.7 84
20. Labour force with tertiary education % 17.0 18.9 90 20.0 21.6 92
Productivity 21. Labour productivity (annual growth rate) % 1.6 1.5 109 -1.1 0.2 -600
86
Employment and Growth: in terms of employment and growth indicators, Greece scores are well below average in both the pre and post- 2007 period. Although the GDP rate for
Greece rose from €17,600 in the pre-2007 period to €20,300, it remained below the EU average for both period (€22,633 in the pre-2007 period and €24,475). Employment rates during
the pre-2007 period in Greece are below the EU average (59.3% compared to 63%). This rate increased slightly for Greece in the post-2007 period (61%), however it still remained the
below the EU average (65%). The rate of long term unemployment is higher in Greece when compared to the EU average, with 5.2% LTU pre-2007 compared to 4.1% across Europe.
While it decreased by the post-2007 period to 4.4%, it was still above the EU average (3.6%). This lead to a decreased index figure from 71 to 62.
Taxes: Taxation on income and wealth is below average for both periods and has decreased against the EU from 65 to 62. Implicit tax rate on labour is below average for both periods,
and has decreased from 34.1% to 32% between the pre and post-2007 periods compared to a smaller increase of 36.1% to 36.2% across the EU. Taxes on goods and services as a
share of GDP for the pre-2007 period are the same in Greece and the EU (11.2% respectively). In Greece this rate increased to 11.3% in the post-2007 period, while on an EU level, the
rate decreased to 10.9%
Public Budgets: When gross government debt is considered as a share of GDP pre-2007, Greece has very high levels of debt - 101.9% compared to 48.3% across the EU. However
this rose considerably to the post-2007 period with a debt of 123.7% compared to 52.1% EU average. Total labour market policy is worse in Greece than the EU with expenditure of 0.5%
of GDP compared to 1.9% across the EU more broadly. This rate increased slightly to 0.7% in the post-2007 period, while the EU average decreased slightly to 1.8%. In terms of the
general government deficit, Greece had a deficit of 5.3, while the EU had a deficit of 1.9 in the pre-2007 period, it dropped significantly by post-2007 with a deficit of 10.6 (Greece)
compared to a deficit of 4.2 across the EU.
Social Protection: Total expenditure on social protection is below average €3,459 (compared to €5,634). Expenditure increased in Greece in the post-2007 period with an average
expenditure of €4,391 compared to an increase to €5,890 across the EU. The share of benefits spent on unemployment in Greece is on the same level as the EU (5.7%) in the pre-2007
period. By the post-2007 period, while the share of benefits spent on unemployment decreased in Greece – so too did expenditure across the EU (5.1% spent in Greece compared to
5.3% in the EU).
Social Dialogue: The share of companies with employee representation in Greece is above average (60 compared to 41 across the EU) and r companies are more likely to consult
employees prior to the introduction of restructuring measures – 77% of companies consult in Greece, which is the same as the EU average (77%)
Training: Public expenditure on education as a share of GDP is below average in Greece during the pre-2007 period – 3.7% compared to 5%. There is no data available for Greece in
the post-2007 period, but the EU average increased to 5.2%.The share of the adult population participating in education and training is significantly lower than the EU average in both
periods – with 1.6% engaged in training pre-2007 compared to 8.3% of people across the EU. While there was an increase in real terms in the post-2007 period to 2.8%, it remains well
below the EU average (9.3%).
Skills: While lower secondary attainment is above average in both periods and has declined over time (from 42.6% to 39.9% compared to an EU average decline from 35.1% to 31.9%),
tertiary education attainment is below average. In the pre-2007 period, 24.8% of 30-34s had tertiary attainment compared to 25.4% in the EU – with a rise to 26.7% in Greece in the post-
2007 period, compared to 31.7% EU average. Similarly, the share of the labour force with tertiary education is below average and has risen in real terms from 17% to 20.7%.
Productivity: the annual growth rate in productivity is just above average pre-2007 at 1.6% compared to 1.5% across the EU. However the average annual growth rate for the post-2007
period in Greece was -1.1 compared to slight growth of 0.2% across the EU.
87
Analysis of flexicurity related inputs and policies
Input Indicators
Active labour Market Policy: expenditure as a share of GDP is far lower in Greece than the EU average (0.2% in the pre-2007 and post-2007 period, compared to an EU average
of 0.5%). Likewise the number of LMP participants engaged in active measure as a share of all unemployed was lower in Greece for both the pre and post-2007 periods when
compared to the EU average (9% in the pre-2007 period in Greece, compared to a 37% EU average; and 7% in Greece for the post-2007 period compared to an EU average of
35%).
Contractual Arrangements: Greece is on par with the EU average when it comes to Employment Protection Legislation for both standard and temporary workers. This position
remained consistent for the pre-2007 and post-2007 periods (an EPL strictness score of 2.3 for Standard Workers, and a score of 3.4 for Temporary Workers, compared to EU
averages of 2.1 for Standard Workers and 1.8 for temporary Workers). The average number of hours worked per week was slightly more than the EU average for the pre-2007
period (43.1 in Greece compared to 38.1 in the EU) and this remained the case for the post-2007 period (42.1 in Greece, compared to 37.7 in the EU).
Lifelong Learning: in Greece total public expenditure on education as a percentage of GDP and private expenditure on education as % of GDP are slightly lower than the EU
average for both the pre and post-2007 periods. Public expenditure on education in Greece is 3.6% for the pre-2007 period and less than 1% in the post-2007 period, the average
for the EU remained at 5.0% for both periods. Private expenditure on education was 0.2% in Greece for the pre-2007 period, and decreased to 0.0% in the post-2007 period. The
average for the EU was 0.6% in the pre-2007 period, compared to 0.7% for the post-2007 period.
Modern Social Security: Expenditure on passive LMP in Greece was lower than the EU average for both the pre and post-2007 periods, the average for the pre-2007 period was
0.38% and the post-2007 period was 0.5%, compared to an EU average of 1.2% in the pre-2007 period and 1.1% in the post-2007 period. Expenditure on social protection in
Greece was slightly lower than the EU average for the pre-2007 and the post-2007 period (for both periods the Greek average was 25% compared to an EU average of 27%).
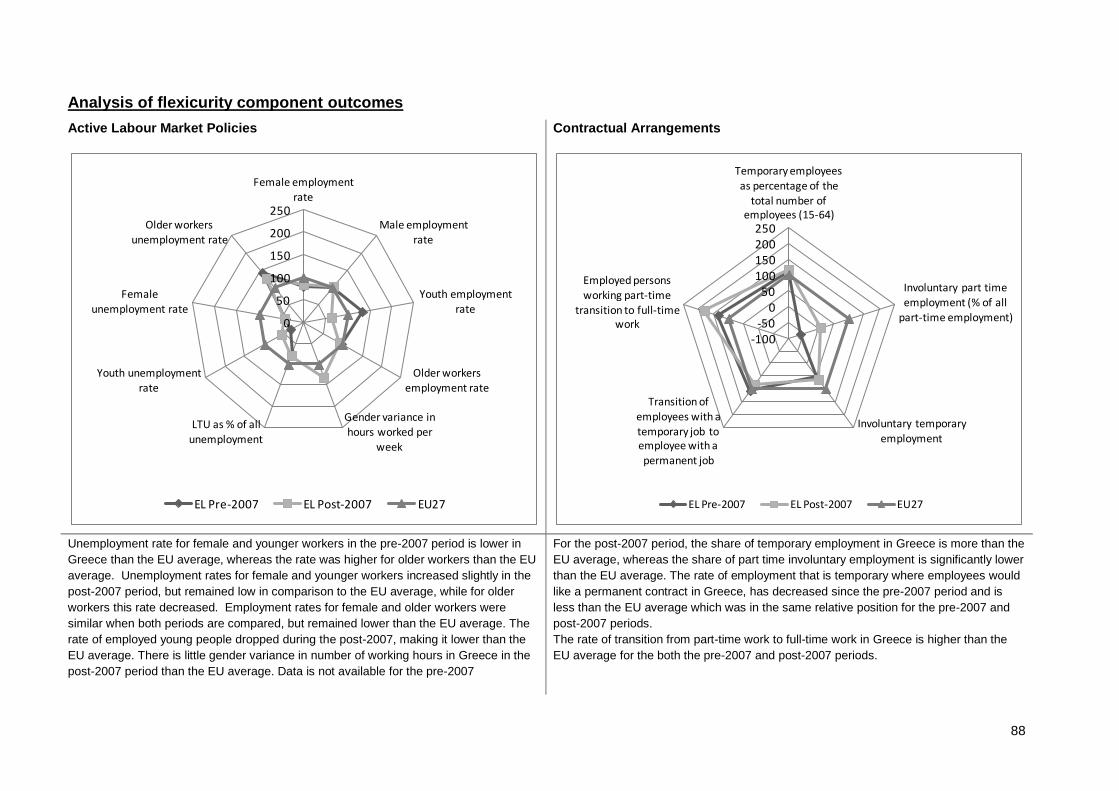
88
Analysis of flexicurity component outcomes
Active Labour Market Policies
Contractual Arrangements
Unemployment rate for female and younger workers in the pre-2007 period is lower in
Greece than the EU average, whereas the rate was higher for older workers than the EU
average. Unemployment rates for female and younger workers increased slightly in the
post-2007 period, but remained low in comparison to the EU average, while for older
workers this rate decreased. Employment rates for female and older workers were
similar when both periods are compared, but remained lower than the EU average. The
rate of employed young people dropped during the post-2007, making it lower than the
EU average. There is little gender variance in number of working hours in Greece in the
post-2007 period than the EU average. Data is not available for the pre-2007
For the post-2007 period, the share of temporary employment in Greece is more than the
EU average, whereas the share of part time involuntary employment is significantly lower
than the EU average. The rate of employment that is temporary where employees would
like a permanent contract in Greece, has decreased since the pre-2007 period and is
less than the EU average which was in the same relative position for the pre-2007 and
post-2007 periods.
The rate of transition from part-time work to full-time work in Greece is higher than the
EU average for the both the pre-2007 and post-2007 periods.
0
50
100
150
200
250
Female employment rate
Male employment rate
Youth employment
rate
Older workers employment rate
Gender variance in hours worked per
week
LTU as % of all unemployment
Youth unemployment rate
Female
unemployment rate
Older workers unemployment rate
EL Pre-2007 EL Post-2007 EU27
-100-50
050
100150200250
Temporary employees
as percentage of the total number of
employees (15-64)
Involuntary part time employment (% of all
part-time employment)
Involuntary temporary
employment
Transition of employees with a temporary job to employee with a permanent job
Employed persons working part-time
transition to full-time work
EL Pre-2007 EL Post-2007 EU27
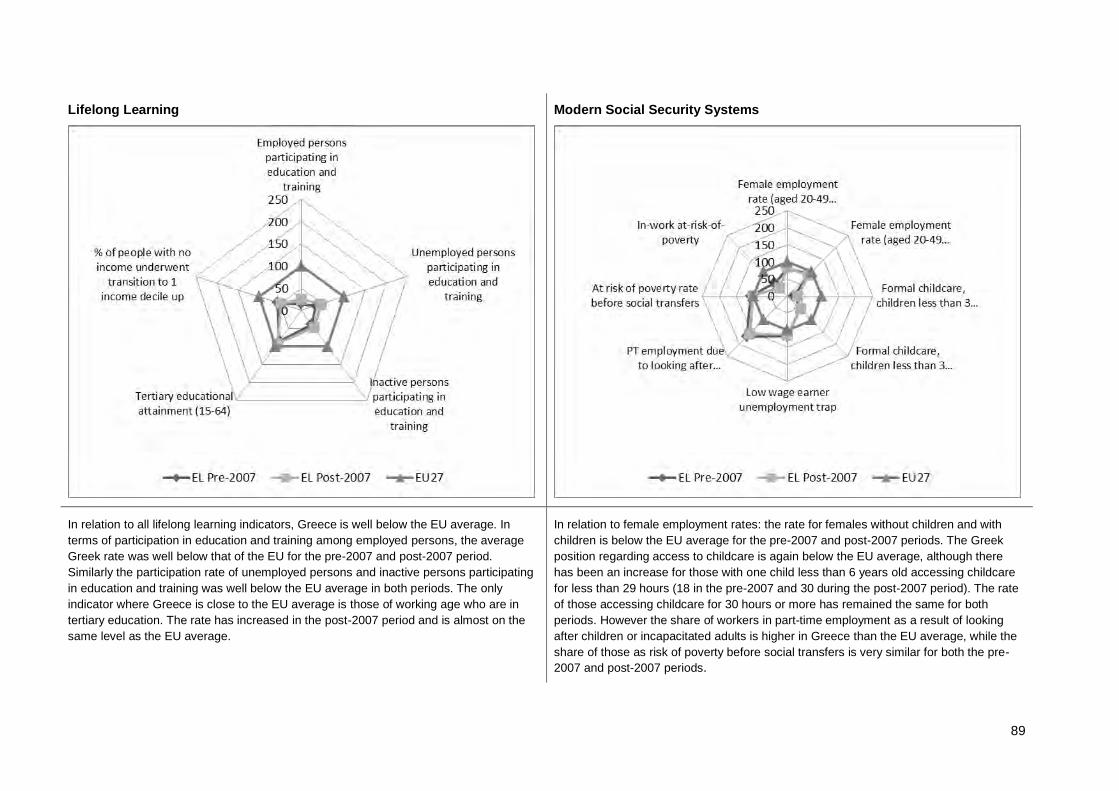
89
Lifelong Learning
Modern Social Security Systems
In relation to all lifelong learning indicators, Greece is well below the EU average. In
terms of participation in education and training among employed persons, the average
Greek rate was well below that of the EU for the pre-2007 and post-2007 period.
Similarly the participation rate of unemployed persons and inactive persons participating
in education and training was well below the EU average in both periods. The only
indicator where Greece is close to the EU average is those of working age who are in
tertiary education. The rate has increased in the post-2007 period and is almost on the
same level as the EU average.
In relation to female employment rates: the rate for females without children and with
children is below the EU average for the pre-2007 and post-2007 periods. The Greek
position regarding access to childcare is again below the EU average, although there
has been an increase for those with one child less than 6 years old accessing childcare
for less than 29 hours (18 in the pre-2007 and 30 during the post-2007 period). The rate
of those accessing childcare for 30 hours or more has remained the same for both
periods. However the share of workers in part-time employment as a result of looking
after children or incapacitated adults is higher in Greece than the EU average, while the
share of those as risk of poverty before social transfers is very similar for both the pre-
2007 and post-2007 periods.
90
Summary: Flexicurity Policy 2007-2010
At the macro-level, Greece performs below average in some areas, such as employment and growth. For example, despite an increase in GDP, the Greek rate remained below the
EU average as did employment rates. Furthermore, the rate of long term unemployment is higher in Greece than across the EU. In relation to taxation on income and wealth – this
was also below average for both periods as did the implicit tax rate of labour. Unsurprisingly, when it came to levels of debt, the Greek rate is extremely high and the total labour
market policy is worse in Greece than the EU. In terms of social protection expenditure and unemployment benefit, less funds were spent on this compared to the rest of the EU.
Greece had very low rates in relation to spending on education; participation rates among adults were also lower in Greece than the rest of the EU. While lower secondary
attainment is above average in both periods, tertiary education attainment is below average
In relation to Active Labour Market Policy, the number of LMP participants engaged in active measure as a share of all unemployed was lower in Greece for both the pre and post-
2007 periods when compared to the EU average. The unemployment rate for female and younger workers in the pre-2007 period is lower in Greece than the EU average, whereas
the rate was higher for older workers than the EU average. Employment rates for female and older workers were similar when both periods are compared, but remained lower than
the EU average. The rate of employed young people dropped during the post-2007, making it lower than the EU average. In terms of contractual arrangements, Greece is on par
with the EU average when it comes to Employment Protection Legislation for both standard and temporary workers. The average number of hours worked per week was slightly
more than the EU average for the pre-2007 period and this remained the case for the post-2007 period.
Spending on education is lower in Greece than the EU and in relation to all lifelong learning indicators Greece performs below the EU average. Regarding modern social security
systems, expenditure on passive LMP in Greece was lower than the EU average. Furthermore, in relation to female employment rates, the rate for female without children and with
children is below the EU average for the pre-2007 and post-2007 periods. Unsurprisingly from this, the Greek position regarding access to childcare is again below the EU average.

91
13 Hungary
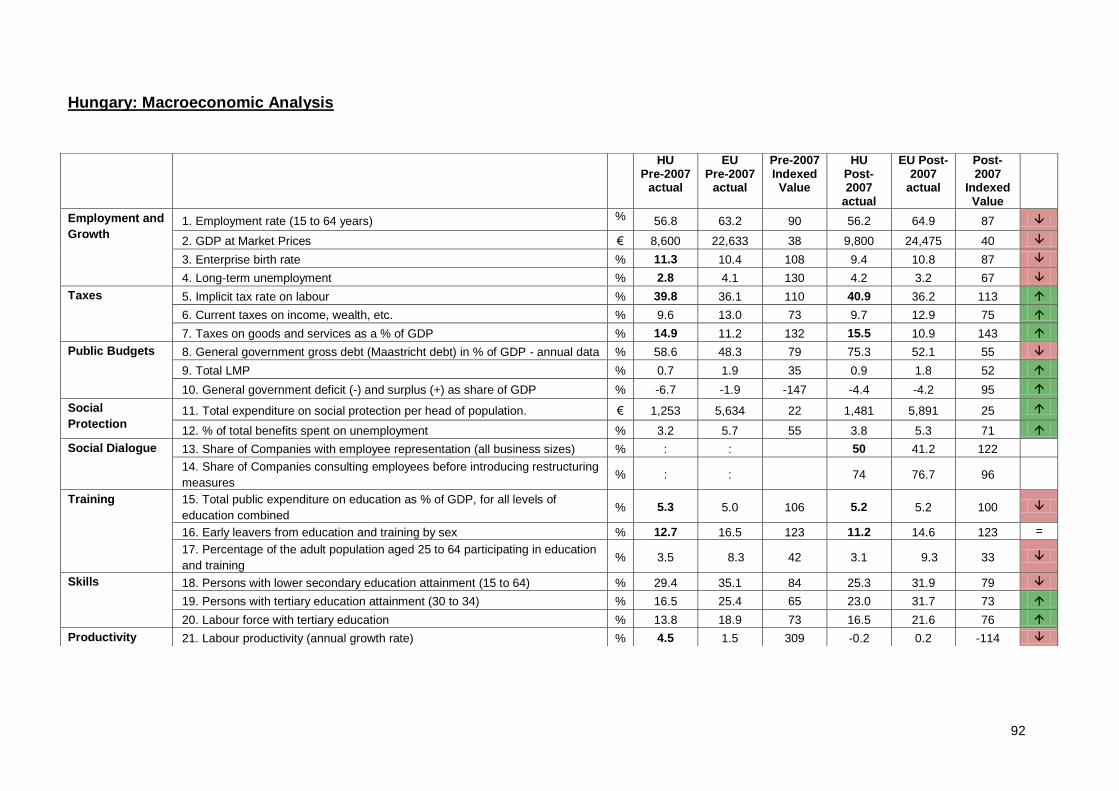
92
Hungary: Macroeconomic Analysis
HU Pre-2007
actual
EU Pre-2007
actual
Pre-2007 Indexed Value
HU Post-2007
actual
EU Post-2007
actual
Post-2007
Indexed Value
Employment and
Growth 1. Employment rate (15 to 64 years) % 56.8 63.2 90 56.2 64.9 87
2. GDP at Market Prices € 8,600 22,633 38 9,800 24,475 40
3. Enterprise birth rate % 11.3 10.4 108 9.4 10.8 87
4. Long-term unemployment % 2.8 4.1 130 4.2 3.2 67
Taxes 5. Implicit tax rate on labour % 39.8 36.1 110 40.9 36.2 113
6. Current taxes on income, wealth, etc. % 9.6 13.0 73 9.7 12.9 75
7. Taxes on goods and services as a % of GDP % 14.9 11.2 132 15.5 10.9 143
Public Budgets 8. General government gross debt (Maastricht debt) in % of GDP - annual data % 58.6 48.3 79 75.3 52.1 55
9. Total LMP % 0.7 1.9 35 0.9 1.8 52
10. General government deficit (-) and surplus (+) as share of GDP % -6.7 -1.9 -147 -4.4 -4.2 95
Social
Protection 11. Total expenditure on social protection per head of population. € 1,253 5,634 22 1,481 5,891 25
12. % of total benefits spent on unemployment % 3.2 5.7 55 3.8 5.3 71
Social Dialogue 13. Share of Companies with employee representation (all business sizes) % : :
50 41.2 122
14. Share of Companies consulting employees before introducing restructuring
measures % : :
74 76.7 96
Training 15. Total public expenditure on education as % of GDP, for all levels of
education combined % 5.3 5.0 106 5.2 5.2 100
16. Early leavers from education and training by sex % 12.7 16.5 123 11.2 14.6 123 =
17. Percentage of the adult population aged 25 to 64 participating in education
and training % 3.5 8.3 42 3.1 9.3 33
Skills 18. Persons with lower secondary education attainment (15 to 64) % 29.4 35.1 84 25.3 31.9 79
19. Persons with tertiary education attainment (30 to 34) % 16.5 25.4 65 23.0 31.7 73
20. Labour force with tertiary education % 13.8 18.9 73 16.5 21.6 76
Productivity 21. Labour productivity (annual growth rate) % 4.5 1.5 309 -0.2 0.2 -114
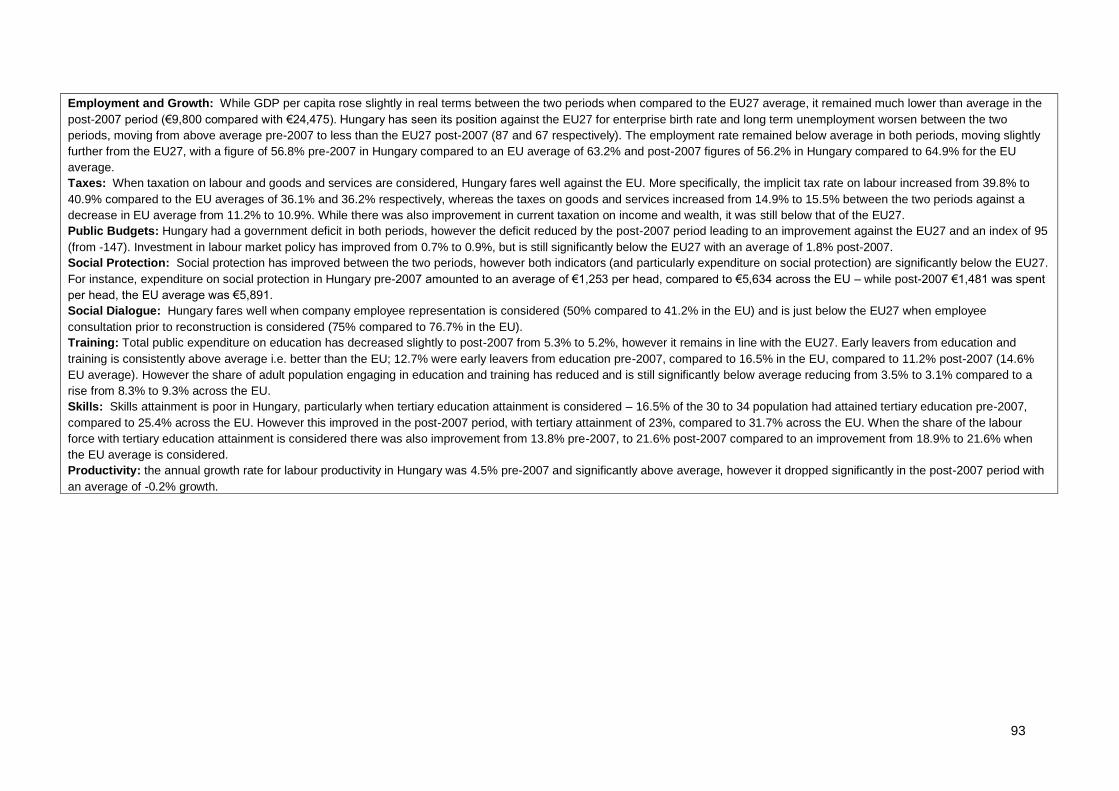
93
Employment and Growth: While GDP per capita rose slightly in real terms between the two periods when compared to the EU27 average, it remained much lower than average in the
post-2007 period (€9,800 compared with €24,475). Hungary has seen its position against the EU27 for enterprise birth rate and long term unemployment worsen between the two
periods, moving from above average pre-2007 to less than the EU27 post-2007 (87 and 67 respectively). The employment rate remained below average in both periods, moving slightly
further from the EU27, with a figure of 56.8% pre-2007 in Hungary compared to an EU average of 63.2% and post-2007 figures of 56.2% in Hungary compared to 64.9% for the EU
average.
Taxes: When taxation on labour and goods and services are considered, Hungary fares well against the EU. More specifically, the implicit tax rate on labour increased from 39.8% to
40.9% compared to the EU averages of 36.1% and 36.2% respectively, whereas the taxes on goods and services increased from 14.9% to 15.5% between the two periods against a
decrease in EU average from 11.2% to 10.9%. While there was also improvement in current taxation on income and wealth, it was still below that of the EU27.
Public Budgets: Hungary had a government deficit in both periods, however the deficit reduced by the post-2007 period leading to an improvement against the EU27 and an index of 95
(from -147). Investment in labour market policy has improved from 0.7% to 0.9%, but is still significantly below the EU27 with an average of 1.8% post-2007.
Social Protection: Social protection has improved between the two periods, however both indicators (and particularly expenditure on social protection) are significantly below the EU27.
For instance, expenditure on social protection in Hungary pre-2007 amounted to an average of €1,253 per head, compared to €5,634 across the EU – while post-2007 €1,481 was spent
per head, the EU average was €5,891.
Social Dialogue: Hungary fares well when company employee representation is considered (50% compared to 41.2% in the EU) and is just below the EU27 when employee
consultation prior to reconstruction is considered (75% compared to 76.7% in the EU).
Training: Total public expenditure on education has decreased slightly to post-2007 from 5.3% to 5.2%, however it remains in line with the EU27. Early leavers from education and
training is consistently above average i.e. better than the EU; 12.7% were early leavers from education pre-2007, compared to 16.5% in the EU, compared to 11.2% post-2007 (14.6%
EU average). However the share of adult population engaging in education and training has reduced and is still significantly below average reducing from 3.5% to 3.1% compared to a
rise from 8.3% to 9.3% across the EU.
Skills: Skills attainment is poor in Hungary, particularly when tertiary education attainment is considered – 16.5% of the 30 to 34 population had attained tertiary education pre-2007,
compared to 25.4% across the EU. However this improved in the post-2007 period, with tertiary attainment of 23%, compared to 31.7% across the EU. When the share of the labour
force with tertiary education attainment is considered there was also improvement from 13.8% pre-2007, to 21.6% post-2007 compared to an improvement from 18.9% to 21.6% when
the EU average is considered.
Productivity: the annual growth rate for labour productivity in Hungary was 4.5% pre-2007 and significantly above average, however it dropped significantly in the post-2007 period with
an average of -0.2% growth.
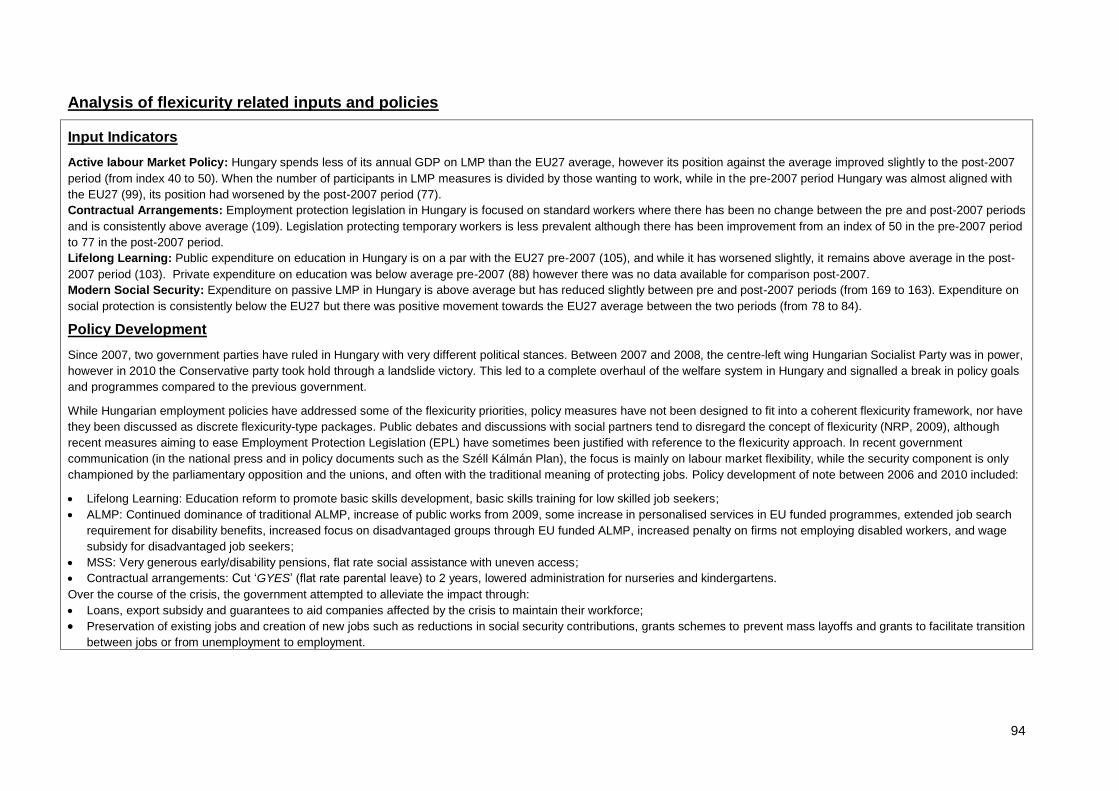
94
Analysis of flexicurity related inputs and policies
Input Indicators
Active labour Market Policy: Hungary spends less of its annual GDP on LMP than the EU27 average, however its position against the average improved slightly to the post-2007
period (from index 40 to 50). When the number of participants in LMP measures is divided by those wanting to work, while in the pre-2007 period Hungary was almost aligned with
the EU27 (99), its position had worsened by the post-2007 period (77).
Contractual Arrangements: Employment protection legislation in Hungary is focused on standard workers where there has been no change between the pre and post-2007 periods
and is consistently above average (109). Legislation protecting temporary workers is less prevalent although there has been improvement from an index of 50 in the pre-2007 period
to 77 in the post-2007 period.
Lifelong Learning: Public expenditure on education in Hungary is on a par with the EU27 pre-2007 (105), and while it has worsened slightly, it remains above average in the post-
2007 period (103). Private expenditure on education was below average pre-2007 (88) however there was no data available for comparison post-2007.
Modern Social Security: Expenditure on passive LMP in Hungary is above average but has reduced slightly between pre and post-2007 periods (from 169 to 163). Expenditure on
social protection is consistently below the EU27 but there was positive movement towards the EU27 average between the two periods (from 78 to 84).
Policy Development
Since 2007, two government parties have ruled in Hungary with very different political stances. Between 2007 and 2008, the centre-left wing Hungarian Socialist Party was in power,
however in 2010 the Conservative party took hold through a landslide victory. This led to a complete overhaul of the welfare system in Hungary and signalled a break in policy goals
and programmes compared to the previous government.
While Hungarian employment policies have addressed some of the flexicurity priorities, policy measures have not been designed to fit into a coherent flexicurity framework, nor have
they been discussed as discrete flexicurity-type packages. Public debates and discussions with social partners tend to disregard the concept of flexicurity (NRP, 2009), although
recent measures aiming to ease Employment Protection Legislation (EPL) have sometimes been justified with reference to the flexicurity approach. In recent government
communication (in the national press and in policy documents such as the Széll Kálmán Plan), the focus is mainly on labour market flexibility, while the security component is only
championed by the parliamentary opposition and the unions, and often with the traditional meaning of protecting jobs. Policy development of note between 2006 and 2010 included:
Lifelong Learning: Education reform to promote basic skills development, basic skills training for low skilled job seekers;
ALMP: Continued dominance of traditional ALMP, increase of public works from 2009, some increase in personalised services in EU funded programmes, extended job search
requirement for disability benefits, increased focus on disadvantaged groups through EU funded ALMP, increased penalty on firms not employing disabled workers, and wage
subsidy for disadvantaged job seekers;
MSS: Very generous early/disability pensions, flat rate social assistance with uneven access;
Contractual arrangements: Cut ‘GYES’ (flat rate parental leave) to 2 years, lowered administration for nurseries and kindergartens.
Over the course of the crisis, the government attempted to alleviate the impact through:
Loans, export subsidy and guarantees to aid companies affected by the crisis to maintain their workforce;
Preservation of existing jobs and creation of new jobs such as reductions in social security contributions, grants schemes to prevent mass layoffs and grants to facilitate transition
between jobs or from unemployment to employment.
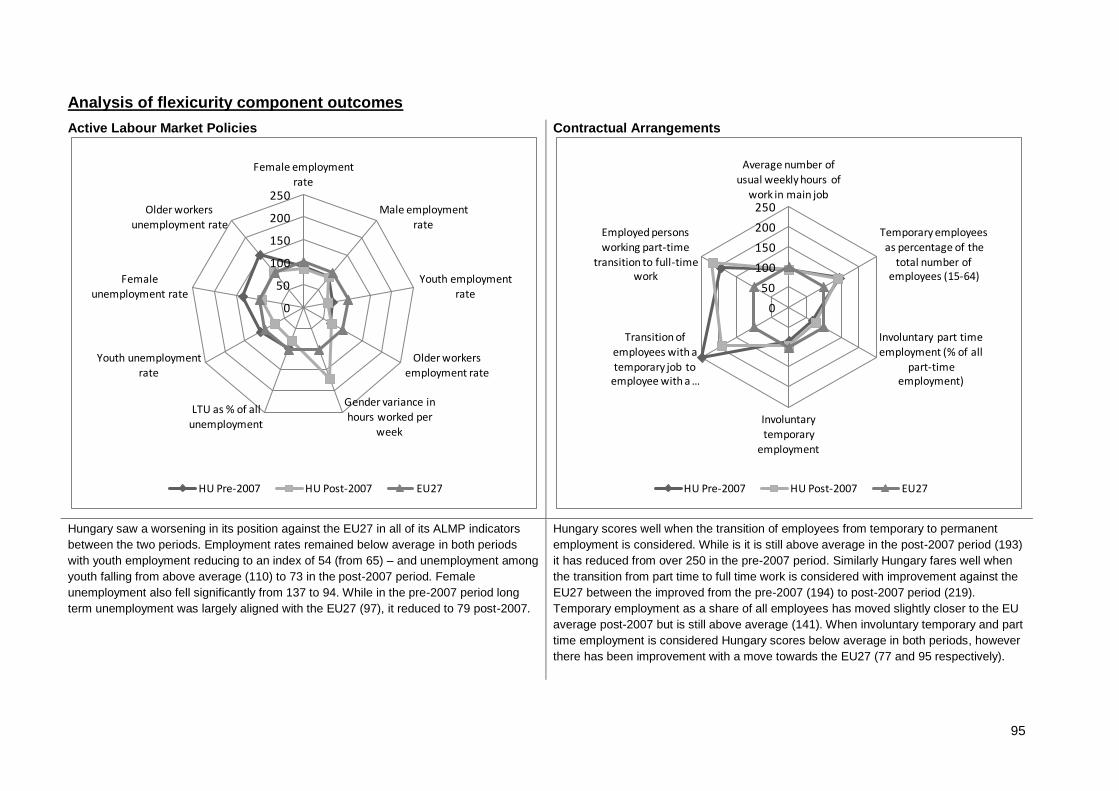
95
Analysis of flexicurity component outcomes
Active Labour Market Policies
Contractual Arrangements
Hungary saw a worsening in its position against the EU27 in all of its ALMP indicators
between the two periods. Employment rates remained below average in both periods
with youth employment reducing to an index of 54 (from 65) – and unemployment among
youth falling from above average (110) to 73 in the post-2007 period. Female
unemployment also fell significantly from 137 to 94. While in the pre-2007 period long
term unemployment was largely aligned with the EU27 (97), it reduced to 79 post-2007.
Hungary scores well when the transition of employees from temporary to permanent
employment is considered. While is it is still above average in the post-2007 period (193)
it has reduced from over 250 in the pre-2007 period. Similarly Hungary fares well when
the transition from part time to full time work is considered with improvement against the
EU27 between the improved from the pre-2007 (194) to post-2007 period (219).
Temporary employment as a share of all employees has moved slightly closer to the EU
average post-2007 but is still above average (141). When involuntary temporary and part
time employment is considered Hungary scores below average in both periods, however
there has been improvement with a move towards the EU27 (77 and 95 respectively).
0
50
100
150
200
250
Female employment rate
Male employment
rate
Youth employment rate
Older workers employment rate
Gender variance in hours worked per
week
LTU as % of all unemployment
Youth unemployment rate
Female unemployment rate
Older workers
unemployment rate
HU Pre-2007 HU Post-2007 EU27
0
50
100
150
200
250
Average number of
usual weekly hours of work in main job
Temporary employees as percentage of the
total number of employees (15-64)
Involuntary part time employment (% of all
part-time employment)
Involuntary
temporary employment
Transition of employees with a
temporary job to employee with a …
Employed persons working part-time
transition to full-time work
HU Pre-2007 HU Post-2007 EU27

96
Lifelong Learning
Modern Social Security Systems
Hungary scores badly for all lifelong learning indicators. Between the pre- and post-2007
periods there was a decrease in the share of employed persons engaged in education
and training in both real and indexed terms (43 to 29). Over the same period
unemployed engagement in training reduced from 44 to 33. While inactive persons
engagement in education and training improved slightly against the EU27 and in real
terms, it had an index of just 48 in the post-2007 period. Tertiary attainment in the 15 to
64 population improved most significantly between the two periods. While still below the
EU27 average, Hungary scored 76 in the post-2007 period compared to 69 pre-2007.
There was also a positive movement towards the index in the share of population with no
income who moved up an income decile from 84 to 89.
While the female employment rate with no children is aligned with the EU27 average,
when considering female employment with one child it drops significantly and has
worsened over time compared to improvement to the EU average. Use of formal
childcare in Hungary according to the indicators is low. For instance, Hungary is indexed
at 43 in the post-2007 period for use of childcare for over 30 hours per week and 14 for
use of childcare for less than 29 hours. While shorter term childcare had remained
similar to the EU27, the use of longer term childcare had got worse (indexed at 48 in the
pre-2007 period). Part time employment due to caring requirements however in Hungary
is relatively good – scoring 160 in the post-2007 period, slightly worse than the pre-2007
period (168). While in-work at-risk-of-poverty is better than the across the EU27 in both
periods (115 pre-2007 and improvement to 132 in post-2007), over the same period the
at risk of poverty before social transfers indicator has worsened from above average pre-
2007 (111) to 80 post-2007.
0
50
100
150
200
250
Employed persons
participating in education and training
Unemployed persons
participating in education and training
Inactive persons
participating in education and training
Tertiary educational
attainment (15-64)
% of people with no
income underwent transition to 1 income
decile up
HU Pre-2007 HU Post-2007 EU27
0
50
100
150
200
250
Female employment
rate (aged 20-49 without children)
Female employment rate (aged 20-49 with 1 child less than 6 years
old)
Formal childcare, children less than 3 years (1-29 hours)
Formal childcare, children less than 3 years (30+ hours)
Low wage earner unemployment trap
PT employment due to looking after children or
incapacitated adults
At risk of poverty rate before social transfers
In-work at-risk-of-
poverty
HU Pre-2007 HU Post-2007 EU27
97
Summary: Flexicurity Policy 2007-2010
There is no targeted flexicurity strategy in Hungary and the implementation of flexicurity policy is not implemented in a balanced manner across the components. The flexicurity
debate across the EU has not had a significant impact on policy development in Hungary, seen instead as ‘superficial’.
Hungary has a low level of spending on LMP as a proportion of GDP spent and low support to those in need. Similarly, there is little debate on the deficiencies of systems to target
specific problem groups. Public expenditure on education is aligned with the EU27 and strategies have focused on matching the population’s skills profile with labour market needs
and deficiencies in youth education and transition to work. However there is low participation in lifelong learning and no dialogue regarding the participation of non-standard workers
in training and education or those with difficulties balancing training with work and family responsibilities.
When modern social security is considered, passive LMP expenditure is above average however there is little social protection. Until 2010, the issue of insufficient work incentives
for the unemployed, for instance, was a core focus. When the work-life balance is considered, debate focuses on an insufficient capacity in public childcare services as well as
benefits and services for long-term care or support to the non-standard workers (such as temporary employees although there was some improvement in the post-2007 period).
Flexibility in contractual arrangements may improve as a result of the January 2012 labour code which comes into effect in July 2012. Similarly there has been a modest increase in
government efforts to improve services to facilitate work life balance, which may have a positive impact on female employment rates.
Since 2007, there has been slight improvement in flexicurity-related indicators in Hungary with the exception of older workers which has steadily increased for the past 10 years
through a gradual increase in the age of retirement. Recent policy measures will probably not affect the flexicurity indicators, but the underlying processes being put in place tend to
be negative. Furthermore, few policies are aimed at achieving both flexibility and security in the labour market in an integrated manner. Flexicurity has had a superficial impact on
policy debates in Hungary. There has been a slight change however in that prior to 2007 flexicurity was not mentioned at all, while recently it has been referred to more often, mainly
as justification for measures aimed at increasing flexibility (most notably in terms of the justification for launching a new labour code).
Future Challenges
Recent policy measures will probably not affect the flexicurity indicators, but the underlying processes being put in place appear to be negative. Though ALMP expenditure has not
been cut, resources have been shifted to expand large-scale public works programmes, which may not facilitate transitions into regular jobs. Also, although the employment rate
increased slightly in 2011, this was to a large extent due to the fact that long term unemployed job seekers in public works schemes are classified as employed in the labour force
survey. The rate of participation in LLL programmes continues to be considerably below the EU average and is expected to further deteriorate in light of some recent measures, such
as the reduction of hours devoted to mathematics and other general subjects in the curricula of vocational schools and the reduction of funding available for training schemes.
A new labour code, enacted in January 2012, comes into effect in July 2012. This may have the effect of increasing flexibility of contractual arrangement. The employment rate of
older workers has been on the increase for the past 10 years, partly in response to the gradual increase in the retirement age. The recent redesign of early pension schemes is likely
to accelerate this trend.

98
14 Ireland
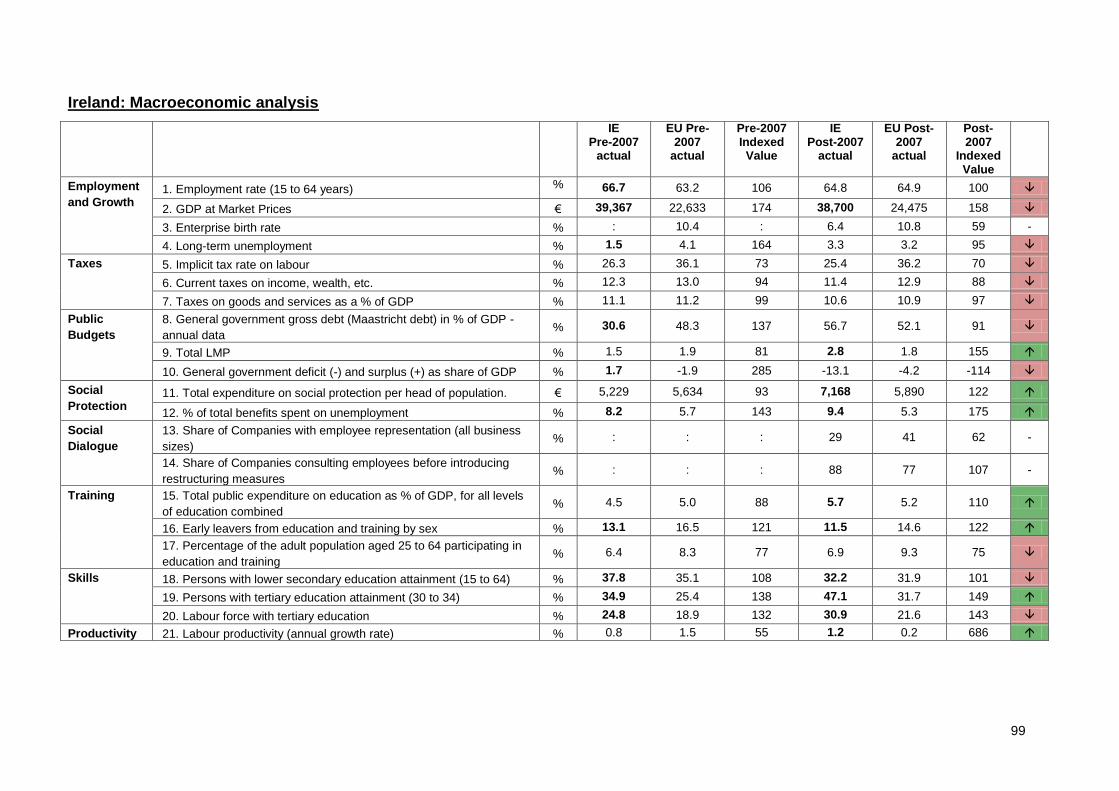
99
Ireland: Macroeconomic analysis
IE Pre-2007
actual
EU Pre-2007
actual
Pre-2007 Indexed Value
IE Post-2007
actual
EU Post-2007
actual
Post-2007
Indexed Value
Employment
and Growth 1. Employment rate (15 to 64 years) % 66.7 63.2 106 64.8 64.9 100
2. GDP at Market Prices € 39,367 22,633 174 38,700 24,475 158
3. Enterprise birth rate % : 10.4 : 6.4 10.8 59 -
4. Long-term unemployment % 1.5 4.1 164 3.3 3.2 95
Taxes 5. Implicit tax rate on labour % 26.3 36.1 73 25.4 36.2 70
6. Current taxes on income, wealth, etc. % 12.3 13.0 94 11.4 12.9 88
7. Taxes on goods and services as a % of GDP % 11.1 11.2 99 10.6 10.9 97
Public
Budgets
8. General government gross debt (Maastricht debt) in % of GDP -
annual data % 30.6 48.3 137 56.7 52.1 91
9. Total LMP % 1.5 1.9 81 2.8 1.8 155
10. General government deficit (-) and surplus (+) as share of GDP % 1.7 -1.9 285 -13.1 -4.2 -114
Social
Protection 11. Total expenditure on social protection per head of population. € 5,229 5,634 93 7,168 5,890 122
12. % of total benefits spent on unemployment % 8.2 5.7 143 9.4 5.3 175
Social
Dialogue
13. Share of Companies with employee representation (all business
sizes) % : : : 29 41 62 -
14. Share of Companies consulting employees before introducing
restructuring measures % : : : 88 77 107 -
Training 15. Total public expenditure on education as % of GDP, for all levels
of education combined % 4.5 5.0 88 5.7 5.2 110
16. Early leavers from education and training by sex % 13.1 16.5 121 11.5 14.6 122
17. Percentage of the adult population aged 25 to 64 participating in
education and training % 6.4 8.3 77 6.9 9.3 75
Skills 18. Persons with lower secondary education attainment (15 to 64) % 37.8 35.1 108 32.2 31.9 101
19. Persons with tertiary education attainment (30 to 34) % 34.9 25.4 138 47.1 31.7 149
20. Labour force with tertiary education % 24.8 18.9 132 30.9 21.6 143
Productivity 21. Labour productivity (annual growth rate) % 0.8 1.5 55 1.2 0.2 686
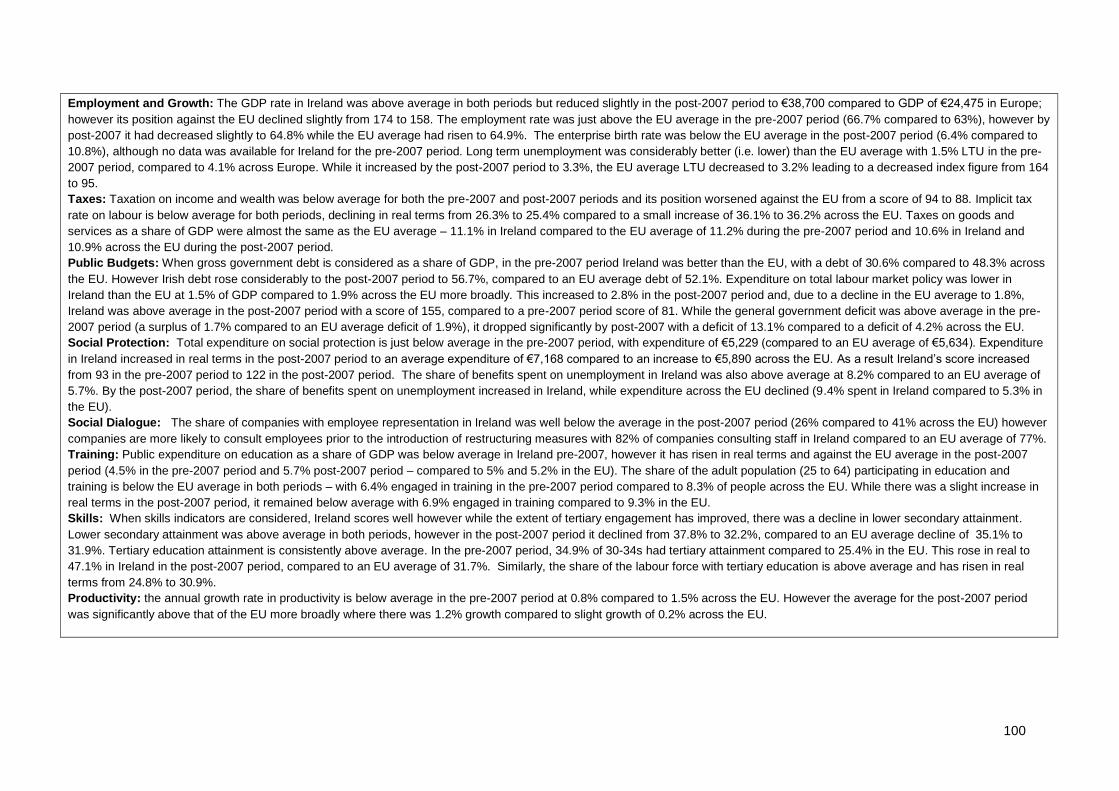
100
Employment and Growth: The GDP rate in Ireland was above average in both periods but reduced slightly in the post-2007 period to €38,700 compared to GDP of €24,475 in Europe;
however its position against the EU declined slightly from 174 to 158. The employment rate was just above the EU average in the pre-2007 period (66.7% compared to 63%), however by
post-2007 it had decreased slightly to 64.8% while the EU average had risen to 64.9%. The enterprise birth rate was below the EU average in the post-2007 period (6.4% compared to
10.8%), although no data was available for Ireland for the pre-2007 period. Long term unemployment was considerably better (i.e. lower) than the EU average with 1.5% LTU in the pre-
2007 period, compared to 4.1% across Europe. While it increased by the post-2007 period to 3.3%, the EU average LTU decreased to 3.2% leading to a decreased index figure from 164
to 95.
Taxes: Taxation on income and wealth was below average for both the pre-2007 and post-2007 periods and its position worsened against the EU from a score of 94 to 88. Implicit tax
rate on labour is below average for both periods, declining in real terms from 26.3% to 25.4% compared to a small increase of 36.1% to 36.2% across the EU. Taxes on goods and
services as a share of GDP were almost the same as the EU average – 11.1% in Ireland compared to the EU average of 11.2% during the pre-2007 period and 10.6% in Ireland and
10.9% across the EU during the post-2007 period.
Public Budgets: When gross government debt is considered as a share of GDP, in the pre-2007 period Ireland was better than the EU, with a debt of 30.6% compared to 48.3% across
the EU. However Irish debt rose considerably to the post-2007 period to 56.7%, compared to an EU average debt of 52.1%. Expenditure on total labour market policy was lower in
Ireland than the EU at 1.5% of GDP compared to 1.9% across the EU more broadly. This increased to 2.8% in the post-2007 period and, due to a decline in the EU average to 1.8%,
Ireland was above average in the post-2007 period with a score of 155, compared to a pre-2007 period score of 81. While the general government deficit was above average in the pre-
2007 period (a surplus of 1.7% compared to an EU average deficit of 1.9%), it dropped significantly by post-2007 with a deficit of 13.1% compared to a deficit of 4.2% across the EU.
Social Protection: Total expenditure on social protection is just below average in the pre-2007 period, with expenditure of €5,229 (compared to an EU average of €5,634). Expenditure
in Ireland increased in real terms in the post-2007 period to an average expenditure of €7,168 compared to an increase to €5,890 across the EU. As a result Ireland’s score increased
from 93 in the pre-2007 period to 122 in the post-2007 period. The share of benefits spent on unemployment in Ireland was also above average at 8.2% compared to an EU average of
5.7%. By the post-2007 period, the share of benefits spent on unemployment increased in Ireland, while expenditure across the EU declined (9.4% spent in Ireland compared to 5.3% in
the EU).
Social Dialogue: The share of companies with employee representation in Ireland was well below the average in the post-2007 period (26% compared to 41% across the EU) however
companies are more likely to consult employees prior to the introduction of restructuring measures with 82% of companies consulting staff in Ireland compared to an EU average of 77%.
Training: Public expenditure on education as a share of GDP was below average in Ireland pre-2007, however it has risen in real terms and against the EU average in the post-2007
period (4.5% in the pre-2007 period and 5.7% post-2007 period – compared to 5% and 5.2% in the EU). The share of the adult population (25 to 64) participating in education and
training is below the EU average in both periods – with 6.4% engaged in training in the pre-2007 period compared to 8.3% of people across the EU. While there was a slight increase in
real terms in the post-2007 period, it remained below average with 6.9% engaged in training compared to 9.3% in the EU.
Skills: When skills indicators are considered, Ireland scores well however while the extent of tertiary engagement has improved, there was a decline in lower secondary attainment.
Lower secondary attainment was above average in both periods, however in the post-2007 period it declined from 37.8% to 32.2%, compared to an EU average decline of 35.1% to
31.9%. Tertiary education attainment is consistently above average. In the pre-2007 period, 34.9% of 30-34s had tertiary attainment compared to 25.4% in the EU. This rose in real to
47.1% in Ireland in the post-2007 period, compared to an EU average of 31.7%. Similarly, the share of the labour force with tertiary education is above average and has risen in real
terms from 24.8% to 30.9%.
Productivity: the annual growth rate in productivity is below average in the pre-2007 period at 0.8% compared to 1.5% across the EU. However the average for the post-2007 period
was significantly above that of the EU more broadly where there was 1.2% growth compared to slight growth of 0.2% across the EU.
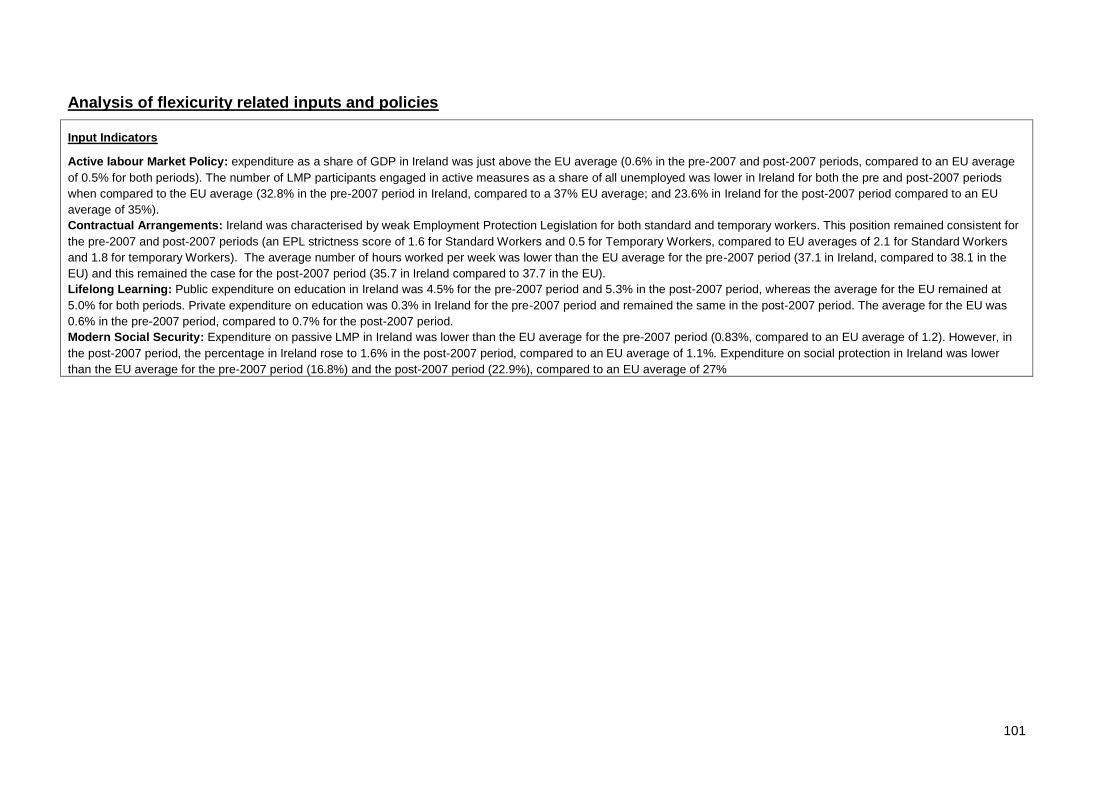
101
Analysis of flexicurity related inputs and policies
Input Indicators
Active labour Market Policy: expenditure as a share of GDP in Ireland was just above the EU average (0.6% in the pre-2007 and post-2007 periods, compared to an EU average
of 0.5% for both periods). The number of LMP participants engaged in active measures as a share of all unemployed was lower in Ireland for both the pre and post-2007 periods
when compared to the EU average (32.8% in the pre-2007 period in Ireland, compared to a 37% EU average; and 23.6% in Ireland for the post-2007 period compared to an EU
average of 35%).
Contractual Arrangements: Ireland was characterised by weak Employment Protection Legislation for both standard and temporary workers. This position remained consistent for
the pre-2007 and post-2007 periods (an EPL strictness score of 1.6 for Standard Workers and 0.5 for Temporary Workers, compared to EU averages of 2.1 for Standard Workers
and 1.8 for temporary Workers). The average number of hours worked per week was lower than the EU average for the pre-2007 period (37.1 in Ireland, compared to 38.1 in the
EU) and this remained the case for the post-2007 period (35.7 in Ireland compared to 37.7 in the EU).
Lifelong Learning: Public expenditure on education in Ireland was 4.5% for the pre-2007 period and 5.3% in the post-2007 period, whereas the average for the EU remained at
5.0% for both periods. Private expenditure on education was 0.3% in Ireland for the pre-2007 period and remained the same in the post-2007 period. The average for the EU was
0.6% in the pre-2007 period, compared to 0.7% for the post-2007 period.
Modern Social Security: Expenditure on passive LMP in Ireland was lower than the EU average for the pre-2007 period (0.83%, compared to an EU average of 1.2). However, in
the post-2007 period, the percentage in Ireland rose to 1.6% in the post-2007 period, compared to an EU average of 1.1%. Expenditure on social protection in Ireland was lower
than the EU average for the pre-2007 period (16.8%) and the post-2007 period (22.9%), compared to an EU average of 27%
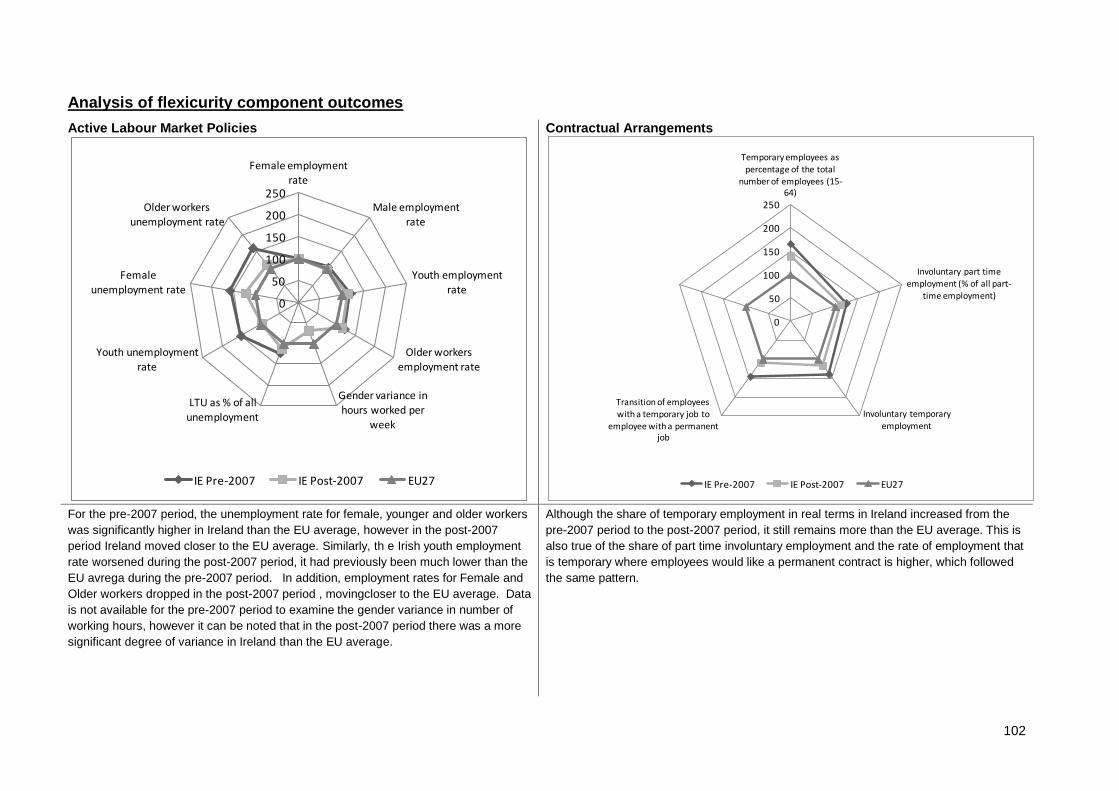
102
Analysis of flexicurity component outcomes
Active Labour Market Policies
Contractual Arrangements
For the pre-2007 period, the unemployment rate for female, younger and older workers
was significantly higher in Ireland than the EU average, however in the post-2007
period Ireland moved closer to the EU average. Similarly, th e Irish youth employment
rate worsened during the post-2007 period, it had previously been much lower than the
EU avrega during the pre-2007 period. In addition, employment rates for Female and
Older workers dropped in the post-2007 period , movingcloser to the EU average. Data
is not available for the pre-2007 period to examine the gender variance in number of
working hours, however it can be noted that in the post-2007 period there was a more
significant degree of variance in Ireland than the EU average.
Although the share of temporary employment in real terms in Ireland increased from the
pre-2007 period to the post-2007 period, it still remains more than the EU average. This is
also true of the share of part time involuntary employment and the rate of employment that
is temporary where employees would like a permanent contract is higher, which followed
the same pattern.
0
50
100
150
200
250
Female employment rate
Male employment rate
Youth employment
rate
Older workers employment rate
Gender variance in hours worked per
week
LTU as % of all unemployment
Youth unemployment rate
Female
unemployment rate
Older workers unemployment rate
IE Pre-2007 IE Post-2007 EU27
0
50
100
150
200
250
Temporary employees as percentage of the total
number of employees (15-64)
Involuntary part time employment (% of all part-
time employment)
Involuntary temporary
employment
Transition of employees with a temporary job to
employee with a permanent job
IE Pre-2007 IE Post-2007 EU27
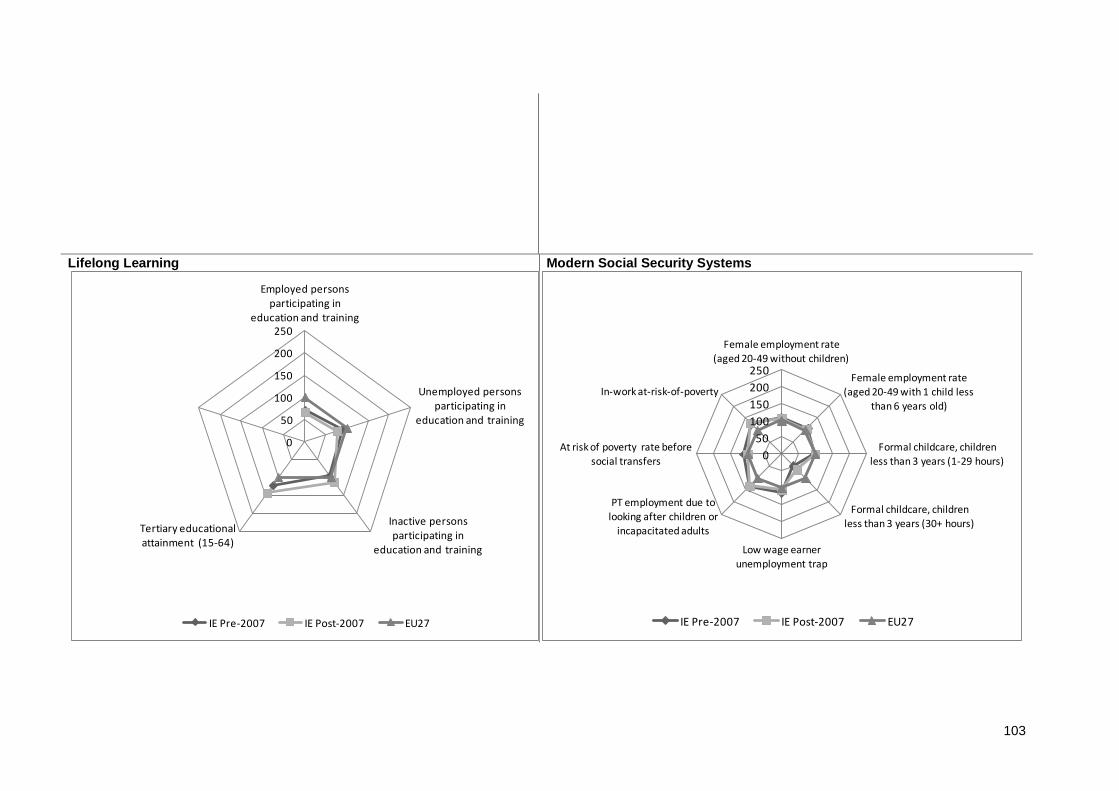
103
Lifelong Learning
Modern Social Security Systems
0
50
100
150
200
250
Employed persons participating in
education and training
Unemployed persons participating in
education and training
Inactive persons participating in
education and training
Tertiary educational attainment (15-64)
IE Pre-2007 IE Post-2007 EU27
0
50
100
150
200
250
Female employment rate
(aged 20-49 without children)
Female employment rate (aged 20-49 with 1 child less
than 6 years old)
Formal childcare, children
less than 3 years (1-29 hours)
Formal childcare, children less than 3 years (30+ hours)
Low wage earner
unemployment trap
PT employment due to looking after children or
incapacitated adults
At risk of poverty rate before
social transfers
In-work at-risk-of-poverty
IE Pre-2007 IE Post-2007 EU27
104
Tertiary education attainment was above average in Ireland in the pre and post-2007
periods. Tertiary attainment over this period also improved when compared to the EU
average from an index of 122 to 143. However, engagement in education and training
was primarily below average. Engagement of employed and unemployed people in
education and training has increased in real terms, however when both indicators are
compared to the EU average, their positions dropped (among the employed from 70 to
66 and among the unemployed from 89 to 76). When engagement of inactive persons
in education is considered however the rate improved from 95 to 113 from the pre-2007
to post-2007 periods.
The employment rate for females without children and with children was above the EU
average for both the pre-2007 and post-2007 periods. For those with one child less than 6
years old the access rate for childcare for less than 29 hours was the same as the EU
average in both periods. The access rate for 30 hours or more was significantly lower than
the EU average in both periods – however it improved against the EU average from 48 to
65. The share of workers in part-time employment as a result of looking after children or
incapacitated adults is better than the EU average in both periods (135 in the pre-2007
period and 134 in the post-2007 period). The share of those at risk of poverty before
social transfers was better than the EU average in the pre-2007 period (112), whereas in
the post-2007 period, the Irish rate was the same as the EU average (100). In work at risk
of poverty however was consistently above average in Ireland at 128 and 131 in the pre-
2007 and post-2007 periods respectively.
Summary: Flexicurity Policy 2007-2010
At the macro-level, Ireland scores better in the pre-2007 period than the post-2007 period when employment and growth indicators are considered. The GDP rate in Ireland is above
average in both periods and rose slightly into the post-2007 years. Although taxation on income and wealth is above average for the pre-2007 period, this decreased by the post-
2007 period This is also true of implicit tax on labour, which was below the EU average for both periods whereas taxes on goods and services as a share of GDP are almost the
same as the EU average. While the levels of gross government debt were low during the pre-2007 period, the Irish rate surpassed the EU level by the post-2007 period and although
the total labour market policy was worse in the pre-2007 period, the rate improved by the post-2007 period. Similarly, while expenditure on social protection per head was below
average in the pre-2007 period, in the post-2007 period Ireland fared more positively. There were also increases in the share of benefits spent on unemployment in real terms and
when compared against the EU average.
From a policy perspective the delivery of current and introduction of new policy and initiatives is undertaken within the Towards 2016 agreement, an agreement between Social
Partners and the Irish Government. Within the period 2007 to 2010 this agreement was subject to review by Government and Social Partners, the result was a Transitional
Agreement for 2008 and 2009. Subsequent discussion between Government and Social Partners has maintained the strong contribution of Social Partners to flexicurity-related
policy in Ireland.
In relation to Active Labour Market Policy, the number of LMP participants engaged in active measure as a share of all unemployed was lower in Ireland for both the pre and post-
2007 periods when compared to the EU average. For the pre-2007 period, the unemployment rate for female, younger and older workers is significantly higher in Ireland than the EU
average, however post-2007 Ireland has moved closer to the EU average. The Irish youth employment rates stayed the same as the EU average for the pre-2007 and post-2007
periods. However, employment rates for Female and Older workers dropped in the post-2007 period and moved closer to the EU average. When it came to contractual
arrangements, Ireland is characterised by weak Employment Protection Legislation for both standard and temporary workers and the average number of hours worked per week was
lower than the EU average. By the post-2007 period, public expenditure on education is just above the EU average, but there is a mixed picture in Ireland when it comes to lifelong
learning indicators. For example, there are low levels among employed and unemployed people participating in education and training. However, the rate of inactive persons
participating in education and training increased by the post-2007 period and therefore was better than the EU average rate. Similarly, among those of working age, tertiary
education in Ireland in the pre-2007 and post-2007 periods remained at a higher rate than the EU average.
105
In relation to modern social security systems, expenditure on passive LMP in Ireland was just above the EU rate by post-2007. However, spend on social protection in Ireland was
much lower than that across the EU. When female employment is considered, Ireland is above the EU average whether female workers have children or not, and remained above
average for pre-2007 and post-2007 periods. Regarding access to childcare, for those with one child less than 6 years old, the access rate for childcare for less than 29 hours is the
same as the EU average. The access rate for 30 hours or more is significantly lower and the share of workers in part-time employment as a result of looking after children or
incapacitated adults is higher in Ireland than the EU average.

106
15 Italy
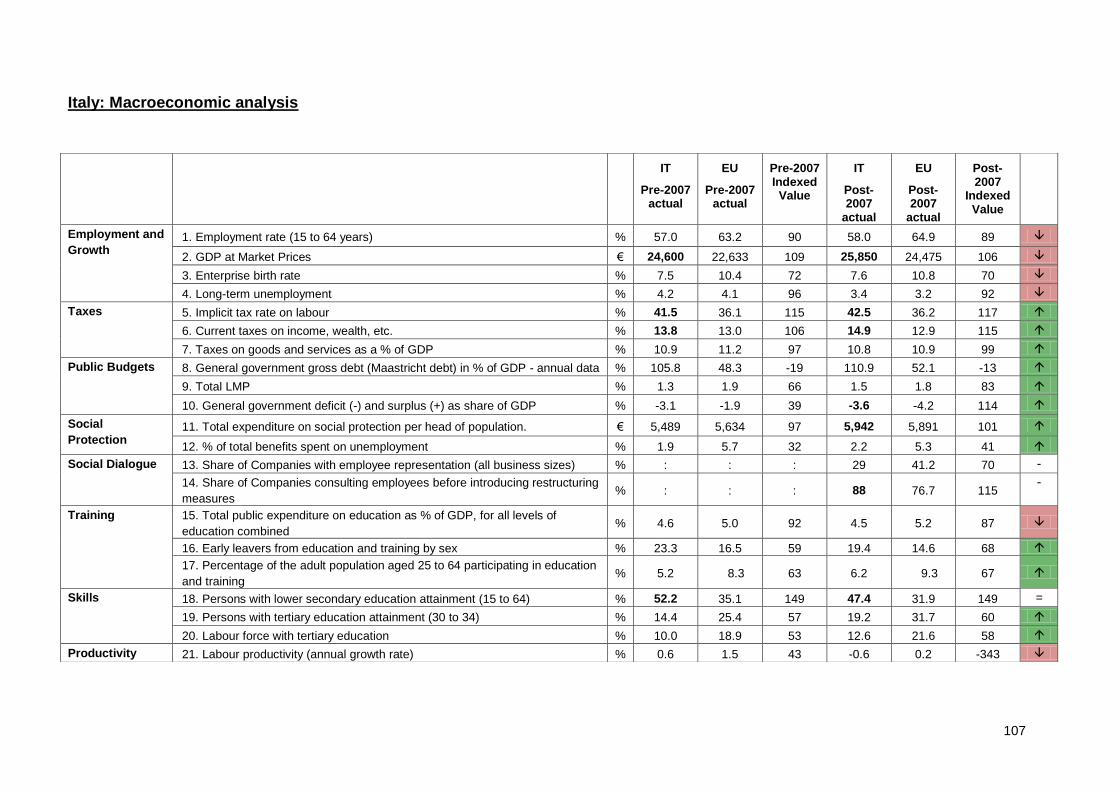
107
Italy: Macroeconomic analysis
IT
Pre-2007 actual
EU
Pre-2007 actual
Pre-2007 Indexed Value
IT
Post-2007
actual
EU
Post-2007
actual
Post-2007
Indexed Value
Employment and
Growth 1. Employment rate (15 to 64 years) % 57.0 63.2 90 58.0 64.9 89
2. GDP at Market Prices € 24,600 22,633 109 25,850 24,475 106
3. Enterprise birth rate % 7.5 10.4 72 7.6 10.8 70
4. Long-term unemployment % 4.2 4.1 96 3.4 3.2 92
Taxes 5. Implicit tax rate on labour % 41.5 36.1 115 42.5 36.2 117
6. Current taxes on income, wealth, etc. % 13.8 13.0 106 14.9 12.9 115
7. Taxes on goods and services as a % of GDP % 10.9 11.2 97 10.8 10.9 99
Public Budgets 8. General government gross debt (Maastricht debt) in % of GDP - annual data % 105.8 48.3 -19 110.9 52.1 -13
9. Total LMP % 1.3 1.9 66 1.5 1.8 83
10. General government deficit (-) and surplus (+) as share of GDP % -3.1 -1.9 39 -3.6 -4.2 114
Social
Protection 11. Total expenditure on social protection per head of population. € 5,489 5,634 97 5,942 5,891 101
12. % of total benefits spent on unemployment % 1.9 5.7 32 2.2 5.3 41
Social Dialogue 13. Share of Companies with employee representation (all business sizes) % : : : 29 41.2 70 -
14. Share of Companies consulting employees before introducing restructuring
measures % : : : 88 76.7 115
-
Training 15. Total public expenditure on education as % of GDP, for all levels of
education combined % 4.6 5.0 92 4.5 5.2 87
16. Early leavers from education and training by sex % 23.3 16.5 59 19.4 14.6 68
17. Percentage of the adult population aged 25 to 64 participating in education
and training % 5.2 8.3 63 6.2 9.3 67
Skills 18. Persons with lower secondary education attainment (15 to 64) % 52.2 35.1 149 47.4 31.9 149 =
19. Persons with tertiary education attainment (30 to 34) % 14.4 25.4 57 19.2 31.7 60
20. Labour force with tertiary education % 10.0 18.9 53 12.6 21.6 58
Productivity 21. Labour productivity (annual growth rate) % 0.6 1.5 43 -0.6 0.2 -343
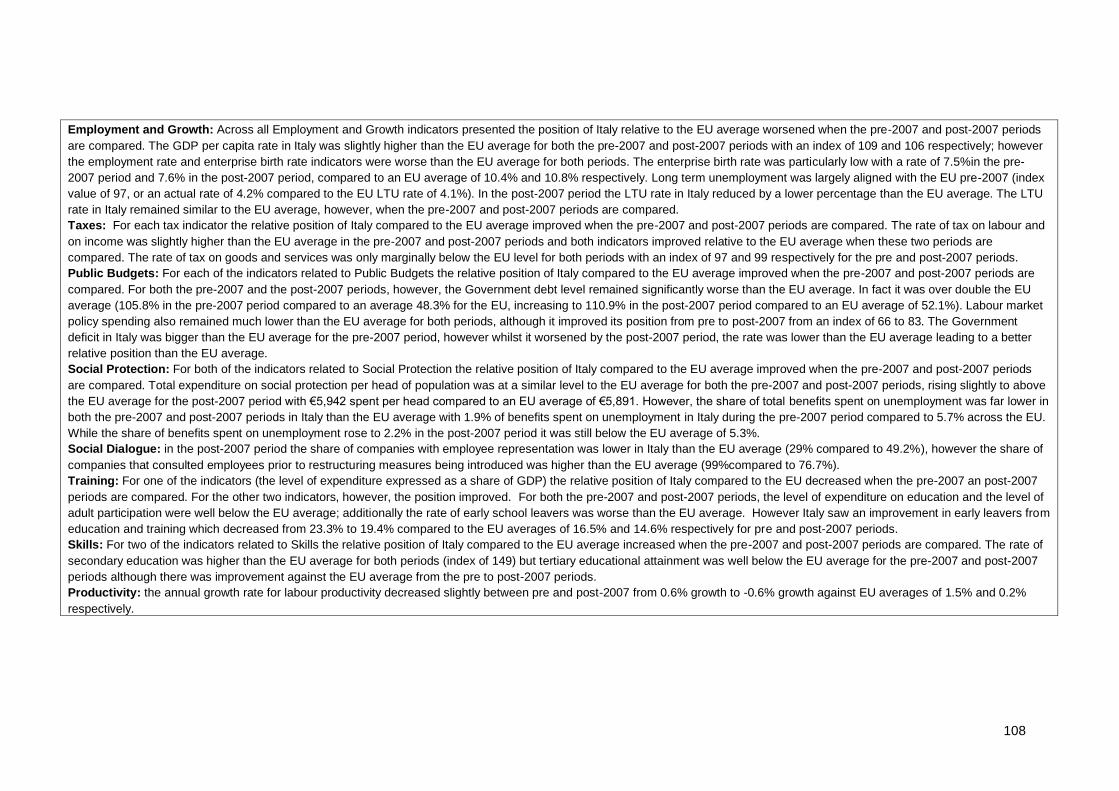
108
Employment and Growth: Across all Employment and Growth indicators presented the position of Italy relative to the EU average worsened when the pre-2007 and post-2007 periods
are compared. The GDP per capita rate in Italy was slightly higher than the EU average for both the pre-2007 and post-2007 periods with an index of 109 and 106 respectively; however
the employment rate and enterprise birth rate indicators were worse than the EU average for both periods. The enterprise birth rate was particularly low with a rate of 7.5%in the pre-
2007 period and 7.6% in the post-2007 period, compared to an EU average of 10.4% and 10.8% respectively. Long term unemployment was largely aligned with the EU pre-2007 (index
value of 97, or an actual rate of 4.2% compared to the EU LTU rate of 4.1%). In the post-2007 period the LTU rate in Italy reduced by a lower percentage than the EU average. The LTU
rate in Italy remained similar to the EU average, however, when the pre-2007 and post-2007 periods are compared.
Taxes: For each tax indicator the relative position of Italy compared to the EU average improved when the pre-2007 and post-2007 periods are compared. The rate of tax on labour and
on income was slightly higher than the EU average in the pre-2007 and post-2007 periods and both indicators improved relative to the EU average when these two periods are
compared. The rate of tax on goods and services was only marginally below the EU level for both periods with an index of 97 and 99 respectively for the pre and post-2007 periods.
Public Budgets: For each of the indicators related to Public Budgets the relative position of Italy compared to the EU average improved when the pre-2007 and post-2007 periods are
compared. For both the pre-2007 and the post-2007 periods, however, the Government debt level remained significantly worse than the EU average. In fact it was over double the EU
average (105.8% in the pre-2007 period compared to an average 48.3% for the EU, increasing to 110.9% in the post-2007 period compared to an EU average of 52.1%). Labour market
policy spending also remained much lower than the EU average for both periods, although it improved its position from pre to post-2007 from an index of 66 to 83. The Government
deficit in Italy was bigger than the EU average for the pre-2007 period, however whilst it worsened by the post-2007 period, the rate was lower than the EU average leading to a better
relative position than the EU average.
Social Protection: For both of the indicators related to Social Protection the relative position of Italy compared to the EU average improved when the pre-2007 and post-2007 periods
are compared. Total expenditure on social protection per head of population was at a similar level to the EU average for both the pre-2007 and post-2007 periods, rising slightly to above
the EU average for the post-2007 period with €5,942 spent per head compared to an EU average of €5,891. However, the share of total benefits spent on unemployment was far lower in
both the pre-2007 and post-2007 periods in Italy than the EU average with 1.9% of benefits spent on unemployment in Italy during the pre-2007 period compared to 5.7% across the EU.
While the share of benefits spent on unemployment rose to 2.2% in the post-2007 period it was still below the EU average of 5.3%.
Social Dialogue: in the post-2007 period the share of companies with employee representation was lower in Italy than the EU average (29% compared to 49.2%), however the share of
companies that consulted employees prior to restructuring measures being introduced was higher than the EU average (99%compared to 76.7%).
Training: For one of the indicators (the level of expenditure expressed as a share of GDP) the relative position of Italy compared to the EU decreased when the pre-2007 an post-2007
periods are compared. For the other two indicators, however, the position improved. For both the pre-2007 and post-2007 periods, the level of expenditure on education and the level of
adult participation were well below the EU average; additionally the rate of early school leavers was worse than the EU average. However Italy saw an improvement in early leavers from
education and training which decreased from 23.3% to 19.4% compared to the EU averages of 16.5% and 14.6% respectively for pre and post-2007 periods.
Skills: For two of the indicators related to Skills the relative position of Italy compared to the EU average increased when the pre-2007 and post-2007 periods are compared. The rate of
secondary education was higher than the EU average for both periods (index of 149) but tertiary educational attainment was well below the EU average for the pre-2007 and post-2007
periods although there was improvement against the EU average from the pre to post-2007 periods.
Productivity: the annual growth rate for labour productivity decreased slightly between pre and post-2007 from 0.6% growth to -0.6% growth against EU averages of 1.5% and 0.2%
respectively.
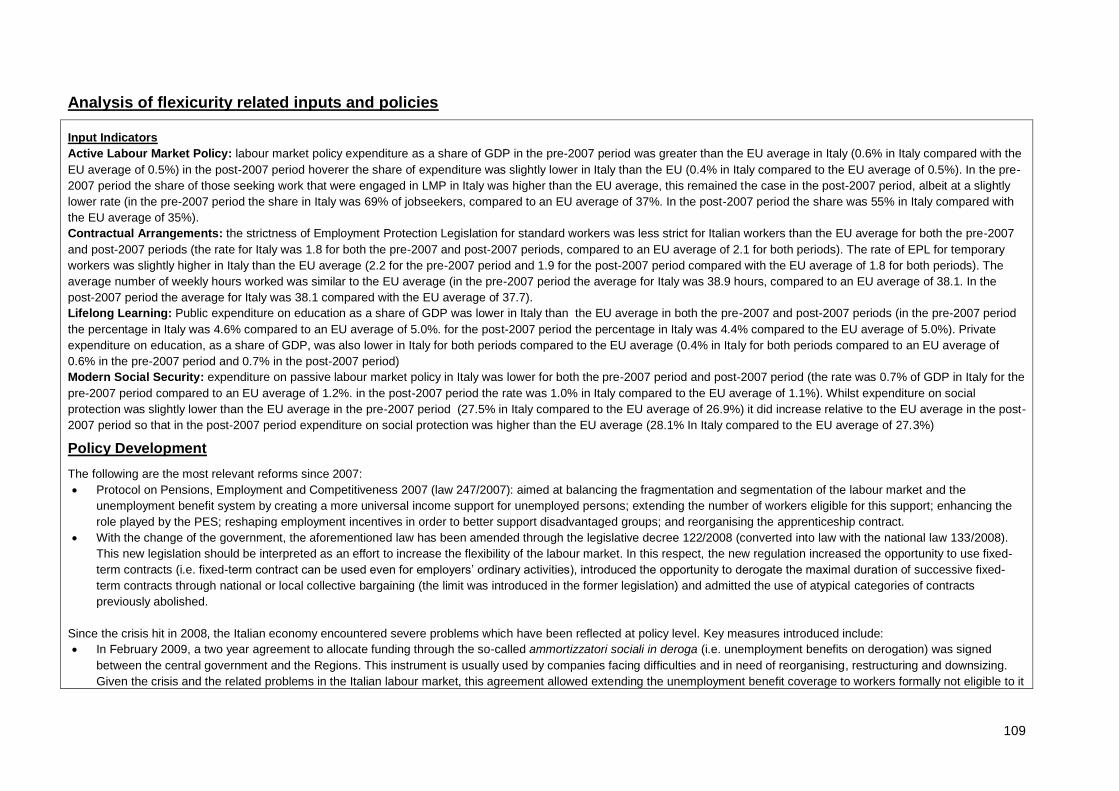
109
Analysis of flexicurity related inputs and policies
Input Indicators
Active Labour Market Policy: labour market policy expenditure as a share of GDP in the pre-2007 period was greater than the EU average in Italy (0.6% in Italy compared with the
EU average of 0.5%) in the post-2007 period hoverer the share of expenditure was slightly lower in Italy than the EU (0.4% in Italy compared to the EU average of 0.5%). In the pre-
2007 period the share of those seeking work that were engaged in LMP in Italy was higher than the EU average, this remained the case in the post-2007 period, albeit at a slightly
lower rate (in the pre-2007 period the share in Italy was 69% of jobseekers, compared to an EU average of 37%. In the post-2007 period the share was 55% in Italy compared with
the EU average of 35%).
Contractual Arrangements: the strictness of Employment Protection Legislation for standard workers was less strict for Italian workers than the EU average for both the pre-2007
and post-2007 periods (the rate for Italy was 1.8 for both the pre-2007 and post-2007 periods, compared to an EU average of 2.1 for both periods). The rate of EPL for temporary
workers was slightly higher in Italy than the EU average (2.2 for the pre-2007 period and 1.9 for the post-2007 period compared with the EU average of 1.8 for both periods). The
average number of weekly hours worked was similar to the EU average (in the pre-2007 period the average for Italy was 38.9 hours, compared to an EU average of 38.1. In the
post-2007 period the average for Italy was 38.1 compared with the EU average of 37.7).
Lifelong Learning: Public expenditure on education as a share of GDP was lower in Italy than the EU average in both the pre-2007 and post-2007 periods (in the pre-2007 period
the percentage in Italy was 4.6% compared to an EU average of 5.0%. for the post-2007 period the percentage in Italy was 4.4% compared to the EU average of 5.0%). Private
expenditure on education, as a share of GDP, was also lower in Italy for both periods compared to the EU average (0.4% in Italy for both periods compared to an EU average of
0.6% in the pre-2007 period and 0.7% in the post-2007 period)
Modern Social Security: expenditure on passive labour market policy in Italy was lower for both the pre-2007 period and post-2007 period (the rate was 0.7% of GDP in Italy for the
pre-2007 period compared to an EU average of 1.2%. in the post-2007 period the rate was 1.0% in Italy compared to the EU average of 1.1%). Whilst expenditure on social
protection was slightly lower than the EU average in the pre-2007 period (27.5% in Italy compared to the EU average of 26.9%) it did increase relative to the EU average in the post-
2007 period so that in the post-2007 period expenditure on social protection was higher than the EU average (28.1% In Italy compared to the EU average of 27.3%)
Policy Development
The following are the most relevant reforms since 2007:
Protocol on Pensions, Employment and Competitiveness 2007 (law 247/2007): aimed at balancing the fragmentation and segmentation of the labour market and the
unemployment benefit system by creating a more universal income support for unemployed persons; extending the number of workers eligible for this support; enhancing the
role played by the PES; reshaping employment incentives in order to better support disadvantaged groups; and reorganising the apprenticeship contract.
With the change of the government, the aforementioned law has been amended through the legislative decree 122/2008 (converted into law with the national law 133/2008).
This new legislation should be interpreted as an effort to increase the flexibility of the labour market. In this respect, the new regulation increased the opportunity to use fixed-
term contracts (i.e. fixed-term contract can be used even for employers’ ordinary activities), introduced the opportunity to derogate the maximal duration of successive fixed-
term contracts through national or local collective bargaining (the limit was introduced in the former legislation) and admitted the use of atypical categories of contracts
previously abolished.
Since the crisis hit in 2008, the Italian economy encountered severe problems which have been reflected at policy level. Key measures introduced include:
In February 2009, a two year agreement to allocate funding through the so-called ammortizzatori sociali in deroga (i.e. unemployment benefits on derogation) was signed
between the central government and the Regions. This instrument is usually used by companies facing difficulties and in need of reorganising, restructuring and downsizing.
Given the crisis and the related problems in the Italian labour market, this agreement allowed extending the unemployment benefit coverage to workers formally not eligible to it
110
(in particular, as concerns Cassa Integrazione Guadagni Straordinaria, addressed to firm facing restructuring, and “mobility” schemes, addressed to workers involved in
collective dismissals). The target groups of this extension are determined by the Regions on the basis of agreements signed with social partners at the local level. According to
this agreement, a total of EUR 8 billion has been earmarked for the period 2009-2010, of which EUR 2.65 billion is allocated from the regions through European Social Fund
resources and EUR 5.35 billion is allocated from national programmes, including the FAS, which is a national fund for underdeveloped areas It seems important to remark that
the allocation of FAS resources (which should be destined by 85% to Southern regions which are the poorest regions in the country) to the financing of national-level
unemployment benefits programmes, raised several critiques from the representatives of these regions.
Agreement between State and Regions on unemployment benefits “on derogation” and active labour market policies for 2011-2012. In order to tackle the increasing problems
of the labour market, this agreement extended the exceptional measures implemented in 2009 for the unemployment benefits “on derogation” for 2011-2012. Furthermore,
specific initiatives on active labour market policies and income support for workers eligible for unemployment benefits “on derogation” are provided.
Recently, in 2012, the new emergency government implemented a reform of the labour market which aims at rationalising the number of atypical contracts, easing the process
of firing workers (extending somehow the support of the workers) and introducing policies.
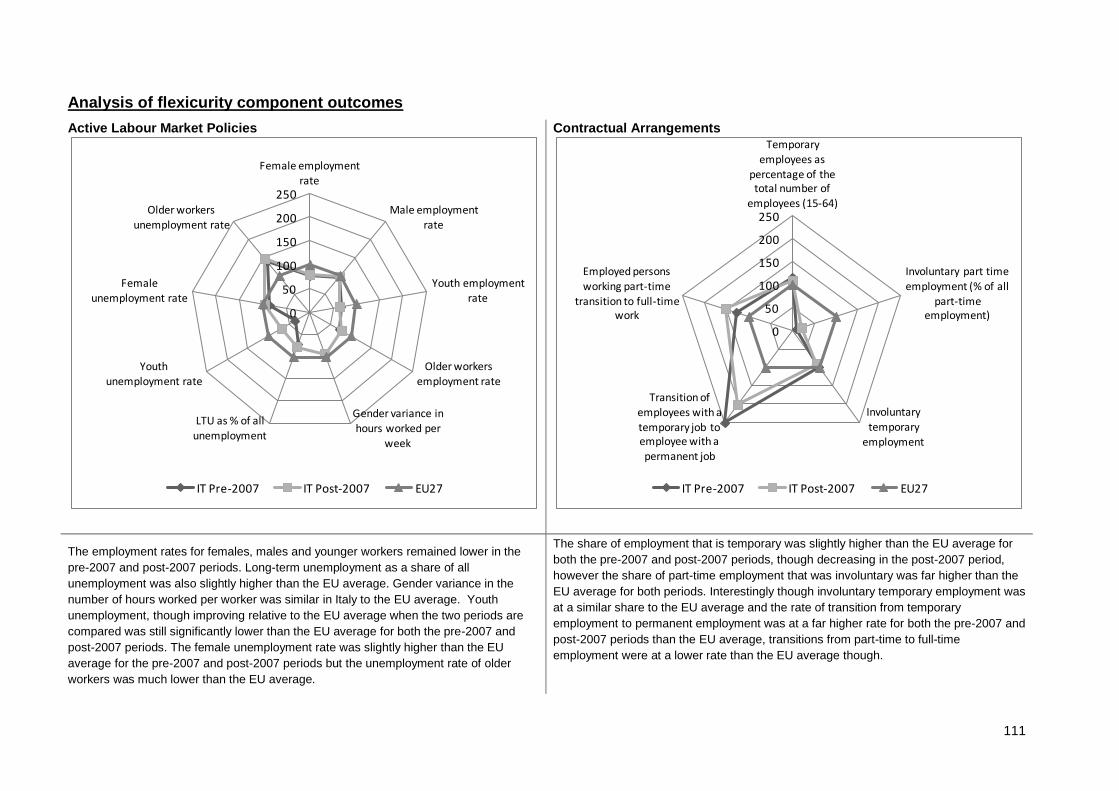
111
Analysis of flexicurity component outcomes
Active Labour Market Policies
Contractual Arrangements
The employment rates for females, males and younger workers remained lower in the
pre-2007 and post-2007 periods. Long-term unemployment as a share of all
unemployment was also slightly higher than the EU average. Gender variance in the
number of hours worked per worker was similar in Italy to the EU average. Youth
unemployment, though improving relative to the EU average when the two periods are
compared was still significantly lower than the EU average for both the pre-2007 and
post-2007 periods. The female unemployment rate was slightly higher than the EU
average for the pre-2007 and post-2007 periods but the unemployment rate of older
workers was much lower than the EU average.
The share of employment that is temporary was slightly higher than the EU average for
both the pre-2007 and post-2007 periods, though decreasing in the post-2007 period,
however the share of part-time employment that was involuntary was far higher than the
EU average for both periods. Interestingly though involuntary temporary employment was
at a similar share to the EU average and the rate of transition from temporary
employment to permanent employment was at a far higher rate for both the pre-2007 and
post-2007 periods than the EU average, transitions from part-time to full-time
employment were at a lower rate than the EU average though.
0
50
100
150
200
250
Female employment rate
Male employment
rate
Youth employment rate
Older workers employment rate
Gender variance in hours worked per
week
LTU as % of all
unemployment
Youth unemployment rate
Female unemployment rate
Older workers
unemployment rate
IT Pre-2007 IT Post-2007 EU27
0
50
100
150
200
250
Temporary employees as
percentage of the total number of
employees (15-64)
Involuntary part time
employment (% of all part-time
employment)
Involuntary
temporary employment
Transition of employees with a temporary job to employee with a permanent job
Employed persons
working part-time transition to full-time
work
IT Pre-2007 IT Post-2007 EU27
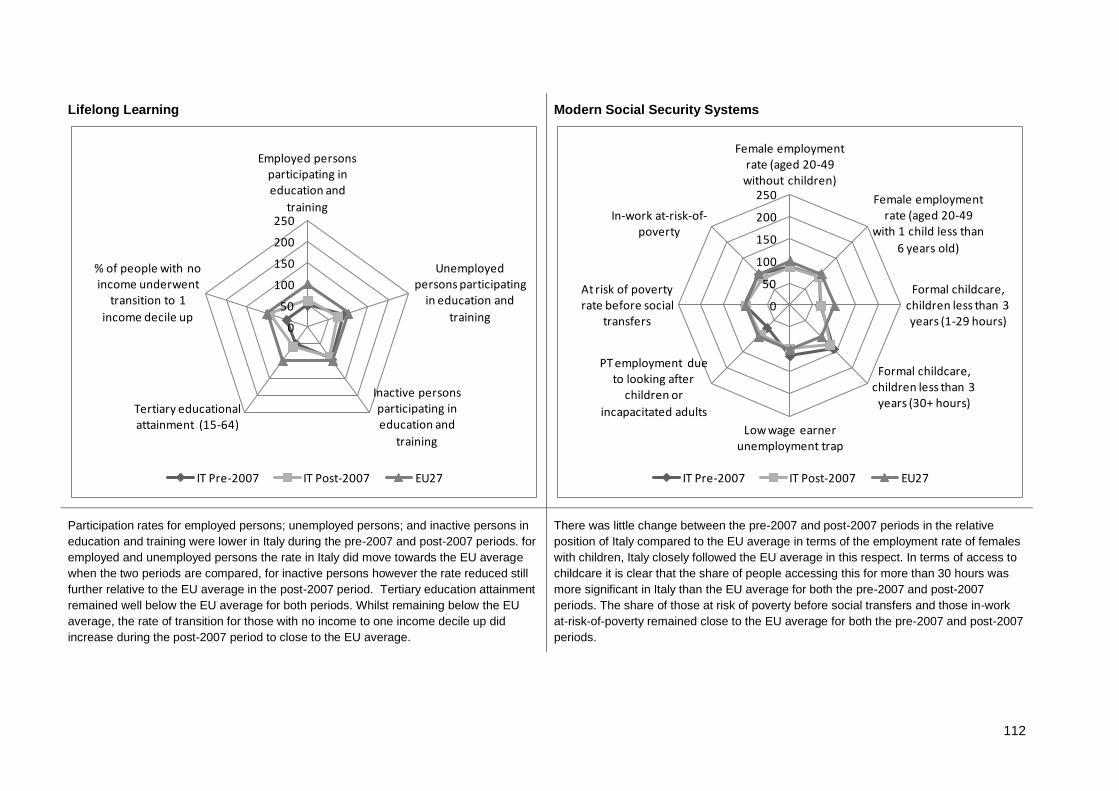
112
Lifelong Learning
Modern Social Security Systems
Participation rates for employed persons; unemployed persons; and inactive persons in
education and training were lower in Italy during the pre-2007 and post-2007 periods. for
employed and unemployed persons the rate in Italy did move towards the EU average
when the two periods are compared, for inactive persons however the rate reduced still
further relative to the EU average in the post-2007 period. Tertiary education attainment
remained well below the EU average for both periods. Whilst remaining below the EU
average, the rate of transition for those with no income to one income decile up did
increase during the post-2007 period to close to the EU average.
There was little change between the pre-2007 and post-2007 periods in the relative
position of Italy compared to the EU average in terms of the employment rate of females
with children, Italy closely followed the EU average in this respect. In terms of access to
childcare it is clear that the share of people accessing this for more than 30 hours was
more significant in Italy than the EU average for both the pre-2007 and post-2007
periods. The share of those at risk of poverty before social transfers and those in-work
at-risk-of-poverty remained close to the EU average for both the pre-2007 and post-2007
periods.
0
50
100
150
200
250
Employed persons participating in education and
training
Unemployed persons participating
in education and
training
Inactive persons participating in education and
training
Tertiary educational attainment (15-64)
% of people with no income underwent
transition to 1
income decile up
IT Pre-2007 IT Post-2007 EU27
0
50
100
150
200
250
Female employment rate (aged 20-49
without children)
Female employment rate (aged 20-49
with 1 child less than
6 years old)
Formal childcare, children less than 3 years (1-29 hours)
Formal childcare, children less than 3
years (30+ hours)
Low wage earner unemployment trap
PT employment due to looking after
children or
incapacitated adults
At risk of poverty rate before social
transfers
In-work at-risk-of-poverty
IT Pre-2007 IT Post-2007 EU27
113
Summary: Flexicurity Policy 2007-2010
Since 2007 Italy has not moved into a different flexicurity approach. The Government economic strategy has focused relevant policy on tackling short term issues arising in the
labour market as a result of the financial crisis and economic downturn rather than implementing longer-term measures aimed at achieving a balanced approach to flexicurity. The
Italian approach to flexicurity has not been comprehensively developed and is characterised by insecurity as well as intermediate-to-high levels of taxation. Significant variance in the
labour market between regions has meant that it has not been appropriate for Italy to fit easily into one of the flexicurity pathways identified by the European Commission.
Policies introduced resulted in a high level of segmentation of the labour market, for example during the last decade, more than 40 different typologies of contracts have been
introduced, this has resulted in increased employer flexibility when hiring people. In the other hand the level of employment protection of permanent workers is high. This aspect is
still at the core of the Italian debate because employers’ representatives and trade unions propose divergent evaluations of the effects of this protection. The first suggest that
permanent workers’ excessive employment protection increases the labor market segmentation because it does not allow workers with different typologies of contracts to enter into
the labor market. Conversely, trade unions reply that the flexibility measures introduced in the last decade resulted only in an increasing segmentation and that introducing measures
to reduce employment protection will affect the workers’ rights without increasing the labor market performance. In addition to the duality of the Italian labor market some contractual
arrangements are covered by unemployment benefits, while others not. This situation reinforces the labour market fragmentation between people with secure contracts eligible for
unemployment benefits, and people without employment protection and social security mechanisms.
Regarding lifelong learning and active labour market policies, the most innovative and effective policy is represented by the Inter-professional Funds for continuous training. The Funds are financed on a compulsory basis by the firms via the National Welfare Institute (0.3% of the employee’s gross earnings) and firms have the power to decide the destination of their contributions, as they may flow into one of the 14 Inter-professional Funds bilaterally set up with the social partners. Single initiatives are carried out at the sector and local level by the social partners. However, there remains no integrated lifelong learning strategy in Italy and the implementation of flexicurity related policy can be patchy.
Active labour market policies are also characterised by significant variance between regions and territories, with a significant level of devolution for policy design and implementation to local decision makers. In the absence of a national policy direction, the effectiveness of the implementation of active labour market policy is dependent on the ability of the local labour market actors to identify and respond to the real labour market needs. Hence training still represents one of the fundamental challenges for the Italian labour market.
Since 2007, the role played by the social partners has been controversial in the evolution of implemented policies. On one hand, although policy reforms on the labour market have
been discussed between the government and the social partners, employers’ representatives, trade unions and political parties propose divergent evaluations of the implemented
policies’ effects. This debate caused a high level of conflict among the different stakeholders, which may have represented an important obstacle to the evolution of a more
comprehensive flexicurity approach. On the other hand, several initiatives implemented at regional and local level by the social parts are playing a pivotal role in the implementation
of specific components of the flexicurity, in particular regarding lifelong learning strategies.
Future Challenges
Currently, flexicurity is a prominent component of political debates. The new government has recently introduced labor market reform which according to the government would
introduce a more comprehensive and systematic approach to address the four components of flexicurity. Although this positive effect, the reforms resulted in a very controversial
debate which highlighted the divergent policy perspectives of the social parts.
Overall, a comprehensive flexicurity strategy does not seem to be operational yet. If a proper flexicurity strategy is to be adopted, several changes must be introduced. The main
challenge towards a comprehensive flexicurity approach is represented by the reduction of labour market segmentation through a rebalance of employment protection across
different contractual typologies and an extended coverage of unemployment benefits. The 2012 reform has partially addressed these problems however, it is doubtful that it will
114
tackle effectively both the high level of labor market segmentation and the fragmented system of unemployment benefits, which lacks of universal coverage. These two issues are
deeply related to a more inclusive labor market. In this respect two categories in particular should be supported: women and young persons. According to the data these categories
tend to enter in the labor market through atypical contracts and this may lead them to a sort of “precariousness” trap” (i.e. being hired on a successive atypical employment contracts
that do not lead to a stabilization of the worker position over time).
Another important aspect, which may affect the implementation of national flexicurity-related reforms, is represented by the considerable regional disparities. In this context, the
problems underlying the ongoing debate on Regional disparities between north and south are out of the scope of this study however, the reduction of these disparities may play an
important role mainly in the provision of ALMPs and in the quality of public employment services. In particular, the Inter-professional Funds for continuous training are still a pivotal
policy instrument for increasing training opportunities. However, since these Inter-professional Funds have been implemented at sector level, the resources are mainly directed to
“stronger” firms and employees, while national resources are mainly used to finance “weaker” workers’ training. Hence a more coherent approach to both ALMP and lifelong learning
strategies is needed.
Eventually, a section of the future challenges of the labor market in Italy cannot disregard the reduction of undeclared work, which remains one of the major problems of the Italian
labor market.

115
16 Latvia
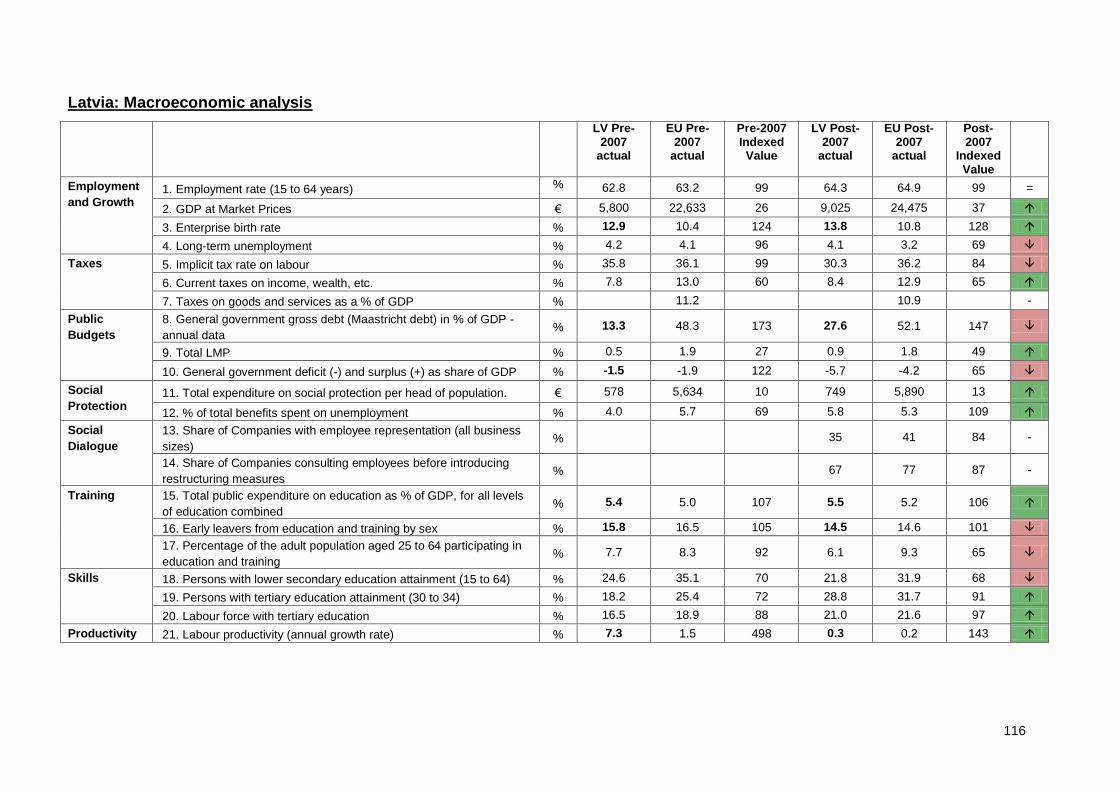
116
Latvia: Macroeconomic analysis
LV Pre-2007
actual
EU Pre-2007
actual
Pre-2007 Indexed Value
LV Post-2007
actual
EU Post-2007
actual
Post-2007
Indexed Value
Employment
and Growth 1. Employment rate (15 to 64 years) % 62.8 63.2 99 64.3 64.9 99 =
2. GDP at Market Prices € 5,800 22,633 26 9,025 24,475 37
3. Enterprise birth rate % 12.9 10.4 124 13.8 10.8 128
4. Long-term unemployment % 4.2 4.1 96 4.1 3.2 69
Taxes 5. Implicit tax rate on labour % 35.8 36.1 99 30.3 36.2 84
6. Current taxes on income, wealth, etc. % 7.8 13.0 60 8.4 12.9 65
7. Taxes on goods and services as a % of GDP % 11.2 10.9 -
Public
Budgets
8. General government gross debt (Maastricht debt) in % of GDP -
annual data % 13.3 48.3 173 27.6 52.1 147
9. Total LMP % 0.5 1.9 27 0.9 1.8 49
10. General government deficit (-) and surplus (+) as share of GDP % -1.5 -1.9 122 -5.7 -4.2 65
Social
Protection 11. Total expenditure on social protection per head of population. € 578 5,634 10 749 5,890 13
12. % of total benefits spent on unemployment % 4.0 5.7 69 5.8 5.3 109
Social
Dialogue
13. Share of Companies with employee representation (all business
sizes) % 35 41 84 -
14. Share of Companies consulting employees before introducing
restructuring measures % 67 77 87 -
Training 15. Total public expenditure on education as % of GDP, for all levels
of education combined % 5.4 5.0 107 5.5 5.2 106
16. Early leavers from education and training by sex % 15.8 16.5 105 14.5 14.6 101
17. Percentage of the adult population aged 25 to 64 participating in
education and training % 7.7 8.3 92 6.1 9.3 65
Skills 18. Persons with lower secondary education attainment (15 to 64) % 24.6 35.1 70 21.8 31.9 68
19. Persons with tertiary education attainment (30 to 34) % 18.2 25.4 72 28.8 31.7 91
20. Labour force with tertiary education % 16.5 18.9 88 21.0 21.6 97
Productivity 21. Labour productivity (annual growth rate) % 7.3 1.5 498 0.3 0.2 143
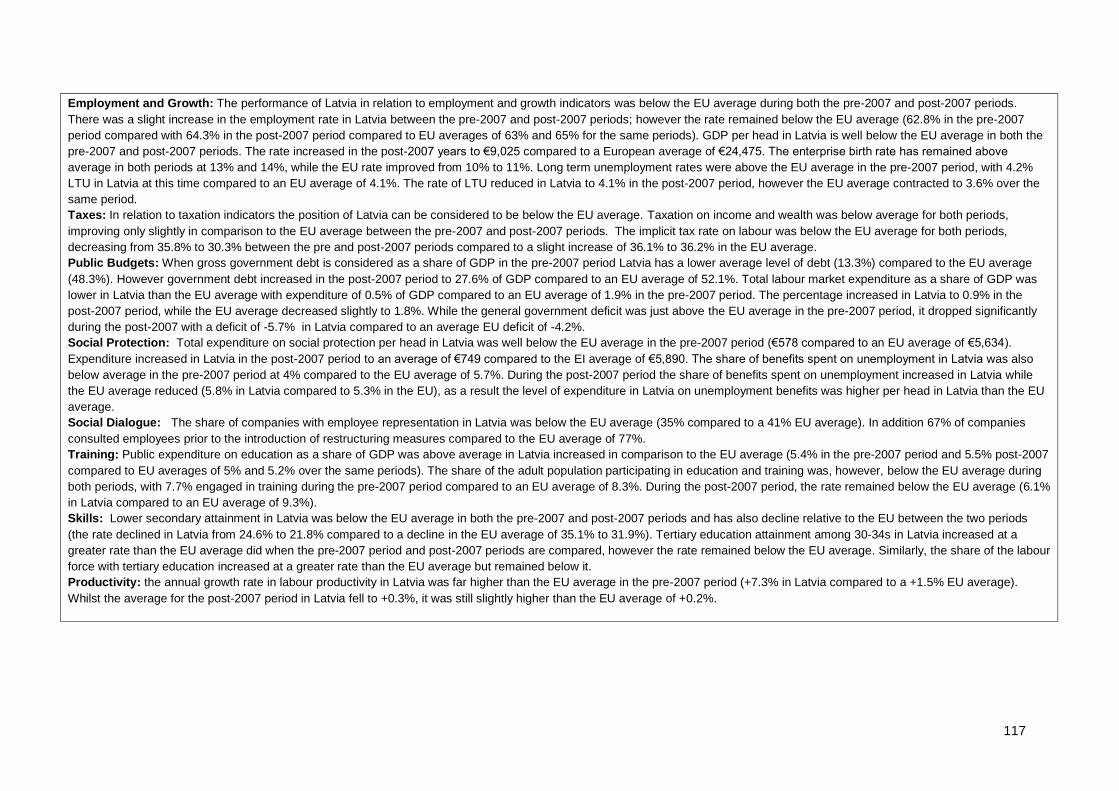
117
Employment and Growth: The performance of Latvia in relation to employment and growth indicators was below the EU average during both the pre-2007 and post-2007 periods.
There was a slight increase in the employment rate in Latvia between the pre-2007 and post-2007 periods; however the rate remained below the EU average (62.8% in the pre-2007
period compared with 64.3% in the post-2007 period compared to EU averages of 63% and 65% for the same periods). GDP per head in Latvia is well below the EU average in both the
pre-2007 and post-2007 periods. The rate increased in the post-2007 years to €9,025 compared to a European average of €24,475. The enterprise birth rate has remained above
average in both periods at 13% and 14%, while the EU rate improved from 10% to 11%. Long term unemployment rates were above the EU average in the pre-2007 period, with 4.2%
LTU in Latvia at this time compared to an EU average of 4.1%. The rate of LTU reduced in Latvia to 4.1% in the post-2007 period, however the EU average contracted to 3.6% over the
same period.
Taxes: In relation to taxation indicators the position of Latvia can be considered to be below the EU average. Taxation on income and wealth was below average for both periods,
improving only slightly in comparison to the EU average between the pre-2007 and post-2007 periods. The implicit tax rate on labour was below the EU average for both periods,
decreasing from 35.8% to 30.3% between the pre and post-2007 periods compared to a slight increase of 36.1% to 36.2% in the EU average.
Public Budgets: When gross government debt is considered as a share of GDP in the pre-2007 period Latvia has a lower average level of debt (13.3%) compared to the EU average
(48.3%). However government debt increased in the post-2007 period to 27.6% of GDP compared to an EU average of 52.1%. Total labour market expenditure as a share of GDP was
lower in Latvia than the EU average with expenditure of 0.5% of GDP compared to an EU average of 1.9% in the pre-2007 period. The percentage increased in Latvia to 0.9% in the
post-2007 period, while the EU average decreased slightly to 1.8%. While the general government deficit was just above the EU average in the pre-2007 period, it dropped significantly
during the post-2007 with a deficit of -5.7% in Latvia compared to an average EU deficit of -4.2%.
Social Protection: Total expenditure on social protection per head in Latvia was well below the EU average in the pre-2007 period (€578 compared to an EU average of €5,634).
Expenditure increased in Latvia in the post-2007 period to an average of €749 compared to the EI average of €5,890. The share of benefits spent on unemployment in Latvia was also
below average in the pre-2007 period at 4% compared to the EU average of 5.7%. During the post-2007 period the share of benefits spent on unemployment increased in Latvia while
the EU average reduced (5.8% in Latvia compared to 5.3% in the EU), as a result the level of expenditure in Latvia on unemployment benefits was higher per head in Latvia than the EU
average.
Social Dialogue: The share of companies with employee representation in Latvia was below the EU average (35% compared to a 41% EU average). In addition 67% of companies
consulted employees prior to the introduction of restructuring measures compared to the EU average of 77%.
Training: Public expenditure on education as a share of GDP was above average in Latvia increased in comparison to the EU average (5.4% in the pre-2007 period and 5.5% post-2007
compared to EU averages of 5% and 5.2% over the same periods). The share of the adult population participating in education and training was, however, below the EU average during
both periods, with 7.7% engaged in training during the pre-2007 period compared to an EU average of 8.3%. During the post-2007 period, the rate remained below the EU average (6.1%
in Latvia compared to an EU average of 9.3%).
Skills: Lower secondary attainment in Latvia was below the EU average in both the pre-2007 and post-2007 periods and has also decline relative to the EU between the two periods
(the rate declined in Latvia from 24.6% to 21.8% compared to a decline in the EU average of 35.1% to 31.9%). Tertiary education attainment among 30-34s in Latvia increased at a
greater rate than the EU average did when the pre-2007 period and post-2007 periods are compared, however the rate remained below the EU average. Similarly, the share of the labour
force with tertiary education increased at a greater rate than the EU average but remained below it.
Productivity: the annual growth rate in labour productivity in Latvia was far higher than the EU average in the pre-2007 period (+7.3% in Latvia compared to a +1.5% EU average).
Whilst the average for the post-2007 period in Latvia fell to +0.3%, it was still slightly higher than the EU average of +0.2%.
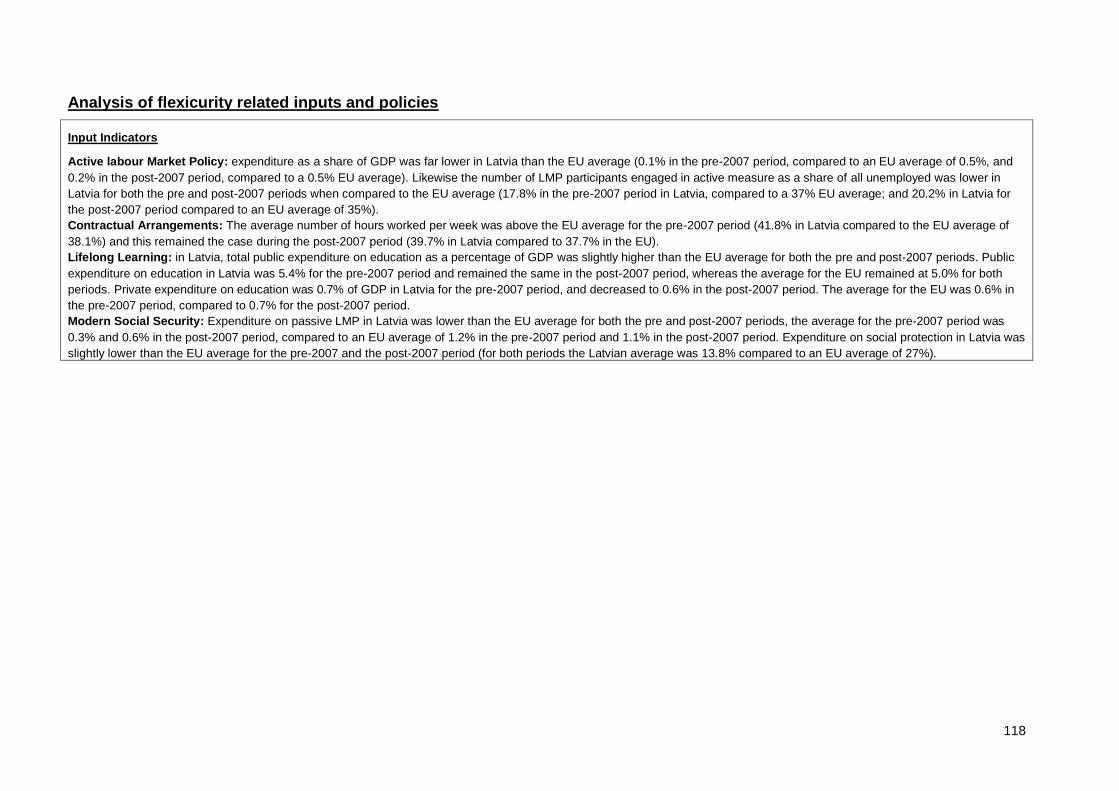
118
Analysis of flexicurity related inputs and policies
Input Indicators
Active labour Market Policy: expenditure as a share of GDP was far lower in Latvia than the EU average (0.1% in the pre-2007 period, compared to an EU average of 0.5%, and
0.2% in the post-2007 period, compared to a 0.5% EU average). Likewise the number of LMP participants engaged in active measure as a share of all unemployed was lower in
Latvia for both the pre and post-2007 periods when compared to the EU average (17.8% in the pre-2007 period in Latvia, compared to a 37% EU average; and 20.2% in Latvia for
the post-2007 period compared to an EU average of 35%).
Contractual Arrangements: The average number of hours worked per week was above the EU average for the pre-2007 period (41.8% in Latvia compared to the EU average of
38.1%) and this remained the case during the post-2007 period (39.7% in Latvia compared to 37.7% in the EU).
Lifelong Learning: in Latvia, total public expenditure on education as a percentage of GDP was slightly higher than the EU average for both the pre and post-2007 periods. Public
expenditure on education in Latvia was 5.4% for the pre-2007 period and remained the same in the post-2007 period, whereas the average for the EU remained at 5.0% for both
periods. Private expenditure on education was 0.7% of GDP in Latvia for the pre-2007 period, and decreased to 0.6% in the post-2007 period. The average for the EU was 0.6% in
the pre-2007 period, compared to 0.7% for the post-2007 period.
Modern Social Security: Expenditure on passive LMP in Latvia was lower than the EU average for both the pre and post-2007 periods, the average for the pre-2007 period was
0.3% and 0.6% in the post-2007 period, compared to an EU average of 1.2% in the pre-2007 period and 1.1% in the post-2007 period. Expenditure on social protection in Latvia was
slightly lower than the EU average for the pre-2007 and the post-2007 period (for both periods the Latvian average was 13.8% compared to an EU average of 27%).
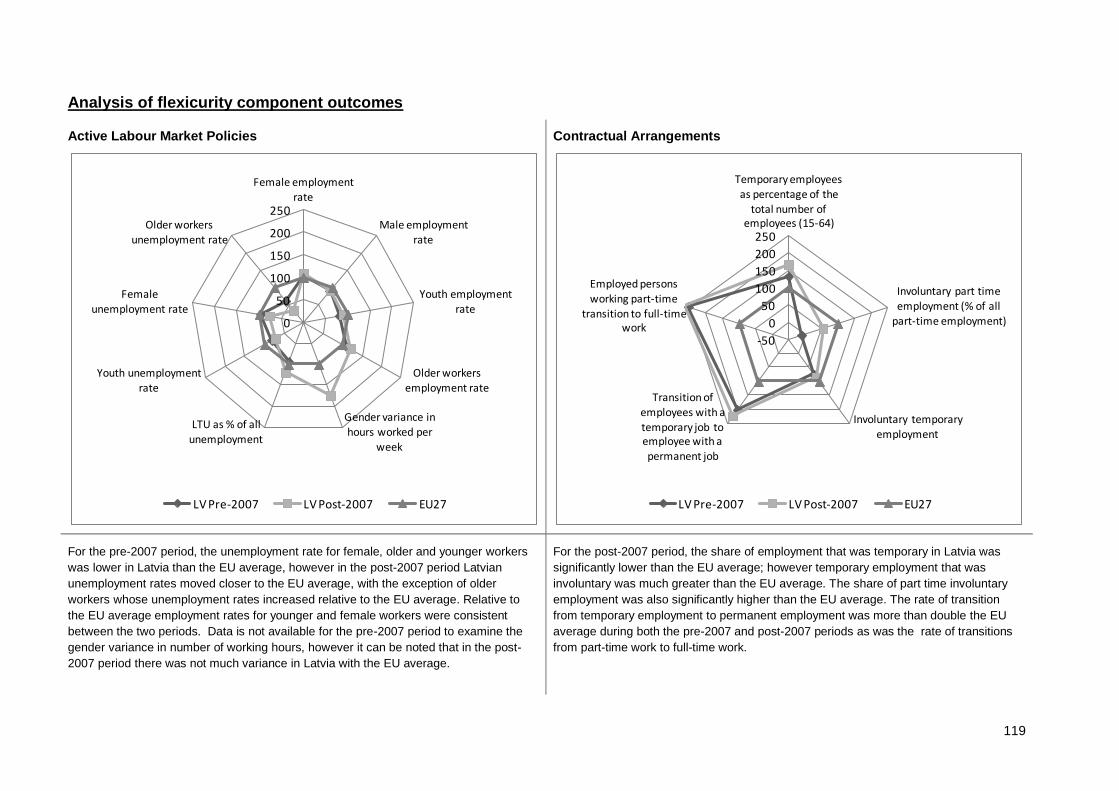
119
Analysis of flexicurity component outcomes
Active Labour Market Policies
Contractual Arrangements
For the pre-2007 period, the unemployment rate for female, older and younger workers
was lower in Latvia than the EU average, however in the post-2007 period Latvian
unemployment rates moved closer to the EU average, with the exception of older
workers whose unemployment rates increased relative to the EU average. Relative to
the EU average employment rates for younger and female workers were consistent
between the two periods. Data is not available for the pre-2007 period to examine the
gender variance in number of working hours, however it can be noted that in the post-
2007 period there was not much variance in Latvia with the EU average.
For the post-2007 period, the share of employment that was temporary in Latvia was
significantly lower than the EU average; however temporary employment that was
involuntary was much greater than the EU average. The share of part time involuntary
employment was also significantly higher than the EU average. The rate of transition
from temporary employment to permanent employment was more than double the EU
average during both the pre-2007 and post-2007 periods as was the rate of transitions
from part-time work to full-time work.
0
50
100
150
200
250
Female employment rate
Male employment rate
Youth employment
rate
Older workers employment rate
Gender variance in hours worked per
week
LTU as % of all unemployment
Youth unemployment rate
Female
unemployment rate
Older workers unemployment rate
LV Pre-2007 LV Post-2007 EU27
-50
0
50
100
150
200
250
Temporary employees as percentage of the
total number of employees (15-64)
Involuntary part time
employment (% of all part-time employment)
Involuntary temporary employment
Transition of employees with a temporary job to employee with a permanent job
Employed persons working part-time
transition to full-time work
LV Pre-2007 LV Post-2007 EU27
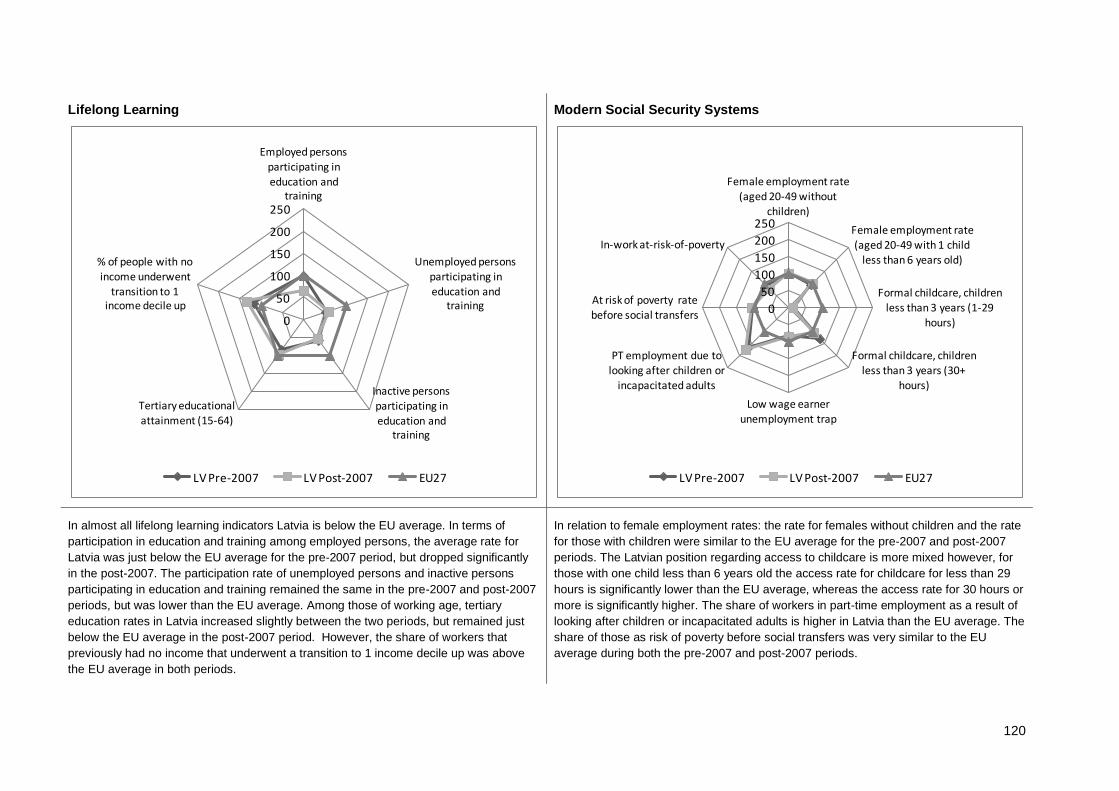
120
Lifelong Learning
Modern Social Security Systems
In almost all lifelong learning indicators Latvia is below the EU average. In terms of
participation in education and training among employed persons, the average rate for
Latvia was just below the EU average for the pre-2007 period, but dropped significantly
in the post-2007. The participation rate of unemployed persons and inactive persons
participating in education and training remained the same in the pre-2007 and post-2007
periods, but was lower than the EU average. Among those of working age, tertiary
education rates in Latvia increased slightly between the two periods, but remained just
below the EU average in the post-2007 period. However, the share of workers that
previously had no income that underwent a transition to 1 income decile up was above
the EU average in both periods.
In relation to female employment rates: the rate for females without children and the rate
for those with children were similar to the EU average for the pre-2007 and post-2007
periods. The Latvian position regarding access to childcare is more mixed however, for
those with one child less than 6 years old the access rate for childcare for less than 29
hours is significantly lower than the EU average, whereas the access rate for 30 hours or
more is significantly higher. The share of workers in part-time employment as a result of
looking after children or incapacitated adults is higher in Latvia than the EU average. The
share of those as risk of poverty before social transfers was very similar to the EU
average during both the pre-2007 and post-2007 periods.
0
50
100
150
200
250
Employed persons participating in
education and training
Unemployed persons participating in education and
training
Inactive persons participating in education and
training
Tertiary educational attainment (15-64)
% of people with no income underwent
transition to 1 income decile up
LV Pre-2007 LV Post-2007 EU27
0
50
100
150
200
250
Female employment rate (aged 20-49 without
children)
Female employment rate
(aged 20-49 with 1 child less than 6 years old)
Formal childcare, children less than 3 years (1-29
hours)
Formal childcare, children less than 3 years (30+
hours)
Low wage earner unemployment trap
PT employment due to looking after children or
incapacitated adults
At risk of poverty rate
before social transfers
In-work at-risk-of-poverty
LV Pre-2007 LV Post-2007 EU27
121
Summary: Flexicurity Policy 2007-2010
Considering the macro-economic analysis presented, Latvia’s position in relation to employment and growth indicators was below the EU average. Employment rates and GDP
remained comparatively low for both the pre-2007 and post-2007 periods, whilst long term unemployment rates were above the EU average in the pre-2007 period but reduced to
closer to the EU average in the post-2007 period. During both periods Latvia had a low level of gross government debt; however, the share of GDP spent on labour market policy
was lower in Latvia than the EU average for both periods. Furthermore spend on social protection per head was far lower than the EU average for both periods, the share of
expenditure which was on unemployment benefits was also below the EU average in both periods. In relation to education, average spending as a share of GDP was just above the
EU average, however while participation rates remain below the EU average.
Looking at the Active Labour Market Policy, the number of LMP participants engaged in active measures as a share of all unemployed was lower in Latvia for both the pre and post-
2007 periods when compared to the EU average. The average number of hours worked per week was above the EU average for both periods. In relation to lifelong learning
indicators, Latvia performs below the EU average; expenditure on passive LMP in Latvia was lower than the EU average for both the pre and post-2007 periods. whilst the female
employment rates for those with and without children are similar to the EU average, the Latvian position regarding access to childcare is more mixed. For those with one child less
than 6 years old the access rate for childcare for less than 29 hours is significantly lower than the EU average, whereas the access rate for 30 hours or more is significantly higher.

122
17 Lithuania
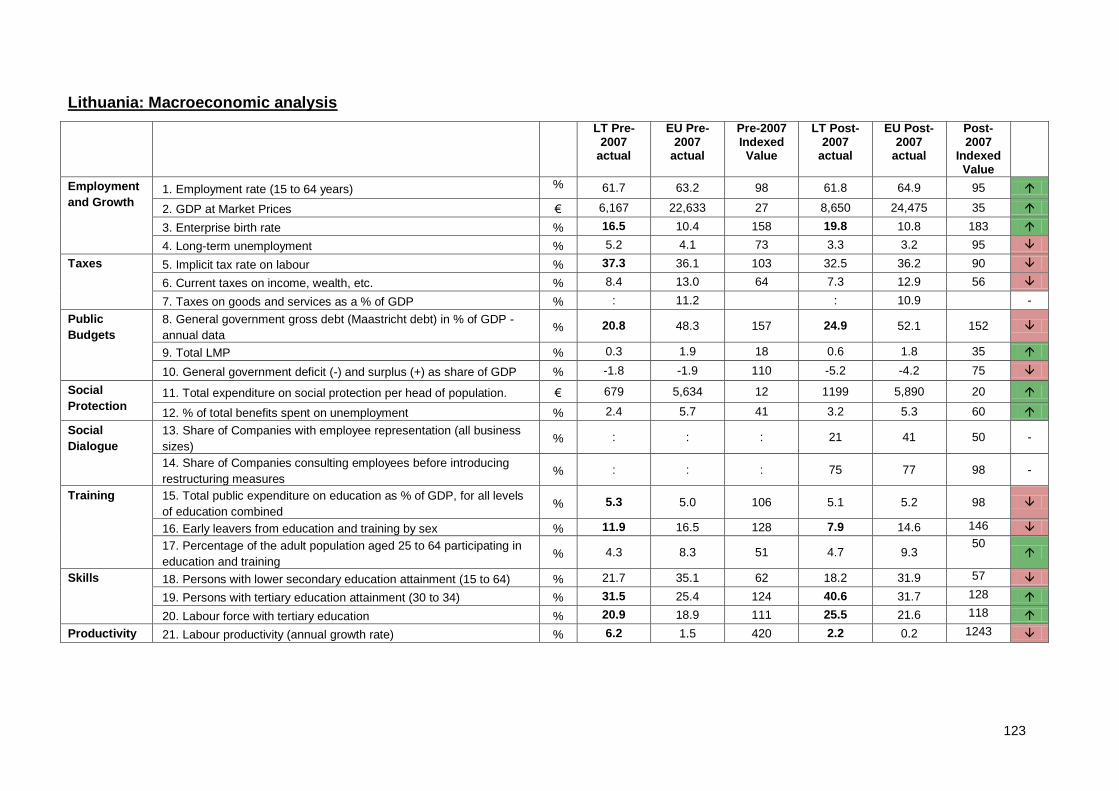
123
Lithuania: Macroeconomic analysis
LT Pre-2007
actual
EU Pre-2007
actual
Pre-2007 Indexed Value
LT Post-2007
actual
EU Post-2007
actual
Post-2007
Indexed Value
Employment
and Growth 1. Employment rate (15 to 64 years) % 61.7 63.2 98 61.8 64.9 95
2. GDP at Market Prices € 6,167 22,633 27 8,650 24,475 35
3. Enterprise birth rate % 16.5 10.4 158 19.8 10.8 183
4. Long-term unemployment % 5.2 4.1 73 3.3 3.2 95
Taxes 5. Implicit tax rate on labour % 37.3 36.1 103 32.5 36.2 90
6. Current taxes on income, wealth, etc. % 8.4 13.0 64 7.3 12.9 56
7. Taxes on goods and services as a % of GDP % : 11.2 : 10.9 -
Public
Budgets
8. General government gross debt (Maastricht debt) in % of GDP -
annual data % 20.8 48.3 157 24.9 52.1 152
9. Total LMP % 0.3 1.9 18 0.6 1.8 35
10. General government deficit (-) and surplus (+) as share of GDP % -1.8 -1.9 110 -5.2 -4.2 75
Social
Protection 11. Total expenditure on social protection per head of population. € 679 5,634 12 1199 5,890 20
12. % of total benefits spent on unemployment % 2.4 5.7 41 3.2 5.3 60
Social
Dialogue
13. Share of Companies with employee representation (all business
sizes) % : : : 21 41 50 -
14. Share of Companies consulting employees before introducing
restructuring measures % : : : 75 77 98 -
Training 15. Total public expenditure on education as % of GDP, for all levels
of education combined % 5.3 5.0 106 5.1 5.2 98
16. Early leavers from education and training by sex % 11.9 16.5 128 7.9 14.6 146
17. Percentage of the adult population aged 25 to 64 participating in
education and training % 4.3 8.3 51 4.7 9.3
50
Skills 18. Persons with lower secondary education attainment (15 to 64) % 21.7 35.1 62 18.2 31.9 57
19. Persons with tertiary education attainment (30 to 34) % 31.5 25.4 124 40.6 31.7 128
20. Labour force with tertiary education % 20.9 18.9 111 25.5 21.6 118
Productivity 21. Labour productivity (annual growth rate) % 6.2 1.5 420 2.2 0.2 1243
124
Employment and Growth: Lithuania scores below average when it comes to employment and growth indicators. The rate of employment has remained consistent in both periods (62%)
compared to an EU average of 63% in the pre-2007 period and 65% in the post-2007 period. Although the GDP rate has increased from €6167 to €8650, it is still significantly lower than
the EU average (€22,633 in the pre-2007 period and €24,475 in the post-2007 period). The enterprise birth rate has remained above average in both periods (16.5% and 10% in the pre-
2007 period and 19.8% and 11% in the post-2007 period). There are slightly higher rates of long term unemployment in Lithuania, with 5.2% LTU pre-2007 compared to 3.3% across
Europe. The Lithuanian rate decreased by the post-2007 period to 3.3% which is almost on par with the EU average (3.3%).
Taxes: Taxation on income and wealth is below average for both periods (8.4% and 7.3% for Lithuania and 13% for the EU across both periods). Implicit tax rate on labour is just above
average for the pre-2007 period (37.3% compared to 32.5%) and has decreased to 32.5% in the post-2007 period, while the EU average increased to 36.2%. There is no data for
Lithuania in relation to taxes on goods and services as a share of GDP. However the EU rate has decreased from 11.2% to 10.9% in the post-2007 period.
Public Budgets: When gross government debt is considered as a share of GDP pre-2007, Lithuania is considered better, with a lower debt of 20.8% compared to 48.3% across the EU.
However this rose to 24.9% in the post-2007 period compared to 52.1% EU average. Total labour market policy is worse in Lithuania than the EU with expenditure of 0.3% of GDP
compared to 1.9% across the EU more broadly. This increased to 0.6% in the post-2007 period, while the EU average decreased slightly to 1.8%. While the general government deficit
was almost the same as the EU average in the pre-2007 period, it dropped significantly by post-2007 with a deficit of 5.2 compared to a deficit of 4.2 across the EU.
Social Protection: Total expenditure on social protection is well below average €679 (compared to €5,634). Expenditure increased in Lithuania in the post-2007 period with an average
expenditure of €1,199 compared to an increase to €5,890 across the EU. The share of benefits spent on unemployment in Lithuania is also below average with 2.4% compared to an EU
average of 5.7%. By the post-2007 period, this had increased to 3.2% in Lithuania while the share of benefits spent on unemployment decreased across the EU (3.2% spent in Lithuania
compared to 5.3% in the EU).
Social Dialogue: The share of companies with employee representation in Lithuania is well below the average (21 compared to 41 across the EU) however 75% of companies in
Lithuania are more likely to consult employees prior to the introduction of restructuring measures compared to an EU average of 77%.
Training: Public expenditure on education as a share of GDP is above average in Lithuania in the pre-2007 period and has decreased in real terms and against the EU average (5.3%
pre 2007 and 5.1% post-2007 – compared to 5% and 5.2% in the EU). The share of the adult population participating in education and training is also below the EU average in both
periods – with 4.3% engaged in training pre-2007 compared to 8.3% of people across the EU. Although the rate in Lithuania increased to 4.7% in the post-2007 period, it still remains
below the EU average (9.3%).
Skills: While lower secondary attainment is below average in both periods and has declined over time (from 21.7% to 18.2% compared to an EU average decline from 35.1% to 31.9%),
tertiary education attainment is above average. In the pre-2007 period, 31.5% of 30-34s had tertiary attainment compared to 25.4% in the EU – with a rise to 40.6% in Lithuania in the
post-2007 period, compared to 31.7% EU average. Similarly, the share of the labour force with tertiary education is above average and has risen in real terms from 20.9% to 25.5%,
however when compared to the EU its position has decreased slightly from an index of 141 to 137.
Productivity: the annual growth rate in productivity is above average pre-2007 at 6.2% compared to 1.5% across the EU. However the average for the post-2007 period in Lithuania was
a growth of 2.2% compared to slight growth of 0.2% across the EU.
125
Analysis of flexicurity related inputs and policies
Input Indicators
Active labour Market Policy: expenditure as a share of GDP is far lower in Lithuania than the EU average in both periods (0.2% compared to an EU average of 0.5). The number
of LMP participants engaged in active measure as a share of all unemployed was higher in Lithuania for both the pre and post-2007 periods when compared to the EU average
(41.3% in the pre-2007 period in Lithuania, compared to a 37% EU average; and 36.3% in Lithuania for the post-2007 period compared to an EU average of 35%).
Contractual Arrangements: Lithuania is characterised by weak Employment Protection Legislation for both standard and temporary workers. Lithuania scored 0.0% for the pre-
2007 and post 2007 periods for EPL strictness for Standard Workers compared to an EU average of 2.1. No data was available for temporary workers, but the EU scored 1.8%.
The average number of hours worked per week in Lithuania was the same as the EU average for the pre-2007 and post-2007period (38.2% in Lithuania, compared to 38.1% in the
EU) and this remained the case for the post-2007 period (38.7% in Lithuania, compared to 37.7% in the EU).
Lifelong Learning: in Lithuania total public expenditure on education as a percentage of GDP was slightly higher than the EU average in the pre-2007 period (5.4% compared to an
EU average of 5.0%). Lithuanian public expenditure in the post-2007 period decreased to 4.8%, whereas the EU average remained the same. Private expenditure on education for
both periods was 0.5%. The average for the EU was 0.6% in the pre-2007 period, compared to 0.7% for the post-2007 period.
Modern Social Security: Expenditure on passive LMP in Lithuania was lower than the EU average for both the pre and post-2007 periods, the average for the pre-2007 period and
the post-2007 period in Lithuania was 0.13%, compared to an EU average of 1.2% in the pre-2007 period and 0.29% in the post-2007 period. Expenditure on social protection in
Lithuania was slightly lower than the EU average for the pre-2007 and the post-2007 period (for both periods the Lithuanian average was 15.6% compared to an EU average of
27%).
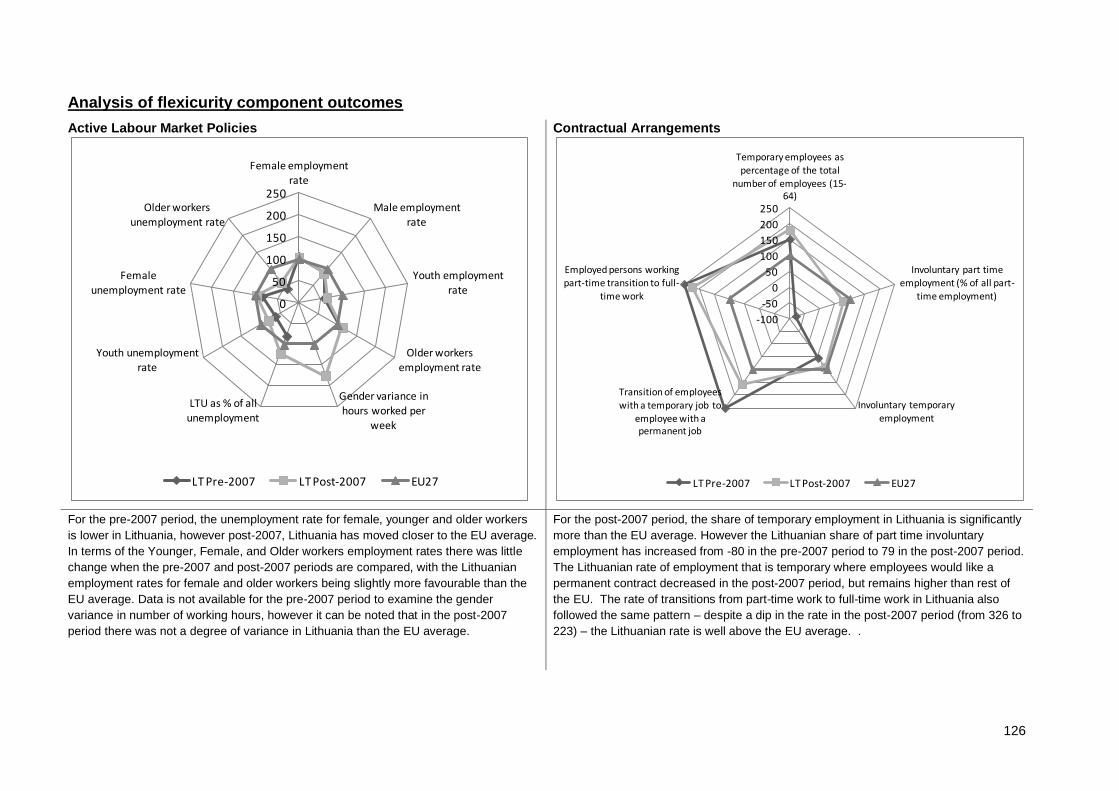
126
Analysis of flexicurity component outcomes
Active Labour Market Policies
Contractual Arrangements
For the pre-2007 period, the unemployment rate for female, younger and older workers
is lower in Lithuania, however post-2007, Lithuania has moved closer to the EU average.
In terms of the Younger, Female, and Older workers employment rates there was little
change when the pre-2007 and post-2007 periods are compared, with the Lithuanian
employment rates for female and older workers being slightly more favourable than the
EU average. Data is not available for the pre-2007 period to examine the gender
variance in number of working hours, however it can be noted that in the post-2007
period there was not a degree of variance in Lithuania than the EU average.
For the post-2007 period, the share of temporary employment in Lithuania is significantly
more than the EU average. However the Lithuanian share of part time involuntary
employment has increased from -80 in the pre-2007 period to 79 in the post-2007 period.
The Lithuanian rate of employment that is temporary where employees would like a
permanent contract decreased in the post-2007 period, but remains higher than rest of
the EU. The rate of transitions from part-time work to full-time work in Lithuania also
followed the same pattern – despite a dip in the rate in the post-2007 period (from 326 to
223) – the Lithuanian rate is well above the EU average. .
0
50
100
150
200
250
Female employment rate
Male employment rate
Youth employment
rate
Older workers employment rate
Gender variance in hours worked per
week
LTU as % of all unemployment
Youth unemployment rate
Female
unemployment rate
Older workers unemployment rate
LT Pre-2007 LT Post-2007 EU27
-100
-50
0
50
100
150
200
250
Temporary employees as percentage of the total
number of employees (15-64)
Involuntary part time employment (% of all part-
time employment)
Involuntary temporary employment
Transition of employees with a temporary job to
employee with a permanent job
Employed persons working part-time transition to full-
time work
LT Pre-2007 LT Post-2007 EU27
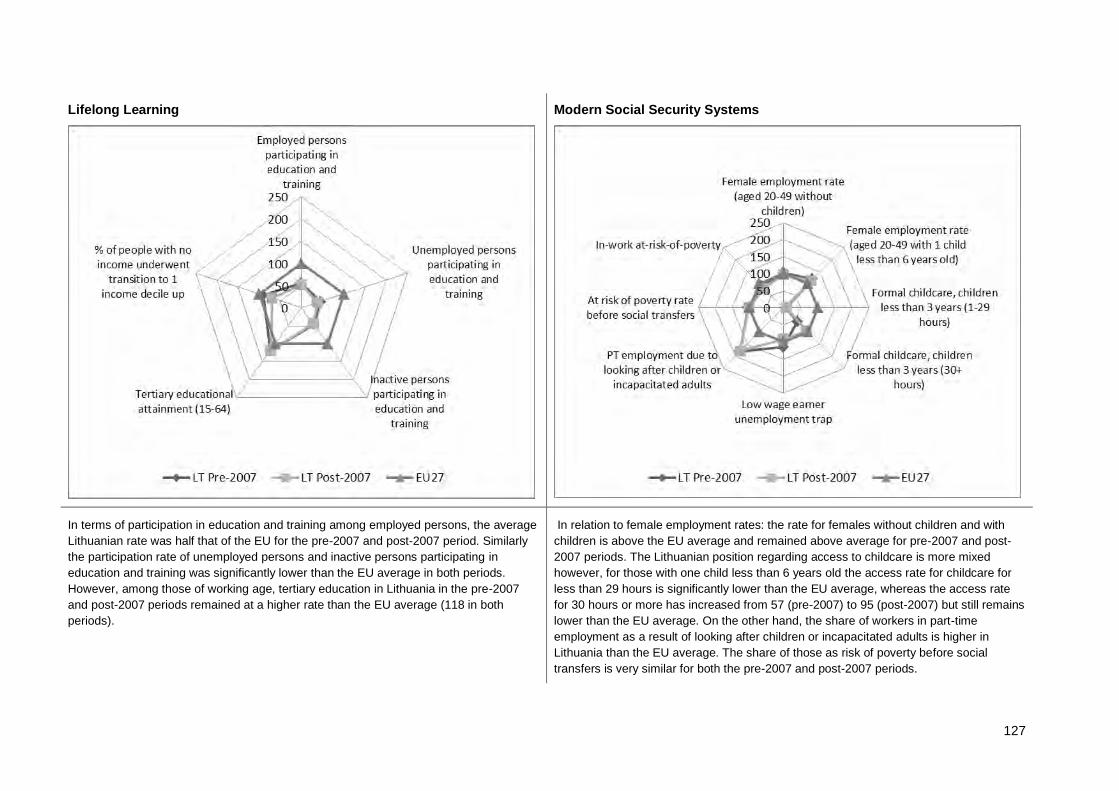
127
Lifelong Learning
Modern Social Security Systems
In terms of participation in education and training among employed persons, the average
Lithuanian rate was half that of the EU for the pre-2007 and post-2007 period. Similarly
the participation rate of unemployed persons and inactive persons participating in
education and training was significantly lower than the EU average in both periods.
However, among those of working age, tertiary education in Lithuania in the pre-2007
and post-2007 periods remained at a higher rate than the EU average (118 in both
periods).
In relation to female employment rates: the rate for females without children and with
children is above the EU average and remained above average for pre-2007 and post-
2007 periods. The Lithuanian position regarding access to childcare is more mixed
however, for those with one child less than 6 years old the access rate for childcare for
less than 29 hours is significantly lower than the EU average, whereas the access rate
for 30 hours or more has increased from 57 (pre-2007) to 95 (post-2007) but still remains
lower than the EU average. On the other hand, the share of workers in part-time
employment as a result of looking after children or incapacitated adults is higher in
Lithuania than the EU average. The share of those as risk of poverty before social
transfers is very similar for both the pre-2007 and post-2007 periods.
128
Summary: Flexicurity Policy 2007-2010
When it came to macro-level analysis, Lithuania scores below average in relation to employment and growth indicators. Although the rate of employment has remained consistent in
both and the GDP rate has increased – both still remain below the EU average. Taxation on income and wealth is below average for both periods as is the implicit tax rate on labour.
Lithuania positively has low levels of debt compared to its EU counterparts, but at the same time does not have good total labour market policy. Furthermore, spending on social
protection is extremely low as is the share of benefits spent on unemployment. Although expenditure on education is just above the EU level, participation among adults remains
low. Furthermore, in Lithuania there has been a decline in lower secondary attainment, whereas tertiary education attainment has increased.
In relation to active labour market policy, the number of LMP participants engaged in active measure as a share of all unemployed was higher in Lithuania for both the pre and post-
2007 periods when compared to the EU average. While the unemployment rate for female, younger and older workers is lower in Lithuania, by the post-2007, this had moved closer
to the EU average. In terms of the Younger, Female, and Older workers employment rates there was little change when the pre-2007 and post-2007 periods are compared, with the
Lithuanian employment rates for female and older workers being slightly more favourable than the EU average.
Lithuania is characterised by weak Employment Protection Legislation for both standard and temporary workers and the average number of hours worked per week in Lithuania was
the same as the EU average for the pre-2007 and post-2007 period. In terms of participation in education and training among employed persons, unemployed persons and inactive
persons, the average Lithuanian rate less that of the EU average for the pre-2007 and post-2007 period. However, among those of working age, tertiary education in the Lithuania in
the pre-2007 and post-2007 periods remained at a higher rate than the EU average.
With regards to modern social security systems, expenditure on passive LMP in Lithuania was lower than the EU average for both the pre and post-2007 periods as was the spend
on social protection. In terms of female employment, the rate for females without children and with children is above the EU average and remained above average for pre-2007 and
post-2007 periods. However, the Lithuanian position regarding access to childcare is more mixed. Those with one child less than 6 years old the access rate for childcare for less
than 29 hours is significantly lower than the EU average, whereas the access rate for 30 hours or more has increased from 57 (pre-2007) to 95 (post-2007) but still remains lower
than the EU average.

129
18 Luxembourg
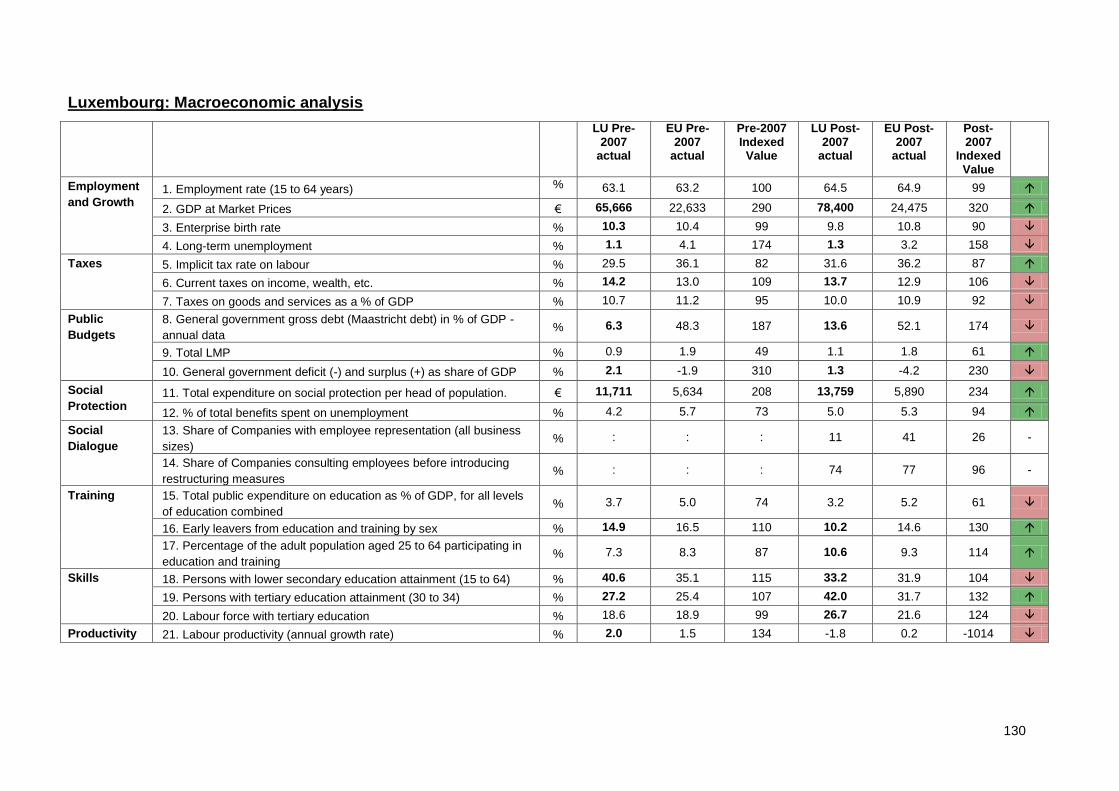
130
Luxembourg: Macroeconomic analysis
LU Pre-2007
actual
EU Pre-2007
actual
Pre-2007 Indexed Value
LU Post-2007
actual
EU Post-2007
actual
Post-2007
Indexed Value
Employment
and Growth 1. Employment rate (15 to 64 years) % 63.1 63.2 100 64.5 64.9 99
2. GDP at Market Prices € 65,666 22,633 290 78,400 24,475 320
3. Enterprise birth rate % 10.3 10.4 99 9.8 10.8 90
4. Long-term unemployment % 1.1 4.1 174 1.3 3.2 158
Taxes 5. Implicit tax rate on labour % 29.5 36.1 82 31.6 36.2 87
6. Current taxes on income, wealth, etc. % 14.2 13.0 109 13.7 12.9 106
7. Taxes on goods and services as a % of GDP % 10.7 11.2 95 10.0 10.9 92
Public
Budgets
8. General government gross debt (Maastricht debt) in % of GDP -
annual data % 6.3 48.3 187 13.6 52.1 174
9. Total LMP % 0.9 1.9 49 1.1 1.8 61
10. General government deficit (-) and surplus (+) as share of GDP % 2.1 -1.9 310 1.3 -4.2 230
Social
Protection 11. Total expenditure on social protection per head of population. € 11,711 5,634 208 13,759 5,890 234
12. % of total benefits spent on unemployment % 4.2 5.7 73 5.0 5.3 94
Social
Dialogue
13. Share of Companies with employee representation (all business
sizes) % : : : 11 41 26 -
14. Share of Companies consulting employees before introducing
restructuring measures % : : : 74 77 96 -
Training 15. Total public expenditure on education as % of GDP, for all levels
of education combined % 3.7 5.0 74 3.2 5.2 61
16. Early leavers from education and training by sex % 14.9 16.5 110 10.2 14.6 130
17. Percentage of the adult population aged 25 to 64 participating in
education and training % 7.3 8.3 87 10.6 9.3 114
Skills 18. Persons with lower secondary education attainment (15 to 64) % 40.6 35.1 115 33.2 31.9 104
19. Persons with tertiary education attainment (30 to 34) % 27.2 25.4 107 42.0 31.7 132
20. Labour force with tertiary education % 18.6 18.9 99 26.7 21.6 124
Productivity 21. Labour productivity (annual growth rate) % 2.0 1.5 134 -1.8 0.2 -1014
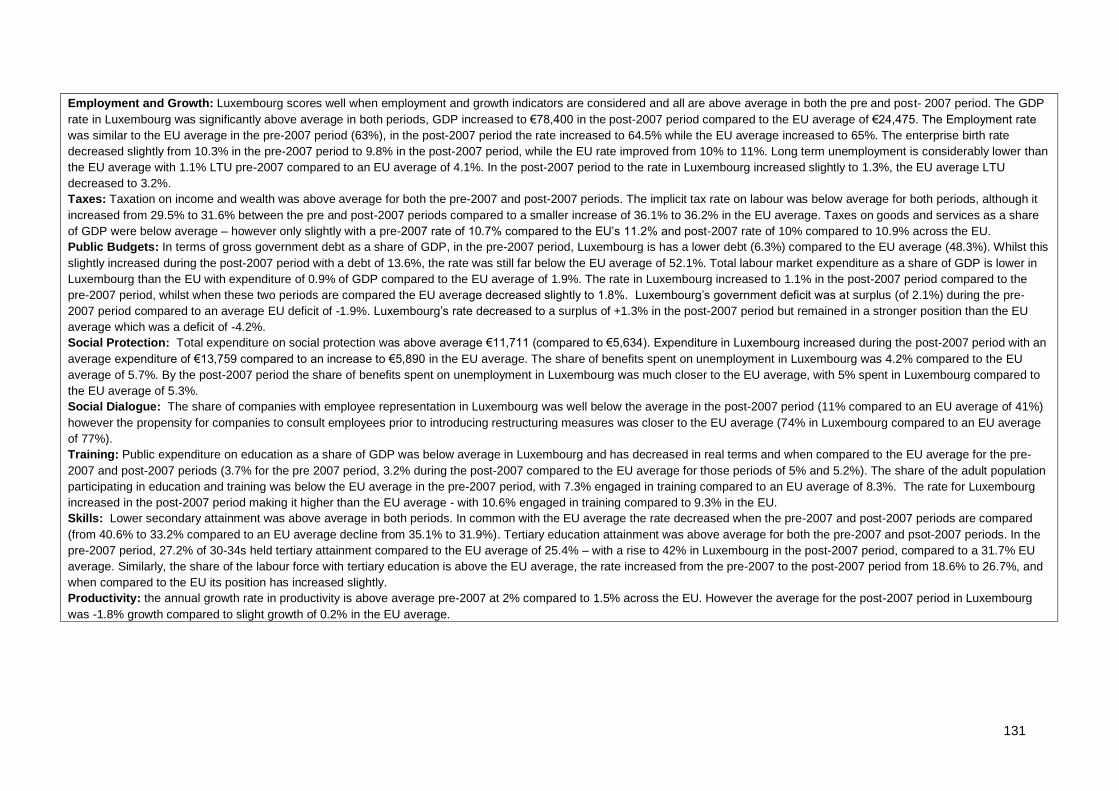
131
Employment and Growth: Luxembourg scores well when employment and growth indicators are considered and all are above average in both the pre and post- 2007 period. The GDP
rate in Luxembourg was significantly above average in both periods, GDP increased to €78,400 in the post-2007 period compared to the EU average of €24,475. The Employment rate
was similar to the EU average in the pre-2007 period (63%), in the post-2007 period the rate increased to 64.5% while the EU average increased to 65%. The enterprise birth rate
decreased slightly from 10.3% in the pre-2007 period to 9.8% in the post-2007 period, while the EU rate improved from 10% to 11%. Long term unemployment is considerably lower than
the EU average with 1.1% LTU pre-2007 compared to an EU average of 4.1%. In the post-2007 period to the rate in Luxembourg increased slightly to 1.3%, the EU average LTU
decreased to 3.2%.
Taxes: Taxation on income and wealth was above average for both the pre-2007 and post-2007 periods. The implicit tax rate on labour was below average for both periods, although it
increased from 29.5% to 31.6% between the pre and post-2007 periods compared to a smaller increase of 36.1% to 36.2% in the EU average. Taxes on goods and services as a share
of GDP were below average – however only slightly with a pre-2007 rate of 10.7% compared to the EU’s 11.2% and post-2007 rate of 10% compared to 10.9% across the EU.
Public Budgets: In terms of gross government debt as a share of GDP, in the pre-2007 period, Luxembourg is has a lower debt (6.3%) compared to the EU average (48.3%). Whilst this
slightly increased during the post-2007 period with a debt of 13.6%, the rate was still far below the EU average of 52.1%. Total labour market expenditure as a share of GDP is lower in
Luxembourg than the EU with expenditure of 0.9% of GDP compared to the EU average of 1.9%. The rate in Luxembourg increased to 1.1% in the post-2007 period compared to the
pre-2007 period, whilst when these two periods are compared the EU average decreased slightly to 1.8%. Luxembourg’s government deficit was at surplus (of 2.1%) during the pre-
2007 period compared to an average EU deficit of -1.9%. Luxembourg’s rate decreased to a surplus of +1.3% in the post-2007 period but remained in a stronger position than the EU
average which was a deficit of -4.2%.
Social Protection: Total expenditure on social protection was above average €11,711 (compared to €5,634). Expenditure in Luxembourg increased during the post-2007 period with an
average expenditure of €13,759 compared to an increase to €5,890 in the EU average. The share of benefits spent on unemployment in Luxembourg was 4.2% compared to the EU
average of 5.7%. By the post-2007 period the share of benefits spent on unemployment in Luxembourg was much closer to the EU average, with 5% spent in Luxembourg compared to
the EU average of 5.3%.
Social Dialogue: The share of companies with employee representation in Luxembourg was well below the average in the post-2007 period (11% compared to an EU average of 41%)
however the propensity for companies to consult employees prior to introducing restructuring measures was closer to the EU average (74% in Luxembourg compared to an EU average
of 77%).
Training: Public expenditure on education as a share of GDP was below average in Luxembourg and has decreased in real terms and when compared to the EU average for the pre-
2007 and post-2007 periods (3.7% for the pre 2007 period, 3.2% during the post-2007 compared to the EU average for those periods of 5% and 5.2%). The share of the adult population
participating in education and training was below the EU average in the pre-2007 period, with 7.3% engaged in training compared to an EU average of 8.3%. The rate for Luxembourg
increased in the post-2007 period making it higher than the EU average - with 10.6% engaged in training compared to 9.3% in the EU.
Skills: Lower secondary attainment was above average in both periods. In common with the EU average the rate decreased when the pre-2007 and post-2007 periods are compared
(from 40.6% to 33.2% compared to an EU average decline from 35.1% to 31.9%). Tertiary education attainment was above average for both the pre-2007 and psot-2007 periods. In the
pre-2007 period, 27.2% of 30-34s held tertiary attainment compared to the EU average of 25.4% – with a rise to 42% in Luxembourg in the post-2007 period, compared to a 31.7% EU
average. Similarly, the share of the labour force with tertiary education is above the EU average, the rate increased from the pre-2007 to the post-2007 period from 18.6% to 26.7%, and
when compared to the EU its position has increased slightly.
Productivity: the annual growth rate in productivity is above average pre-2007 at 2% compared to 1.5% across the EU. However the average for the post-2007 period in Luxembourg
was -1.8% growth compared to slight growth of 0.2% in the EU average.
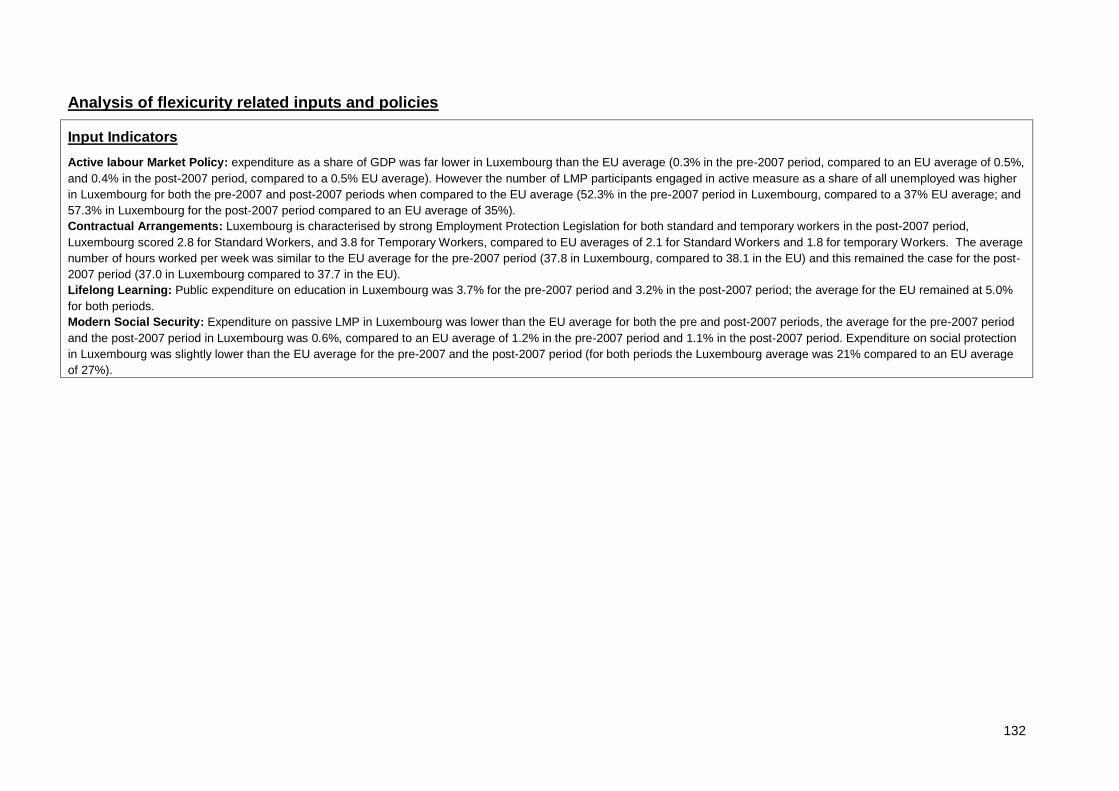
132
Analysis of flexicurity related inputs and policies
Input Indicators
Active labour Market Policy: expenditure as a share of GDP was far lower in Luxembourg than the EU average (0.3% in the pre-2007 period, compared to an EU average of 0.5%,
and 0.4% in the post-2007 period, compared to a 0.5% EU average). However the number of LMP participants engaged in active measure as a share of all unemployed was higher
in Luxembourg for both the pre-2007 and post-2007 periods when compared to the EU average (52.3% in the pre-2007 period in Luxembourg, compared to a 37% EU average; and
57.3% in Luxembourg for the post-2007 period compared to an EU average of 35%).
Contractual Arrangements: Luxembourg is characterised by strong Employment Protection Legislation for both standard and temporary workers in the post-2007 period,
Luxembourg scored 2.8 for Standard Workers, and 3.8 for Temporary Workers, compared to EU averages of 2.1 for Standard Workers and 1.8 for temporary Workers. The average
number of hours worked per week was similar to the EU average for the pre-2007 period (37.8 in Luxembourg, compared to 38.1 in the EU) and this remained the case for the post-
2007 period (37.0 in Luxembourg compared to 37.7 in the EU).
Lifelong Learning: Public expenditure on education in Luxembourg was 3.7% for the pre-2007 period and 3.2% in the post-2007 period; the average for the EU remained at 5.0%
for both periods.
Modern Social Security: Expenditure on passive LMP in Luxembourg was lower than the EU average for both the pre and post-2007 periods, the average for the pre-2007 period
and the post-2007 period in Luxembourg was 0.6%, compared to an EU average of 1.2% in the pre-2007 period and 1.1% in the post-2007 period. Expenditure on social protection
in Luxembourg was slightly lower than the EU average for the pre-2007 and the post-2007 period (for both periods the Luxembourg average was 21% compared to an EU average
of 27%).
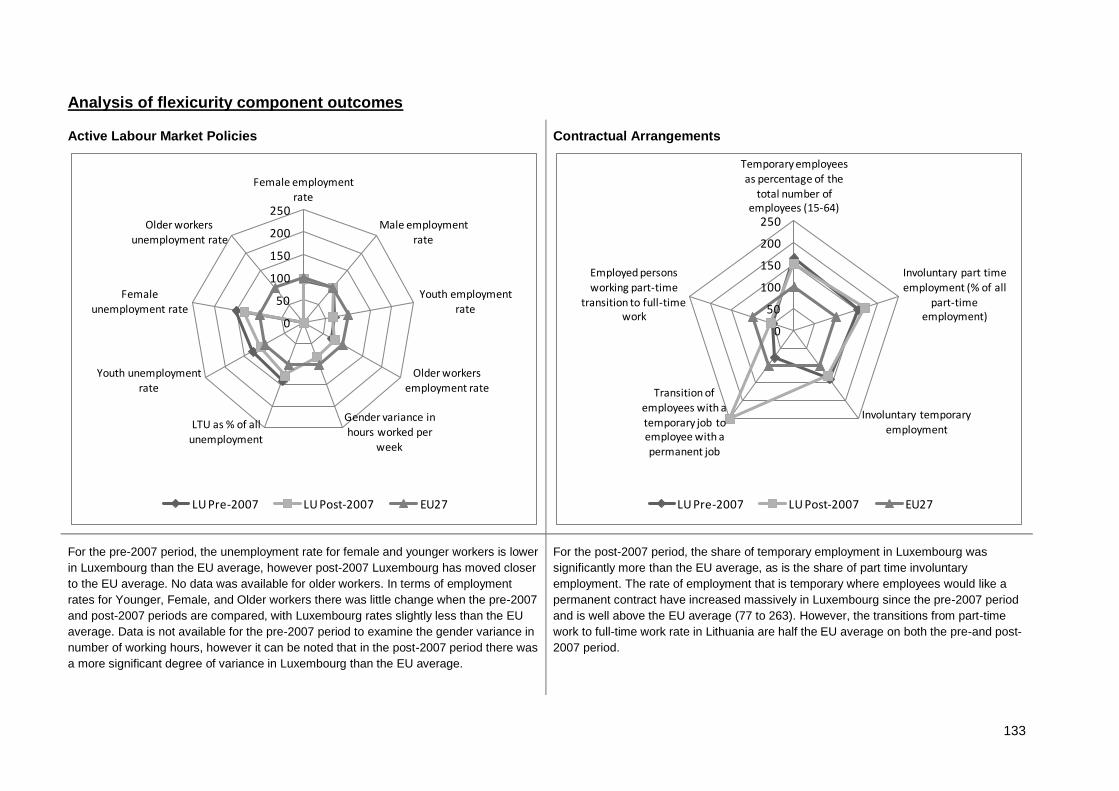
133
Analysis of flexicurity component outcomes
Active Labour Market Policies
Contractual Arrangements
For the pre-2007 period, the unemployment rate for female and younger workers is lower
in Luxembourg than the EU average, however post-2007 Luxembourg has moved closer
to the EU average. No data was available for older workers. In terms of employment
rates for Younger, Female, and Older workers there was little change when the pre-2007
and post-2007 periods are compared, with Luxembourg rates slightly less than the EU
average. Data is not available for the pre-2007 period to examine the gender variance in
number of working hours, however it can be noted that in the post-2007 period there was
a more significant degree of variance in Luxembourg than the EU average.
For the post-2007 period, the share of temporary employment in Luxembourg was
significantly more than the EU average, as is the share of part time involuntary
employment. The rate of employment that is temporary where employees would like a
permanent contract have increased massively in Luxembourg since the pre-2007 period
and is well above the EU average (77 to 263). However, the transitions from part-time
work to full-time work rate in Lithuania are half the EU average on both the pre-and post-
2007 period.
0
50
100
150
200
250
Female employment rate
Male employment rate
Youth employment
rate
Older workers employment rate
Gender variance in hours worked per
week
LTU as % of all unemployment
Youth unemployment rate
Female
unemployment rate
Older workers unemployment rate
LU Pre-2007 LU Post-2007 EU27
0
50
100
150
200
250
Temporary employees as percentage of the
total number of employees (15-64)
Involuntary part time employment (% of all
part-time employment)
Involuntary temporary employment
Transition of employees with a
temporary job to employee with a permanent job
Employed persons working part-time
transition to full-time work
LU Pre-2007 LU Post-2007 EU27
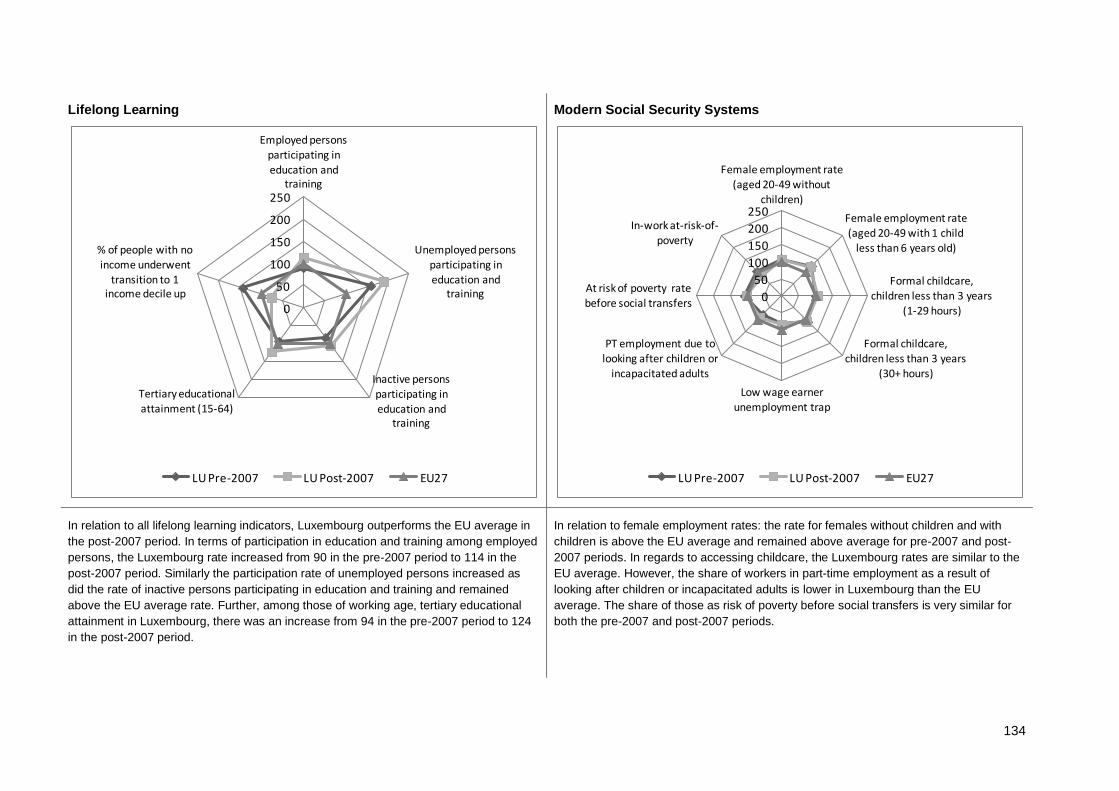
134
Lifelong Learning
Modern Social Security Systems
In relation to all lifelong learning indicators, Luxembourg outperforms the EU average in
the post-2007 period. In terms of participation in education and training among employed
persons, the Luxembourg rate increased from 90 in the pre-2007 period to 114 in the
post-2007 period. Similarly the participation rate of unemployed persons increased as
did the rate of inactive persons participating in education and training and remained
above the EU average rate. Further, among those of working age, tertiary educational
attainment in Luxembourg, there was an increase from 94 in the pre-2007 period to 124
in the post-2007 period.
In relation to female employment rates: the rate for females without children and with
children is above the EU average and remained above average for pre-2007 and post-
2007 periods. In regards to accessing childcare, the Luxembourg rates are similar to the
EU average. However, the share of workers in part-time employment as a result of
looking after children or incapacitated adults is lower in Luxembourg than the EU
average. The share of those as risk of poverty before social transfers is very similar for
both the pre-2007 and post-2007 periods.
0
50
100
150
200
250
Employed persons participating in
education and training
Unemployed persons participating in education and
training
Inactive persons participating in education and
training
Tertiary educational attainment (15-64)
% of people with no income underwent
transition to 1 income decile up
LU Pre-2007 LU Post-2007 EU27
0
50
100
150
200
250
Female employment rate (aged 20-49 without
children)
Female employment rate
(aged 20-49 with 1 child less than 6 years old)
Formal childcare, children less than 3 years
(1-29 hours)
Formal childcare, children less than 3 years
(30+ hours)
Low wage earner unemployment trap
PT employment due to looking after children or
incapacitated adults
At risk of poverty rate
before social transfers
In-work at-risk-of-poverty
LU Pre-2007 LU Post-2007 EU27
135
Summary: Flexicurity Policy 2007-2010
The macro-economic position of Luxembourg scores is very positive. This position has not altered when the pre-2007 and post-2007 periods are compared. In relation to
employment and growth indicators, Luxembourg performs well above the EU average for both periods. For example, the GDP rate in Luxembourg is significantly above average in
both periods and continued to into the post-2007 period as did the high employment rate. Furthermore, long term unemployment rates were considerably lower than the EU average.
There is a mixed picture on taxes, where taxation on income and wealth is above average, while implicit tax on labour and tax on goods and services as a share on GDP are below
average. Encouragingly, Luxembourg has extremely low levels of debt and social protection spend is well above the EU average. However, the total labour market policy
expenditure, expressed as a share of GDP remained lower than the EU average in both the pre-2007 an post-2007 periods and the share of benefits spent on unemployment in
Luxembourg is below average. Public expenditure on education as a share of GDP is also below average and has declined when the two periods are compared. Moreover, the
share of the adult population participating in education and training is also below the EU average.
In terms of Active labour Market Policy, the number of LMP participants engaged in active measure as a share of all unemployed was higher in Luxembourg for both the pre and
post-2007 periods when compared to the EU average. There has also been a contraction in the unemployment rates for female and younger workers which have closed towards the
EU average. In relation to contractual arrangements, Luxembourg is characterised by strong Employment Protection Legislation for both standard and temporary workers and the
average number of hours worked per week was almost level with the EU average for the pre-2007 period and increased slightly in the post-2007 period. In relation to all lifelong
learning indicators, Luxembourg outperforms the EU average in the post-2007 period. However, spend on passive LMP and social protection in Luxembourg was lower than the EU
average for both the pre and post-2007 periods. The rate of female employment with and without children remained above average for both periods and in relation to accessing
childcare, the Luxembourg rates are similar to the EU average.

136
19 Malta
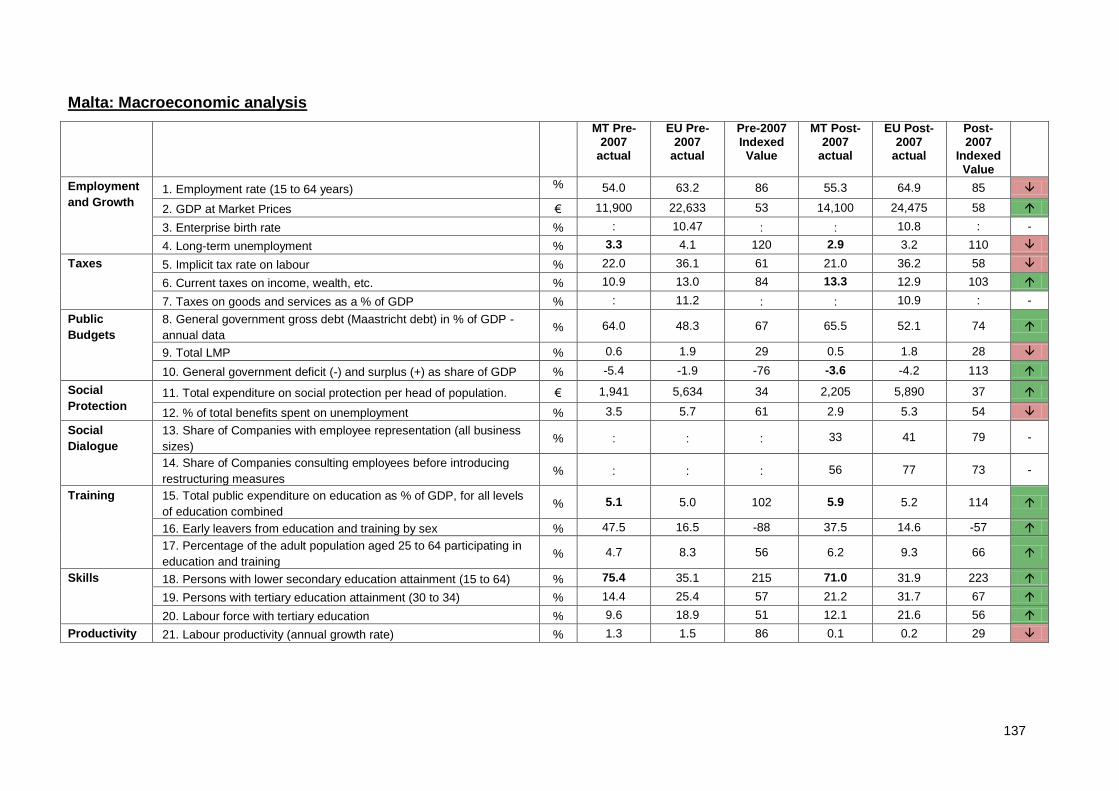
137
Malta: Macroeconomic analysis
MT Pre-2007
actual
EU Pre-2007
actual
Pre-2007 Indexed Value
MT Post-2007
actual
EU Post-2007
actual
Post-2007
Indexed Value
Employment
and Growth 1. Employment rate (15 to 64 years) % 54.0 63.2 86 55.3 64.9 85
2. GDP at Market Prices € 11,900 22,633 53 14,100 24,475 58
3. Enterprise birth rate % : 10.47 : : 10.8 : -
4. Long-term unemployment % 3.3 4.1 120 2.9 3.2 110
Taxes 5. Implicit tax rate on labour % 22.0 36.1 61 21.0 36.2 58
6. Current taxes on income, wealth, etc. % 10.9 13.0 84 13.3 12.9 103
7. Taxes on goods and services as a % of GDP % : 11.2 : : 10.9 : -
Public
Budgets
8. General government gross debt (Maastricht debt) in % of GDP -
annual data % 64.0 48.3 67 65.5 52.1 74
9. Total LMP % 0.6 1.9 29 0.5 1.8 28
10. General government deficit (-) and surplus (+) as share of GDP % -5.4 -1.9 -76 -3.6 -4.2 113
Social
Protection 11. Total expenditure on social protection per head of population. € 1,941 5,634 34 2,205 5,890 37
12. % of total benefits spent on unemployment % 3.5 5.7 61 2.9 5.3 54
Social
Dialogue
13. Share of Companies with employee representation (all business
sizes) % : : : 33 41 79 -
14. Share of Companies consulting employees before introducing
restructuring measures % : : : 56 77 73 -
Training 15. Total public expenditure on education as % of GDP, for all levels
of education combined % 5.1 5.0 102 5.9 5.2 114
16. Early leavers from education and training by sex % 47.5 16.5 -88 37.5 14.6 -57
17. Percentage of the adult population aged 25 to 64 participating in
education and training % 4.7 8.3 56 6.2 9.3 66
Skills 18. Persons with lower secondary education attainment (15 to 64) % 75.4 35.1 215 71.0 31.9 223
19. Persons with tertiary education attainment (30 to 34) % 14.4 25.4 57 21.2 31.7 67
20. Labour force with tertiary education % 9.6 18.9 51 12.1 21.6 56
Productivity 21. Labour productivity (annual growth rate) % 1.3 1.5 86 0.1 0.2 29
138
Employment and Growth: The employment rate for Malta was below the EU average during both the pre-2007 and post-2007 periods. The rate increased in the post-2007 period when
compared with the pre-2007 period (from 54% to 55%), while the EU average increased from 63% to 65% over the same period. From the pre-2007 period to the post-2007 period the
GDP rate in Malta increased from €11,900 to €14,100 but remained below the EU averages for these periods (€22,633 and €24,475 respectively). Long term unemployment is
considerably lower than the EU average with an LTU rate of 3.3% in the pre-2007 period compared to an EU average of 4.1%. This rate decreased in Malta to 2.9% in the post-2007
period; the EU average decreased to a slightly quicker rate to 3.6%.
Taxes: Taxation on income and wealth was below the EU average for the pre-2007 period but just above the EU average during the post-2007 period. The implicit tax rate on labour was
below average for both periods; in Malta the rate decreased from 22% to 21% when the pre and post-2007 periods are compared whereas there was a small increase in the EU average
from 36.1% to 36.2%.
Public Budgets: When gross government debt is considered as a share of GDP in the pre-2007, Malta’s debt was considerably higher than the EU average, with a debt of 64%
compared to an EU average of 48.3%. Interestingly the debt level in Malta rose at a slower rate during the post-2007 period than the EU average, in the post-2007 period the rate was
65.5% compared to 52.1% EU average. The share of GDP spent on labour market policy is lower in Malta than the EU average with expenditure of 0.6% of GDP compared to an EU
average of 1.9%. The percentage decreased slightly to 0.5% in Malta during the post-2007 period, while the EU average also decreased slightly to 1.8%. The general government deficit
was 5.4% of GDP compared to an EU average of 1.9% of GDP in the pre-2007 period. In the post-2007 period Malta had a deficit of 3.6% of GDP compared to an EU average deficit of
4.2%.
Social Protection: During both the pre-2007 and post-2007 periods total expenditure on social protection per head in Malta was substantially lower than the EU average (€1,941 in
Malta compared to an EU average of €5,634 in the pre-2007 period and €2,205 per head in Malta during the post-2007 period compared to an EU average of €5,890. The share of
benefits spent on unemployment in Malta was also below the average EU average for both periods. In the pre-2007 period 3.5% of total benefit spending in Malta was on unemployment
compared to an EU average of 5.7%. By the post-2007 period the share was 2.9% spent in Malta compared to an EU average of 5.3%.
Social Dialogue: In the post-2007 period the share of companies with employee representation in Malta was well below the EU average (33% compared to an EU average of 41%), in
addition only 56% of companies in Malta consulted employees prior to the introduction of restructuring measures compared to an EU average of 77%.
Training: Public expenditure on education as a share of GDP was above average in Malta and increased at a greater rate than the EU average when the pre-2007 and post-2007
periods are compared (5.1% in the pre 2007 period and 5.9% in the post-2007 period in Malta compared to EU averages of 5% and 5.2% for the same periods). The share of the adult
population participating in education and training was below the EU average in both periods – with 4.7% engaged in training in the pre-2007 period in Malta compared to an EU average
of 8.3%. In the post-2007 period, an average of 6.2% was engaged with education and training in Malta compared to 9.3% in the EU.
Skills: The rate of lower secondary attainment was significantly above average in Malta during both the pre-2007 and post-2007 periods. The rate did, however, decline in Malta when
the two periods are compared (from 75.4% in the pre-2007 period to 71% in the post-2007 period. The EU average also declined, albeit at a lower rate, from 35.1% to 31.9%). The rate of
tertiary education attainment was below average in Malta during both periods. In the pre-2007 period, 14.4% of 30-34s had tertiary attainment compared to the EU average of 25.4%.
The rate increased in Malta to 21.2% in the post-2007 period, however the EU average increased to 31.7%. Similarly, the share of the labour force with tertiary education increased when
the two periods are compared, but remained well below the EU average.
Productivity: the annual productivity growth rate in Malta was below average in both the pre-2007 and post-2007 periods. During the pre-2007 period the average for Malta was +1.3%
compared to an EU average of +1.5%. The average for the post-2007 period in Malta was +0.1% compared to the EU average of +0.2%.
139
Analysis of flexicurity related inputs and policies
Input Indicators
Active labour Market Policy: expenditure as a share of GDP was far lower in Malta than the EU average (0.1% in the pre-2007 period, compared to an EU average of 0.5%, and
0% in the post-2007 period, compared to a 0.5% EU average). Likewise the number of LMP participants engaged in active measure as a share of all unemployed was lower in Malta
for both the pre and post-2007 periods when compared to the EU average (7.1% in the pre-2007 period in Malta, compared to a 37% EU average; and 8.6% in Malta for the post-
2007 period compared to an EU average of 35%).
Contractual Arrangements: The average number of hours worked per week was slightly above the EU average for the pre-2007 period (39.5 in Malta, compared to 38.1 in the EU)
and this remained the case for the post-2007 period (39.0 in Malta compared to 37.7 in the EU).
Lifelong Learning: Public expenditure on education in Malta was 4.9% for the pre-2007 period and 6.2% in the post-2007 period; the average for the EU remained at 5.0% for both
periods. Private expenditure on education was 0.7% in Malta for the pre-2007 period, and decreased to 0.3% in the post-2007 period. The average for the EU was 0.6% in the pre-
2007 period, compared to 0.7% for the post-2007 period.
Modern Social Security: Expenditure on passive LMP in Malta was lower than the EU average for both the pre and post-2007 periods, the average for the pre-2007 period and the
post-2007 period in Malta was 0.4%, compared to an EU average of 1.2% in the pre-2007 period and 1.1% in the post-2007 period. Expenditure on social protection in Malta was
slightly lower than the EU average for the pre-2007 and the post-2007 period (for both periods the average in Malta was 18% compared to an EU average of 27%).
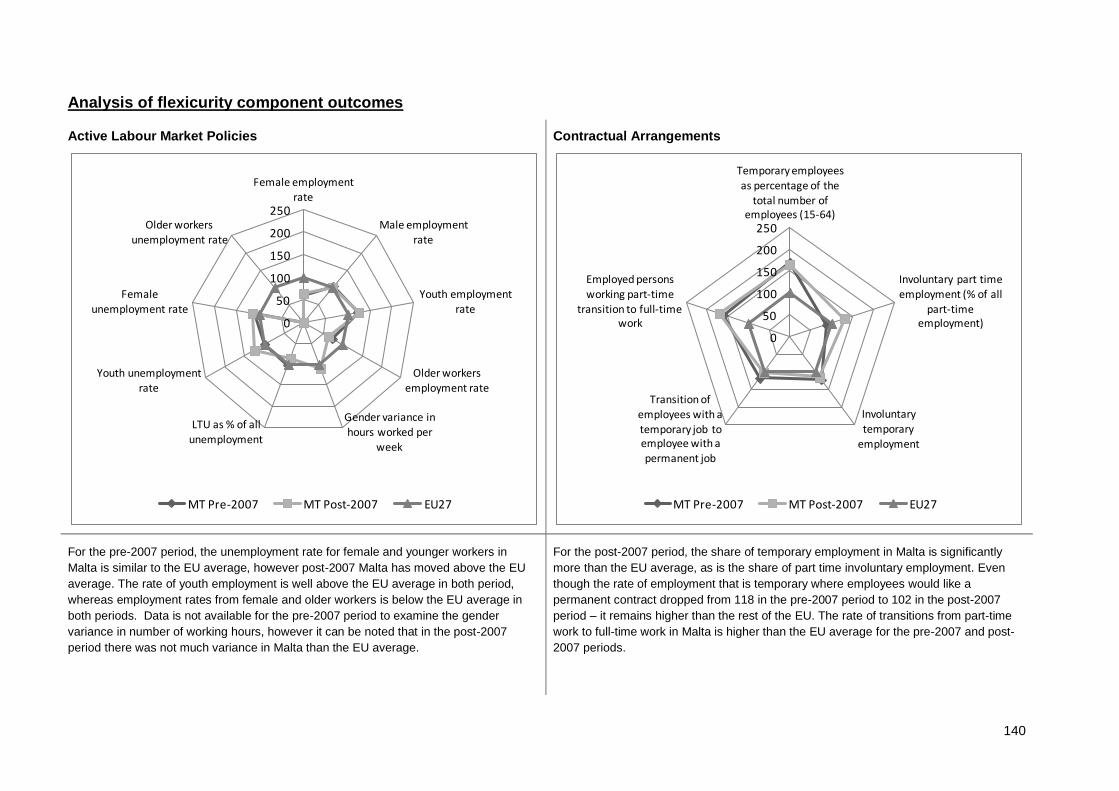
140
Analysis of flexicurity component outcomes
Active Labour Market Policies
Contractual Arrangements
For the pre-2007 period, the unemployment rate for female and younger workers in
Malta is similar to the EU average, however post-2007 Malta has moved above the EU
average. The rate of youth employment is well above the EU average in both period,
whereas employment rates from female and older workers is below the EU average in
both periods. Data is not available for the pre-2007 period to examine the gender
variance in number of working hours, however it can be noted that in the post-2007
period there was not much variance in Malta than the EU average.
For the post-2007 period, the share of temporary employment in Malta is significantly
more than the EU average, as is the share of part time involuntary employment. Even
though the rate of employment that is temporary where employees would like a
permanent contract dropped from 118 in the pre-2007 period to 102 in the post-2007
period – it remains higher than the rest of the EU. The rate of transitions from part-time
work to full-time work in Malta is higher than the EU average for the pre-2007 and post-
2007 periods.
0
50
100
150
200
250
Female employment rate
Male employment rate
Youth employment
rate
Older workers employment rate
Gender variance in hours worked per
week
LTU as % of all unemployment
Youth unemployment rate
Female
unemployment rate
Older workers unemployment rate
MT Pre-2007 MT Post-2007 EU27
0
50
100
150
200
250
Temporary employees
as percentage of the total number of
employees (15-64)
Involuntary part time
employment (% of all part-time
employment)
Involuntary
temporary employment
Transition of employees with a temporary job to employee with a
permanent job
Employed persons
working part-time transition to full-time
work
MT Pre-2007 MT Post-2007 EU27
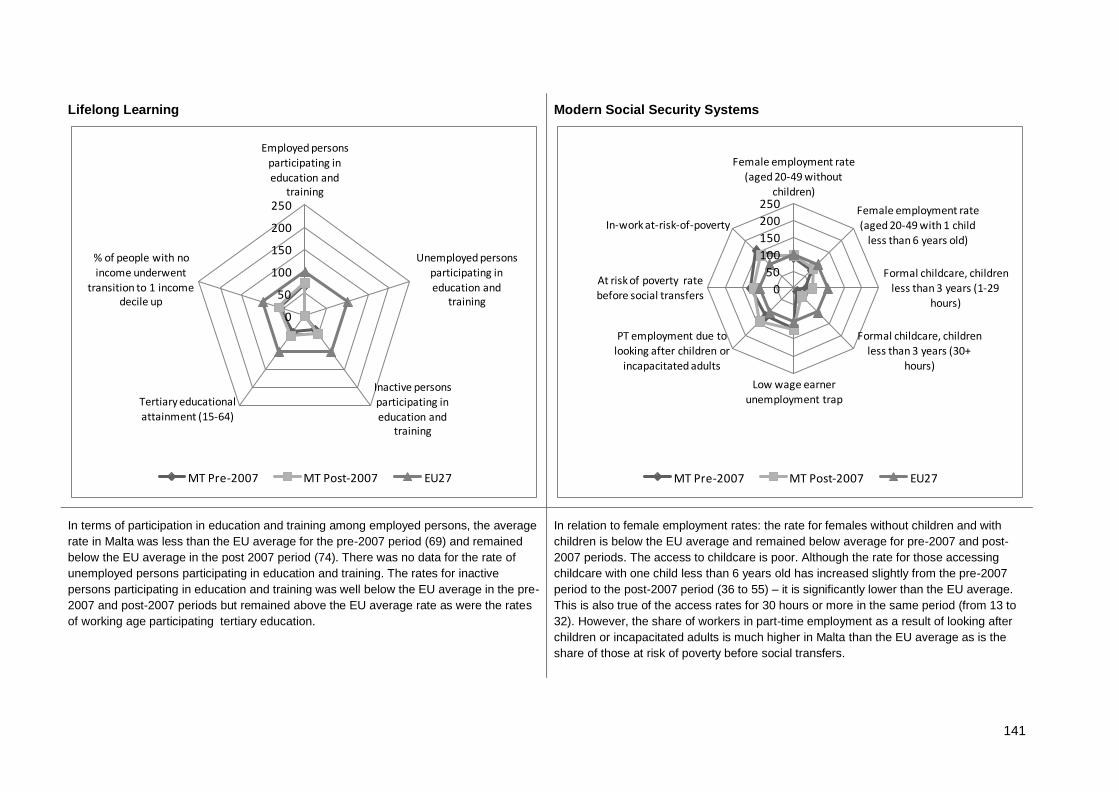
141
Lifelong Learning
Modern Social Security Systems
In terms of participation in education and training among employed persons, the average
rate in Malta was less than the EU average for the pre-2007 period (69) and remained
below the EU average in the post 2007 period (74). There was no data for the rate of
unemployed persons participating in education and training. The rates for inactive
persons participating in education and training was well below the EU average in the pre-
2007 and post-2007 periods but remained above the EU average rate as were the rates
of working age participating tertiary education.
In relation to female employment rates: the rate for females without children and with
children is below the EU average and remained below average for pre-2007 and post-
2007 periods. The access to childcare is poor. Although the rate for those accessing
childcare with one child less than 6 years old has increased slightly from the pre-2007
period to the post-2007 period (36 to 55) – it is significantly lower than the EU average.
This is also true of the access rates for 30 hours or more in the same period (from 13 to
32). However, the share of workers in part-time employment as a result of looking after
children or incapacitated adults is much higher in Malta than the EU average as is the
share of those at risk of poverty before social transfers.
0
50
100
150
200
250
Employed persons participating in education and
training
Unemployed persons participating in
education and training
Inactive persons participating in education and
training
Tertiary educational attainment (15-64)
% of people with no income underwent
transition to 1 income decile up
MT Pre-2007 MT Post-2007 EU27
0
50
100
150
200
250
Female employment rate (aged 20-49 without
children)
Female employment rate (aged 20-49 with 1 child
less than 6 years old)
Formal childcare, children
less than 3 years (1-29 hours)
Formal childcare, children less than 3 years (30+
hours)
Low wage earner unemployment trap
PT employment due to looking after children or
incapacitated adults
At risk of poverty rate before social transfers
In-work at-risk-of-poverty
MT Pre-2007 MT Post-2007 EU27
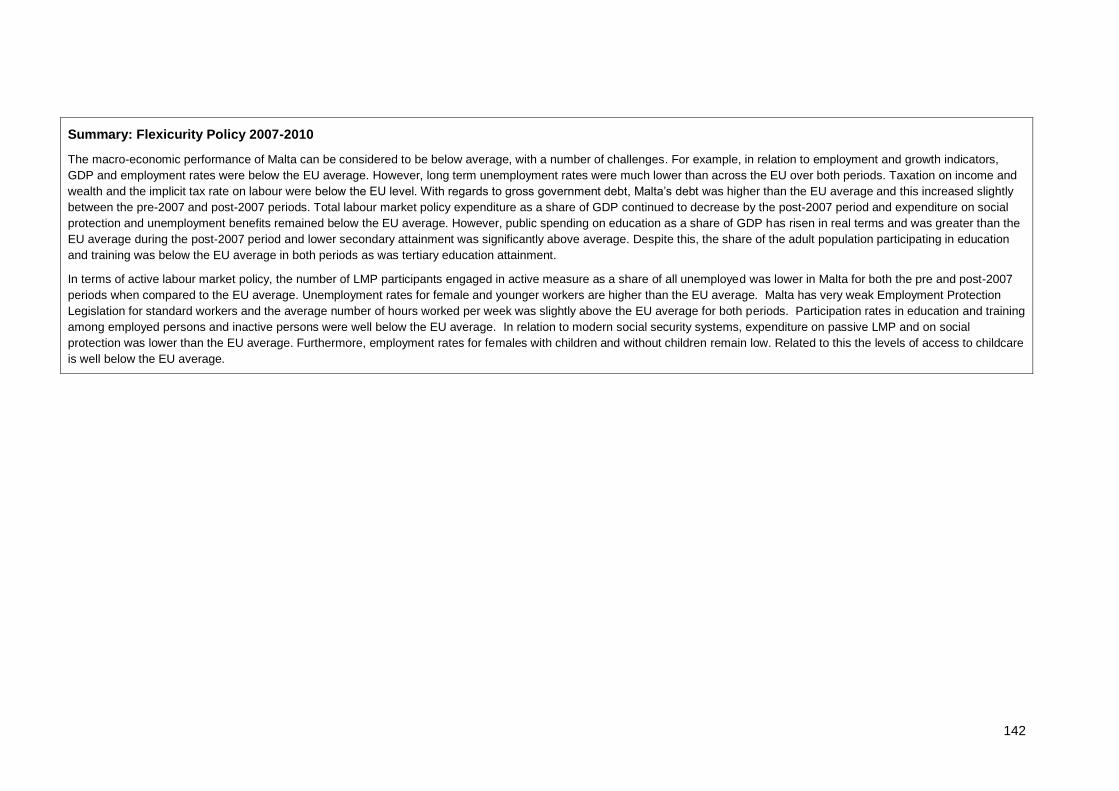
142
Summary: Flexicurity Policy 2007-2010
The macro-economic performance of Malta can be considered to be below average, with a number of challenges. For example, in relation to employment and growth indicators,
GDP and employment rates were below the EU average. However, long term unemployment rates were much lower than across the EU over both periods. Taxation on income and
wealth and the implicit tax rate on labour were below the EU level. With regards to gross government debt, Malta’s debt was higher than the EU average and this increased slightly
between the pre-2007 and post-2007 periods. Total labour market policy expenditure as a share of GDP continued to decrease by the post-2007 period and expenditure on social
protection and unemployment benefits remained below the EU average. However, public spending on education as a share of GDP has risen in real terms and was greater than the
EU average during the post-2007 period and lower secondary attainment was significantly above average. Despite this, the share of the adult population participating in education
and training was below the EU average in both periods as was tertiary education attainment.
In terms of active labour market policy, the number of LMP participants engaged in active measure as a share of all unemployed was lower in Malta for both the pre and post-2007
periods when compared to the EU average. Unemployment rates for female and younger workers are higher than the EU average. Malta has very weak Employment Protection
Legislation for standard workers and the average number of hours worked per week was slightly above the EU average for both periods. Participation rates in education and training
among employed persons and inactive persons were well below the EU average. In relation to modern social security systems, expenditure on passive LMP and on social
protection was lower than the EU average. Furthermore, employment rates for females with children and without children remain low. Related to this the levels of access to childcare
is well below the EU average.

143
20 Netherlands
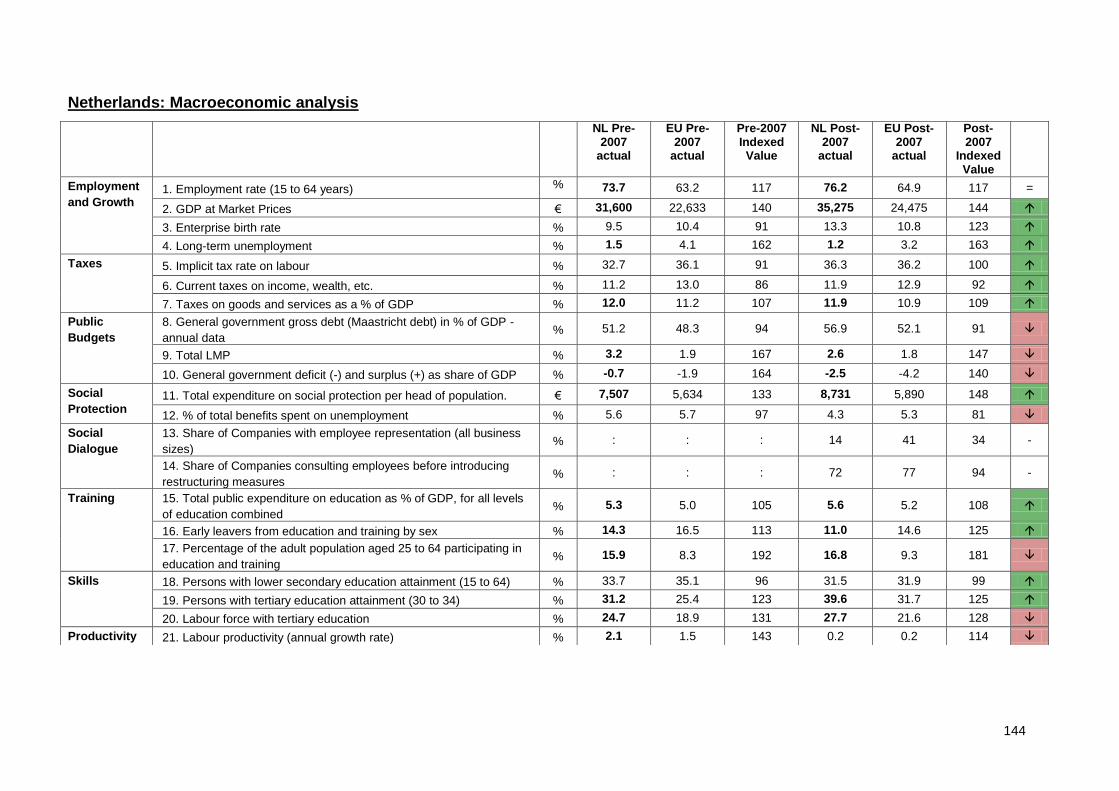
144
Netherlands: Macroeconomic analysis
NL Pre-2007
actual
EU Pre-2007
actual
Pre-2007 Indexed Value
NL Post-2007
actual
EU Post-2007
actual
Post-2007
Indexed Value
Employment
and Growth 1. Employment rate (15 to 64 years) % 73.7 63.2 117 76.2 64.9 117 =
2. GDP at Market Prices € 31,600 22,633 140 35,275 24,475 144
3. Enterprise birth rate % 9.5 10.4 91 13.3 10.8 123
4. Long-term unemployment % 1.5 4.1 162 1.2 3.2 163
Taxes 5. Implicit tax rate on labour % 32.7 36.1 91 36.3 36.2 100
6. Current taxes on income, wealth, etc. % 11.2 13.0 86 11.9 12.9 92
7. Taxes on goods and services as a % of GDP % 12.0 11.2 107 11.9 10.9 109
Public
Budgets
8. General government gross debt (Maastricht debt) in % of GDP -
annual data % 51.2 48.3 94 56.9 52.1 91
9. Total LMP % 3.2 1.9 167 2.6 1.8 147
10. General government deficit (-) and surplus (+) as share of GDP % -0.7 -1.9 164 -2.5 -4.2 140
Social
Protection 11. Total expenditure on social protection per head of population. € 7,507 5,634 133 8,731 5,890 148
12. % of total benefits spent on unemployment % 5.6 5.7 97 4.3 5.3 81
Social
Dialogue
13. Share of Companies with employee representation (all business
sizes) % : : : 14 41 34 -
14. Share of Companies consulting employees before introducing
restructuring measures % : : : 72 77 94 -
Training 15. Total public expenditure on education as % of GDP, for all levels
of education combined % 5.3 5.0 105 5.6 5.2 108
16. Early leavers from education and training by sex % 14.3 16.5 113 11.0 14.6 125
17. Percentage of the adult population aged 25 to 64 participating in
education and training % 15.9 8.3 192 16.8 9.3 181
Skills 18. Persons with lower secondary education attainment (15 to 64) % 33.7 35.1 96 31.5 31.9 99
19. Persons with tertiary education attainment (30 to 34) % 31.2 25.4 123 39.6 31.7 125
20. Labour force with tertiary education % 24.7 18.9 131 27.7 21.6 128
Productivity 21. Labour productivity (annual growth rate) % 2.1 1.5 143 0.2 0.2 114
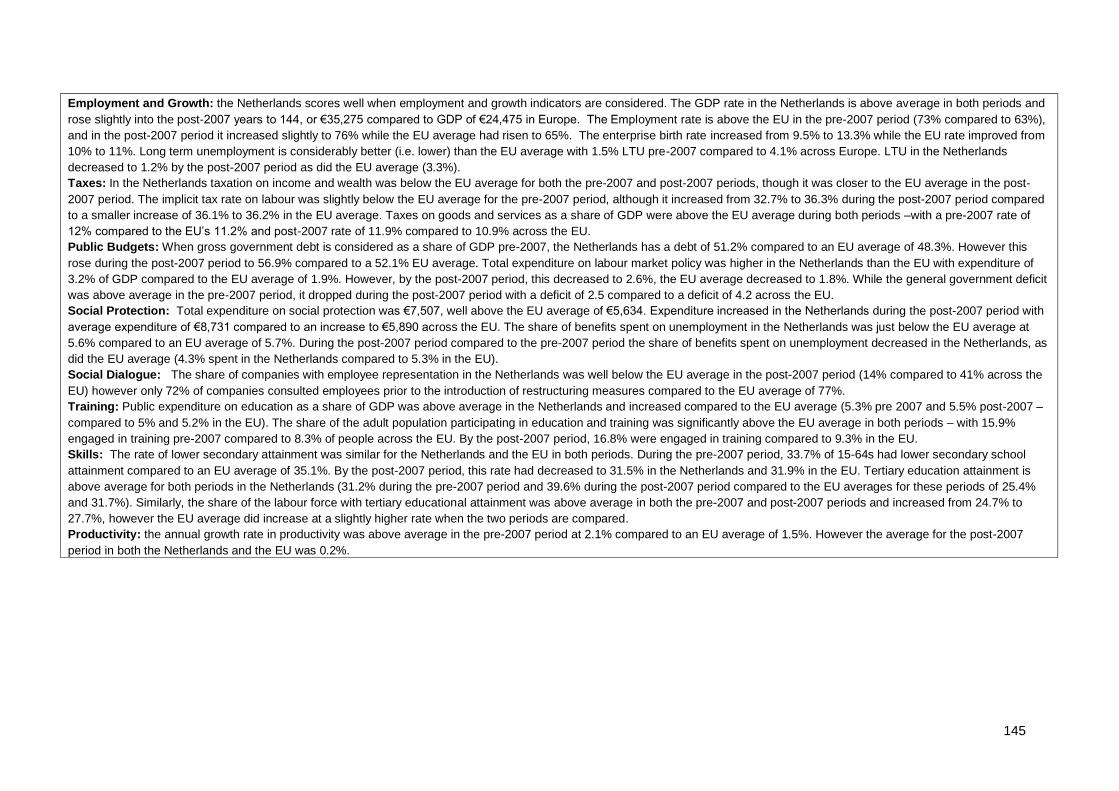
145
Employment and Growth: the Netherlands scores well when employment and growth indicators are considered. The GDP rate in the Netherlands is above average in both periods and
rose slightly into the post-2007 years to 144, or €35,275 compared to GDP of €24,475 in Europe. The Employment rate is above the EU in the pre-2007 period (73% compared to 63%),
and in the post-2007 period it increased slightly to 76% while the EU average had risen to 65%. The enterprise birth rate increased from 9.5% to 13.3% while the EU rate improved from
10% to 11%. Long term unemployment is considerably better (i.e. lower) than the EU average with 1.5% LTU pre-2007 compared to 4.1% across Europe. LTU in the Netherlands
decreased to 1.2% by the post-2007 period as did the EU average (3.3%).
Taxes: In the Netherlands taxation on income and wealth was below the EU average for both the pre-2007 and post-2007 periods, though it was closer to the EU average in the post-
2007 period. The implicit tax rate on labour was slightly below the EU average for the pre-2007 period, although it increased from 32.7% to 36.3% during the post-2007 period compared
to a smaller increase of 36.1% to 36.2% in the EU average. Taxes on goods and services as a share of GDP were above the EU average during both periods –with a pre-2007 rate of
12% compared to the EU’s 11.2% and post-2007 rate of 11.9% compared to 10.9% across the EU.
Public Budgets: When gross government debt is considered as a share of GDP pre-2007, the Netherlands has a debt of 51.2% compared to an EU average of 48.3%. However this
rose during the post-2007 period to 56.9% compared to a 52.1% EU average. Total expenditure on labour market policy was higher in the Netherlands than the EU with expenditure of
3.2% of GDP compared to the EU average of 1.9%. However, by the post-2007 period, this decreased to 2.6%, the EU average decreased to 1.8%. While the general government deficit
was above average in the pre-2007 period, it dropped during the post-2007 period with a deficit of 2.5 compared to a deficit of 4.2 across the EU.
Social Protection: Total expenditure on social protection was €7,507, well above the EU average of €5,634. Expenditure increased in the Netherlands during the post-2007 period with
average expenditure of €8,731 compared to an increase to €5,890 across the EU. The share of benefits spent on unemployment in the Netherlands was just below the EU average at
5.6% compared to an EU average of 5.7%. During the post-2007 period compared to the pre-2007 period the share of benefits spent on unemployment decreased in the Netherlands, as
did the EU average (4.3% spent in the Netherlands compared to 5.3% in the EU).
Social Dialogue: The share of companies with employee representation in the Netherlands was well below the EU average in the post-2007 period (14% compared to 41% across the
EU) however only 72% of companies consulted employees prior to the introduction of restructuring measures compared to the EU average of 77%.
Training: Public expenditure on education as a share of GDP was above average in the Netherlands and increased compared to the EU average (5.3% pre 2007 and 5.5% post-2007 –
compared to 5% and 5.2% in the EU). The share of the adult population participating in education and training was significantly above the EU average in both periods – with 15.9%
engaged in training pre-2007 compared to 8.3% of people across the EU. By the post-2007 period, 16.8% were engaged in training compared to 9.3% in the EU.
Skills: The rate of lower secondary attainment was similar for the Netherlands and the EU in both periods. During the pre-2007 period, 33.7% of 15-64s had lower secondary school
attainment compared to an EU average of 35.1%. By the post-2007 period, this rate had decreased to 31.5% in the Netherlands and 31.9% in the EU. Tertiary education attainment is
above average for both periods in the Netherlands (31.2% during the pre-2007 period and 39.6% during the post-2007 period compared to the EU averages for these periods of 25.4%
and 31.7%). Similarly, the share of the labour force with tertiary educational attainment was above average in both the pre-2007 and post-2007 periods and increased from 24.7% to
27.7%, however the EU average did increase at a slightly higher rate when the two periods are compared.
Productivity: the annual growth rate in productivity was above average in the pre-2007 period at 2.1% compared to an EU average of 1.5%. However the average for the post-2007
period in both the Netherlands and the EU was 0.2%.
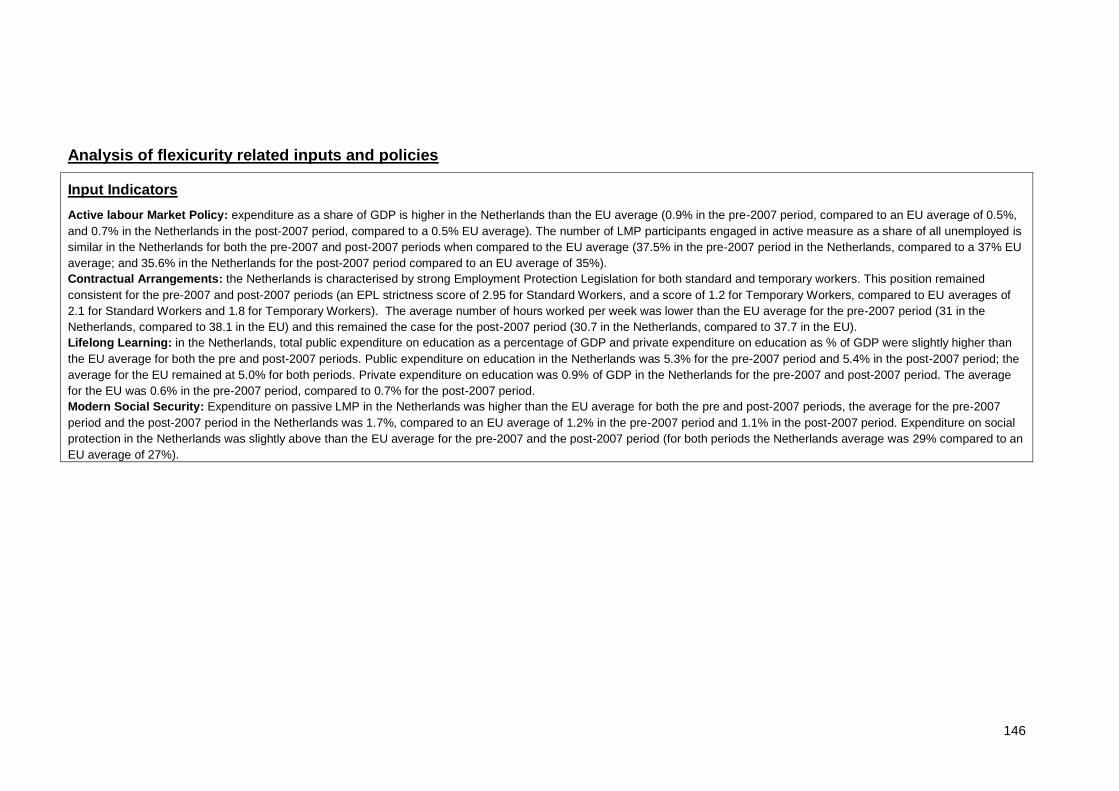
146
Analysis of flexicurity related inputs and policies
Input Indicators
Active labour Market Policy: expenditure as a share of GDP is higher in the Netherlands than the EU average (0.9% in the pre-2007 period, compared to an EU average of 0.5%,
and 0.7% in the Netherlands in the post-2007 period, compared to a 0.5% EU average). The number of LMP participants engaged in active measure as a share of all unemployed is
similar in the Netherlands for both the pre-2007 and post-2007 periods when compared to the EU average (37.5% in the pre-2007 period in the Netherlands, compared to a 37% EU
average; and 35.6% in the Netherlands for the post-2007 period compared to an EU average of 35%).
Contractual Arrangements: the Netherlands is characterised by strong Employment Protection Legislation for both standard and temporary workers. This position remained
consistent for the pre-2007 and post-2007 periods (an EPL strictness score of 2.95 for Standard Workers, and a score of 1.2 for Temporary Workers, compared to EU averages of
2.1 for Standard Workers and 1.8 for Temporary Workers). The average number of hours worked per week was lower than the EU average for the pre-2007 period (31 in the
Netherlands, compared to 38.1 in the EU) and this remained the case for the post-2007 period (30.7 in the Netherlands, compared to 37.7 in the EU).
Lifelong Learning: in the Netherlands, total public expenditure on education as a percentage of GDP and private expenditure on education as % of GDP were slightly higher than
the EU average for both the pre and post-2007 periods. Public expenditure on education in the Netherlands was 5.3% for the pre-2007 period and 5.4% in the post-2007 period; the
average for the EU remained at 5.0% for both periods. Private expenditure on education was 0.9% of GDP in the Netherlands for the pre-2007 and post-2007 period. The average
for the EU was 0.6% in the pre-2007 period, compared to 0.7% for the post-2007 period.
Modern Social Security: Expenditure on passive LMP in the Netherlands was higher than the EU average for both the pre and post-2007 periods, the average for the pre-2007
period and the post-2007 period in the Netherlands was 1.7%, compared to an EU average of 1.2% in the pre-2007 period and 1.1% in the post-2007 period. Expenditure on social
protection in the Netherlands was slightly above than the EU average for the pre-2007 and the post-2007 period (for both periods the Netherlands average was 29% compared to an
EU average of 27%).
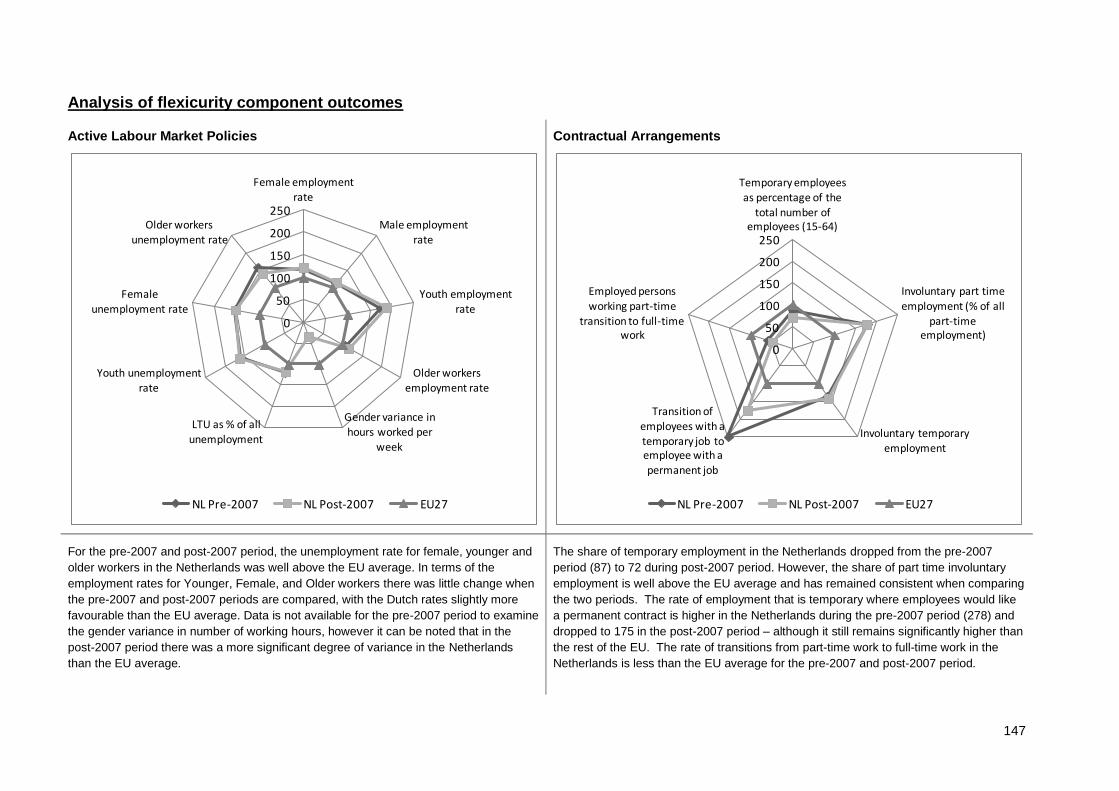
147
Analysis of flexicurity component outcomes
Active Labour Market Policies
Contractual Arrangements
For the pre-2007 and post-2007 period, the unemployment rate for female, younger and
older workers in the Netherlands was well above the EU average. In terms of the
employment rates for Younger, Female, and Older workers there was little change when
the pre-2007 and post-2007 periods are compared, with the Dutch rates slightly more
favourable than the EU average. Data is not available for the pre-2007 period to examine
the gender variance in number of working hours, however it can be noted that in the
post-2007 period there was a more significant degree of variance in the Netherlands
than the EU average.
The share of temporary employment in the Netherlands dropped from the pre-2007
period (87) to 72 during post-2007 period. However, the share of part time involuntary
employment is well above the EU average and has remained consistent when comparing
the two periods. The rate of employment that is temporary where employees would like
a permanent contract is higher in the Netherlands during the pre-2007 period (278) and
dropped to 175 in the post-2007 period – although it still remains significantly higher than
the rest of the EU. The rate of transitions from part-time work to full-time work in the
Netherlands is less than the EU average for the pre-2007 and post-2007 period.
0
50
100
150
200
250
Female employment rate
Male employment rate
Youth employment
rate
Older workers employment rate
Gender variance in hours worked per
week
LTU as % of all unemployment
Youth unemployment rate
Female
unemployment rate
Older workers unemployment rate
NL Pre-2007 NL Post-2007 EU27
0
50
100
150
200
250
Temporary employees as percentage of the
total number of employees (15-64)
Involuntary part time
employment (% of all part-time
employment)
Involuntary temporary employment
Transition of employees with a temporary job to employee with a
permanent job
Employed persons
working part-time transition to full-time
work
NL Pre-2007 NL Post-2007 EU27
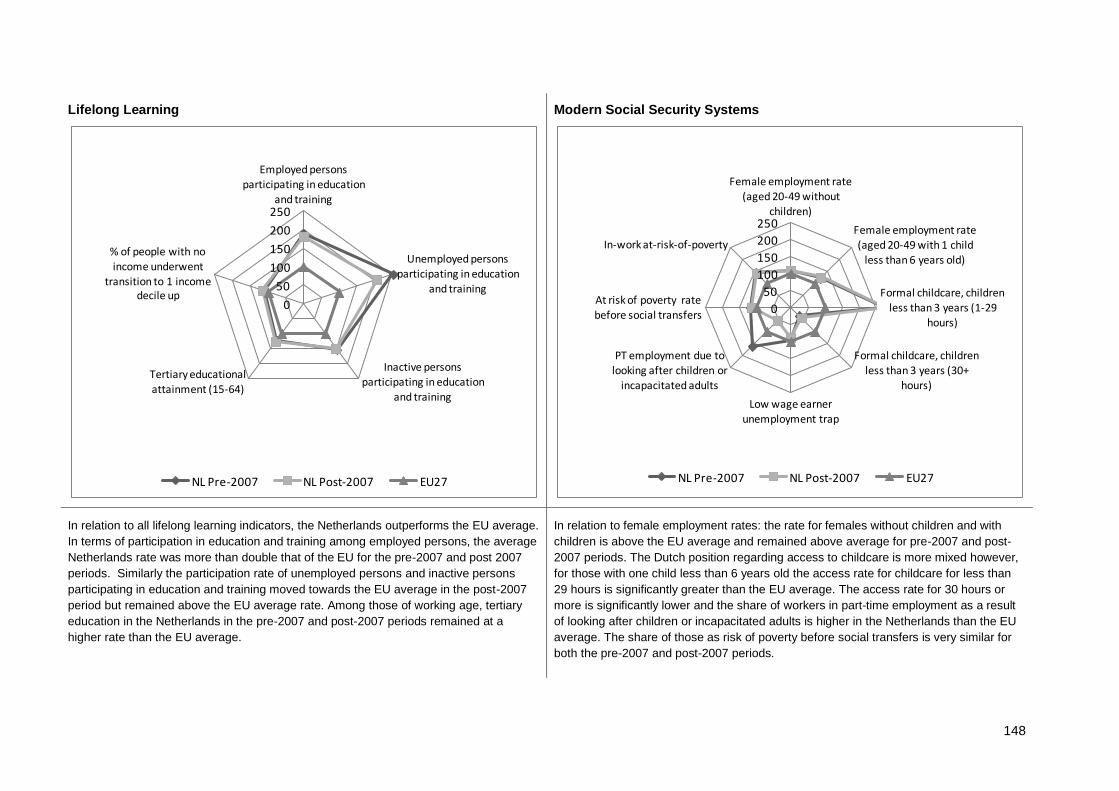
148
Lifelong Learning
Modern Social Security Systems
In relation to all lifelong learning indicators, the Netherlands outperforms the EU average.
In terms of participation in education and training among employed persons, the average
Netherlands rate was more than double that of the EU for the pre-2007 and post 2007
periods. Similarly the participation rate of unemployed persons and inactive persons
participating in education and training moved towards the EU average in the post-2007
period but remained above the EU average rate. Among those of working age, tertiary
education in the Netherlands in the pre-2007 and post-2007 periods remained at a
higher rate than the EU average.
In relation to female employment rates: the rate for females without children and with
children is above the EU average and remained above average for pre-2007 and post-
2007 periods. The Dutch position regarding access to childcare is more mixed however,
for those with one child less than 6 years old the access rate for childcare for less than
29 hours is significantly greater than the EU average. The access rate for 30 hours or
more is significantly lower and the share of workers in part-time employment as a result
of looking after children or incapacitated adults is higher in the Netherlands than the EU
average. The share of those as risk of poverty before social transfers is very similar for
both the pre-2007 and post-2007 periods.
0
50
100
150
200
250
Employed persons participating in education
and training
Unemployed persons participating in education
and training
Inactive persons participating in education
and training
Tertiary educational attainment (15-64)
% of people with no income underwent
transition to 1 income decile up
NL Pre-2007 NL Post-2007 EU27
0
50
100
150
200
250
Female employment rate (aged 20-49 without
children)
Female employment rate
(aged 20-49 with 1 child less than 6 years old)
Formal childcare, children less than 3 years (1-29
hours)
Formal childcare, children less than 3 years (30+
hours)
Low wage earner unemployment trap
PT employment due to looking after children or
incapacitated adults
At risk of poverty rate
before social transfers
In-work at-risk-of-poverty
NL Pre-2007 NL Post-2007 EU27
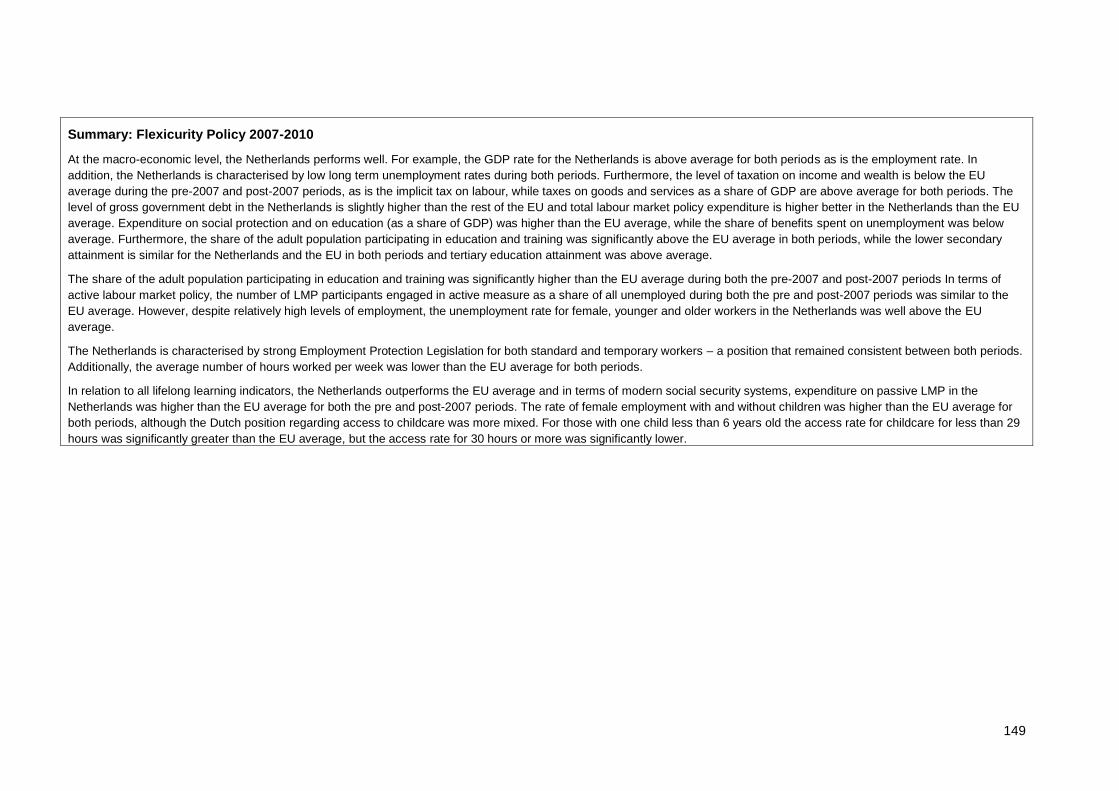
149
Summary: Flexicurity Policy 2007-2010
At the macro-economic level, the Netherlands performs well. For example, the GDP rate for the Netherlands is above average for both periods as is the employment rate. In
addition, the Netherlands is characterised by low long term unemployment rates during both periods. Furthermore, the level of taxation on income and wealth is below the EU
average during the pre-2007 and post-2007 periods, as is the implicit tax on labour, while taxes on goods and services as a share of GDP are above average for both periods. The
level of gross government debt in the Netherlands is slightly higher than the rest of the EU and total labour market policy expenditure is higher better in the Netherlands than the EU
average. Expenditure on social protection and on education (as a share of GDP) was higher than the EU average, while the share of benefits spent on unemployment was below
average. Furthermore, the share of the adult population participating in education and training was significantly above the EU average in both periods, while the lower secondary
attainment is similar for the Netherlands and the EU in both periods and tertiary education attainment was above average.
The share of the adult population participating in education and training was significantly higher than the EU average during both the pre-2007 and post-2007 periods In terms of
active labour market policy, the number of LMP participants engaged in active measure as a share of all unemployed during both the pre and post-2007 periods was similar to the
EU average. However, despite relatively high levels of employment, the unemployment rate for female, younger and older workers in the Netherlands was well above the EU
average.
The Netherlands is characterised by strong Employment Protection Legislation for both standard and temporary workers – a position that remained consistent between both periods.
Additionally, the average number of hours worked per week was lower than the EU average for both periods.
In relation to all lifelong learning indicators, the Netherlands outperforms the EU average and in terms of modern social security systems, expenditure on passive LMP in the
Netherlands was higher than the EU average for both the pre and post-2007 periods. The rate of female employment with and without children was higher than the EU average for
both periods, although the Dutch position regarding access to childcare was more mixed. For those with one child less than 6 years old the access rate for childcare for less than 29
hours was significantly greater than the EU average, but the access rate for 30 hours or more was significantly lower.

150
21 Poland
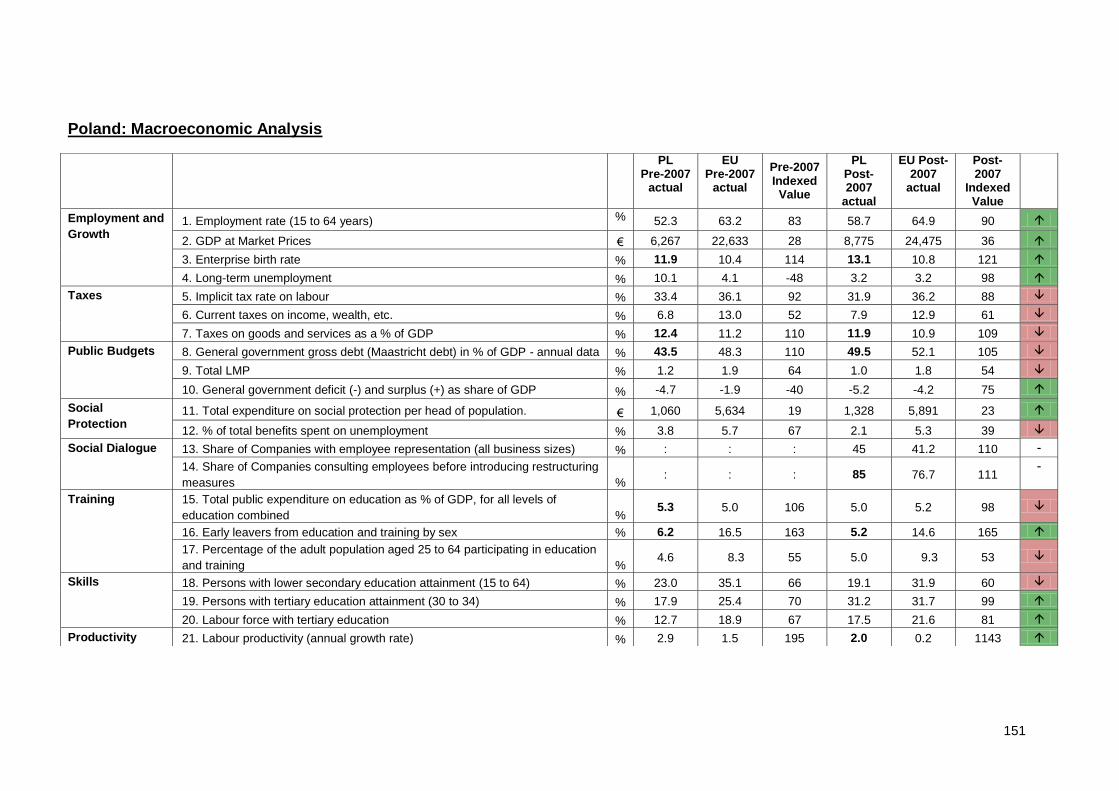
151
Poland: Macroeconomic Analysis
PL Pre-2007
actual
EU Pre-2007
actual
Pre-2007 Indexed Value
PL Post-2007
actual
EU Post-2007
actual
Post-2007
Indexed Value
Employment and
Growth 1. Employment rate (15 to 64 years) % 52.3 63.2 83 58.7 64.9 90
2. GDP at Market Prices € 6,267 22,633 28 8,775 24,475 36
3. Enterprise birth rate % 11.9 10.4 114 13.1 10.8 121
4. Long-term unemployment % 10.1 4.1 -48 3.2 3.2 98
Taxes 5. Implicit tax rate on labour % 33.4 36.1 92 31.9 36.2 88
6. Current taxes on income, wealth, etc. % 6.8 13.0 52 7.9 12.9 61
7. Taxes on goods and services as a % of GDP % 12.4 11.2 110 11.9 10.9 109
Public Budgets 8. General government gross debt (Maastricht debt) in % of GDP - annual data % 43.5 48.3 110 49.5 52.1 105
9. Total LMP % 1.2 1.9 64 1.0 1.8 54
10. General government deficit (-) and surplus (+) as share of GDP % -4.7 -1.9 -40 -5.2 -4.2 75
Social
Protection 11. Total expenditure on social protection per head of population. € 1,060 5,634 19 1,328 5,891 23
12. % of total benefits spent on unemployment % 3.8 5.7 67 2.1 5.3 39
Social Dialogue 13. Share of Companies with employee representation (all business sizes) % : : : 45 41.2 110 -
14. Share of Companies consulting employees before introducing restructuring
measures % : : : 85 76.7 111
-
Training 15. Total public expenditure on education as % of GDP, for all levels of
education combined % 5.3 5.0 106 5.0 5.2 98
16. Early leavers from education and training by sex % 6.2 16.5 163 5.2 14.6 165
17. Percentage of the adult population aged 25 to 64 participating in education
and training % 4.6 8.3 55 5.0 9.3 53
Skills 18. Persons with lower secondary education attainment (15 to 64) % 23.0 35.1 66 19.1 31.9 60
19. Persons with tertiary education attainment (30 to 34) % 17.9 25.4 70 31.2 31.7 99
20. Labour force with tertiary education % 12.7 18.9 67 17.5 21.6 81
Productivity 21. Labour productivity (annual growth rate) % 2.9 1.5 195 2.0 0.2 1143
152
Employment and Growth: the employment rate in Poland was below the EU average for both the pre-2007 and post-2007 periods, though it did move closer to the EU average in
the post-2007 period from 52.3% to 58.7% compared to a post-2007 average for the EU of 64.9%. GDP per capita remained well below the EU average in both the pre-2007 and
post-2007 periods. The long-term unemployment rate, though higher than the EU average in both periods, did increase relative to the EU average for the post-2007 period declining
from 10.1% to 3.2%, compared to an EU average post-2007 of just under 3.2%. The enterprise birth rate in Poland remained better than average for both periods and increased in
relative to the EU average by post-2007.
Taxes: the implicit tax rate on labour and taxes on income and wealth were lower in Poland than the EU average for the pre-2007 and post-2007 periods and decreased against the
EU average over the period. In contrast, taxes on goods and services as a percentage of GDP were slightly higher across both periods although the rate did fall slightly relative to
the EU average.
Public Budgets: Government debt as a share of GDP is less significant across both periods in Poland than the EU average, whilst spending on LMP is far lower that the EU
average, the deficit in Poland is more significant than the EU average by post-2007.
Social Protection: spending on social protection per head and the percentage of total benefits that are spent on unemployment are far lower in Poland than the EU average in both
the pre-2007 and post-2007 periods. More specifically, expenditure was a fifth of the EU average in Poland in both periods, although did improve slightly relative to the EU average
in the post-2007 period.
Social Dialogue: the share of companies with employee representation and the share of companies that consulted employees prior to introducing restructuring, measures were
above the EU average for the post-2007 period.
Training: the rate of early school leaving in Poland is lower than the EU average for both periods (6.2% and 5.2% respectively, compared to 16.5% and 14.6%). Public expenditure
on education has fallen relative to the EU average from the pre-2007 (5.3%) to the post-2007 (5%) period and is now below the EU average (5.2%). The share of the adult
population participating in education and training has increased slightly in real terms when the two periods are compared (from 4.6% to 5%), however this remains well below the EU
average of 8.3% for pre-2007 and 9.3% for post-2007.
Skills: at all educational attainment levels Poland underperforms relative to the EU average for both the pre-2007 and post-2007 periods. Lower secondary educational attainment is
particularly low in both periods falling in real terms from 23% to 19.1% compared to EU averages of 35.1% and 31.9% respectively. Tertiary attainment post-2007 in the 30 to 34 age
group is aligned with the EU average showing improvement from the pre-2007 level (where 17.9% of the age group had tertiary attainment compared to 25.4% EU average. The
tertiary educational attainment in the workforce has improved to post-2007 but remains below average (17.5% compared to 21.6%).
Productivity: the annual growth rate in labour productivity is above the EU average for both periods, particularly post-2007 when average annual growth of 2% was achieved
compared to 0.2% across the EU.
153
Analysis of flexicurity related inputs and policies
Input Indicators
Active labour Market Policy: labour market policy expenditure (as a share of GDP) in Poland was less significant than the EU average in the pre-2007 period (0.4% in Poland
compared with the EU average of 0.5%), however in the post-2007 period the average for Poland was greater than the EU (0.7% for Poland compared with the EU average of
0.5%). Consistent with the additional resource devoted to LMP there was also an increase in the number of participants in labour market policy as a share of those wanting to find
work. In the pre-2007 period the share of participants was the same as the average for the EU (37%) but for the post-2007 period the average for Poland was 55% compared to a
35% for the EU.
Contractual Arrangements: strictness of Employment Protection Legislation in Poland was similar to the EU average prior to 2007, this remained the case in the post-2007 period.
Prior to 2007 EPL for temporary workers was lower than the EU average but increased to the same level as the EU average between 2007 and 2010. The average number of
weekly hours of work was slightly above the EU average prior to 2007 and remains above average between 2007 and 2010, having reduced at a similar rate to the EU average.
Lifelong Learning: total public expenditure on education as a percentage of GDP was slightly higher than the EU average in the pre-2007 period but reduced to the same level as
the EU average in the post-2007 period (for the pre-2007 period the average for Poland was 5.3% compared to an EU average of 5.0%. in the post-2007 period the average for both
Poland and the EU was 5.0%). Private expenditure on education in Poland for the pre-2007 and post-2007 periods was0.6% of GDP. The average rate for the EU was 0.6% in the
pre-2007 period but this increased to 0.7% in the post-2007 period.
Modern Social Security: expenditure on passive LMP in Poland was far lower than the EU average in both the pre-2007 and post-2007 periods. The average expenditure in this
area also reduced at a greater rate in Poland than the EU average did between the two periods (for the pre-2007 period the average for Poland was 0.8%, compared to the EU
average of 1.2%. In the post-2007 period the average for Poland reduced to 0.4% compared to the EU average of 1.1%).
Policy Development
The debate on flexicurity in Poland only started with the submission of Commission Communication in 2007 and it is still not very well known.
A number of relevant reforms took place in Poland. The key objectives included: the improvement of the most important legal act defining the framework of labour market policy,
supporting the labour market, ensuring a better work-life balance, promoting women's employment, increasing economic activity of older and younger persons, improving
entrepreneurs’ ability to create and retain jobs, increasing the flexibility and diversification of forms of employment and organisation of work, improving of mobility, and increasing the
economic activity of the disabled people. The most important objective of flexicurity-related measures in Poland was to create jobs and provide “targeted ALMP”.2The amendment to
the Act on Employment Promotion and Labour Market Institutions (December 2008) enriched the ALMP offer and introduced important developments in the provisions for adult
vocational training. A second important development was introducing an “anti-crisis package” in summer 2009.
Key flexicurity-related measures include:
Improving the Public Employment Service through widening access to their services (among others, to apprenticeships and training) for unemployed persons and the creation
of professional activation centres (CAZ) and the creation of local information – consultation points (LPIK).
Ensuring a better work-life balance through measures designed to assist individuals (for example, strengthened employment protection for parents within the period of
2 Joint Study of the European Social Partners “The implementation of Flexicurity and the role of the social partners”, National fiche on Poland prepared by Anna Kwiatkiewicz, Draft
version: October 2010, Revised version: March 2011.
154
shortened working time because of taking care of a small child; extension of maternity leave) and actions for employers (for example, financing pre-schools and nurseries in
companies from company social funds’ resources, and exemption from paying Labour Fund and Guaranteed Employee Benefit Fund contributions for parents returning from
maternity and parental leave)
Policies to promote women's employment
Actions to increase the economic activity of persons aged 50+ and the promotion of employment, lessening the results of unemployment and economic activation of persons in
non-mobile age – 45/50 PLUS PROGRAMME)
Increasing economic activity of younger persons: a program of professional activation of persons under 30, with a purpose of vocational activation of young people and Jobs for
Youth - Good Start, which aimed to vocational activation of young unemployed
Improvement of entrepreneurs’ ability to create and retain jobs: tax exemptions) for entrepreneurs, who create new jobs, and employ disabled and disadvantaged persons.
Increasing the flexibility and diversification of forms of employment and organisation of work
Increasing the economic activity of the disabled people: improved PES services and access, co financing of wages for of the employed disabled and refund of social security
contributions for employers.
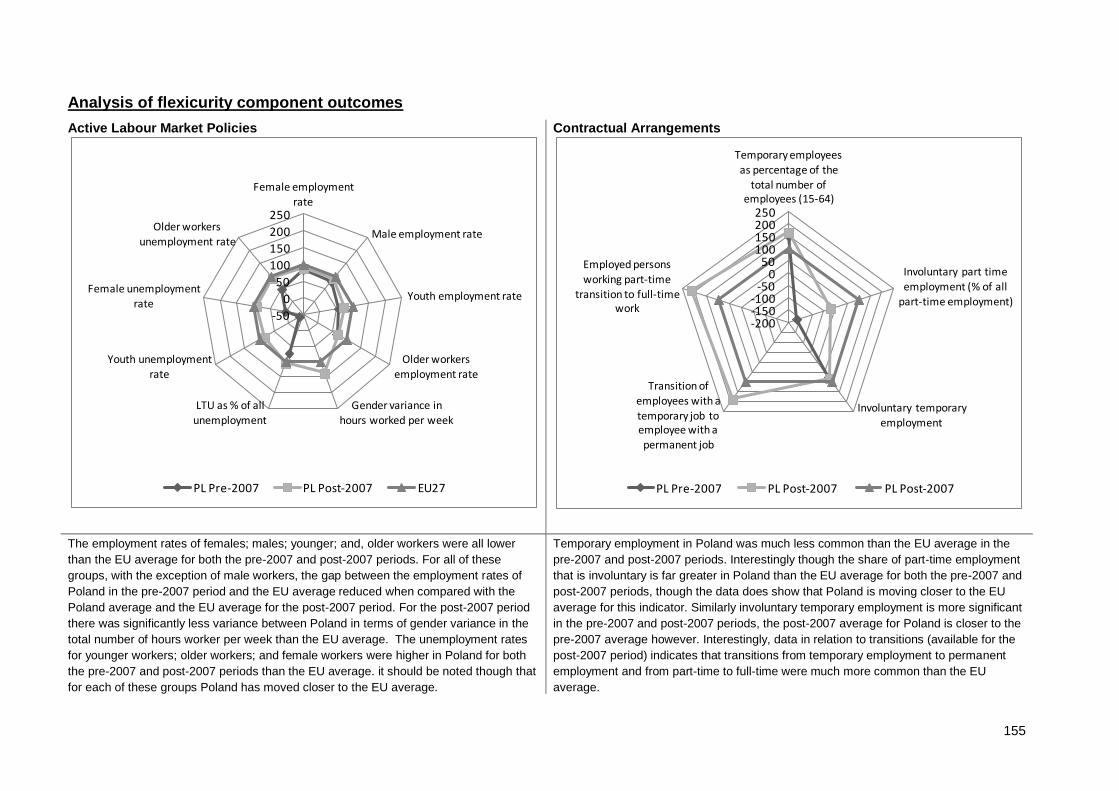
155
Analysis of flexicurity component outcomes
Active Labour Market Policies
Contractual Arrangements
The employment rates of females; males; younger; and, older workers were all lower
than the EU average for both the pre-2007 and post-2007 periods. For all of these
groups, with the exception of male workers, the gap between the employment rates of
Poland in the pre-2007 period and the EU average reduced when compared with the
Poland average and the EU average for the post-2007 period. For the post-2007 period
there was significantly less variance between Poland in terms of gender variance in the
total number of hours worker per week than the EU average. The unemployment rates
for younger workers; older workers; and female workers were higher in Poland for both
the pre-2007 and post-2007 periods than the EU average. it should be noted though that
for each of these groups Poland has moved closer to the EU average.
Temporary employment in Poland was much less common than the EU average in the
pre-2007 and post-2007 periods. Interestingly though the share of part-time employment
that is involuntary is far greater in Poland than the EU average for both the pre-2007 and
post-2007 periods, though the data does show that Poland is moving closer to the EU
average for this indicator. Similarly involuntary temporary employment is more significant
in the pre-2007 and post-2007 periods, the post-2007 average for Poland is closer to the
pre-2007 average however. Interestingly, data in relation to transitions (available for the
post-2007 period) indicates that transitions from temporary employment to permanent
employment and from part-time to full-time were much more common than the EU
average.
-50
0
50
100
150
200
250
Female employment rate
Male employment rate
Youth employment rate
Older workers employment rate
Gender variance in hours worked per week
LTU as % of all unemployment
Youth unemployment rate
Female unemployment
rate
Older workers
unemployment rate
PL Pre-2007 PL Post-2007 EU27
-200-150-100
-500
50100150200250
Temporary employees
as percentage of the total number of
employees (15-64)
Involuntary part time employment (% of all
part-time employment)
Involuntary temporary employment
Transition of
employees with a temporary job to employee with a permanent job
Employed persons
working part-time transition to full-time
work
PL Pre-2007 PL Post-2007 PL Post-2007
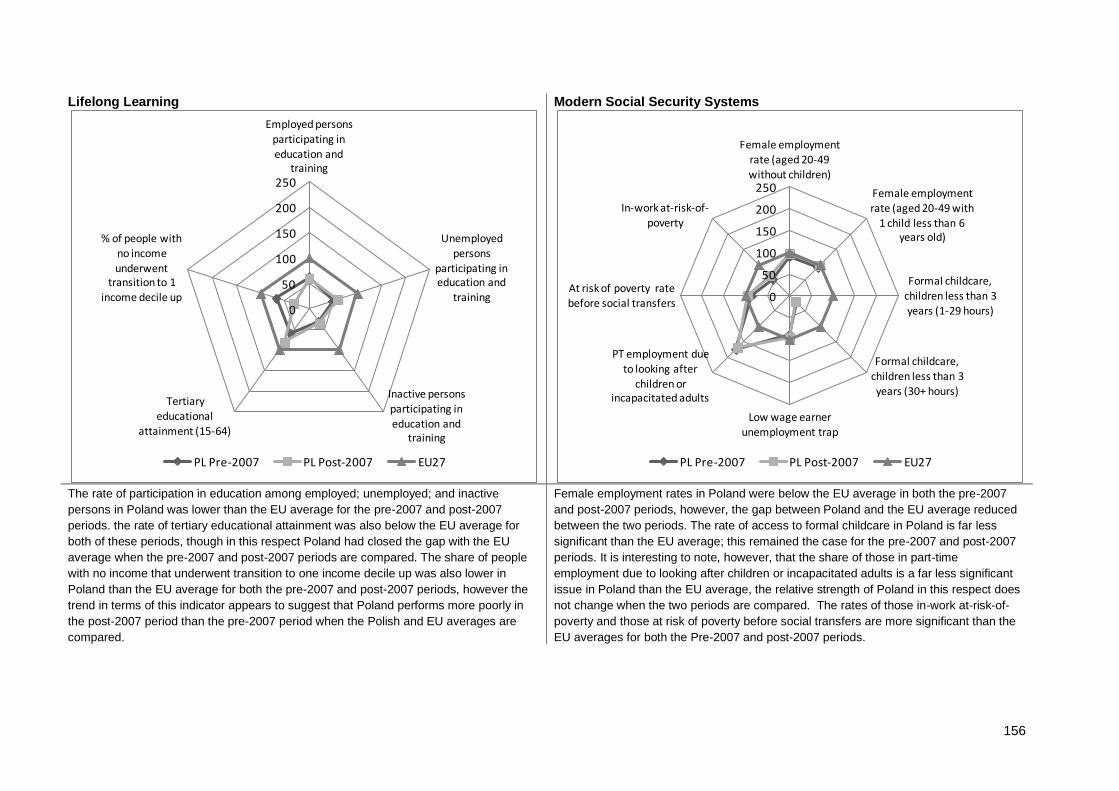
156
Lifelong Learning
Modern Social Security Systems
The rate of participation in education among employed; unemployed; and inactive
persons in Poland was lower than the EU average for the pre-2007 and post-2007
periods. the rate of tertiary educational attainment was also below the EU average for
both of these periods, though in this respect Poland had closed the gap with the EU
average when the pre-2007 and post-2007 periods are compared. The share of people
with no income that underwent transition to one income decile up was also lower in
Poland than the EU average for both the pre-2007 and post-2007 periods, however the
trend in terms of this indicator appears to suggest that Poland performs more poorly in
the post-2007 period than the pre-2007 period when the Polish and EU averages are
compared.
Female employment rates in Poland were below the EU average in both the pre-2007
and post-2007 periods, however, the gap between Poland and the EU average reduced
between the two periods. The rate of access to formal childcare in Poland is far less
significant than the EU average; this remained the case for the pre-2007 and post-2007
periods. It is interesting to note, however, that the share of those in part-time
employment due to looking after children or incapacitated adults is a far less significant
issue in Poland than the EU average, the relative strength of Poland in this respect does
not change when the two periods are compared. The rates of those in-work at-risk-of-
poverty and those at risk of poverty before social transfers are more significant than the
EU averages for both the Pre-2007 and post-2007 periods.
0
50
100
150
200
250
Employed persons participating in education and
training
Unemployed persons
participating in education and
training
Inactive persons participating in education and
training
Tertiary educational
attainment (15-64)
% of people with no income
underwent transition to 1
income decile up
PL Pre-2007 PL Post-2007 EU27
0
50
100
150
200
250
Female employment rate (aged 20-49 without children)
Female employment rate (aged 20-49 with
1 child less than 6 years old)
Formal childcare,
children less than 3 years (1-29 hours)
Formal childcare,
children less than 3 years (30+ hours)
Low wage earner unemployment trap
PT employment due to looking after
children or incapacitated adults
At risk of poverty rate before social transfers
In-work at-risk-of-poverty
PL Pre-2007 PL Post-2007 EU27
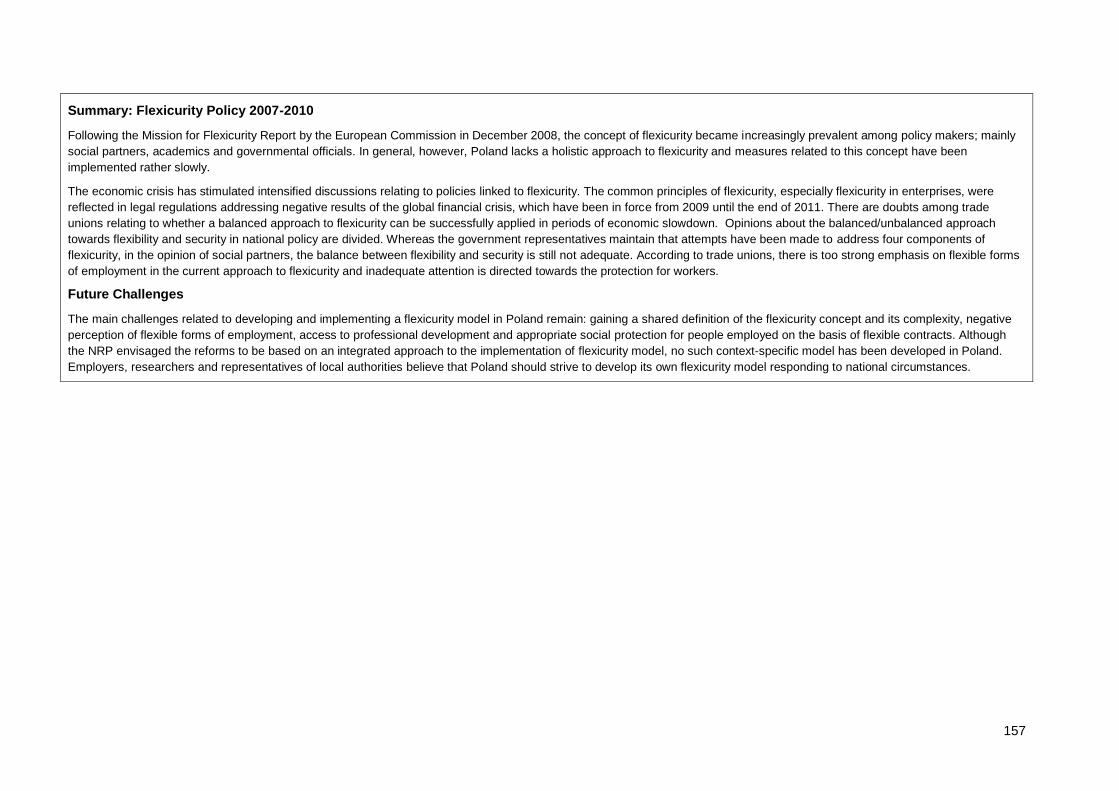
157
Summary: Flexicurity Policy 2007-2010
Following the Mission for Flexicurity Report by the European Commission in December 2008, the concept of flexicurity became increasingly prevalent among policy makers; mainly
social partners, academics and governmental officials. In general, however, Poland lacks a holistic approach to flexicurity and measures related to this concept have been
implemented rather slowly.
The economic crisis has stimulated intensified discussions relating to policies linked to flexicurity. The common principles of flexicurity, especially flexicurity in enterprises, were
reflected in legal regulations addressing negative results of the global financial crisis, which have been in force from 2009 until the end of 2011. There are doubts among trade
unions relating to whether a balanced approach to flexicurity can be successfully applied in periods of economic slowdown. Opinions about the balanced/unbalanced approach
towards flexibility and security in national policy are divided. Whereas the government representatives maintain that attempts have been made to address four components of
flexicurity, in the opinion of social partners, the balance between flexibility and security is still not adequate. According to trade unions, there is too strong emphasis on flexible forms
of employment in the current approach to flexicurity and inadequate attention is directed towards the protection for workers.
Future Challenges
The main challenges related to developing and implementing a flexicurity model in Poland remain: gaining a shared definition of the flexicurity concept and its complexity, negative
perception of flexible forms of employment, access to professional development and appropriate social protection for people employed on the basis of flexible contracts. Although
the NRP envisaged the reforms to be based on an integrated approach to the implementation of flexicurity model, no such context-specific model has been developed in Poland.
Employers, researchers and representatives of local authorities believe that Poland should strive to develop its own flexicurity model responding to national circumstances.

158
22 Portugal
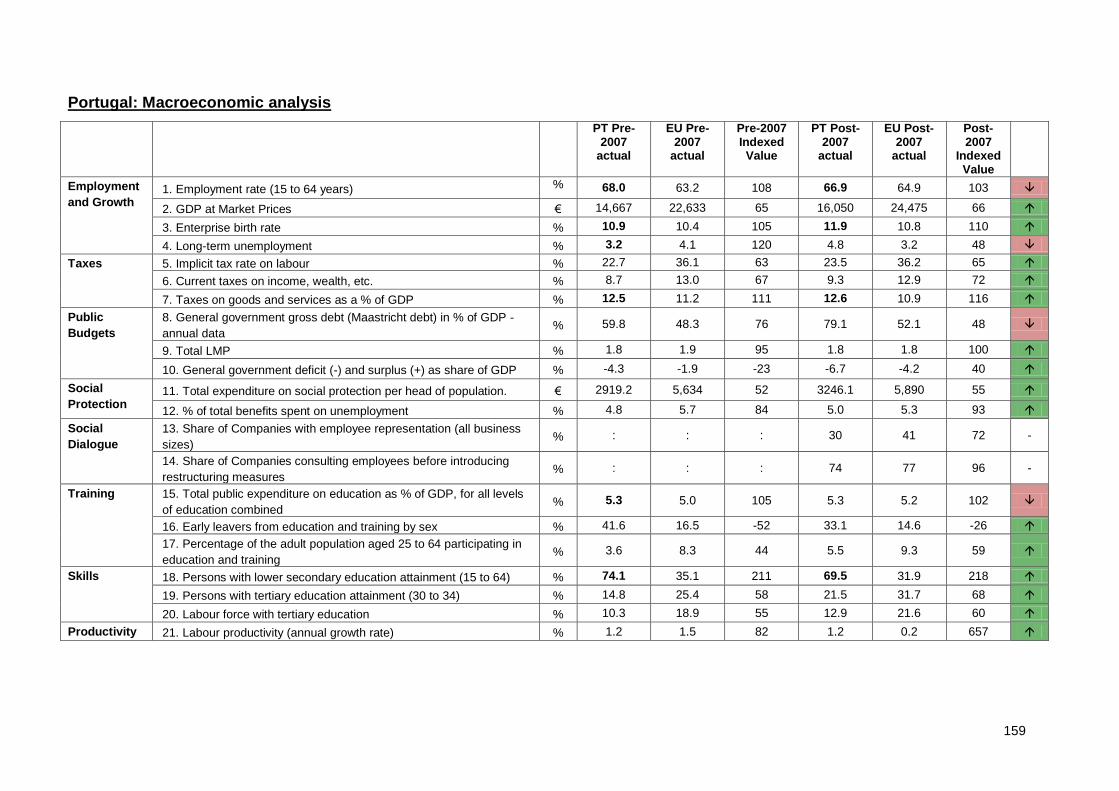
159
Portugal: Macroeconomic analysis
PT Pre-2007
actual
EU Pre-2007
actual
Pre-2007 Indexed Value
PT Post-2007
actual
EU Post-2007
actual
Post-2007
Indexed Value
Employment
and Growth 1. Employment rate (15 to 64 years) % 68.0 63.2 108 66.9 64.9 103
2. GDP at Market Prices € 14,667 22,633 65 16,050 24,475 66
3. Enterprise birth rate % 10.9 10.4 105 11.9 10.8 110
4. Long-term unemployment % 3.2 4.1 120 4.8 3.2 48
Taxes 5. Implicit tax rate on labour % 22.7 36.1 63 23.5 36.2 65
6. Current taxes on income, wealth, etc. % 8.7 13.0 67 9.3 12.9 72
7. Taxes on goods and services as a % of GDP % 12.5 11.2 111 12.6 10.9 116
Public
Budgets
8. General government gross debt (Maastricht debt) in % of GDP -
annual data % 59.8 48.3 76 79.1 52.1 48
9. Total LMP % 1.8 1.9 95 1.8 1.8 100
10. General government deficit (-) and surplus (+) as share of GDP % -4.3 -1.9 -23 -6.7 -4.2 40
Social
Protection 11. Total expenditure on social protection per head of population. € 2919.2 5,634 52 3246.1 5,890 55
12. % of total benefits spent on unemployment % 4.8 5.7 84 5.0 5.3 93
Social
Dialogue
13. Share of Companies with employee representation (all business
sizes) % : : : 30 41 72 -
14. Share of Companies consulting employees before introducing
restructuring measures % : : : 74 77 96 -
Training 15. Total public expenditure on education as % of GDP, for all levels
of education combined % 5.3 5.0 105 5.3 5.2 102
16. Early leavers from education and training by sex % 41.6 16.5 -52 33.1 14.6 -26
17. Percentage of the adult population aged 25 to 64 participating in
education and training % 3.6 8.3 44 5.5 9.3 59
Skills 18. Persons with lower secondary education attainment (15 to 64) % 74.1 35.1 211 69.5 31.9 218
19. Persons with tertiary education attainment (30 to 34) % 14.8 25.4 58 21.5 31.7 68
20. Labour force with tertiary education % 10.3 18.9 55 12.9 21.6 60
Productivity 21. Labour productivity (annual growth rate) % 1.2 1.5 82 1.2 0.2 657
160
Employment and Growth: Portugal scores well when employment and growth indicators are considered and all are above average in both the pre and post- 2007 period, with the
exception of GDP. The employment rate in Portugal is 5 percentage points above the EU in pre-2007 (68% compared to 63%), however by post-2007 it had decreased slightly to 67%
while the EU average had risen to 65%. The GDP rate is below average for both periods - €14,667 compared to €22,633 in pre-2007 period and €16,050 compared to €24,475 in the
post-2007 period. The enterprise birth rate has increased from 10.9% to 11.9%, while the EU rate has improved from 10 to 11. Long term unemployment is considerably better (i.e.
lower) than the EU average with 3.2% LTU pre-2007 compared to 4.1% across Europe. While it increased by the post-2007 period to 4.8%, the EU average LTU decreased to 3.2%
leading to a decreased index figure from 120 to 48.
Taxes: Taxation on income and wealth is below average for both periods but has improved against the EU from 63 to 65. Implicit tax rate on labour is below average for both periods,
although has increased from 22.7% to 23.5% between the pre and post-2007 periods compared to a smaller increase of 36.1% to 36.2% across the EU. Taxes on goods and services as
a share of GDP are above average – however only slightly with a pre-2007 rate of 12.5% compared to the EU’s 11.2% and post-2007 rate of 12.6% compared to 10.9% across the EU.
Public Budgets: When gross government debt is considered as a share of GDP pre-2007, Portugal has debt of 59.8% compared to 48.3% across the EU. However this rose
considerably to the post-2007 period with a debt of 79.1% compared to 52.1% EU average. Total labour market policy is almost the same as the EU with expenditure of 1.8% of GDP
compared to 1.9% across the EU more broadly. This remained stable to the post-2007 period, while the EU average decreased slightly to 1.8%. Portugal has a general government
deficit of 4.3 compared to an EU deficit of 1.9. This dropped significantly by post-2007 with a deficit of 6.7compared to a deficit of 4.2 across the EU.
Social Protection: Total expenditure on social protection is below average €2,919 (compared to €5,634). Expenditure increased in Portugal in the post-2007 period with an average
expenditure of €3,246 compared to an increase to €5,890 across the EU. The share of benefits spent on unemployment in Portugal is also below average with 4.8% compared to an EU
average of 5.7%. By the post-2007 period, while the share of benefits spent on unemployment increased in Portugal – expenditure across the EU increased (5% spent in Portugal
compared to 5.3% in the EU).
Social Dialogue: The share of companies with employee representation in Portugal is well below the average (10 compared to 41 across the EU) however 74% of companies are likely
to consult employees prior to the introduction of restructuring measures compared to an EU average of 77%.
Training: Public expenditure on education as a share of GDP is just above average in Portugal and has remained consistent (5.3% pre and post-2007 period – compared to 5% and
5.2% in the EU). The share of the adult population participating in education and training is below the EU average in both periods – with 3.6% engaged in training pre-2007 compared to
8.3% of people across the EU. By the post-2007 period the rate increased to 5.5%, while in the EU this rate increased to 9.3%.
Skills: While lower secondary attainment is above average in both periods and has declined over time (from 74.1% to 69.5% compared to an EU average decline from 35.1% to 31.9%),
tertiary education attainment is below average. In the pre-2007 period, 14.8% of 30-34s had tertiary attainment compared to 25.4% in the EU – with a rise to 21.5% in Portugal in the
post-2007 period, compared to 31.7% EU average. Similarly, the share of the labour force with tertiary education is below average and has risen in real terms from 10.3% to 12.9%,
however when compared to the EU its position has increased slightly from an index of 55 to 60.
Productivity: the annual growth rate in productivity is above average pre-2007 at 1.2% compared to 1.5% across the EU. This remained consistent for the post-2007 period in Portugal
compared to slight growth of 0.2% across the EU.
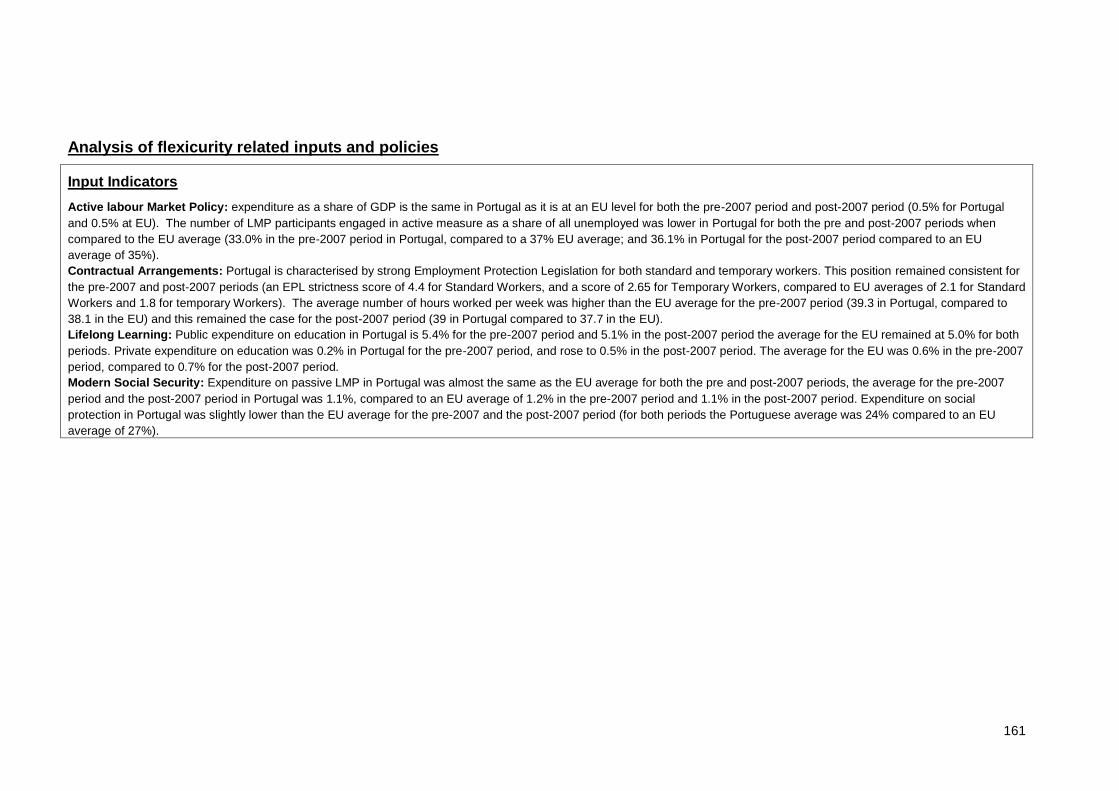
161
Analysis of flexicurity related inputs and policies
Input Indicators
Active labour Market Policy: expenditure as a share of GDP is the same in Portugal as it is at an EU level for both the pre-2007 period and post-2007 period (0.5% for Portugal
and 0.5% at EU). The number of LMP participants engaged in active measure as a share of all unemployed was lower in Portugal for both the pre and post-2007 periods when
compared to the EU average (33.0% in the pre-2007 period in Portugal, compared to a 37% EU average; and 36.1% in Portugal for the post-2007 period compared to an EU
average of 35%).
Contractual Arrangements: Portugal is characterised by strong Employment Protection Legislation for both standard and temporary workers. This position remained consistent for
the pre-2007 and post-2007 periods (an EPL strictness score of 4.4 for Standard Workers, and a score of 2.65 for Temporary Workers, compared to EU averages of 2.1 for Standard
Workers and 1.8 for temporary Workers). The average number of hours worked per week was higher than the EU average for the pre-2007 period (39.3 in Portugal, compared to
38.1 in the EU) and this remained the case for the post-2007 period (39 in Portugal compared to 37.7 in the EU).
Lifelong Learning: Public expenditure on education in Portugal is 5.4% for the pre-2007 period and 5.1% in the post-2007 period the average for the EU remained at 5.0% for both
periods. Private expenditure on education was 0.2% in Portugal for the pre-2007 period, and rose to 0.5% in the post-2007 period. The average for the EU was 0.6% in the pre-2007
period, compared to 0.7% for the post-2007 period.
Modern Social Security: Expenditure on passive LMP in Portugal was almost the same as the EU average for both the pre and post-2007 periods, the average for the pre-2007
period and the post-2007 period in Portugal was 1.1%, compared to an EU average of 1.2% in the pre-2007 period and 1.1% in the post-2007 period. Expenditure on social
protection in Portugal was slightly lower than the EU average for the pre-2007 and the post-2007 period (for both periods the Portuguese average was 24% compared to an EU
average of 27%).
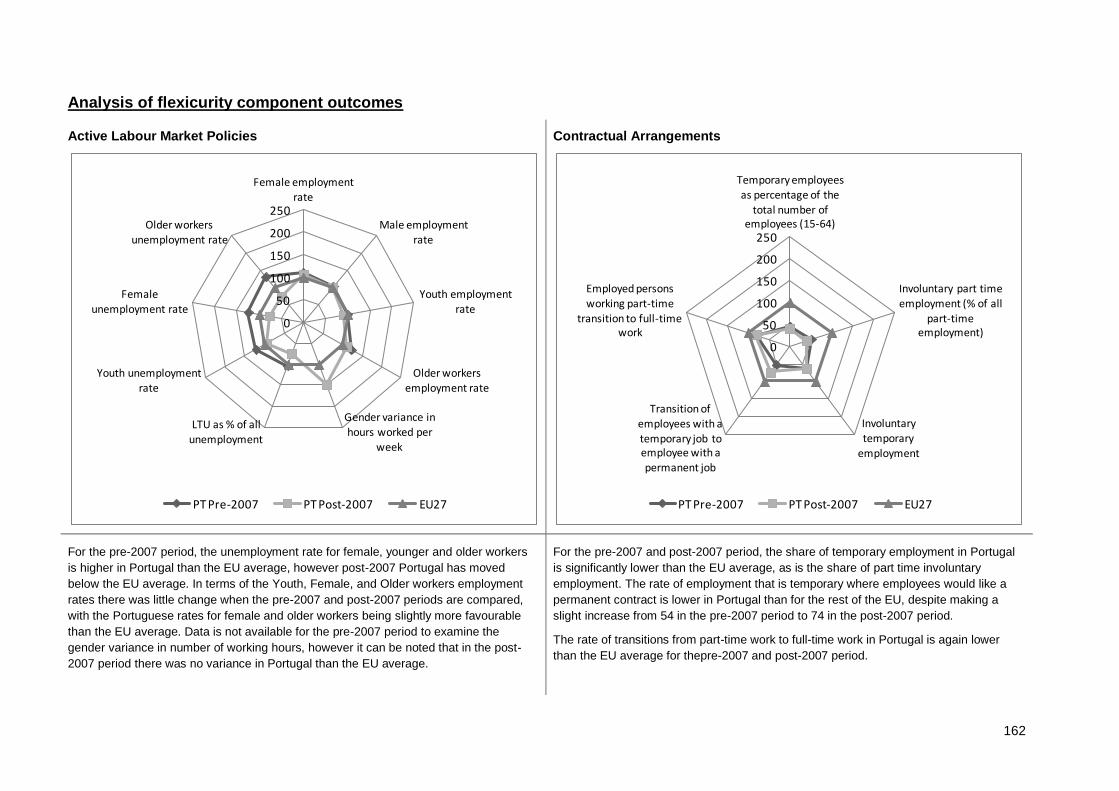
162
Analysis of flexicurity component outcomes
Active Labour Market Policies
Contractual Arrangements
For the pre-2007 period, the unemployment rate for female, younger and older workers
is higher in Portugal than the EU average, however post-2007 Portugal has moved
below the EU average. In terms of the Youth, Female, and Older workers employment
rates there was little change when the pre-2007 and post-2007 periods are compared,
with the Portuguese rates for female and older workers being slightly more favourable
than the EU average. Data is not available for the pre-2007 period to examine the
gender variance in number of working hours, however it can be noted that in the post-
2007 period there was no variance in Portugal than the EU average.
For the pre-2007 and post-2007 period, the share of temporary employment in Portugal
is significantly lower than the EU average, as is the share of part time involuntary
employment. The rate of employment that is temporary where employees would like a
permanent contract is lower in Portugal than for the rest of the EU, despite making a
slight increase from 54 in the pre-2007 period to 74 in the post-2007 period.
The rate of transitions from part-time work to full-time work in Portugal is again lower
than the EU average for thepre-2007 and post-2007 period.
0
50
100
150
200
250
Female employment rate
Male employment rate
Youth employment
rate
Older workers employment rate
Gender variance in hours worked per
week
LTU as % of all unemployment
Youth unemployment rate
Female
unemployment rate
Older workers unemployment rate
PT Pre-2007 PT Post-2007 EU27
0
50
100
150
200
250
Temporary employees as percentage of the
total number of employees (15-64)
Involuntary part time employment (% of all
part-time employment)
Involuntary temporary
employment
Transition of employees with a temporary job to employee with a permanent job
Employed persons working part-time
transition to full-time work
PT Pre-2007 PT Post-2007 EU27
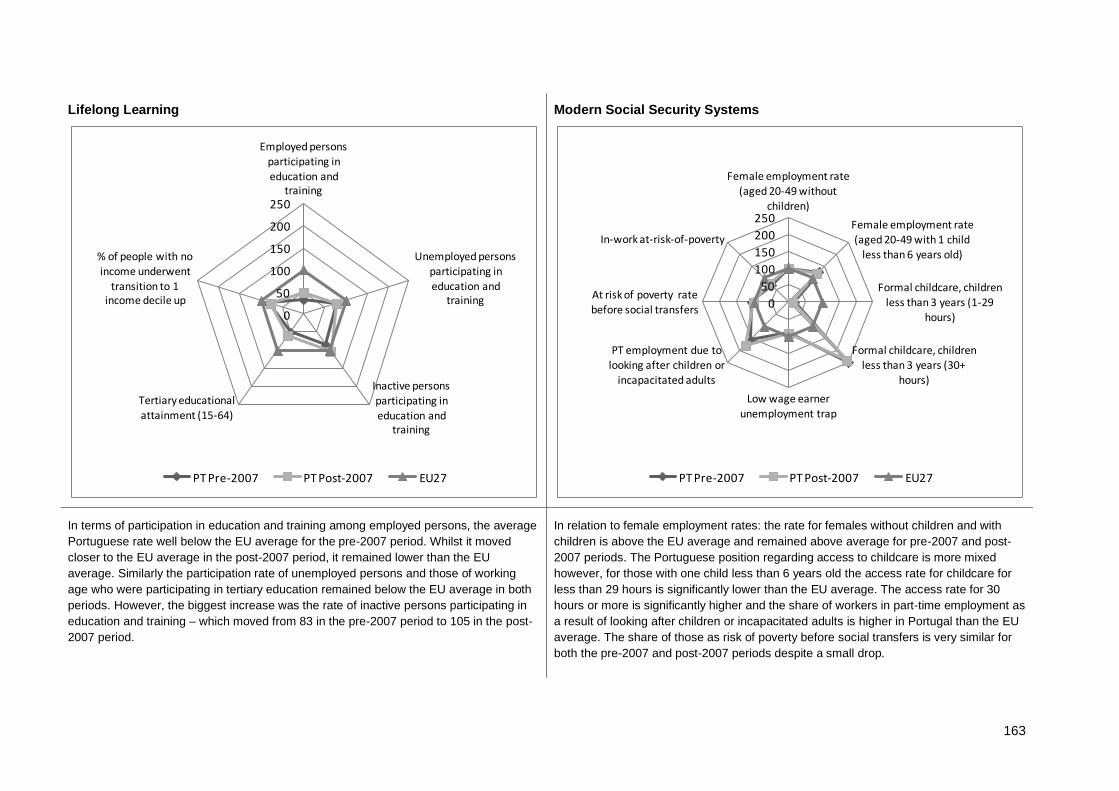
163
Lifelong Learning
Modern Social Security Systems
In terms of participation in education and training among employed persons, the average
Portuguese rate well below the EU average for the pre-2007 period. Whilst it moved
closer to the EU average in the post-2007 period, it remained lower than the EU
average. Similarly the participation rate of unemployed persons and those of working
age who were participating in tertiary education remained below the EU average in both
periods. However, the biggest increase was the rate of inactive persons participating in
education and training – which moved from 83 in the pre-2007 period to 105 in the post-
2007 period.
In relation to female employment rates: the rate for females without children and with
children is above the EU average and remained above average for pre-2007 and post-
2007 periods. The Portuguese position regarding access to childcare is more mixed
however, for those with one child less than 6 years old the access rate for childcare for
less than 29 hours is significantly lower than the EU average. The access rate for 30
hours or more is significantly higher and the share of workers in part-time employment as
a result of looking after children or incapacitated adults is higher in Portugal than the EU
average. The share of those as risk of poverty before social transfers is very similar for
both the pre-2007 and post-2007 periods despite a small drop.
0
50
100
150
200
250
Employed persons participating in education and
training
Unemployed persons participating in education and
training
Inactive persons participating in education and
training
Tertiary educational attainment (15-64)
% of people with no income underwent
transition to 1 income decile up
PT Pre-2007 PT Post-2007 EU27
0
50
100
150
200
250
Female employment rate (aged 20-49 without
children)
Female employment rate (aged 20-49 with 1 child
less than 6 years old)
Formal childcare, children less than 3 years (1-29
hours)
Formal childcare, children less than 3 years (30+
hours)
Low wage earner
unemployment trap
PT employment due to looking after children or
incapacitated adults
At risk of poverty rate before social transfers
In-work at-risk-of-poverty
PT Pre-2007 PT Post-2007 EU27
164
Summary: Flexicurity Policy 2007-2010
Portugal performs well in relation to employment and growth indicators at a macro-economic level. The employment level in Portugal is above the EU average (and has remained
consistent over the two periods). Although GDP increased, it is still lower compared to the average across Europe. Taxation on income and wealth along with implicit rate on labour
is below average for both periods. However, taxes on goods and services as a share of GDP are above average. Despite expenditure on social protection and the share of benefits
spent on unemployment being below average, public expenditure on education is above average. Training and skills indicators showed that the share of the adult population
participating in education and training is below the EU average as is tertiary education attainment. However, lower secondary attainment remained above average between both
periods.
With regards to active labour market policy the number of LMP participants engaged in active measure as a share of all unemployed was lower in Portugal than the EU.
Furthermore, unemployment rates for female, younger and older workers are higher in Portugal in the pre-2007 period, but declined by the post-2007 period bringing it into line with
the EU average. Portugal is characterised by strong Employment Protection Legislation for both standard and temporary workers and the average number of hours worked per week
was higher than the EU average for both periods. Participation rates of employed persons, unemployed persons and those of working age were below the EU average. However, the
rate of inactive people engaged with education and training was significantly higher in Portugal by the post-2007 period. When it came to modern social security systems,
expenditure on passive LMP in Portugal was almost the same as the EU average for both periods, while spend on social protection in was slightly lower than the EU average for the
same period. Despite employment rates being high for females with and without children, the Portuguese position regarding access to childcare is more mixed. For example, for
those with one child less than 6 years old the access rate for childcare for less than 29 hours is significantly lower than the EU average, whereas the access rate for 30 hours or
more is significantly higher.

165
23 Romania
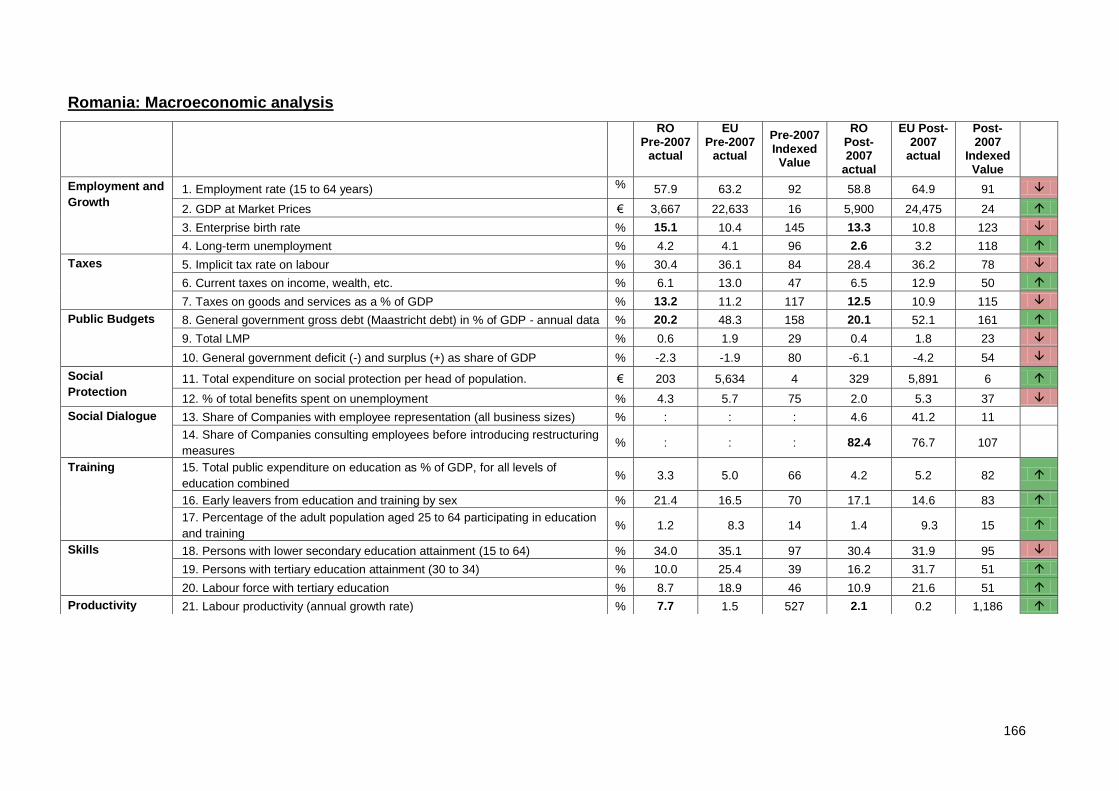
166
Romania: Macroeconomic analysis
RO Pre-2007
actual
EU Pre-2007
actual
Pre-2007 Indexed Value
RO Post-2007
actual
EU Post-2007
actual
Post-2007
Indexed Value
Employment and
Growth 1. Employment rate (15 to 64 years) % 57.9 63.2 92 58.8 64.9 91
2. GDP at Market Prices € 3,667 22,633 16 5,900 24,475 24
3. Enterprise birth rate % 15.1 10.4 145 13.3 10.8 123
4. Long-term unemployment % 4.2 4.1 96 2.6 3.2 118
Taxes 5. Implicit tax rate on labour % 30.4 36.1 84 28.4 36.2 78
6. Current taxes on income, wealth, etc. % 6.1 13.0 47 6.5 12.9 50
7. Taxes on goods and services as a % of GDP % 13.2 11.2 117 12.5 10.9 115
Public Budgets 8. General government gross debt (Maastricht debt) in % of GDP - annual data % 20.2 48.3 158 20.1 52.1 161
9. Total LMP % 0.6 1.9 29 0.4 1.8 23
10. General government deficit (-) and surplus (+) as share of GDP % -2.3 -1.9 80 -6.1 -4.2 54
Social
Protection 11. Total expenditure on social protection per head of population. € 203 5,634 4 329 5,891 6
12. % of total benefits spent on unemployment % 4.3 5.7 75 2.0 5.3 37
Social Dialogue 13. Share of Companies with employee representation (all business sizes) % : : : 4.6 41.2 11
14. Share of Companies consulting employees before introducing restructuring
measures % : : : 82.4 76.7 107
Training 15. Total public expenditure on education as % of GDP, for all levels of
education combined % 3.3 5.0 66 4.2 5.2 82
16. Early leavers from education and training by sex % 21.4 16.5 70 17.1 14.6 83
17. Percentage of the adult population aged 25 to 64 participating in education
and training % 1.2 8.3 14 1.4 9.3 15
Skills 18. Persons with lower secondary education attainment (15 to 64) % 34.0 35.1 97 30.4 31.9 95
19. Persons with tertiary education attainment (30 to 34) % 10.0 25.4 39 16.2 31.7 51
20. Labour force with tertiary education % 8.7 18.9 46 10.9 21.6 51
Productivity 21. Labour productivity (annual growth rate) % 7.7 1.5 527 2.1 0.2 1,186
167
Employment and Growth: In Romania, the employment rate among the 15 to 64 population is below average and has got slightly worse over time in real terms and when the indexed
figures are considered. The enterprise birth rate is above average for both periods, although it declined slightly from pre-2007 to post-2007 from 15.1% to 13.3%, compared to an
increase of 10.4% to 10.8% across the EU. Long term unemployment has improved between the two periods decreasing in real terms from 4.2% to 2.6%, leading to an increase of index
from 96 to 118. GDP at market prices remains significantly below the EU average in both periods, although it rose towards the EU index from 16 to 24 by post-2007, although in real
terms GDP of €590 in Romania compared to an EU average of €24,475.
Taxes: Taxation in Romania is below average except where taxation on goods and services is considered which is above average for both periods. Current taxation on income and
wealth scores 47 pre-2007 (6.1%) compared to the EU average of 100 and rose slightly by the post-2007 period to 50 (6.5%). Implicit taxation on labour decreased from 30.4% pre-2007
to 28.4% post-2007.
Public Budgets: The general government gross debt is below the EU average in Romania and has improved from pre to post-2007 from 20.2% to 20.1% compared to a decline of
48.3% to 52.1% in the EU. The government deficit however was worse than the EU average for both the pre and post-2007 periods and in fact worsened from -2.3% to -6.1% compared
to an EU decline of -1.9% to -4.2%.
Social Protection: Total public expenditure on social protection is significantly under the EU average. Pre-2007, €203 was spent per person compared to an EU average of €5,634.
While the level of expenditure increased post-2007, it remained significantly below average (€329 compared to €5,891). The share of benefits spent on employment is also sub-average
and has worsened over time with 4.3% spent pre-2007, compared to 2% post-2008 compared to a decline of 5.7% to 5.3% across the EU.
Social Dialogue: While the share of companies with employee representation is significantly below average (4.6%) post-2007 compared to 41.2% across the EU, the share of
companies consulting employees prior to restructuring is above average – 82.4% compared to the EU share of 76.7%. No data was available for pre-2007.
Training: Public expenditure on education has improved between the pre and post-2007 periods but remains below the EU average, with 3.3% spent pre-2007 and 4.2% spent post-
2007, compared to 5% and 5.2% in the EU. Participation in education and training is below average but has improved slightly over time when compared to the EU (from an index of 14 to
15 and a rise in real terms from 1.2% to 1.4% compared to 8.3% and 9.3% in the EU). Early leavers from education and training is also above average in Romania – with 21.4% leaving
education early in the pre-2007 period, compared to 16.5% across the EU. Early leavers reduced from the pre-2007 to the post-2007 period to 17.1% compared to an EU average of
14.6%, leading to an improved index score of 83 (up from 70 pre-2007).
Skills: While persons with lower secondary educational attainment is around the EU average pre-2007 (with 34% attaining lower secondary education compared to 35.1% in the EU),
there was a slight decrease by post-2007 to 30.4% which led to a decrease in the indexed score from 97 to 95. Tertiary educational attainment (30 to 34 years) is below the EU average
in both periods, however improved from 10% pre-2007 to 16.2% post-2007. Despite the improvement, this compares to a rate of 25.4% across the EU pre-2007 which increased to
31.7% in the post-2007 period. The share of the labour force with tertiary education is also below average and whilst it improved from 8.7% to 10.9% between pre and post-2007, it
remained below average.
Productivity: The annual growth rate for labour productivity slowed from 7.7% to 2.1% between pre and post-2007 in Romania, but this was compared to a decrease from 1.5% to 0.2%
which meant that Romania is considered better than the EU average for both periods.
168
Analysis of flexicurity related inputs and policies
Input Indicators
Active labour Market Policy: Expenditure on labour market policy in pre-2007 as a share of Romanian GDP (0.1%) is much lower than the EU average (0.5%) and decreased slightly
in the post-2007 period (0.06%) while the EU average remained unchanged. The number of participants engaging in LMP measures divided by the number of people wanting to work is
also lower in Romania (27.1%) when compared to the EU average for the pre-2007 period (37%). This had worsened by the post-2007 period with 23.3% investment compared to an EU
average of 35%.
Contractual Arrangements: There was no data available relating to employment protection legislation for standard or temporary workers in Romania.
Lifelong Learning: Expenditure on education in Romania is below average when compared to the EU however it has improved between the pre and post 2007 periods. Total public
expenditure as a share of GDP improved from 3.4% to 4.3%, compared to an EU average of 5%; while private expenditure increased from 0.3% to 0.5% compared to an increase across
the EU of 0.6% to 0.7%.
Modern Social Security: Expenditure on passive labour market policy is below the EU average for both periods, and therefore considered to be better. In fact 0.42% and 0.26% was
spent on passive LMP in pre-2007 and post-2007 respectively compared to 1.2% and 1.1% respectively across the EU. However, expenditure on social protection is worse than the EU
average, with half the expenditure in pre-2007 (13.07% compared to 26.9% across the EU) and only a slight improvement in post-2007 (14.96% compared to 27.3% in the EU).
Policy Development
The concept of flexicurity slowly becomes common knowledge and acquires significance in Romania. Policy measures adopted recently have not been justified to the Romanian public in
relation to flexicurity however there has been an increased awareness of flexicurity as a concept more recently as a result of the European Commission’s flexicurity initiative. Social
partners (especially trade unions) are generally suspicious of the term as the recent measures adopted in Romania have focused entirely on introducing more flexibility, especially
external flexibility into the economy. However these measures are not the result of a move to flexicurity per se and are more likely the result of the economic crisis as the government
seeks to stabilise the Romanian financial situation.
Policy developments include:
A thorough reform of the public pension system - to discourage early and invalidity-related retirement and to (temporarily) remove the link between salaries and the value of the
pension. The reform also included increases in the contribution period. The statutory retirement age for women rose by 3 years from 60 to 63, with the new statutory age to be
reached 2030;
A thorough reform of the Labour Code so as to increase flexibility for enterprises and easing rules for enterprises to hire and fire; and,
A sweeping change of the country’s social dialogue laws to eliminate national collective bargaining and revamp rules for unions and employers organisations’ representation. This has
made decision-making structures more difficult to trade unions and employers resulting in a boycott by trade unions.
The result is arguably the relative absence of a national flexicurity pathway in Romania. All of the measures were introduced against a backdrop of tough austerity and a bout of severe
internal devaluation. This led to major cuts to public spending, including expenditure on social protection and benefits to the unemployed. However a new unemployment insurance act is
currently pending.
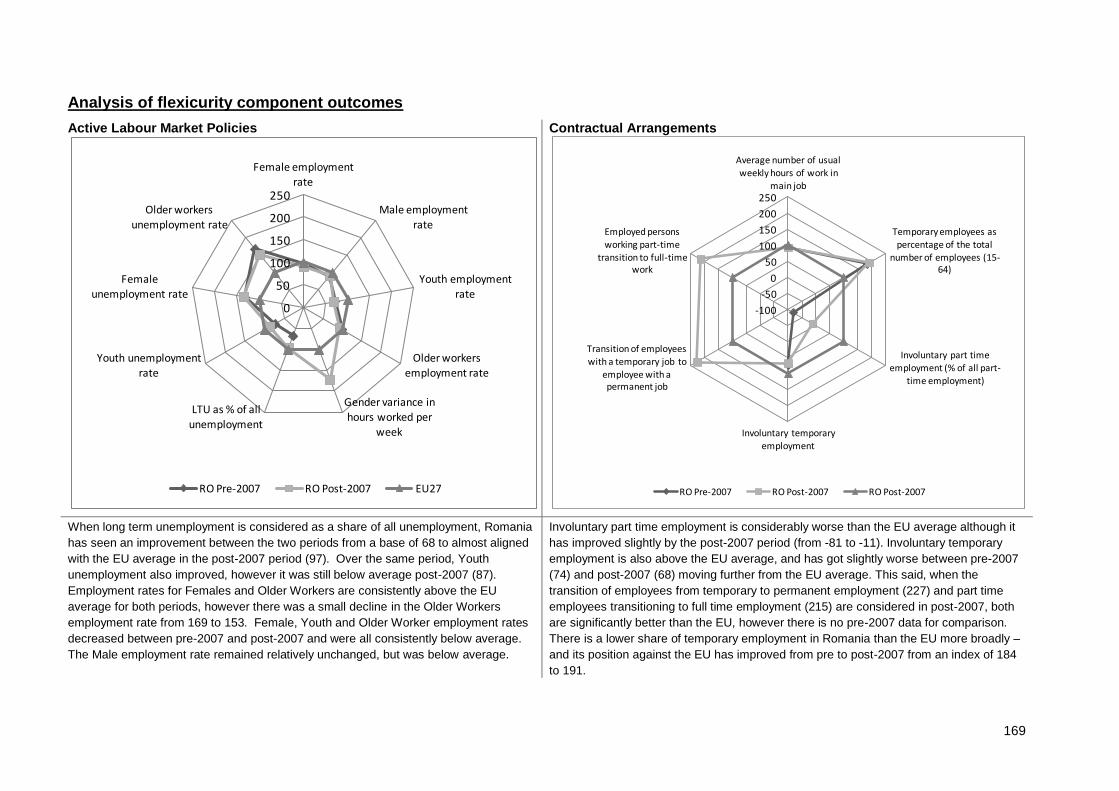
169
Analysis of flexicurity component outcomes
Active Labour Market Policies
Contractual Arrangements
When long term unemployment is considered as a share of all unemployment, Romania
has seen an improvement between the two periods from a base of 68 to almost aligned
with the EU average in the post-2007 period (97). Over the same period, Youth
unemployment also improved, however it was still below average post-2007 (87).
Employment rates for Females and Older Workers are consistently above the EU
average for both periods, however there was a small decline in the Older Workers
employment rate from 169 to 153. Female, Youth and Older Worker employment rates
decreased between pre-2007 and post-2007 and were all consistently below average.
The Male employment rate remained relatively unchanged, but was below average.
Involuntary part time employment is considerably worse than the EU average although it
has improved slightly by the post-2007 period (from -81 to -11). Involuntary temporary
employment is also above the EU average, and has got slightly worse between pre-2007
(74) and post-2007 (68) moving further from the EU average. This said, when the
transition of employees from temporary to permanent employment (227) and part time
employees transitioning to full time employment (215) are considered in post-2007, both
are significantly better than the EU, however there is no pre-2007 data for comparison.
There is a lower share of temporary employment in Romania than the EU more broadly –
and its position against the EU has improved from pre to post-2007 from an index of 184
to 191.
0
50
100
150
200
250
Female employment rate
Male employment
rate
Youth employment rate
Older workers employment rate
Gender variance in hours worked per
week
LTU as % of all unemployment
Youth unemployment rate
Female unemployment rate
Older workers
unemployment rate
RO Pre-2007 RO Post-2007 EU27
-100
-50
0
50
100
150
200
250
Average number of usual weekly hours of work in
main job
Temporary employees as percentage of the total
number of employees (15-64)
Involuntary part time
employment (% of all part-
time employment)
Involuntary temporary employment
Transition of employees with a temporary job to
employee with a permanent job
Employed persons working part-time
transition to full-time work
RO Pre-2007 RO Post-2007 RO Post-2007
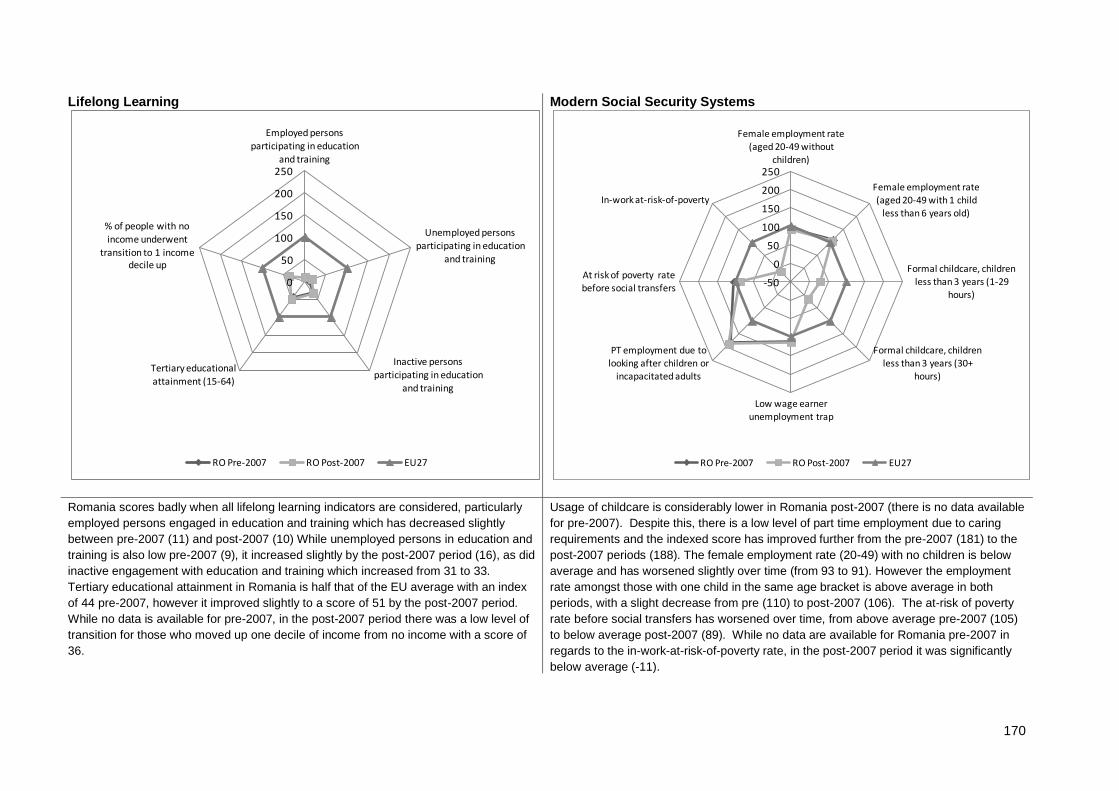
170
Lifelong Learning
Modern Social Security Systems
Romania scores badly when all lifelong learning indicators are considered, particularly
employed persons engaged in education and training which has decreased slightly
between pre-2007 (11) and post-2007 (10) While unemployed persons in education and
training is also low pre-2007 (9), it increased slightly by the post-2007 period (16), as did
inactive engagement with education and training which increased from 31 to 33.
Tertiary educational attainment in Romania is half that of the EU average with an index
of 44 pre-2007, however it improved slightly to a score of 51 by the post-2007 period.
While no data is available for pre-2007, in the post-2007 period there was a low level of
transition for those who moved up one decile of income from no income with a score of
36.
Usage of childcare is considerably lower in Romania post-2007 (there is no data available
for pre-2007). Despite this, there is a low level of part time employment due to caring
requirements and the indexed score has improved further from the pre-2007 (181) to the
post-2007 periods (188). The female employment rate (20-49) with no children is below
average and has worsened slightly over time (from 93 to 91). However the employment
rate amongst those with one child in the same age bracket is above average in both
periods, with a slight decrease from pre (110) to post-2007 (106). The at-risk of poverty
rate before social transfers has worsened over time, from above average pre-2007 (105)
to below average post-2007 (89). While no data are available for Romania pre-2007 in
regards to the in-work-at-risk-of-poverty rate, in the post-2007 period it was significantly
below average (-11).
0
50
100
150
200
250
Employed persons
participating in education
and training
Unemployed persons
participating in education
and training
Inactive persons
participating in education and training
Tertiary educational attainment (15-64)
% of people with no income underwent
transition to 1 income decile up
RO Pre-2007 RO Post-2007 EU27
-50
0
50
100
150
200
250
Female employment rate (aged 20-49 without
children)
Female employment rate (aged 20-49 with 1 child
less than 6 years old)
Formal childcare, children less than 3 years (1-29
hours)
Formal childcare, children less than 3 years (30+
hours)
Low wage earner
unemployment trap
PT employment due to looking after children or
incapacitated adults
At risk of poverty rate before social transfers
In-work at-risk-of-poverty
RO Pre-2007 RO Post-2007 EU27
171
Summary: Flexicurity Policy 2007-2010
When Romania is compared to EU averages, the macro-economic indicator for GDP is significantly below that of the EU and while it has improved over time, it remains below average.
Long term unemployment over the period however has improved. The enterprise birth rate is above average for both periods, however it has decreased from the pre to post-2007
periods. Indicators related to training and skills suggest that there has been improvement when compared to the EU average, however for all they remain below the EU average post-
2007, suggesting particular issues in relation to tertiary educational attainment and participation in education and training. Social protection indicators are poor – with low expenditure
on social protection and a low share of benefits spent on unemployment. Inputs to the four flexicurity components are also varied in Romania. Expenditure on labour market policy is
low and worsened from the pre-2007 to post-2007 periods when compared to the EU. Over the same period, public expenditure on education decreased and was consistently below
the EU average. Whilst private expenditure in education increased from pre to post-2007; it remained below the EU for both periods. Expenditure on passive labour market policy is
above average in Romania – however expenditure on social protection is considerably worse, with half the expenditure as a share of GDP than the average for the EU pre-2007.
Despite a small increase in the post-2007 period, it remains significantly below average.
Lifelong learning remains a considerable issue in Romania post-2007 with many indicators seeing a worsening position against the EU average from pre to post-2007. LLL is an
underdeveloped element of flexicurity in Romania – visible through low participation in education and training for those in employment and those outside of it – and possibly further
reflected by low levels of tertiary educational attainment in the working age population by the post-2007 period. Contractual arrangements present a varied picture of the situation in
Romania. While temporary employment is much better than the EU average, involuntary part time employment is significantly below the EU average in both periods and while it
improved post-2007 it remained a significant issue. Involuntary temporary employment was below average however it did improve by post-2007 and was closer to the EU average.
Despite high levels of involuntary temporary and part time employment, transition from temporary and part time employment to permanent roles is significantly above the EU average in
the post-2007 period suggesting that such employment is not necessarily a permanent feature of employment.
Employment rates in Romania have been consistently lower than across the EU in both the pre and post-2007 periods for Females, Males, Youth and Older Workers and, with the
exception of the Male employment rate, they all worsened against the EU to the post-2007 period. Long term unemployment however has seen improvement and was almost aligned
with the EU by post-2007. Female and Older Workers Unemployment rates are well above the EU average – however Youth unemployment remained an issue post-2007 period
although there had been improvement since pre-2007 against the EU average. Unemployment has been below the EU average during the crisis largely due to out-migration,
unemployment eligibility rules and the large percentage of workers in subsistence farming. When modern social security is considered, Romanian at-risk-of poverty rates are better than
average. However female employment is relatively low among the child-bearing age range for those with and without children. Use of childcare is also lower in Romania – and has
worsened considerably from pre-2007 to post-2007.
Romania’s approach to flexicurity was initially focused on a consensus approach – employment security was prioritised over job security and wage-support measures were offered to
employers. Furthermore a framework of action focusing on social dialogue which saw national collective bargaining at the core as a mainstay of an emergent national approach to
flexicurity was enacted. However, after 2008, the approach moved away from a consensus led approach and the balance shifted to flexibility and with a reduction of both job and
employment security and drastic cuts in wage support measures. The drastic reduction in collective bargaining at national and branch level has seriously eroded the opportunities for
debate on flexicurity. While there has been no debate on the concept of flexicurity in Romania and no real attempt to locate measures on the four core components under the umbrella
of flexicurity, the crisis and associated austerity measures led to a shift in the balance of flexicurity towards flexibility, with security reduced to the prevention and combat of undeclared
work.
Future challenges
The Government has to seek a restoration of the consensus approach and of the social dialogue without which any attempt of building a solid national pathway towards flexicurity is
172
doomed. The main challenge for the near future would be that of restoring the compulsory character of collective bargaining at sector/branch level and even of a certain measure, if
limited, of collective bargaining at national level. Without this, unions will be alienated and a national pathway towards flexicurity, if it will emerge, will be forever contested and thus
inherently shaky;
Temporary (determined duration) contracts will have to receive equal status with non-determined duration (permanent) contracts in the Labour Code. This will forever eliminate all of
the restrictions employers complain about when resorting o this type of contracts as well as ensure that rights of temporary workers are on equal footing with those of permanent
workers though one has to state that even today, no significant difference in this respect exists.
Vocational schools have to be restored/re-established. The existence of a special type of educational establishment dedicated to a specific education and training route is a must. It
does not only mean a boost for this type of education, of which much need is in Romania, but it also brings back this type of education where it belongs- i.e.: in specially dedicated
educational establishments that provide dedicated, vocation-oriented education and training, including the much-needed practical component! The current form, that of “technological
high-schools: was unfortunately providing neither;
So as to promote investment in human resources at enterprise level and thus meet the various challenges in terms of skill needs of employers the current system of subsidies as
provided by the unemployment insurance act would have to undergo a change. Its anchor, in terms of amounts provide to recipients, should no longer be the “social reference indicator”
as it is currently but rather the minimum salary.
Internship and apprenticeship should be more aggressively promoted as vehicles for enterprise-based human resources development in Romania. As many companies complain of the
quality of graduates from all strands and routes of education and training and as engaging into the more “formal” forms of vocational education and training comes rather expensive for
a company in times of crisis, apprenticeship in some cases and internship, in some other cases are emerging as useful alternative routes both for acquiring specific skills as well as
gaining much needed job experience (something every employers craves for while each and every fresh graduate is at pains to supply). Fine tuning of the apprenticeship law is on the
government agenda, as is a special law that will finally regulate internship in Romania and make an attractive option for employers and potential interns alike. Hopes are high therefore
that once political stability will finally descend, these priorities will take centre stage and articulate themselves soon enough as building blocks of a national flexicurity pathway. It would
be also best if this would be done the consensual way around and not via another top-down imposition;
There is a strong and stringent need to anticipate developments on the labour market, to make policies less pro-cycle than in the recent past and prepare early responses. Without this
it is impossible to build a solid and assumed national pathway towards flexicurity.

173
24 Slovakia
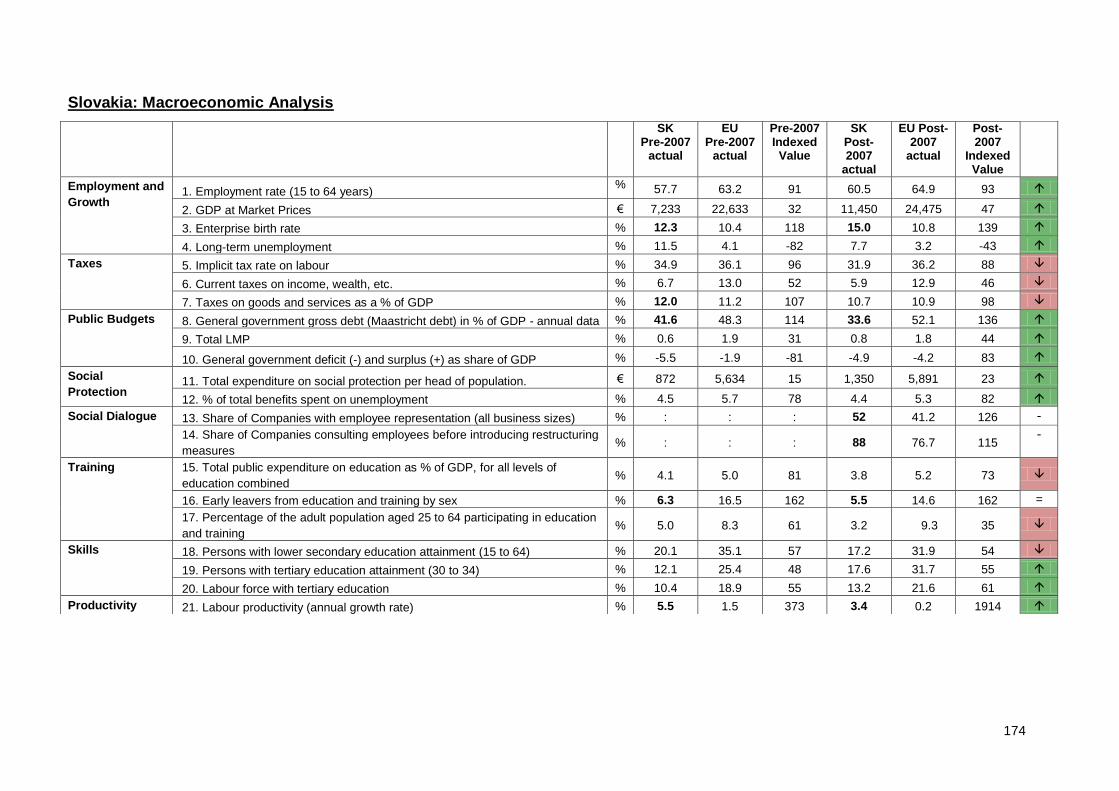
174
Slovakia: Macroeconomic Analysis
SK Pre-2007
actual
EU Pre-2007
actual
Pre-2007 Indexed Value
SK Post-2007
actual
EU Post-2007
actual
Post-2007
Indexed Value
Employment and
Growth 1. Employment rate (15 to 64 years)
% 57.7 63.2 91 60.5 64.9 93
2. GDP at Market Prices € 7,233 22,633 32 11,450 24,475 47
3. Enterprise birth rate % 12.3 10.4 118 15.0 10.8 139
4. Long-term unemployment % 11.5 4.1 -82 7.7 3.2 -43
Taxes 5. Implicit tax rate on labour % 34.9 36.1 96 31.9 36.2 88
6. Current taxes on income, wealth, etc. % 6.7 13.0 52 5.9 12.9 46
7. Taxes on goods and services as a % of GDP % 12.0 11.2 107 10.7 10.9 98
Public Budgets 8. General government gross debt (Maastricht debt) in % of GDP - annual data % 41.6 48.3 114 33.6 52.1 136
9. Total LMP % 0.6 1.9 31 0.8 1.8 44
10. General government deficit (-) and surplus (+) as share of GDP % -5.5 -1.9 -81 -4.9 -4.2 83
Social
Protection 11. Total expenditure on social protection per head of population. € 872 5,634 15 1,350 5,891 23
12. % of total benefits spent on unemployment % 4.5 5.7 78 4.4 5.3 82
Social Dialogue 13. Share of Companies with employee representation (all business sizes) % : : : 52 41.2 126 -
14. Share of Companies consulting employees before introducing restructuring
measures % : : : 88 76.7 115
-
Training 15. Total public expenditure on education as % of GDP, for all levels of
education combined % 4.1 5.0 81 3.8 5.2 73
16. Early leavers from education and training by sex % 6.3 16.5 162 5.5 14.6 162 =
17. Percentage of the adult population aged 25 to 64 participating in education
and training % 5.0 8.3 61 3.2 9.3 35
Skills 18. Persons with lower secondary education attainment (15 to 64) % 20.1 35.1 57 17.2 31.9 54
19. Persons with tertiary education attainment (30 to 34) % 12.1 25.4 48 17.6 31.7 55
20. Labour force with tertiary education % 10.4 18.9 55 13.2 21.6 61
Productivity 21. Labour productivity (annual growth rate) % 5.5 1.5 373 3.4 0.2 1914
175
Employment and Growth: While Slovakia’s employment rate is below average in both periods, it rose from 57.7% to 60.5% between the pre and post-2007 periods compared to
EU averages of 63.2% and 64.9%. When long term unemployment is considered, Slovakia’s rate was significantly higher than the EU – at 11.5% pre-2007 compared to 4.1% in the
EU. By post-2007, while the rate has reduced it remained at 7.7% compared to the EU average of 3.4%. GDP was a third of the EU average in Slovakia pre-2007 at €7,233
compared to €22,633. By post-2007 it had increased to just less than half of the EU GDP, equivalent to €11,450 (compared to the EU average of €24,475).
Taxes: Taxation on goods and services accounted for 12% of GDP pre-2007 in Slovakia compared to 11.2% in the EU and Slovakia therefore had an index of 107. However, by
post-2007 its position against the EU declined to 98 due to a fall in taxation to 10.7%. The implicit tax rate on labour was below average in both periods and worsened from pre to
post 2007 from an EU index of 96 to 88, the equivalent of 31.9% post-2007 in real terms, compared to the EU average of 36.2%. Current taxes on income and wealth were half that
of the EU in both periods.
Public Budgets: The General government gross debt was better than the EU average for both periods and improved from pre to post-2007 from 41.6% to 33.6% - compared to the
EU averages of 48.3% and 52.2%. The general government deficit was worse in Slovakia in both periods than the EU average, however while the EU deficit worsened from pre to
post 2007 – it improved in Slovakia from -5.5% to -4.2%. Total LMP is worse is Slovakia in both periods – however its position improved slightly from 0.6% to 0.8% and an index of
31 to 44.
Social Protection: Expenditure on social protection per head of the population is significantly lower in Slovakia in both periods, despite improving from €872 to €1,350. The share of
benefits spent on unemployment decreased in the period from 4.5% to 4.4% however its position improved slightly from an index of 78 to 82.
Social Dialogue: The share of companies with employee representation in Slovakia was above average post-2007, 52% compared to the EU average of 41.2%. The share of
companies consulting employees prior to restructuring measures being introduced was also above average at 88% compared with 76.7% in the EU.
Training: Total public expenditure on education and training was below average and worsened between the pre and post-2007 period in real terms from 4.1% to 3.8%, despite an
increase in the EU average from 5% to 5.2%. Early leavers from education and training however was significantly below the EU average in both periods at 6.3% pre-2007 and
improved further to 5.5% post-2007 (compared with 16.5% and 14.6% respectively across the EU).
Skills: When skills indicators are considered, Slovakia fared poorly. Furthermore, the share of the population attaining lower secondary education worsened over the two periods
from 20.1% to 17.2%, also worsening against the EU index from 57 to 54. Tertiary educational attainment in the 30 to 34 population, whilst improving from pre to post 2007 from
12.1% to 17.6%, remained significantly below the EU averages of 25.4% and 31.7% for the period. Tertiary educational attainment in the labour force increased from 10.4% pre-
2007 to 13.2%, however was also significantly below the EU averages of 18.9% and 21.6%. Despite this, for both indicators, Slovakia’s position against the EU improved slightly
(albeit still below average).
Productivity: the annual growth rate in labour productivity was significantly above the EU average in both periods.
176
Analysis of flexicurity related inputs and policies
Input Indicators
Active labour Market Policy: expenditure as a share of GDP is far lower in Slovakia than the EU average for the pre-2007 and post-2007 period (0.1% compared to an EU average
of 0.5%). The number of LMP participants engaged in active measure as a share of all unemployed was higher in Slovakia for both the pre and post-2007 periods when compared to
the EU average (64.9% in the pre-2007 period in Slovakia, compared to a 37% EU average; and 49.3% in Slovakia for the post-2007 period compared to an EU average of 35%).
Contractual Arrangements: Slovakia is characterised by strong Employment Protection Legislation for standard workers but less so for temporary workers. This position remained
consistent for the pre-2007 and post-2007 periods (an EPL strictness score of 2.4 for Standard Workers, and a score of 0.6 for Temporary Workers, compared to EU averages of 2.1
for Standard Workers and 1.8 for temporary Workers). The average number of hours worked per week was higher than the EU average for the pre-2007 period (41.2 in Slovakia,
compared to 38.1 in the EU) and this remained the case for the post-2007 period (40.9 in Slovakia compared to 37.7 in the EU).
Lifelong Learning: in Slovakia, the total public expenditure on education as a percentage of GDP and private expenditure on education as % of GDP is lower than the EU average
for both the pre and post-2007 periods. Public expenditure on education in Slovakia is 4.1% for the pre-2007 period and 3.6% in the post-2007 period, the average for the EU
remained at 5.0% for both periods. Private expenditure on education was 0.4% in Slovakia for the pre-2007 period, and rose to 0.6% in the post-2007 period. The average for the EU
was 0.6% in the pre-2007 period, compared to 0.7% for the post-2007 period.
Modern Social Security: Expenditure on passive LMP in Slovakia was lower than the EU average for both the pre and post-2007 periods, the average for the pre-2007 period and
the post-2007 period in the UK was 0.4%, compared to an EU average of 1.2% in the pre-2007 period and 1.1% in the post-2007 period. Expenditure on social protection in Slovakia
was lower than the EU average for the pre-2007 and the post-2007 period (for both periods the Slovakian average was 17.4% compared to an EU average of 27%).
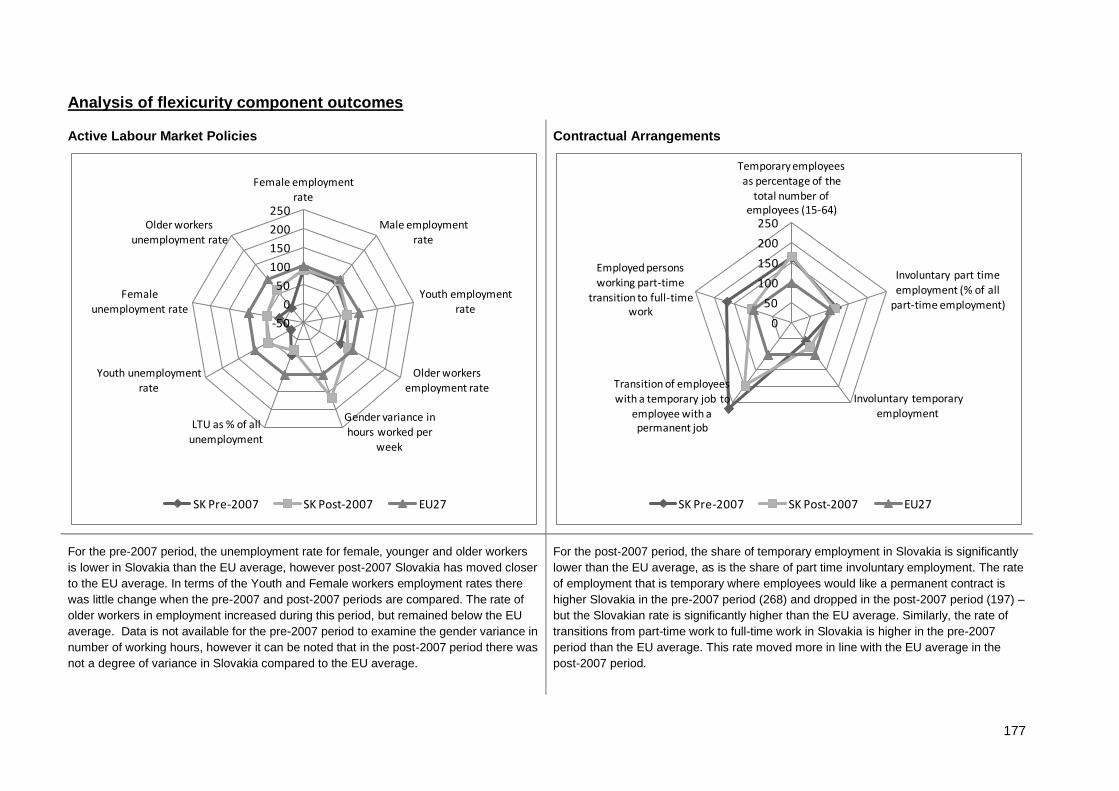
177
Analysis of flexicurity component outcomes
Active Labour Market Policies
Contractual Arrangements
For the pre-2007 period, the unemployment rate for female, younger and older workers
is lower in Slovakia than the EU average, however post-2007 Slovakia has moved closer
to the EU average. In terms of the Youth and Female workers employment rates there
was little change when the pre-2007 and post-2007 periods are compared. The rate of
older workers in employment increased during this period, but remained below the EU
average. Data is not available for the pre-2007 period to examine the gender variance in
number of working hours, however it can be noted that in the post-2007 period there was
not a degree of variance in Slovakia compared to the EU average.
For the post-2007 period, the share of temporary employment in Slovakia is significantly
lower than the EU average, as is the share of part time involuntary employment. The rate
of employment that is temporary where employees would like a permanent contract is
higher Slovakia in the pre-2007 period (268) and dropped in the post-2007 period (197) –
but the Slovakian rate is significantly higher than the EU average. Similarly, the rate of
transitions from part-time work to full-time work in Slovakia is higher in the pre-2007
period than the EU average. This rate moved more in line with the EU average in the
post-2007 period.
-50
0
50
100
150
200
250
Female employment rate
Male employment rate
Youth employment
rate
Older workers employment rate
Gender variance in hours worked per
week
LTU as % of all unemployment
Youth unemployment rate
Female
unemployment rate
Older workers unemployment rate
SK Pre-2007 SK Post-2007 EU27
0
50
100
150
200
250
Temporary employees as percentage of the
total number of employees (15-64)
Involuntary part time
employment (% of all part-time employment)
Involuntary temporary employment
Transition of employees with a temporary job to
employee with a permanent job
Employed persons working part-time
transition to full-time work
SK Pre-2007 SK Post-2007 EU27
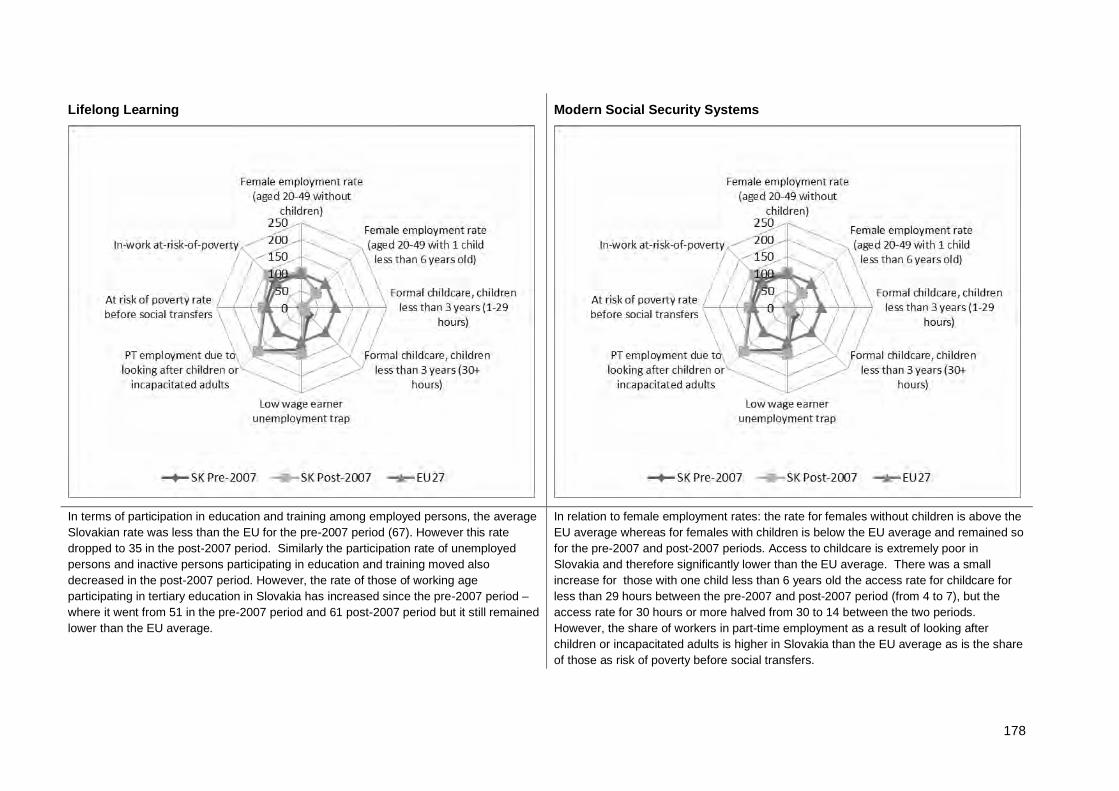
178
Lifelong Learning
Modern Social Security Systems
In terms of participation in education and training among employed persons, the average
Slovakian rate was less than the EU for the pre-2007 period (67). However this rate
dropped to 35 in the post-2007 period. Similarly the participation rate of unemployed
persons and inactive persons participating in education and training moved also
decreased in the post-2007 period. However, the rate of those of working age
participating in tertiary education in Slovakia has increased since the pre-2007 period –
where it went from 51 in the pre-2007 period and 61 post-2007 period but it still remained
lower than the EU average.
In relation to female employment rates: the rate for females without children is above the
EU average whereas for females with children is below the EU average and remained so
for the pre-2007 and post-2007 periods. Access to childcare is extremely poor in
Slovakia and therefore significantly lower than the EU average. There was a small
increase for those with one child less than 6 years old the access rate for childcare for
less than 29 hours between the pre-2007 and post-2007 period (from 4 to 7), but the
access rate for 30 hours or more halved from 30 to 14 between the two periods.
However, the share of workers in part-time employment as a result of looking after
children or incapacitated adults is higher in Slovakia than the EU average as is the share
of those as risk of poverty before social transfers.
179
Summary: Flexicurity Policy 2007-2010
Slovakia’s employment and growth rates tend to be below the EU average and is characterised with high levels of long term unemployment. Although taxation on goods and
services are just above the EU level, the level of debt for the country was much less than that across Europe. Spend on social protection and the share of benefits spent on
unemployment was lower than the EU average. Public expenditure on education and training was also low and Slovakia fared poorly when skills indicators are considered.
In relation to active labour market policy, the number of LMP participants engaged in active measure as a share of all unemployed was higher in Slovakia for both the pre and post-
2007 periods when compared to the EU average. In terms of contractual arrangements, Slovakia is characterised by strong Employment Protection Legislation for standard workers
but less so for temporary workers and the average number of hours worked per week was higher than the EU average.
In relation to modern social security systems, spend on passive LMP in Slovakia was lower than the EU average as was expenditure on social protection. When it came to female
employment rates – the rate for females without children is above the EU average whereas for females with children is below the EU average and remained so for the pre-2007 and
post-2007 periods. Access to childcare is extremely poor in Slovakia and therefore significantly lower than the EU average.

180
25 Slovenia
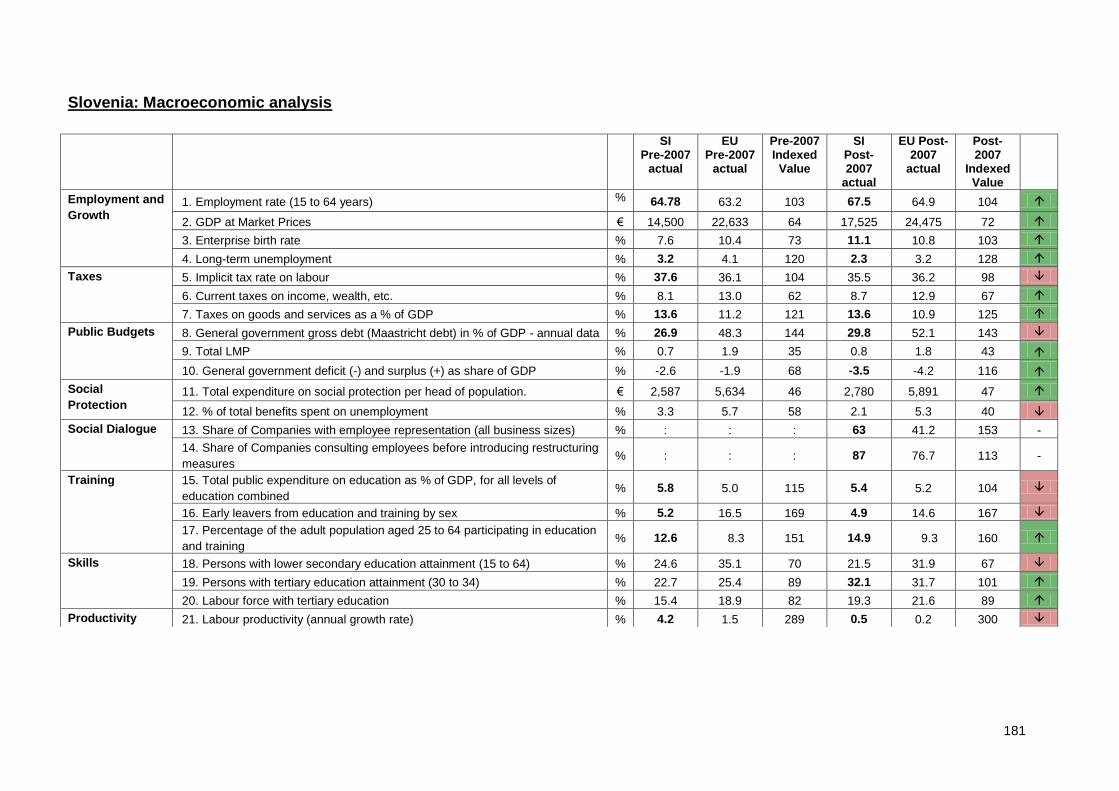
181
Slovenia: Macroeconomic analysis
SI Pre-2007
actual
EU Pre-2007
actual
Pre-2007 Indexed Value
SI Post-2007
actual
EU Post-2007
actual
Post-2007
Indexed Value
Employment and
Growth 1. Employment rate (15 to 64 years) % 64.78 63.2 103 67.5 64.9 104
2. GDP at Market Prices € 14,500 22,633 64 17,525 24,475 72
3. Enterprise birth rate % 7.6 10.4 73 11.1 10.8 103
4. Long-term unemployment % 3.2 4.1 120 2.3 3.2 128
Taxes 5. Implicit tax rate on labour % 37.6 36.1 104 35.5 36.2 98
6. Current taxes on income, wealth, etc. % 8.1 13.0 62 8.7 12.9 67
7. Taxes on goods and services as a % of GDP % 13.6 11.2 121 13.6 10.9 125
Public Budgets 8. General government gross debt (Maastricht debt) in % of GDP - annual data % 26.9 48.3 144 29.8 52.1 143
9. Total LMP % 0.7 1.9 35 0.8 1.8 43
10. General government deficit (-) and surplus (+) as share of GDP % -2.6 -1.9 68 -3.5 -4.2 116
Social
Protection 11. Total expenditure on social protection per head of population. € 2,587 5,634 46 2,780 5,891 47
12. % of total benefits spent on unemployment % 3.3 5.7 58 2.1 5.3 40
Social Dialogue 13. Share of Companies with employee representation (all business sizes) % : : : 63 41.2 153 -
14. Share of Companies consulting employees before introducing restructuring
measures % : : : 87 76.7 113 -
Training 15. Total public expenditure on education as % of GDP, for all levels of
education combined % 5.8 5.0 115 5.4 5.2 104
16. Early leavers from education and training by sex % 5.2 16.5 169 4.9 14.6 167
17. Percentage of the adult population aged 25 to 64 participating in education
and training % 12.6 8.3 151 14.9 9.3 160
Skills 18. Persons with lower secondary education attainment (15 to 64) % 24.6 35.1 70 21.5 31.9 67
19. Persons with tertiary education attainment (30 to 34) % 22.7 25.4 89 32.1 31.7 101
20. Labour force with tertiary education % 15.4 18.9 82 19.3 21.6 89
Productivity 21. Labour productivity (annual growth rate) % 4.2 1.5 289 0.5 0.2 300
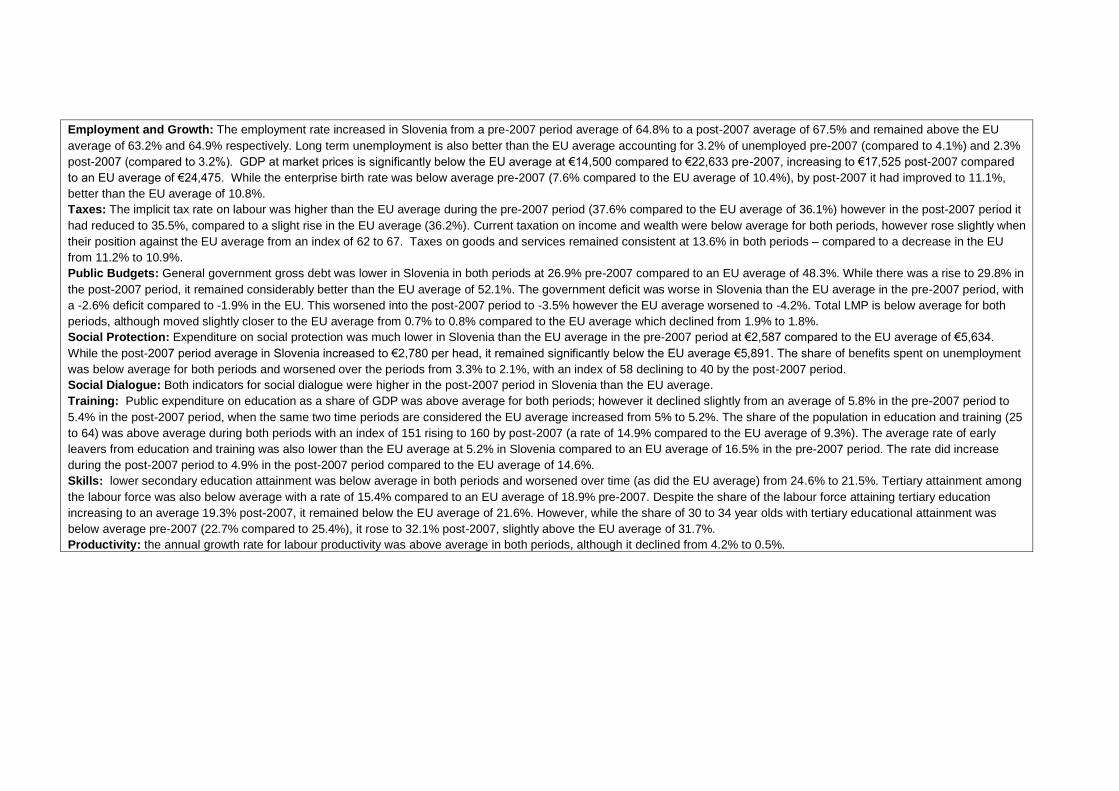
Employment and Growth: The employment rate increased in Slovenia from a pre-2007 period average of 64.8% to a post-2007 average of 67.5% and remained above the EU
average of 63.2% and 64.9% respectively. Long term unemployment is also better than the EU average accounting for 3.2% of unemployed pre-2007 (compared to 4.1%) and 2.3%
post-2007 (compared to 3.2%). GDP at market prices is significantly below the EU average at €14,500 compared to €22,633 pre-2007, increasing to €17,525 post-2007 compared
to an EU average of €24,475. While the enterprise birth rate was below average pre-2007 (7.6% compared to the EU average of 10.4%), by post-2007 it had improved to 11.1%,
better than the EU average of 10.8%.
Taxes: The implicit tax rate on labour was higher than the EU average during the pre-2007 period (37.6% compared to the EU average of 36.1%) however in the post-2007 period it
had reduced to 35.5%, compared to a slight rise in the EU average (36.2%). Current taxation on income and wealth were below average for both periods, however rose slightly when
their position against the EU average from an index of 62 to 67. Taxes on goods and services remained consistent at 13.6% in both periods – compared to a decrease in the EU
from 11.2% to 10.9%.
Public Budgets: General government gross debt was lower in Slovenia in both periods at 26.9% pre-2007 compared to an EU average of 48.3%. While there was a rise to 29.8% in
the post-2007 period, it remained considerably better than the EU average of 52.1%. The government deficit was worse in Slovenia than the EU average in the pre-2007 period, with
a -2.6% deficit compared to -1.9% in the EU. This worsened into the post-2007 period to -3.5% however the EU average worsened to -4.2%. Total LMP is below average for both
periods, although moved slightly closer to the EU average from 0.7% to 0.8% compared to the EU average which declined from 1.9% to 1.8%.
Social Protection: Expenditure on social protection was much lower in Slovenia than the EU average in the pre-2007 period at €2,587 compared to the EU average of €5,634.
While the post-2007 period average in Slovenia increased to €2,780 per head, it remained significantly below the EU average €5,891. The share of benefits spent on unemployment
was below average for both periods and worsened over the periods from 3.3% to 2.1%, with an index of 58 declining to 40 by the post-2007 period.
Social Dialogue: Both indicators for social dialogue were higher in the post-2007 period in Slovenia than the EU average.
Training: Public expenditure on education as a share of GDP was above average for both periods; however it declined slightly from an average of 5.8% in the pre-2007 period to
5.4% in the post-2007 period, when the same two time periods are considered the EU average increased from 5% to 5.2%. The share of the population in education and training (25
to 64) was above average during both periods with an index of 151 rising to 160 by post-2007 (a rate of 14.9% compared to the EU average of 9.3%). The average rate of early
leavers from education and training was also lower than the EU average at 5.2% in Slovenia compared to an EU average of 16.5% in the pre-2007 period. The rate did increase
during the post-2007 period to 4.9% in the post-2007 period compared to the EU average of 14.6%.
Skills: lower secondary education attainment was below average in both periods and worsened over time (as did the EU average) from 24.6% to 21.5%. Tertiary attainment among
the labour force was also below average with a rate of 15.4% compared to an EU average of 18.9% pre-2007. Despite the share of the labour force attaining tertiary education
increasing to an average 19.3% post-2007, it remained below the EU average of 21.6%. However, while the share of 30 to 34 year olds with tertiary educational attainment was
below average pre-2007 (22.7% compared to 25.4%), it rose to 32.1% post-2007, slightly above the EU average of 31.7%.
Productivity: the annual growth rate for labour productivity was above average in both periods, although it declined from 4.2% to 0.5%.
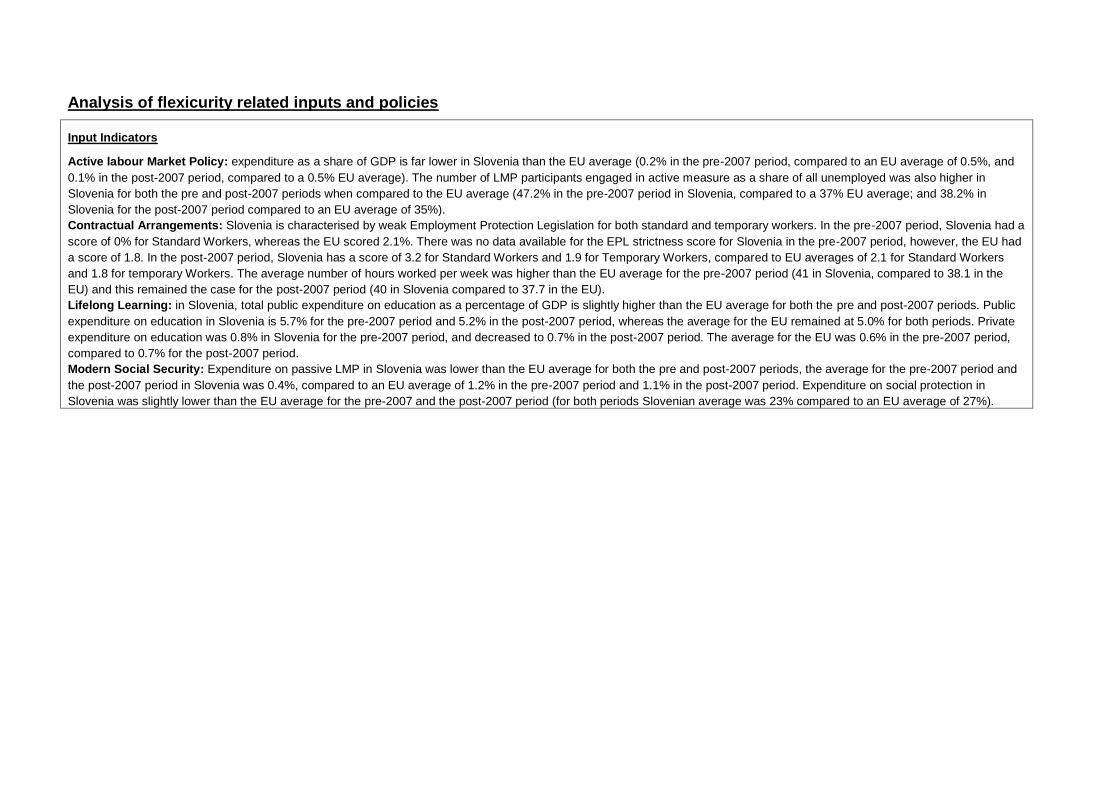
Analysis of flexicurity related inputs and policies
Input Indicators
Active labour Market Policy: expenditure as a share of GDP is far lower in Slovenia than the EU average (0.2% in the pre-2007 period, compared to an EU average of 0.5%, and
0.1% in the post-2007 period, compared to a 0.5% EU average). The number of LMP participants engaged in active measure as a share of all unemployed was also higher in
Slovenia for both the pre and post-2007 periods when compared to the EU average (47.2% in the pre-2007 period in Slovenia, compared to a 37% EU average; and 38.2% in
Slovenia for the post-2007 period compared to an EU average of 35%).
Contractual Arrangements: Slovenia is characterised by weak Employment Protection Legislation for both standard and temporary workers. In the pre-2007 period, Slovenia had a
score of 0% for Standard Workers, whereas the EU scored 2.1%. There was no data available for the EPL strictness score for Slovenia in the pre-2007 period, however, the EU had
a score of 1.8. In the post-2007 period, Slovenia has a score of 3.2 for Standard Workers and 1.9 for Temporary Workers, compared to EU averages of 2.1 for Standard Workers
and 1.8 for temporary Workers. The average number of hours worked per week was higher than the EU average for the pre-2007 period (41 in Slovenia, compared to 38.1 in the
EU) and this remained the case for the post-2007 period (40 in Slovenia compared to 37.7 in the EU).
Lifelong Learning: in Slovenia, total public expenditure on education as a percentage of GDP is slightly higher than the EU average for both the pre and post-2007 periods. Public
expenditure on education in Slovenia is 5.7% for the pre-2007 period and 5.2% in the post-2007 period, whereas the average for the EU remained at 5.0% for both periods. Private
expenditure on education was 0.8% in Slovenia for the pre-2007 period, and decreased to 0.7% in the post-2007 period. The average for the EU was 0.6% in the pre-2007 period,
compared to 0.7% for the post-2007 period.
Modern Social Security: Expenditure on passive LMP in Slovenia was lower than the EU average for both the pre and post-2007 periods, the average for the pre-2007 period and
the post-2007 period in Slovenia was 0.4%, compared to an EU average of 1.2% in the pre-2007 period and 1.1% in the post-2007 period. Expenditure on social protection in
Slovenia was slightly lower than the EU average for the pre-2007 and the post-2007 period (for both periods Slovenian average was 23% compared to an EU average of 27%).
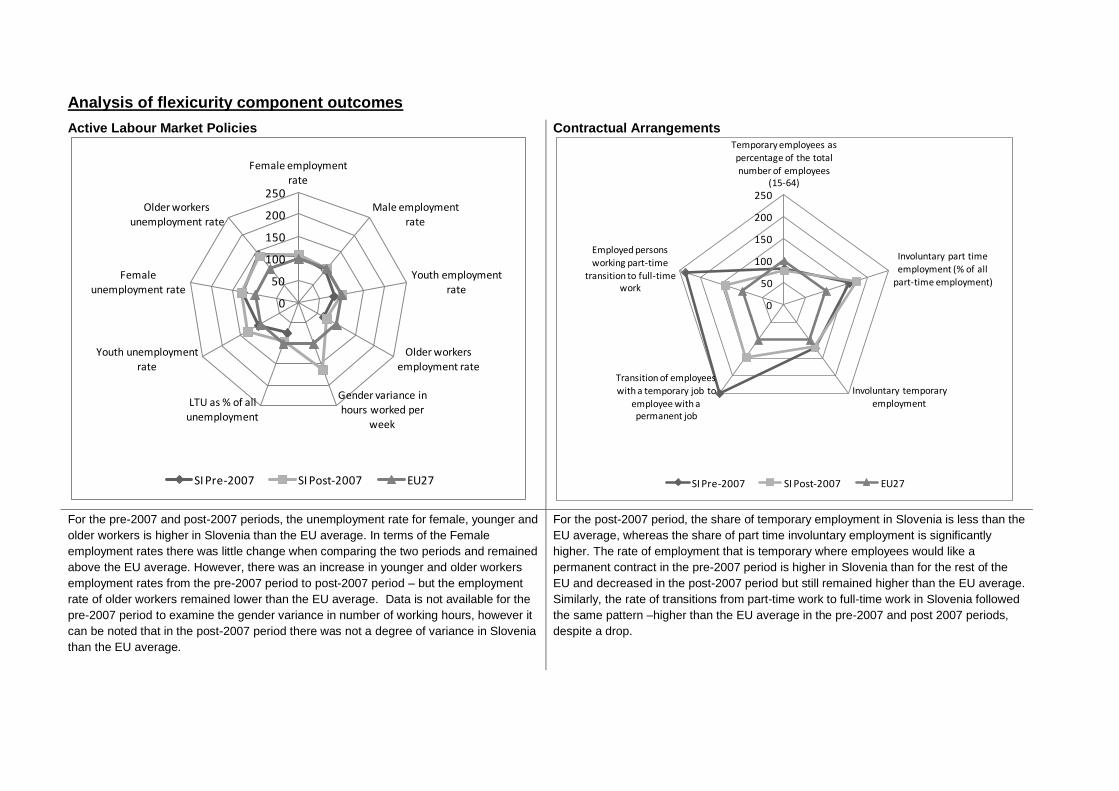
Analysis of flexicurity component outcomes
Active Labour Market Policies
Contractual Arrangements
For the pre-2007 and post-2007 periods, the unemployment rate for female, younger and
older workers is higher in Slovenia than the EU average. In terms of the Female
employment rates there was little change when comparing the two periods and remained
above the EU average. However, there was an increase in younger and older workers
employment rates from the pre-2007 period to post-2007 period – but the employment
rate of older workers remained lower than the EU average. Data is not available for the
pre-2007 period to examine the gender variance in number of working hours, however it
can be noted that in the post-2007 period there was not a degree of variance in Slovenia
than the EU average.
For the post-2007 period, the share of temporary employment in Slovenia is less than the
EU average, whereas the share of part time involuntary employment is significantly
higher. The rate of employment that is temporary where employees would like a
permanent contract in the pre-2007 period is higher in Slovenia than for the rest of the
EU and decreased in the post-2007 period but still remained higher than the EU average.
Similarly, the rate of transitions from part-time work to full-time work in Slovenia followed
the same pattern –higher than the EU average in the pre-2007 and post 2007 periods,
despite a drop.
0
50
100
150
200
250
Female employment rate
Male employment rate
Youth employment
rate
Older workers employment rate
Gender variance in hours worked per
week
LTU as % of all unemployment
Youth unemployment rate
Female
unemployment rate
Older workers unemployment rate
SI Pre-2007 SI Post-2007 EU27
0
50
100
150
200
250
Temporary employees as percentage of the total number of employees
(15-64)
Involuntary part time employment (% of all
part-time employment)
Involuntary temporary employment
Transition of employees with a temporary job to
employee with a permanent job
Employed persons working part-time
transition to full-time work
SI Pre-2007 SI Post-2007 EU27
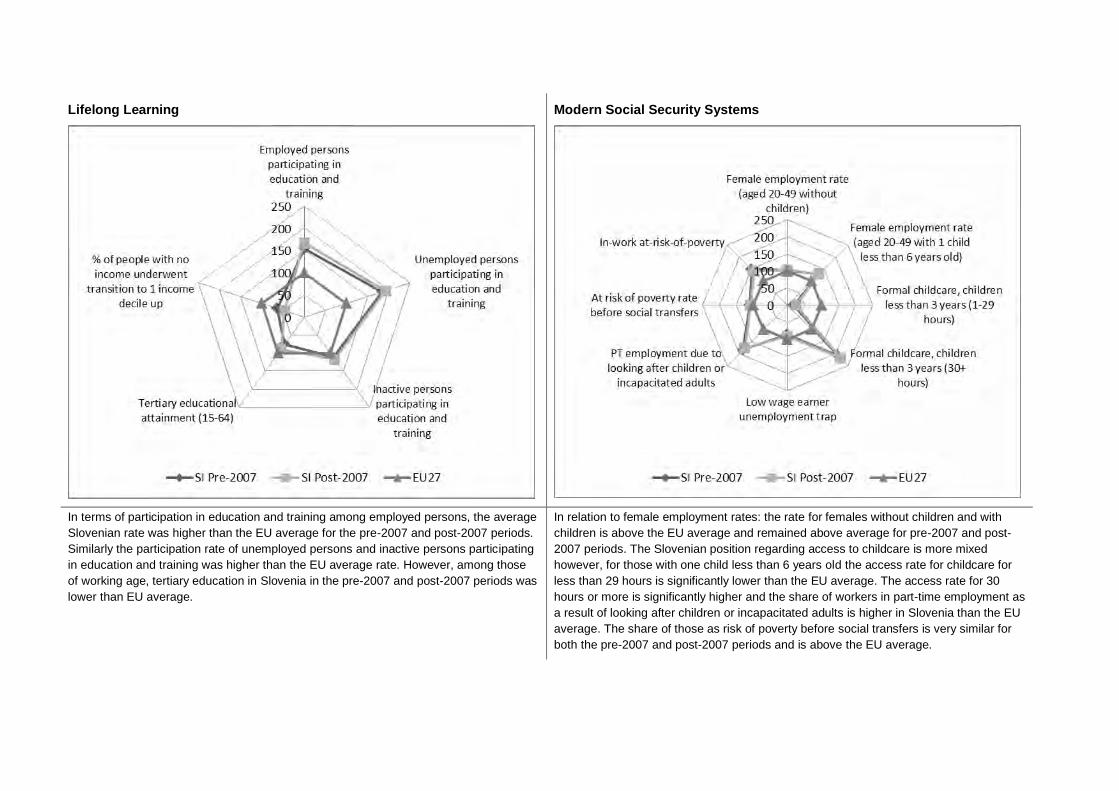
Lifelong Learning
Modern Social Security Systems
In terms of participation in education and training among employed persons, the average
Slovenian rate was higher than the EU average for the pre-2007 and post-2007 periods.
Similarly the participation rate of unemployed persons and inactive persons participating
in education and training was higher than the EU average rate. However, among those
of working age, tertiary education in Slovenia in the pre-2007 and post-2007 periods was
lower than EU average.
In relation to female employment rates: the rate for females without children and with
children is above the EU average and remained above average for pre-2007 and post-
2007 periods. The Slovenian position regarding access to childcare is more mixed
however, for those with one child less than 6 years old the access rate for childcare for
less than 29 hours is significantly lower than the EU average. The access rate for 30
hours or more is significantly higher and the share of workers in part-time employment as
a result of looking after children or incapacitated adults is higher in Slovenia than the EU
average. The share of those as risk of poverty before social transfers is very similar for
both the pre-2007 and post-2007 periods and is above the EU average.
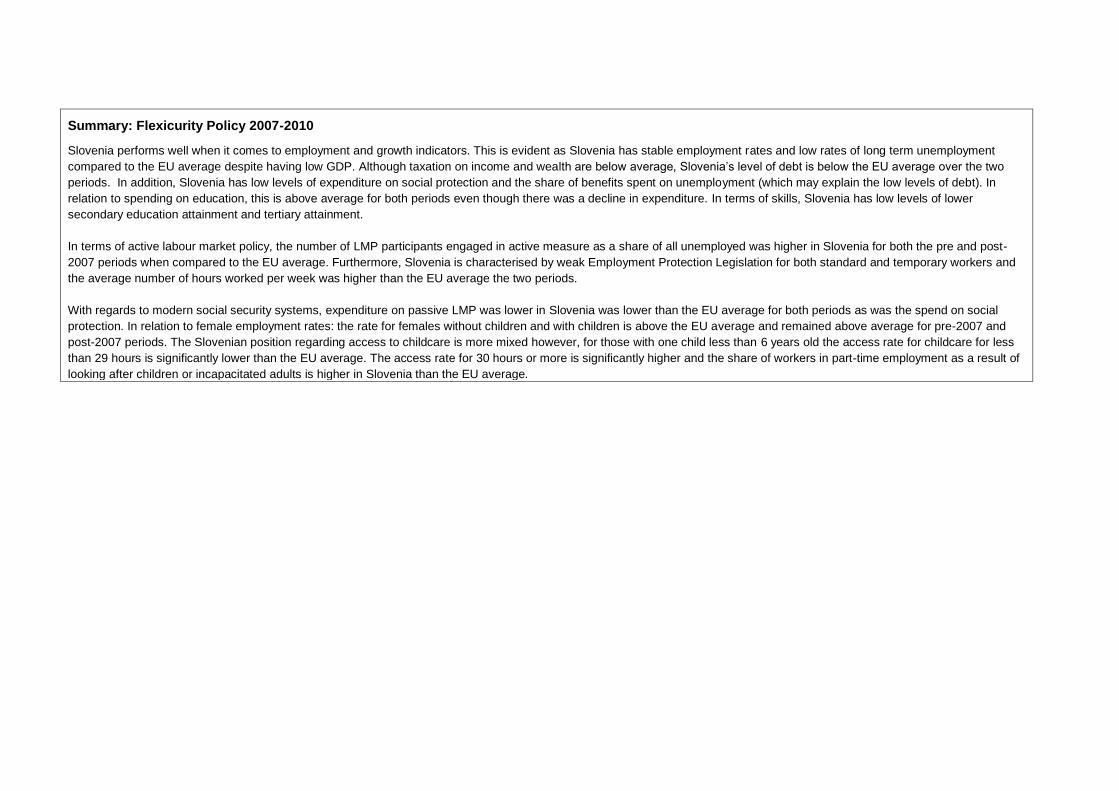
Summary: Flexicurity Policy 2007-2010
Slovenia performs well when it comes to employment and growth indicators. This is evident as Slovenia has stable employment rates and low rates of long term unemployment
compared to the EU average despite having low GDP. Although taxation on income and wealth are below average, Slovenia’s level of debt is below the EU average over the two
periods. In addition, Slovenia has low levels of expenditure on social protection and the share of benefits spent on unemployment (which may explain the low levels of debt). In
relation to spending on education, this is above average for both periods even though there was a decline in expenditure. In terms of skills, Slovenia has low levels of lower
secondary education attainment and tertiary attainment.
In terms of active labour market policy, the number of LMP participants engaged in active measure as a share of all unemployed was higher in Slovenia for both the pre and post-
2007 periods when compared to the EU average. Furthermore, Slovenia is characterised by weak Employment Protection Legislation for both standard and temporary workers and
the average number of hours worked per week was higher than the EU average the two periods.
With regards to modern social security systems, expenditure on passive LMP was lower in Slovenia was lower than the EU average for both periods as was the spend on social
protection. In relation to female employment rates: the rate for females without children and with children is above the EU average and remained above average for pre-2007 and
post-2007 periods. The Slovenian position regarding access to childcare is more mixed however, for those with one child less than 6 years old the access rate for childcare for less
than 29 hours is significantly lower than the EU average. The access rate for 30 hours or more is significantly higher and the share of workers in part-time employment as a result of
looking after children or incapacitated adults is higher in Slovenia than the EU average.

26 Spain
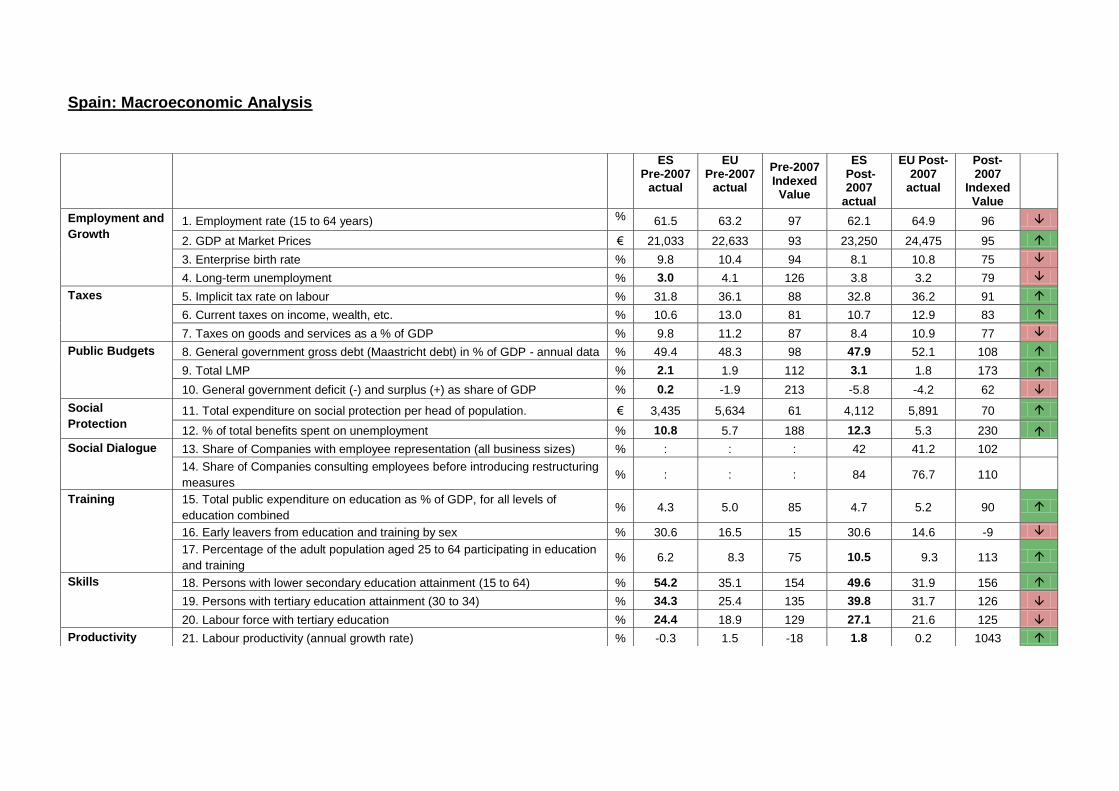
Spain: Macroeconomic Analysis
ES Pre-2007
actual
EU Pre-2007
actual
Pre-2007 Indexed Value
ES Post-2007
actual
EU Post-2007
actual
Post-2007
Indexed Value
Employment and
Growth 1. Employment rate (15 to 64 years) % 61.5 63.2 97 62.1 64.9 96
2. GDP at Market Prices € 21,033 22,633 93 23,250 24,475 95
3. Enterprise birth rate % 9.8 10.4 94 8.1 10.8 75
4. Long-term unemployment % 3.0 4.1 126 3.8 3.2 79
Taxes 5. Implicit tax rate on labour % 31.8 36.1 88 32.8 36.2 91
6. Current taxes on income, wealth, etc. % 10.6 13.0 81 10.7 12.9 83
7. Taxes on goods and services as a % of GDP % 9.8 11.2 87 8.4 10.9 77
Public Budgets 8. General government gross debt (Maastricht debt) in % of GDP - annual data % 49.4 48.3 98 47.9 52.1 108
9. Total LMP % 2.1 1.9 112 3.1 1.8 173
10. General government deficit (-) and surplus (+) as share of GDP % 0.2 -1.9 213 -5.8 -4.2 62
Social
Protection 11. Total expenditure on social protection per head of population. € 3,435 5,634 61 4,112 5,891 70
12. % of total benefits spent on unemployment % 10.8 5.7 188 12.3 5.3 230
Social Dialogue 13. Share of Companies with employee representation (all business sizes) % : : : 42 41.2 102
14. Share of Companies consulting employees before introducing restructuring
measures % : : : 84 76.7 110
Training 15. Total public expenditure on education as % of GDP, for all levels of
education combined % 4.3 5.0 85 4.7 5.2 90
16. Early leavers from education and training by sex % 30.6 16.5 15 30.6 14.6 -9
17. Percentage of the adult population aged 25 to 64 participating in education
and training % 6.2 8.3 75 10.5 9.3 113
Skills 18. Persons with lower secondary education attainment (15 to 64) % 54.2 35.1 154 49.6 31.9 156
19. Persons with tertiary education attainment (30 to 34) % 34.3 25.4 135 39.8 31.7 126
20. Labour force with tertiary education % 24.4 18.9 129 27.1 21.6 125
Productivity 21. Labour productivity (annual growth rate) % -0.3 1.5 -18 1.8 0.2 1043
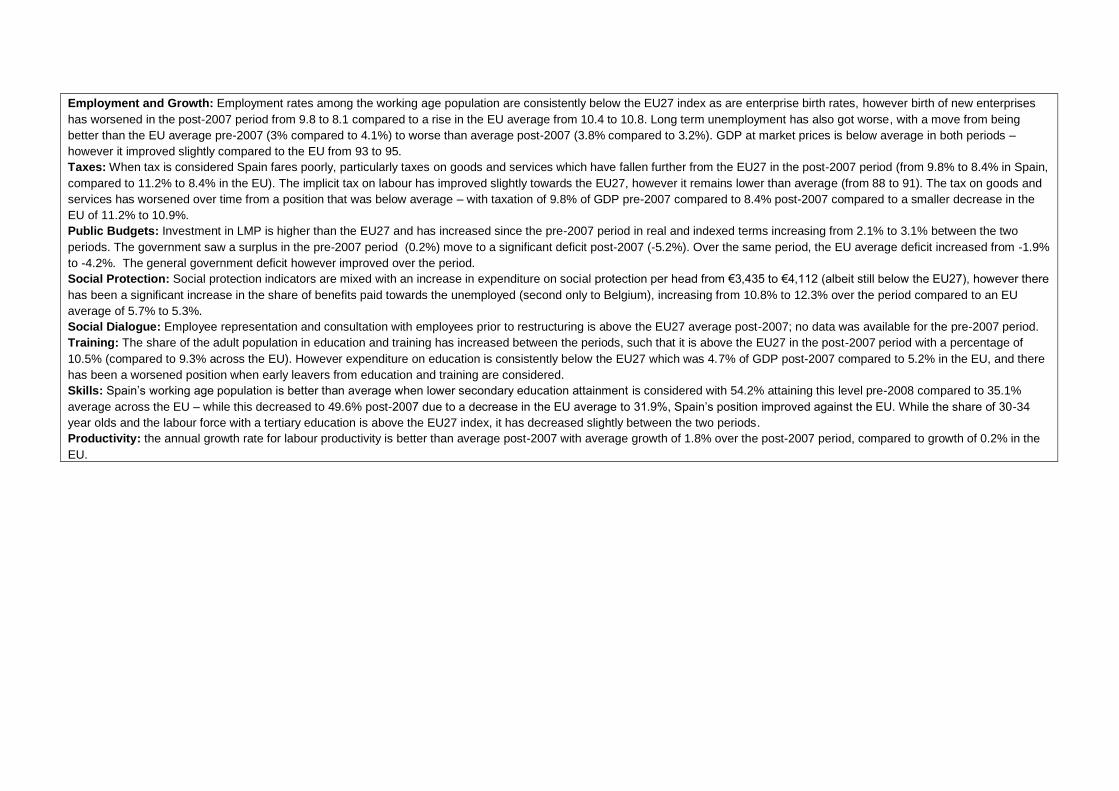
Employment and Growth: Employment rates among the working age population are consistently below the EU27 index as are enterprise birth rates, however birth of new enterprises
has worsened in the post-2007 period from 9.8 to 8.1 compared to a rise in the EU average from 10.4 to 10.8. Long term unemployment has also got worse, with a move from being
better than the EU average pre-2007 (3% compared to 4.1%) to worse than average post-2007 (3.8% compared to 3.2%). GDP at market prices is below average in both periods –
however it improved slightly compared to the EU from 93 to 95.
Taxes: When tax is considered Spain fares poorly, particularly taxes on goods and services which have fallen further from the EU27 in the post-2007 period (from 9.8% to 8.4% in Spain,
compared to 11.2% to 8.4% in the EU). The implicit tax on labour has improved slightly towards the EU27, however it remains lower than average (from 88 to 91). The tax on goods and
services has worsened over time from a position that was below average – with taxation of 9.8% of GDP pre-2007 compared to 8.4% post-2007 compared to a smaller decrease in the
EU of 11.2% to 10.9%.
Public Budgets: Investment in LMP is higher than the EU27 and has increased since the pre-2007 period in real and indexed terms increasing from 2.1% to 3.1% between the two
periods. The government saw a surplus in the pre-2007 period (0.2%) move to a significant deficit post-2007 (-5.2%). Over the same period, the EU average deficit increased from -1.9%
to -4.2%. The general government deficit however improved over the period.
Social Protection: Social protection indicators are mixed with an increase in expenditure on social protection per head from €3,435 to €4,112 (albeit still below the EU27), however there
has been a significant increase in the share of benefits paid towards the unemployed (second only to Belgium), increasing from 10.8% to 12.3% over the period compared to an EU
average of 5.7% to 5.3%.
Social Dialogue: Employee representation and consultation with employees prior to restructuring is above the EU27 average post-2007; no data was available for the pre-2007 period.
Training: The share of the adult population in education and training has increased between the periods, such that it is above the EU27 in the post-2007 period with a percentage of
10.5% (compared to 9.3% across the EU). However expenditure on education is consistently below the EU27 which was 4.7% of GDP post-2007 compared to 5.2% in the EU, and there
has been a worsened position when early leavers from education and training are considered.
Skills: Spain’s working age population is better than average when lower secondary education attainment is considered with 54.2% attaining this level pre-2008 compared to 35.1%
average across the EU – while this decreased to 49.6% post-2007 due to a decrease in the EU average to 31.9%, Spain’s position improved against the EU. While the share of 30-34
year olds and the labour force with a tertiary education is above the EU27 index, it has decreased slightly between the two periods.
Productivity: the annual growth rate for labour productivity is better than average post-2007 with average growth of 1.8% over the post-2007 period, compared to growth of 0.2% in the
EU.
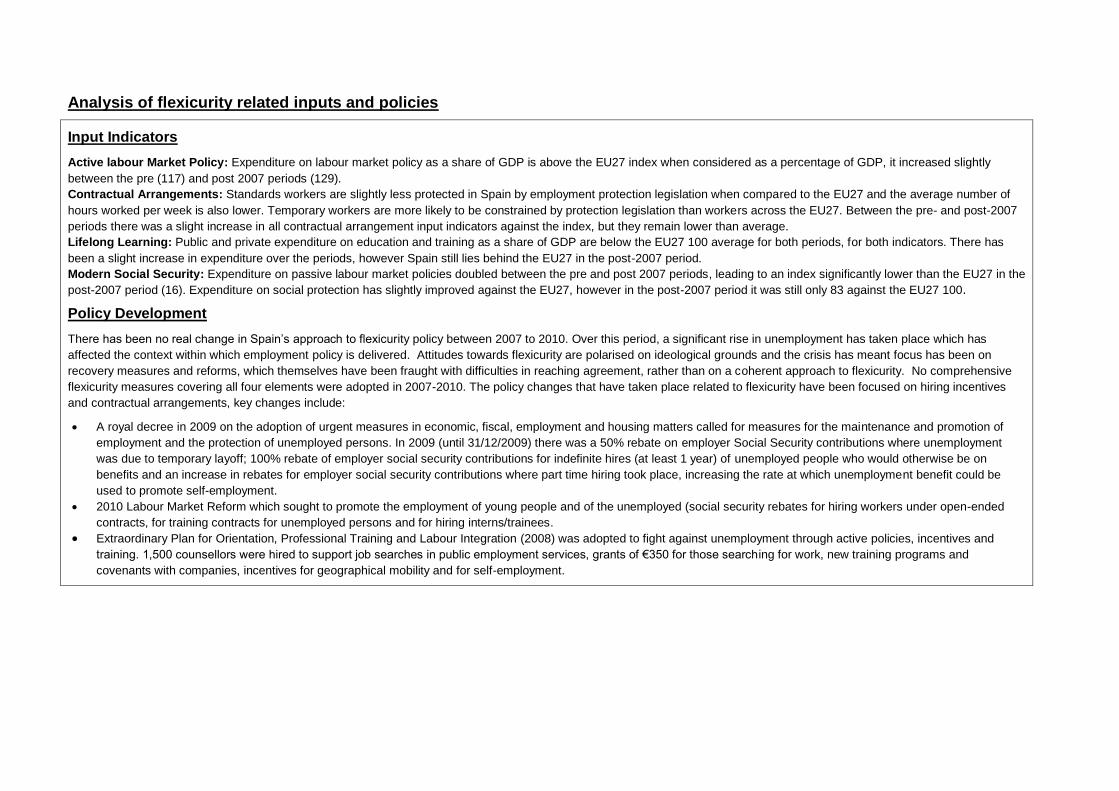
Analysis of flexicurity related inputs and policies
Input Indicators
Active labour Market Policy: Expenditure on labour market policy as a share of GDP is above the EU27 index when considered as a percentage of GDP, it increased slightly
between the pre (117) and post 2007 periods (129).
Contractual Arrangements: Standards workers are slightly less protected in Spain by employment protection legislation when compared to the EU27 and the average number of
hours worked per week is also lower. Temporary workers are more likely to be constrained by protection legislation than workers across the EU27. Between the pre- and post-2007
periods there was a slight increase in all contractual arrangement input indicators against the index, but they remain lower than average.
Lifelong Learning: Public and private expenditure on education and training as a share of GDP are below the EU27 100 average for both periods, for both indicators. There has
been a slight increase in expenditure over the periods, however Spain still lies behind the EU27 in the post-2007 period.
Modern Social Security: Expenditure on passive labour market policies doubled between the pre and post 2007 periods, leading to an index significantly lower than the EU27 in the
post-2007 period (16). Expenditure on social protection has slightly improved against the EU27, however in the post-2007 period it was still only 83 against the EU27 100.
Policy Development
There has been no real change in Spain’s approach to flexicurity policy between 2007 to 2010. Over this period, a significant rise in unemployment has taken place which has
affected the context within which employment policy is delivered. Attitudes towards flexicurity are polarised on ideological grounds and the crisis has meant focus has been on
recovery measures and reforms, which themselves have been fraught with difficulties in reaching agreement, rather than on a coherent approach to flexicurity. No comprehensive
flexicurity measures covering all four elements were adopted in 2007-2010. The policy changes that have taken place related to flexicurity have been focused on hiring incentives
and contractual arrangements, key changes include:
A royal decree in 2009 on the adoption of urgent measures in economic, fiscal, employment and housing matters called for measures for the maintenance and promotion of
employment and the protection of unemployed persons. In 2009 (until 31/12/2009) there was a 50% rebate on employer Social Security contributions where unemployment
was due to temporary layoff; 100% rebate of employer social security contributions for indefinite hires (at least 1 year) of unemployed people who would otherwise be on
benefits and an increase in rebates for employer social security contributions where part time hiring took place, increasing the rate at which unemployment benefit could be
used to promote self-employment.
2010 Labour Market Reform which sought to promote the employment of young people and of the unemployed (social security rebates for hiring workers under open-ended
contracts, for training contracts for unemployed persons and for hiring interns/trainees.
Extraordinary Plan for Orientation, Professional Training and Labour Integration (2008) was adopted to fight against unemployment through active policies, incentives and
training. 1,500 counsellors were hired to support job searches in public employment services, grants of €350 for those searching for work, new training programs and
covenants with companies, incentives for geographical mobility and for self-employment.
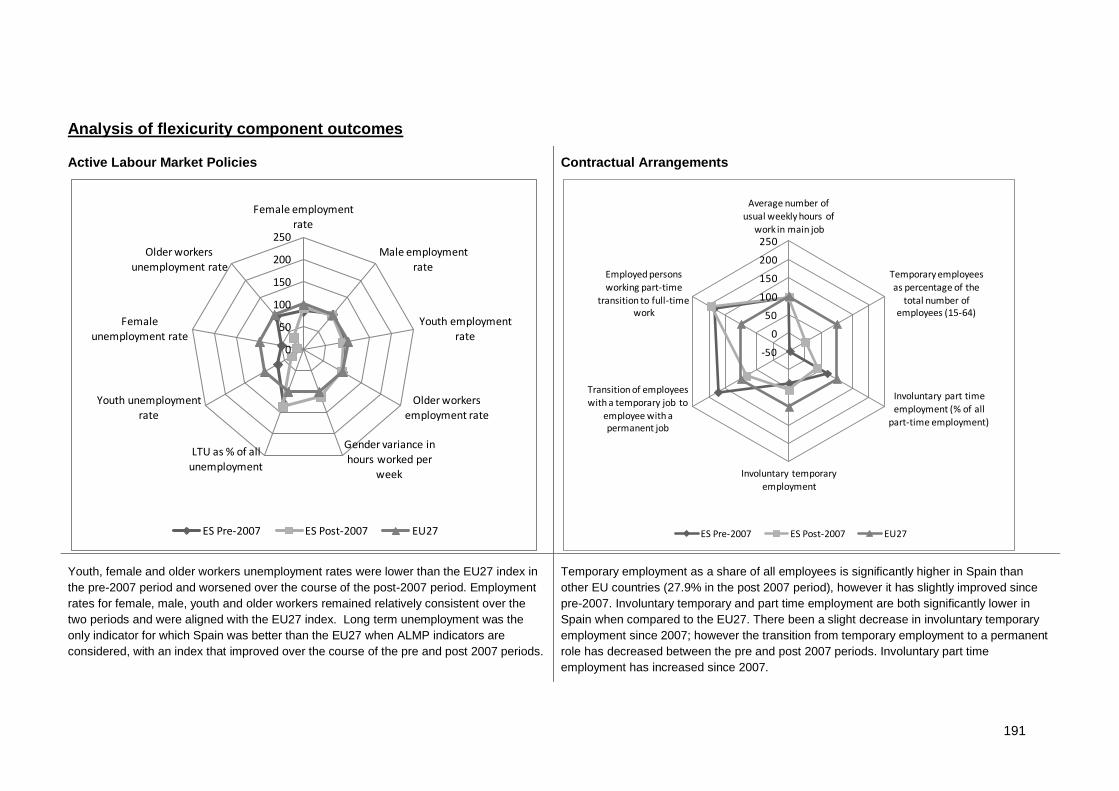
191
Analysis of flexicurity component outcomes
Active Labour Market Policies
Contractual Arrangements
Youth, female and older workers unemployment rates were lower than the EU27 index in
the pre-2007 period and worsened over the course of the post-2007 period. Employment
rates for female, male, youth and older workers remained relatively consistent over the
two periods and were aligned with the EU27 index. Long term unemployment was the
only indicator for which Spain was better than the EU27 when ALMP indicators are
considered, with an index that improved over the course of the pre and post 2007 periods.
Temporary employment as a share of all employees is significantly higher in Spain than
other EU countries (27.9% in the post 2007 period), however it has slightly improved since
pre-2007. Involuntary temporary and part time employment are both significantly lower in
Spain when compared to the EU27. There been a slight decrease in involuntary temporary
employment since 2007; however the transition from temporary employment to a permanent
role has decreased between the pre and post 2007 periods. Involuntary part time
employment has increased since 2007.
0
50
100
150
200
250
Female employment rate
Male employment
rate
Youth employment rate
Older workers employment rate
Gender variance in hours worked per
week
LTU as % of all unemployment
Youth unemployment rate
Female unemployment rate
Older workers
unemployment rate
ES Pre-2007 ES Post-2007 EU27
-50
0
50
100
150
200
250
Average number of
usual weekly hours of
work in main job
Temporary employees as percentage of the
total number of employees (15-64)
Involuntary part time
employment (% of all part-time employment)
Involuntary temporary employment
Transition of employees
with a temporary job to
employee with a permanent job
Employed persons working part-time
transition to full-time work
ES Pre-2007 ES Post-2007 EU27
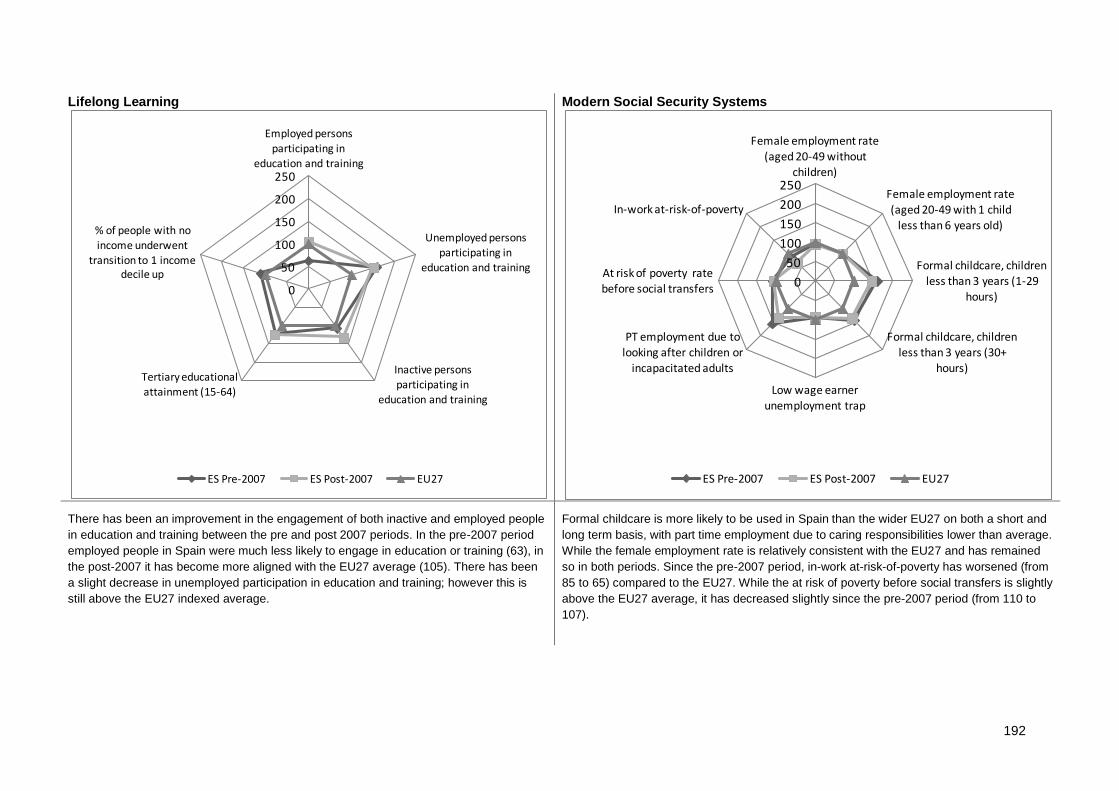
192
Lifelong Learning
Modern Social Security Systems
There has been an improvement in the engagement of both inactive and employed people
in education and training between the pre and post 2007 periods. In the pre-2007 period
employed people in Spain were much less likely to engage in education or training (63), in
the post-2007 it has become more aligned with the EU27 average (105). There has been
a slight decrease in unemployed participation in education and training; however this is
still above the EU27 indexed average.
Formal childcare is more likely to be used in Spain than the wider EU27 on both a short and
long term basis, with part time employment due to caring responsibilities lower than average.
While the female employment rate is relatively consistent with the EU27 and has remained
so in both periods. Since the pre-2007 period, in-work at-risk-of-poverty has worsened (from
85 to 65) compared to the EU27. While the at risk of poverty before social transfers is slightly
above the EU27 average, it has decreased slightly since the pre-2007 period (from 110 to
107).
0
50
100
150
200
250
Employed persons
participating in education and training
Unemployed persons participating in
education and training
Inactive persons participating in
education and training
Tertiary educational attainment (15-64)
% of people with no income underwent
transition to 1 income decile up
ES Pre-2007 ES Post-2007 EU27
0
50
100
150
200
250
Female employment rate (aged 20-49 without
children)
Female employment rate
(aged 20-49 with 1 child less than 6 years old)
Formal childcare, children less than 3 years (1-29
hours)
Formal childcare, children less than 3 years (30+
hours)
Low wage earner unemployment trap
PT employment due to looking after children or
incapacitated adults
At risk of poverty rate before social transfers
In-work at-risk-of-poverty
ES Pre-2007 ES Post-2007 EU27
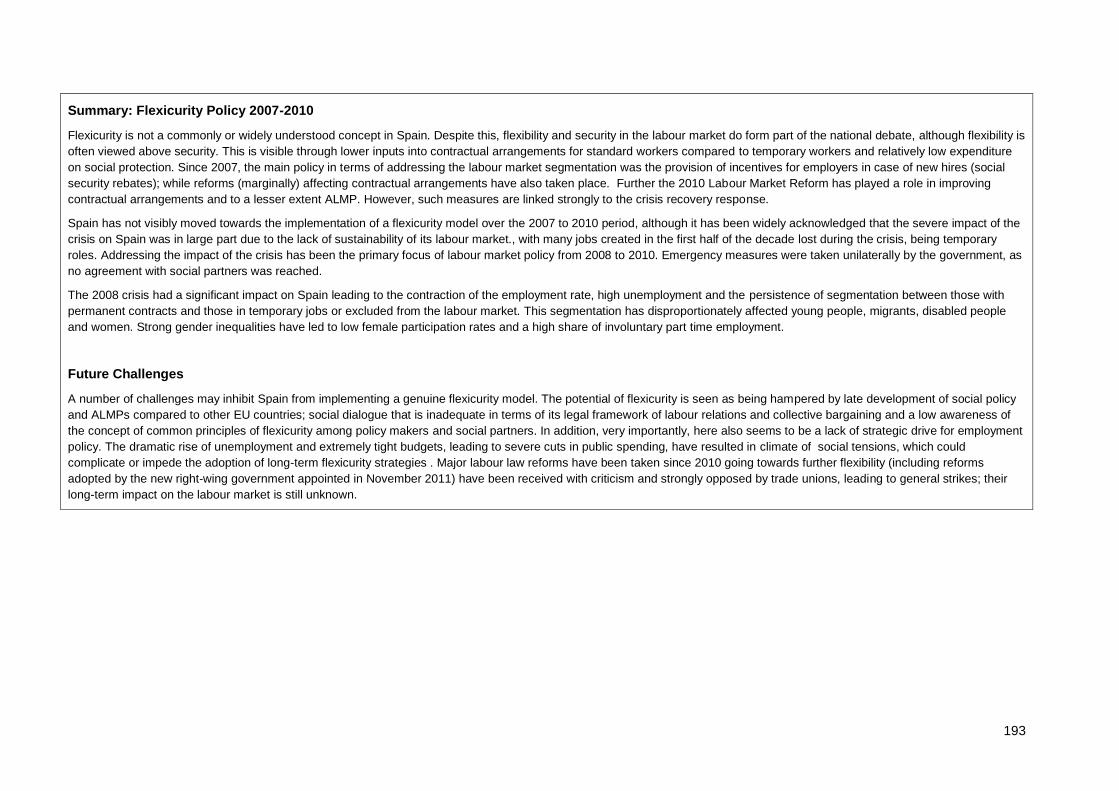
193
Summary: Flexicurity Policy 2007-2010
Flexicurity is not a commonly or widely understood concept in Spain. Despite this, flexibility and security in the labour market do form part of the national debate, although flexibility is
often viewed above security. This is visible through lower inputs into contractual arrangements for standard workers compared to temporary workers and relatively low expenditure
on social protection. Since 2007, the main policy in terms of addressing the labour market segmentation was the provision of incentives for employers in case of new hires (social
security rebates); while reforms (marginally) affecting contractual arrangements have also taken place. Further the 2010 Labour Market Reform has played a role in improving
contractual arrangements and to a lesser extent ALMP. However, such measures are linked strongly to the crisis recovery response.
Spain has not visibly moved towards the implementation of a flexicurity model over the 2007 to 2010 period, although it has been widely acknowledged that the severe impact of the
crisis on Spain was in large part due to the lack of sustainability of its labour market., with many jobs created in the first half of the decade lost during the crisis, being temporary
roles. Addressing the impact of the crisis has been the primary focus of labour market policy from 2008 to 2010. Emergency measures were taken unilaterally by the government, as
no agreement with social partners was reached.
The 2008 crisis had a significant impact on Spain leading to the contraction of the employment rate, high unemployment and the persistence of segmentation between those with
permanent contracts and those in temporary jobs or excluded from the labour market. This segmentation has disproportionately affected young people, migrants, disabled people
and women. Strong gender inequalities have led to low female participation rates and a high share of involuntary part time employment.
Future Challenges
A number of challenges may inhibit Spain from implementing a genuine flexicurity model. The potential of flexicurity is seen as being hampered by late development of social policy
and ALMPs compared to other EU countries; social dialogue that is inadequate in terms of its legal framework of labour relations and collective bargaining and a low awareness of
the concept of common principles of flexicurity among policy makers and social partners. In addition, very importantly, here also seems to be a lack of strategic drive for employment
policy. The dramatic rise of unemployment and extremely tight budgets, leading to severe cuts in public spending, have resulted in climate of social tensions, which could
complicate or impede the adoption of long-term flexicurity strategies . Major labour law reforms have been taken since 2010 going towards further flexibility (including reforms
adopted by the new right-wing government appointed in November 2011) have been received with criticism and strongly opposed by trade unions, leading to general strikes; their
long-term impact on the labour market is still unknown.

194
27 Sweden
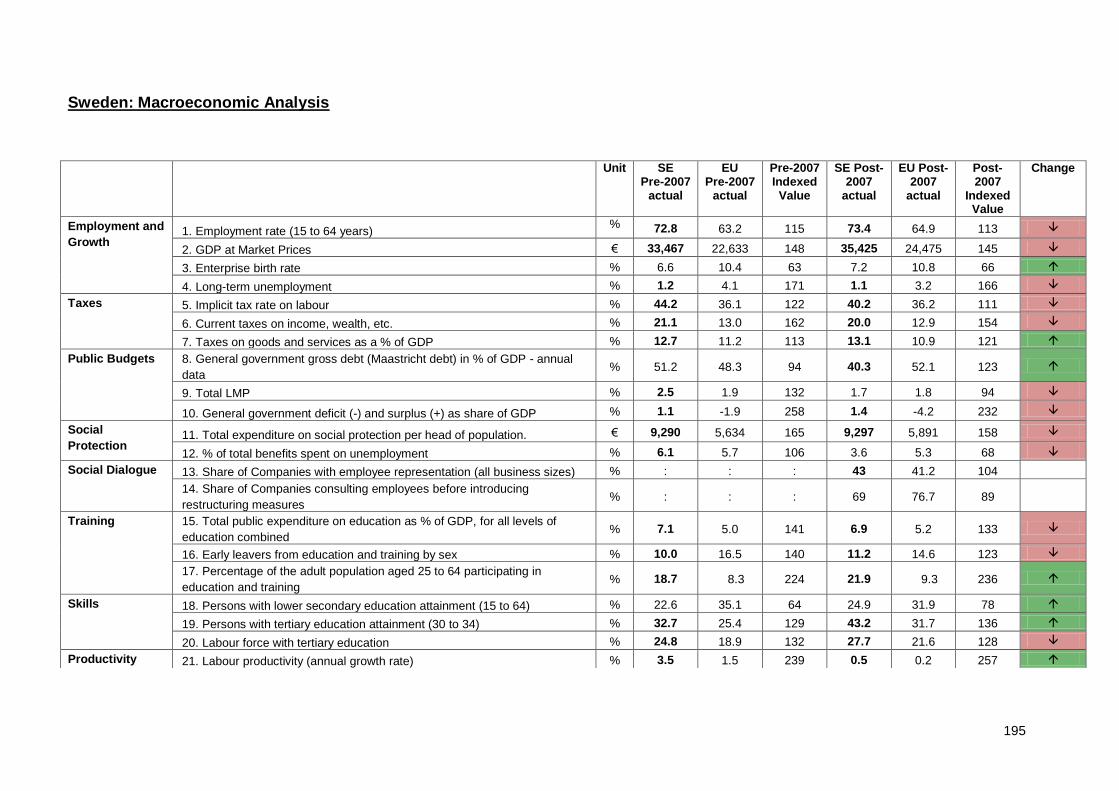
195
Sweden: Macroeconomic Analysis
Unit SE Pre-2007
actual
EU Pre-2007
actual
Pre-2007 Indexed Value
SE Post-2007
actual
EU Post-2007
actual
Post-2007
Indexed Value
Change
Employment and
Growth 1. Employment rate (15 to 64 years)
% 72.8 63.2 115 73.4 64.9 113
2. GDP at Market Prices € 33,467 22,633 148 35,425 24,475 145
3. Enterprise birth rate % 6.6 10.4 63 7.2 10.8 66
4. Long-term unemployment % 1.2 4.1 171 1.1 3.2 166
Taxes 5. Implicit tax rate on labour % 44.2 36.1 122 40.2 36.2 111
6. Current taxes on income, wealth, etc. % 21.1 13.0 162 20.0 12.9 154
7. Taxes on goods and services as a % of GDP % 12.7 11.2 113 13.1 10.9 121
Public Budgets 8. General government gross debt (Maastricht debt) in % of GDP - annual
data % 51.2 48.3 94 40.3 52.1 123
9. Total LMP % 2.5 1.9 132 1.7 1.8 94
10. General government deficit (-) and surplus (+) as share of GDP % 1.1 -1.9 258 1.4 -4.2 232
Social
Protection 11. Total expenditure on social protection per head of population. € 9,290 5,634 165 9,297 5,891 158
12. % of total benefits spent on unemployment % 6.1 5.7 106 3.6 5.3 68
Social Dialogue 13. Share of Companies with employee representation (all business sizes) % : : : 43 41.2 104
14. Share of Companies consulting employees before introducing
restructuring measures % : : : 69 76.7 89
Training 15. Total public expenditure on education as % of GDP, for all levels of
education combined % 7.1 5.0 141 6.9 5.2 133
16. Early leavers from education and training by sex % 10.0 16.5 140 11.2 14.6 123
17. Percentage of the adult population aged 25 to 64 participating in
education and training % 18.7 8.3 224 21.9 9.3 236
Skills 18. Persons with lower secondary education attainment (15 to 64) % 22.6 35.1 64 24.9 31.9 78
19. Persons with tertiary education attainment (30 to 34) % 32.7 25.4 129 43.2 31.7 136
20. Labour force with tertiary education % 24.8 18.9 132 27.7 21.6 128
Productivity 21. Labour productivity (annual growth rate) % 3.5 1.5 239 0.5 0.2 257
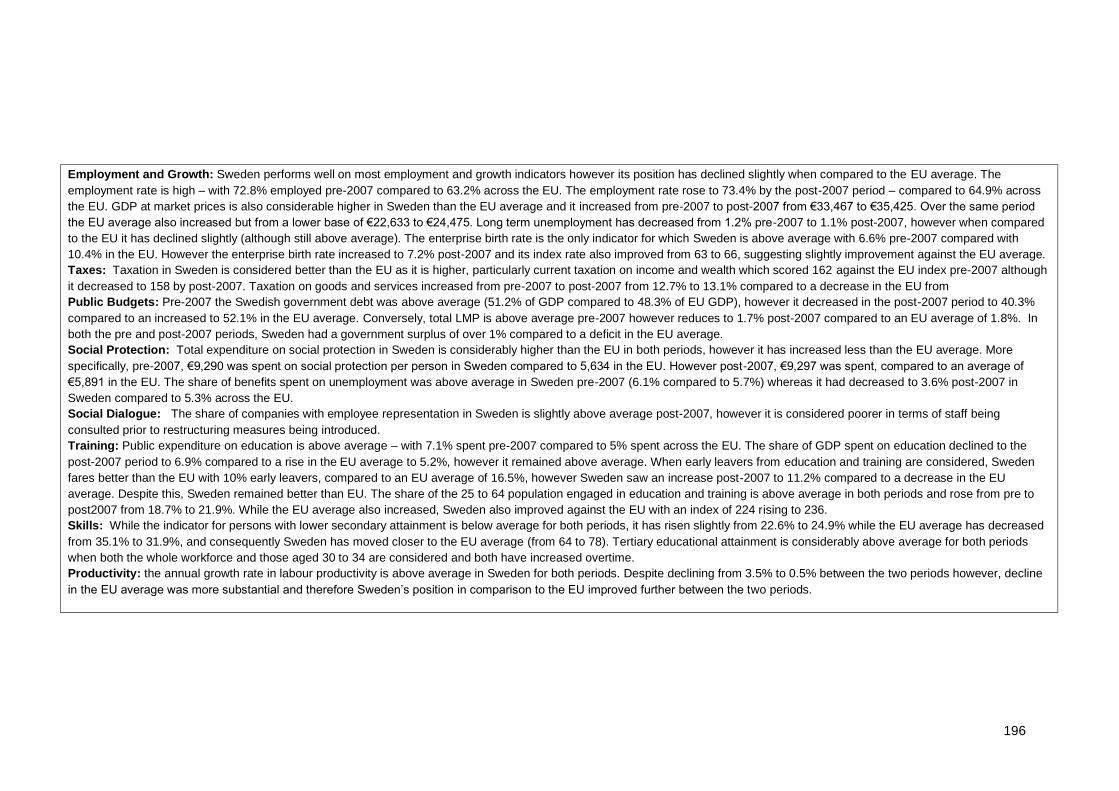
196
Employment and Growth: Sweden performs well on most employment and growth indicators however its position has declined slightly when compared to the EU average. The
employment rate is high – with 72.8% employed pre-2007 compared to 63.2% across the EU. The employment rate rose to 73.4% by the post-2007 period – compared to 64.9% across
the EU. GDP at market prices is also considerable higher in Sweden than the EU average and it increased from pre-2007 to post-2007 from €33,467 to €35,425. Over the same period
the EU average also increased but from a lower base of €22,633 to €24,475. Long term unemployment has decreased from 1.2% pre-2007 to 1.1% post-2007, however when compared
to the EU it has declined slightly (although still above average). The enterprise birth rate is the only indicator for which Sweden is above average with 6.6% pre-2007 compared with
10.4% in the EU. However the enterprise birth rate increased to 7.2% post-2007 and its index rate also improved from 63 to 66, suggesting slightly improvement against the EU average.
Taxes: Taxation in Sweden is considered better than the EU as it is higher, particularly current taxation on income and wealth which scored 162 against the EU index pre-2007 although
it decreased to 158 by post-2007. Taxation on goods and services increased from pre-2007 to post-2007 from 12.7% to 13.1% compared to a decrease in the EU from
Public Budgets: Pre-2007 the Swedish government debt was above average (51.2% of GDP compared to 48.3% of EU GDP), however it decreased in the post-2007 period to 40.3%
compared to an increased to 52.1% in the EU average. Conversely, total LMP is above average pre-2007 however reduces to 1.7% post-2007 compared to an EU average of 1.8%. In
both the pre and post-2007 periods, Sweden had a government surplus of over 1% compared to a deficit in the EU average.
Social Protection: Total expenditure on social protection in Sweden is considerably higher than the EU in both periods, however it has increased less than the EU average. More
specifically, pre-2007, €9,290 was spent on social protection per person in Sweden compared to 5,634 in the EU. However post-2007, €9,297 was spent, compared to an average of
€5,891 in the EU. The share of benefits spent on unemployment was above average in Sweden pre-2007 (6.1% compared to 5.7%) whereas it had decreased to 3.6% post-2007 in
Sweden compared to 5.3% across the EU.
Social Dialogue: The share of companies with employee representation in Sweden is slightly above average post-2007, however it is considered poorer in terms of staff being
consulted prior to restructuring measures being introduced.
Training: Public expenditure on education is above average – with 7.1% spent pre-2007 compared to 5% spent across the EU. The share of GDP spent on education declined to the
post-2007 period to 6.9% compared to a rise in the EU average to 5.2%, however it remained above average. When early leavers from education and training are considered, Sweden
fares better than the EU with 10% early leavers, compared to an EU average of 16.5%, however Sweden saw an increase post-2007 to 11.2% compared to a decrease in the EU
average. Despite this, Sweden remained better than EU. The share of the 25 to 64 population engaged in education and training is above average in both periods and rose from pre to
post2007 from 18.7% to 21.9%. While the EU average also increased, Sweden also improved against the EU with an index of 224 rising to 236.
Skills: While the indicator for persons with lower secondary attainment is below average for both periods, it has risen slightly from 22.6% to 24.9% while the EU average has decreased
from 35.1% to 31.9%, and consequently Sweden has moved closer to the EU average (from 64 to 78). Tertiary educational attainment is considerably above average for both periods
when both the whole workforce and those aged 30 to 34 are considered and both have increased overtime.
Productivity: the annual growth rate in labour productivity is above average in Sweden for both periods. Despite declining from 3.5% to 0.5% between the two periods however, decline
in the EU average was more substantial and therefore Sweden’s position in comparison to the EU improved further between the two periods.
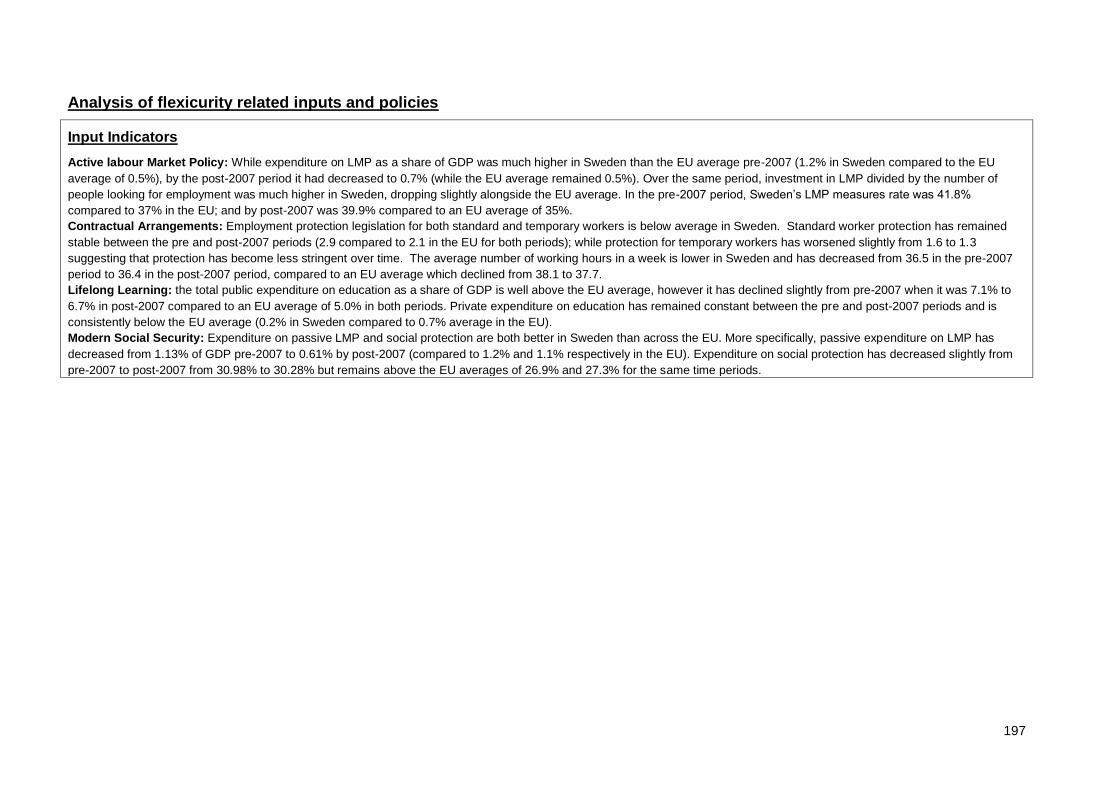
197
Analysis of flexicurity related inputs and policies
Input Indicators
Active labour Market Policy: While expenditure on LMP as a share of GDP was much higher in Sweden than the EU average pre-2007 (1.2% in Sweden compared to the EU
average of 0.5%), by the post-2007 period it had decreased to 0.7% (while the EU average remained 0.5%). Over the same period, investment in LMP divided by the number of
people looking for employment was much higher in Sweden, dropping slightly alongside the EU average. In the pre-2007 period, Sweden’s LMP measures rate was 41.8%
compared to 37% in the EU; and by post-2007 was 39.9% compared to an EU average of 35%.
Contractual Arrangements: Employment protection legislation for both standard and temporary workers is below average in Sweden. Standard worker protection has remained
stable between the pre and post-2007 periods (2.9 compared to 2.1 in the EU for both periods); while protection for temporary workers has worsened slightly from 1.6 to 1.3
suggesting that protection has become less stringent over time. The average number of working hours in a week is lower in Sweden and has decreased from 36.5 in the pre-2007
period to 36.4 in the post-2007 period, compared to an EU average which declined from 38.1 to 37.7.
Lifelong Learning: the total public expenditure on education as a share of GDP is well above the EU average, however it has declined slightly from pre-2007 when it was 7.1% to
6.7% in post-2007 compared to an EU average of 5.0% in both periods. Private expenditure on education has remained constant between the pre and post-2007 periods and is
consistently below the EU average (0.2% in Sweden compared to 0.7% average in the EU).
Modern Social Security: Expenditure on passive LMP and social protection are both better in Sweden than across the EU. More specifically, passive expenditure on LMP has
decreased from 1.13% of GDP pre-2007 to 0.61% by post-2007 (compared to 1.2% and 1.1% respectively in the EU). Expenditure on social protection has decreased slightly from
pre-2007 to post-2007 from 30.98% to 30.28% but remains above the EU averages of 26.9% and 27.3% for the same time periods.
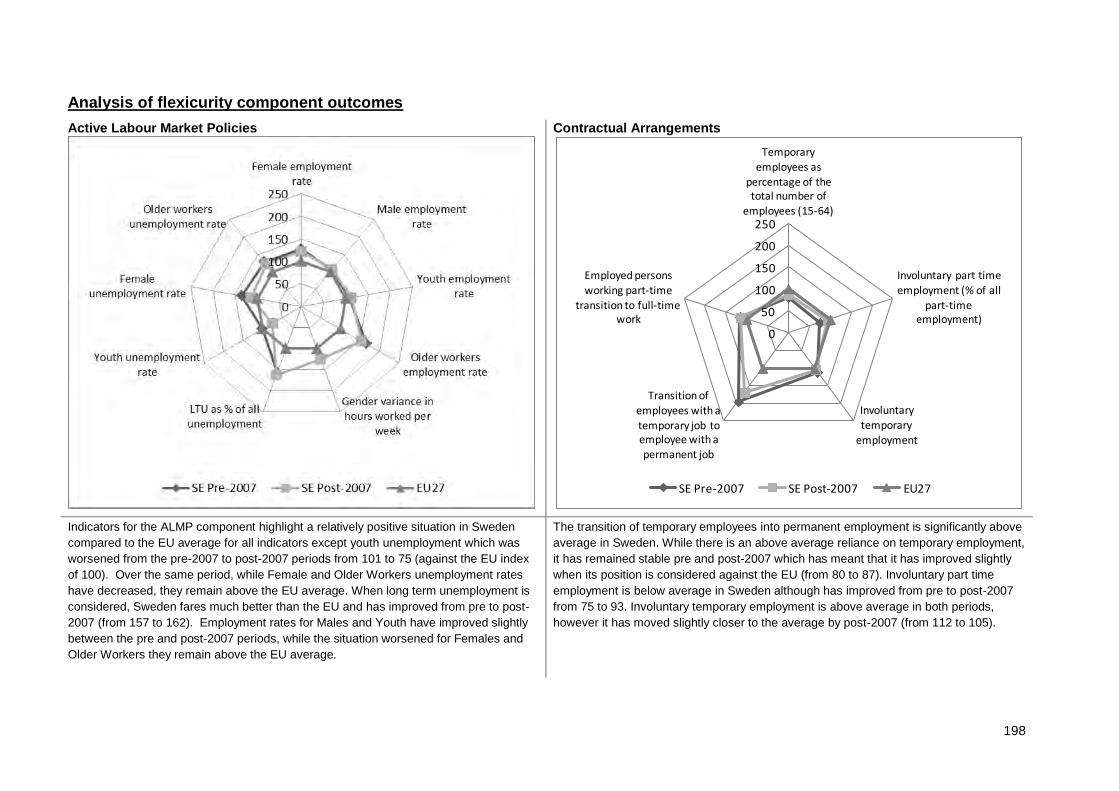
198
Analysis of flexicurity component outcomes
Active Labour Market Policies
Contractual Arrangements
Indicators for the ALMP component highlight a relatively positive situation in Sweden
compared to the EU average for all indicators except youth unemployment which was
worsened from the pre-2007 to post-2007 periods from 101 to 75 (against the EU index
of 100). Over the same period, while Female and Older Workers unemployment rates
have decreased, they remain above the EU average. When long term unemployment is
considered, Sweden fares much better than the EU and has improved from pre to post-
2007 (from 157 to 162). Employment rates for Males and Youth have improved slightly
between the pre and post-2007 periods, while the situation worsened for Females and
Older Workers they remain above the EU average.
The transition of temporary employees into permanent employment is significantly above
average in Sweden. While there is an above average reliance on temporary employment,
it has remained stable pre and post-2007 which has meant that it has improved slightly
when its position is considered against the EU (from 80 to 87). Involuntary part time
employment is below average in Sweden although has improved from pre to post-2007
from 75 to 93. Involuntary temporary employment is above average in both periods,
however it has moved slightly closer to the average by post-2007 (from 112 to 105).
0
50
100
150
200
250
Temporary employees as
percentage of the total number of
employees (15-64)
Involuntary part time
employment (% of all part-time
employment)
Involuntary
temporary employment
Transition of employees with a temporary job to employee with a
permanent job
Employed persons
working part-time transition to full-time
work
SE Pre-2007 SE Post-2007 EU27
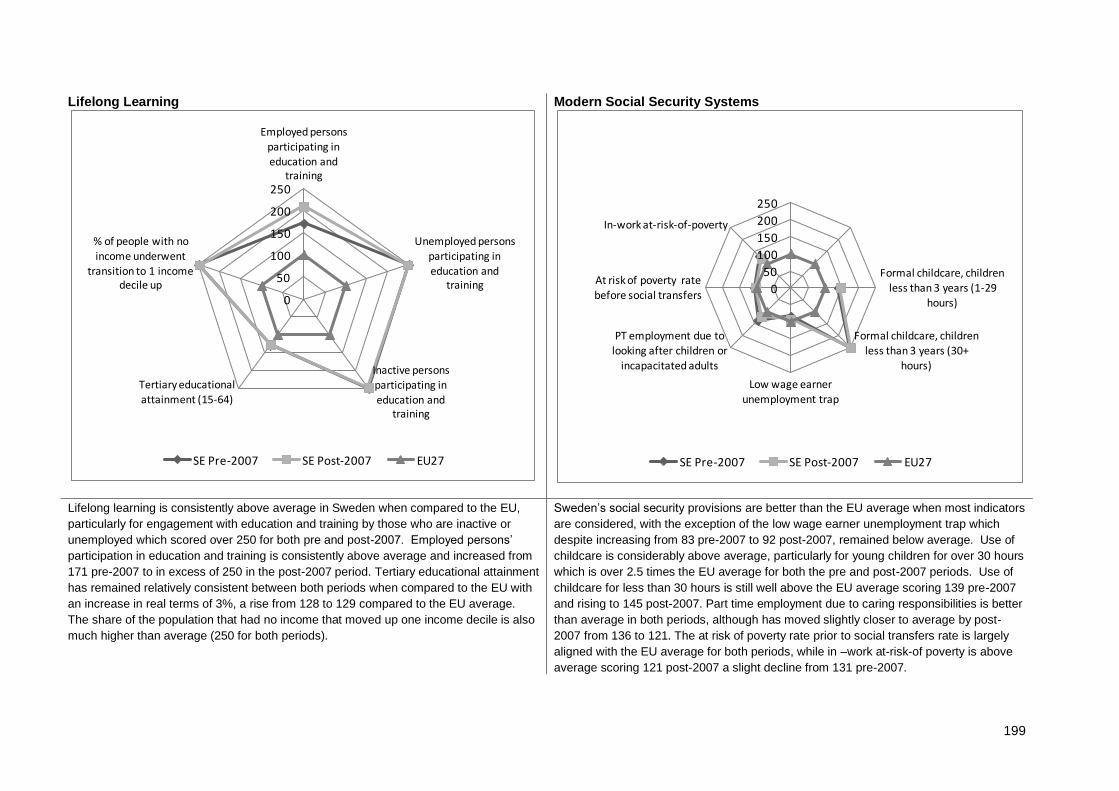
199
Lifelong Learning
Modern Social Security Systems
Lifelong learning is consistently above average in Sweden when compared to the EU,
particularly for engagement with education and training by those who are inactive or
unemployed which scored over 250 for both pre and post-2007. Employed persons’
participation in education and training is consistently above average and increased from
171 pre-2007 to in excess of 250 in the post-2007 period. Tertiary educational attainment
has remained relatively consistent between both periods when compared to the EU with
an increase in real terms of 3%, a rise from 128 to 129 compared to the EU average.
The share of the population that had no income that moved up one income decile is also
much higher than average (250 for both periods).
Sweden’s social security provisions are better than the EU average when most indicators
are considered, with the exception of the low wage earner unemployment trap which
despite increasing from 83 pre-2007 to 92 post-2007, remained below average. Use of
childcare is considerably above average, particularly for young children for over 30 hours
which is over 2.5 times the EU average for both the pre and post-2007 periods. Use of
childcare for less than 30 hours is still well above the EU average scoring 139 pre-2007
and rising to 145 post-2007. Part time employment due to caring responsibilities is better
than average in both periods, although has moved slightly closer to average by post-
2007 from 136 to 121. The at risk of poverty rate prior to social transfers rate is largely
aligned with the EU average for both periods, while in –work at-risk-of poverty is above
average scoring 121 post-2007 a slight decline from 131 pre-2007.
0
50
100
150
200
250
Employed persons participating in education and
training
Unemployed persons participating in
education and training
Inactive persons participating in education and
training
Tertiary educational attainment (15-64)
% of people with no income underwent
transition to 1 income decile up
SE Pre-2007 SE Post-2007 EU27
0
50
100
150
200
250
Formal childcare, children less than 3 years (1-29
hours)
Formal childcare, children less than 3 years (30+
hours)
Low wage earner
unemployment trap
PT employment due to looking after children or
incapacitated adults
At risk of poverty rate before social transfers
In-work at-risk-of-poverty
SE Pre-2007 SE Post-2007 EU27
200
Summary: Flexicurity Policy 2007-2010
At the macro-economic level, Sweden position has changed relatively little between the pre and post-2007 periods with small changes against the EU average for most indicators.
However, it saw significant improvement in terms of its General Government gross debt in real terms and against the EU average as it declined in real terms against an increase in
debt across the EU. Taxation is significantly above the EU average, particularly when taxes on income and wealth are considered. Total LMP decreased over the period and was
lower than the EU average by post-2007 and the share of benefits spent on unemployment decreased in both real and indexed terms, however expenditure on social protection
increased. Despite a decrease in public expenditure on education by the post-2007 period, Sweden’s expenditure remained above the average for the EU for the period. Adult
engagement in education and training increased from a base that was significantly above average – reflected in high tertiary education attainment in the 30 to 34 population and the
labour force which increased in real terms from pre to post-2007. Despite these improvements, there is still a lower than average share of the population with lower secondary
attainment, however it had improved from pre to post-2007 compared to a decrease in the EU average.
When inputs to Active Labour Market policy are considered, expenditure on LMP decreased between pre and post-2007 but remained above average, however the share of people
engaged with LMP measures (when considered against the number of people looking for work) is above average. However, the ALMP indicators still suggest a positive situation
compared to the EU average, with the exception of youth unemployment which worsened between the two periods and was below average by post-2007. Long term unemployment
as a share of unemployment was considerably lower in Sweden post-2007.
Protection for workers is below average in Sweden. Indicators for contractual arrangements highlight that there is above average reliance on temporary employment, however
transition from temporary to permanent employment is significantly higher than the average for the EU, and involuntary temporary employment is relatively stable. Expenditure on
passive LMP and social protection are higher in Sweden than the EU and indicators of social security systems reflect these investments. More specifically, childcare for over 30
hours per week is well above average and part time employment due to caring for children or incapacitated adults is aligned with the EU. Public expenditure on education is above
average however it has declined in the post-2007 period. That said, lifelong learning is consistently above average in Sweden, particularly when engagement of inactive or
unemployed people in education and training is considered. Similarly, employed persons engagement with education is above average.
The Swedish NRP 2008-2010 explicit mentions of flexicurity are the reference to the EU Council’s conclusions on flexicurity and the description of social partners’ agreement on
flexible contract. The NRP states that the measures carried out by the government are not isolated measures but rather co-ordinated and integrated programmes.

201
28 UK
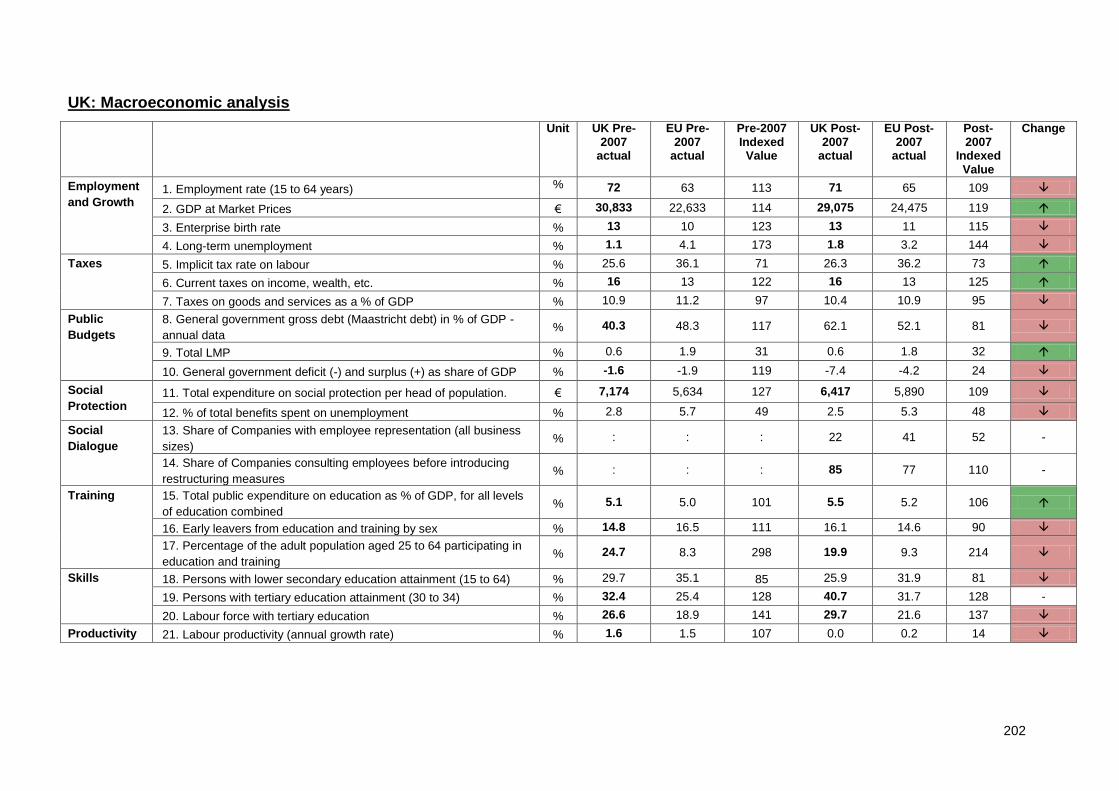
202
UK: Macroeconomic analysis
Unit UK Pre-2007
actual
EU Pre-2007
actual
Pre-2007 Indexed Value
UK Post-2007
actual
EU Post-2007
actual
Post-2007
Indexed Value
Change
Employment
and Growth 1. Employment rate (15 to 64 years) % 72 63 113 71 65 109
2. GDP at Market Prices € 30,833 22,633 114 29,075 24,475 119
3. Enterprise birth rate % 13 10 123 13 11 115
4. Long-term unemployment % 1.1 4.1 173 1.8 3.2 144
Taxes 5. Implicit tax rate on labour % 25.6 36.1 71 26.3 36.2 73
6. Current taxes on income, wealth, etc. % 16 13 122 16 13 125
7. Taxes on goods and services as a % of GDP % 10.9 11.2 97 10.4 10.9 95
Public
Budgets
8. General government gross debt (Maastricht debt) in % of GDP -
annual data % 40.3 48.3 117 62.1 52.1 81
9. Total LMP % 0.6 1.9 31 0.6 1.8 32
10. General government deficit (-) and surplus (+) as share of GDP % -1.6 -1.9 119 -7.4 -4.2 24
Social
Protection 11. Total expenditure on social protection per head of population. € 7,174 5,634 127 6,417 5,890 109
12. % of total benefits spent on unemployment % 2.8 5.7 49 2.5 5.3 48
Social
Dialogue
13. Share of Companies with employee representation (all business
sizes) % : : : 22 41 52 -
14. Share of Companies consulting employees before introducing
restructuring measures % : : : 85 77 110 -
Training 15. Total public expenditure on education as % of GDP, for all levels
of education combined % 5.1 5.0 101 5.5 5.2 106
16. Early leavers from education and training by sex % 14.8 16.5 111 16.1 14.6 90
17. Percentage of the adult population aged 25 to 64 participating in
education and training % 24.7 8.3 298 19.9 9.3 214
Skills 18. Persons with lower secondary education attainment (15 to 64) % 29.7 35.1 85 25.9 31.9 81
19. Persons with tertiary education attainment (30 to 34) % 32.4 25.4 128 40.7 31.7 128 -
20. Labour force with tertiary education % 26.6 18.9 141 29.7 21.6 137
Productivity 21. Labour productivity (annual growth rate) % 1.6 1.5 107 0.0 0.2 14
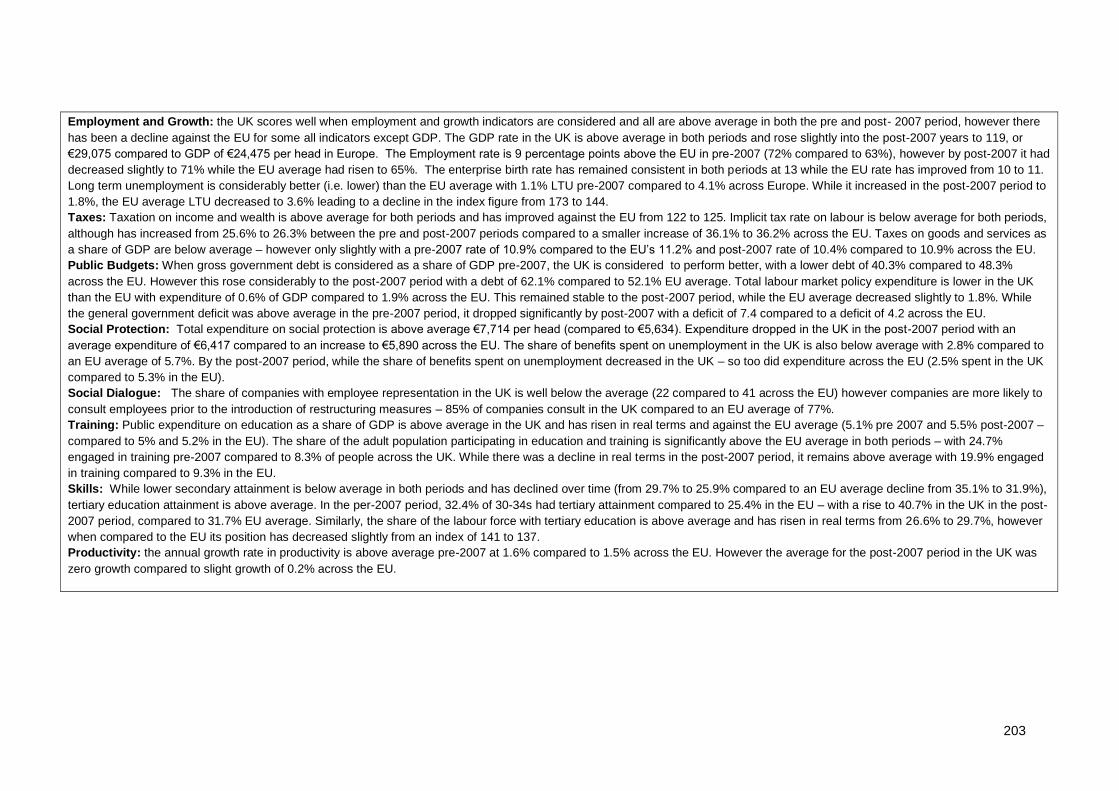
203
Employment and Growth: the UK scores well when employment and growth indicators are considered and all are above average in both the pre and post- 2007 period, however there
has been a decline against the EU for some all indicators except GDP. The GDP rate in the UK is above average in both periods and rose slightly into the post-2007 years to 119, or
€29,075 compared to GDP of €24,475 per head in Europe. The Employment rate is 9 percentage points above the EU in pre-2007 (72% compared to 63%), however by post-2007 it had
decreased slightly to 71% while the EU average had risen to 65%. The enterprise birth rate has remained consistent in both periods at 13 while the EU rate has improved from 10 to 11.
Long term unemployment is considerably better (i.e. lower) than the EU average with 1.1% LTU pre-2007 compared to 4.1% across Europe. While it increased in the post-2007 period to
1.8%, the EU average LTU decreased to 3.6% leading to a decline in the index figure from 173 to 144.
Taxes: Taxation on income and wealth is above average for both periods and has improved against the EU from 122 to 125. Implicit tax rate on labour is below average for both periods,
although has increased from 25.6% to 26.3% between the pre and post-2007 periods compared to a smaller increase of 36.1% to 36.2% across the EU. Taxes on goods and services as
a share of GDP are below average – however only slightly with a pre-2007 rate of 10.9% compared to the EU’s 11.2% and post-2007 rate of 10.4% compared to 10.9% across the EU.
Public Budgets: When gross government debt is considered as a share of GDP pre-2007, the UK is considered to perform better, with a lower debt of 40.3% compared to 48.3%
across the EU. However this rose considerably to the post-2007 period with a debt of 62.1% compared to 52.1% EU average. Total labour market policy expenditure is lower in the UK
than the EU with expenditure of 0.6% of GDP compared to 1.9% across the EU. This remained stable to the post-2007 period, while the EU average decreased slightly to 1.8%. While
the general government deficit was above average in the pre-2007 period, it dropped significantly by post-2007 with a deficit of 7.4 compared to a deficit of 4.2 across the EU.
Social Protection: Total expenditure on social protection is above average €7,714 per head (compared to €5,634). Expenditure dropped in the UK in the post-2007 period with an
average expenditure of €6,417 compared to an increase to €5,890 across the EU. The share of benefits spent on unemployment in the UK is also below average with 2.8% compared to
an EU average of 5.7%. By the post-2007 period, while the share of benefits spent on unemployment decreased in the UK – so too did expenditure across the EU (2.5% spent in the UK
compared to 5.3% in the EU).
Social Dialogue: The share of companies with employee representation in the UK is well below the average (22 compared to 41 across the EU) however companies are more likely to
consult employees prior to the introduction of restructuring measures – 85% of companies consult in the UK compared to an EU average of 77%.
Training: Public expenditure on education as a share of GDP is above average in the UK and has risen in real terms and against the EU average (5.1% pre 2007 and 5.5% post-2007 –
compared to 5% and 5.2% in the EU). The share of the adult population participating in education and training is significantly above the EU average in both periods – with 24.7%
engaged in training pre-2007 compared to 8.3% of people across the UK. While there was a decline in real terms in the post-2007 period, it remains above average with 19.9% engaged
in training compared to 9.3% in the EU.
Skills: While lower secondary attainment is below average in both periods and has declined over time (from 29.7% to 25.9% compared to an EU average decline from 35.1% to 31.9%),
tertiary education attainment is above average. In the per-2007 period, 32.4% of 30-34s had tertiary attainment compared to 25.4% in the EU – with a rise to 40.7% in the UK in the post-
2007 period, compared to 31.7% EU average. Similarly, the share of the labour force with tertiary education is above average and has risen in real terms from 26.6% to 29.7%, however
when compared to the EU its position has decreased slightly from an index of 141 to 137.
Productivity: the annual growth rate in productivity is above average pre-2007 at 1.6% compared to 1.5% across the EU. However the average for the post-2007 period in the UK was
zero growth compared to slight growth of 0.2% across the EU.
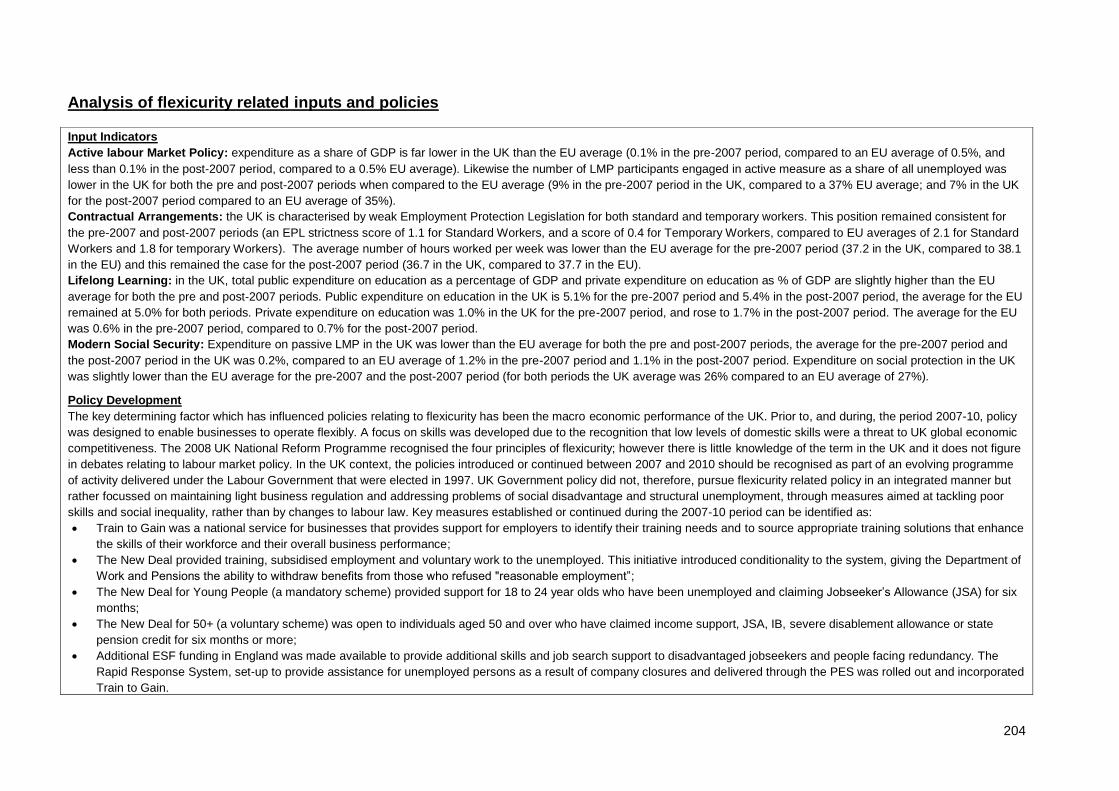
204
Analysis of flexicurity related inputs and policies
Input Indicators
Active labour Market Policy: expenditure as a share of GDP is far lower in the UK than the EU average (0.1% in the pre-2007 period, compared to an EU average of 0.5%, and
less than 0.1% in the post-2007 period, compared to a 0.5% EU average). Likewise the number of LMP participants engaged in active measure as a share of all unemployed was
lower in the UK for both the pre and post-2007 periods when compared to the EU average (9% in the pre-2007 period in the UK, compared to a 37% EU average; and 7% in the UK
for the post-2007 period compared to an EU average of 35%).
Contractual Arrangements: the UK is characterised by weak Employment Protection Legislation for both standard and temporary workers. This position remained consistent for
the pre-2007 and post-2007 periods (an EPL strictness score of 1.1 for Standard Workers, and a score of 0.4 for Temporary Workers, compared to EU averages of 2.1 for Standard
Workers and 1.8 for temporary Workers). The average number of hours worked per week was lower than the EU average for the pre-2007 period (37.2 in the UK, compared to 38.1
in the EU) and this remained the case for the post-2007 period (36.7 in the UK, compared to 37.7 in the EU).
Lifelong Learning: in the UK, total public expenditure on education as a percentage of GDP and private expenditure on education as % of GDP are slightly higher than the EU
average for both the pre and post-2007 periods. Public expenditure on education in the UK is 5.1% for the pre-2007 period and 5.4% in the post-2007 period, the average for the EU
remained at 5.0% for both periods. Private expenditure on education was 1.0% in the UK for the pre-2007 period, and rose to 1.7% in the post-2007 period. The average for the EU
was 0.6% in the pre-2007 period, compared to 0.7% for the post-2007 period.
Modern Social Security: Expenditure on passive LMP in the UK was lower than the EU average for both the pre and post-2007 periods, the average for the pre-2007 period and
the post-2007 period in the UK was 0.2%, compared to an EU average of 1.2% in the pre-2007 period and 1.1% in the post-2007 period. Expenditure on social protection in the UK
was slightly lower than the EU average for the pre-2007 and the post-2007 period (for both periods the UK average was 26% compared to an EU average of 27%).
Policy Development
The key determining factor which has influenced policies relating to flexicurity has been the macro economic performance of the UK. Prior to, and during, the period 2007-10, policy
was designed to enable businesses to operate flexibly. A focus on skills was developed due to the recognition that low levels of domestic skills were a threat to UK global economic
competitiveness. The 2008 UK National Reform Programme recognised the four principles of flexicurity; however there is little knowledge of the term in the UK and it does not figure
in debates relating to labour market policy. In the UK context, the policies introduced or continued between 2007 and 2010 should be recognised as part of an evolving programme
of activity delivered under the Labour Government that were elected in 1997. UK Government policy did not, therefore, pursue flexicurity related policy in an integrated manner but
rather focussed on maintaining light business regulation and addressing problems of social disadvantage and structural unemployment, through measures aimed at tackling poor
skills and social inequality, rather than by changes to labour law. Key measures established or continued during the 2007-10 period can be identified as:
Train to Gain was a national service for businesses that provides support for employers to identify their training needs and to source appropriate training solutions that enhance
the skills of their workforce and their overall business performance;
The New Deal provided training, subsidised employment and voluntary work to the unemployed. This initiative introduced conditionality to the system, giving the Department of
Work and Pensions the ability to withdraw benefits from those who refused "reasonable employment”;
The New Deal for Young People (a mandatory scheme) provided support for 18 to 24 year olds who have been unemployed and claiming Jobseeker’s Allowance (JSA) for six
months;
The New Deal for 50+ (a voluntary scheme) was open to individuals aged 50 and over who have claimed income support, JSA, IB, severe disablement allowance or state
pension credit for six months or more;
Additional ESF funding in England was made available to provide additional skills and job search support to disadvantaged jobseekers and people facing redundancy. The
Rapid Response System, set-up to provide assistance for unemployed persons as a result of company closures and delivered through the PES was rolled out and incorporated
Train to Gain.
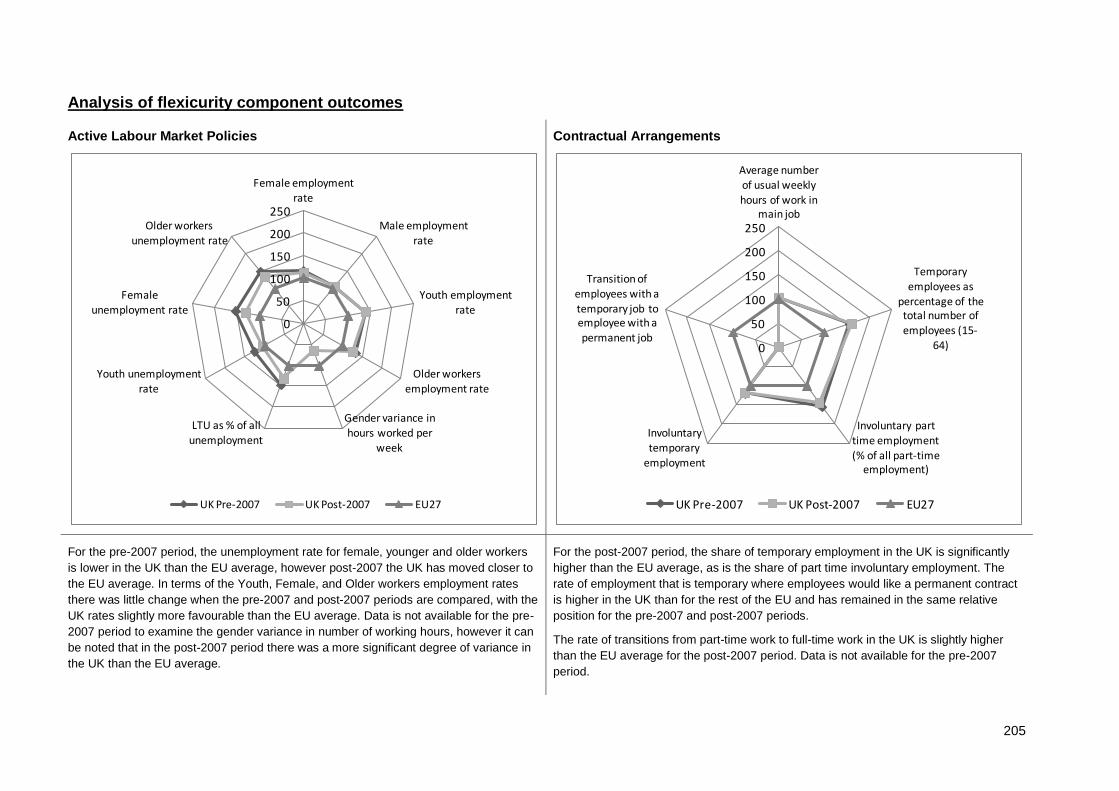
205
Analysis of flexicurity component outcomes
Active Labour Market Policies
Contractual Arrangements
For the pre-2007 period, the unemployment rate for female, younger and older workers
is lower in the UK than the EU average, however post-2007 the UK has moved closer to
the EU average. In terms of the Youth, Female, and Older workers employment rates
there was little change when the pre-2007 and post-2007 periods are compared, with the
UK rates slightly more favourable than the EU average. Data is not available for the pre-
2007 period to examine the gender variance in number of working hours, however it can
be noted that in the post-2007 period there was a more significant degree of variance in
the UK than the EU average.
For the post-2007 period, the share of temporary employment in the UK is significantly
higher than the EU average, as is the share of part time involuntary employment. The
rate of employment that is temporary where employees would like a permanent contract
is higher in the UK than for the rest of the EU and has remained in the same relative
position for the pre-2007 and post-2007 periods.
The rate of transitions from part-time work to full-time work in the UK is slightly higher
than the EU average for the post-2007 period. Data is not available for the pre-2007
period.
0
50
100
150
200
250
Female employment rate
Male employment
rate
Youth employment rate
Older workers employment rate
Gender variance in hours worked per
week
LTU as % of all unemployment
Youth unemployment rate
Female unemployment rate
Older workers
unemployment rate
UK Pre-2007 UK Post-2007 EU27
0
50
100
150
200
250
Average number of usual weekly hours of work in
main job
Temporary employees as
percentage of the total number of employees (15-
64)
Involuntary part time employment (% of all part-time
employment)
Involuntary temporary
employment
Transition of employees with a temporary job to employee with a
permanent job
UK Pre-2007 UK Post-2007 EU27
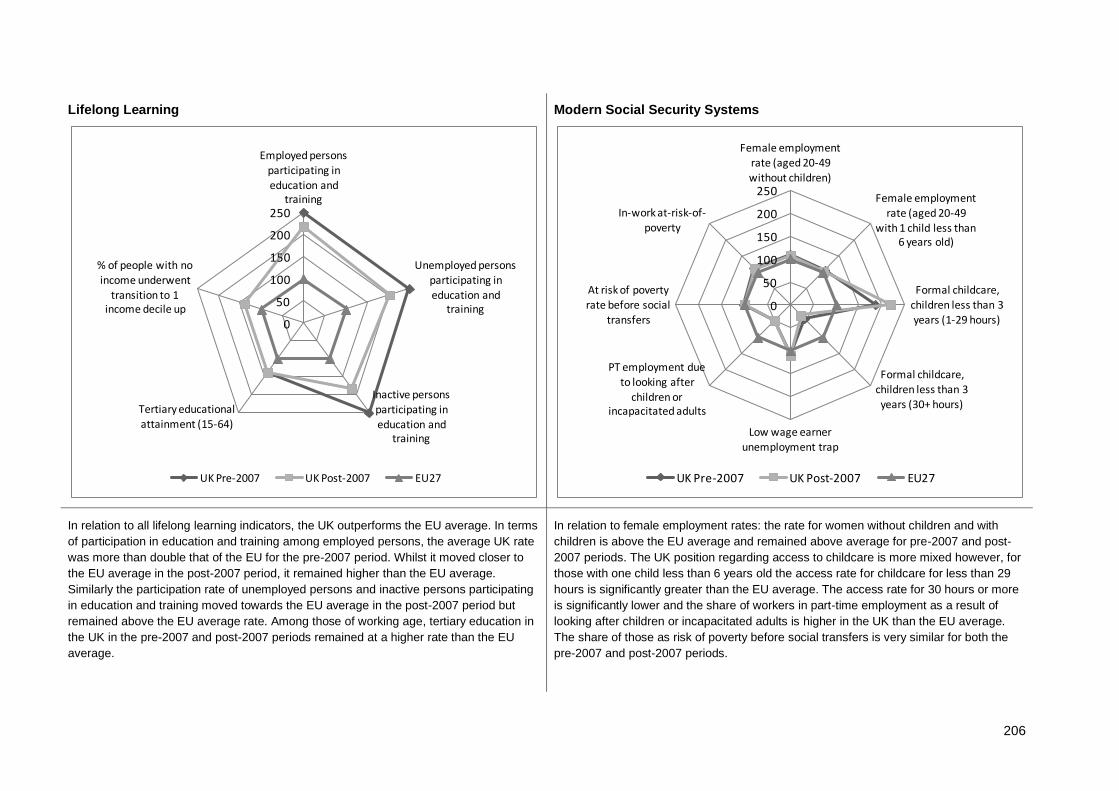
206
Lifelong Learning
Modern Social Security Systems
In relation to all lifelong learning indicators, the UK outperforms the EU average. In terms
of participation in education and training among employed persons, the average UK rate
was more than double that of the EU for the pre-2007 period. Whilst it moved closer to
the EU average in the post-2007 period, it remained higher than the EU average.
Similarly the participation rate of unemployed persons and inactive persons participating
in education and training moved towards the EU average in the post-2007 period but
remained above the EU average rate. Among those of working age, tertiary education in
the UK in the pre-2007 and post-2007 periods remained at a higher rate than the EU
average.
In relation to female employment rates: the rate for women without children and with
children is above the EU average and remained above average for pre-2007 and post-
2007 periods. The UK position regarding access to childcare is more mixed however, for
those with one child less than 6 years old the access rate for childcare for less than 29
hours is significantly greater than the EU average. The access rate for 30 hours or more
is significantly lower and the share of workers in part-time employment as a result of
looking after children or incapacitated adults is higher in the UK than the EU average.
The share of those as risk of poverty before social transfers is very similar for both the
pre-2007 and post-2007 periods.
0
50
100
150
200
250
Employed persons participating in education and
training
Unemployed persons participating in education and
training
Inactive persons
participating in education and
training
Tertiary educational attainment (15-64)
% of people with no income underwent
transition to 1 income decile up
UK Pre-2007 UK Post-2007 EU27
0
50
100
150
200
250
Female employment rate (aged 20-49 without children)
Female employment rate (aged 20-49
with 1 child less than 6 years old)
Formal childcare,
children less than 3 years (1-29 hours)
Formal childcare, children less than 3 years (30+ hours)
Low wage earner unemployment trap
PT employment due to looking after
children or incapacitated adults
At risk of poverty
rate before social transfers
In-work at-risk-of-poverty
UK Pre-2007 UK Post-2007 EU27
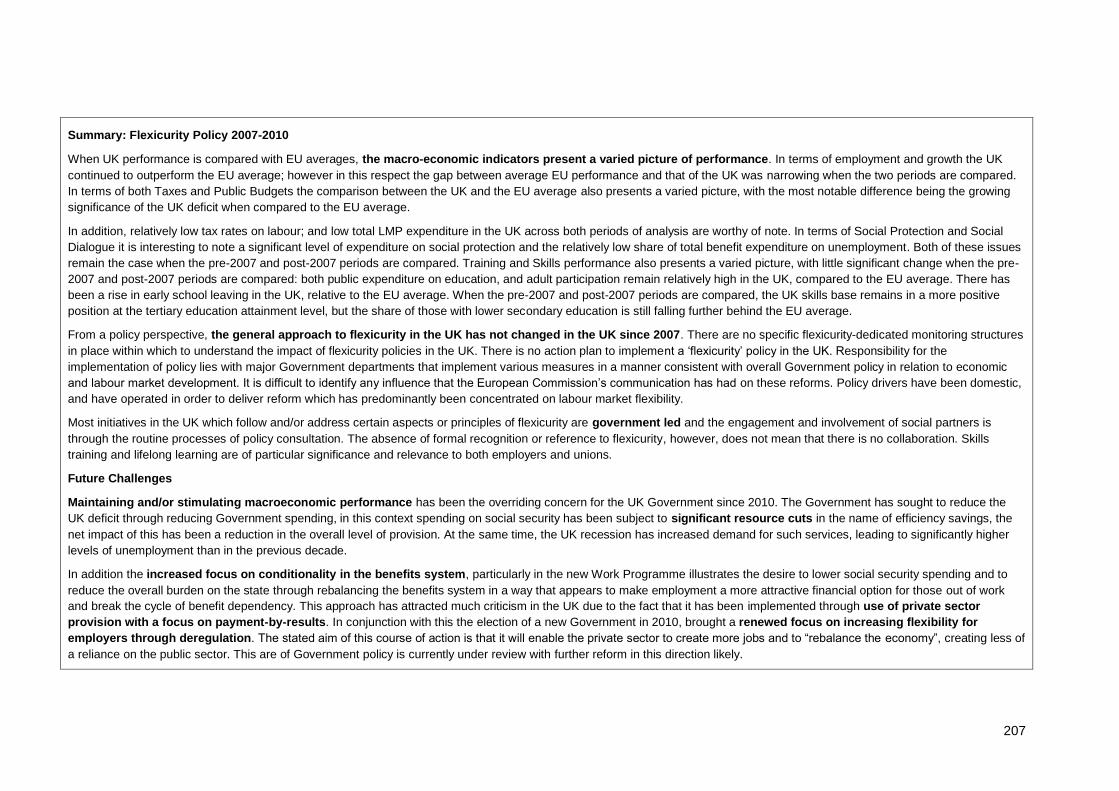
207
Summary: Flexicurity Policy 2007-2010
When UK performance is compared with EU averages, the macro-economic indicators present a varied picture of performance. In terms of employment and growth the UK
continued to outperform the EU average; however in this respect the gap between average EU performance and that of the UK was narrowing when the two periods are compared.
In terms of both Taxes and Public Budgets the comparison between the UK and the EU average also presents a varied picture, with the most notable difference being the growing
significance of the UK deficit when compared to the EU average.
In addition, relatively low tax rates on labour; and low total LMP expenditure in the UK across both periods of analysis are worthy of note. In terms of Social Protection and Social
Dialogue it is interesting to note a significant level of expenditure on social protection and the relatively low share of total benefit expenditure on unemployment. Both of these issues
remain the case when the pre-2007 and post-2007 periods are compared. Training and Skills performance also presents a varied picture, with little significant change when the pre-
2007 and post-2007 periods are compared: both public expenditure on education, and adult participation remain relatively high in the UK, compared to the EU average. There has
been a rise in early school leaving in the UK, relative to the EU average. When the pre-2007 and post-2007 periods are compared, the UK skills base remains in a more positive
position at the tertiary education attainment level, but the share of those with lower secondary education is still falling further behind the EU average.
From a policy perspective, the general approach to flexicurity in the UK has not changed in the UK since 2007. There are no specific flexicurity-dedicated monitoring structures
in place within which to understand the impact of flexicurity policies in the UK. There is no action plan to implement a ‘flexicurity’ policy in the UK. Responsibility for the
implementation of policy lies with major Government departments that implement various measures in a manner consistent with overall Government policy in relation to economic
and labour market development. It is difficult to identify any influence that the European Commission’s communication has had on these reforms. Policy drivers have been domestic,
and have operated in order to deliver reform which has predominantly been concentrated on labour market flexibility.
Most initiatives in the UK which follow and/or address certain aspects or principles of flexicurity are government led and the engagement and involvement of social partners is
through the routine processes of policy consultation. The absence of formal recognition or reference to flexicurity, however, does not mean that there is no collaboration. Skills
training and lifelong learning are of particular significance and relevance to both employers and unions.
Future Challenges
Maintaining and/or stimulating macroeconomic performance has been the overriding concern for the UK Government since 2010. The Government has sought to reduce the
UK deficit through reducing Government spending, in this context spending on social security has been subject to significant resource cuts in the name of efficiency savings, the
net impact of this has been a reduction in the overall level of provision. At the same time, the UK recession has increased demand for such services, leading to significantly higher
levels of unemployment than in the previous decade.
In addition the increased focus on conditionality in the benefits system, particularly in the new Work Programme illustrates the desire to lower social security spending and to
reduce the overall burden on the state through rebalancing the benefits system in a way that appears to make employment a more attractive financial option for those out of work
and break the cycle of benefit dependency. This approach has attracted much criticism in the UK due to the fact that it has been implemented through use of private sector
provision with a focus on payment-by-results. In conjunction with this the election of a new Government in 2010, brought a renewed focus on increasing flexibility for
employers through deregulation. The stated aim of this course of action is that it will enable the private sector to create more jobs and to “rebalance the economy”, creating less of
a reliance on the public sector. This are of Government policy is currently under review with further reform in this direction likely.
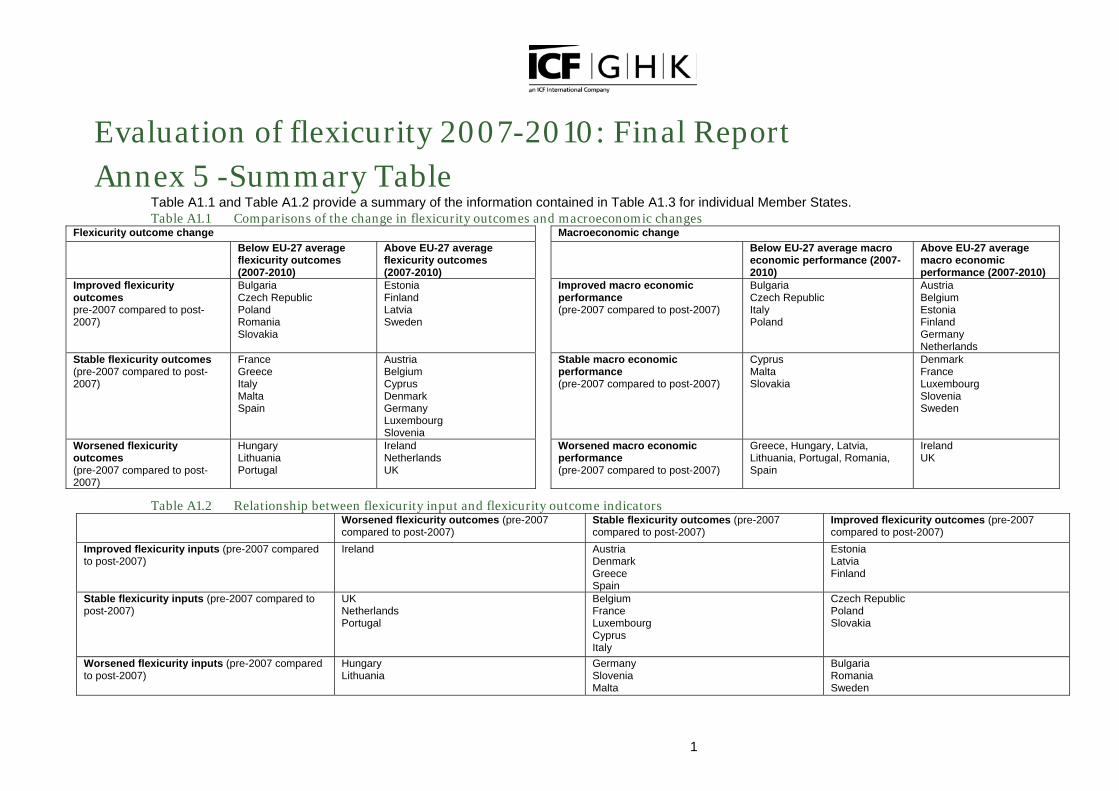
1
Evaluation of flexicurity 2007-2010: Final Report Annex 5 -Summary Table
Table A1.1 and Table A1.2 provide a summary of the information contained in Table A1.3 for individual Member States.
Table A1.1 Comparisons of the change in flexicurity outcomes and macroeconomic changes Flexicurity outcome change Macroeconomic change
Below EU-27 average flexicurity outcomes (2007-2010)
Above EU-27 average flexicurity outcomes (2007-2010)
Below EU-27 average macro economic performance (2007-2010)
Above EU-27 average macro economic performance (2007-2010)
Improved flexicurity outcomes pre-2007 compared to post-2007)
Bulgaria Czech Republic Poland Romania Slovakia
Estonia Finland Latvia Sweden
Improved macro economic performance (pre-2007 compared to post-2007)
Bulgaria Czech Republic Italy Poland
Austria Belgium Estonia Finland Germany Netherlands
Stable flexicurity outcomes (pre-2007 compared to post-2007)
France Greece Italy Malta Spain
Austria Belgium Cyprus Denmark Germany Luxembourg Slovenia
Stable macro economic performance (pre-2007 compared to post-2007)
Cyprus Malta Slovakia
Denmark France Luxembourg Slovenia Sweden
Worsened flexicurity outcomes (pre-2007 compared to post-2007)
Hungary Lithuania Portugal
Ireland Netherlands UK
Worsened macro economic performance (pre-2007 compared to post-2007)
Greece, Hungary, Latvia, Lithuania, Portugal, Romania, Spain
Ireland UK
Table A1.2 Relationship between flexicurity input and flexicurity outcome indicators Worsened flexicurity outcomes (pre-2007
compared to post-2007) Stable flexicurity outcomes (pre-2007 compared to post-2007)
Improved flexicurity outcomes (pre-2007 compared to post-2007)
Improved flexicurity inputs (pre-2007 compared to post-2007)
Ireland Austria Denmark Greece Spain
Estonia Latvia Finland
Stable flexicurity inputs (pre-2007 compared to post-2007)
UK Netherlands Portugal
Belgium France Luxembourg Cyprus Italy
Czech Republic Poland Slovakia
Worsened flexicurity inputs (pre-2007 compared to post-2007)
Hungary Lithuania
Germany Slovenia Malta
Bulgaria Romania Sweden
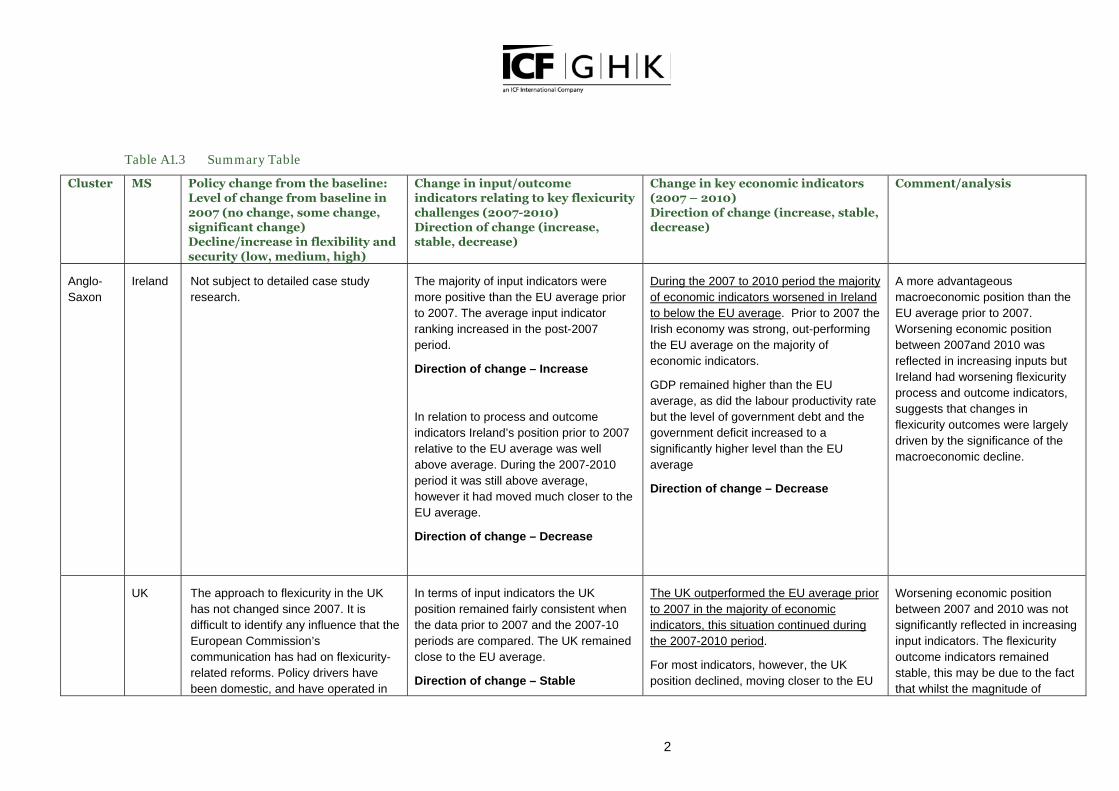
2
Table A1.3 Summary Table
Cluster MS Policy change from the baseline: Level of change from baseline in 2007 (no change, some change, significant change) Decline/increase in flexibility and security (low, medium, high)
Change in input/outcome indicators relating to key flexicurity challenges (2007-2010) Direction of change (increase, stable, decrease)
Change in key economic indicators (2007 – 2010) Direction of change (increase, stable, decrease)
Comment/analysis
Anglo-
Saxon
Ireland Not subject to detailed case study
research.
The majority of input indicators were
more positive than the EU average prior
to 2007. The average input indicator
ranking increased in the post-2007
period.
Direction of change – Increase
In relation to process and outcome
indicators Ireland’s position prior to 2007
relative to the EU average was well
above average. During the 2007-2010
period it was still above average,
however it had moved much closer to the
EU average.
Direction of change – Decrease
During the 2007 to 2010 period the majority
of economic indicators worsened in Ireland
to below the EU average. Prior to 2007 the
Irish economy was strong, out-performing
the EU average on the majority of
economic indicators.
GDP remained higher than the EU
average, as did the labour productivity rate
but the level of government debt and the
government deficit increased to a
significantly higher level than the EU
average
Direction of change – Decrease
A more advantageous
macroeconomic position than the
EU average prior to 2007.
Worsening economic position
between 2007and 2010 was
reflected in increasing inputs but
Ireland had worsening flexicurity
process and outcome indicators,
suggests that changes in
flexicurity outcomes were largely
driven by the significance of the
macroeconomic decline.
UK The approach to flexicurity in the UK
has not changed since 2007. It is
difficult to identify any influence that the
European Commission’s
communication has had on flexicurity-
related reforms. Policy drivers have
been domestic, and have operated in
In terms of input indicators the UK
position remained fairly consistent when
the data prior to 2007 and the 2007-10
periods are compared. The UK remained
close to the EU average.
Direction of change – Stable
The UK outperformed the EU average prior
to 2007 in the majority of economic
indicators, this situation continued during
the 2007-2010 period.
For most indicators, however, the UK
position declined, moving closer to the EU
Worsening economic position
between 2007 and 2010 was not
significantly reflected in increasing
input indicators. The flexicurity
outcome indicators remained
stable, this may be due to the fact
that whilst the magnitude of
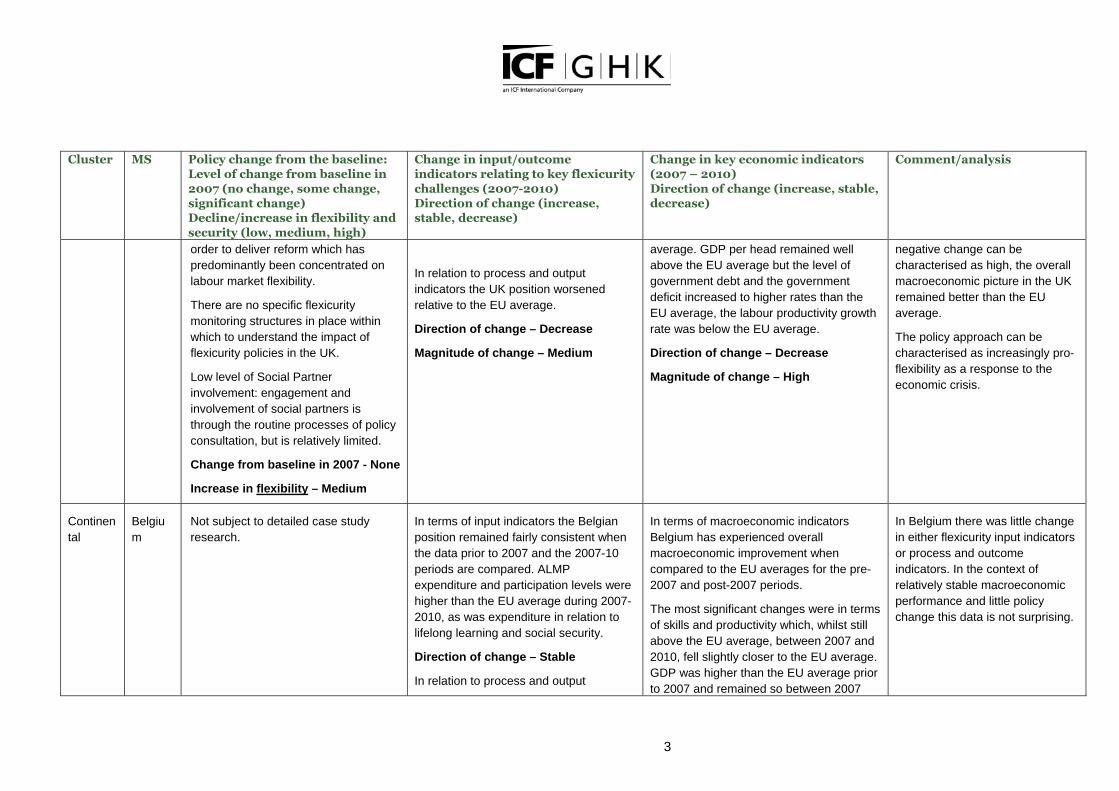
3
Cluster MS Policy change from the baseline: Level of change from baseline in 2007 (no change, some change, significant change) Decline/increase in flexibility and security (low, medium, high)
Change in input/outcome indicators relating to key flexicurity challenges (2007-2010) Direction of change (increase, stable, decrease)
Change in key economic indicators (2007 – 2010) Direction of change (increase, stable, decrease)
Comment/analysis
order to deliver reform which has
predominantly been concentrated on
labour market flexibility.
There are no specific flexicurity
monitoring structures in place within
which to understand the impact of
flexicurity policies in the UK.
Low level of Social Partner
involvement: engagement and
involvement of social partners is
through the routine processes of policy
consultation, but is relatively limited.
Change from baseline in 2007 - None
Increase in flexibility – Medium
In relation to process and output
indicators the UK position worsened
relative to the EU average.
Direction of change – Decrease
Magnitude of change – Medium
average. GDP per head remained well
above the EU average but the level of
government debt and the government
deficit increased to higher rates than the
EU average, the labour productivity growth
rate was below the EU average.
Direction of change – Decrease
Magnitude of change – High
negative change can be
characterised as high, the overall
macroeconomic picture in the UK
remained better than the EU
average.
The policy approach can be
characterised as increasingly pro-
flexibility as a response to the
economic crisis.
Continen
tal
Belgiu
m
Not subject to detailed case study
research.
In terms of input indicators the Belgian
position remained fairly consistent when
the data prior to 2007 and the 2007-10
periods are compared. ALMP
expenditure and participation levels were
higher than the EU average during 2007-
2010, as was expenditure in relation to
lifelong learning and social security.
Direction of change – Stable
In relation to process and output
In terms of macroeconomic indicators
Belgium has experienced overall
macroeconomic improvement when
compared to the EU averages for the pre-
2007 and post-2007 periods.
The most significant changes were in terms
of skills and productivity which, whilst still
above the EU average, between 2007 and
2010, fell slightly closer to the EU average.
GDP was higher than the EU average prior
to 2007 and remained so between 2007
In Belgium there was little change
in either flexicurity input indicators
or process and outcome
indicators. In the context of
relatively stable macroeconomic
performance and little policy
change this data is not surprising.
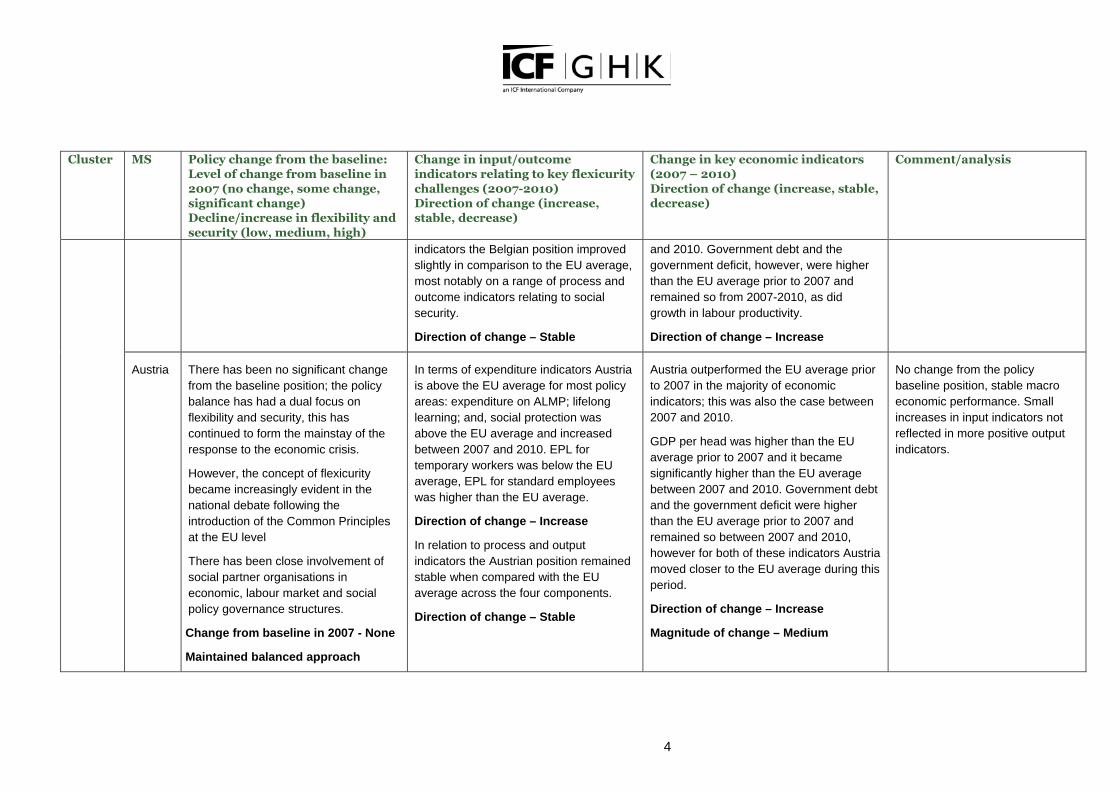
4
Cluster MS Policy change from the baseline: Level of change from baseline in 2007 (no change, some change, significant change) Decline/increase in flexibility and security (low, medium, high)
Change in input/outcome indicators relating to key flexicurity challenges (2007-2010) Direction of change (increase, stable, decrease)
Change in key economic indicators (2007 – 2010) Direction of change (increase, stable, decrease)
Comment/analysis
indicators the Belgian position improved
slightly in comparison to the EU average,
most notably on a range of process and
outcome indicators relating to social
security.
Direction of change – Stable
and 2010. Government debt and the
government deficit, however, were higher
than the EU average prior to 2007 and
remained so from 2007-2010, as did
growth in labour productivity.
Direction of change – Increase
Austria There has been no significant change
from the baseline position; the policy
balance has had a dual focus on
flexibility and security, this has
continued to form the mainstay of the
response to the economic crisis.
However, the concept of flexicurity
became increasingly evident in the
national debate following the
introduction of the Common Principles
at the EU level
There has been close involvement of
social partner organisations in
economic, labour market and social
policy governance structures.
Change from baseline in 2007 - None
Maintained balanced approach
In terms of expenditure indicators Austria
is above the EU average for most policy
areas: expenditure on ALMP; lifelong
learning; and, social protection was
above the EU average and increased
between 2007 and 2010. EPL for
temporary workers was below the EU
average, EPL for standard employees
was higher than the EU average.
Direction of change – Increase
In relation to process and output
indicators the Austrian position remained
stable when compared with the EU
average across the four components.
Direction of change – Stable
Austria outperformed the EU average prior
to 2007 in the majority of economic
indicators; this was also the case between
2007 and 2010.
GDP per head was higher than the EU
average prior to 2007 and it became
significantly higher than the EU average
between 2007 and 2010. Government debt
and the government deficit were higher
than the EU average prior to 2007 and
remained so between 2007 and 2010,
however for both of these indicators Austria
moved closer to the EU average during this
period.
Direction of change – Increase
Magnitude of change – Medium
No change from the policy
baseline position, stable macro
economic performance. Small
increases in input indicators not
reflected in more positive output
indicators.
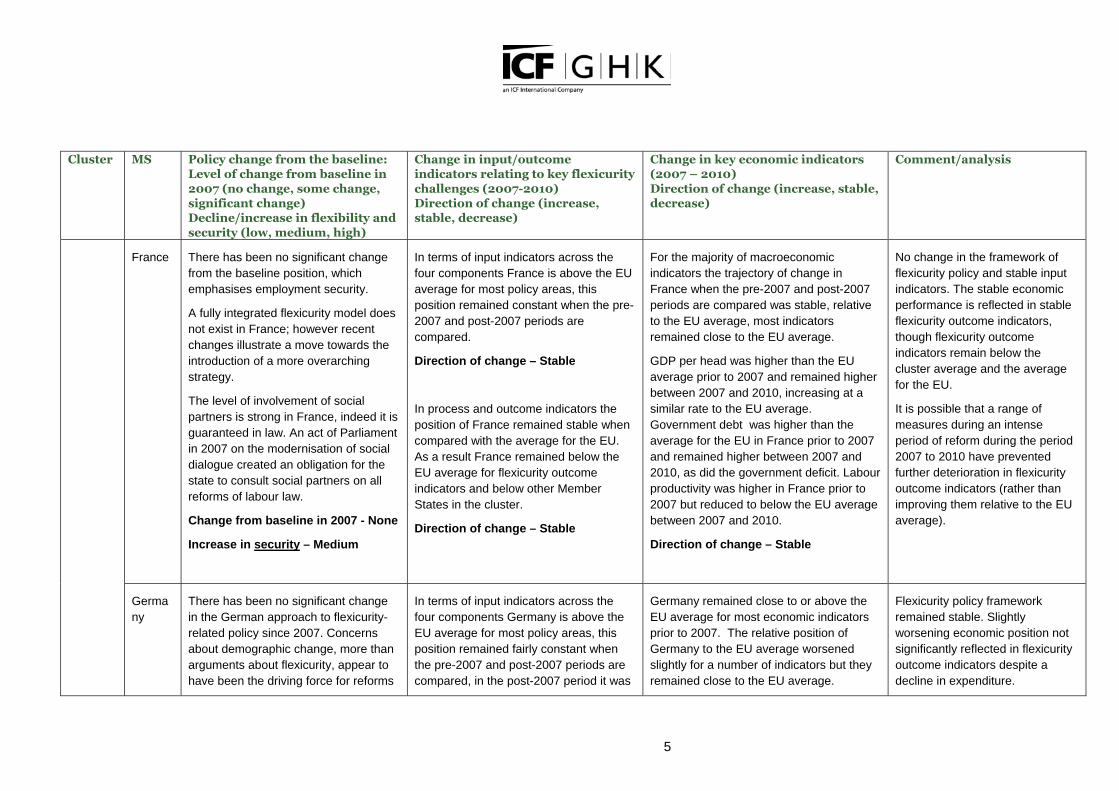
5
Cluster MS Policy change from the baseline: Level of change from baseline in 2007 (no change, some change, significant change) Decline/increase in flexibility and security (low, medium, high)
Change in input/outcome indicators relating to key flexicurity challenges (2007-2010) Direction of change (increase, stable, decrease)
Change in key economic indicators (2007 – 2010) Direction of change (increase, stable, decrease)
Comment/analysis
France There has been no significant change
from the baseline position, which
emphasises employment security.
A fully integrated flexicurity model does
not exist in France; however recent
changes illustrate a move towards the
introduction of a more overarching
strategy.
The level of involvement of social
partners is strong in France, indeed it is
guaranteed in law. An act of Parliament
in 2007 on the modernisation of social
dialogue created an obligation for the
state to consult social partners on all
reforms of labour law.
Change from baseline in 2007 - None
Increase in security – Medium
In terms of input indicators across the
four components France is above the EU
average for most policy areas, this
position remained constant when the pre-
2007 and post-2007 periods are
compared.
Direction of change – Stable
In process and outcome indicators the
position of France remained stable when
compared with the average for the EU.
As a result France remained below the
EU average for flexicurity outcome
indicators and below other Member
States in the cluster.
Direction of change – Stable
For the majority of macroeconomic
indicators the trajectory of change in
France when the pre-2007 and post-2007
periods are compared was stable, relative
to the EU average, most indicators
remained close to the EU average.
GDP per head was higher than the EU
average prior to 2007 and remained higher
between 2007 and 2010, increasing at a
similar rate to the EU average.
Government debt was higher than the
average for the EU in France prior to 2007
and remained higher between 2007 and
2010, as did the government deficit. Labour
productivity was higher in France prior to
2007 but reduced to below the EU average
between 2007 and 2010.
Direction of change – Stable
No change in the framework of
flexicurity policy and stable input
indicators. The stable economic
performance is reflected in stable
flexicurity outcome indicators,
though flexicurity outcome
indicators remain below the
cluster average and the average
for the EU.
It is possible that a range of
measures during an intense
period of reform during the period
2007 to 2010 have prevented
further deterioration in flexicurity
outcome indicators (rather than
improving them relative to the EU
average).
Germa
ny
There has been no significant change
in the German approach to flexicurity-
related policy since 2007. Concerns
about demographic change, more than
arguments about flexicurity, appear to
have been the driving force for reforms
In terms of input indicators across the
four components Germany is above the
EU average for most policy areas, this
position remained fairly constant when
the pre-2007 and post-2007 periods are
compared, in the post-2007 period it was
Germany remained close to or above the
EU average for most economic indicators
prior to 2007. The relative position of
Germany to the EU average worsened
slightly for a number of indicators but they
remained close to the EU average.
Flexicurity policy framework
remained stable. Slightly
worsening economic position not
significantly reflected in flexicurity
outcome indicators despite a
decline in expenditure.
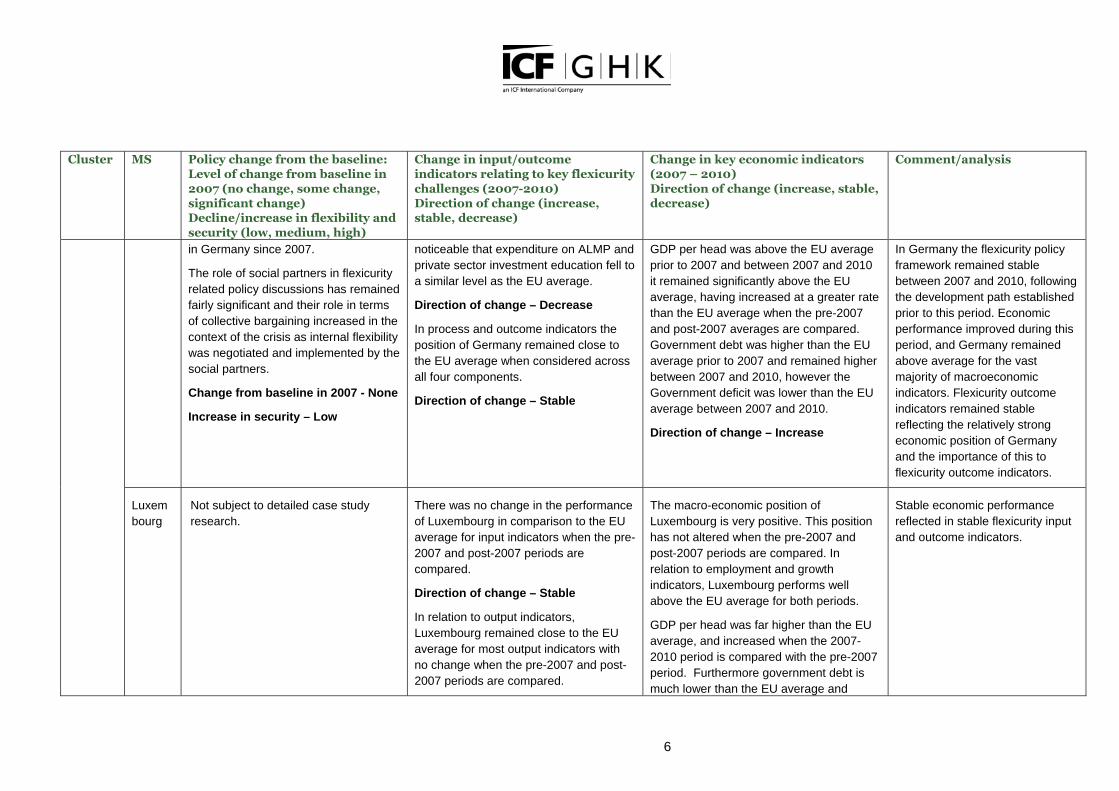
6
Cluster MS Policy change from the baseline: Level of change from baseline in 2007 (no change, some change, significant change) Decline/increase in flexibility and security (low, medium, high)
Change in input/outcome indicators relating to key flexicurity challenges (2007-2010) Direction of change (increase, stable, decrease)
Change in key economic indicators (2007 – 2010) Direction of change (increase, stable, decrease)
Comment/analysis
in Germany since 2007.
The role of social partners in flexicurity
related policy discussions has remained
fairly significant and their role in terms
of collective bargaining increased in the
context of the crisis as internal flexibility
was negotiated and implemented by the
social partners.
Change from baseline in 2007 - None
Increase in security – Low
noticeable that expenditure on ALMP and
private sector investment education fell to
a similar level as the EU average.
Direction of change – Decrease
In process and outcome indicators the
position of Germany remained close to
the EU average when considered across
all four components.
Direction of change – Stable
GDP per head was above the EU average
prior to 2007 and between 2007 and 2010
it remained significantly above the EU
average, having increased at a greater rate
than the EU average when the pre-2007
and post-2007 averages are compared.
Government debt was higher than the EU
average prior to 2007 and remained higher
between 2007 and 2010, however the
Government deficit was lower than the EU
average between 2007 and 2010.
Direction of change – Increase
In Germany the flexicurity policy
framework remained stable
between 2007 and 2010, following
the development path established
prior to this period. Economic
performance improved during this
period, and Germany remained
above average for the vast
majority of macroeconomic
indicators. Flexicurity outcome
indicators remained stable
reflecting the relatively strong
economic position of Germany
and the importance of this to
flexicurity outcome indicators.
Luxem
bourg
Not subject to detailed case study
research.
There was no change in the performance
of Luxembourg in comparison to the EU
average for input indicators when the pre-
2007 and post-2007 periods are
compared.
Direction of change – Stable
In relation to output indicators,
Luxembourg remained close to the EU
average for most output indicators with
no change when the pre-2007 and post-
2007 periods are compared.
The macro-economic position of
Luxembourg is very positive. This position
has not altered when the pre-2007 and
post-2007 periods are compared. In
relation to employment and growth
indicators, Luxembourg performs well
above the EU average for both periods.
GDP per head was far higher than the EU
average, and increased when the 2007-
2010 period is compared with the pre-2007
period. Furthermore government debt is
much lower than the EU average and
Stable economic performance
reflected in stable flexicurity input
and outcome indicators.
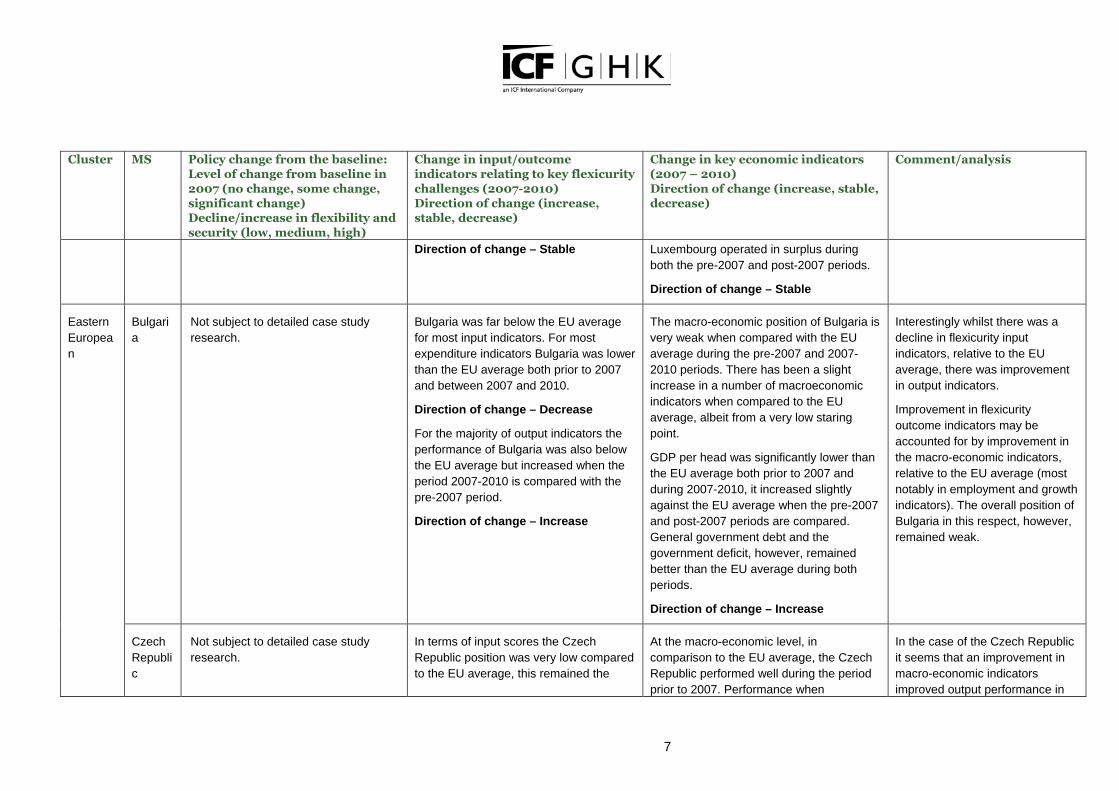
7
Cluster MS Policy change from the baseline: Level of change from baseline in 2007 (no change, some change, significant change) Decline/increase in flexibility and security (low, medium, high)
Change in input/outcome indicators relating to key flexicurity challenges (2007-2010) Direction of change (increase, stable, decrease)
Change in key economic indicators (2007 – 2010) Direction of change (increase, stable, decrease)
Comment/analysis
Direction of change – Stable
Luxembourg operated in surplus during
both the pre-2007 and post-2007 periods.
Direction of change – Stable
Bulgari
a
Not subject to detailed case study
research.
Bulgaria was far below the EU average
for most input indicators. For most
expenditure indicators Bulgaria was lower
than the EU average both prior to 2007
and between 2007 and 2010.
Direction of change – Decrease
For the majority of output indicators the
performance of Bulgaria was also below
the EU average but increased when the
period 2007-2010 is compared with the
pre-2007 period.
Direction of change – Increase
The macro-economic position of Bulgaria is
very weak when compared with the EU
average during the pre-2007 and 2007-
2010 periods. There has been a slight
increase in a number of macroeconomic
indicators when compared to the EU
average, albeit from a very low staring
point.
GDP per head was significantly lower than
the EU average both prior to 2007 and
during 2007-2010, it increased slightly
against the EU average when the pre-2007
and post-2007 periods are compared.
General government debt and the
government deficit, however, remained
better than the EU average during both
periods.
Direction of change – Increase
Interestingly whilst there was a
decline in flexicurity input
indicators, relative to the EU
average, there was improvement
in output indicators.
Improvement in flexicurity
outcome indicators may be
accounted for by improvement in
the macro-economic indicators,
relative to the EU average (most
notably in employment and growth
indicators). The overall position of
Bulgaria in this respect, however,
remained weak.
Eastern
Europea
n
Czech
Republi
c
Not subject to detailed case study
research.
In terms of input scores the Czech
Republic position was very low compared
to the EU average, this remained the
At the macro-economic level, in
comparison to the EU average, the Czech
Republic performed well during the period
prior to 2007. Performance when
In the case of the Czech Republic
it seems that an improvement in
macro-economic indicators
improved output performance in
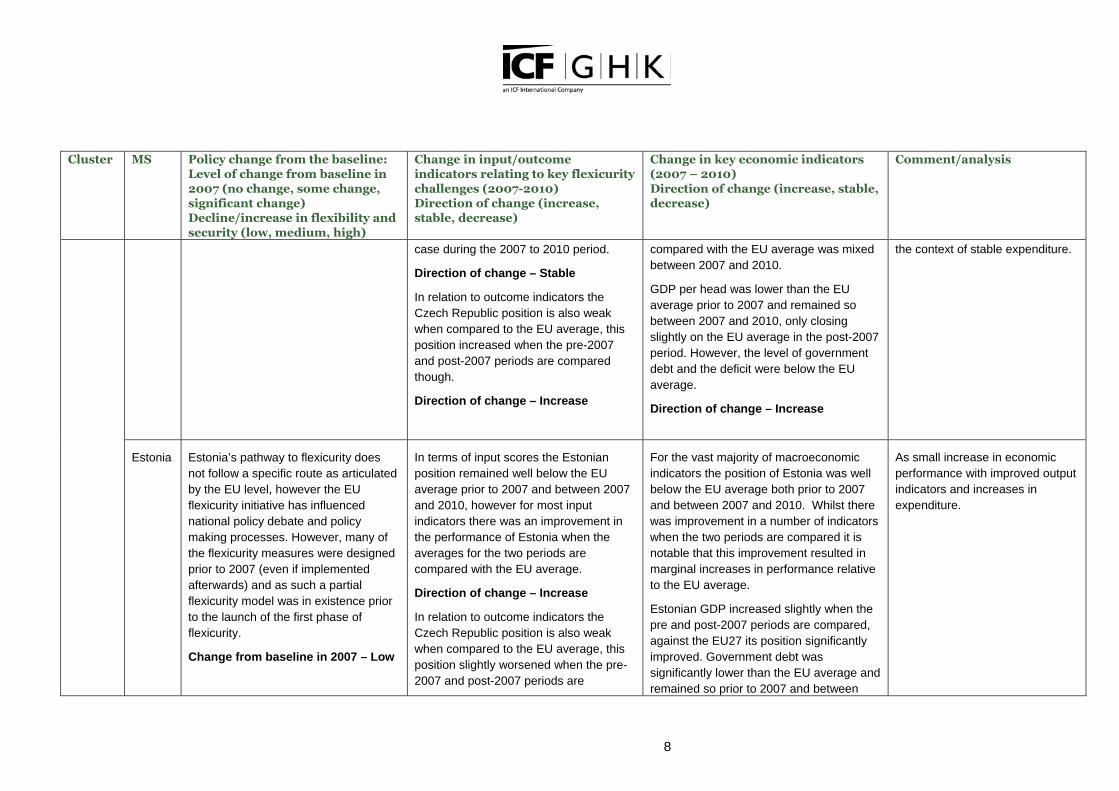
8
Cluster MS Policy change from the baseline: Level of change from baseline in 2007 (no change, some change, significant change) Decline/increase in flexibility and security (low, medium, high)
Change in input/outcome indicators relating to key flexicurity challenges (2007-2010) Direction of change (increase, stable, decrease)
Change in key economic indicators (2007 – 2010) Direction of change (increase, stable, decrease)
Comment/analysis
case during the 2007 to 2010 period.
Direction of change – Stable
In relation to outcome indicators the
Czech Republic position is also weak
when compared to the EU average, this
position increased when the pre-2007
and post-2007 periods are compared
though.
Direction of change – Increase
compared with the EU average was mixed
between 2007 and 2010.
GDP per head was lower than the EU
average prior to 2007 and remained so
between 2007 and 2010, only closing
slightly on the EU average in the post-2007
period. However, the level of government
debt and the deficit were below the EU
average.
Direction of change – Increase
the context of stable expenditure.
Estonia Estonia’s pathway to flexicurity does
not follow a specific route as articulated
by the EU level, however the EU
flexicurity initiative has influenced
national policy debate and policy
making processes. However, many of
the flexicurity measures were designed
prior to 2007 (even if implemented
afterwards) and as such a partial
flexicurity model was in existence prior
to the launch of the first phase of
flexicurity.
Change from baseline in 2007 – Low
In terms of input scores the Estonian
position remained well below the EU
average prior to 2007 and between 2007
and 2010, however for most input
indicators there was an improvement in
the performance of Estonia when the
averages for the two periods are
compared with the EU average.
Direction of change – Increase
In relation to outcome indicators the
Czech Republic position is also weak
when compared to the EU average, this
position slightly worsened when the pre-
2007 and post-2007 periods are
For the vast majority of macroeconomic
indicators the position of Estonia was well
below the EU average both prior to 2007
and between 2007 and 2010. Whilst there
was improvement in a number of indicators
when the two periods are compared it is
notable that this improvement resulted in
marginal increases in performance relative
to the EU average.
Estonian GDP increased slightly when the
pre and post-2007 periods are compared,
against the EU27 its position significantly
improved. Government debt was
significantly lower than the EU average and
remained so prior to 2007 and between
As small increase in economic
performance with improved output
indicators and increases in
expenditure.
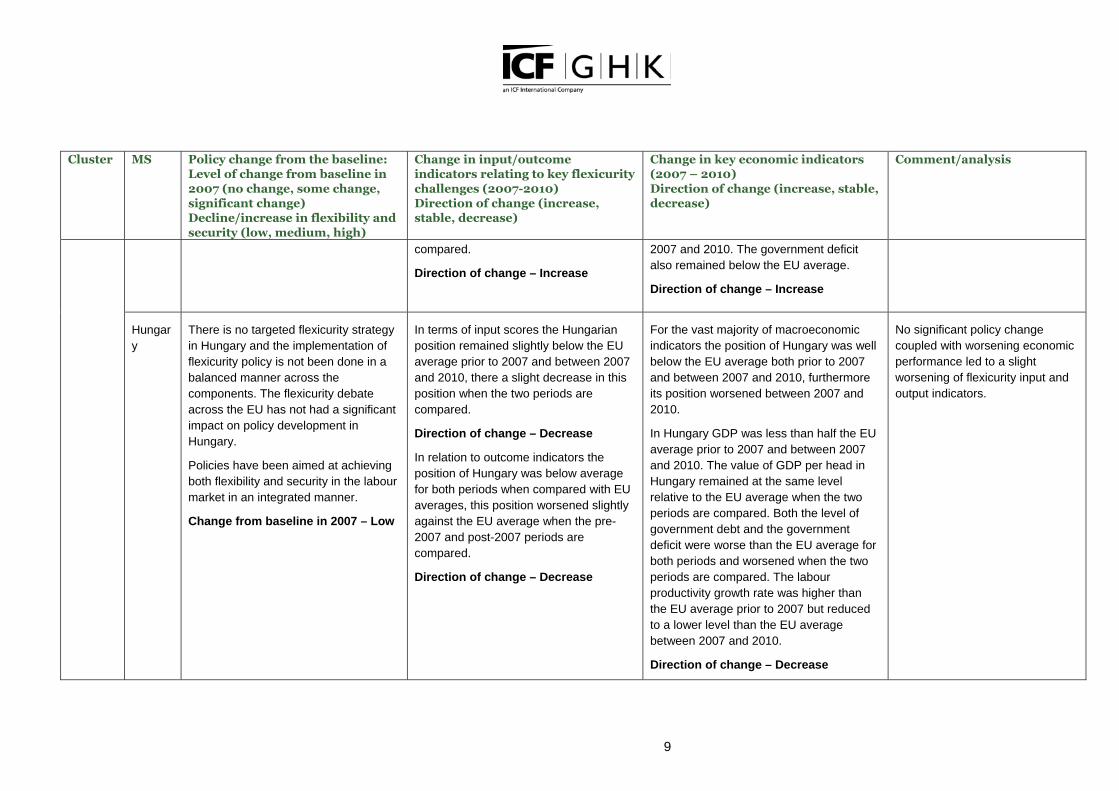
9
Cluster MS Policy change from the baseline: Level of change from baseline in 2007 (no change, some change, significant change) Decline/increase in flexibility and security (low, medium, high)
Change in input/outcome indicators relating to key flexicurity challenges (2007-2010) Direction of change (increase, stable, decrease)
Change in key economic indicators (2007 – 2010) Direction of change (increase, stable, decrease)
Comment/analysis
compared.
Direction of change – Increase
2007 and 2010. The government deficit
also remained below the EU average.
Direction of change – Increase
Hungar
y
There is no targeted flexicurity strategy
in Hungary and the implementation of
flexicurity policy is not been done in a
balanced manner across the
components. The flexicurity debate
across the EU has not had a significant
impact on policy development in
Hungary.
Policies have been aimed at achieving
both flexibility and security in the labour
market in an integrated manner.
Change from baseline in 2007 – Low
In terms of input scores the Hungarian
position remained slightly below the EU
average prior to 2007 and between 2007
and 2010, there a slight decrease in this
position when the two periods are
compared.
Direction of change – Decrease
In relation to outcome indicators the
position of Hungary was below average
for both periods when compared with EU
averages, this position worsened slightly
against the EU average when the pre-
2007 and post-2007 periods are
compared.
Direction of change – Decrease
For the vast majority of macroeconomic
indicators the position of Hungary was well
below the EU average both prior to 2007
and between 2007 and 2010, furthermore
its position worsened between 2007 and
2010.
In Hungary GDP was less than half the EU
average prior to 2007 and between 2007
and 2010. The value of GDP per head in
Hungary remained at the same level
relative to the EU average when the two
periods are compared. Both the level of
government debt and the government
deficit were worse than the EU average for
both periods and worsened when the two
periods are compared. The labour
productivity growth rate was higher than
the EU average prior to 2007 but reduced
to a lower level than the EU average
between 2007 and 2010.
Direction of change – Decrease
No significant policy change
coupled with worsening economic
performance led to a slight
worsening of flexicurity input and
output indicators.
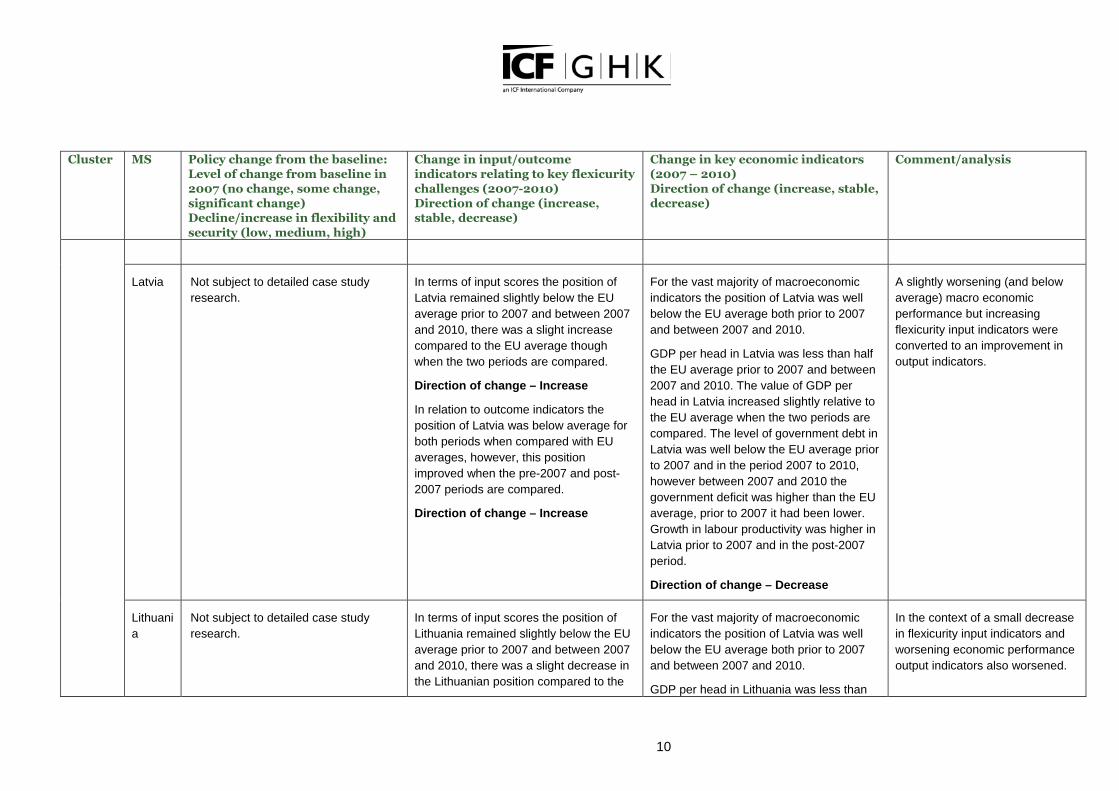
10
Cluster MS Policy change from the baseline: Level of change from baseline in 2007 (no change, some change, significant change) Decline/increase in flexibility and security (low, medium, high)
Change in input/outcome indicators relating to key flexicurity challenges (2007-2010) Direction of change (increase, stable, decrease)
Change in key economic indicators (2007 – 2010) Direction of change (increase, stable, decrease)
Comment/analysis
Latvia Not subject to detailed case study
research.
In terms of input scores the position of
Latvia remained slightly below the EU
average prior to 2007 and between 2007
and 2010, there was a slight increase
compared to the EU average though
when the two periods are compared.
Direction of change – Increase
In relation to outcome indicators the
position of Latvia was below average for
both periods when compared with EU
averages, however, this position
improved when the pre-2007 and post-
2007 periods are compared.
Direction of change – Increase
For the vast majority of macroeconomic
indicators the position of Latvia was well
below the EU average both prior to 2007
and between 2007 and 2010.
GDP per head in Latvia was less than half
the EU average prior to 2007 and between
2007 and 2010. The value of GDP per
head in Latvia increased slightly relative to
the EU average when the two periods are
compared. The level of government debt in
Latvia was well below the EU average prior
to 2007 and in the period 2007 to 2010,
however between 2007 and 2010 the
government deficit was higher than the EU
average, prior to 2007 it had been lower.
Growth in labour productivity was higher in
Latvia prior to 2007 and in the post-2007
period.
Direction of change – Decrease
A slightly worsening (and below
average) macro economic
performance but increasing
flexicurity input indicators were
converted to an improvement in
output indicators.
Lithuani
a
Not subject to detailed case study
research.
In terms of input scores the position of
Lithuania remained slightly below the EU
average prior to 2007 and between 2007
and 2010, there was a slight decrease in
the Lithuanian position compared to the
For the vast majority of macroeconomic
indicators the position of Latvia was well
below the EU average both prior to 2007
and between 2007 and 2010.
GDP per head in Lithuania was less than
In the context of a small decrease
in flexicurity input indicators and
worsening economic performance
output indicators also worsened.
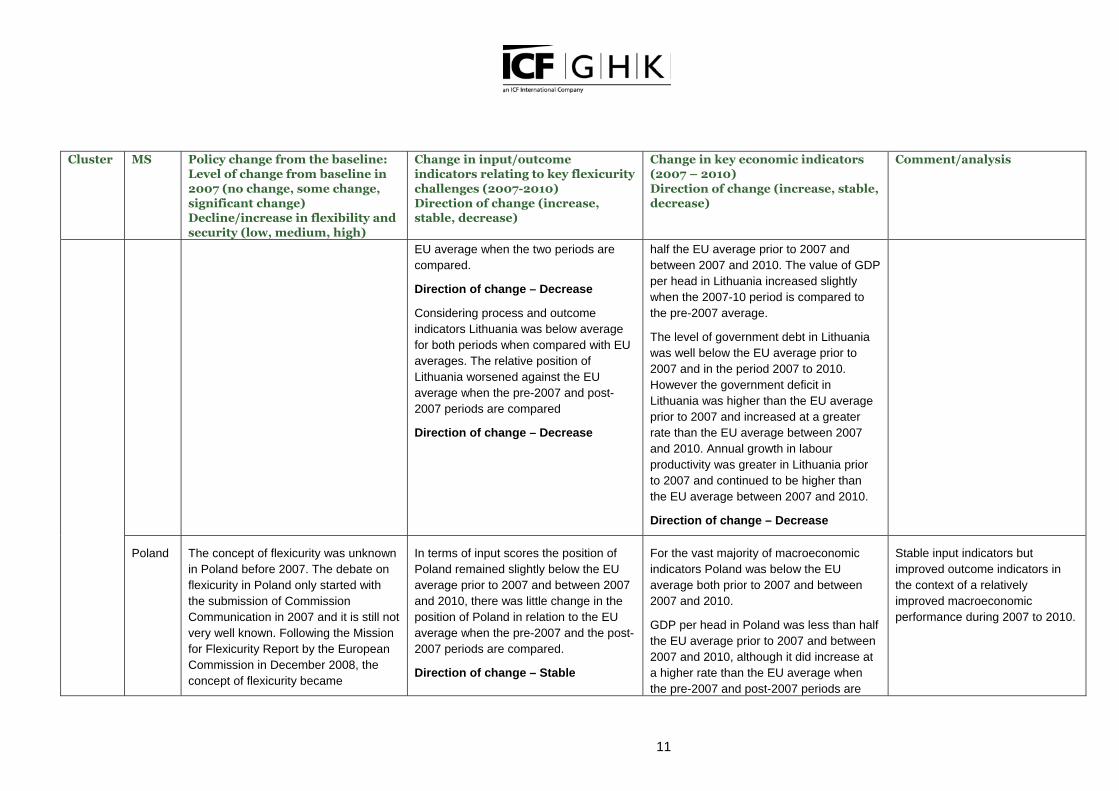
11
Cluster MS Policy change from the baseline: Level of change from baseline in 2007 (no change, some change, significant change) Decline/increase in flexibility and security (low, medium, high)
Change in input/outcome indicators relating to key flexicurity challenges (2007-2010) Direction of change (increase, stable, decrease)
Change in key economic indicators (2007 – 2010) Direction of change (increase, stable, decrease)
Comment/analysis
EU average when the two periods are
compared.
Direction of change – Decrease
Considering process and outcome
indicators Lithuania was below average
for both periods when compared with EU
averages. The relative position of
Lithuania worsened against the EU
average when the pre-2007 and post-
2007 periods are compared
Direction of change – Decrease
half the EU average prior to 2007 and
between 2007 and 2010. The value of GDP
per head in Lithuania increased slightly
when the 2007-10 period is compared to
the pre-2007 average.
The level of government debt in Lithuania
was well below the EU average prior to
2007 and in the period 2007 to 2010.
However the government deficit in
Lithuania was higher than the EU average
prior to 2007 and increased at a greater
rate than the EU average between 2007
and 2010. Annual growth in labour
productivity was greater in Lithuania prior
to 2007 and continued to be higher than
the EU average between 2007 and 2010.
Direction of change – Decrease
Poland The concept of flexicurity was unknown
in Poland before 2007. The debate on
flexicurity in Poland only started with
the submission of Commission
Communication in 2007 and it is still not
very well known. Following the Mission
for Flexicurity Report by the European
Commission in December 2008, the
concept of flexicurity became
In terms of input scores the position of
Poland remained slightly below the EU
average prior to 2007 and between 2007
and 2010, there was little change in the
position of Poland in relation to the EU
average when the pre-2007 and the post-
2007 periods are compared.
Direction of change – Stable
For the vast majority of macroeconomic
indicators Poland was below the EU
average both prior to 2007 and between
2007 and 2010.
GDP per head in Poland was less than half
the EU average prior to 2007 and between
2007 and 2010, although it did increase at
a higher rate than the EU average when
the pre-2007 and post-2007 periods are
Stable input indicators but
improved outcome indicators in
the context of a relatively
improved macroeconomic
performance during 2007 to 2010.
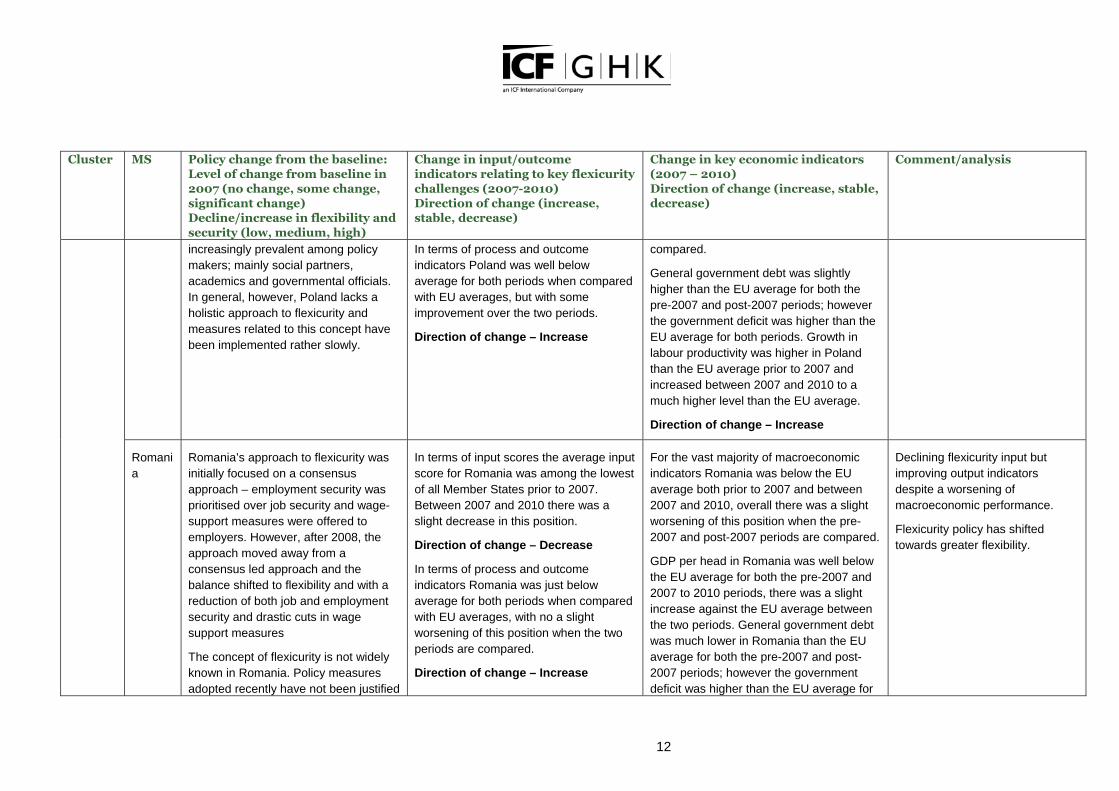
12
Cluster MS Policy change from the baseline: Level of change from baseline in 2007 (no change, some change, significant change) Decline/increase in flexibility and security (low, medium, high)
Change in input/outcome indicators relating to key flexicurity challenges (2007-2010) Direction of change (increase, stable, decrease)
Change in key economic indicators (2007 – 2010) Direction of change (increase, stable, decrease)
Comment/analysis
increasingly prevalent among policy
makers; mainly social partners,
academics and governmental officials.
In general, however, Poland lacks a
holistic approach to flexicurity and
measures related to this concept have
been implemented rather slowly.
In terms of process and outcome
indicators Poland was well below
average for both periods when compared
with EU averages, but with some
improvement over the two periods.
Direction of change – Increase
compared.
General government debt was slightly
higher than the EU average for both the
pre-2007 and post-2007 periods; however
the government deficit was higher than the
EU average for both periods. Growth in
labour productivity was higher in Poland
than the EU average prior to 2007 and
increased between 2007 and 2010 to a
much higher level than the EU average.
Direction of change – Increase
Romani
a
Romania’s approach to flexicurity was
initially focused on a consensus
approach – employment security was
prioritised over job security and wage-
support measures were offered to
employers. However, after 2008, the
approach moved away from a
consensus led approach and the
balance shifted to flexibility and with a
reduction of both job and employment
security and drastic cuts in wage
support measures
The concept of flexicurity is not widely
known in Romania. Policy measures
adopted recently have not been justified
In terms of input scores the average input
score for Romania was among the lowest
of all Member States prior to 2007.
Between 2007 and 2010 there was a
slight decrease in this position.
Direction of change – Decrease
In terms of process and outcome
indicators Romania was just below
average for both periods when compared
with EU averages, with no a slight
worsening of this position when the two
periods are compared.
Direction of change – Increase
For the vast majority of macroeconomic
indicators Romania was below the EU
average both prior to 2007 and between
2007 and 2010, overall there was a slight
worsening of this position when the pre-
2007 and post-2007 periods are compared.
GDP per head in Romania was well below
the EU average for both the pre-2007 and
2007 to 2010 periods, there was a slight
increase against the EU average between
the two periods. General government debt
was much lower in Romania than the EU
average for both the pre-2007 and post-
2007 periods; however the government
deficit was higher than the EU average for
Declining flexicurity input but
improving output indicators
despite a worsening of
macroeconomic performance.
Flexicurity policy has shifted
towards greater flexibility.
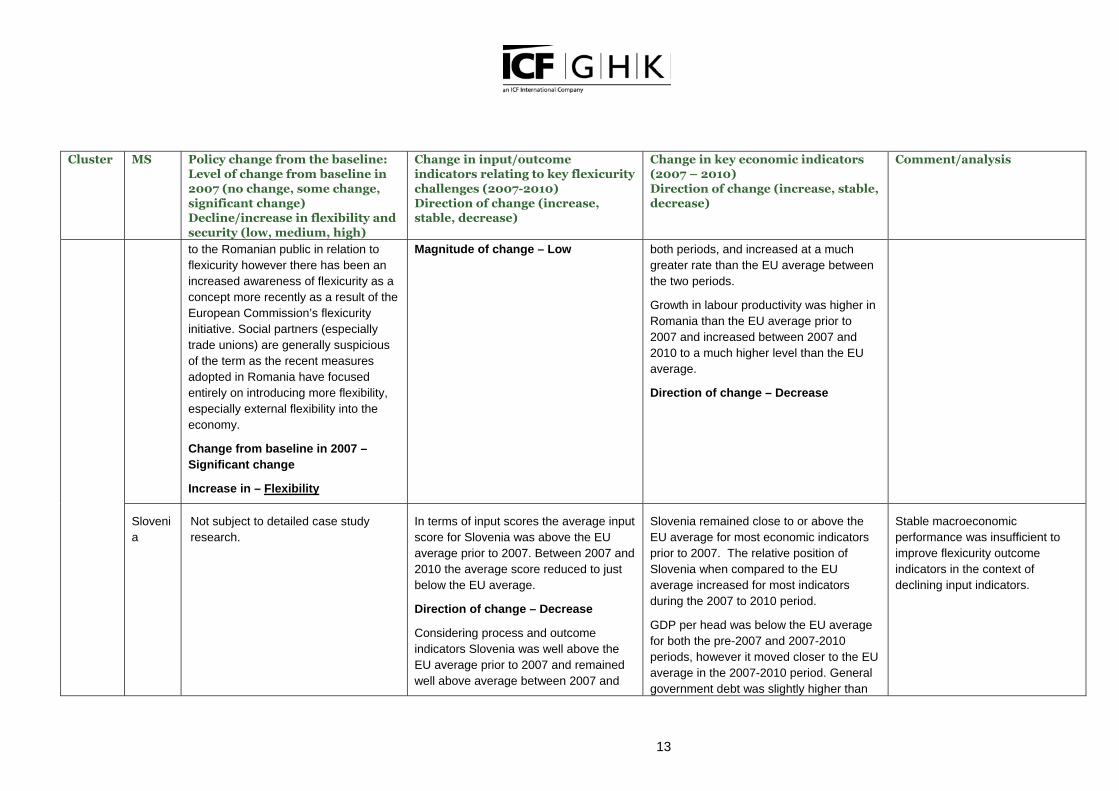
13
Cluster MS Policy change from the baseline: Level of change from baseline in 2007 (no change, some change, significant change) Decline/increase in flexibility and security (low, medium, high)
Change in input/outcome indicators relating to key flexicurity challenges (2007-2010) Direction of change (increase, stable, decrease)
Change in key economic indicators (2007 – 2010) Direction of change (increase, stable, decrease)
Comment/analysis
to the Romanian public in relation to
flexicurity however there has been an
increased awareness of flexicurity as a
concept more recently as a result of the
European Commission’s flexicurity
initiative. Social partners (especially
trade unions) are generally suspicious
of the term as the recent measures
adopted in Romania have focused
entirely on introducing more flexibility,
especially external flexibility into the
economy.
Change from baseline in 2007 –
Significant change
Increase in – Flexibility
Magnitude of change – Low
both periods, and increased at a much
greater rate than the EU average between
the two periods.
Growth in labour productivity was higher in
Romania than the EU average prior to
2007 and increased between 2007 and
2010 to a much higher level than the EU
average.
Direction of change – Decrease
Sloveni
a
Not subject to detailed case study
research.
In terms of input scores the average input
score for Slovenia was above the EU
average prior to 2007. Between 2007 and
2010 the average score reduced to just
below the EU average.
Direction of change – Decrease
Considering process and outcome
indicators Slovenia was well above the
EU average prior to 2007 and remained
well above average between 2007 and
Slovenia remained close to or above the
EU average for most economic indicators
prior to 2007. The relative position of
Slovenia when compared to the EU
average increased for most indicators
during the 2007 to 2010 period.
GDP per head was below the EU average
for both the pre-2007 and 2007-2010
periods, however it moved closer to the EU
average in the 2007-2010 period. General
government debt was slightly higher than
Stable macroeconomic
performance was insufficient to
improve flexicurity outcome
indicators in the context of
declining input indicators.

14
Cluster MS Policy change from the baseline: Level of change from baseline in 2007 (no change, some change, significant change) Decline/increase in flexibility and security (low, medium, high)
Change in input/outcome indicators relating to key flexicurity challenges (2007-2010) Direction of change (increase, stable, decrease)
Change in key economic indicators (2007 – 2010) Direction of change (increase, stable, decrease)
Comment/analysis
2010, despite a slight reduction.
Direction of change – Stable
the EU average for both the pre-2007 and
post-2007 periods. The general
government deficit was higher than the EU
average prior to 2007 but between 2007
and 2010 it increased at a lower rate than
the EU average and as a result was lower
than the EU average during 2007 to 2010.
Growth in labour productivity was higher in
Slovenia than the EU average prior to 2007
and remained at higher level than the EU
average between 2007 and 2010.
Direction of change – Stable
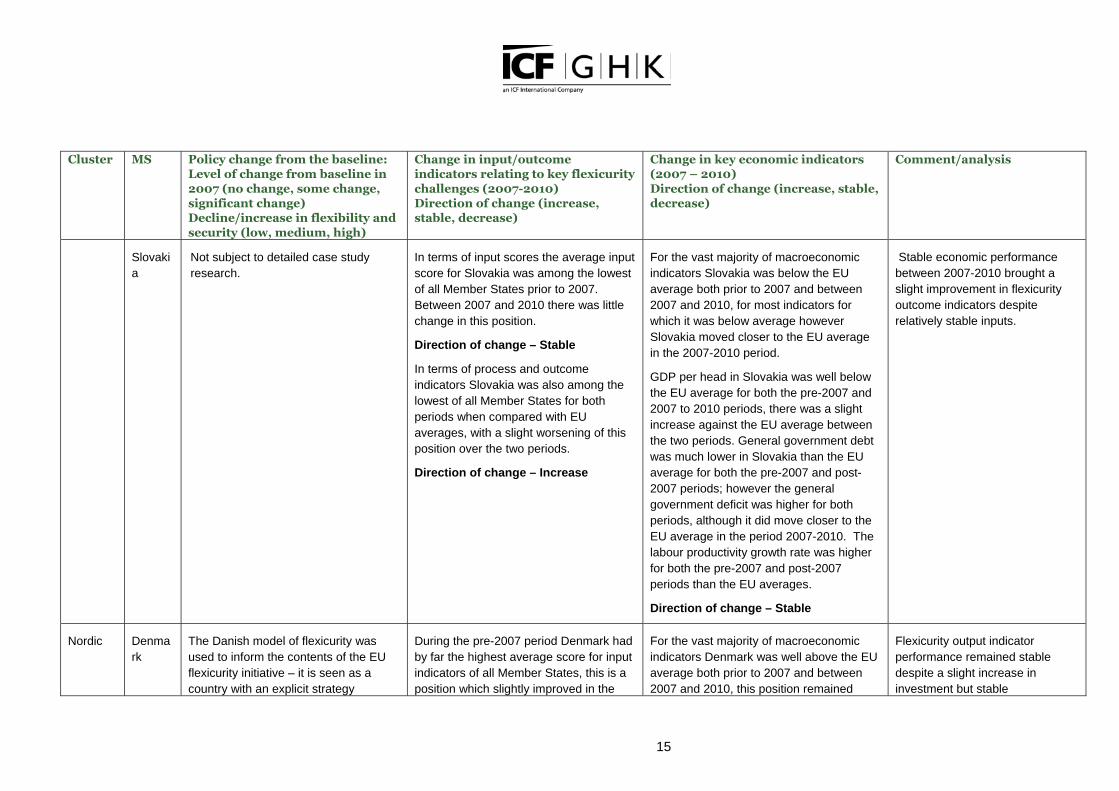
15
Cluster MS Policy change from the baseline: Level of change from baseline in 2007 (no change, some change, significant change) Decline/increase in flexibility and security (low, medium, high)
Change in input/outcome indicators relating to key flexicurity challenges (2007-2010) Direction of change (increase, stable, decrease)
Change in key economic indicators (2007 – 2010) Direction of change (increase, stable, decrease)
Comment/analysis
Slovaki
a
Not subject to detailed case study
research.
In terms of input scores the average input
score for Slovakia was among the lowest
of all Member States prior to 2007.
Between 2007 and 2010 there was little
change in this position.
Direction of change – Stable
In terms of process and outcome
indicators Slovakia was also among the
lowest of all Member States for both
periods when compared with EU
averages, with a slight worsening of this
position over the two periods.
Direction of change – Increase
For the vast majority of macroeconomic
indicators Slovakia was below the EU
average both prior to 2007 and between
2007 and 2010, for most indicators for
which it was below average however
Slovakia moved closer to the EU average
in the 2007-2010 period.
GDP per head in Slovakia was well below
the EU average for both the pre-2007 and
2007 to 2010 periods, there was a slight
increase against the EU average between
the two periods. General government debt
was much lower in Slovakia than the EU
average for both the pre-2007 and post-
2007 periods; however the general
government deficit was higher for both
periods, although it did move closer to the
EU average in the period 2007-2010. The
labour productivity growth rate was higher
for both the pre-2007 and post-2007
periods than the EU averages.
Direction of change – Stable
Stable economic performance
between 2007-2010 brought a
slight improvement in flexicurity
outcome indicators despite
relatively stable inputs.
Nordic Denma
rk
The Danish model of flexicurity was
used to inform the contents of the EU
flexicurity initiative – it is seen as a
country with an explicit strategy
During the pre-2007 period Denmark had
by far the highest average score for input
indicators of all Member States, this is a
position which slightly improved in the
For the vast majority of macroeconomic
indicators Denmark was well above the EU
average both prior to 2007 and between
2007 and 2010, this position remained
Flexicurity output indicator
performance remained stable
despite a slight increase in
investment but stable
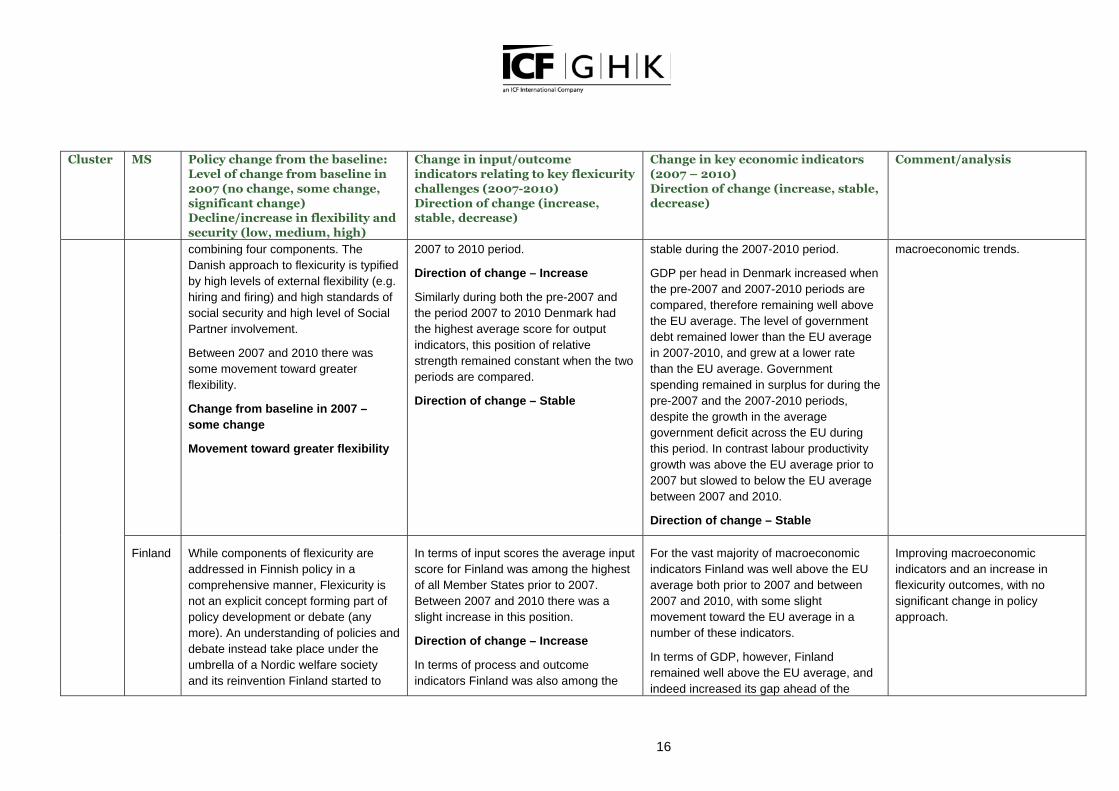
16
Cluster MS Policy change from the baseline: Level of change from baseline in 2007 (no change, some change, significant change) Decline/increase in flexibility and security (low, medium, high)
Change in input/outcome indicators relating to key flexicurity challenges (2007-2010) Direction of change (increase, stable, decrease)
Change in key economic indicators (2007 – 2010) Direction of change (increase, stable, decrease)
Comment/analysis
combining four components. The
Danish approach to flexicurity is typified
by high levels of external flexibility (e.g.
hiring and firing) and high standards of
social security and high level of Social
Partner involvement.
Between 2007 and 2010 there was
some movement toward greater
flexibility.
Change from baseline in 2007 –
some change
Movement toward greater flexibility
2007 to 2010 period.
Direction of change – Increase
Similarly during both the pre-2007 and
the period 2007 to 2010 Denmark had
the highest average score for output
indicators, this position of relative
strength remained constant when the two
periods are compared.
Direction of change – Stable
stable during the 2007-2010 period.
GDP per head in Denmark increased when
the pre-2007 and 2007-2010 periods are
compared, therefore remaining well above
the EU average. The level of government
debt remained lower than the EU average
in 2007-2010, and grew at a lower rate
than the EU average. Government
spending remained in surplus for during the
pre-2007 and the 2007-2010 periods,
despite the growth in the average
government deficit across the EU during
this period. In contrast labour productivity
growth was above the EU average prior to
2007 but slowed to below the EU average
between 2007 and 2010.
Direction of change – Stable
macroeconomic trends.
Finland While components of flexicurity are
addressed in Finnish policy in a
comprehensive manner, Flexicurity is
not an explicit concept forming part of
policy development or debate (any
more). An understanding of policies and
debate instead take place under the
umbrella of a Nordic welfare society
and its reinvention Finland started to
In terms of input scores the average input
score for Finland was among the highest
of all Member States prior to 2007.
Between 2007 and 2010 there was a
slight increase in this position.
Direction of change – Increase
In terms of process and outcome
indicators Finland was also among the
For the vast majority of macroeconomic
indicators Finland was well above the EU
average both prior to 2007 and between
2007 and 2010, with some slight
movement toward the EU average in a
number of these indicators.
In terms of GDP, however, Finland
remained well above the EU average, and
indeed increased its gap ahead of the
Improving macroeconomic
indicators and an increase in
flexicurity outcomes, with no
significant change in policy
approach.
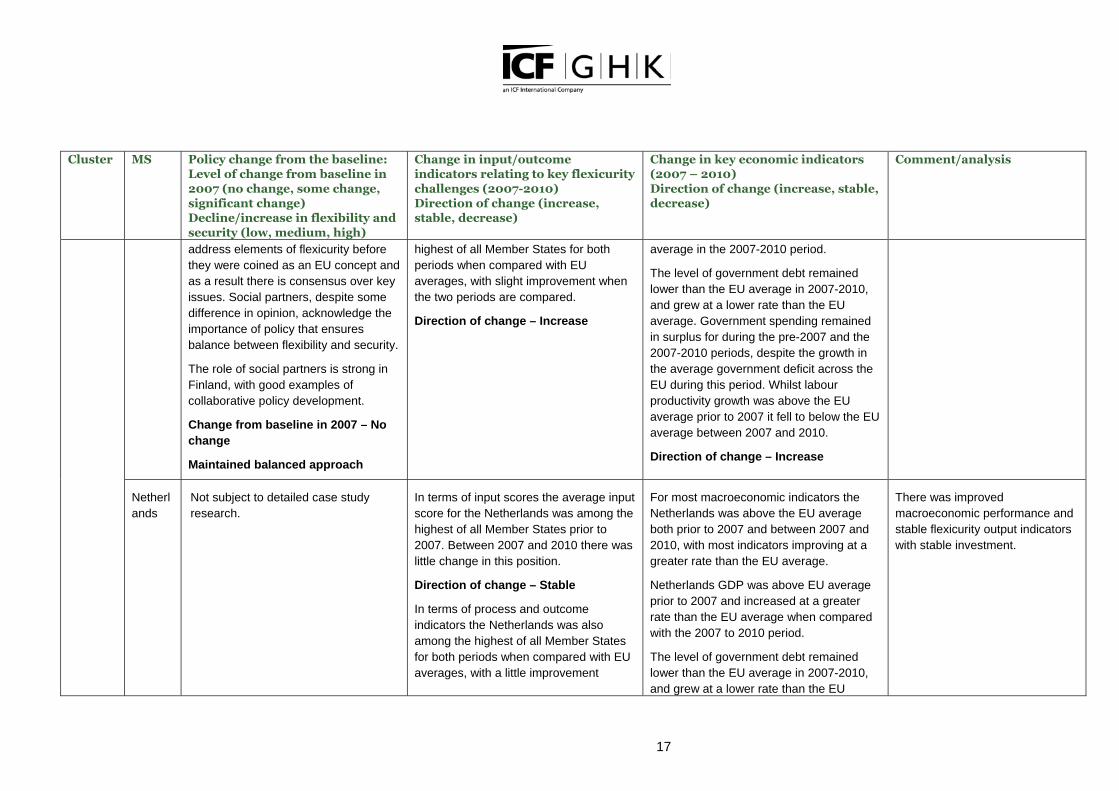
17
Cluster MS Policy change from the baseline: Level of change from baseline in 2007 (no change, some change, significant change) Decline/increase in flexibility and security (low, medium, high)
Change in input/outcome indicators relating to key flexicurity challenges (2007-2010) Direction of change (increase, stable, decrease)
Change in key economic indicators (2007 – 2010) Direction of change (increase, stable, decrease)
Comment/analysis
address elements of flexicurity before
they were coined as an EU concept and
as a result there is consensus over key
issues. Social partners, despite some
difference in opinion, acknowledge the
importance of policy that ensures
balance between flexibility and security.
The role of social partners is strong in
Finland, with good examples of
collaborative policy development.
Change from baseline in 2007 – No
change
Maintained balanced approach
highest of all Member States for both
periods when compared with EU
averages, with slight improvement when
the two periods are compared.
Direction of change – Increase
average in the 2007-2010 period.
The level of government debt remained
lower than the EU average in 2007-2010,
and grew at a lower rate than the EU
average. Government spending remained
in surplus for during the pre-2007 and the
2007-2010 periods, despite the growth in
the average government deficit across the
EU during this period. Whilst labour
productivity growth was above the EU
average prior to 2007 it fell to below the EU
average between 2007 and 2010.
Direction of change – Increase
Netherl
ands
Not subject to detailed case study
research.
In terms of input scores the average input
score for the Netherlands was among the
highest of all Member States prior to
2007. Between 2007 and 2010 there was
little change in this position.
Direction of change – Stable
In terms of process and outcome
indicators the Netherlands was also
among the highest of all Member States
for both periods when compared with EU
averages, with a little improvement
For most macroeconomic indicators the
Netherlands was above the EU average
both prior to 2007 and between 2007 and
2010, with most indicators improving at a
greater rate than the EU average.
Netherlands GDP was above EU average
prior to 2007 and increased at a greater
rate than the EU average when compared
with the 2007 to 2010 period.
The level of government debt remained
lower than the EU average in 2007-2010,
and grew at a lower rate than the EU
There was improved
macroeconomic performance and
stable flexicurity output indicators
with stable investment.
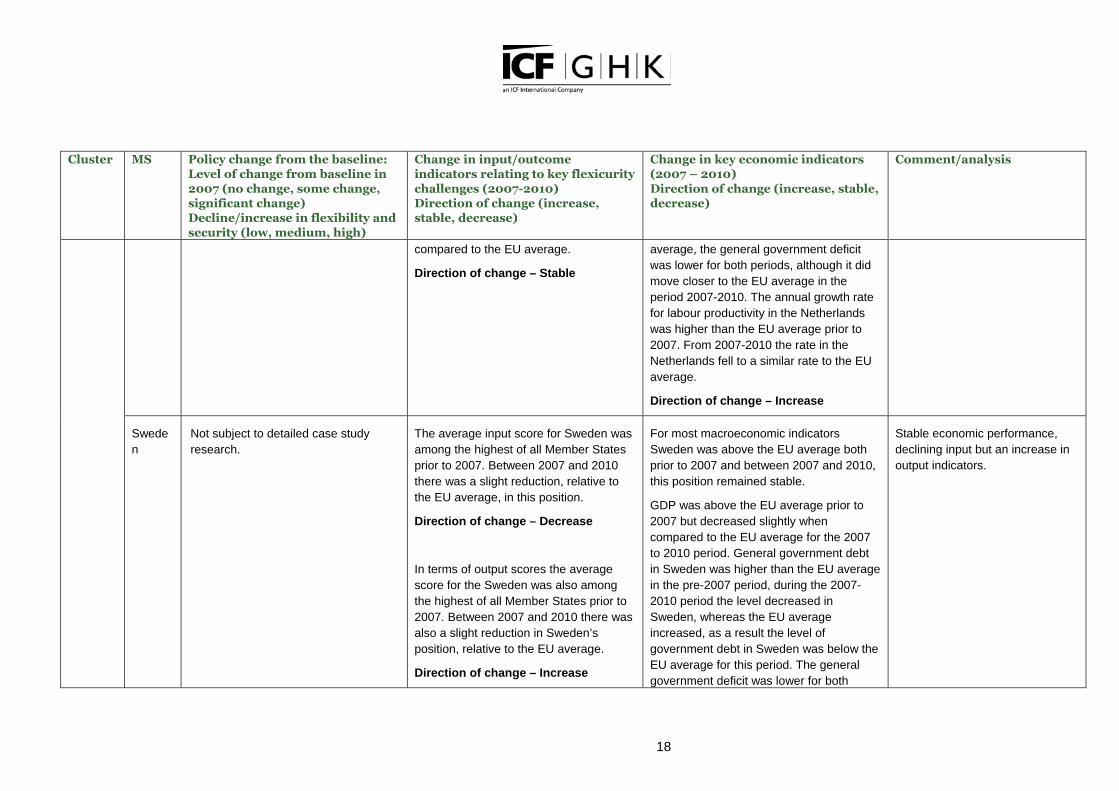
18
Cluster MS Policy change from the baseline: Level of change from baseline in 2007 (no change, some change, significant change) Decline/increase in flexibility and security (low, medium, high)
Change in input/outcome indicators relating to key flexicurity challenges (2007-2010) Direction of change (increase, stable, decrease)
Change in key economic indicators (2007 – 2010) Direction of change (increase, stable, decrease)
Comment/analysis
compared to the EU average.
Direction of change – Stable
average, the general government deficit
was lower for both periods, although it did
move closer to the EU average in the
period 2007-2010. The annual growth rate
for labour productivity in the Netherlands
was higher than the EU average prior to
2007. From 2007-2010 the rate in the
Netherlands fell to a similar rate to the EU
average.
Direction of change – Increase
Swede
n
Not subject to detailed case study
research.
The average input score for Sweden was
among the highest of all Member States
prior to 2007. Between 2007 and 2010
there was a slight reduction, relative to
the EU average, in this position.
Direction of change – Decrease
In terms of output scores the average
score for the Sweden was also among
the highest of all Member States prior to
2007. Between 2007 and 2010 there was
also a slight reduction in Sweden’s
position, relative to the EU average.
Direction of change – Increase
For most macroeconomic indicators
Sweden was above the EU average both
prior to 2007 and between 2007 and 2010,
this position remained stable.
GDP was above the EU average prior to
2007 but decreased slightly when
compared to the EU average for the 2007
to 2010 period. General government debt
in Sweden was higher than the EU average
in the pre-2007 period, during the 2007-
2010 period the level decreased in
Sweden, whereas the EU average
increased, as a result the level of
government debt in Sweden was below the
EU average for this period. The general
government deficit was lower for both
Stable economic performance,
declining input but an increase in
output indicators.
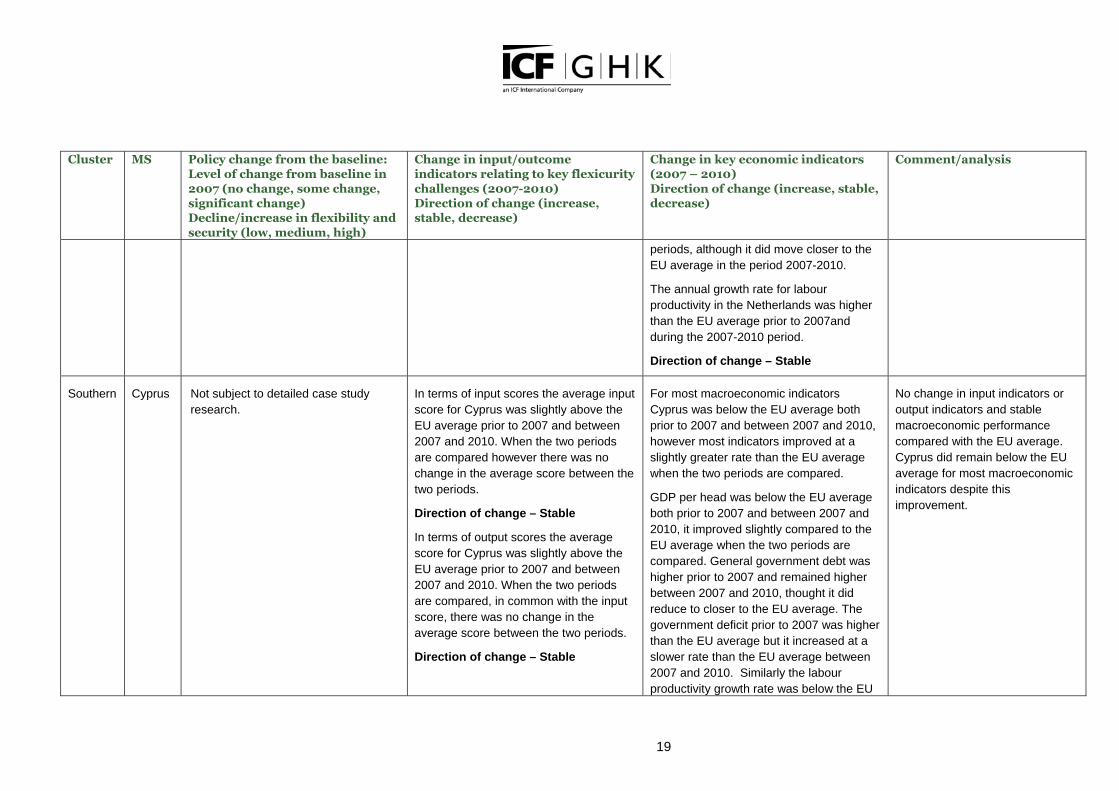
19
Cluster MS Policy change from the baseline: Level of change from baseline in 2007 (no change, some change, significant change) Decline/increase in flexibility and security (low, medium, high)
Change in input/outcome indicators relating to key flexicurity challenges (2007-2010) Direction of change (increase, stable, decrease)
Change in key economic indicators (2007 – 2010) Direction of change (increase, stable, decrease)
Comment/analysis
periods, although it did move closer to the
EU average in the period 2007-2010.
The annual growth rate for labour
productivity in the Netherlands was higher
than the EU average prior to 2007and
during the 2007-2010 period.
Direction of change – Stable
Southern Cyprus Not subject to detailed case study
research.
In terms of input scores the average input
score for Cyprus was slightly above the
EU average prior to 2007 and between
2007 and 2010. When the two periods
are compared however there was no
change in the average score between the
two periods.
Direction of change – Stable
In terms of output scores the average
score for Cyprus was slightly above the
EU average prior to 2007 and between
2007 and 2010. When the two periods
are compared, in common with the input
score, there was no change in the
average score between the two periods.
Direction of change – Stable
For most macroeconomic indicators
Cyprus was below the EU average both
prior to 2007 and between 2007 and 2010,
however most indicators improved at a
slightly greater rate than the EU average
when the two periods are compared.
GDP per head was below the EU average
both prior to 2007 and between 2007 and
2010, it improved slightly compared to the
EU average when the two periods are
compared. General government debt was
higher prior to 2007 and remained higher
between 2007 and 2010, thought it did
reduce to closer to the EU average. The
government deficit prior to 2007 was higher
than the EU average but it increased at a
slower rate than the EU average between
2007 and 2010. Similarly the labour
productivity growth rate was below the EU
No change in input indicators or
output indicators and stable
macroeconomic performance
compared with the EU average.
Cyprus did remain below the EU
average for most macroeconomic
indicators despite this
improvement.
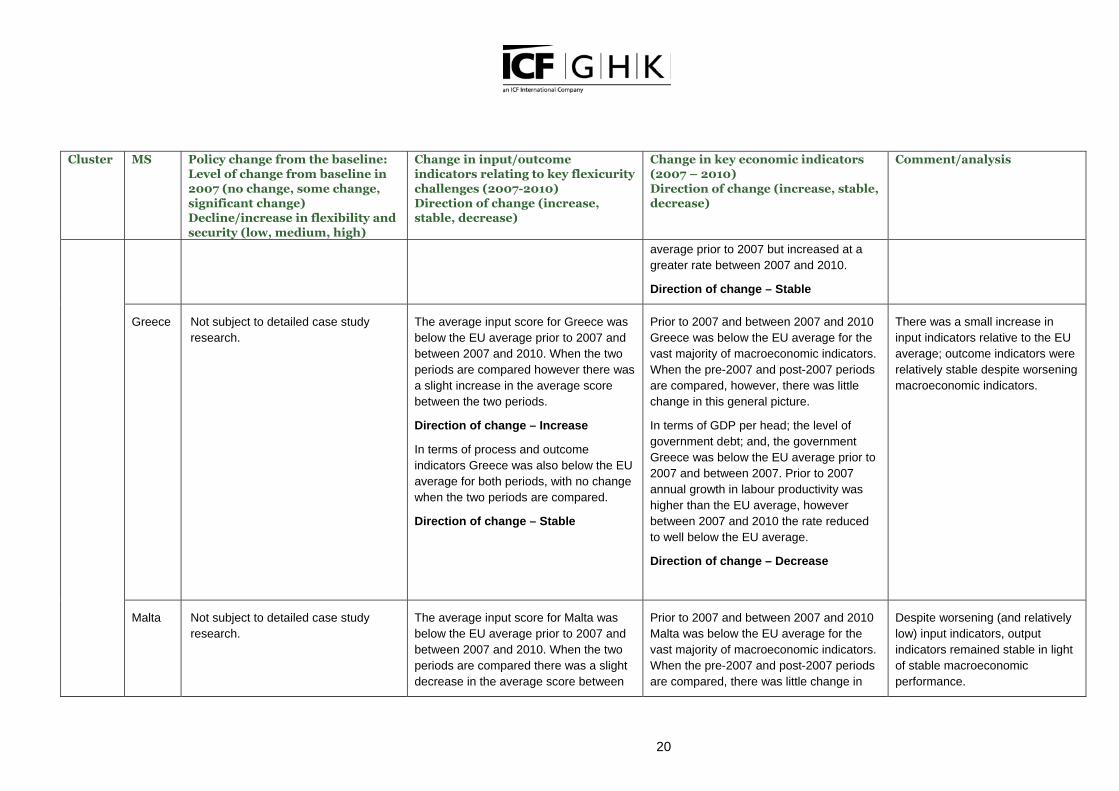
20
Cluster MS Policy change from the baseline: Level of change from baseline in 2007 (no change, some change, significant change) Decline/increase in flexibility and security (low, medium, high)
Change in input/outcome indicators relating to key flexicurity challenges (2007-2010) Direction of change (increase, stable, decrease)
Change in key economic indicators (2007 – 2010) Direction of change (increase, stable, decrease)
Comment/analysis
average prior to 2007 but increased at a
greater rate between 2007 and 2010.
Direction of change – Stable
Greece Not subject to detailed case study
research.
The average input score for Greece was
below the EU average prior to 2007 and
between 2007 and 2010. When the two
periods are compared however there was
a slight increase in the average score
between the two periods.
Direction of change – Increase
In terms of process and outcome
indicators Greece was also below the EU
average for both periods, with no change
when the two periods are compared.
Direction of change – Stable
Prior to 2007 and between 2007 and 2010
Greece was below the EU average for the
vast majority of macroeconomic indicators.
When the pre-2007 and post-2007 periods
are compared, however, there was little
change in this general picture.
In terms of GDP per head; the level of
government debt; and, the government
Greece was below the EU average prior to
2007 and between 2007. Prior to 2007
annual growth in labour productivity was
higher than the EU average, however
between 2007 and 2010 the rate reduced
to well below the EU average.
Direction of change – Decrease
There was a small increase in
input indicators relative to the EU
average; outcome indicators were
relatively stable despite worsening
macroeconomic indicators.
Malta Not subject to detailed case study
research.
The average input score for Malta was
below the EU average prior to 2007 and
between 2007 and 2010. When the two
periods are compared there was a slight
decrease in the average score between
Prior to 2007 and between 2007 and 2010
Malta was below the EU average for the
vast majority of macroeconomic indicators.
When the pre-2007 and post-2007 periods
are compared, there was little change in
Despite worsening (and relatively
low) input indicators, output
indicators remained stable in light
of stable macroeconomic
performance.
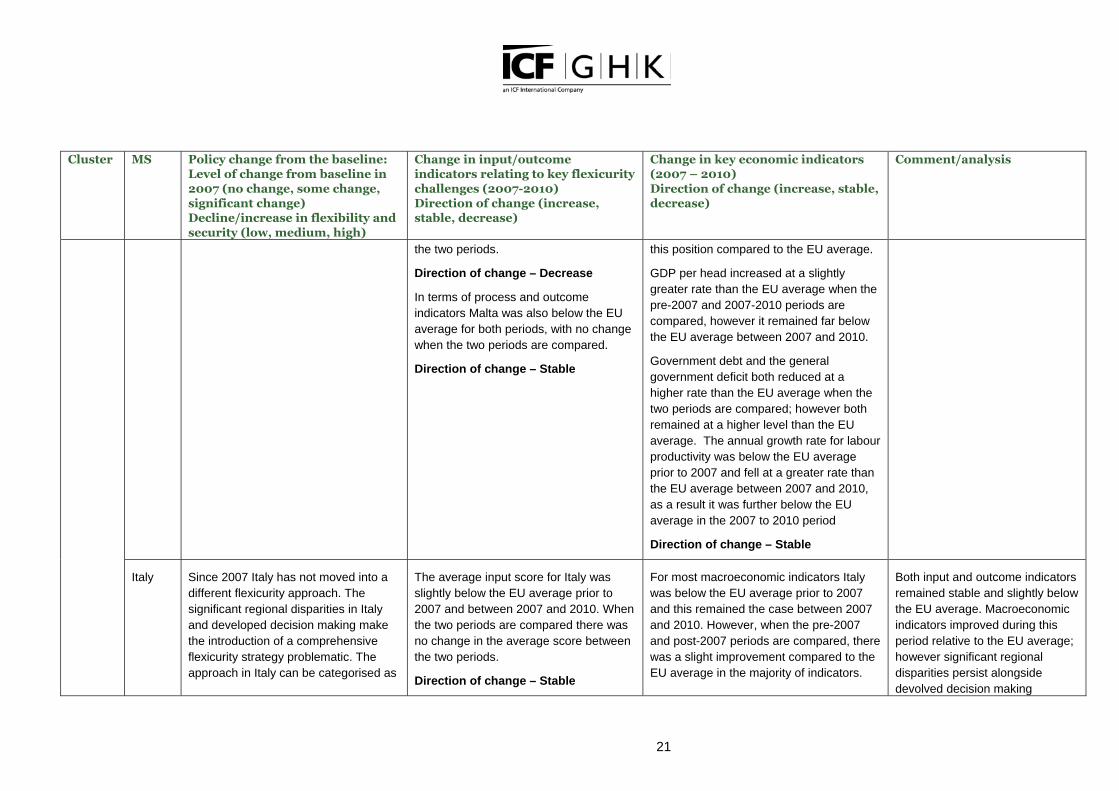
21
Cluster MS Policy change from the baseline: Level of change from baseline in 2007 (no change, some change, significant change) Decline/increase in flexibility and security (low, medium, high)
Change in input/outcome indicators relating to key flexicurity challenges (2007-2010) Direction of change (increase, stable, decrease)
Change in key economic indicators (2007 – 2010) Direction of change (increase, stable, decrease)
Comment/analysis
the two periods.
Direction of change – Decrease
In terms of process and outcome
indicators Malta was also below the EU
average for both periods, with no change
when the two periods are compared.
Direction of change – Stable
this position compared to the EU average.
GDP per head increased at a slightly
greater rate than the EU average when the
pre-2007 and 2007-2010 periods are
compared, however it remained far below
the EU average between 2007 and 2010.
Government debt and the general
government deficit both reduced at a
higher rate than the EU average when the
two periods are compared; however both
remained at a higher level than the EU
average. The annual growth rate for labour
productivity was below the EU average
prior to 2007 and fell at a greater rate than
the EU average between 2007 and 2010,
as a result it was further below the EU
average in the 2007 to 2010 period
Direction of change – Stable
Italy Since 2007 Italy has not moved into a
different flexicurity approach. The
significant regional disparities in Italy
and developed decision making make
the introduction of a comprehensive
flexicurity strategy problematic. The
approach in Italy can be categorised as
The average input score for Italy was
slightly below the EU average prior to
2007 and between 2007 and 2010. When
the two periods are compared there was
no change in the average score between
the two periods.
Direction of change – Stable
For most macroeconomic indicators Italy
was below the EU average prior to 2007
and this remained the case between 2007
and 2010. However, when the pre-2007
and post-2007 periods are compared, there
was a slight improvement compared to the
EU average in the majority of indicators.
Both input and outcome indicators
remained stable and slightly below
the EU average. Macroeconomic
indicators improved during this
period relative to the EU average;
however significant regional
disparities persist alongside
devolved decision making
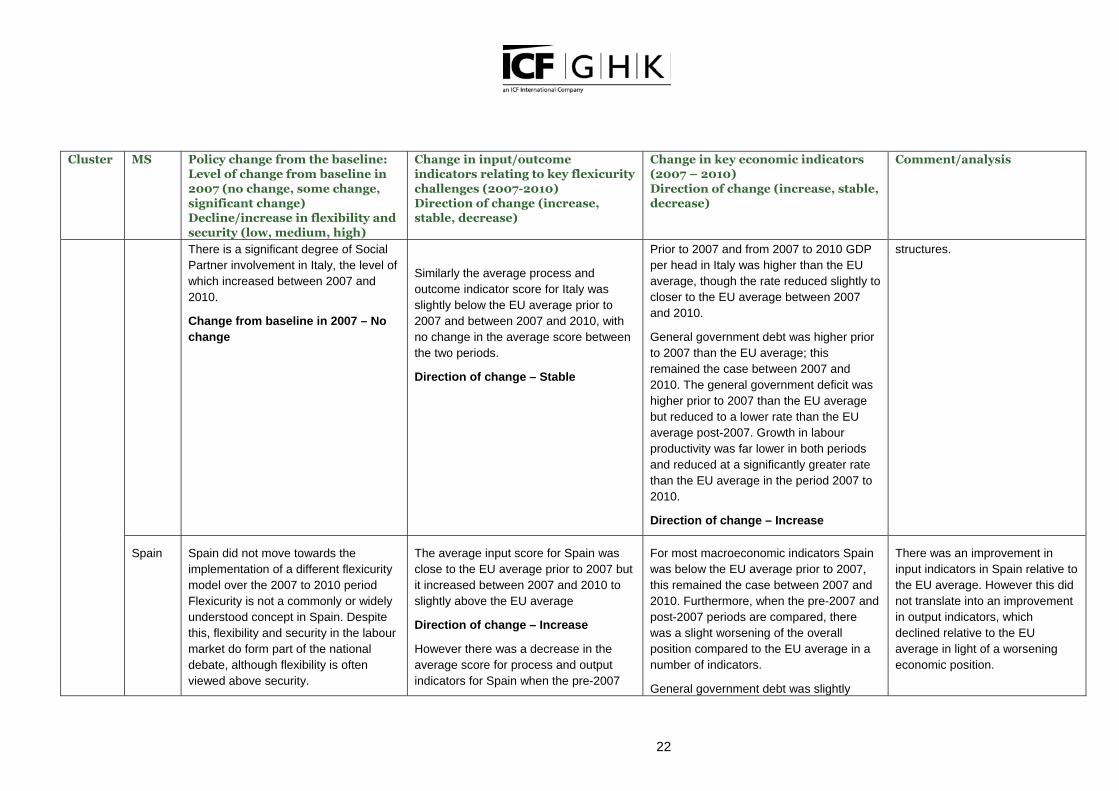
22
Cluster MS Policy change from the baseline: Level of change from baseline in 2007 (no change, some change, significant change) Decline/increase in flexibility and security (low, medium, high)
Change in input/outcome indicators relating to key flexicurity challenges (2007-2010) Direction of change (increase, stable, decrease)
Change in key economic indicators (2007 – 2010) Direction of change (increase, stable, decrease)
Comment/analysis
There is a significant degree of Social
Partner involvement in Italy, the level of
which increased between 2007 and
2010.
Change from baseline in 2007 – No
change
Similarly the average process and
outcome indicator score for Italy was
slightly below the EU average prior to
2007 and between 2007 and 2010, with
no change in the average score between
the two periods.
Direction of change – Stable
Prior to 2007 and from 2007 to 2010 GDP
per head in Italy was higher than the EU
average, though the rate reduced slightly to
closer to the EU average between 2007
and 2010.
General government debt was higher prior
to 2007 than the EU average; this
remained the case between 2007 and
2010. The general government deficit was
higher prior to 2007 than the EU average
but reduced to a lower rate than the EU
average post-2007. Growth in labour
productivity was far lower in both periods
and reduced at a significantly greater rate
than the EU average in the period 2007 to
2010.
Direction of change – Increase
structures.
Spain Spain did not move towards the
implementation of a different flexicurity
model over the 2007 to 2010 period
Flexicurity is not a commonly or widely
understood concept in Spain. Despite
this, flexibility and security in the labour
market do form part of the national
debate, although flexibility is often
viewed above security.
The average input score for Spain was
close to the EU average prior to 2007 but
it increased between 2007 and 2010 to
slightly above the EU average
Direction of change – Increase
However there was a decrease in the
average score for process and output
indicators for Spain when the pre-2007
For most macroeconomic indicators Spain
was below the EU average prior to 2007,
this remained the case between 2007 and
2010. Furthermore, when the pre-2007 and
post-2007 periods are compared, there
was a slight worsening of the overall
position compared to the EU average in a
number of indicators.
General government debt was slightly
There was an improvement in
input indicators in Spain relative to
the EU average. However this did
not translate into an improvement
in output indicators, which
declined relative to the EU
average in light of a worsening
economic position.
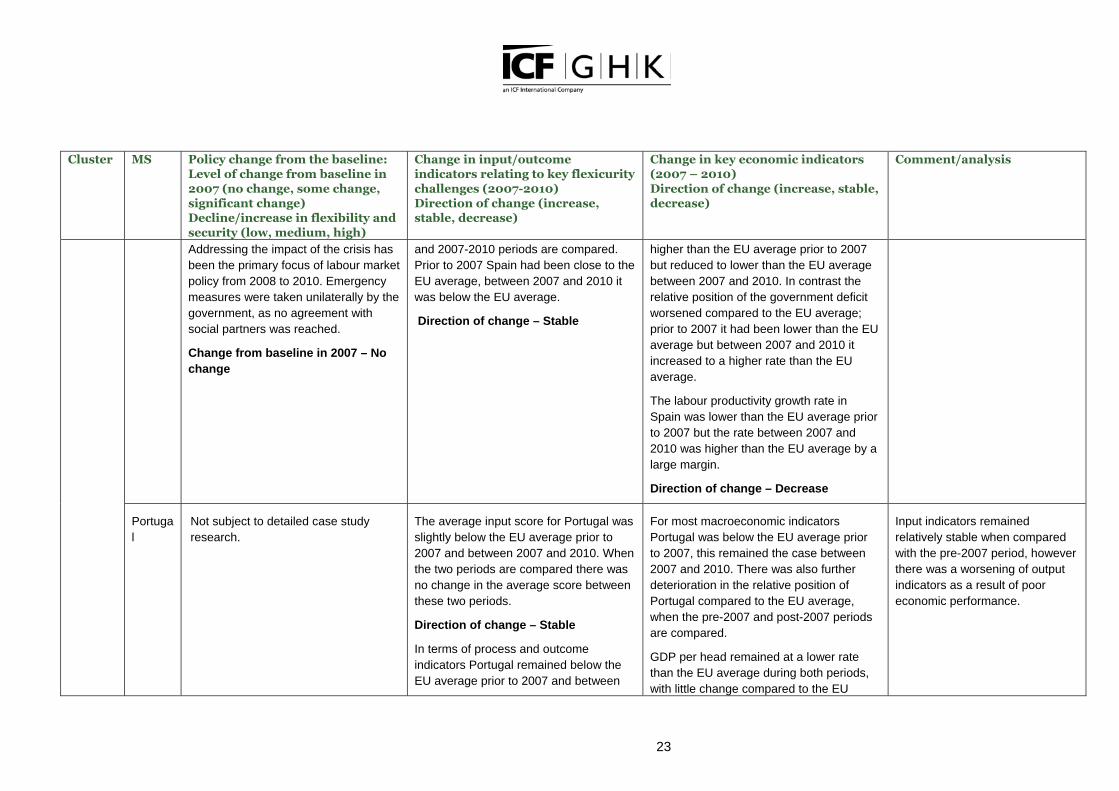
23
Cluster MS Policy change from the baseline: Level of change from baseline in 2007 (no change, some change, significant change) Decline/increase in flexibility and security (low, medium, high)
Change in input/outcome indicators relating to key flexicurity challenges (2007-2010) Direction of change (increase, stable, decrease)
Change in key economic indicators (2007 – 2010) Direction of change (increase, stable, decrease)
Comment/analysis
Addressing the impact of the crisis has
been the primary focus of labour market
policy from 2008 to 2010. Emergency
measures were taken unilaterally by the
government, as no agreement with
social partners was reached.
Change from baseline in 2007 – No
change
and 2007-2010 periods are compared.
Prior to 2007 Spain had been close to the
EU average, between 2007 and 2010 it
was below the EU average.
Direction of change – Stable
higher than the EU average prior to 2007
but reduced to lower than the EU average
between 2007 and 2010. In contrast the
relative position of the government deficit
worsened compared to the EU average;
prior to 2007 it had been lower than the EU
average but between 2007 and 2010 it
increased to a higher rate than the EU
average.
The labour productivity growth rate in
Spain was lower than the EU average prior
to 2007 but the rate between 2007 and
2010 was higher than the EU average by a
large margin.
Direction of change – Decrease
Portuga
l
Not subject to detailed case study
research.
The average input score for Portugal was
slightly below the EU average prior to
2007 and between 2007 and 2010. When
the two periods are compared there was
no change in the average score between
these two periods.
Direction of change – Stable
In terms of process and outcome
indicators Portugal remained below the
EU average prior to 2007 and between
For most macroeconomic indicators
Portugal was below the EU average prior
to 2007, this remained the case between
2007 and 2010. There was also further
deterioration in the relative position of
Portugal compared to the EU average,
when the pre-2007 and post-2007 periods
are compared.
GDP per head remained at a lower rate
than the EU average during both periods,
with little change compared to the EU
Input indicators remained
relatively stable when compared
with the pre-2007 period, however
there was a worsening of output
indicators as a result of poor
economic performance.
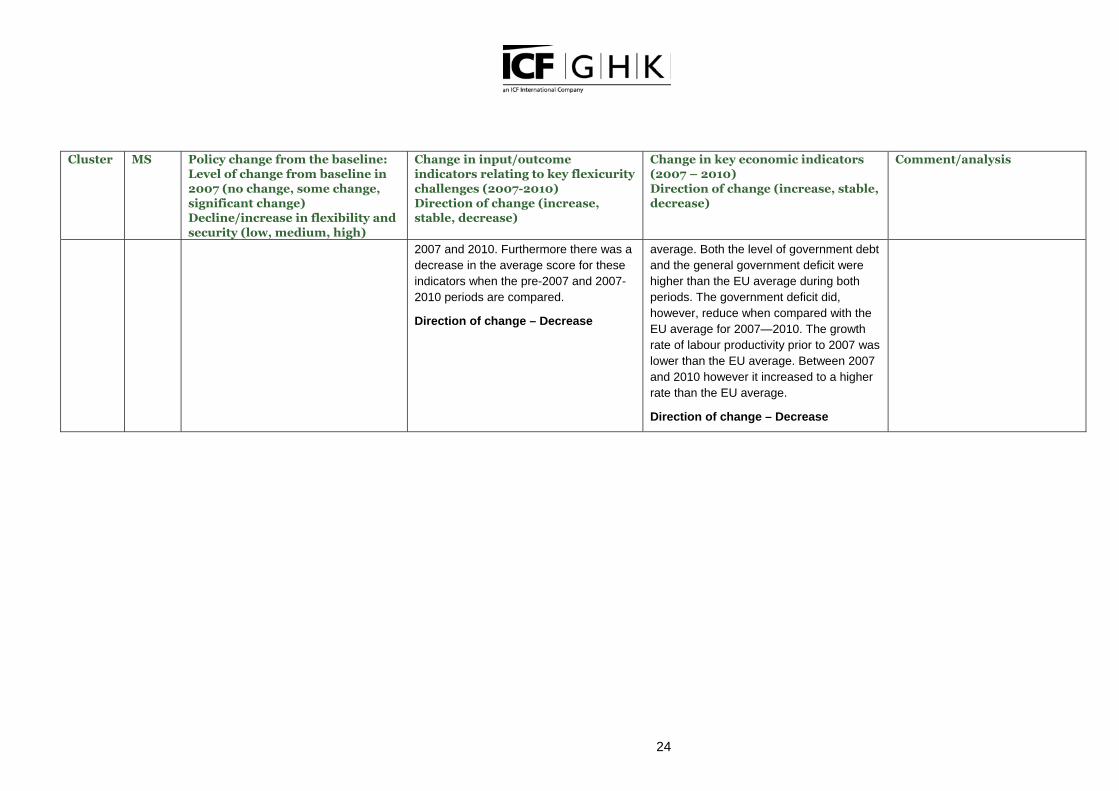
24
Cluster MS Policy change from the baseline: Level of change from baseline in 2007 (no change, some change, significant change) Decline/increase in flexibility and security (low, medium, high)
Change in input/outcome indicators relating to key flexicurity challenges (2007-2010) Direction of change (increase, stable, decrease)
Change in key economic indicators (2007 – 2010) Direction of change (increase, stable, decrease)
Comment/analysis
2007 and 2010. Furthermore there was a
decrease in the average score for these
indicators when the pre-2007 and 2007-
2010 periods are compared.
Direction of change – Decrease
average. Both the level of government debt
and the general government deficit were
higher than the EU average during both
periods. The government deficit did,
however, reduce when compared with the
EU average for 2007—2010. The growth
rate of labour productivity prior to 2007 was
lower than the EU average. Between 2007
and 2010 however it increased to a higher
rate than the EU average.
Direction of change – Decrease
Related Documents