1 Flexicurity in Europe Administrative Agreement JRC N°31962-2010-11 NFP ISP - FLEXICURITY 2 Final Report

Welcome message from author
This document is posted to help you gain knowledge. Please leave a comment to let me know what you think about it! Share it to your friends and learn new things together.
Transcript

1
Flexicurity in Europe
Administrative Agreement
JRC N°31962-2010-11 NFP ISP - FLEXICURITY 2
Final Report

2
© European Union, 2013
The Project has been executed by M. Nardo and F. Rossetti of the European Commission, Joint
Research Center, Unit of Econometrics and Applied Statistics.
We thank Guy Lejeune for the valuable suggestions, R. Rosati for the initial support with the data
and Melissa Mouthaan for the editing assistance.
Disclaimer:
This report was prepared for the use of the European Commission, Directorate-General for
Employment, Social Affairs and Inclusion. The views and opinions expressed here are the authors’
only and do not necessarily represent the Commission’s official position.
Comments and enquiries should be addressed to:
Michela Nardo: [email protected]
Fiammetta Rossetti: [email protected]

3
Executive Summary
The notion of Flexicurity has been widely used in the last decade to reconcile the needs of a flexible
labour market with those of a robust social security. Emerging in the Netherlands in the mid 1990s,
this concept presupposes a “double bind”: high levels of flexibility are required to compete
successfully in a globalized market and thus to afford high levels of employment security.
The European Commission promoted flexicurity to a flagship policy in the mid 2000s. Included in the
Lisbon Agenda (re-confirmed in its follow-up, the EU2020 strategy), flexicurity is advocated by
guideline 21 of the European Employment Strategy 2007 as able “to promote flexibility combined
with employment security”. Member States are then called upon to implement employment policies
aimed at achieving full employment, improving quality and productivity at work, and strengthening
social and territorial cohesion.
After a decade of bonanza the economic crisis brought rising unemployment levels, decreased and in
some cases even negative real GDP growth and scaled-back income-security policies, reducing the
attraction of flexicurity. Most European Countries are facing increased inequality and social tensions,
tighter budget balance constraints together with growing government expenditures to finance the
considerable growth in unemployment rates, effectively reducing the scope for activation and other
support measures. The ‘double bind’ of flexicurity seems therefore jeopardised.
Can Flexicurity survive the crisis?
This is the question we address in this report. By using the set of indicators proposed by the
European Commission to monitor flexicurity we analyse the latest trends in four dimensions: flexible
and reliable contractual agreements, lifelong learning, active labour market policies and social
security systems. Our findings are summarised below.
Flexibility seems to have increased in many countries. Labour turnover has increased in most of the
Eastern and Baltic countries (up to 8 percentage points in Latvia). Hiring rates have dropped sharply
and dismissal rates boosted dramatically during the economic crisis. The proportion of individuals
with at least the same employment security as in the previous year fell almost everywhere in
Europe, and up to 15 percentage points in Latvia and 9 in Estonia (but also more than 6 percentage
points in Spain and Portugal) while the fraction of workforce with involuntary temporary or part-
time contracts increased even in not very traditionally flexible countries (like the Mediterranean
ones). Higher flexibility, however, was not reached as the result of a well-defined policy strategy, but
rather as the consequence of shrinking economic activity.
Young generations paid the highest price. The presence of a dual labour market in many Southern
and Eastern countries has worsened the position of young generations since it induced large-scale
dismissals of young workers with temporary contracts. During the period 2008-2012, the youth
unemployment rate rose to more than twice the corresponding figure for the adult workforce, with
peaks in the Eastern and Southern countries (5 times the adult level in Italy, Czech Republic and
Romania). Temporary contracts, a typical measure of flexibility of labour market, have increased
more for young cohorts during the crisis period: while in Poland 14 out of 100 young employees had
4
a temporary contract in 2000, by 2011 this figure had risen to 65 (but also 56 in Germany and 42 in
EU27).
Temporary work does not seem a choice of the workers, but rather a constraint of the labour
market, worsened by the crisis. In 2011 the percentage of workers aged 15-64 in EU27who could not
find a permanent job and accepted to work on a temporary basis was about 60%, but this spans
from less than 25% in DE and AT to above 90% in ES and CY.
We find evidence of the “skill biased technical change” whereby the low educated paid the highest
price in the current crisis: in 2007 up to 66% of the young unemployed in Slovakia and up to 76% of
the inactive workers in Germany and Denmark were low educated (ISCED level 0-2) with a European
average of 20.1% and 59% respectively. The situation in 2011 has not changed: up to 63.7% young
unemployed in Slovakia and up to 75% of inactive workers in Denmark have at most a lower
secondary education degree (with a European average of 28.2% and 52.3% respectively). The
condition is particularly serious as a poor start for young generations (with temporary contracts)
tends to imply lower lifetime wages, more frequent career breaks, lower employment opportunities,
lower firms’ incentives to invest in human capital formation and problems with future pension
entitlements (as temporary workers are generally not paying the same amount of pension insurance
as workers with an open-ended contract). This is the so-called "scarring" effect.
The Flexicurity thesis postulates that “a market with high employability levels also shows high levels
of labour market turnover and employment security”. The current crisis is likely to boost the need
for measures of income support in order to counteract the increased unemployment rate. Income
support for out-of-work maintenance already increased at the pace of 9% every year on average in
the EU during the period 2008-2010. This increase was more pronounced in IE and ES where this
form of support represents 2.9% and 3.1% of 2010 GDP respectively.
High (or growing) levels of social security collided with the constraints of a tight budget balance and
a decreasing real GDP therefore limiting the (already scarce) room for manoeuvring of some
Member States (especially the Southern countries). In the period 2008-2010 a drop of expenditures
in active labour market policies has been observed in many EU countries with traditionally low
activation measures: in Anglo-Saxon Countries with -19% in UK and -33% in IE, in Mediterranean
countries where reductions (-31% in ES, -14% in IT, -5% in EL) coexist with a slight increase (8% in
PT), but also it has been observed in countries with generous activation policies like in NL (-20% ) and
DK (-10%).
Investment of enterprises in training workers (direct and labour costs) has decreased slightly in
many EU countries (notable exceptions are PT, BE and CY where participation to CVT increased
substantially – by 12% points for the first two countries and 7% for CY), probably in response to the
changed economic conditions and the raised financial pressure on firms.
From the data we analysed, the additional flexibility obtained during the crisis does not seem to be
compensated by increased security. Rather the contrary. Undoubtedly, in countries where flexicurity
policies were/are in place (Nordic and Continental) the effects of the crisis (in terms of
unemployment and GDP growth) have been less severe than in other countries characterised by high
labour market rigidities. This implied more room for manoeuvring for the former when deciding
activation and support policies. However many historical and institutional factors, besides the

5
degree of flexicurity, played a role in the economic fate of the European countries. It is still unclear
whether the increased flexibility will produce the economic advantages to reach enhanced security
levels in the long run or if rising social inequality, worsened by flexibility, will rather damage the
social fabric and will ultimately be detrimental to the entire economy.
6
Contents
Executive Summary ................................................................................................................................. 3
List of tables ............................................................................................................................................ 7
List of Figures .......................................................................................................................................... 8
List of Charts ........................................................................................................................................... 9
List of indicators considered (EMCO and EMCO-modified list) ............................................................ 10
1. Introduction ...................................................................................................................................... 13
2. The concept of Flexicurity: a brief overview ..................................................................................... 16
2.1 Monitoring of flexicurity across EU by using the ESC or the SFO approach ............................... 19
2.2 Flexicurity practices: new challenges .......................................................................................... 22
3. The dimensions of flexicurity in times of crisis: facts and figures .................................................... 25
4. Flexicurity in Europe: analysis of the EMCO and EMCO-modified list of indicators and proposal of a
reclassification ...................................................................................................................................... 37
4.1 Flexible and reliable contractual arrangements ......................................................................... 38
4.2 Comprehensive lifelong learning strategies ............................................................................... 46
4.3 Effective labour market policy .................................................................................................... 54
4.4 Modern social security systems .................................................................................................. 58
4.4.1 Social security systems ......................................................................................................... 60
4.4.2 Reconciliation of work and private life ................................................................................ 65
5. Update of the joint EMPL-JRC project Flexicurity 1 ......................................................................... 70
References ............................................................................................................................................ 79
7
List of tables
Table 1. Fraction of individuals moving from temporary (in t-1) to permanent jobs in t and % of temporary
employees ............................................................................................................................................................. 29
Table 2. Pairwise Pearson Correlation of the indicator in component 1. Flexible and reliable contractual
arrangements (data for the last available year, in red correlations significant at the 5% level) .......................... 44
Table 3. Principal Component Analysis on the indicators of flexible and reliable contractual arrangements ...... 45
Table 4. Pearson Correlation of the indicator in component 2. Comprehensive lifelong learning strategies (data
for the last available year, in red correlations significant at the 5% level) ........................................................... 50
Table 5. Principal Component Analysis on the indicators of Comprehensive lifelong learning strategies ............ 52
Table 6. Pairwise Pearson Correlation of some of the indicators in component 2. Comprehensive lifelong
learning strategies (data for the last available year, in red correlations significant at the 5% level) .................. 52
Table 7. Available data for Computer and Internet skills ..................................................................................... 53
Table 8. Pearson Correlation of the indicator in component 3. Effective active labour market policies (data for
the last available year, in red correlations significant at the 5% level) ................................................................ 57
Table 9. Principal Component Analysis on the indicators of Effective active labour market policies ................... 57
Table 10. Pearson Correlation of the indicator in component 4. Modern social security systems: social security
systems (data for the last available year, in red correlations significant at the 5% level) .................................... 64
Table 11. Principal Component Analysis on the indicators of Modern social security systems: social security
systems ................................................................................................................................................................. 64
Table 12. Pearson Correlation of the indicator in component 4. Modern social security systems: reconciliation of
work with private life (data for the last available year, in red correlations significant at the 5% level) .............. 68
Table 13. Principal Component Analysis on the indicators of Modern social security systems: reconciliation of
work with private life ............................................................................................................................................ 68
Table 14. List of indicators for each of the four components of flexicurity used in the joint EMPL-JRC project
Flexicurity 1 (see file Excel: Update_EMPL-JRC project). ...................................................................................... 72
Table 15. List of EMPL-JRC indicators considered for the inclusion analysis ......................................................... 74
Table 16. Pearson Correlation between the EMPL-JRC list and the EMCO list. Flexible and reliable contractual
arrangements (Red marked correlations are significant at p < .05000) ............................................................... 75
Table 17. Principal Component analysis. Set of EMPL-JRC list and EMCO list. Flexible and reliable contractual
arrangements ....................................................................................................................................................... 75
Table 18. Pearson Correlation between the EMPL-JRC list and the EMCO list. Lifelong Learning (Red marked
correlations are significant at p < .05000) ............................................................................................................ 76
Table 19. Principal Component analysis. Set of EMPL-JRC list and EMCO list. Lifelong Learning ......................... 76
Table 20. Pearson Correlation between the EMPL-JRC list and the EMCO list. Modern social security (Red
marked correlations are significant at p < .05000) ............................................................................................... 77
Table 21. Principal Component analysis. Set of EMPL-JRC list and EMCO list. Modern social security system .... 78
8
List of Figures
Figure 1. Flexicurity as state of affairs: the Stock-Flow-Outcome model ............................................................. 17
Figure 2. Flexicurity as policy strategy: the Efforts-States-Challenges model ...................................................... 18
Figure 3. Theoretical classification of countries and policy regimes in the flexicurity context ............................. 21
Figure 4. Gross Domestic Product at constant (2005) prices. Percentage change 2000-2007 and 2008-2011 .... 25
Figure 5. Unemployment rate: delta 2000-2007 .................................................................................................. 25
Figure 6. Unemployment rate for two age brackets (below 25 and 25-75): delta 2000-2007 and 2008-2011 .... 26
Figure 7. Temporary employees (%) for 2000 and 2011, different age brackets .................................................. 27
Figure 8. Temporary employees (%): delta 2000-2007 and 2008-2011 ................................................................ 28
Figure 9. Youth-to total employment rate ratio. 2000 and 2011 ......................................................................... 28
Figure 10. Diversity and reasons for contractual and working arrangements: involuntary part time and
temporary work rates. Delta 2000-2007 and 2007-2011 ..................................................................................... 28
Figure 11. Long term unemployment ................................................................................................................... 31
Figure 12. Expenditure on Active Labour Market Policies (cat. 2-7) per person wanting to work ........................ 32
Figure 13. Expenditure on LMP supports (cat. 8: out of work income maintenance) as % of GDP. Delta 2005-
2007 and 2008-2010 ............................................................................................................................................. 32
Figure 14. At-risk-of-poverty rate of unemployed (aged 18+) .............................................................................. 32
Figure 15. Net replacement rate after 6 months of unemployment. Value in 2007 and delta 2007-2010........... 33
Figure 16. Total public expenditure in education as % of GDP, delta 2008-2010 ................................................. 34
Figure 17. Total of persons [aged 24-64] with tertiary education attainment. Level in 2008 and delta 2008-2011
.............................................................................................................................................................................. 34
Figure 18. Continuing vocational training: % of employees and investment by enterprises. Levels in 2005 and
delta 2005-2010.................................................................................................................................................... 35
Figure 19. Computer skills: percentage of people aged 24-54 having low or medium-high computer skills ........ 35
Figure 20. Internet skills: percentage of people aged 24-54 having low or medium-high computer skills ........... 35
Figure 21. At risk of poverty rate (cut-off point: 60% of median equivalised income after social transfers) of
employed and unemployed persons (age 16-64) .................................................................................................. 36
Figure 22. Relative proportion of expenditures on LMP supports (cat 8: out of work income maintenance) and
on ALMP (cat. 2-7) – PPS per person wanting to work. ........................................................................................ 36
Figure 23. List of indicators for flexible and reliable contractual arrangements .................................................. 40
Figure 24. Map of indicators with respect to different policy classifications ........................................................ 40
Figure 25. Transition by type of contract (employment security): standardized (compound) changes between
2006-2010 (IE missing) ......................................................................................................................................... 41
Figure 26. List of indicators for Comprehensive lifelong learning strategies ........................................................ 47
Figure 27. Map of indicators with respect to different policy classifications ........................................................ 47
Figure 28. Lifelong learning: percentage of adult population (25-64) participating in education and training.
Standardized (compound) changes between 2006-2011 ..................................................................................... 48
Figure 29. List of indicators for Effective active labour market policies ............................................................... 55
Figure 30. Map of indicators with respect to different policy classifications ........................................................ 55
Figure 31. Long term Unemployment: standardized (compound) changes between 2006-2011 ........................ 57
Figure 32. List of indicators for Modern social security systems .......................................................................... 59
Figure 33. Map of indicators with respect to different policy classifications ........................................................ 60
Figure 34. Modern social security systems (social security systems): standardized (compound) changes between
2006-2011 ............................................................................................................................................................. 62
Figure 35. Modern social security systems (reconciliation of work and private life): standardized (compound)
changes between 2006-2010 ................................................................................................................................ 66

9
List of Charts
Chart 1. Bar charts of component 1: Flexible and reliable contractual arrangements. Selected countries .......... 42
Chart 2. Bar charts of component 2: Comprehensive lifelong learning strategies. Selected countries ................ 49
Chart 3. Bar charts of component 3: Effective labour market policies. Selected countries .................................. 56
Chart 4. Bar charts of component 4.a: Social security systems. Selected countries ............................................. 63
Chart 5. Bar charts of component 4.b: Reconciliation of work and private life. Selected countries ..................... 67
10
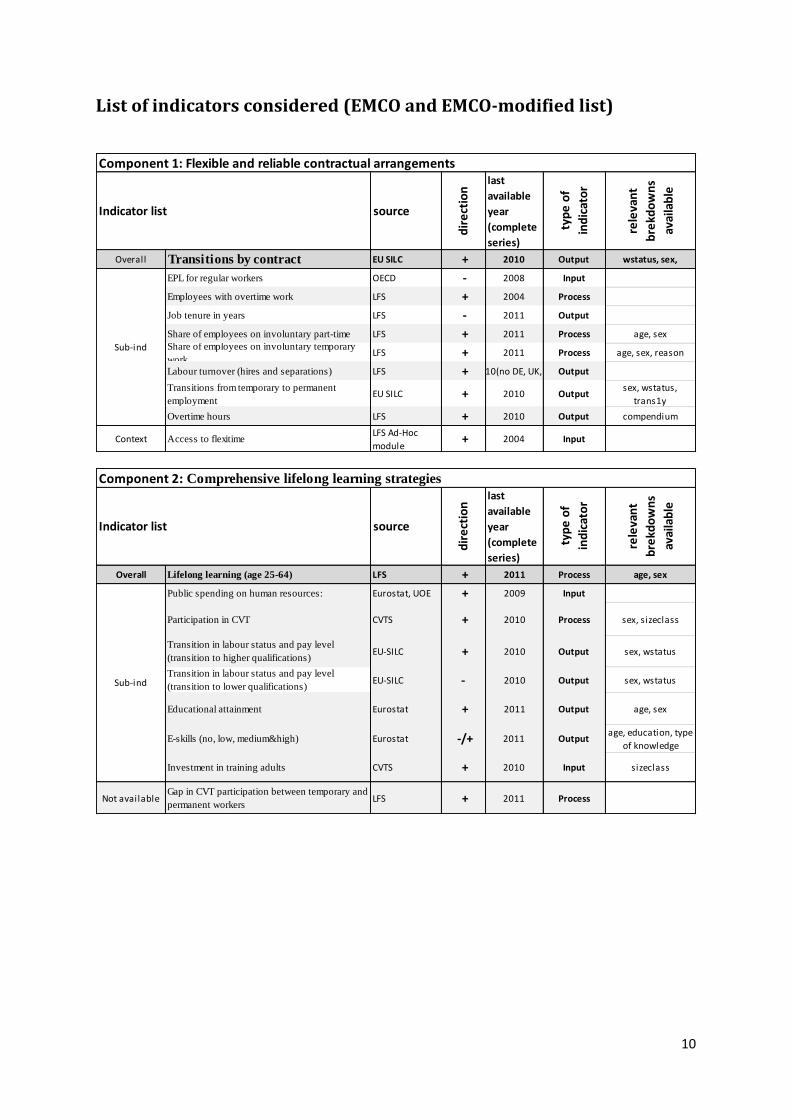
List of indicators considered (EMCO and EMCO-modified list)
Component 1: Flexible and reliable contractual arrangements
Indicator list source
dir
ect
ion
last
available
year
(complete
series)
typ
e o
f
ind
icat
or
rele
van
t
bre
kdo
wn
s
avai
lab
le
Overall EU SILC + 2010 Output wstatus, sex,
OECD - 2008 Input
LFS + 2004 Process
LFS - 2011 Output
LFS + 2011 Process age, sex
LFS + 2011 Process age, sex, reason
LFS + 2010(no DE, UK, IE) Output
EU SILC + 2010 Outputsex, wstatus,
trans1y
Overtime hours LFS + 2010 Output compendium
ContextLFS Ad-Hoc
module + 2004 Input
Sub-ind Share of employees on involuntary temporary
work
Labour turnover (hires and separations)
Transitions from temporary to permanent
employment
Access to flexitime
Transitions by contract
EPL for regular workers
Employees with overtime work
Job tenure in years
Share of employees on involuntary part-time
Component 2: Comprehensive lifelong learning strategies
Indicator list source
dir
ect
ion
last
available
year
(complete
series)ty
pe
of
ind
icat
or
rele
van
t
bre
kdo
wn
s
avai
lab
le
Overall Lifelong learning (age 25-64) LFS + 2011 Process age, sex
Public spending on human resources: Eurostat, UOE + 2009 Input
Participation in CVT CVTS + 2010 Process sex, sizeclass
EU-SILC + 2010 Output sex, wstatus
EU-SILC - 2010 Output sex, wstatus
Educational attainment Eurostat + 2011 Output age, sex
E-skills (no, low, medium&high) Eurostat -/+ 2011 Outputage, education, type
of knowledge
Investment in training adults CVTS + 2010 Input sizeclass
Not available LFS + 2011 Process
Sub-indTransition in labour status and pay level
(transition to lower qualifications)
Gap in CVT participation between temporary and
permanent workers
Transition in labour status and pay level
(transition to higher qualifications)
11
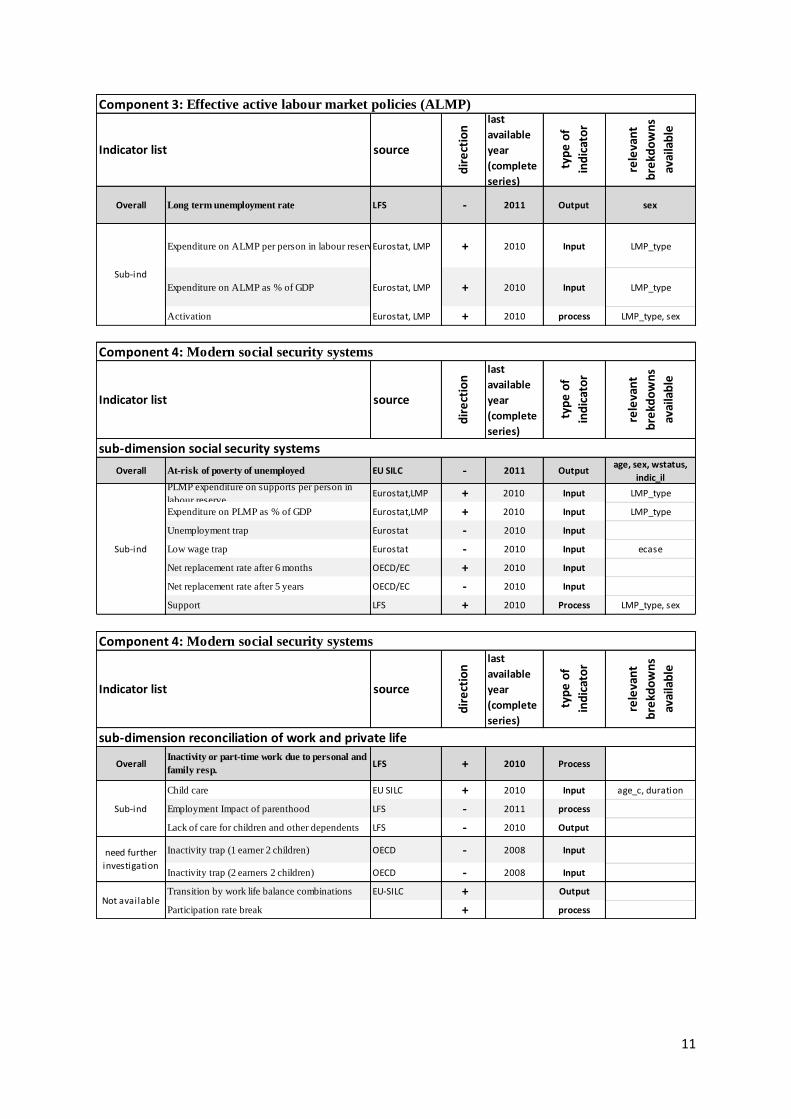
Component 3: Effective active labour market policies (ALMP)
Indicator list source
dir
ect
ion
last
available
year
(complete
series)
typ
e o
f
ind
icat
or
rele
van
t
bre
kdo
wn
s
avai
lab
le
Overall Long term unemployment rate LFS - 2011 Output sex
Expenditure on ALMP per person in labour reserve Eurostat, LMP + 2010 Input LMP_type
Expenditure on ALMP as % of GDP Eurostat, LMP + 2010 Input LMP_type
Activation Eurostat, LMP + 2010 process LMP_type, sex
Sub-ind
Component 4: Modern social security systems
Indicator list source
dir
ect
ion
last
available
year
(complete
series)
typ
e o
f
ind
icat
or
rele
van
t
bre
kdo
wn
s
avai
lab
le
sub-dimension social security systems
Overall At-risk of poverty of unemployed EU SILC - 2011 Outputage, sex, wstatus,
indic_il
Eurostat,LMP + 2010 Input LMP_type
Expenditure on PLMP as % of GDP Eurostat,LMP + 2010 Input LMP_type
Unemployment trap Eurostat - 2010 Input
Low wage trap Eurostat - 2010 Input ecase
Net replacement rate after 6 months OECD/EC + 2010 Input
Net replacement rate after 5 years OECD/EC - 2010 Input
Support LFS + 2010 Process LMP_type, sex
Sub-ind
PLMP expenditure on supports per person in
labour reserve
Component 4: Modern social security systems
Indicator list source
dir
ect
ion
last
available
year
(complete
series)
typ
e o
f
ind
icat
or
rele
van
t
bre
kdo
wn
s
avai
lab
le
sub-dimension reconciliation of work and private life
Overall LFS + 2010 Process
Child care EU SILC + 2010 Input age_c, duration
Employment Impact of parenthood LFS - 2011 process
Lack of care for children and other dependents LFS - 2010 Output
Inactivity trap (1 earner 2 children) OECD - 2008 Input
Inactivity trap (2 earners 2 children) OECD - 2008 Input
Transition by work life balance combinations EU-SILC + Output
Participation rate break + process
Inactivity or part-time work due to personal and
family resp.
need further
investigation
Not available
Sub-ind
12
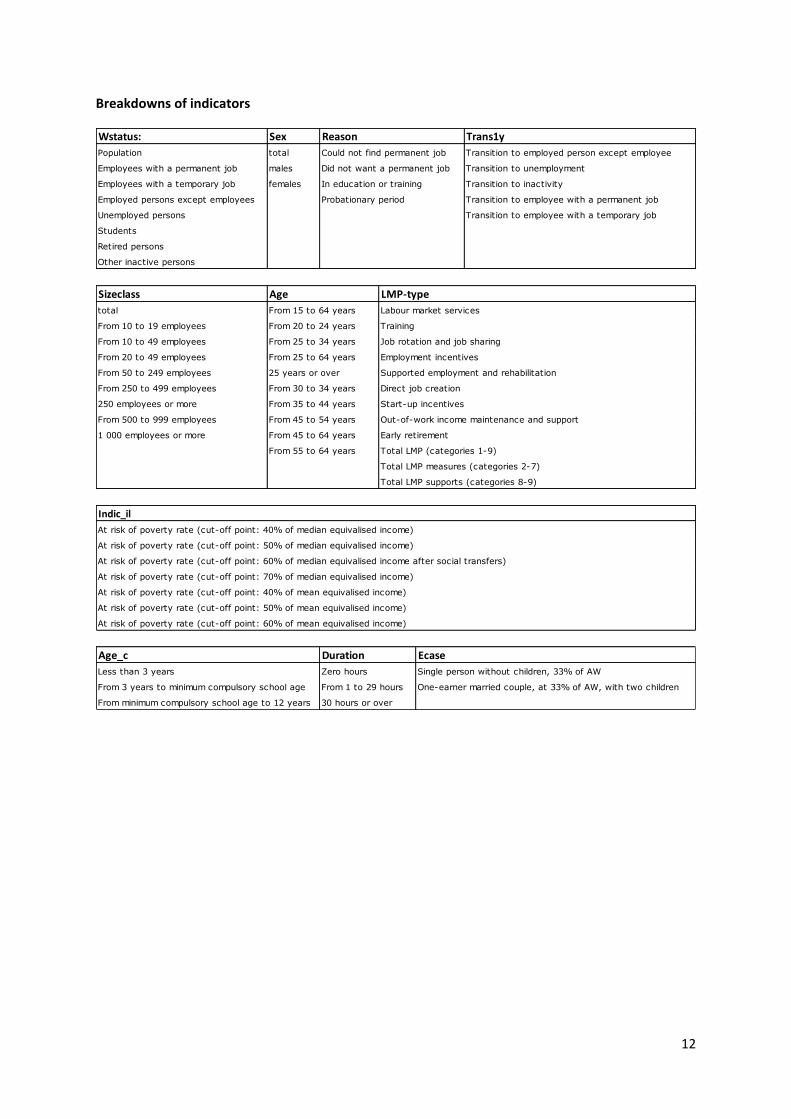
Breakdowns of indicators
Wstatus: Sex Reason Trans1y
Population total Could not find permanent job Transition to employed person except employee
Employees with a permanent job males Did not want a permanent job Transition to unemployment
Employees with a temporary job females In education or training Transition to inactivity
Employed persons except employees Probationary period Transition to employee with a permanent job
Unemployed persons Transition to employee with a temporary job
Students
Retired persons
Other inactive persons
Sizeclass Age LMP-type
total From 15 to 64 years Labour market services
From 10 to 19 employees From 20 to 24 years Training
From 10 to 49 employees From 25 to 34 years Job rotation and job sharing
From 20 to 49 employees From 25 to 64 years Employment incentives
From 50 to 249 employees 25 years or over Supported employment and rehabilitation
From 250 to 499 employees From 30 to 34 years Direct job creation
250 employees or more From 35 to 44 years Start-up incentives
From 500 to 999 employees From 45 to 54 years Out-of-work income maintenance and support
1 000 employees or more From 45 to 64 years Early retirement
From 55 to 64 years Total LMP (categories 1-9)
Total LMP measures (categories 2-7)
Total LMP supports (categories 8-9)
Indic_il
At risk of poverty rate (cut-off point: 40% of median equivalised income)
At risk of poverty rate (cut-off point: 50% of median equivalised income)
At risk of poverty rate (cut-off point: 60% of median equivalised income after social transfers)
At risk of poverty rate (cut-off point: 70% of median equivalised income)
At risk of poverty rate (cut-off point: 40% of mean equivalised income)
At risk of poverty rate (cut-off point: 50% of mean equivalised income)
At risk of poverty rate (cut-off point: 60% of mean equivalised income)
Age_c Duration Ecase
Less than 3 years Zero hours Single person without children, 33% of AW
From 3 years to minimum compulsory school age From 1 to 29 hours One-earner married couple, at 33% of AW, with two children
From minimum compulsory school age to 12 years 30 hours or over
13
Flexicurity in Europe
1. Introduction
The notion of Flexicurity has been widely used in the last decade to reconcile the needs of a flexible
labour market with those of a robust social security. Coined in the mid 1990s in the Netherlands by
the Dutch sociologist H. Adriaansen, the word flexicurity was associated to the need of
strengthening the position of temporary workers without compromising flexibility (Madsen 2006
and Van Oorschot, 2004).1 This notion was widely used also in Denmark in the 1990s for a number of
labour market reforms (Madsen 2002) and had an echo at the EU level in 1997 with the
Commission’s Green Paper Partnership for a new Organization of Work which states: “the key issue
for employees, management, the social partners and policy makers alike is to strike the right balance
between flexibility and security”.
Only in the 2000s was the concept of flexicurity proposed in the European discourse as a guideline to
modernising employment policies and welfare provisions. In response to the dominant deregulation
of the 1980s,2 the notion of flexicurity claims that investment in social policies is not a wasteful
burden but instead constitutes an economic production factor (Wilthagen, 1998). The idea is that
flexibility and security could be mutually supportive: only through higher security protecting the
employment (and not the job), the challenges of a globalized economy could be effectively faced via
additional flexibility (hence efficiency).
In 2007 the European Commission promoted this idea to a key policy concept. Flexicurity was
incorporated into the European Employment Strategy 2007 (and in the Lisbon Agenda): guideline 21
calls for Member States “to promote flexibility combined with employment security” and to
implement employment policies aimed at achieving full employment, improving quality and
productivity at work, and strengthening social and territorial cohesion. This document proposes a set
of policy components, reaffirmed later within the EU-2020 strategy. These are:
1. Flexible and reliable contractual arrangements (FCA): The availability of contractual
arrangements, providing adequate flexibility for both employer and employees in a balanced
combination with security and activation offers3 via modern labour laws, collective agreements and
work organization4
2. Comprehensive lifelong learning strategies (LLL): strategies to ensure the continual adaptability
and employability of workers, particularly the most vulnerable.
1 The idea to reconcile security with flexibility was present in the Rehn-Meidner Model in Sweeden after World War II and in the Sorge and Streeck’s model of 1988 (see Keune and Jepsen, 2006). 2 And riding the wave of a decade of good economic performance in the leader flexicurity countries (Denmark and Netherlands) 3 Flexicurity, Joint Contribution of the Employment Committee and the Social Protection Committee, May 2006. 4 EMCO report Monitoring and analysis of Flexicurity policies, Issue 2 July 2009.

14
3. Effective labour market policies (ALMP): policies helping people to cope with rapid change,
reduce unemployment spells, and ease the transition to new jobs.
4. Modern social security systems (MSS) further divided in: 4.a. Social security systems and 4.b.
Reconciliation of work and private life: systems that provide adequate income support, encourage
employment and facilitate labour mobility. It includes a broad coverage of social protection
provisions helping people to combine work with private life and family responsibilities.
The monitoring of flexicurity achievements has been taken forward following the endorsement by
member States of a list of indicators (EMCO-list5). A revised and enriched list of indicators (EMCO-
modified list6) has been proposed in 2010. Both lists classify indicators of flexibility and security in
input-process-output. 7
The difficulty for establishing a clear categorization of flexicurity dimensions both at the EU level and
among experts (see for example Viebrock and Clasen, 2009) stems from the multidimensional nature
of the concept, its strong path (country) dependence, and the interlink between all dimensions and
the need to take time (hence possible loops and intertemporal links) into account. A brief review of
the different concepts and problems is given in the Section 2.
The recent trend in assessing flexicurity at the European level is linked to the monitoring of
employment policies using the Joint Assessment Framework (JAF).8 Setting aside the taxonomy
input-process-output, the Commission proposes an analytical tool, the JAF, to underpin evidence-
based policy making based on a three-step approach:
1. quantitative assessment based on indicators: identification of a key overall indicator per
policy (sub-)area and a limited number of corresponding sub-indicators and contextual
indicators;
2. qualitative assessment that qualifies and complements the findings from step 1;
3. prioritising challenges and identifying key challenges.
This new assessment framework favoured an overall revision of flexicurity indicators, reported in
Section 4, eventually leading to a new list of overall indicators and sub-indicators (and in some cases
contextual indicators) for each of the four dimensions of flexicurity. This list (and its regrouping
according to the JAF style) only partially overlaps with the policy areas proposed by JAF (which
represent the yardstick of Commission priorities for its residual mandate).9 The dimensions FCA and
LLL are partially contained in policy area 2.a Combating segmentation and 8.2 Lifelong learning
respectively. The dimension ALMP coincides with the policy area 3. Active Labour Market Policies
and the dimension MSS is contained in two policy areas: 4.1 Adequate social security and 5. Work-
life balance. Nonetheless, integrated flexicurity policies remain a key word in the Commission
discourse related to modernising labour markets and achieving the objectives of Europe 2020
5 EMCO/25/240609/EN 6 EMCO/41/300610/EN 7 EMCO (Employment Committee) report Monitoring and analysis of Flexicurity policies, Issue 2 July 2009. 8 See the joint Commission, EMCO, Social Protection Committee report to the Council (Nov. 2010): Foundations and structures for a Joint Assessment Framework (JAF), including an Employment Performance Monitor (EPM) to monitor the Employment Guidelines under Europe 2020. Council Doc 16984/10. 9 Flexicurity has never been a policy area in its own. JAF has been recently updated and will be published in 2013.
15
Strategy. Both Commission initiatives: an agenda for new skills and jobs and youth on the move
contain suggestions for strengthening flexicurity by reducing labour market segmentation and
supporting labour transitions (by equipping people with the right skills for employment); improving
job quality and working conditions; supporting job creation; facilitating the acquisition of skills,
qualifications and experience; strengthening public employment services such as job search support,
career analyses, validation of experience, etc.
The difference in socio-economic, institutional and historical backgrounds among European
countries pushed the Commission to propose country specific pathways to meet the challenge of
flexicurity: (i) tackling contractual segmentation, (ii) developing flexicurity within enterprises and
offering transition security, (iii) tackling skills and opportunity gaps among the workforce, (iv)
improving opportunities for benefit recipients and informally employed workers (European
Commission 2007a and European expert group on flexicurity, 2007).
It is still not clear to what extent these goals will be translated into effective practices and,
ultimately, results. Since 2008 the concept of flexicurity has been challenged by two forces. On the
one hand, the economic crisis diminished both the public provisions for labour active policies,
education and social security and the private incentive to invest in human resources in such a way
that the first victims of the crisis have been precisely those workers with flexible contractual
arrangements (Tros, 2012). The persistent unemployment (especially of young cohorts) and the
difficulty in early career development, as well as the cut in welfare expenditure in many member
states, are all factors which do not contribute to an effective flexicurity policy.10 On the other hand,
the concept of flexicurity itself suffered from a lack of consensus driven by the weakness of its
underlying theory and the imprecise nature of the concept (Viebrock and Clasen, 2009).
The economic crisis also had an impact on how the European Commission envisaged flexicurity.
When first mentioned by Commissioner Špidla in 2005, the idea of flexicurity was more related to
the neo-liberal push towards deregulation of labour markets (Vesan, 2011). By contrast, the current
approach of the Commission is to devote more attention to employment security, as stated by
Commissioner Andor (2011) “even before the crisis, the number of temporary contracts and jobs
arranged through private work agencies rose steeply, even in countries where employment
protection has been reformed. The labour markets did not really benefit from this, despite the short
honeymoon when employment increased before falling sharply during the crisis. And job insecurity
has increased”.
This report presents a brief overview of the concept of flexicurity and its latest developments
(Section 2 and 3). The preparatory work for constructing the list of flexicurity indicators endorsed by
EMCO in November 2012 is presented in Section 4. Section 5 contains the evaluation of an
alternative list of indicators jointly developed by EMPL and JRC and used to construct a set of
composite indicators of flexicurity (AA N° 30566-2007-03 A1CO ISP BE - Flexicuirty1). Five Annexes
containing the JAF graphs, a technical document about data and related issues accompanying the
Excel files with bar and radar charts and an Excel file with the updated data of the project Flexicurity
1 complete the package.
10 Given the rigidities of the labour markets in Europe the flexibility part has be interpreted as working hours flexibility more than anything else (Meardi, 2012)
16
2. The concept of Flexicurity: a brief overview
The literature on flexicurity is very recent and goes back to the 1990s and early 2000s when
flexicurity is at times a strategy, a state of affairs and sometimes an analytical tool. Wilthagen (1998)
defines it as a coordinated policy strategy; Wilthagen and Rogowski 2002 refer to a synchronized
strategy directed towards weaker labour groups, while Ferrera et al., 2001 associate flexicurity with
the fight against social exclusion. A totally different position is expressed by Tangian 2004 who sees
flexicurity as a response to the economic need to increase the competitiveness of the European
economies, thus promoting liberalization regardless of security concerns (which are only used as a
way to reach a compromise between employers and employees). Madsen, 2004 paves the way
towards a more pragmatic vision of flexicurity by proposing the idea of the “golden Triangle” based
on flexible labour markets, generous unemployment support and strong emphasis on activation
measures (like skill upgrading and requalification of unemployed workers). The European
Commission (2006, 2007a) follows this direction but adopts a more institutional definition based on
four pillars (with more emphasis on lifelong learning and on reconciliation family-work with respect
to Madsen 2004), while Wilthagen and Tros 2003, 2004 offer a set of flexicurity profiles in order to
allow a full monitoring of policies in European Countries. They identify various types of flexibility and
security, pointing out the historical path dependency of the concept (and opening to the
construction of dynamic indicators). The combination of these different forms of flexibility and
security produce a matrix helpful to analyse the different national or sectorial flexicurity profiles.
Each of these approaches is not neutral as it implies a different emphasis on the various flexicurity
components and a defined path towards the reconciliation of security and flexibility. As stated by
Chung (2012, p. 154) “By taking up a certain definition and framework, a researcher is consciously
taking a decision to put emphasis on a certain aspect of flexicurity”.
Even if there is no universally agreed-upon definition of flexicurity, this concept is presented in the
literature mainly in two ways: as a policy strategy (i.e. the efforts to reach flexibility and security) or
as a state of affairs (i.e. the outcome of flexicurity policies).
Flexicurity as state of affairs is essentially implemented in the Stock-Flow-Outcomes model (see
Figure 1), and Muffels et al, 2010, where the stock is the set of human and social capital11 built up
though education, skill formation, work experience, and social networking. The transition and the
duration of states constitute the flow and the outcomes are the attainments of different types of
flexibilities/securities. The approach has been operationalized as a monitoring tool by constructing
an extended Flexicurity Matrix (Wilthagen 1998) with 5 forms of flexibility (numerical internal,
numerical external, functional internal, functional external, wage flexibility) and 7 different forms of
security (job security, work security, employment security, wage/income security - after transfer
income-, employability security, representation security, work-life balance security) and by adding
the concept of dynamic indicators to monitor the transition between outcomes and new actions.12
11 Inspired to Sen’s capability approach of 1993 and to the Stiglitz, Sen, Fitoussy report of 2009 12 Flexibility. External numerical flexibility: ease of hiring and firing workers and the use of flexible forms of labour contracts; Internal numerical flexibility: the ability of firms to adapt to economic fluctuations via e.g. work-time adjustments, sub-contracting, temporary work, etc.; Functional internal flexibility: ability of firms to

17
Figure 1. Flexicurity as state of affairs: the Stock-Flow-Outcome model
(Source: rearranged from Muffels at al. 2010, FCA=flexible and reliable contractual agreements; LLL= lifelong learning; ALMP=active labour
market policies; MSS=modern social security systems).
Flexicurity as a policy strategy is operationalized in the Effort-States-Challenges (ESC) model (Figure
2, Bekker and Chung 2009). Efforts aim at describing the different actions made to enhance
flexicurity by institutions (e.g. via employment protection, regulation on wages or work-time),
companies (e.g. via working time arrangements) and individuals (e.g. via savings or overtime working
hours). States refer to the outcome of flexicurity policies, basically income security and higher
employment rate (higher productivity). Challenges can be understood as the gap between the policy
goals set when Efforts were designed and what has been actually achieved. This gap establishes the
link between the states, the current policy agenda, and the design of future Efforts and constitutes
the necessary dynamic element to make flexicurity an evolving concept. Notice that the same level
of Efforts does not necessarily bring the same effects or produce the same challenges. A series of
indirect effects (e.g. on fertility rate) or external factors influencing the context determine the
results and the extent of the interaction between the elements of the ESC model and should be
taken into account.
A reduced version of the ESC model has been used for policy evaluation (Castonguay, 2009) under
the name of Input-Process-Output where Efforts translate into Input and Process and States
correspond to Outputs. Challenges parallels to Impacts are usually neglected in the static version of
policy cycle formulation.
deploy the skills of the workforce and internal job-mobility; Functional external flexibility: mobility of workers across jobs and functions; Wage flexibility: ability to introduce pay based on performance/results. Security. Job security: the certainty of retaining a specific job with the same employer; Work security: safe and healthy workspace; Employment security: certainty of remaining in paid work (not necessarily with the same job or employer); Wage/income security: certainty of receiving adequate and stable level of income; Employability security: opportunity to acquire and maintain skills; Representation security: protection of collective voice through workers’ representation and trade unions organizations; Work-life balance: options to combine work with family responsibilities. Definitions rearranged from Viebrock and Clasen 2009 and Muffels et al., 2010
18
Input indicators are quantitative assessments of rules and regulations related to “rights” or
obligations” (e.g. benefit coverage, provision of services and financial resources, etc.); Process
Indicators aim at measuring the extent to which policy measures are being implemented. Output
indicators ideally measure the result of policy measures (e.g. unemployment dynamics, actual
income security, or lifelong learning participation). The goal of this classification is not to establish a
causal link between input-process-output (deemed too complex for a linear and mechanistic
representation of the interaction between different variables) but rather to link the monitoring of
flexicurity to the policy cycle and use the list of indicators for policy evaluation.
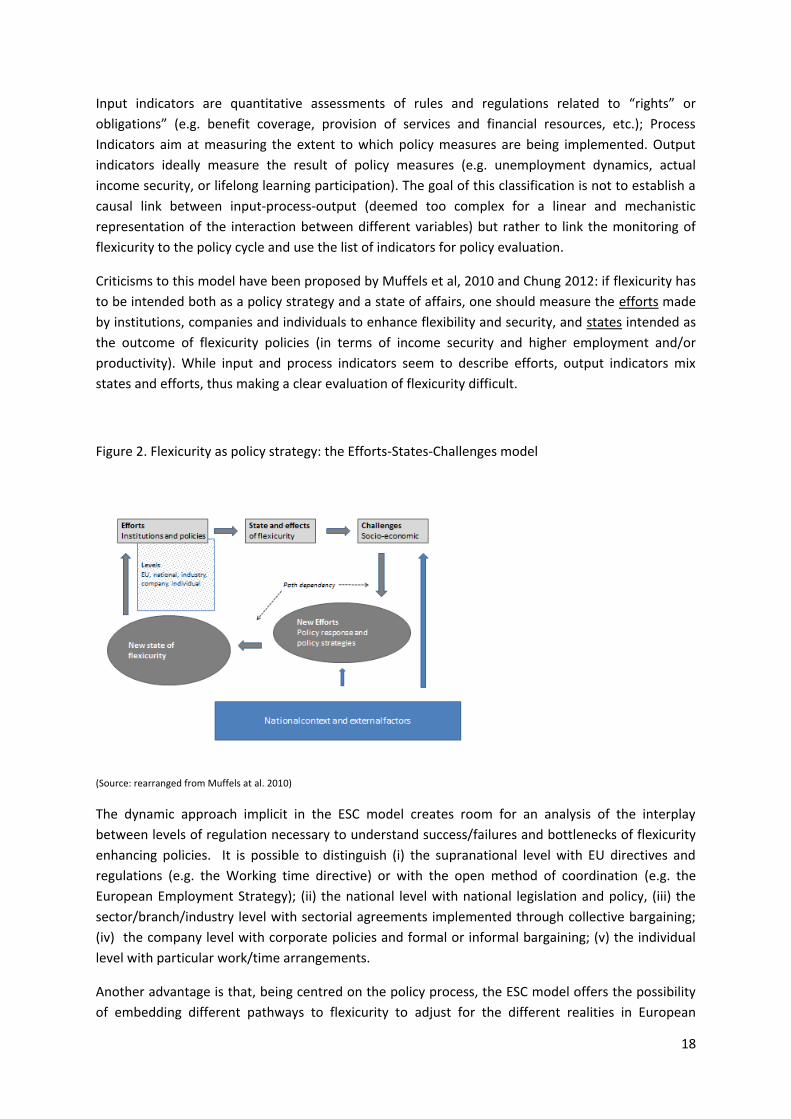
Criticisms to this model have been proposed by Muffels et al, 2010 and Chung 2012: if flexicurity has
to be intended both as a policy strategy and a state of affairs, one should measure the efforts made
by institutions, companies and individuals to enhance flexibility and security, and states intended as
the outcome of flexicurity policies (in terms of income security and higher employment and/or
productivity). While input and process indicators seem to describe efforts, output indicators mix
states and efforts, thus making a clear evaluation of flexicurity difficult.
Figure 2. Flexicurity as policy strategy: the Efforts-States-Challenges model
(Source: rearranged from Muffels at al. 2010)
The dynamic approach implicit in the ESC model creates room for an analysis of the interplay
between levels of regulation necessary to understand success/failures and bottlenecks of flexicurity
enhancing policies. It is possible to distinguish (i) the supranational level with EU directives and
regulations (e.g. the Working time directive) or with the open method of coordination (e.g. the
European Employment Strategy); (ii) the national level with national legislation and policy, (iii) the
sector/branch/industry level with sectorial agreements implemented through collective bargaining;
(iv) the company level with corporate policies and formal or informal bargaining; (v) the individual
level with particular work/time arrangements.
Another advantage is that, being centred on the policy process, the ESC model offers the possibility
of embedding different pathways to flexicurity to adjust for the different realities in European
19
Countries. The SFO model, being based upon a predefined taxonomy of security and flexibility forms
instead offers the possibility of identifying predefined combinations of flexibility and security which
do not always match national specificities (European expert group on flexicurity, 2007). Moreover,
having 35 different combinations of flexibility and security forms (coming from a matrix with 7 rows
and 5 columns) may contribute to the vagueness and the ambiguity of the concept of flexicurity
(Keune and Jepsen, 2006).
The studies focusing on the multidimensional nature of flexicurity and following either the ESC or
the SFO approach started in the early 2000s (see Viebrock and Clasen, 2009). These studies, briefly
reported in Section 2.1, consist mainly of two types:
1. Studies aimed at analysing trends and flexicurity pathways using national data, and
clustering groups of countries according to the level of flexibility and security displayed
(Boeri 2011, Bekker and Chung 2009, Chung 2012, European Commission 2006, 2007b,
Eurofund 2010a,b, Laporšek and Dolenc 2011, Muffels and Luijkx 2005, 2008). Trends and
clusters are also linked to the dynamic perspective of flexicurity using micro-level panel data
coming from large surveys13 analysed among others by Muffels, Wilthagen Chung and
Dekker (2010).
2. Studies aiming at constructing composite indicators to measure the extent of flexibility and
security in EU Member States (among others Manca, Governatori, Mascherini 2010, Maselli
2010, Tangian 2010, Bachmann, Bechara, Schaffner, 2011).
Furthermore the literature reports flexicurity practices in EU Member States (in the 1990s and early
2000s mostly in Denmark and Netherlands, with the economic crisis in all EU countries) useful for
identifying best practices in times of economic challenges (see Section 2.2).
2.1 Monitoring of flexicurity across EU by using the ESC or the SFO approach
In the specialized literature, flexicurity is mostly assumed to be “good” or welfare-enhancing by
definition, without a (data driven) proof that it is actually so. The bulk of the (scarce) quantitative
literature on flexicurity has been centred on the definition of the most suitable indicators to
populate the four dimensions of flexicurity, and on the analysis of EU Member States’ performances
and trends. This has been the focus of the European Commission (European Commission 2006,
2007b) and of Muffels, Wilthagen, Chung (2010). All these studies define and analyse a set of
flexicurity indicators, identify common patterns across countries, and cluster countries according to
performance. An overall assessment of the actual welfare-enhancing effects of flexicurity is lacking
in the literature and there is little empirical analysis of the trade-offs between flexibility and security
as well of the relationship between output variables such as GDP per capita, productivity, disposable
income, material deprivation or unemployment rate, and the indicators associated to flexibility and
security.
13 As for example the Labour Force Survey, the European Community Household Survey, or EU Social and Living Conditions survey.
20
Recently Laporšek and Dolenc (2011) replicate the analysis of the European Commission (2007b) by
clustering 25 EU countries on a subset of indicators belonging to the four pillars of flexicurity
(hierarchical clustering using the Ward method, data 2007-2008). They find five clusters describing
different models of flexicurity in EU. A rigid labour market and a very low security of employees
characterize the Eastern European and the Baltic countries and are associated with a low labour
productivity and GDP per capita. Low flexibility and intermediate-to-low security is found in
Mediterranean countries, Luxemburg and Poland together with a low labour productivity and a GDP
per capita close to the EU average. The highest productivity, GDP per capita and the lowest
unemployment is registered in Scandinavian and Anglo-Saxon countries where flexibility is high and
security is intermediate (Scandinavian and NL) to high (UK and Ireland). Finally, continental countries
(Germany, Austria, France and Belgium) display medium level of flexibility in employment
relationships with a share of temporary and part-time contracts exceeding the EU average but with
high expenditures in active employment policies and social protection. Interestingly each cluster is
analysed in relation to some indicators of macroeconomic performance (like GDP per capita,
unemployment rate, long-term unemployment and real labour productivity). The authors conclude
that countries with greater flexibility and security attain higher levels of GDP per capita and
productivity, and lower levels of unemployment. 14
The need to develop dynamic indicators has been underlined by many authors (Muffels, Wilthagen,
Chung and Dekker (2010), Muffels, R., Wilthagen, T., Chung, H., (2010) Muffels and Luijkx (2008)
among others). Muffels, Wilthagen, Chung and Dekker (2010) for example monitor the progress of
Member States’ achievements on flexicurity by developing transition indicators for the four
components of flexicurity using EU-SILC data (of particular interest is the indicator on work-life
balance transition security discussed by the Employment Committee Indicator Group as a possible
official indicator of the component on Modern Social Security Systems).
The flexibility notion presupposes a “double bind”: high levels of flexibility are required to compete
successfully in a globalized market and thus to afford high levels of employment security (see
Muffels and Luijkx, 2005). However, the differences between Member States may suggest the
presence of possible trade-offs between flexibility and security. An increase in flexibility (via
increased market competition or skill-biased technical change) produces a decrease of security for
employees, especially the low skilled ones (Muffels and Luijkx, 2005). Various strands of the
economic theory offered explanations for the trade-off. The neoclassical theory points out that
generous social protection (high security) and institutional constraints such as minimum wages, and
collective wage bargaining could decrease the flexibility of the labour market slowing down the
adjustment process of the labour force to the challenges of the globalization and economic
downturns. Institutional economics suggests that tight dismissal protection and entry barriers based
on skills could hamper efficiency, and thus flexibility, via additional transaction costs. Another
explanation points to the rise in demand for high skilled workers induced by the “skill biased
technical change” that reduces the demand for low skilled workers (Luddite explanation) who are
thereby forced to accept lower wages and security. A similar justification is given by sociologists:
14 The comparison between clusters is done using both descriptive statistics and an econometric modelling regressing productivity on two factors (representing flexibility and security) obtained using Principal Component Analysis. The model estimated is however not fully described in the paper (nor the results) so we report only the results of the descriptive statistics.
21
globalization and social stratification particularly affects low skilled workers, who as a group are
increasingly exposed to rising employment instability and income insecurity (Muffels and Wilthagen
1013).
Using the European Community Household Panel, Muffels and Luijkx (2005) find evidence that, for
the period 1993-1999 and for male workers, some countries – corporatist and Southern regimes -
behave according to the trade-off theory (an increase in flexibility leads to decreased security), while
others - the social-democrats regimes - behave according to the “double bind” model. Southern
regimes exhibit segmented labour markets with low mobility rates and lag behind countries with
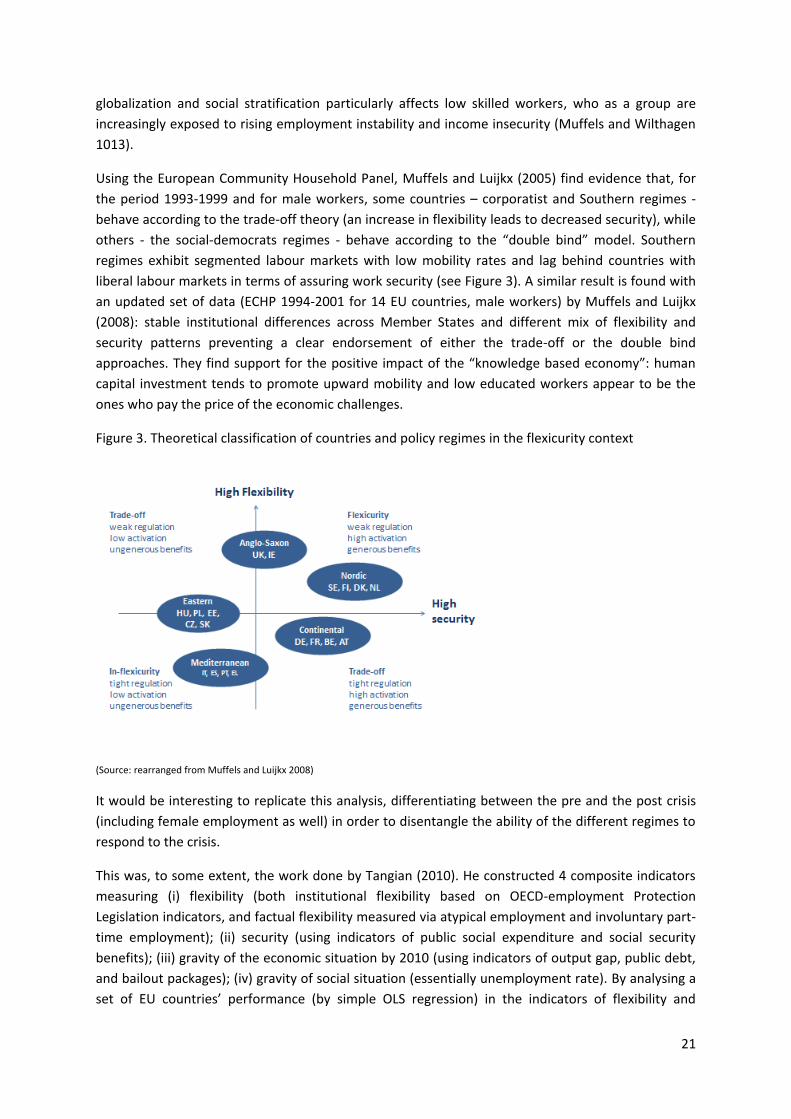
liberal labour markets in terms of assuring work security (see Figure 3). A similar result is found with
an updated set of data (ECHP 1994-2001 for 14 EU countries, male workers) by Muffels and Luijkx
(2008): stable institutional differences across Member States and different mix of flexibility and
security patterns preventing a clear endorsement of either the trade-off or the double bind
approaches. They find support for the positive impact of the “knowledge based economy”: human
capital investment tends to promote upward mobility and low educated workers appear to be the
ones who pay the price of the economic challenges.
Figure 3. Theoretical classification of countries and policy regimes in the flexicurity context
(Source: rearranged from Muffels and Luijkx 2008)
It would be interesting to replicate this analysis, differentiating between the pre and the post crisis
(including female employment as well) in order to disentangle the ability of the different regimes to
respond to the crisis.
This was, to some extent, the work done by Tangian (2010). He constructed 4 composite indicators
measuring (i) flexibility (both institutional flexibility based on OECD-employment Protection
Legislation indicators, and factual flexibility measured via atypical employment and involuntary part-
time employment); (ii) security (using indicators of public social expenditure and social security
benefits); (iii) gravity of the economic situation by 2010 (using indicators of output gap, public debt,
and bailout packages); (iv) gravity of social situation (essentially unemployment rate). By analysing a
set of EU countries’ performance (by simple OLS regression) in the indicators of flexibility and
22
security versus those of gravity Tangian finds that countries with high labour flexibility demonstrate
no macroeconomic advantages. Moreover countries where high level of flexibility is combined with
high levels of security show no advantages either, as the generous social security worsens
macroeconomic performance indicators. The analysis however is based on contemporaneous
correlations and do not take into account that adjustments in economic structures need time to be
visible in terms of economic growth.
The monitoring of Member States’ flexicurity performance using composite indicators has been
proposed by the European Commission (see Manca et al. 2010) with the construction of a set of
composite indicators measuring the 4 flexicurity components proposed by the Commission.
Analysing country scores and rankings, the authors conclude that there is substantial heterogeneity
across EU Member States in terms of how close they are to fulfil flexicurity "requirements".
Geographical clustering in Nordic, Continental, Anglo-Saxon, Mediterranean and New Member
States seems to be confirmed. A similar exercise (but less ambitious in scope and analysis) is done by
Maselli (2010) who constructed a flexicurity index from two composite indicators (security and
flexibility), assembling the indicators corresponding to two stages of the policy cycle, input and
output. Maselli shows, once again, the idiosyncratic preference for flexibility and security of 19 EU
European countries and finds clusters of countries (that only partially overlap with the clusters found
in EC 2007, 2008 and in Muffels and Luijkx 2008 among others). Chung (2012), shows that the
monitoring of state and effort levels (within the ESC model) using composite measures produce
different clustering of countries and highlights the need to clarify at which level of state and effort
flexicurity is addressed.
The approach based on composite indicators, while having the appeal of a summary measure
enabling comparisons and benchmarking, has the disadvantage of hiding trade-offs between
indicators, which could be important in explaining differentiated pathways to flexicurity and country
responses to the current crisis. An additional difficulty is that composites mix together indicators
measuring both state and dynamic concepts (and cause and effects variables), making the overall
evaluation of flexicurity pathways even more difficult.
2.2 Flexicurity practices: new challenges
Most of the specialized literature reports variations in flexicurity regimes by looking at real policies
put in place in specific countries and analyses the impact of these policies in terms of changes in
flexibility or security of workers especially in light of the recent crisis (for an overview of practices
see Eurofound 2010a,b and 2012).
Economic crisis damaged the economic and social fabric everywhere in Europe but with large
differences across countries (see Section 2.3). In 2011 long term unemployment rate is at 1.1% in
Austria while 6.3% in Bulgaria. In Finland the fraction of individuals with a temporary job in 2009
who moved to a permanent job in 2010 was 48.7%, while this figure was 10.6% in France, and 16.4%
in Spain. In the same year, 27.8% of Spanish employees (but also 24.5% of the British) moved to
lower qualification level (employment status and pay) with respect to 2009. This percentage was
23
14.5% in Germany. In 2010 the percentage of adult population (25-64) participating in education
and training was 7.7 in Germany and 32.3 in Denmark while only 1.3 in Romania. In Denmark 1.4% of
2010 GDP is spent in active labour market policies, while in the Netherlands and France this figure is
around 0.8%. Italy, instead, devoted 0.35% of GDP and Greece 2.2%.
Clearly the response to the crisis not only depends on the degree of flexibility or security in place in
different countries, but rests heavily on the institutional configuration which finally limits the
leverage forces for counter-acting actions (Letschke and Watt 2010, and Meardi 2011) and on the
degree to which social partners can act as brokers of divergent interests (Voss, Dornelas, Wild and
Kwiatkiewicz, 2011).
Denmark (together with the Netherlands the home country of flexicurity) displays little protection
against dismissal (high external numerical flexibility in the SFO model), high levels of income security
via generous unemployment benefits and high levels of employment security (with high use of re-
training, see Viebrock and Clasen 2009). The role of social partners is crucial as it enhances workers’
acceptability of easy hiring and firing via the use of generous unemployment insurance system and,
equally for employers makes the costly unemployment system worthwhile given a socially accepted
flexibility in adapting the workforce to the changing market demand. A decreasing trend in
unemployment and an increasing GDP per capita during the 1990s and early 2000s together with the
traditional Scandinavian welfare state that protected the “working poor” contributed to the success
of the model worldwide. The economic crisis however brought rising unemployment levels,
degreased real GDP growth (Figure 4, Figure 5) and scaled back some income security policies
(Jorgensen, 2011) reducing the glittering of the golden triangle.
Flexicurity in the Netherlands has been characterized by less emphasis on activation policies and a
flexibilization of the labour market during the 1990s (with the Flexibility and Security Bill, see
Wilthagen 2007). The increased flexibility was reached by (slightly) reducing the strong protection
granted to workers with standard employment contracts and at the same time by increasing the
protection of workers in flexible employment (via e.g. right to train, wage guarantees,
supplementary pensions). Measures to spread work, care, and education over the lifetime have also
been taken. Similarly to Denmark, the role of social partners has been crucial for the legitimation of
flexicurity in the Netherlands. In recent years, however, the Dutch trade unions criticized the
unbalanced effects of the Flexibility and Security Bill observing lower investments in education and
training, higher feelings of insecurity among workers with temporary contracts and low transition
towards open-ended job contracts (Tros, 2012). As a policy-response to the crisis the Dutch
government introduced further flexibility into the system by increasing the number of repetitions
permitted of a temporary contract before a regular contract has to be started.
In 2009 local Mobility Centers were established in the Netherlands in order to favour job-to-job
mobility (originally, these were independent networks of several actors such as employers, training
institutes, public employment services, private agencies etc., but since 2011 they are integrated into
the structure of public employment). The objective of these Mobility Centers was the construction of
tailor-made program for companies with redundancy problems (though a lot of SME could not enter
the program due to accession conditions), promoting temporary and part-time unemployment
schedules and offering at the same time fast outplacement in case of firing, and assistance for skill
upgrade and skill recognition via training. In 2009 the Dutch government also introduced the Act
24
Investment in Young People offering learn-work trajectories to young unemployed under 27 (local
authorities were obliged to offer such trajectories and young unemployed obliged to accept as
precondition to obtain a welfare allowance). Even if the effectiveness of this plan in reducing youth
unemployment is still under discussion (the plan was formally but not de facto abolished in 2012,
see Tros 2012), positive feedbacks have been observed in longer school participation and training
among young people.
The German response to the economic crisis is different from that of Denmark or the Netherlands
and goes in the direction of an adjustment of working time schedule (Boeri and Brueckner, 2011). In
some months of 2009 there were 1.4 million workers in Germany with short-time work and 30% of
firms implementing some form of reduced work-hours (Tros, 2012). Work-time reduction was also
used as a temporary buffer in Italy (via a “solidarity contract” within firms facing risk of dismissals),
Sweden and Finland (together with transition security measures like Step-in jobs for migrants in
Sweden, or Flexicurity Committees in Finland see Tros, 2012 and Wilthagen, 2012).
With much more flexibility than security, Anglo-Saxon countries (UK and Ireland) responded to the
economic crisis mainly through dismissals (especially of migrants) and informal reduction of working
hours (UK). Ireland pushed lifelong learning through Skillnets, networks of private companies
delivering training, and the UK created the Early Warning System and a Rapid Respond Services to
facilitate job-to-job transition and put in place programs for smoothing the learn-work transition of
youth unemployment (Wilthagen 2012). Strengthening of lifelong learning is also a challenge in
Spain which experienced heavy dismissal of employees (both native and migrants). Spain is indeed
the country with the highest unemployment rate in Europe with a general unemployment rate of
25% and 53,2% of youth unemployment in 2012.
Central and Eastern European countries display, in general, below average performance in flexicurity
and security. The exposure to the globalized market has forced these countries to rationalize
production and contain labour costs, mainly achieved through downsizing, fixed-term contracts and
informal employment (Cazes and Nesporova, 2001 and 2007); the consequent worsening of workers’
employment and social security positions encouraged governments to push for a better balance
between flexibility and security. This response varied depending on national specificities: Baltic and
some Central European countries have implemented flexicurity policies similar to those in the
western countries, while in Balkan countries labour market rigidities persisted together with high
unemployment and weak income security (Cazes and Nesporova, 2003). The Economic crisis hit
eastern countries, increasing unemployment and worsening real GDP growth (see Figure 4, Figure 5).
The worst cases are Latvia where the unemployment rate doubled, reaching 16.2% in 2011, and real
GDP decreased by 14%; and Lithuania where the unemployment rate almost tripled from 5.3% in
2008 to 15.3% in 2011 together with a decrease in real GDP of 8.5%. Poland is an exception
(together with Slovakia) with an increase in unemployment similar to the EU average (reaching 9.6%
in 2011) and an increase in real GDP of 10% in 3 years. The response to these challenges has been
country-specific and mostly managed through redundancies and shortening of working time along
with limited income support (Wilthagen 2012 and Borghouts 2012).
25
3. The dimensions of flexicurity in times of crisis: facts and figures
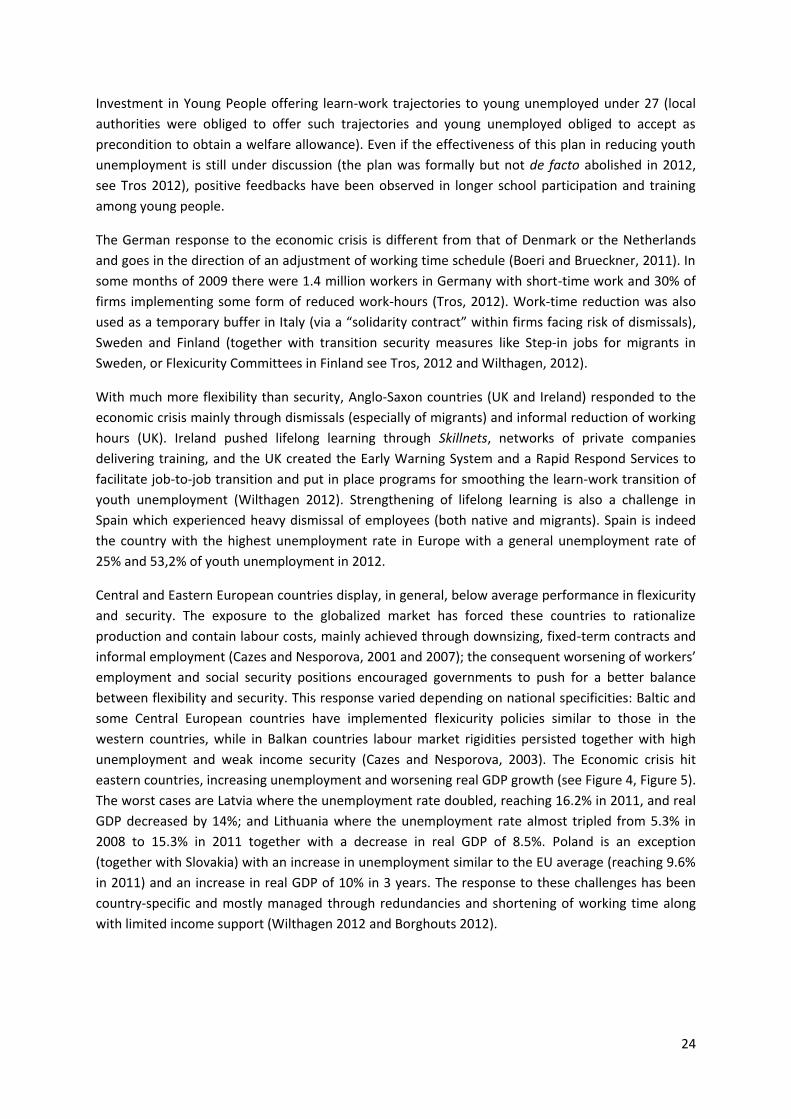
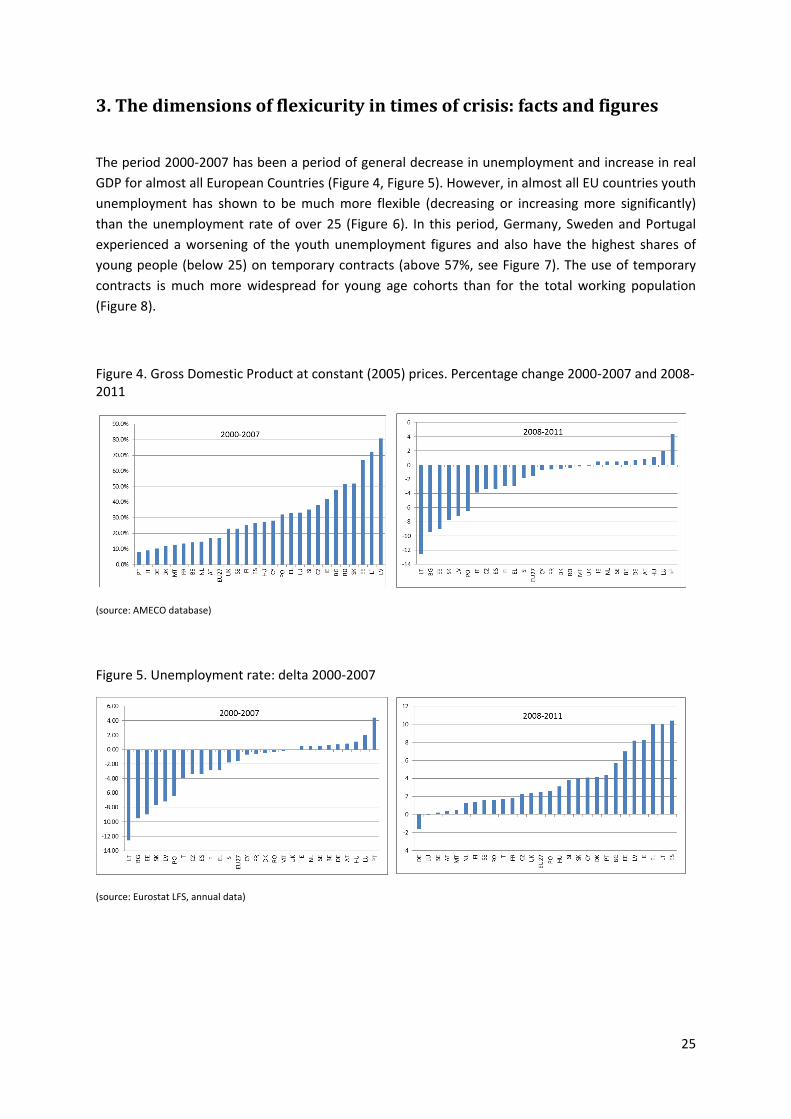
The period 2000-2007 has been a period of general decrease in unemployment and increase in real
GDP for almost all European Countries (Figure 4, Figure 5). However, in almost all EU countries youth
unemployment has shown to be much more flexible (decreasing or increasing more significantly)
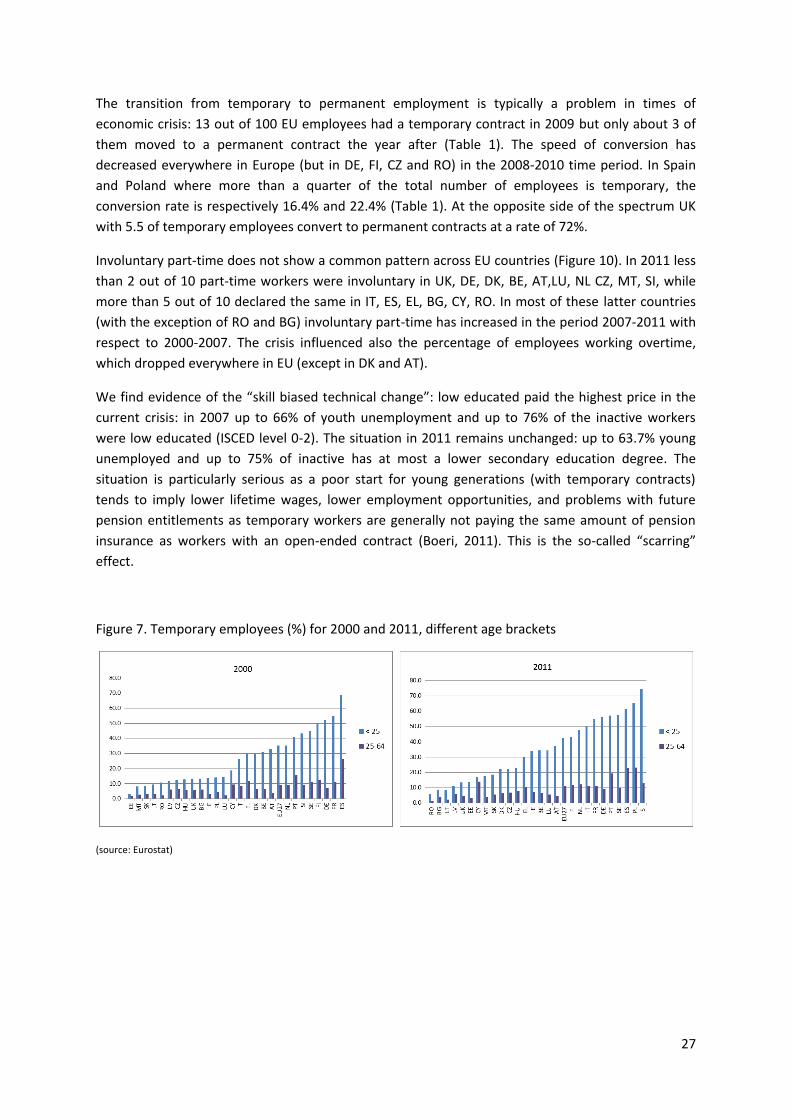
than the unemployment rate of over 25 (Figure 6). In this period, Germany, Sweden and Portugal
experienced a worsening of the youth unemployment figures and also have the highest shares of
young people (below 25) on temporary contracts (above 57%, see Figure 7). The use of temporary
contracts is much more widespread for young age cohorts than for the total working population
(Figure 8).
Figure 4. Gross Domestic Product at constant (2005) prices. Percentage change 2000-2007 and 2008-2011
(source: AMECO database)
Figure 5. Unemployment rate: delta 2000-2007
(source: Eurostat LFS, annual data)
26
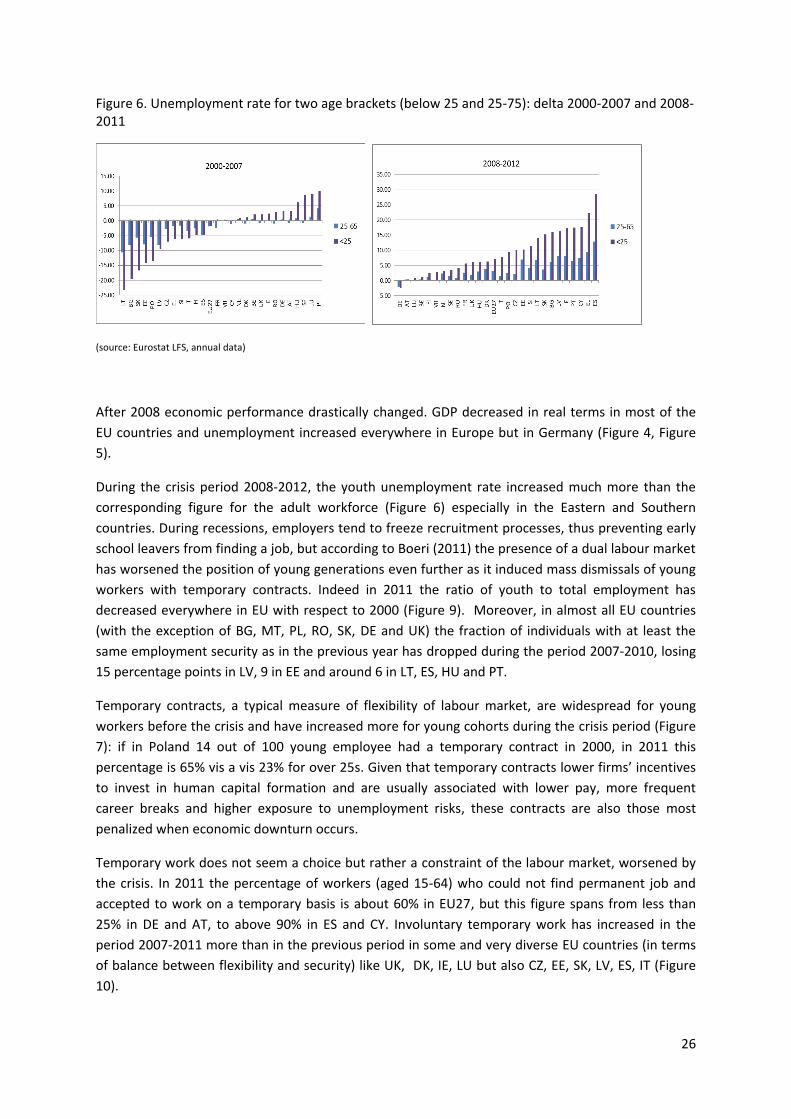
Figure 6. Unemployment rate for two age brackets (below 25 and 25-75): delta 2000-2007 and 2008-2011
(source: Eurostat LFS, annual data)
After 2008 economic performance drastically changed. GDP decreased in real terms in most of the
EU countries and unemployment increased everywhere in Europe but in Germany (Figure 4, Figure
5).
During the crisis period 2008-2012, the youth unemployment rate increased much more than the
corresponding figure for the adult workforce (Figure 6) especially in the Eastern and Southern
countries. During recessions, employers tend to freeze recruitment processes, thus preventing early
school leavers from finding a job, but according to Boeri (2011) the presence of a dual labour market
has worsened the position of young generations even further as it induced mass dismissals of young
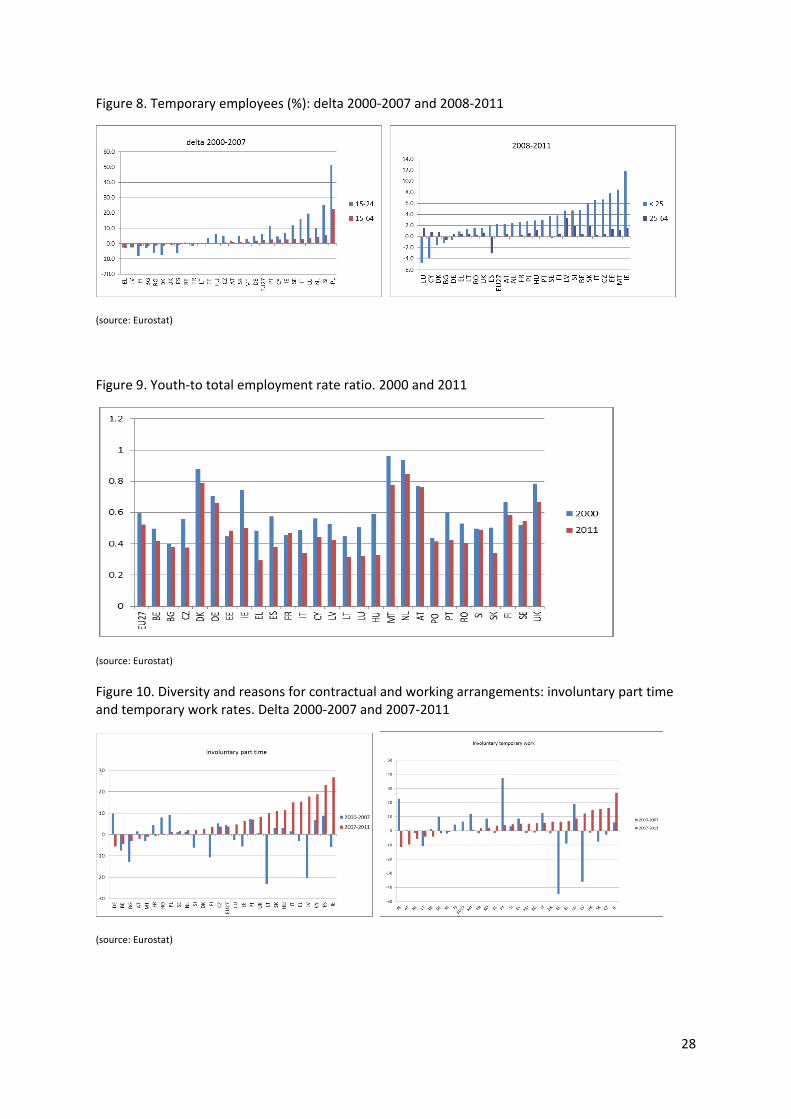
workers with temporary contracts. Indeed in 2011 the ratio of youth to total employment has
decreased everywhere in EU with respect to 2000 (Figure 9). Moreover, in almost all EU countries
(with the exception of BG, MT, PL, RO, SK, DE and UK) the fraction of individuals with at least the
same employment security as in the previous year has dropped during the period 2007-2010, losing
15 percentage points in LV, 9 in EE and around 6 in LT, ES, HU and PT.
Temporary contracts, a typical measure of flexibility of labour market, are widespread for young
workers before the crisis and have increased more for young cohorts during the crisis period (Figure
7): if in Poland 14 out of 100 young employee had a temporary contract in 2000, in 2011 this
percentage is 65% vis a vis 23% for over 25s. Given that temporary contracts lower firms’ incentives
to invest in human capital formation and are usually associated with lower pay, more frequent
career breaks and higher exposure to unemployment risks, these contracts are also those most
penalized when economic downturn occurs.
Temporary work does not seem a choice but rather a constraint of the labour market, worsened by
the crisis. In 2011 the percentage of workers (aged 15-64) who could not find permanent job and
accepted to work on a temporary basis is about 60% in EU27, but this figure spans from less than
25% in DE and AT, to above 90% in ES and CY. Involuntary temporary work has increased in the
period 2007-2011 more than in the previous period in some and very diverse EU countries (in terms
of balance between flexibility and security) like UK, DK, IE, LU but also CZ, EE, SK, LV, ES, IT (Figure
10).
27
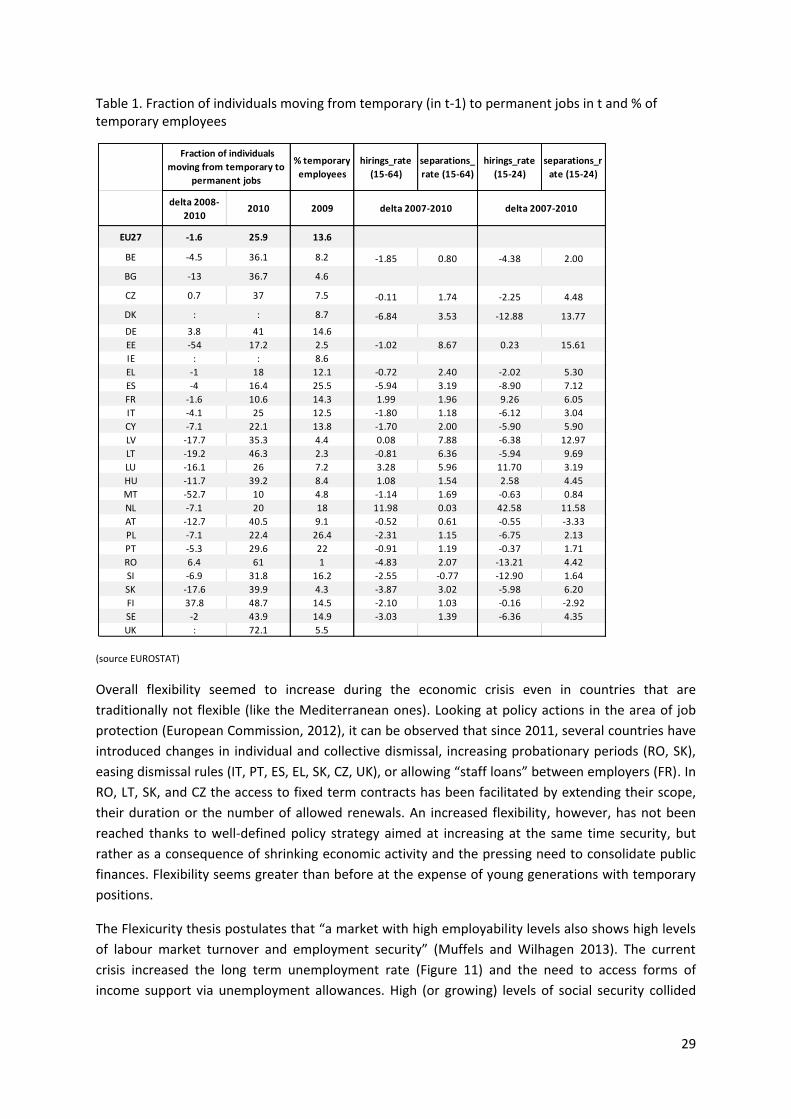
The transition from temporary to permanent employment is typically a problem in times of
economic crisis: 13 out of 100 EU employees had a temporary contract in 2009 but only about 3 of
them moved to a permanent contract the year after (Table 1). The speed of conversion has
decreased everywhere in Europe (but in DE, FI, CZ and RO) in the 2008-2010 time period. In Spain
and Poland where more than a quarter of the total number of employees is temporary, the
conversion rate is respectively 16.4% and 22.4% (Table 1). At the opposite side of the spectrum UK
with 5.5 of temporary employees convert to permanent contracts at a rate of 72%.
Involuntary part-time does not show a common pattern across EU countries (Figure 10). In 2011 less
than 2 out of 10 part-time workers were involuntary in UK, DE, DK, BE, AT,LU, NL CZ, MT, SI, while
more than 5 out of 10 declared the same in IT, ES, EL, BG, CY, RO. In most of these latter countries
(with the exception of RO and BG) involuntary part-time has increased in the period 2007-2011 with
respect to 2000-2007. The crisis influenced also the percentage of employees working overtime,
which dropped everywhere in EU (except in DK and AT).
We find evidence of the “skill biased technical change”: low educated paid the highest price in the
current crisis: in 2007 up to 66% of youth unemployment and up to 76% of the inactive workers
were low educated (ISCED level 0-2). The situation in 2011 remains unchanged: up to 63.7% young
unemployed and up to 75% of inactive has at most a lower secondary education degree. The
situation is particularly serious as a poor start for young generations (with temporary contracts)
tends to imply lower lifetime wages, lower employment opportunities, and problems with future
pension entitlements as temporary workers are generally not paying the same amount of pension
insurance as workers with an open-ended contract (Boeri, 2011). This is the so-called “scarring”
effect.
Figure 7. Temporary employees (%) for 2000 and 2011, different age brackets
(source: Eurostat)
28
Figure 8. Temporary employees (%): delta 2000-2007 and 2008-2011
(source: Eurostat)
Figure 9. Youth-to total employment rate ratio. 2000 and 2011
(source: Eurostat)
Figure 10. Diversity and reasons for contractual and working arrangements: involuntary part time and temporary work rates. Delta 2000-2007 and 2007-2011
(source: Eurostat)
29
Table 1. Fraction of individuals moving from temporary (in t-1) to permanent jobs in t and % of temporary employees
(source EUROSTAT)
Overall flexibility seemed to increase during the economic crisis even in countries that are
traditionally not flexible (like the Mediterranean ones). Looking at policy actions in the area of job
protection (European Commission, 2012), it can be observed that since 2011, several countries have
introduced changes in individual and collective dismissal, increasing probationary periods (RO, SK),
easing dismissal rules (IT, PT, ES, EL, SK, CZ, UK), or allowing “staff loans” between employers (FR). In
RO, LT, SK, and CZ the access to fixed term contracts has been facilitated by extending their scope,
their duration or the number of allowed renewals. An increased flexibility, however, has not been
reached thanks to well-defined policy strategy aimed at increasing at the same time security, but
rather as a consequence of shrinking economic activity and the pressing need to consolidate public
finances. Flexibility seems greater than before at the expense of young generations with temporary
positions.
The Flexicurity thesis postulates that “a market with high employability levels also shows high levels
of labour market turnover and employment security” (Muffels and Wilhagen 2013). The current
crisis increased the long term unemployment rate (Figure 11) and the need to access forms of
income support via unemployment allowances. High (or growing) levels of social security collided
% temporary
employees
hirings_rate
(15-64)
separations_
rate (15-64)
hirings_rate
(15-24)
separations_r
ate (15-24)
delta 2008-
20102010 2009
EU27 -1.6 25.9 13.6
BE -4.5 36.1 8.2 -1.85 0.80 -4.38 2.00
BG -13 36.7 4.6
CZ 0.7 37 7.5 -0.11 1.74 -2.25 4.48
DK : : 8.7 -6.84 3.53 -12.88 13.77
DE 3.8 41 14.6
EE -54 17.2 2.5 -1.02 8.67 0.23 15.61
IE : : 8.6
EL -1 18 12.1 -0.72 2.40 -2.02 5.30
ES -4 16.4 25.5 -5.94 3.19 -8.90 7.12
FR -1.6 10.6 14.3 1.99 1.96 9.26 6.05
IT -4.1 25 12.5 -1.80 1.18 -6.12 3.04
CY -7.1 22.1 13.8 -1.70 2.00 -5.90 5.90
LV -17.7 35.3 4.4 0.08 7.88 -6.38 12.97
LT -19.2 46.3 2.3 -0.81 6.36 -5.94 9.69
LU -16.1 26 7.2 3.28 5.96 11.70 3.19
HU -11.7 39.2 8.4 1.08 1.54 2.58 4.45
MT -52.7 10 4.8 -1.14 1.69 -0.63 0.84
NL -7.1 20 18 11.98 0.03 42.58 11.58
AT -12.7 40.5 9.1 -0.52 0.61 -0.55 -3.33
PL -7.1 22.4 26.4 -2.31 1.15 -6.75 2.13
PT -5.3 29.6 22 -0.91 1.19 -0.37 1.71
RO 6.4 61 1 -4.83 2.07 -13.21 4.42
SI -6.9 31.8 16.2 -2.55 -0.77 -12.90 1.64
SK -17.6 39.9 4.3 -3.87 3.02 -5.98 6.20
FI 37.8 48.7 14.5 -2.10 1.03 -0.16 -2.92
SE -2 43.9 14.9 -3.03 1.39 -6.36 4.35
UK : 72.1 5.5
delta 2007-2010
Fraction of individuals
moving from temporary to
permanent jobs
delta 2007-2010
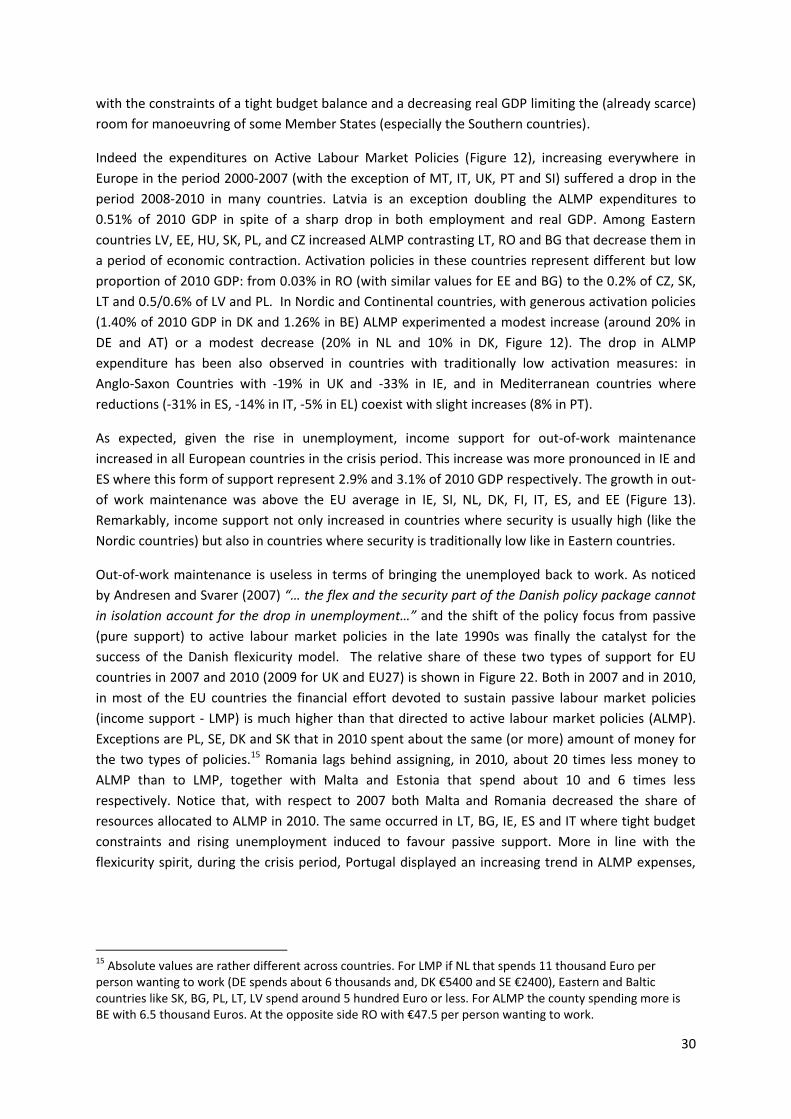
30
with the constraints of a tight budget balance and a decreasing real GDP limiting the (already scarce)
room for manoeuvring of some Member States (especially the Southern countries).
Indeed the expenditures on Active Labour Market Policies (Figure 12), increasing everywhere in
Europe in the period 2000-2007 (with the exception of MT, IT, UK, PT and SI) suffered a drop in the
period 2008-2010 in many countries. Latvia is an exception doubling the ALMP expenditures to
0.51% of 2010 GDP in spite of a sharp drop in both employment and real GDP. Among Eastern
countries LV, EE, HU, SK, PL, and CZ increased ALMP contrasting LT, RO and BG that decrease them in
a period of economic contraction. Activation policies in these countries represent different but low
proportion of 2010 GDP: from 0.03% in RO (with similar values for EE and BG) to the 0.2% of CZ, SK,
LT and 0.5/0.6% of LV and PL. In Nordic and Continental countries, with generous activation policies
(1.40% of 2010 GDP in DK and 1.26% in BE) ALMP experimented a modest increase (around 20% in
DE and AT) or a modest decrease (20% in NL and 10% in DK, Figure 12). The drop in ALMP
expenditure has been also observed in countries with traditionally low activation measures: in
Anglo-Saxon Countries with -19% in UK and -33% in IE, and in Mediterranean countries where
reductions (-31% in ES, -14% in IT, -5% in EL) coexist with slight increases (8% in PT).
As expected, given the rise in unemployment, income support for out-of-work maintenance
increased in all European countries in the crisis period. This increase was more pronounced in IE and
ES where this form of support represent 2.9% and 3.1% of 2010 GDP respectively. The growth in out-
of work maintenance was above the EU average in IE, SI, NL, DK, FI, IT, ES, and EE (Figure 13).
Remarkably, income support not only increased in countries where security is usually high (like the
Nordic countries) but also in countries where security is traditionally low like in Eastern countries.
Out-of-work maintenance is useless in terms of bringing the unemployed back to work. As noticed
by Andresen and Svarer (2007) “… the flex and the security part of the Danish policy package cannot
in isolation account for the drop in unemployment…” and the shift of the policy focus from passive
(pure support) to active labour market policies in the late 1990s was finally the catalyst for the
success of the Danish flexicurity model. The relative share of these two types of support for EU
countries in 2007 and 2010 (2009 for UK and EU27) is shown in Figure 22. Both in 2007 and in 2010,
in most of the EU countries the financial effort devoted to sustain passive labour market policies
(income support - LMP) is much higher than that directed to active labour market policies (ALMP).
Exceptions are PL, SE, DK and SK that in 2010 spent about the same (or more) amount of money for
the two types of policies.15 Romania lags behind assigning, in 2010, about 20 times less money to
ALMP than to LMP, together with Malta and Estonia that spend about 10 and 6 times less
respectively. Notice that, with respect to 2007 both Malta and Romania decreased the share of
resources allocated to ALMP in 2010. The same occurred in LT, BG, IE, ES and IT where tight budget
constraints and rising unemployment induced to favour passive support. More in line with the
flexicurity spirit, during the crisis period, Portugal displayed an increasing trend in ALMP expenses,
15 Absolute values are rather different across countries. For LMP if NL that spends 11 thousand Euro per person wanting to work (DE spends about 6 thousands and, DK €5400 and SE €2400), Eastern and Baltic countries like SK, BG, PL, LT, LV spend around 5 hundred Euro or less. For ALMP the county spending more is BE with 6.5 thousand Euros. At the opposite side RO with €47.5 per person wanting to work.
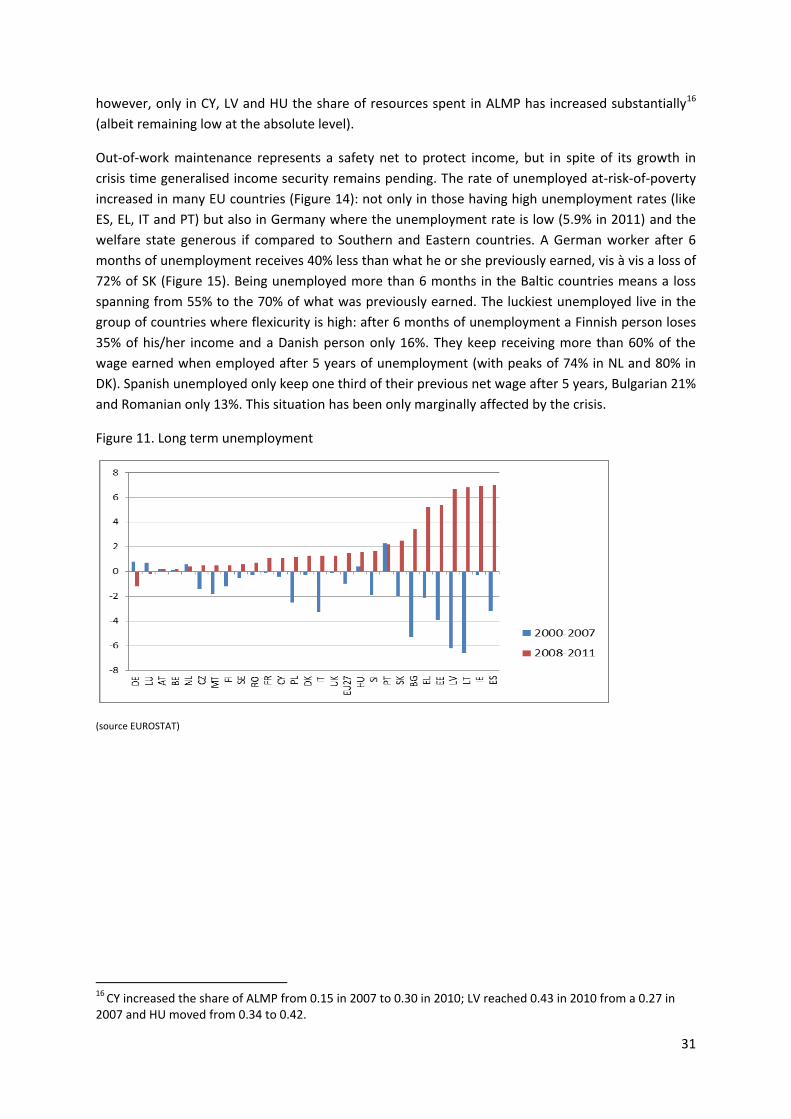
31
however, only in CY, LV and HU the share of resources spent in ALMP has increased substantially16
(albeit remaining low at the absolute level).
Out-of-work maintenance represents a safety net to protect income, but in spite of its growth in
crisis time generalised income security remains pending. The rate of unemployed at-risk-of-poverty
increased in many EU countries (Figure 14): not only in those having high unemployment rates (like
ES, EL, IT and PT) but also in Germany where the unemployment rate is low (5.9% in 2011) and the
welfare state generous if compared to Southern and Eastern countries. A German worker after 6
months of unemployment receives 40% less than what he or she previously earned, vis à vis a loss of
72% of SK (Figure 15). Being unemployed more than 6 months in the Baltic countries means a loss
spanning from 55% to the 70% of what was previously earned. The luckiest unemployed live in the
group of countries where flexicurity is high: after 6 months of unemployment a Finnish person loses
35% of his/her income and a Danish person only 16%. They keep receiving more than 60% of the
wage earned when employed after 5 years of unemployment (with peaks of 74% in NL and 80% in
DK). Spanish unemployed only keep one third of their previous net wage after 5 years, Bulgarian 21%
and Romanian only 13%. This situation has been only marginally affected by the crisis.
Figure 11. Long term unemployment
(source EUROSTAT)
16 CY increased the share of ALMP from 0.15 in 2007 to 0.30 in 2010; LV reached 0.43 in 2010 from a 0.27 in 2007 and HU moved from 0.34 to 0.42.
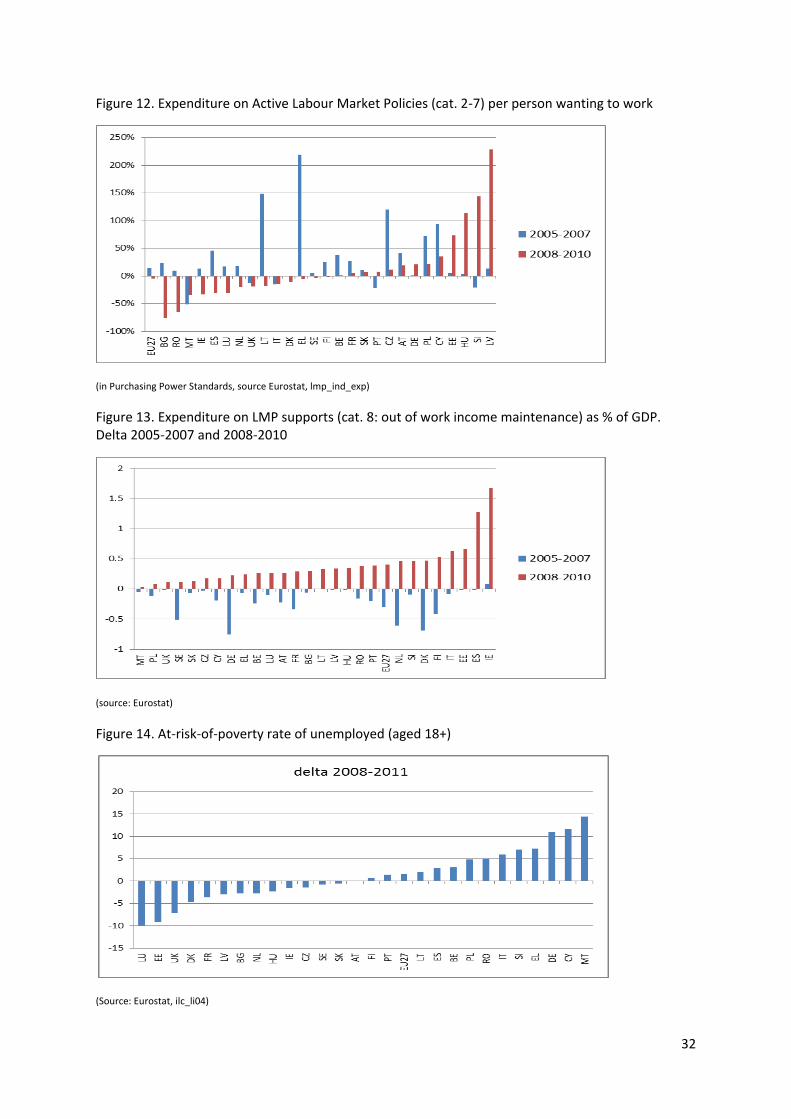
32
Figure 12. Expenditure on Active Labour Market Policies (cat. 2-7) per person wanting to work
(in Purchasing Power Standards, source Eurostat, lmp_ind_exp)
Figure 13. Expenditure on LMP supports (cat. 8: out of work income maintenance) as % of GDP. Delta 2005-2007 and 2008-2010
(source: Eurostat)
Figure 14. At-risk-of-poverty rate of unemployed (aged 18+)
(Source: Eurostat, ilc_li04)
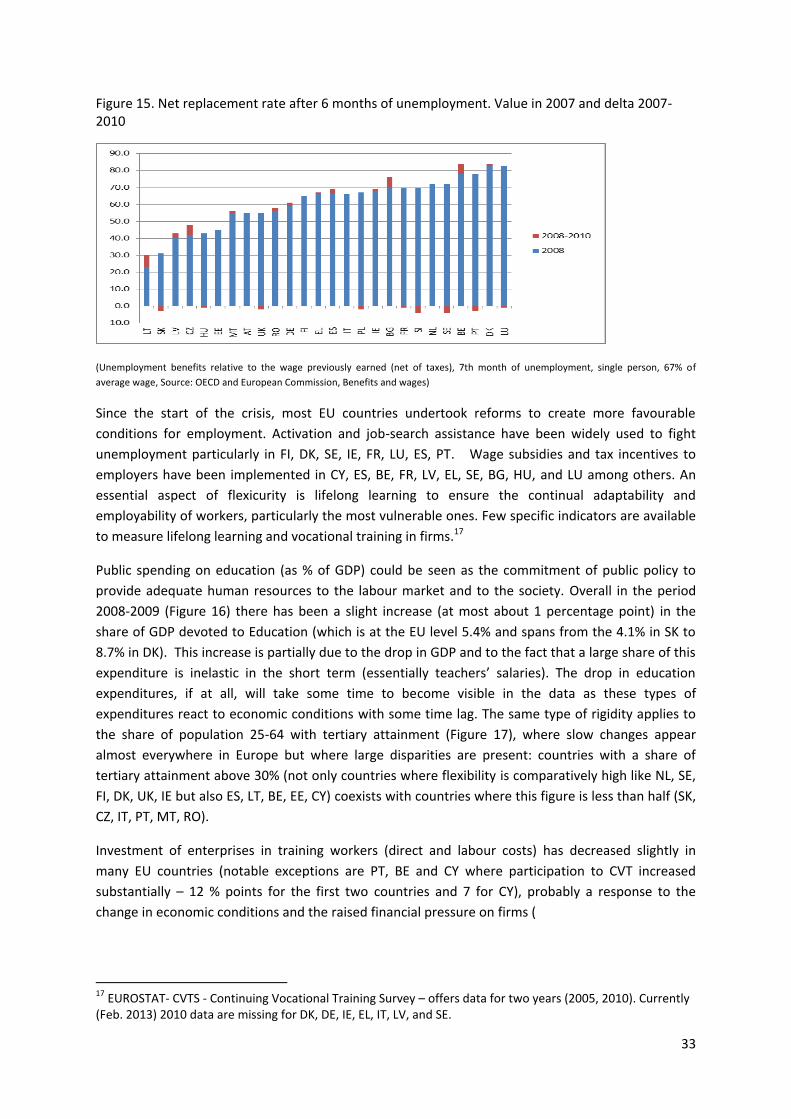
33
Figure 15. Net replacement rate after 6 months of unemployment. Value in 2007 and delta 2007-2010
(Unemployment benefits relative to the wage previously earned (net of taxes), 7th month of unemployment, single person, 67% of
average wage, Source: OECD and European Commission, Benefits and wages)
Since the start of the crisis, most EU countries undertook reforms to create more favourable
conditions for employment. Activation and job-search assistance have been widely used to fight
unemployment particularly in FI, DK, SE, IE, FR, LU, ES, PT. Wage subsidies and tax incentives to
employers have been implemented in CY, ES, BE, FR, LV, EL, SE, BG, HU, and LU among others. An
essential aspect of flexicurity is lifelong learning to ensure the continual adaptability and
employability of workers, particularly the most vulnerable ones. Few specific indicators are available
to measure lifelong learning and vocational training in firms.17
Public spending on education (as % of GDP) could be seen as the commitment of public policy to
provide adequate human resources to the labour market and to the society. Overall in the period
2008-2009 (Figure 16) there has been a slight increase (at most about 1 percentage point) in the
share of GDP devoted to Education (which is at the EU level 5.4% and spans from the 4.1% in SK to
8.7% in DK). This increase is partially due to the drop in GDP and to the fact that a large share of this
expenditure is inelastic in the short term (essentially teachers’ salaries). The drop in education
expenditures, if at all, will take some time to become visible in the data as these types of
expenditures react to economic conditions with some time lag. The same type of rigidity applies to
the share of population 25-64 with tertiary attainment (Figure 17), where slow changes appear
almost everywhere in Europe but where large disparities are present: countries with a share of
tertiary attainment above 30% (not only countries where flexibility is comparatively high like NL, SE,
FI, DK, UK, IE but also ES, LT, BE, EE, CY) coexists with countries where this figure is less than half (SK,
CZ, IT, PT, MT, RO).
Investment of enterprises in training workers (direct and labour costs) has decreased slightly in
many EU countries (notable exceptions are PT, BE and CY where participation to CVT increased
substantially – 12 % points for the first two countries and 7 for CY), probably a response to the
change in economic conditions and the raised financial pressure on firms (
17 EUROSTAT- CVTS - Continuing Vocational Training Survey – offers data for two years (2005, 2010). Currently (Feb. 2013) 2010 data are missing for DK, DE, IE, EL, IT, LV, and SE.
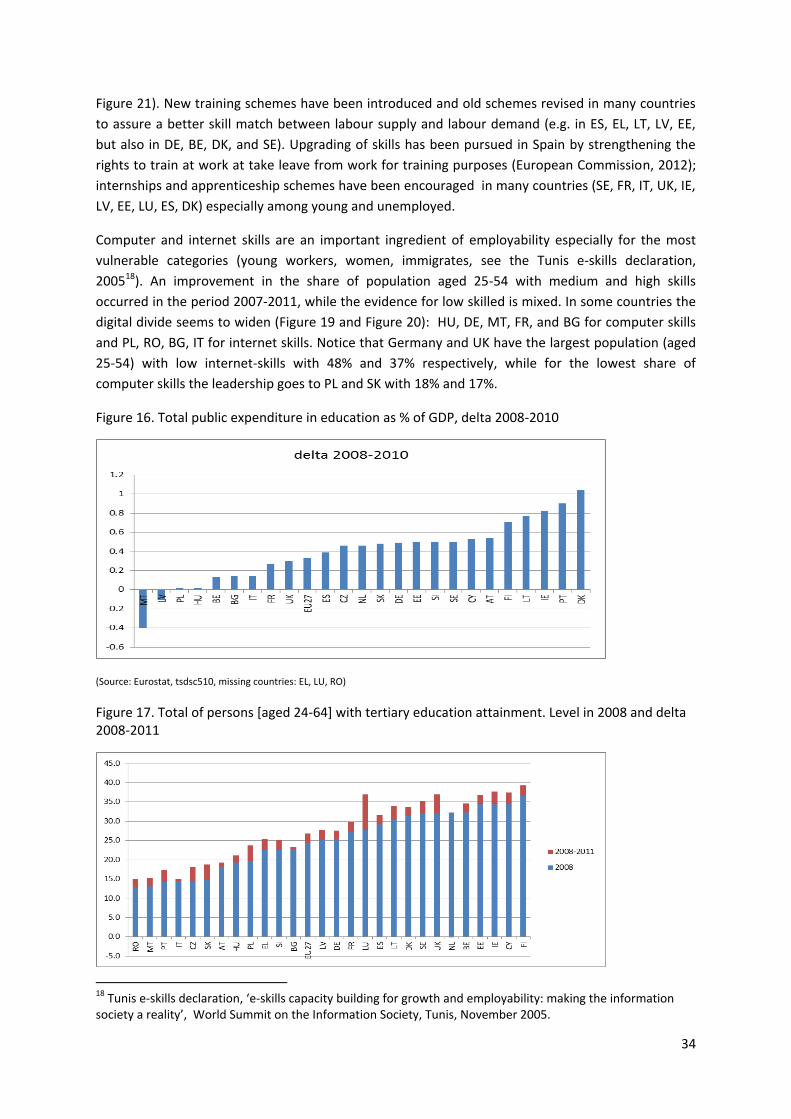
34
Figure 21). New training schemes have been introduced and old schemes revised in many countries
to assure a better skill match between labour supply and labour demand (e.g. in ES, EL, LT, LV, EE,
but also in DE, BE, DK, and SE). Upgrading of skills has been pursued in Spain by strengthening the
rights to train at work at take leave from work for training purposes (European Commission, 2012);
internships and apprenticeship schemes have been encouraged in many countries (SE, FR, IT, UK, IE,
LV, EE, LU, ES, DK) especially among young and unemployed.
Computer and internet skills are an important ingredient of employability especially for the most
vulnerable categories (young workers, women, immigrates, see the Tunis e-skills declaration,
200518). An improvement in the share of population aged 25-54 with medium and high skills
occurred in the period 2007-2011, while the evidence for low skilled is mixed. In some countries the
digital divide seems to widen (Figure 19 and Figure 20): HU, DE, MT, FR, and BG for computer skills
and PL, RO, BG, IT for internet skills. Notice that Germany and UK have the largest population (aged
25-54) with low internet-skills with 48% and 37% respectively, while for the lowest share of
computer skills the leadership goes to PL and SK with 18% and 17%.
Figure 16. Total public expenditure in education as % of GDP, delta 2008-2010
(Source: Eurostat, tsdsc510, missing countries: EL, LU, RO)
Figure 17. Total of persons [aged 24-64] with tertiary education attainment. Level in 2008 and delta 2008-2011
18 Tunis e-skills declaration, ‘e-skills capacity building for growth and employability: making the information society a reality’, World Summit on the Information Society, Tunis, November 2005.
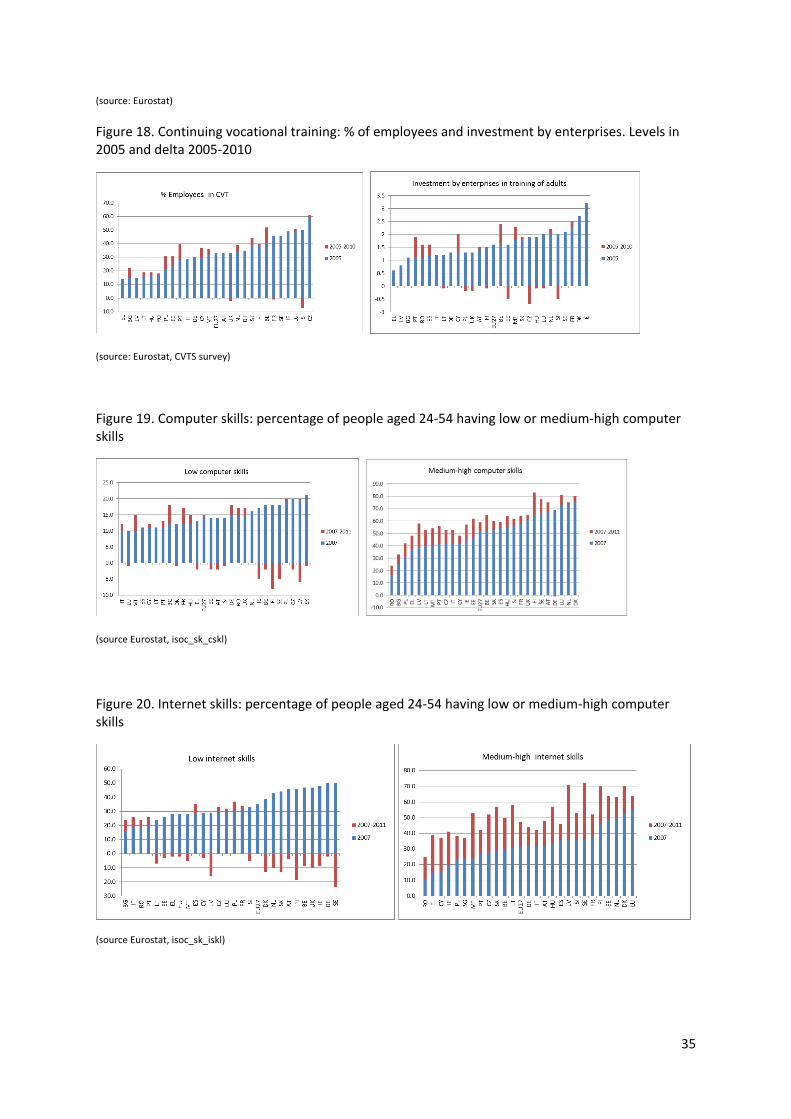
35
(source: Eurostat)
Figure 18. Continuing vocational training: % of employees and investment by enterprises. Levels in 2005 and delta 2005-2010
(source: Eurostat, CVTS survey)
Figure 19. Computer skills: percentage of people aged 24-54 having low or medium-high computer skills
(source Eurostat, isoc_sk_cskl)
Figure 20. Internet skills: percentage of people aged 24-54 having low or medium-high computer skills
(source Eurostat, isoc_sk_iskl)
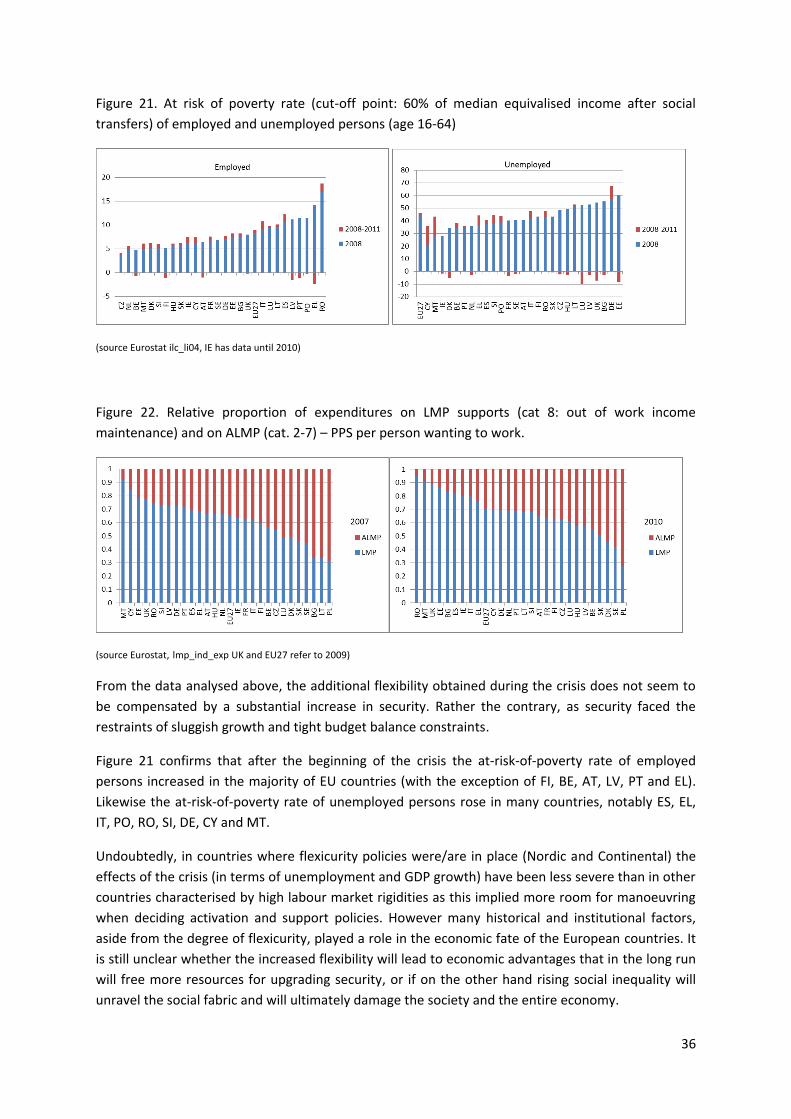
36
Figure 21. At risk of poverty rate (cut-off point: 60% of median equivalised income after social
transfers) of employed and unemployed persons (age 16-64)
(source Eurostat ilc_li04, IE has data until 2010)
Figure 22. Relative proportion of expenditures on LMP supports (cat 8: out of work income
maintenance) and on ALMP (cat. 2-7) – PPS per person wanting to work.
(source Eurostat, lmp_ind_exp UK and EU27 refer to 2009)
From the data analysed above, the additional flexibility obtained during the crisis does not seem to
be compensated by a substantial increase in security. Rather the contrary, as security faced the
restraints of sluggish growth and tight budget balance constraints.
Figure 21 confirms that after the beginning of the crisis the at-risk-of-poverty rate of employed
persons increased in the majority of EU countries (with the exception of FI, BE, AT, LV, PT and EL).
Likewise the at-risk-of-poverty rate of unemployed persons rose in many countries, notably ES, EL,
IT, PO, RO, SI, DE, CY and MT.
Undoubtedly, in countries where flexicurity policies were/are in place (Nordic and Continental) the
effects of the crisis (in terms of unemployment and GDP growth) have been less severe than in other
countries characterised by high labour market rigidities as this implied more room for manoeuvring
when deciding activation and support policies. However many historical and institutional factors,
aside from the degree of flexicurity, played a role in the economic fate of the European countries. It
is still unclear whether the increased flexibility will lead to economic advantages that in the long run
will free more resources for upgrading security, or if on the other hand rising social inequality will
unravel the social fabric and will ultimately damage the society and the entire economy.

37
4. Flexicurity in Europe: analysis of the EMCO and EMCO-modified list
of indicators and proposal of a reclassification
The monitoring of flexicurity achievements was taken forward with the endorsement of a list of
indicators (EMCO-list19) by member States. Then, a revised and enriched list of indicators (EMCO-
modified list) was even proposed in 2010.
This section presents an up to date statistical analysis of the EMCO and the EMCO-modified lists of
indicators adopted by the European Commission to monitor the four component of flexicurity. We
highlight the major existing problems with data or definitions and provide a concise evaluation of
statistical coherence for each indicator in each component in every country in order to obtain an
appraisal of the relative performance of each EU Member State.
Both analysis and reclassification have been presented and discussed at the Employment Committee
(EMCO, sessions of October and November 2012). The reclassification proposal has been finally
endorsed by EMCO with minor changes.
Below are the four policy components of flexicurity (which the present section focuses on) that were
also reaffirmed within the EU-2020 strategy:
1. Flexible and reliable contractual arrangements;
2. Comprehensive lifelong learning strategies;
3. Effective labour market policies;
4. Modern social security systems (further divided in: 4.a. Social security systems and 4.b.
Reconciliation of work and private life).
19 EMCO/25/240609
38
4.1 Flexible and reliable contractual arrangements
The component on flexible and reliable contractual arrangements aims to capture the first part of
flexicurity dimension: the flexibility in the labour market allowing companies to make quick and
efficient adjustments to their workforces.
According to the economic theory, employment regulation must facilitate these necessary flexible
work arrangements both externally and internally. The more restrictive employment law is, the
higher the probability is that companies start using “non-standard” contracts to achieve the
flexibility that they need. Furthermore, rigid employment legislations are an unnecessary cost
burden for companies in Europe.
The set of 9 indicators proposed to measure this first component are detailed in the following
paragraph. Indicators are heterogeneous in terms of data-type and time coverage, so we use
standardization methods (i.e. z-score) to reach a homogeneous ground for comparison.
All but the first one, Access to flexitime, are included in the EMCO-modified list.
Indicators
1. Access to flexitime (source: Labour Force Survey (LFS) ad hoc module; 21.A4). This indicator
measures the percentage of employees with flexible working time arrangements. It’s not included in
EMCO-modified list and data is available for 2004 only.
2. Employment Protection Legislation of temporary workers vs. regular workers (source: OECD). This composite indicator quantifies the regulation of fixed-term and temporary forms of employment. Overall 21 basic items are classified in three main areas: (i) protection of regular workers against dismissal; (ii) regulation of temporary employment; (iii) specific requirements for collective dismissals. Data is available for a subset of EU countries from 2000 to 2004 while almost complete data series are available from 2005 to 2008. Only two data points exist for 2009. 3. Diversity and reasons for contractual and working arrangements (source: LFS; 21.M2). This is a
measure of the share of employees working in permanent contracts or in voluntary fixed-term or
part-time contracts. Data is available from 2000 to 2011. For the present analysis we used the Total
employees in part-time and/or fixed-term contracts plus total self-employed as % of persons in
employment although data is also available for the following three sub-definitions of this indicator
(but it is unclear what has to be considered):
1. “Total employees part-time and/or fixed-term contracts plus total self-employed as % of
persons in employment”;
2. “Employees in non-standard employment (part-time and/or fixed-term) as % of total
employees”. This indicator also has several sub-specifications;
3. “Total self-employed as % of total persons in employment”. This indicator is then sub-
classified into “part-time” and “total”.
39
EMCO-IG finally decided to include two separate indicators of Diversity: the share of involuntary
part-time and the share of involuntary fixed term contracts.
4. Employees with overtime work measures the percentage of employees working overtime. Data is from 2000 to 2010. This indicator has exactly the same reference (EMCO 21.A3) as that attached to Overtime hours. EUROSTAT does not provide a differentiation between work and hours except for 2004 (LFS ad hoc module), where many possible series can be taken. It is not clear whether the distinction between hours and work has to be conserved and if this is the case which series for overtime work need to be chosen. 5. Transition by contract (source: Eurostat Survey on Income and Living Conditions – EU-SILC)
measures the fraction of individuals with at least the same employment security as the previous
year. Data is from 2006 to 2010 (few data points in 2011). Data is updated in EUROSTAT databases
[Labour transitions by type of contract - Changes in employment security, ilc_lvhl33].
6. Overtime hours (source: LFS ad hoc module). Data available for 2004 (see above Employees with overtime work). 7. Job tenure (source: LFS; PA2-S4). It’s measured in years and data is available from 2000 to 2011.
8. Labour turnover (hires and separations) (source: LFS) measures the number of workers who either
change employment status (e.g. from employment to unemployment) or move between jobs.
Labour Turnover is the sum of the two components – the number of hirings and the number of
separations. Data are available from 2000 to 2010 for all EU countries but DE, UK and IE (complete
series for all but DE, UK, IE only from 2008).
9. Transition from temporary to permanent employment (source: EU-SILC) measures the percentage
of individuals moving from temporary to permanent jobs over total or neutral transitions. Data is
available from 2006 to 2010 (few data points in 2011). Data is updated in EUROSTAT databases
[Labour transitions by type of contract, ilc_lvhl32].
Difference with the Joint Assessment Framework20
The Overall indicator and most of the sub-indicators of JAF (Policy Area 2 Enhancing labour market
functioning, combating segmentation) are included in the EMCO-modified list (Figure 23 and Figure
24). Exceptions are the breakdowns by gender of the overall indicator (Transition by type of
contract), present in JAF but not in the EMCO-modified list (nor in the EMCO list).
20 Foundations and structures for a Joint Assessment Framework (JAF), including an Employment Performance Monitor (EPM), to monitor the Employment Guidelines under Europe 2020 . The JAF considered was that prior to the revision taking place since mid-2012 and not yet finalised.
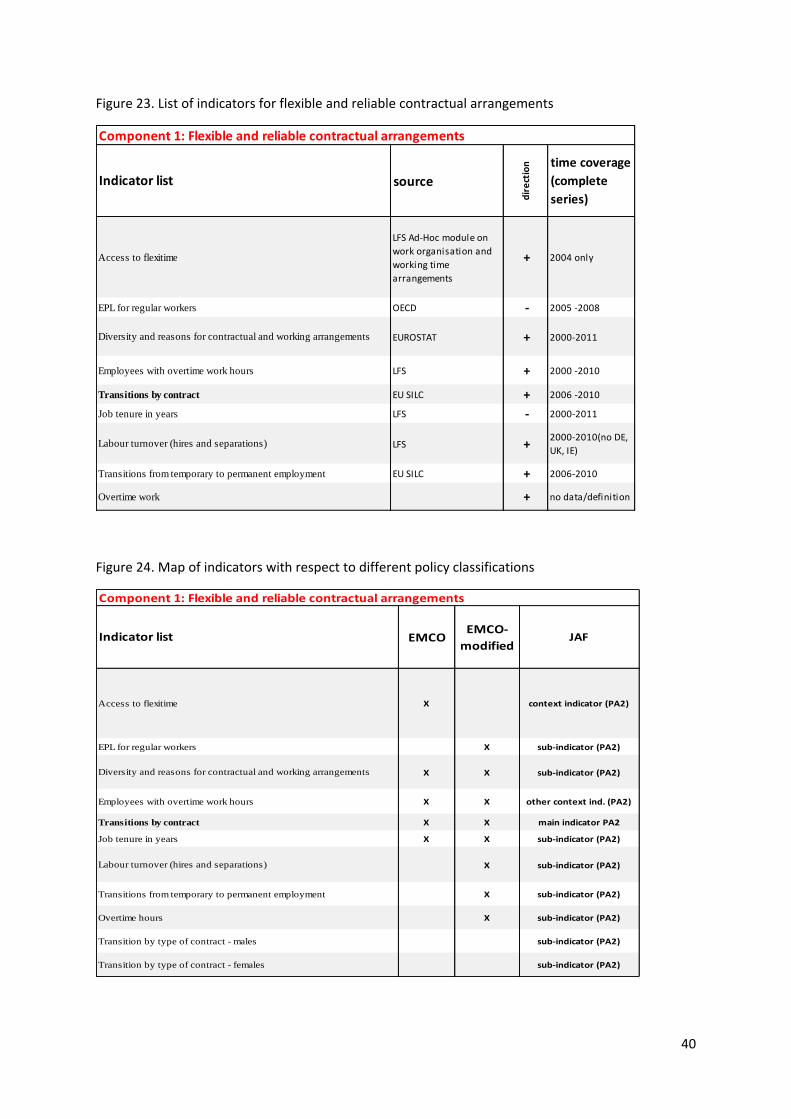
40
Figure 23. List of indicators for flexible and reliable contractual arrangements
Figure 24. Map of indicators with respect to different policy classifications
Component 1: Flexible and reliable contractual arrangements
source
dir
ect
ion time coverage
(complete
series)
LFS Ad-Hoc module on
work organisation and
working time
arrangements
+ 2004 only
OECD - 2005 -2008
EUROSTAT + 2000-2011
LFS + 2000 -2010
EU SILC + 2006 -2010
LFS - 2000-2011
LFS +2000-2010(no DE,
UK, IE)
Transitions from temporary to permanent employment EU SILC + 2006-2010
Overtime work + no data/definition
Transitions by contract
Indicator list
Access to flexitime
EPL for regular workers
Diversity and reasons for contractual and working arrangements
Employees with overtime work hours
Labour turnover (hires and separations)
Job tenure in years
Component 1: Flexible and reliable contractual arrangements
EMCOEMCO-
modifiedJAF
X context indicator (PA2)
X sub-indicator (PA2)
X X sub-indicator (PA2)
X X other context ind. (PA2)
X X main indicator PA2
X X sub-indicator (PA2)
X sub-indicator (PA2)
Transitions from temporary to permanent employment X sub-indicator (PA2)
Overtime hours X sub-indicator (PA2)
Transition by type of contract - males sub-indicator (PA2)
Transition by type of contract - females sub-indicator (PA2)
Transitions by contract
Job tenure in years
Labour turnover (hires and separations)
Indicator list
Access to flexitime
EPL for regular workers
Diversity and reasons for contractual and working arrangements
Employees with overtime work hours
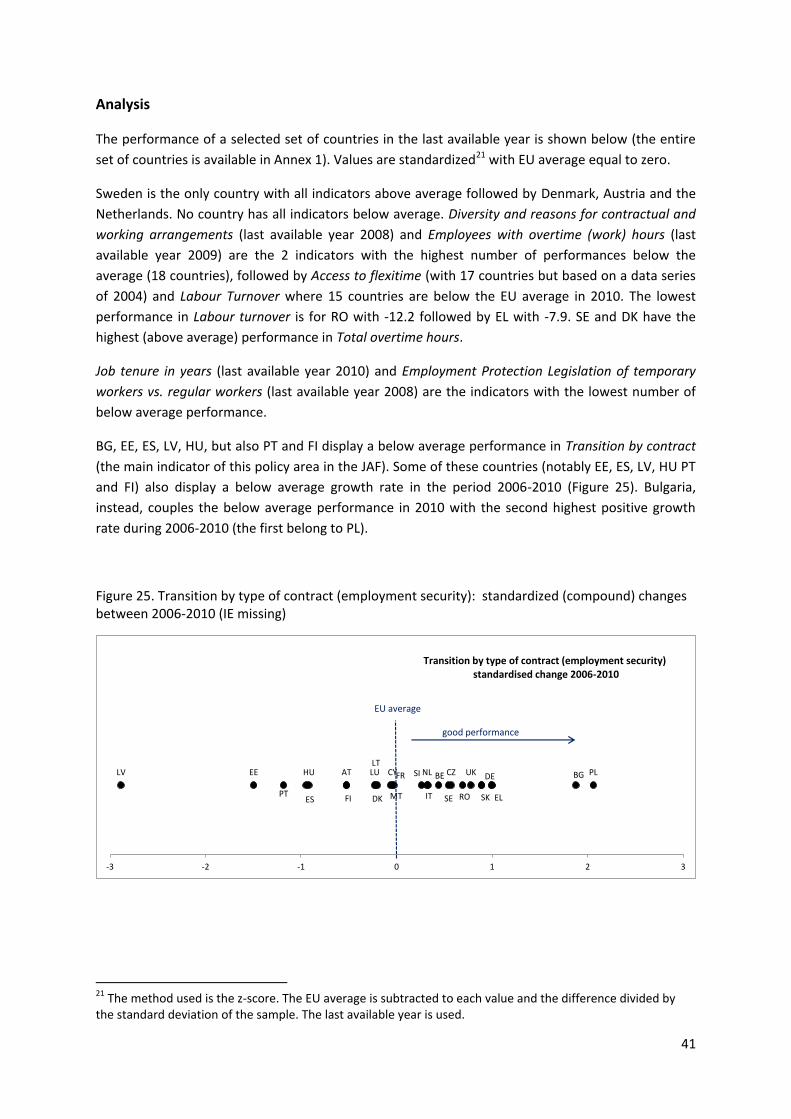
41
Analysis
The performance of a selected set of countries in the last available year is shown below (the entire
set of countries is available in Annex 1). Values are standardized21 with EU average equal to zero.
Sweden is the only country with all indicators above average followed by Denmark, Austria and the
Netherlands. No country has all indicators below average. Diversity and reasons for contractual and
working arrangements (last available year 2008) and Employees with overtime (work) hours (last
available year 2009) are the 2 indicators with the highest number of performances below the
average (18 countries), followed by Access to flexitime (with 17 countries but based on a data series
of 2004) and Labour Turnover where 15 countries are below the EU average in 2010. The lowest
performance in Labour turnover is for RO with -12.2 followed by EL with -7.9. SE and DK have the
highest (above average) performance in Total overtime hours.
Job tenure in years (last available year 2010) and Employment Protection Legislation of temporary
workers vs. regular workers (last available year 2008) are the indicators with the lowest number of
below average performance.
BG, EE, ES, LV, HU, but also PT and FI display a below average performance in Transition by contract
(the main indicator of this policy area in the JAF). Some of these countries (notably EE, ES, LV, HU PT
and FI) also display a below average growth rate in the period 2006-2010 (Figure 25). Bulgaria,
instead, couples the below average performance in 2010 with the second highest positive growth
rate during 2006-2010 (the first belong to PL).
Figure 25. Transition by type of contract (employment security): standardized (compound) changes between 2006-2010 (IE missing)
21 The method used is the z-score. The EU average is subtracted to each value and the difference divided by the standard deviation of the sample. The last available year is used.
BE BGCZ
DK
DEEE
ELES
FR
IT
CYLVLTLUHU
MT
NLAT PL
PT RO
SI
SKFI SE
UK
-3 -2 -1 0 1 2 3
Transition by type of contract (employment security) standardised change 2006-2010
EU average
good performance
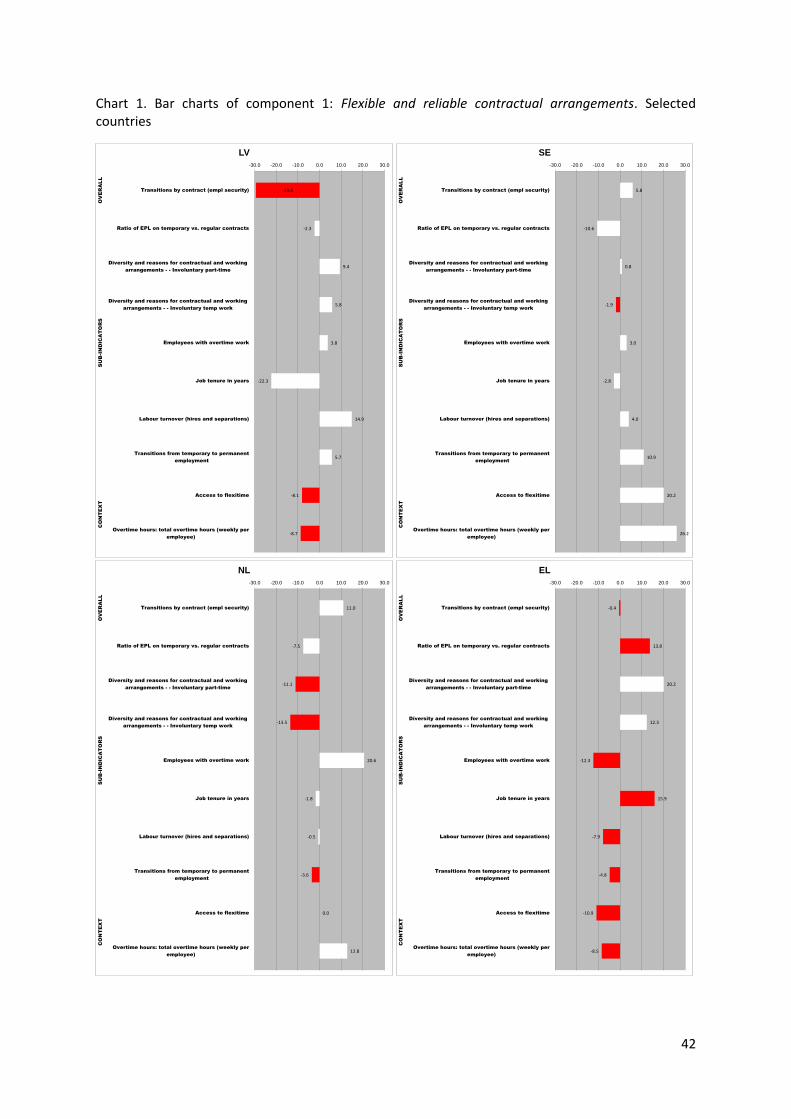
42
Chart 1. Bar charts of component 1: Flexible and reliable contractual arrangements. Selected countries
-29.4
-2.3
9.4
5.8
3.8
-22.3
14.9
5.7
-8.1
-8.7
-30.0 -20.0 -10.0 0.0 10.0 20.0 30.0
Transitions by contract (empl security)
Ratio of EPL on temporary vs. regular contracts
Diversity and reasons for contractual and working
arrangements - - Involuntary part-time
Diversity and reasons for contractual and working
arrangements - - Involuntary temp work
Employees with overtime work
Job tenure in years
Labour turnover (hires and separations)
Transitions from temporary to permanent
employment
Access to flexitime
Overtime hours: total overtime hours (weekly per
employee)
OV
ER
AL
LS
UB
-IN
DIC
AT
OR
SC
ON
TE
XT
LV
5.8
-10.6
0.8
-1.9
3.0
-2.8
4.0
10.9
20.2
26.2
-30.0 -20.0 -10.0 0.0 10.0 20.0 30.0
Transitions by contract (empl security)
Ratio of EPL on temporary vs. regular contracts
Diversity and reasons for contractual and working
arrangements - - Involuntary part-time
Diversity and reasons for contractual and working
arrangements - - Involuntary temp work
Employees with overtime work
Job tenure in years
Labour turnover (hires and separations)
Transitions from temporary to permanent
employment
Access to flexitime
Overtime hours: total overtime hours (weekly per
employee)
OV
ER
AL
LS
UB
-IN
DIC
AT
OR
SC
ON
TE
XT
SE
11.0
-7.5
-11.1
-13.5
20.6
-1.8
-0.5
-3.6
0.0
12.8
-30.0 -20.0 -10.0 0.0 10.0 20.0 30.0
Transitions by contract (empl security)
Ratio of EPL on temporary vs. regular contracts
Diversity and reasons for contractual and working
arrangements - - Involuntary part-time
Diversity and reasons for contractual and working
arrangements - - Involuntary temp work
Employees with overtime work
Job tenure in years
Labour turnover (hires and separations)
Transitions from temporary to permanent
employment
Access to flexitime
Overtime hours: total overtime hours (weekly per
employee)
OV
ER
AL
LS
UB
-IN
DIC
AT
OR
SC
ON
TE
XT
NL
-0.4
13.8
20.2
12.3
-12.3
15.9
-7.9
-4.8
-10.9
-8.5
-30.0 -20.0 -10.0 0.0 10.0 20.0 30.0
Transitions by contract (empl security)
Ratio of EPL on temporary vs. regular contracts
Diversity and reasons for contractual and working
arrangements - - Involuntary part-time
Diversity and reasons for contractual and working
arrangements - - Involuntary temp work
Employees with overtime work
Job tenure in years
Labour turnover (hires and separations)
Transitions from temporary to permanent
employment
Access to flexitime
Overtime hours: total overtime hours (weekly per
employee)
OV
ER
AL
LS
UB
-IN
DIC
AT
OR
SC
ON
TE
XT
EL

43
In order to see the relationship between components we calculate the correlation coefficients (Table
2) which are not significantly different from zero (5% significance level) in the majority of cases. In
particular Diversity and reason for contractual working arrangements (involuntary part time and
involuntary fixed term) and Transition from temporary to permanent employment are statistically not
correlated with any other indicator of their group. Transition by contract (overall indicator of this
component of flexicurity) should be positively related to all the indicators of this component but Job
tenure and EPL for regular workers. This is actually not the case with Labour turnover where the
correlation is significant and negative (-0.61).
A more in-depth analysis on the structure of this component is conducted using Principal
Component Analysis (PCA). This statistical technique manipulates the data with the aim of
highlighting common latent dimensions or “explanations” in the data. PCA exploits the correlation
between the indicators to reveal shared patterns of behaviour in indicators or single out indicators
that have an autonomous explanatory power.
PCA applied to Component 1 reveals 3 different statistical patterns of behaviour (Table 3): the first
group of indicators behaving similarly (they represent 25% of total information in the dataset) are
Involuntary fixed term (Inv_fixed term), Employment Protection Legislation for regular workers (EPL),
Transition by from temporary to permanent employment (Transition_tp) and overtime hours
(Overtime_hours). Transition by contract (Trans_contract), Labour turnover (Turnover) and Job
tenure (Job_ten) share the second latent factor (representing another 25% of the information).
Involuntary part-time (Inv_part time) and Overtime work (Overtime_work) stand alone as behaving
differently from the rest of indicators but representing 18% of the information.
Overall, this component presents a high statistical heterogeneity and data problems (missing
countries and old data). The behaviour of sub-indicators is not always in line with what is
theoretically expected and the PCA highlights the multidimensional nature of this component. After
2 rounds of consultation the EMCO-IG finally endorsed the classification reported below.
JAF Reclassification: Flexible and reliable contractual arrangements
Objective: The component on flexible and reliable contractual arrangements aims at capturing the
first part of flexicurity dimension: the flexibility in the labour market allowing companies to quick
and efficient adjustments of their workforces.
Indicators
Overall Indicator
1. Transition by contract
Sub-indicators
2. Diversity and reasons for contractual and working arrangements
Share of employees on involuntary part-time (taken because of: could not find full-time job")
available as share of total employees.
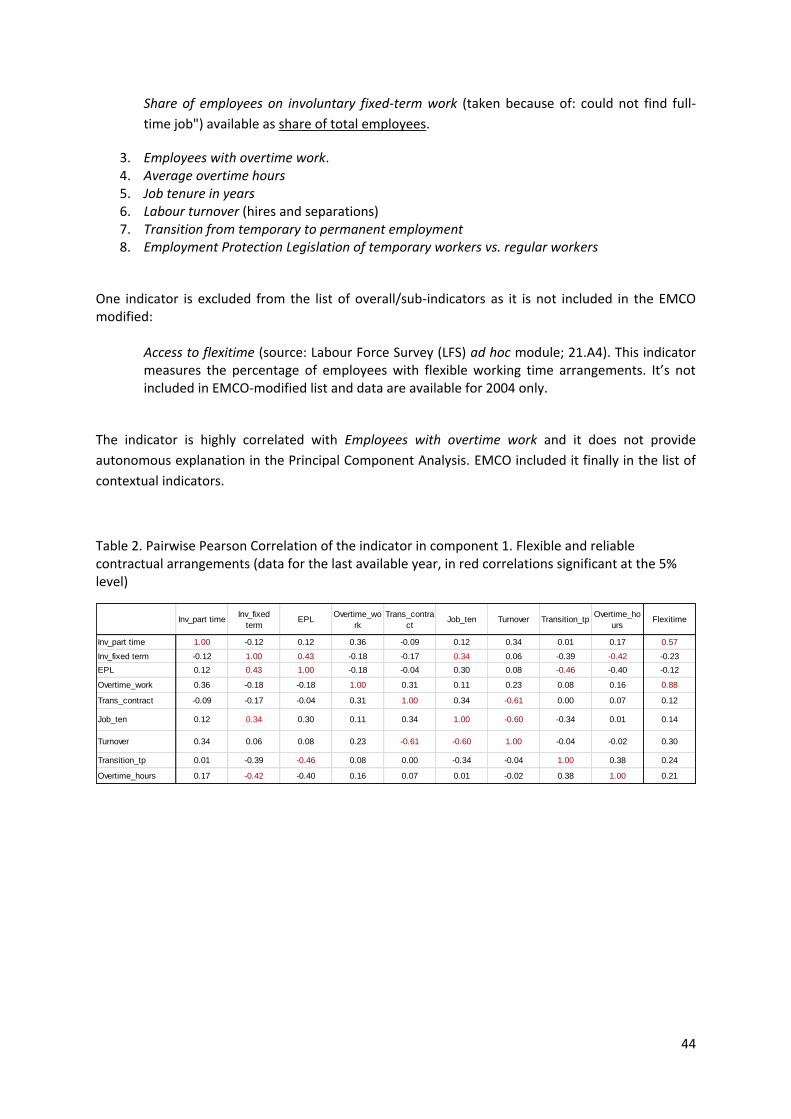
44
Share of employees on involuntary fixed-term work (taken because of: could not find full-
time job") available as share of total employees.
3. Employees with overtime work. 4. Average overtime hours 5. Job tenure in years 6. Labour turnover (hires and separations) 7. Transition from temporary to permanent employment 8. Employment Protection Legislation of temporary workers vs. regular workers
One indicator is excluded from the list of overall/sub-indicators as it is not included in the EMCO modified:
Access to flexitime (source: Labour Force Survey (LFS) ad hoc module; 21.A4). This indicator measures the percentage of employees with flexible working time arrangements. It’s not included in EMCO-modified list and data are available for 2004 only.
The indicator is highly correlated with Employees with overtime work and it does not provide
autonomous explanation in the Principal Component Analysis. EMCO included it finally in the list of
contextual indicators.
Table 2. Pairwise Pearson Correlation of the indicator in component 1. Flexible and reliable contractual arrangements (data for the last available year, in red correlations significant at the 5% level)
Inv_part timeInv_fixed
termEPL
Overtime_wo
rk
Trans_contra
ctJob_ten Turnover Transition_tp
Overtime_ho
ursFlexitime
Inv_part time 1.00 -0.12 0.12 0.36 -0.09 0.12 0.34 0.01 0.17 0.57
Inv_fixed term -0.12 1.00 0.43 -0.18 -0.17 0.34 0.06 -0.39 -0.42 -0.23
EPL 0.12 0.43 1.00 -0.18 -0.04 0.30 0.08 -0.46 -0.40 -0.12
Overtime_work 0.36 -0.18 -0.18 1.00 0.31 0.11 0.23 0.08 0.16 0.88
Trans_contract -0.09 -0.17 -0.04 0.31 1.00 0.34 -0.61 0.00 0.07 0.12
Job_ten 0.12 0.34 0.30 0.11 0.34 1.00 -0.60 -0.34 0.01 0.14
Turnover 0.34 0.06 0.08 0.23 -0.61 -0.60 1.00 -0.04 -0.02 0.30
Transition_tp 0.01 -0.39 -0.46 0.08 0.00 -0.34 -0.04 1.00 0.38 0.24
Overtime_hours 0.17 -0.42 -0.40 0.16 0.07 0.01 -0.02 0.38 1.00 0.21
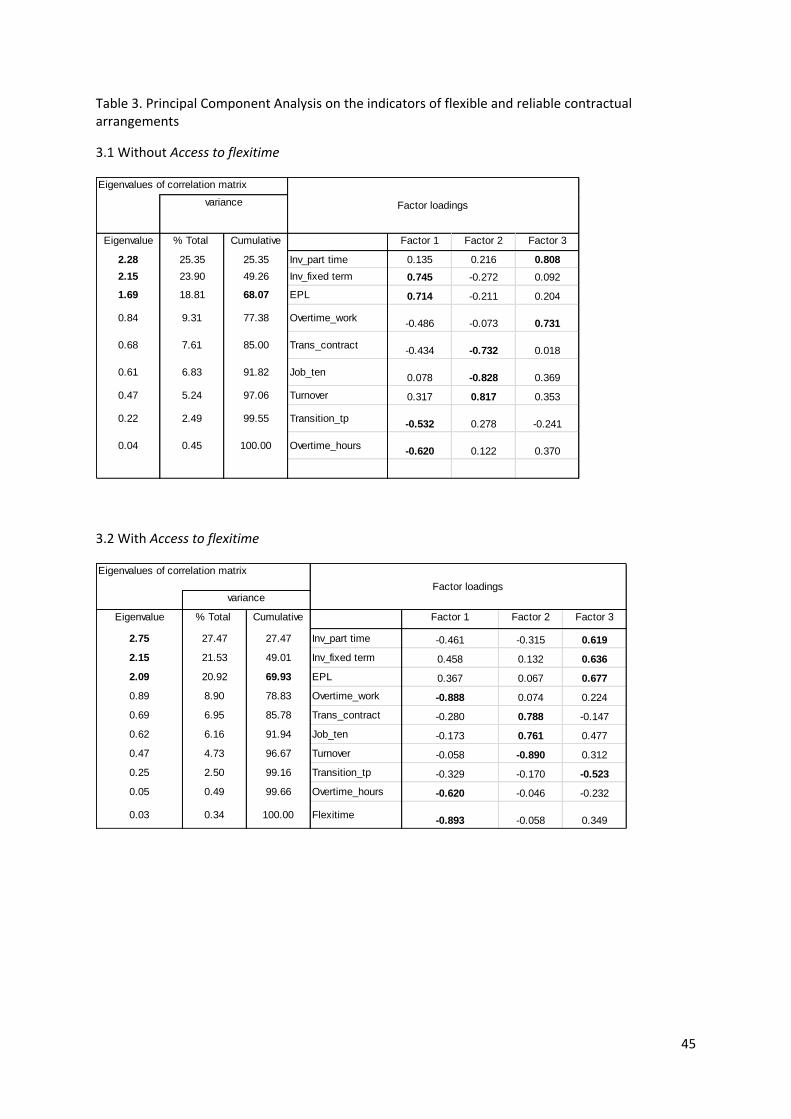
45
Table 3. Principal Component Analysis on the indicators of flexible and reliable contractual arrangements
3.1 Without Access to flexitime
3.2 With Access to flexitime
Eigenvalue % Total Cumulative Factor 1 Factor 2 Factor 3
2.28 25.35 25.35 Inv_part time 0.135 0.216 0.808
2.15 23.90 49.26 Inv_fixed term 0.745 -0.272 0.092
1.69 18.81 68.07 EPL 0.714 -0.211 0.204
0.84 9.31 77.38 Overtime_work-0.486 -0.073 0.731
0.68 7.61 85.00 Trans_contract-0.434 -0.732 0.018
0.61 6.83 91.82 Job_ten0.078 -0.828 0.369
0.47 5.24 97.06 Turnover 0.317 0.817 0.353
0.22 2.49 99.55 Transition_tp-0.532 0.278 -0.241
0.04 0.45 100.00 Overtime_hours-0.620 0.122 0.370
Eigenvalues of correlation matrix
Factor loadingsvariance
Eigenvalue % Total Cumulative Factor 1 Factor 2 Factor 3
2.75 27.47 27.47 Inv_part time -0.461 -0.315 0.619
2.15 21.53 49.01 Inv_fixed term 0.458 0.132 0.636
2.09 20.92 69.93 EPL 0.367 0.067 0.677
0.89 8.90 78.83 Overtime_work -0.888 0.074 0.224
0.69 6.95 85.78 Trans_contract -0.280 0.788 -0.147
0.62 6.16 91.94 Job_ten -0.173 0.761 0.477
0.47 4.73 96.67 Turnover -0.058 -0.890 0.312
0.25 2.50 99.16 Transition_tp -0.329 -0.170 -0.523
0.05 0.49 99.66 Overtime_hours -0.620 -0.046 -0.232
0.03 0.34 100.00 Flexitime-0.893 -0.058 0.349
Eigenvalues of correlation matrix
varianceFactor loadings

46
4.2 Comprehensive lifelong learning strategies
The component comprehensive lifelong learning strategies is aimed at measuring the continual
adaptability and employability of workers, particularly the most vulnerable. The 8 considered
indicators are not homogeneous in terms of data coverage (Figure 26).
Indicators
Public spending in human resources (source: UOE; PA 8.2-S4; Eurostat: tsdsc510) measures the total
public spending in education as % of GDP. Data is available from 2000 to 2008 with only a few data
points in 2009.
Investment by enterprises in training of adults (source: CVTS, 2005, 2010; 23.A1) measures the direct
and labour costs of participants divided by total labour costs. Data is available only for 2005 and
2010. Indicator not included in EMCO-modified list.
Lifelong learning (source: LFS; trng_lfse_01) measures the percentage of the adult population aged
25-64 participating in education and training, total. Data is from 2000 to 2011.
Participation in CVT (Continuing Vocational Training) (source: CVTS, 2005, 2010; 23.A2) measures
the share of employees participating in continuous vocational training. Data availability is only for
2005 and 2010. Indicator not included in EMCO-modified list.
Gap in CVT participation between temporary and permanent workers. Data is not available.
Transition in labour status and pay level (source: EU-SILC; ilc_lvhl35) measures the transition to the
same or higher qualification level (employment status and pay) as previous year or the transition to
lower qualification level (employment status and pay) than last year. For the analysis we used the
transition to higher qualification level. Data is available from 2006 to 2010 (few data points in 2011).
Indicator not included in EMCO-modified list.
Educational attainment (source: LFS; edat_lfse_07) measures the total percentage of population
aged 25-64 with tertiary education attainment. Several breakdowns are also available: age, sex,
labour stats or ISCED level. Data is available from 2000 to 2011.
E-skills (source: ICT household survey; isoc_sk_cskl_i / isoc_sk_iskl_i) measures the percentage of
individuals between 25 and 54 years old who have carried out low-level computer/internet activities
These indicators are in the Eurostat database where are divided in several categories among which
the most meaningful are 4: no skills, high skills, medium skills and low skills. On the whole, 8
breakdowns of information are available (i.e. Internet and Computer skills further classified in 4
levels: no skills, low skills, medium skills and high skills). For the present analysis we considered the
low skills for both. Data availability spells out as follows (Table 7). About Computer Skills, low and
high skills cover 2005-2007-2009-2011, while medium skills are only available for 2006. Concerning
Internet Skills, low skills cover 2005-2007-2011, medium skills cover 2006-2010 and high skills cover
2005-2007-2010-2011. One last remark (also useful for a correct interpretation of bar charts) regards
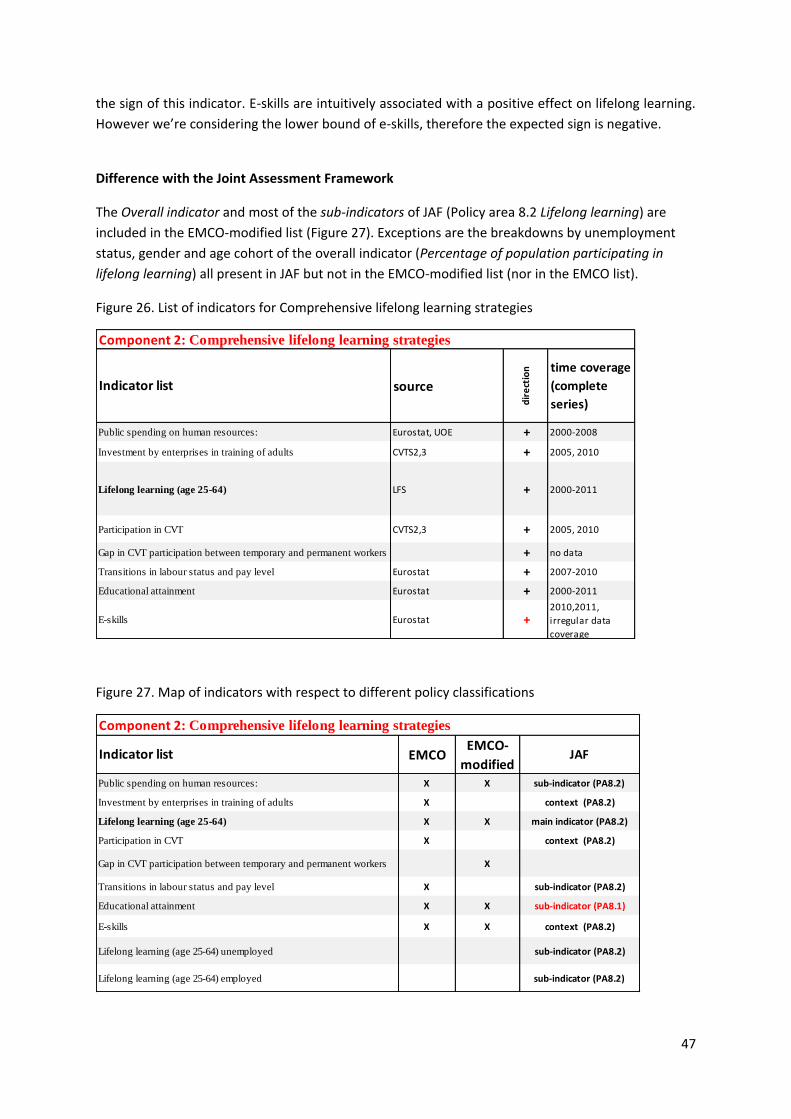
47
the sign of this indicator. E-skills are intuitively associated with a positive effect on lifelong learning.
However we’re considering the lower bound of e-skills, therefore the expected sign is negative.
Difference with the Joint Assessment Framework
The Overall indicator and most of the sub-indicators of JAF (Policy area 8.2 Lifelong learning) are
included in the EMCO-modified list (Figure 27). Exceptions are the breakdowns by unemployment
status, gender and age cohort of the overall indicator (Percentage of population participating in
lifelong learning) all present in JAF but not in the EMCO-modified list (nor in the EMCO list).
Figure 26. List of indicators for Comprehensive lifelong learning strategies
Figure 27. Map of indicators with respect to different policy classifications
Component 2: Comprehensive lifelong learning strategies
source
dir
ect
ion time coverage
(complete
series)
Public spending on human resources: Eurostat, UOE + 2000-2008
Investment by enterprises in training of adults CVTS2,3 + 2005, 2010
Lifelong learning (age 25-64) LFS + 2000-2011
Participation in CVT CVTS2,3 + 2005, 2010
Gap in CVT participation between temporary and permanent workers + no data
Transitions in labour status and pay level Eurostat + 2007-2010
Educational attainment Eurostat + 2000-2011
E-skills Eurostat +2010,2011,
irregular data
coverage
Indicator list
Component 2: Comprehensive lifelong learning strategies
EMCOEMCO-
modifiedJAF
Public spending on human resources: X X sub-indicator (PA8.2)
Investment by enterprises in training of adults X context (PA8.2)
Lifelong learning (age 25-64) X X main indicator (PA8.2)
Participation in CVT X context (PA8.2)
Gap in CVT participation between temporary and permanent workers X
Transitions in labour status and pay level X sub-indicator (PA8.2)
Educational attainment X X sub-indicator (PA8.1)
E-skills X X context (PA8.2)
Lifelong learning (age 25-64) unemployed sub-indicator (PA8.2)
Lifelong learning (age 25-64) employed sub-indicator (PA8.2)
Indicator list
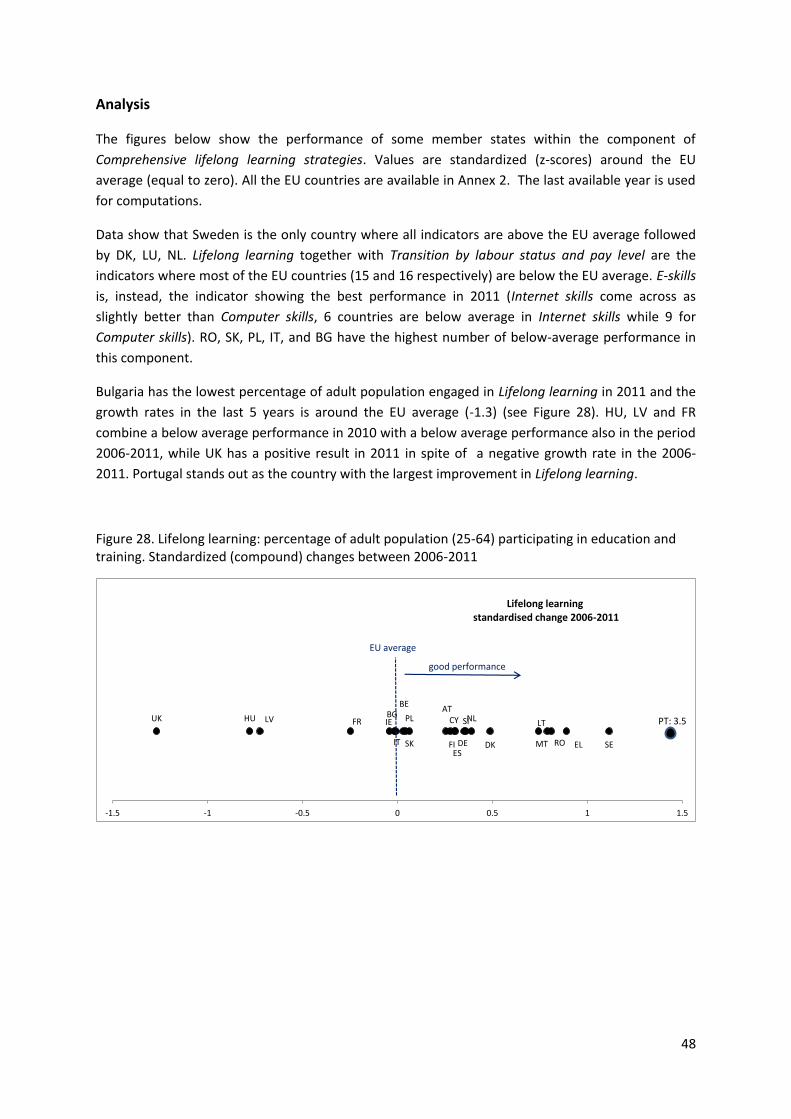
48
Analysis
The figures below show the performance of some member states within the component of
Comprehensive lifelong learning strategies. Values are standardized (z-scores) around the EU
average (equal to zero). All the EU countries are available in Annex 2. The last available year is used
for computations.
Data show that Sweden is the only country where all indicators are above the EU average followed
by DK, LU, NL. Lifelong learning together with Transition by labour status and pay level are the
indicators where most of the EU countries (15 and 16 respectively) are below the EU average. E-skills
is, instead, the indicator showing the best performance in 2011 (Internet skills come across as
slightly better than Computer skills, 6 countries are below average in Internet skills while 9 for
Computer skills). RO, SK, PL, IT, and BG have the highest number of below-average performance in
this component.
Bulgaria has the lowest percentage of adult population engaged in Lifelong learning in 2011 and the
growth rates in the last 5 years is around the EU average (-1.3) (see Figure 28). HU, LV and FR
combine a below average performance in 2010 with a below average performance also in the period
2006-2011, while UK has a positive result in 2011 in spite of a negative growth rate in the 2006-
2011. Portugal stands out as the country with the largest improvement in Lifelong learning.
Figure 28. Lifelong learning: percentage of adult population (25-64) participating in education and training. Standardized (compound) changes between 2006-2011
BEBG
DKDE
IE
ELES
FR
IT
CYLV LTHU
MT
NLAT
PL
RO
SI
SK FI SE
UK
-1.5 -1 -0.5 0 0.5 1 1.5
Lifelong learning standardised change 2006-2011
EU average
good performance
PT: 3.5
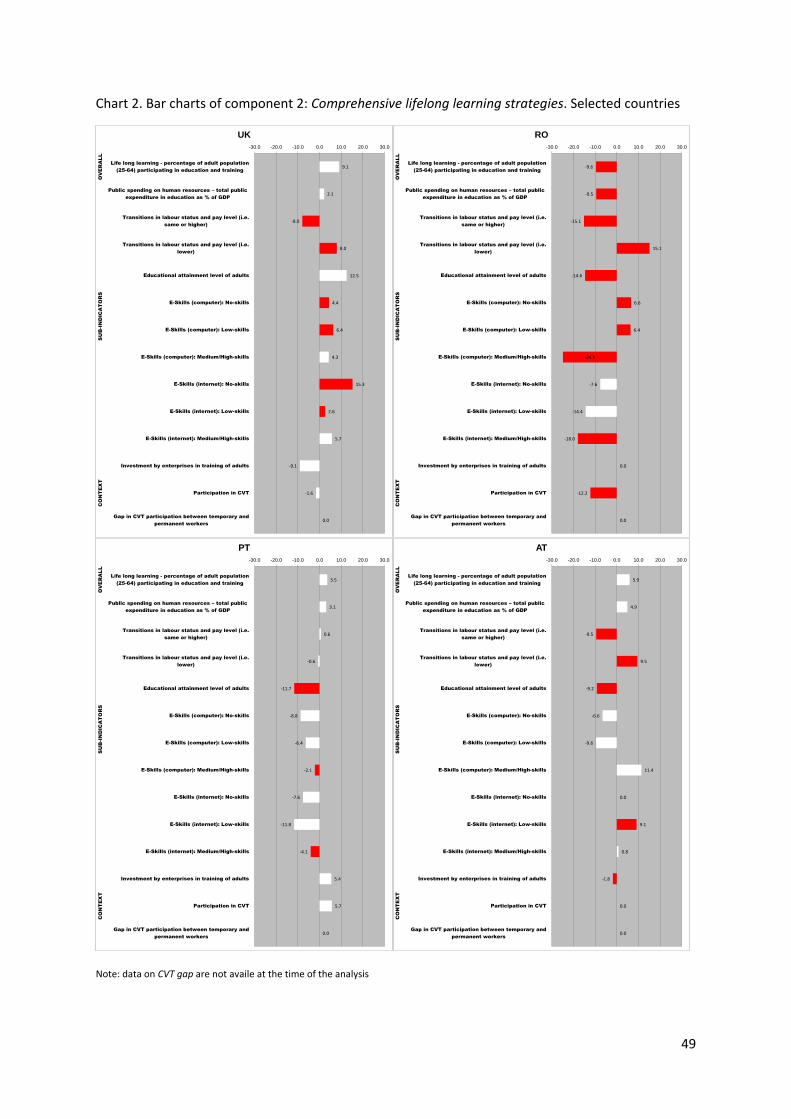
49
Chart 2. Bar charts of component 2: Comprehensive lifelong learning strategies. Selected countries
Note: data on CVT gap are not availe at the time of the analysis
9.1
2.1
-8.0
8.0
12.5
4.4
6.4
4.3
15.3
2.6
5.7
-9.1
-1.6
0.0
-30.0 -20.0 -10.0 0.0 10.0 20.0 30.0
Life long learning - percentage of adult population
(25-64) participating in education and training
Public spending on human resources – total public
expenditure in education as % of GDP
Transitions in labour status and pay level (i.e.
same or higher)
Transitions in labour status and pay level (i.e.
lower)
Educational attainment level of adults
E-Skills (computer): No-skills
E-Skills (computer): Low-skills
E-Skills (computer): Medium/High-skills
E-Skills (internet): No-skills
E-Skills (internet): Low-skills
E-Skills (internet): Medium/High-skills
Investment by enterprises in training of adults
Participation in CVT
Gap in CVT participation between temporary and
permanent workers
OV
ER
AL
LS
UB
-IN
DIC
AT
OR
SC
ON
TE
XT
UK
-9.6
-9.5
-15.1
15.1
-14.6
6.6
6.4
-24.9
-7.6
-14.4
-18.0
0.0
-12.2
0.0
-30.0 -20.0 -10.0 0.0 10.0 20.0 30.0
Life long learning - percentage of adult population
(25-64) participating in education and training
Public spending on human resources – total public
expenditure in education as % of GDP
Transitions in labour status and pay level (i.e.
same or higher)
Transitions in labour status and pay level (i.e.
lower)
Educational attainment level of adults
E-Skills (computer): No-skills
E-Skills (computer): Low-skills
E-Skills (computer): Medium/High-skills
E-Skills (internet): No-skills
E-Skills (internet): Low-skills
E-Skills (internet): Medium/High-skills
Investment by enterprises in training of adults
Participation in CVT
Gap in CVT participation between temporary and
permanent workers
OV
ER
AL
LS
UB
-IN
DIC
AT
OR
SC
ON
TE
XT
RO
3.5
3.1
0.6
-0.6
-11.7
-8.8
-6.4
-2.1
-7.6
-11.8
-4.1
5.4
5.7
0.0
-30.0 -20.0 -10.0 0.0 10.0 20.0 30.0
Life long learning - percentage of adult population
(25-64) participating in education and training
Public spending on human resources – total public
expenditure in education as % of GDP
Transitions in labour status and pay level (i.e.
same or higher)
Transitions in labour status and pay level (i.e.
lower)
Educational attainment level of adults
E-Skills (computer): No-skills
E-Skills (computer): Low-skills
E-Skills (computer): Medium/High-skills
E-Skills (internet): No-skills
E-Skills (internet): Low-skills
E-Skills (internet): Medium/High-skills
Investment by enterprises in training of adults
Participation in CVT
Gap in CVT participation between temporary and
permanent workers
OV
ER
AL
LS
UB
-IN
DIC
AT
OR
SC
ON
TE
XT
PT
5.9
4.9
-9.5
9.5
-9.2
-6.6
-9.6
11.4
0.0
9.1
0.8
-1.8
0.0
0.0
-30.0 -20.0 -10.0 0.0 10.0 20.0 30.0
Life long learning - percentage of adult population
(25-64) participating in education and training
Public spending on human resources – total public
expenditure in education as % of GDP
Transitions in labour status and pay level (i.e.
same or higher)
Transitions in labour status and pay level (i.e.
lower)
Educational attainment level of adults
E-Skills (computer): No-skills
E-Skills (computer): Low-skills
E-Skills (computer): Medium/High-skills
E-Skills (internet): No-skills
E-Skills (internet): Low-skills
E-Skills (internet): Medium/High-skills
Investment by enterprises in training of adults
Participation in CVT
Gap in CVT participation between temporary and
permanent workers
OV
ER
AL
LS
UB
-IN
DIC
AT
OR
SC
ON
TE
XT
AT
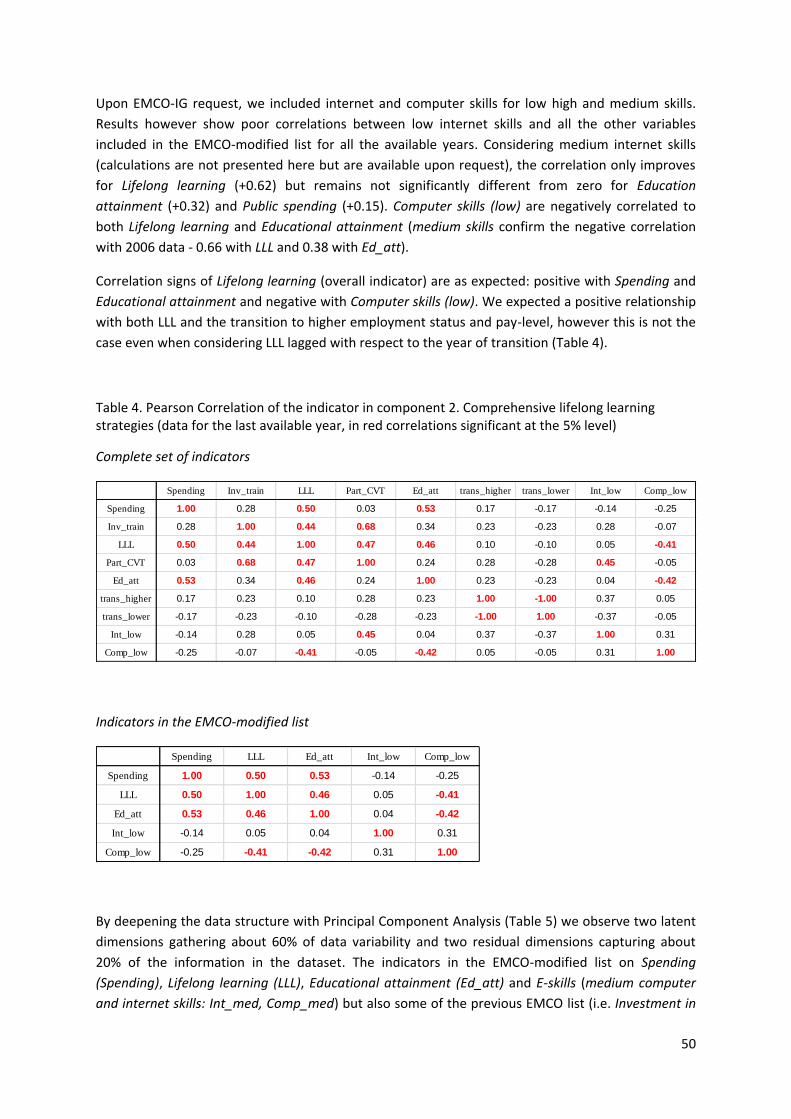
50
Upon EMCO-IG request, we included internet and computer skills for low high and medium skills.
Results however show poor correlations between low internet skills and all the other variables
included in the EMCO-modified list for all the available years. Considering medium internet skills
(calculations are not presented here but are available upon request), the correlation only improves
for Lifelong learning (+0.62) but remains not significantly different from zero for Education
attainment (+0.32) and Public spending (+0.15). Computer skills (low) are negatively correlated to
both Lifelong learning and Educational attainment (medium skills confirm the negative correlation
with 2006 data - 0.66 with LLL and 0.38 with Ed_att).
Correlation signs of Lifelong learning (overall indicator) are as expected: positive with Spending and
Educational attainment and negative with Computer skills (low). We expected a positive relationship
with both LLL and the transition to higher employment status and pay-level, however this is not the
case even when considering LLL lagged with respect to the year of transition (Table 4).
Table 4. Pearson Correlation of the indicator in component 2. Comprehensive lifelong learning strategies (data for the last available year, in red correlations significant at the 5% level)
Complete set of indicators
Indicators in the EMCO-modified list
By deepening the data structure with Principal Component Analysis (Table 5) we observe two latent
dimensions gathering about 60% of data variability and two residual dimensions capturing about
20% of the information in the dataset. The indicators in the EMCO-modified list on Spending
(Spending), Lifelong learning (LLL), Educational attainment (Ed_att) and E-skills (medium computer
and internet skills: Int_med, Comp_med) but also some of the previous EMCO list (i.e. Investment in
Spending Inv_train LLL Part_CVT Ed_att trans_higher trans_lower Int_low Comp_low
Spending 1.00 0.28 0.50 0.03 0.53 0.17 -0.17 -0.14 -0.25
Inv_train 0.28 1.00 0.44 0.68 0.34 0.23 -0.23 0.28 -0.07
LLL 0.50 0.44 1.00 0.47 0.46 0.10 -0.10 0.05 -0.41
Part_CVT 0.03 0.68 0.47 1.00 0.24 0.28 -0.28 0.45 -0.05
Ed_att 0.53 0.34 0.46 0.24 1.00 0.23 -0.23 0.04 -0.42
trans_higher 0.17 0.23 0.10 0.28 0.23 1.00 -1.00 0.37 0.05
trans_lower -0.17 -0.23 -0.10 -0.28 -0.23 -1.00 1.00 -0.37 -0.05
Int_low -0.14 0.28 0.05 0.45 0.04 0.37 -0.37 1.00 0.31
Comp_low -0.25 -0.07 -0.41 -0.05 -0.42 0.05 -0.05 0.31 1.00
Spending LLL Ed_att Int_low Comp_low
Spending 1.00 0.50 0.53 -0.14 -0.25
LLL 0.50 1.00 0.46 0.05 -0.41
Ed_att 0.53 0.46 1.00 0.04 -0.42
Int_low -0.14 0.05 0.04 1.00 0.31
Comp_low -0.25 -0.41 -0.42 0.31 1.00

51
training (Inv_train), Participation in CVT (Part_CVT) and High computer skills (Comp_high)) have all
the same unique latent dimension, meaning that they all behave similarly. Transition (trans_higher,
trans_lower) and some of the breakdowns of e-skills instead are loaded by different latent
dimensions highlighting divergent behavioural pattern.
Proposal endorsed: keep separate the classes no skills and low skills and merge (if at all) the
medium-high skills22,23.
Motivation: (i) merging low, medium and high skills would leave low skills alone representing the
complete lack of e-skills. This because data about “no-skills” looks unreliable (due to a small sample
size) for both Computer- and Internet-skills (ii) Both the categories of low- and no-skills have the
same negative (or inconclusive) correlation with the overall indicator while high and medium skills
are obviously positively correlated with it. (iii) No-skills and low skills are significantly correlated
between them and not correlated with medium-skills. Vice versa medium and high skills are
correlated among them but not necessarily with no-skills and low skills.
Furthermore, EMCO finally decided to include CVT indicators in the list of sub-indicators. The
indicator Gap in CVT participation between temporary and permanent workers (source: CVTS3, 2005)
will be included as a contextual indicator and considered pending, depending on the development of
the data collection.
JAF Reclassification: Comprehensive lifelong learning strategies
Objective: The component ‘comprehensive lifelong learning strategies’ aims at measuring the
continual adaptability and employability of workers, particularly the most vulnerable.
Indicators
Overall Indicator
1. Lifelong learning
Sub-Indicators
2. Educational attainment.
3. Public spending in human resources
4. Transition in labour status and pay level. Transition to higher and to lower are included
5. E-skills: no, low and medium&high computer and internet skills.
22 Internet skills include the use of internet, e-mail, social networks, phone calls though the net, peer-to-peer file sharing for exchanging movies or music, creation of a Web page, download and installation of software, use of anti-viruses, and spyware. Low skills refer to 1-2 of these activities, medium skills to 3-4 and high skills to 5-6 internet activities. 23 Computer skills include: use a mouse, copy a file, use cut-and-paste to copy files, use basic arithmetic formulae, compress files, write a computer program, connect and install new devices, connect computers to a local area network, detect and solve computer problems. Low skills refer to 1-2 of these activities, medium skills to 3-4 and high skills to 5-6 internet activities
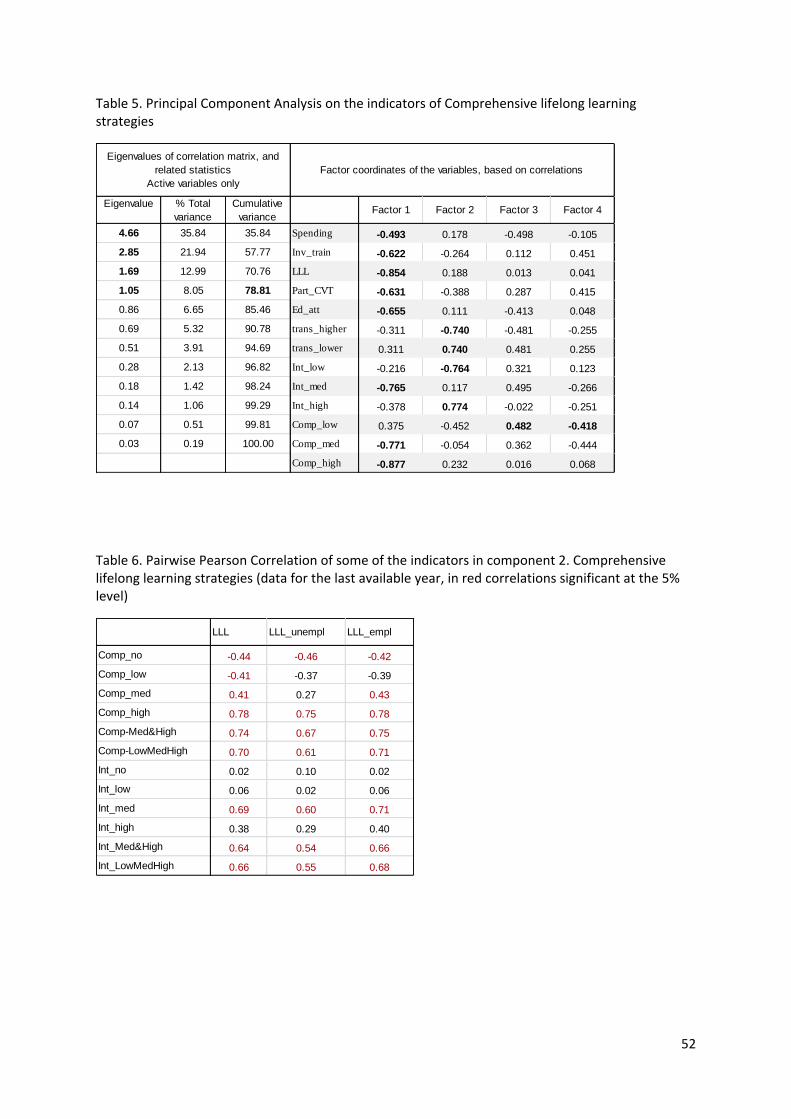
52
Table 5. Principal Component Analysis on the indicators of Comprehensive lifelong learning strategies
Table 6. Pairwise Pearson Correlation of some of the indicators in component 2. Comprehensive lifelong learning strategies (data for the last available year, in red correlations significant at the 5% level)
Eigenvalue % Total
variance
Cumulative
varianceFactor 1 Factor 2 Factor 3 Factor 4
4.66 35.84 35.84 Spending -0.493 0.178 -0.498 -0.105
2.85 21.94 57.77 Inv_train -0.622 -0.264 0.112 0.451
1.69 12.99 70.76 LLL -0.854 0.188 0.013 0.041
1.05 8.05 78.81 Part_CVT -0.631 -0.388 0.287 0.415
0.86 6.65 85.46 Ed_att -0.655 0.111 -0.413 0.048
0.69 5.32 90.78 trans_higher -0.311 -0.740 -0.481 -0.255
0.51 3.91 94.69 trans_lower 0.311 0.740 0.481 0.255
0.28 2.13 96.82 Int_low -0.216 -0.764 0.321 0.123
0.18 1.42 98.24 Int_med -0.765 0.117 0.495 -0.266
0.14 1.06 99.29 Int_high -0.378 0.774 -0.022 -0.251
0.07 0.51 99.81 Comp_low 0.375 -0.452 0.482 -0.418
0.03 0.19 100.00 Comp_med -0.771 -0.054 0.362 -0.444
Comp_high -0.877 0.232 0.016 0.068
Eigenvalues of correlation matrix, and
related statistics
Active variables only
Factor coordinates of the variables, based on correlations
LLL LLL_unempl LLL_empl
Comp_no -0.44 -0.46 -0.42
Comp_low -0.41 -0.37 -0.39
Comp_med 0.41 0.27 0.43
Comp_high 0.78 0.75 0.78
Comp-Med&High 0.74 0.67 0.75
Comp-LowMedHigh 0.70 0.61 0.71
Int_no 0.02 0.10 0.02
Int_low 0.06 0.02 0.06
Int_med 0.69 0.60 0.71
Int_high 0.38 0.29 0.40
Int_Med&High 0.64 0.54 0.66
Int_LowMedHigh 0.66 0.55 0.68
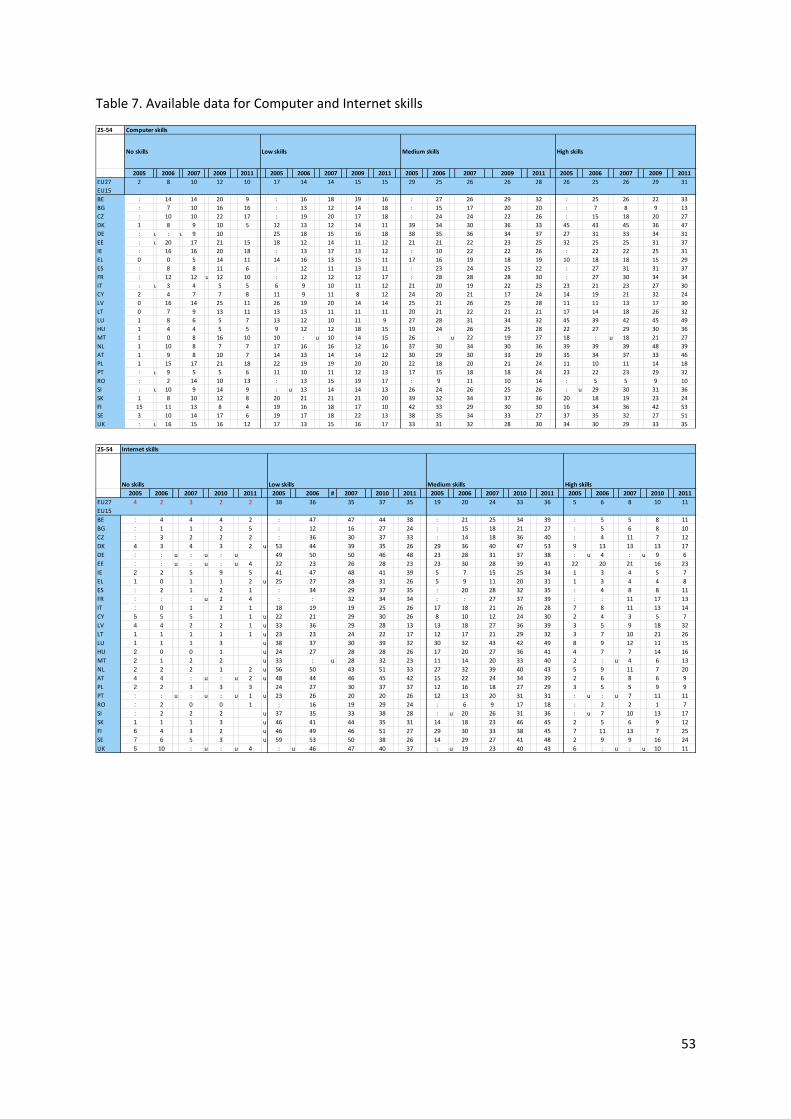
53
Table 7. Available data for Computer and Internet skills
25-54 Computer skills
No skills Low skills Medium skills High skills
2005 2006 2007 2009 2011 2005 2006 2007 2009 2011 2005 2006 2007 2009 2011 2005 2006 2007 2009 2011
EU27 2 8 10 12 10 17 14 14 15 15 29 25 26 26 28 26 25 26 29 31
EU15
BE : 14 14 20 9 : 16 18 19 16 : 27 26 29 32 : 25 26 22 33
BG : 7 10 16 16 : 13 12 14 18 : 15 17 20 20 : 7 8 9 13
CZ : 10 10 22 17 : 19 20 17 18 : 24 24 22 26 : 15 18 20 27
DK 1 8 9 10 5 12 13 12 14 11 39 34 30 36 33 45 43 45 36 47
DE : u : u 9 10 25 18 15 16 18 38 35 36 34 37 27 31 33 34 31
EE : u 20 17 21 15 18 12 14 11 12 21 21 22 23 25 32 25 25 31 37
IE : 16 16 20 18 : 13 17 13 12 : 10 22 22 26 : 22 22 25 31
EL 0 0 5 14 11 14 16 13 15 11 17 16 19 18 19 10 18 18 15 29
ES : 8 8 11 6 : 12 11 13 11 : 23 24 25 22 : 27 31 31 37
FR : 12 12 u 12 10 : 12 12 12 17 : 28 28 28 30 : 27 30 34 34
IT : u 3 4 5 5 6 9 10 11 12 21 20 19 22 23 23 21 23 27 30
CY 2 4 7 7 8 11 9 11 8 12 24 20 21 17 24 14 19 21 32 24
LV 0 16 14 25 11 26 19 20 14 14 25 21 26 25 28 11 11 13 17 30
LT 0 7 9 13 11 13 13 11 11 11 20 21 22 21 21 17 14 18 26 32
LU 1 8 6 5 7 13 12 10 11 9 27 28 31 34 32 45 39 42 45 49
HU 1 4 4 5 5 9 12 12 18 15 19 24 26 25 28 22 27 29 30 36
MT 1 0 8 16 10 10 : u 10 14 15 26 : u 22 19 27 18 : u 18 21 27
NL 1 10 8 7 7 17 16 16 12 16 37 30 34 30 36 39 39 39 48 39
AT 1 9 8 10 7 14 13 14 14 12 30 29 30 33 29 35 34 37 33 46
PL 1 15 17 21 18 22 19 19 20 20 22 18 20 21 24 11 10 11 14 18
PT : u 9 5 5 6 11 10 11 12 13 17 15 18 18 24 23 22 23 29 32
RO : 2 14 10 13 : 13 15 19 17 : 9 11 10 14 : 5 5 9 10
SI : u 10 9 14 9 : u 13 14 14 13 26 24 26 25 26 : u 29 30 31 36
SK 1 8 10 12 8 20 21 21 21 20 39 32 34 37 36 20 18 19 23 24
FI 15 11 13 8 4 19 16 18 17 10 42 33 29 30 30 16 34 36 42 53
SE 3 10 14 17 6 19 17 18 22 13 38 35 34 33 27 37 35 32 27 51
UK : u 16 15 16 12 17 13 15 16 17 33 31 32 28 30 34 30 29 33 35
25-54 Internet skills
No skills Low skills Medium skills High skills
2005 2006 2007 2010 2011 2005 2006 # 2007 2010 2011 2005 2006 2007 2010 2011 2005 2006 2007 2010 2011
EU27 4 2 3 2 2 38 36 35 37 35 19 20 24 33 36 5 6 8 10 11
EU15
BE : 4 4 4 2 : 47 47 44 38 : 21 25 34 39 : 5 5 8 11
BG : 1 1 2 5 : 12 16 27 24 : 15 18 21 27 : 5 6 8 10
CZ : 3 2 2 2 : 36 30 37 33 : 14 18 36 40 : 4 11 7 12
DK 4 3 4 3 2 u 53 44 39 35 26 29 36 40 47 53 9 13 13 13 17
DE : : u : u : u 49 50 50 46 48 23 28 31 37 38 : u 4 : u 9 6
EE : : u : u : u 4 22 23 26 28 23 23 30 28 39 41 22 20 21 16 23
IE 2 2 5 9 5 41 47 48 41 39 5 7 15 25 34 1 3 4 5 7
EL 1 0 1 1 2 u 25 27 28 31 26 5 9 11 20 31 1 3 4 4 8
ES : 2 1 2 1 : 34 29 37 35 : 20 28 32 35 : 4 8 8 11
FR : : : u 2 4 : : 32 34 34 : : 27 37 39 : : 11 17 13
IT : 0 1 2 1 18 19 19 25 26 17 18 21 26 28 7 8 11 13 14
CY 5 5 5 1 1 u 22 21 29 30 26 8 10 12 24 30 2 4 3 5 7
LV 4 4 2 2 1 u 33 36 29 28 13 13 18 27 36 39 3 5 9 18 32
LT 1 1 1 1 1 u 23 23 24 22 17 12 17 21 29 32 3 7 10 21 26
LU 1 1 1 3 u 38 37 30 39 32 30 32 43 42 49 8 9 12 11 15
HU 2 0 0 1 u 24 27 28 28 26 17 20 27 36 41 4 7 7 14 16
MT 2 1 2 2 u 33 : u 28 32 23 11 14 20 33 40 2 : u 4 6 13
NL 2 2 2 1 2 u 56 50 43 51 33 27 32 39 40 43 5 9 11 7 20
AT 4 4 : u : u 2 u 48 44 46 45 42 15 22 24 34 39 2 6 8 6 9
PL 2 2 3 3 3 24 27 30 37 37 12 16 18 27 29 3 5 5 9 9
PT : : u : u : u 1 u 23 26 20 20 26 12 13 20 31 31 : u : u 7 11 11
RO : 2 0 0 1 : 16 19 29 24 : 6 9 17 18 : 2 2 1 7
SI : 2 2 2 u 37 35 33 38 28 : u 20 26 31 36 : u 7 10 13 17
SK 1 1 1 3 u 46 41 44 35 31 14 18 23 46 45 2 5 6 9 12
FI 6 4 3 2 u 46 49 46 51 27 29 30 33 38 45 7 11 13 7 25
SE 7 6 5 3 u 59 53 50 38 26 14 29 27 41 48 2 9 9 16 24
UK 5 10 : u : u 4 : u 46 47 40 37 : u 19 23 40 43 6 : u : u 10 11
54
4.3 Effective labour market policy
Effective active labour market policies (ALMP) are meant to help people in coping with rapid change,
in reducing unemployment spells and in easing transitions toward new jobs. It contains 4 indicators
(Figure 29) which are homogeneous in terms of data and country coverage.
Indicators
Expenditure on Active Labour Market Policies per person wanting to work (cat. 2-7) (ALMP) (source:
Eurostat, Labour Market Policy; lmp_ind_exp) measures government actions to help and support the
unemployed and other disadvantaged groups in the transition from unemployment or inactivity to
work. Data on the expenditure and participants for each intervention are collected annually by
administrative sources of each member state. The database also collects extensive qualitative
information for each intervention: how it works, its main target groups, etc. Data coverage is from
2000 to 2010 (few data points in 2011 and complete series from 2006). Notice that the definition
given in the compendium contains also category 1.1: client service which is not directly available in
ESTAT webpage.
Expenditure on Active Labour Market Policies (ALMP) as percentage of GDP (source: Eurostat, Labour
Market Policy; lmp_ind_exp) is the previous indicator as a percentage of the gross domestic product.
Data coverage is from 2000 to 2010 (few data points in 2011) with complete series available from
2006.
Activation (source: Eurostat, Labour Market Policy; lmp_ind_actsup) is the share of participants in
regular activation measure (with respect to the number of persons wanting to work). Data is
available from 2000 to 2010 (few data points in 2011) and complete series are from 2006.
Long term unemployment rate (source: LFS; une_ltu_a) is the rate of long term unemployment of
the active population. Data coverage: 2000 to 2011.
Difference with the Joint Assessment Framework
The Overall indicator and all the sub-indicators of JAF (Policy area 3 Active labour market policies) are
included in the EMCO-modified list (Figure 30).
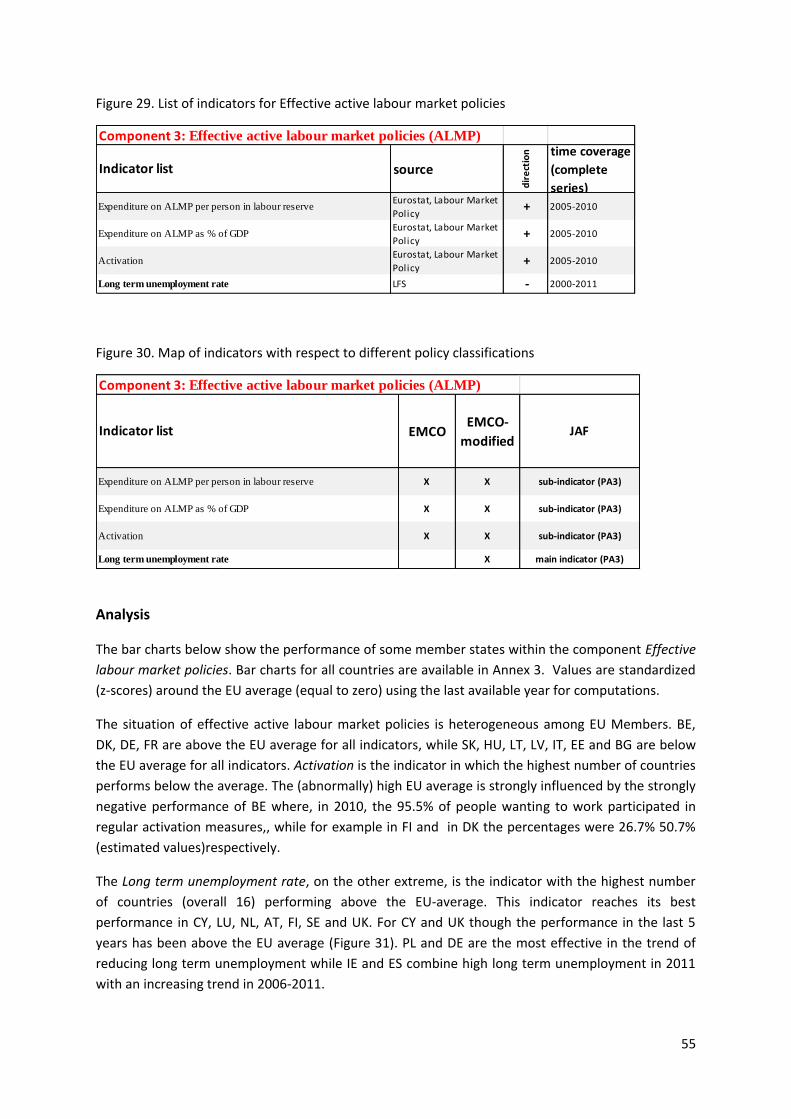
55
Figure 29. List of indicators for Effective active labour market policies
Figure 30. Map of indicators with respect to different policy classifications
Analysis
The bar charts below show the performance of some member states within the component Effective
labour market policies. Bar charts for all countries are available in Annex 3. Values are standardized
(z-scores) around the EU average (equal to zero) using the last available year for computations.
The situation of effective active labour market policies is heterogeneous among EU Members. BE,
DK, DE, FR are above the EU average for all indicators, while SK, HU, LT, LV, IT, EE and BG are below
the EU average for all indicators. Activation is the indicator in which the highest number of countries
performs below the average. The (abnormally) high EU average is strongly influenced by the strongly
negative performance of BE where, in 2010, the 95.5% of people wanting to work participated in
regular activation measures,, while for example in FI and in DK the percentages were 26.7% 50.7%
(estimated values)respectively.
The Long term unemployment rate, on the other extreme, is the indicator with the highest number
of countries (overall 16) performing above the EU-average. This indicator reaches its best
performance in CY, LU, NL, AT, FI, SE and UK. For CY and UK though the performance in the last 5
years has been above the EU average (Figure 31). PL and DE are the most effective in the trend of
reducing long term unemployment while IE and ES combine high long term unemployment in 2011
with an increasing trend in 2006-2011.
Component 3: Effective active labour market policies (ALMP)
source
dir
ect
ion time coverage
(complete
series)
Expenditure on ALMP per person in labour reserve Eurostat, Labour Market
Policy + 2005-2010
Expenditure on ALMP as % of GDPEurostat, Labour Market
Policy + 2005-2010
ActivationEurostat, Labour Market
Policy + 2005-2010
Long term unemployment rate LFS - 2000-2011
Indicator list
Component 3: Effective active labour market policies (ALMP)
EMCOEMCO-
modifiedJAF
Expenditure on ALMP per person in labour reserve X X sub-indicator (PA3)
Expenditure on ALMP as % of GDP X X sub-indicator (PA3)
Activation X X sub-indicator (PA3)
Long term unemployment rate X main indicator (PA3)
Indicator list
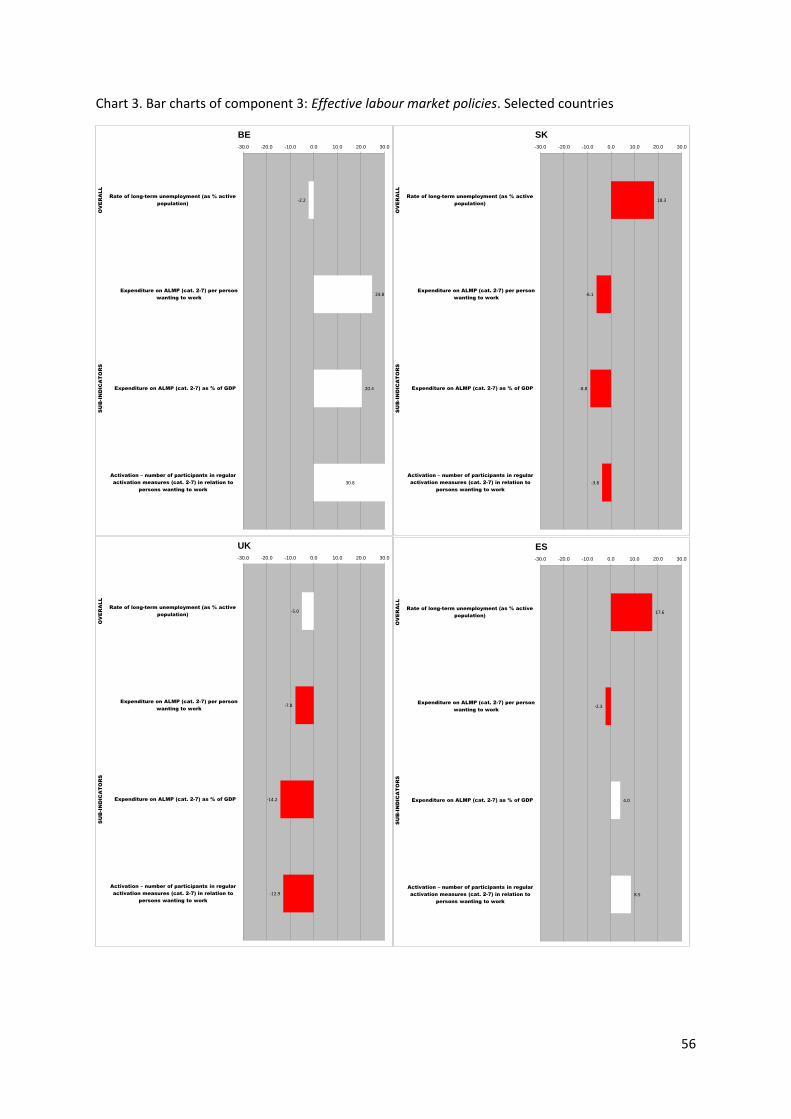
56
Chart 3. Bar charts of component 3: Effective labour market policies. Selected countries
-2.2
24.8
20.4
30.8
-30.0 -20.0 -10.0 0.0 10.0 20.0 30.0
Rate of long-term unemployment (as % active
population)
Expenditure on ALMP (cat. 2-7) per person
wanting to work
Expenditure on ALMP (cat. 2-7) as % of GDP
Activation – number of participants in regular
activation measures (cat. 2-7) in relation to
persons wanting to work
OV
ER
AL
LS
UB
-IN
DIC
AT
OR
S
BE
18.3
-6.1
-8.8
-3.8
-30.0 -20.0 -10.0 0.0 10.0 20.0 30.0
Rate of long-term unemployment (as % active
population)
Expenditure on ALMP (cat. 2-7) per person
wanting to work
Expenditure on ALMP (cat. 2-7) as % of GDP
Activation – number of participants in regular
activation measures (cat. 2-7) in relation to
persons wanting to work
OV
ER
AL
LS
UB
-IN
DIC
AT
OR
S
SK
-5.0
-7.8
-14.2
-12.9
-30.0 -20.0 -10.0 0.0 10.0 20.0 30.0
Rate of long-term unemployment (as % active
population)
Expenditure on ALMP (cat. 2-7) per person
wanting to work
Expenditure on ALMP (cat. 2-7) as % of GDP
Activation – number of participants in regular
activation measures (cat. 2-7) in relation to
persons wanting to work
OV
ER
AL
LS
UB
-IN
DIC
AT
OR
S
UK
17.6
-2.3
4.0
8.5
-30.0 -20.0 -10.0 0.0 10.0 20.0 30.0
Rate of long-term unemployment (as % active
population)
Expenditure on ALMP (cat. 2-7) per person
wanting to work
Expenditure on ALMP (cat. 2-7) as % of GDP
Activation – number of participants in regular
activation measures (cat. 2-7) in relation to
persons wanting to work
OV
ER
AL
LS
UB
-IN
DIC
AT
OR
S
ES
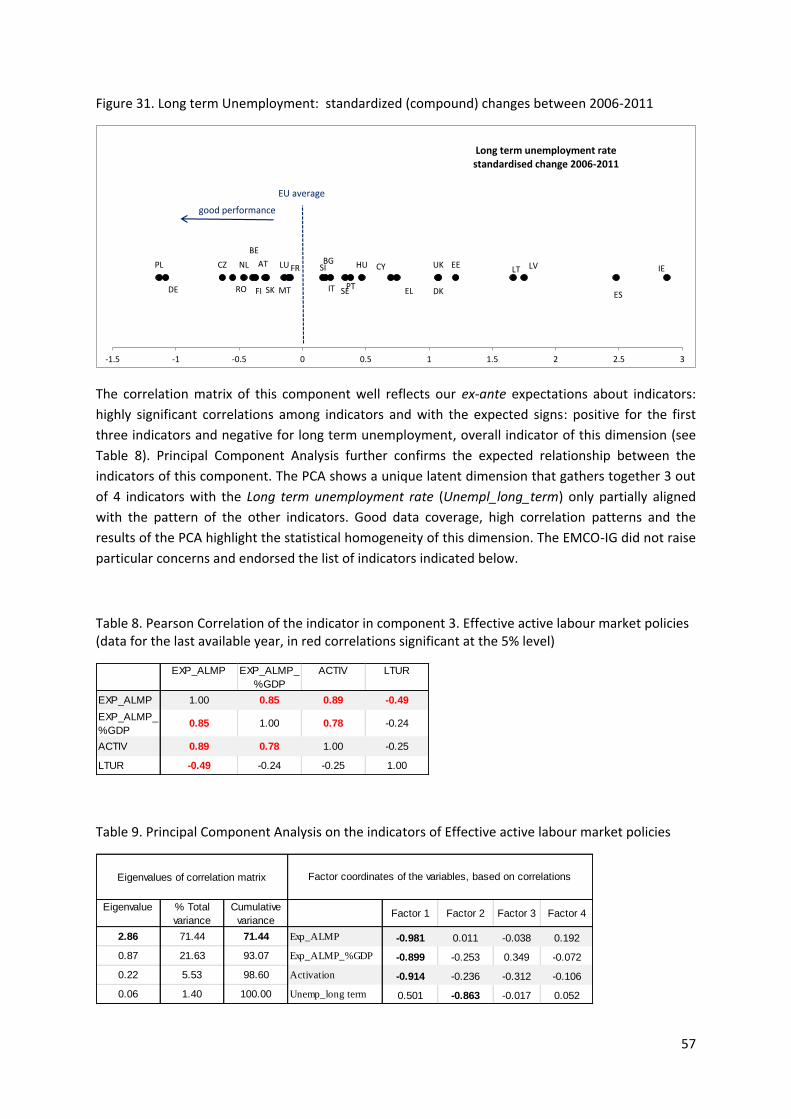
57
Figure 31. Long term Unemployment: standardized (compound) changes between 2006-2011
The correlation matrix of this component well reflects our ex-ante expectations about indicators:
highly significant correlations among indicators and with the expected signs: positive for the first
three indicators and negative for long term unemployment, overall indicator of this dimension (see
Table 8). Principal Component Analysis further confirms the expected relationship between the
indicators of this component. The PCA shows a unique latent dimension that gathers together 3 out
of 4 indicators with the Long term unemployment rate (Unempl_long_term) only partially aligned
with the pattern of the other indicators. Good data coverage, high correlation patterns and the
results of the PCA highlight the statistical homogeneity of this dimension. The EMCO-IG did not raise
particular concerns and endorsed the list of indicators indicated below.
Table 8. Pearson Correlation of the indicator in component 3. Effective active labour market policies (data for the last available year, in red correlations significant at the 5% level)
Table 9. Principal Component Analysis on the indicators of Effective active labour market policies
BEBGCZ
DKDE
EE IE
EL ES
FR
IT
CY LVLTLU HU
MT
NL ATPL
PTRO
SI
SKFI SE
UK
-1.5 -1 -0.5 0 0.5 1 1.5 2 2.5 3
Long term unemployment ratestandardised change 2006-2011
EU average
good performance
EXP_ALMP EXP_ALMP_
%GDP
ACTIV LTUR
EXP_ALMP 1.00 0.85 0.89 -0.49
EXP_ALMP_
%GDP0.85 1.00 0.78 -0.24
ACTIV 0.89 0.78 1.00 -0.25
LTUR -0.49 -0.24 -0.25 1.00
Eigenvalue % Total
variance
Cumulative
varianceFactor 1 Factor 2 Factor 3 Factor 4
2.86 71.44 71.44 Exp_ALMP -0.981 0.011 -0.038 0.192
0.87 21.63 93.07 Exp_ALMP_%GDP -0.899 -0.253 0.349 -0.072
0.22 5.53 98.60 Activation -0.914 -0.236 -0.312 -0.106
0.06 1.40 100.00 Unemp_long term 0.501 -0.863 -0.017 0.052
Eigenvalues of correlation matrix Factor coordinates of the variables, based on correlations

58
JAF Reclassification: Effective labour market policy
Objective: Effective active labour market policies (ALMP) are meant to help people in coping with
rapid change, to reduce unemployment spells and to ease transitions toward new jobs. It contains 4
indicators which are homogeneous in terms of data and country coverage.
Indicators
Overall Indicator
1. Long term unemployment rate
Sub-Indicators
2. Expenditure on Active Labour Market Policies per person wanting to work (cat. 2-7) 3. Expenditure on Active Labour Market Policies (ALMP) as percentage of GDP 4. Activation
4.4 Modern social security systems
The dimension of modern social security systems aims at providing an adequate income support,
encouraging employment and facilitating labour market mobility. It accounts for a broad
consideration of social protection provisions (unemployment benefits, pensions and healthcare
meant to help people in reconciling their job and private life).
This dimension is further divided into two sub-components: a. Social security systems and b.
Reconciliation of work and private life. We analyse the two subcomponents separately and Figure 32
contains the indicators from each of them.
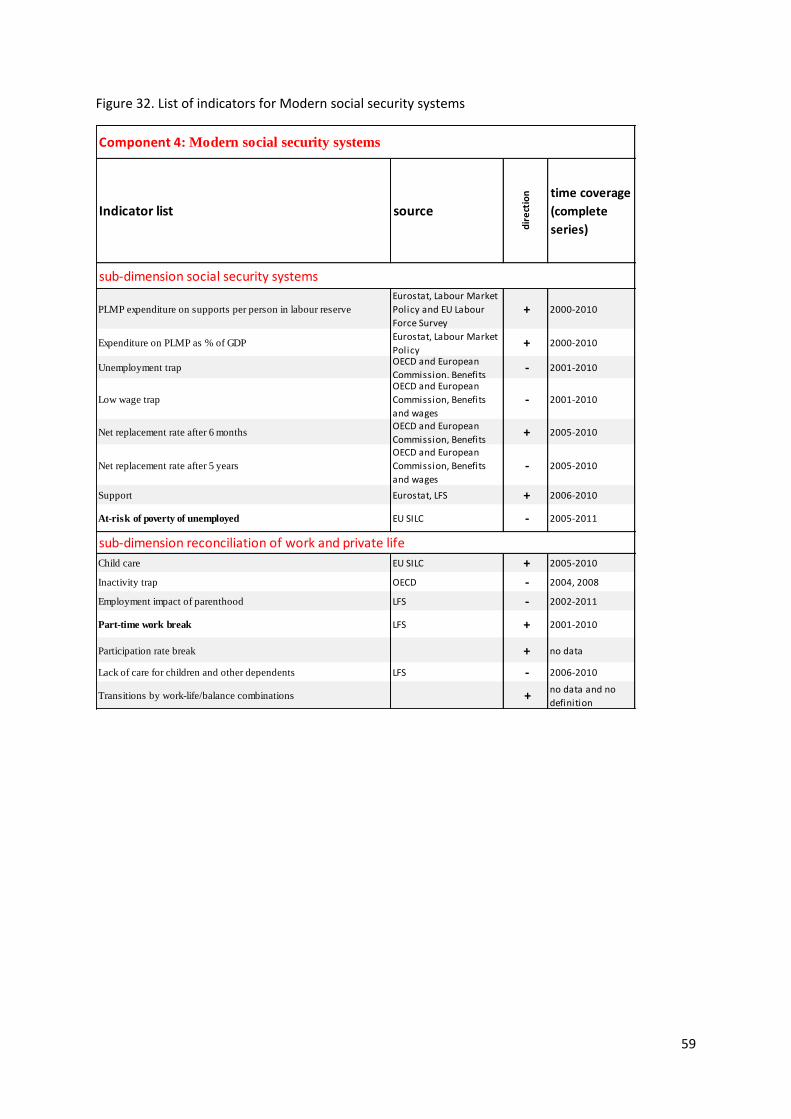
59
Figure 32. List of indicators for Modern social security systems
Component 4: Modern social security systems
source
dir
ect
ion time coverage
(complete
series)
sub-dimension social security systems
PLMP expenditure on supports per person in labour reserve
Eurostat, Labour Market
Policy and EU Labour
Force Survey + 2000-2010
Expenditure on PLMP as % of GDPEurostat, Labour Market
Policy + 2000-2010
Unemployment trapOECD and European
Commission, Benefits - 2001-2010
Low wage trap
OECD and European
Commission, Benefits
and wages - 2001-2010
Net replacement rate after 6 monthsOECD and European
Commission, Benefits + 2005-2010
Net replacement rate after 5 years
OECD and European
Commission, Benefits
and wages - 2005-2010
Support Eurostat, LFS + 2006-2010
At-risk of poverty of unemployed EU SILC - 2005-2011
sub-dimension reconciliation of work and private life
Child care EU SILC + 2005-2010
Inactivity trap OECD - 2004, 2008
Employment impact of parenthood LFS - 2002-2011
Part-time work break LFS + 2001-2010
Participation rate break + no data
Lack of care for children and other dependents LFS - 2006-2010
Transitions by work-life/balance combinations +no data and no
definition
Indicator list
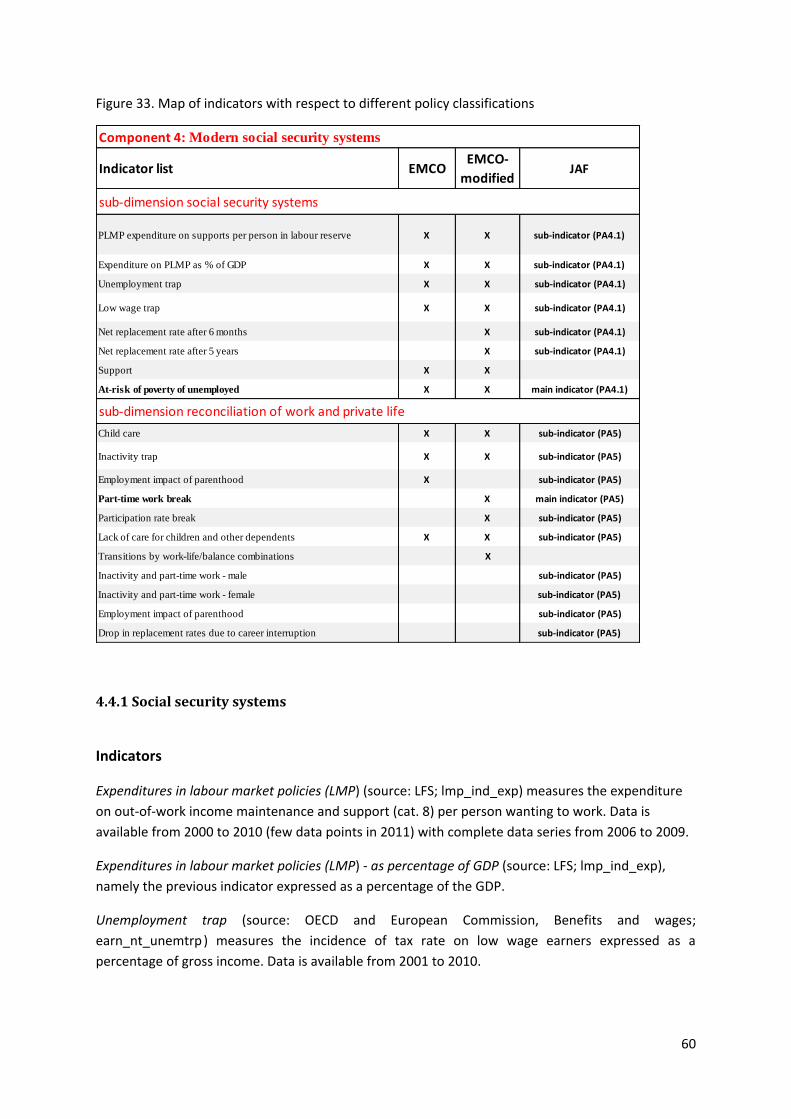
60
Figure 33. Map of indicators with respect to different policy classifications
4.4.1 Social security systems
Indicators
Expenditures in labour market policies (LMP) (source: LFS; lmp_ind_exp) measures the expenditure
on out-of-work income maintenance and support (cat. 8) per person wanting to work. Data is
available from 2000 to 2010 (few data points in 2011) with complete data series from 2006 to 2009.
Expenditures in labour market policies (LMP) - as percentage of GDP (source: LFS; lmp_ind_exp),
namely the previous indicator expressed as a percentage of the GDP.
Unemployment trap (source: OECD and European Commission, Benefits and wages;
earn_nt_unemtrp ) measures the incidence of tax rate on low wage earners expressed as a
percentage of gross income. Data is available from 2001 to 2010.
Component 4: Modern social security systems
EMCOEMCO-
modifiedJAF
sub-dimension social security systems
PLMP expenditure on supports per person in labour reserve X X sub-indicator (PA4.1)
Expenditure on PLMP as % of GDP X X sub-indicator (PA4.1)
Unemployment trap X X sub-indicator (PA4.1)
Low wage trap X X sub-indicator (PA4.1)
Net replacement rate after 6 months X sub-indicator (PA4.1)
Net replacement rate after 5 years X sub-indicator (PA4.1)
Support X X
At-risk of poverty of unemployed X X main indicator (PA4.1)
sub-dimension reconciliation of work and private life
Child care X X sub-indicator (PA5)
Inactivity trap X X sub-indicator (PA5)
Employment impact of parenthood X sub-indicator (PA5)
Part-time work break X main indicator (PA5)
Participation rate break X sub-indicator (PA5)
Lack of care for children and other dependents X X sub-indicator (PA5)
Transitions by work-life/balance combinations X
Inactivity and part-time work - male sub-indicator (PA5)
Inactivity and part-time work - female sub-indicator (PA5)
Employment impact of parenthood sub-indicator (PA5)
Drop in replacement rates due to career interruption sub-indicator (PA5)
Indicator list
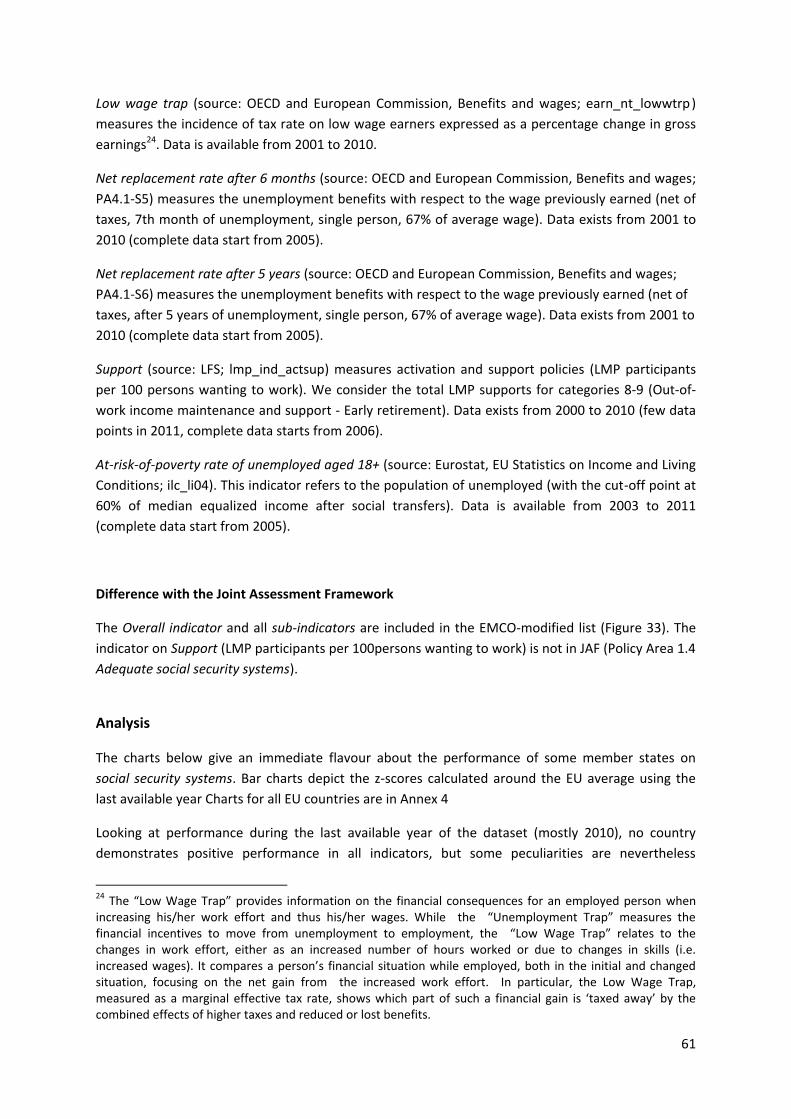
61
Low wage trap (source: OECD and European Commission, Benefits and wages; earn_nt_lowwtrp )
measures the incidence of tax rate on low wage earners expressed as a percentage change in gross
earnings24. Data is available from 2001 to 2010.
Net replacement rate after 6 months (source: OECD and European Commission, Benefits and wages;
PA4.1-S5) measures the unemployment benefits with respect to the wage previously earned (net of
taxes, 7th month of unemployment, single person, 67% of average wage). Data exists from 2001 to
2010 (complete data start from 2005).
Net replacement rate after 5 years (source: OECD and European Commission, Benefits and wages;
PA4.1-S6) measures the unemployment benefits with respect to the wage previously earned (net of
taxes, after 5 years of unemployment, single person, 67% of average wage). Data exists from 2001 to
2010 (complete data start from 2005).
Support (source: LFS; lmp_ind_actsup) measures activation and support policies (LMP participants
per 100 persons wanting to work). We consider the total LMP supports for categories 8-9 (Out-of-
work income maintenance and support - Early retirement). Data exists from 2000 to 2010 (few data
points in 2011, complete data starts from 2006).
At-risk-of-poverty rate of unemployed aged 18+ (source: Eurostat, EU Statistics on Income and Living
Conditions; ilc_li04). This indicator refers to the population of unemployed (with the cut-off point at
60% of median equalized income after social transfers). Data is available from 2003 to 2011
(complete data start from 2005).
Difference with the Joint Assessment Framework
The Overall indicator and all sub-indicators are included in the EMCO-modified list (Figure 33). The
indicator on Support (LMP participants per 100persons wanting to work) is not in JAF (Policy Area 1.4
Adequate social security systems).
Analysis
The charts below give an immediate flavour about the performance of some member states on
social security systems. Bar charts depict the z-scores calculated around the EU average using the
last available year Charts for all EU countries are in Annex 4
Looking at performance during the last available year of the dataset (mostly 2010), no country
demonstrates positive performance in all indicators, but some peculiarities are nevertheless
24 The “Low Wage Trap” provides information on the financial consequences for an employed person when increasing his/her work effort and thus his/her wages. While the “Unemployment Trap” measures the financial incentives to move from unemployment to employment, the “Low Wage Trap” relates to the changes in work effort, either as an increased number of hours worked or due to changes in skills (i.e. increased wages). It compares a person’s financial situation while employed, both in the initial and changed situation, focusing on the net gain from the increased work effort. In particular, the Low Wage Trap, measured as a marginal effective tax rate, shows which part of such a financial gain is ‘taxed away’ by the combined effects of higher taxes and reduced or lost benefits.
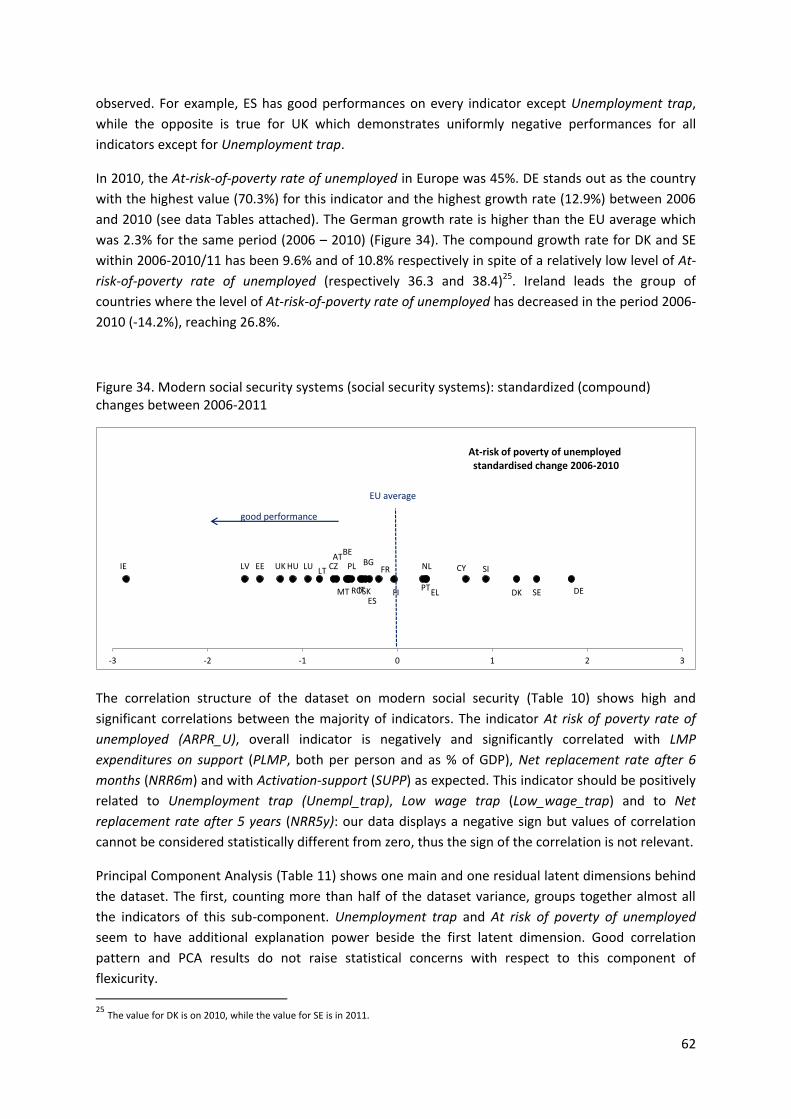
62
observed. For example, ES has good performances on every indicator except Unemployment trap,
while the opposite is true for UK which demonstrates uniformly negative performances for all
indicators except for Unemployment trap.
In 2010, the At-risk-of-poverty rate of unemployed in Europe was 45%. DE stands out as the country
with the highest value (70.3%) for this indicator and the highest growth rate (12.9%) between 2006
and 2010 (see data Tables attached). The German growth rate is higher than the EU average which
was 2.3% for the same period (2006 – 2010) (Figure 34). The compound growth rate for DK and SE
within 2006-2010/11 has been 9.6% and of 10.8% respectively in spite of a relatively low level of At-
risk-of-poverty rate of unemployed (respectively 36.3 and 38.4)25. Ireland leads the group of
countries where the level of At-risk-of-poverty rate of unemployed has decreased in the period 2006-
2010 (-14.2%), reaching 26.8%.
Figure 34. Modern social security systems (social security systems): standardized (compound) changes between 2006-2011
The correlation structure of the dataset on modern social security (Table 10) shows high and
significant correlations between the majority of indicators. The indicator At risk of poverty rate of
unemployed (ARPR_U), overall indicator is negatively and significantly correlated with LMP
expenditures on support (PLMP, both per person and as % of GDP), Net replacement rate after 6
months (NRR6m) and with Activation-support (SUPP) as expected. This indicator should be positively
related to Unemployment trap (Unempl_trap), Low wage trap (Low_wage_trap) and to Net
replacement rate after 5 years (NRR5y): our data displays a negative sign but values of correlation
cannot be considered statistically different from zero, thus the sign of the correlation is not relevant.
Principal Component Analysis (Table 11) shows one main and one residual latent dimensions behind
the dataset. The first, counting more than half of the dataset variance, groups together almost all
the indicators of this sub-component. Unemployment trap and At risk of poverty of unemployed
seem to have additional explanation power beside the first latent dimension. Good correlation
pattern and PCA results do not raise statistical concerns with respect to this component of
flexicurity.
25 The value for DK is on 2010, while the value for SE is in 2011.
BEBGCZ
DK DE
EEIE
ELES
FR
IT
CYLVLT
LUHU
MT
NLAT
PL
PTRO
SI
SK FI SE
UK
-3 -2 -1 0 1 2 3
At-risk of poverty of unemployed standardised change 2006-2010
EU average
good performance
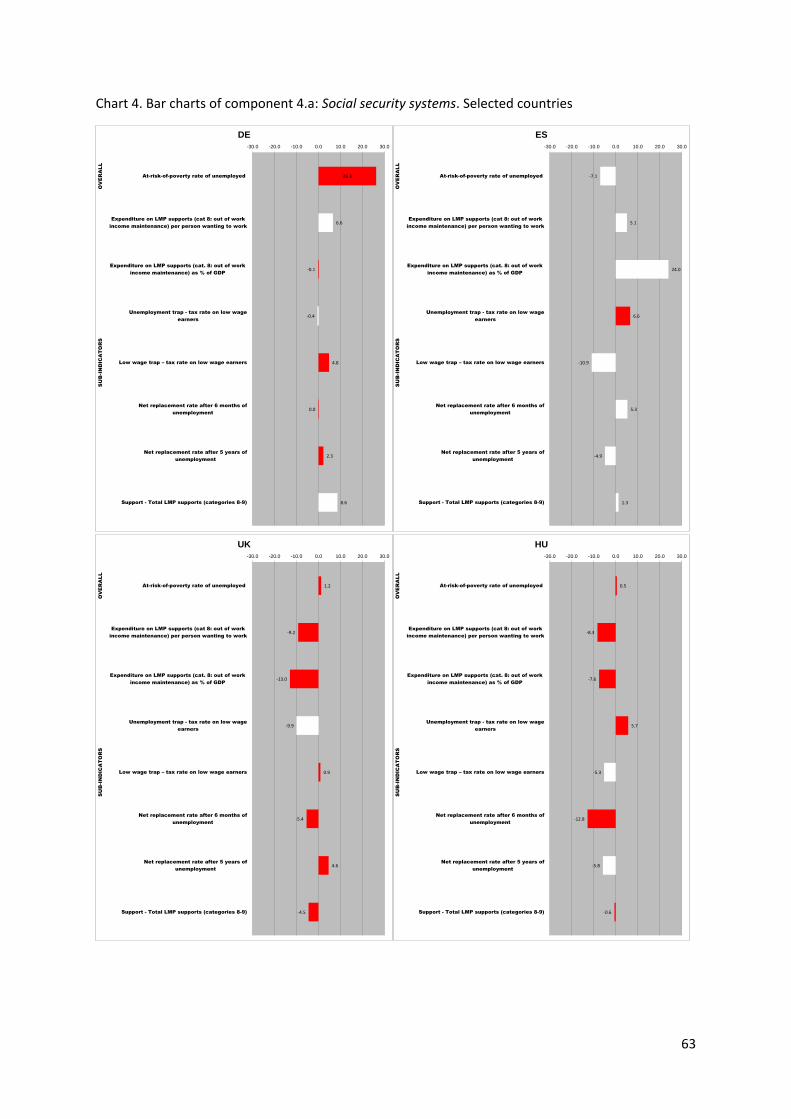
63
Chart 4. Bar charts of component 4.a: Social security systems. Selected countries
26.3
6.6
-0.1
-0.4
4.8
0.0
2.3
8.6
-30.0 -20.0 -10.0 0.0 10.0 20.0 30.0
At-risk-of-poverty rate of unemployed
Expenditure on LMP supports (cat 8: out of work
income maintenance) per person wanting to work
Expenditure on LMP supports (cat. 8: out of work
income maintenance) as % of GDP
Unemployment trap - tax rate on low wage
earners
Low wage trap – tax rate on low wage earners
Net replacement rate after 6 months of
unemployment
Net replacement rate after 5 years of
unemployment
Support - Total LMP supports (categories 8-9)
OV
ER
AL
LS
UB
-IN
DIC
AT
OR
S
DE
-7.1
5.1
24.0
6.6
-10.9
5.3
-4.9
1.3
-30.0 -20.0 -10.0 0.0 10.0 20.0 30.0
At-risk-of-poverty rate of unemployed
Expenditure on LMP supports (cat 8: out of work
income maintenance) per person wanting to work
Expenditure on LMP supports (cat. 8: out of work
income maintenance) as % of GDP
Unemployment trap - tax rate on low wage
earners
Low wage trap – tax rate on low wage earners
Net replacement rate after 6 months of
unemployment
Net replacement rate after 5 years of
unemployment
Support - Total LMP supports (categories 8-9)
OV
ER
AL
LS
UB
-IN
DIC
AT
OR
S
ES
1.2
-9.2
-13.0
-9.9
0.9
-5.4
4.6
-4.5
-30.0 -20.0 -10.0 0.0 10.0 20.0 30.0
At-risk-of-poverty rate of unemployed
Expenditure on LMP supports (cat 8: out of work
income maintenance) per person wanting to work
Expenditure on LMP supports (cat. 8: out of work
income maintenance) as % of GDP
Unemployment trap - tax rate on low wage
earners
Low wage trap – tax rate on low wage earners
Net replacement rate after 6 months of
unemployment
Net replacement rate after 5 years of
unemployment
Support - Total LMP supports (categories 8-9)
OV
ER
AL
LS
UB
-IN
DIC
AT
OR
S
UK
0.5
-8.3
-7.6
5.7
-5.3
-12.8
-5.8
-0.6
-30.0 -20.0 -10.0 0.0 10.0 20.0 30.0
At-risk-of-poverty rate of unemployed
Expenditure on LMP supports (cat 8: out of work
income maintenance) per person wanting to work
Expenditure on LMP supports (cat. 8: out of work
income maintenance) as % of GDP
Unemployment trap - tax rate on low wage
earners
Low wage trap – tax rate on low wage earners
Net replacement rate after 6 months of
unemployment
Net replacement rate after 5 years of
unemployment
Support - Total LMP supports (categories 8-9)
OV
ER
AL
LS
UB
-IN
DIC
AT
OR
S
HU
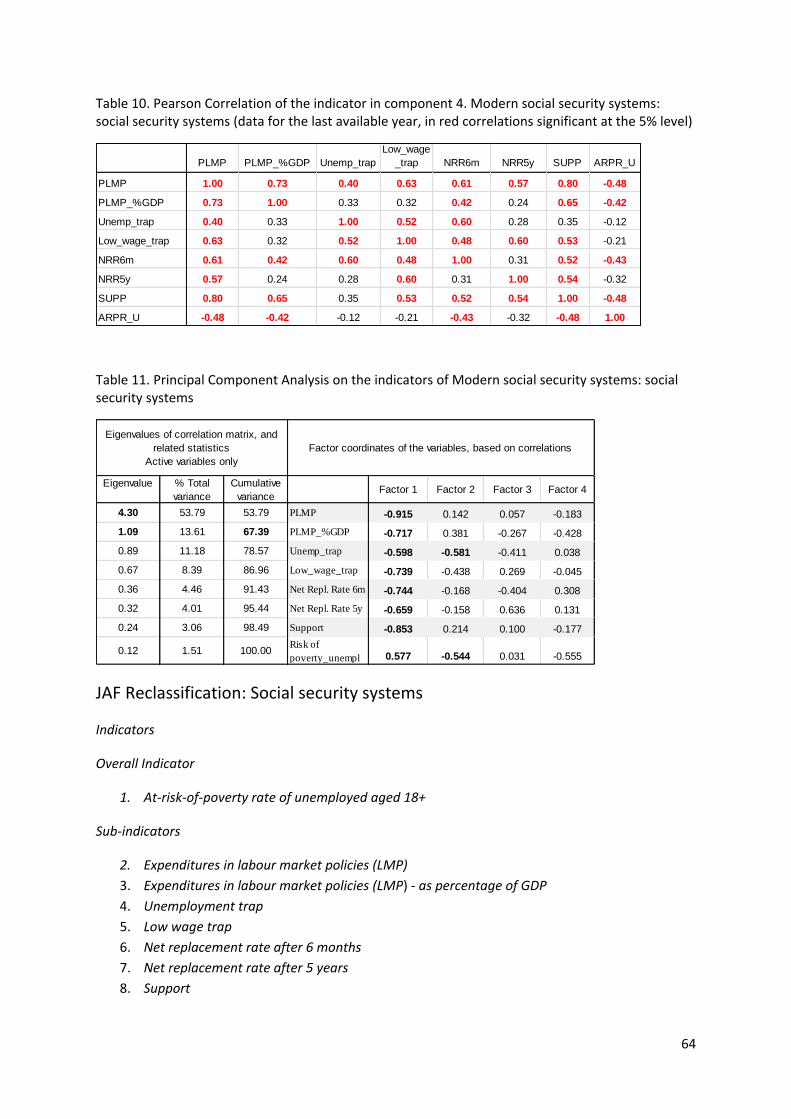
64
Table 10. Pearson Correlation of the indicator in component 4. Modern social security systems: social security systems (data for the last available year, in red correlations significant at the 5% level)
Table 11. Principal Component Analysis on the indicators of Modern social security systems: social security systems
JAF Reclassification: Social security systems
Indicators
Overall Indicator
1. At-risk-of-poverty rate of unemployed aged 18+
Sub-indicators
2. Expenditures in labour market policies (LMP)
3. Expenditures in labour market policies (LMP) - as percentage of GDP
4. Unemployment trap
5. Low wage trap
6. Net replacement rate after 6 months
7. Net replacement rate after 5 years
8. Support
PLMP PLMP_%GDP Unemp_trap
Low_wage
_trap NRR6m NRR5y SUPP ARPR_U
PLMP 1.00 0.73 0.40 0.63 0.61 0.57 0.80 -0.48
PLMP_%GDP 0.73 1.00 0.33 0.32 0.42 0.24 0.65 -0.42
Unemp_trap 0.40 0.33 1.00 0.52 0.60 0.28 0.35 -0.12
Low_wage_trap 0.63 0.32 0.52 1.00 0.48 0.60 0.53 -0.21
NRR6m 0.61 0.42 0.60 0.48 1.00 0.31 0.52 -0.43
NRR5y 0.57 0.24 0.28 0.60 0.31 1.00 0.54 -0.32
SUPP 0.80 0.65 0.35 0.53 0.52 0.54 1.00 -0.48
ARPR_U -0.48 -0.42 -0.12 -0.21 -0.43 -0.32 -0.48 1.00
Eigenvalue % Total
variance
Cumulative
varianceFactor 1 Factor 2 Factor 3 Factor 4
4.30 53.79 53.79 PLMP -0.915 0.142 0.057 -0.183
1.09 13.61 67.39 PLMP_%GDP -0.717 0.381 -0.267 -0.428
0.89 11.18 78.57 Unemp_trap -0.598 -0.581 -0.411 0.038
0.67 8.39 86.96 Low_wage_trap -0.739 -0.438 0.269 -0.045
0.36 4.46 91.43 Net Repl. Rate 6m -0.744 -0.168 -0.404 0.308
0.32 4.01 95.44 Net Repl. Rate 5y -0.659 -0.158 0.636 0.131
0.24 3.06 98.49 Support -0.853 0.214 0.100 -0.177
0.12 1.51 100.00Risk of
poverty_unempl 0.577 -0.544 0.031 -0.555
Eigenvalues of correlation matrix, and
related statistics
Active variables only
Factor coordinates of the variables, based on correlations
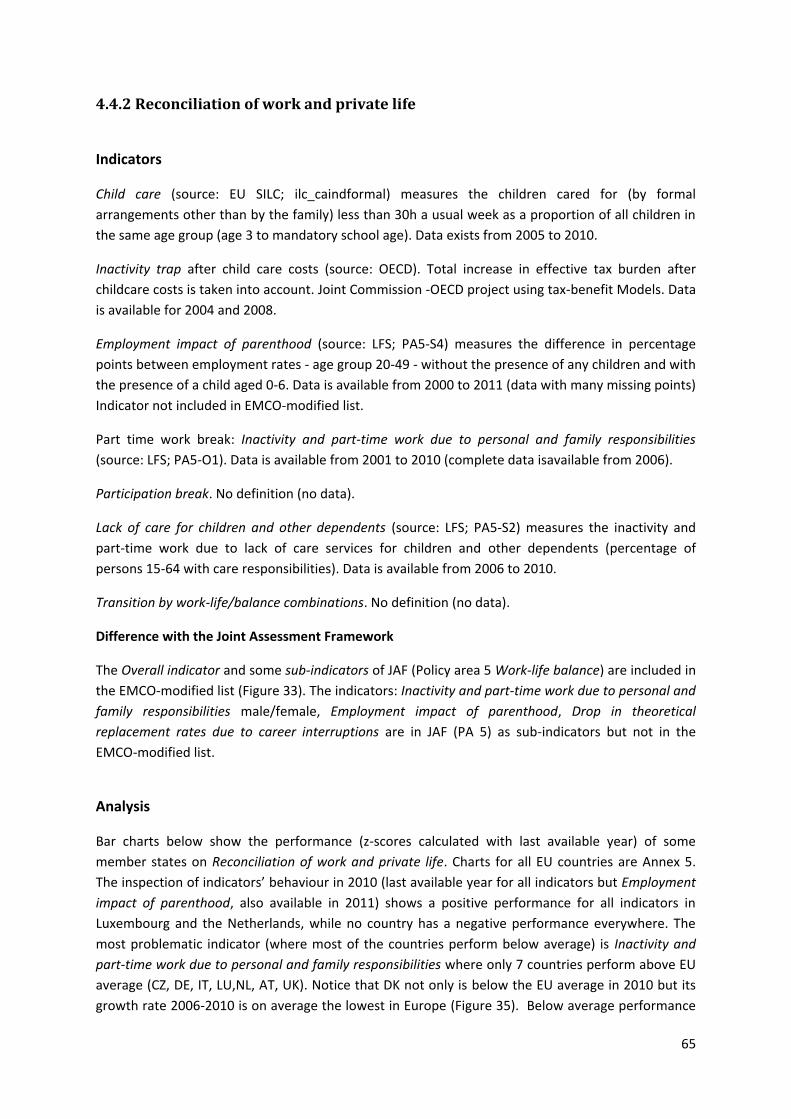
65
4.4.2 Reconciliation of work and private life
Indicators
Child care (source: EU SILC; ilc_caindformal) measures the children cared for (by formal
arrangements other than by the family) less than 30h a usual week as a proportion of all children in
the same age group (age 3 to mandatory school age). Data exists from 2005 to 2010.
Inactivity trap after child care costs (source: OECD). Total increase in effective tax burden after
childcare costs is taken into account. Joint Commission -OECD project using tax-benefit Models. Data
is available for 2004 and 2008.
Employment impact of parenthood (source: LFS; PA5-S4) measures the difference in percentage
points between employment rates - age group 20-49 - without the presence of any children and with
the presence of a child aged 0-6. Data is available from 2000 to 2011 (data with many missing points)
Indicator not included in EMCO-modified list.
Part time work break: Inactivity and part-time work due to personal and family responsibilities
(source: LFS; PA5-O1). Data is available from 2001 to 2010 (complete data isavailable from 2006).
Participation break. No definition (no data).
Lack of care for children and other dependents (source: LFS; PA5-S2) measures the inactivity and
part-time work due to lack of care services for children and other dependents (percentage of
persons 15-64 with care responsibilities). Data is available from 2006 to 2010.
Transition by work-life/balance combinations. No definition (no data).
Difference with the Joint Assessment Framework
The Overall indicator and some sub-indicators of JAF (Policy area 5 Work-life balance) are included in
the EMCO-modified list (Figure 33). The indicators: Inactivity and part-time work due to personal and
family responsibilities male/female, Employment impact of parenthood, Drop in theoretical
replacement rates due to career interruptions are in JAF (PA 5) as sub-indicators but not in the
EMCO-modified list.
Analysis
Bar charts below show the performance (z-scores calculated with last available year) of some
member states on Reconciliation of work and private life. Charts for all EU countries are Annex 5.
The inspection of indicators’ behaviour in 2010 (last available year for all indicators but Employment
impact of parenthood, also available in 2011) shows a positive performance for all indicators in
Luxembourg and the Netherlands, while no country has a negative performance everywhere. The
most problematic indicator (where most of the countries perform below average) is Inactivity and
part-time work due to personal and family responsibilities where only 7 countries perform above EU
average (CZ, DE, IT, LU,NL, AT, UK). Notice that DK not only is below the EU average in 2010 but its
growth rate 2006-2010 is on average the lowest in Europe (Figure 35). Below average performance
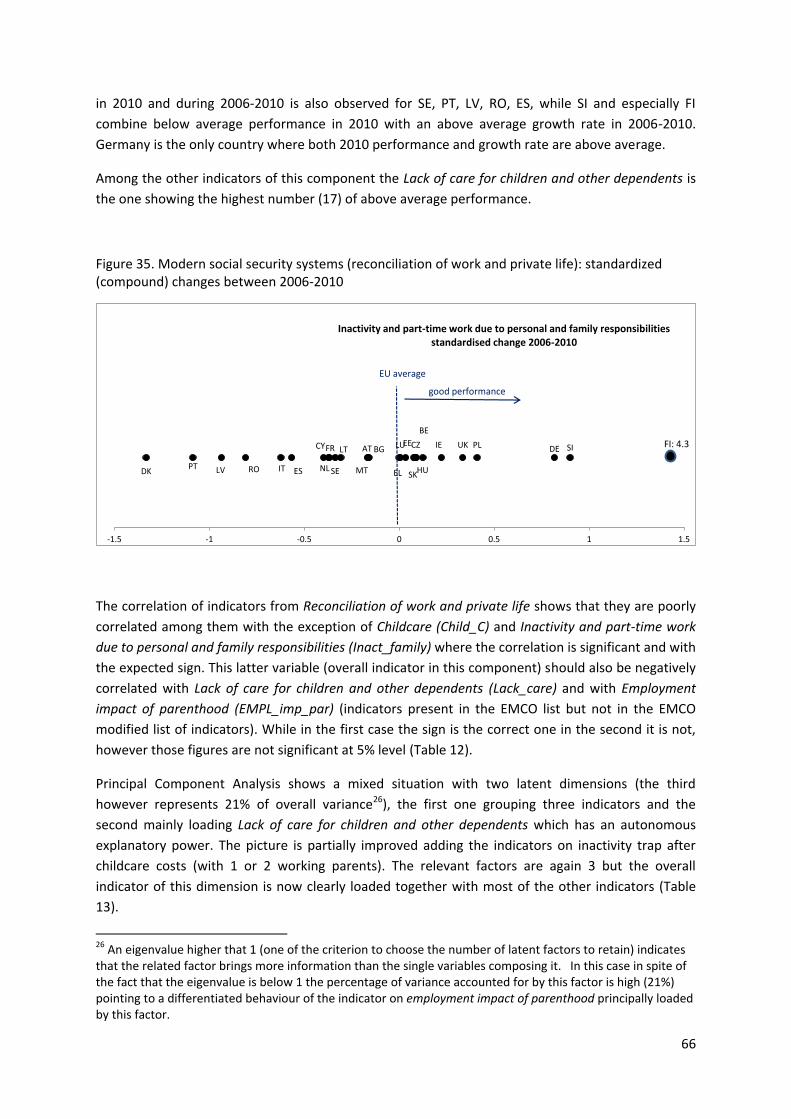
66
in 2010 and during 2006-2010 is also observed for SE, PT, LV, RO, ES, while SI and especially FI
combine below average performance in 2010 with an above average growth rate in 2006-2010.
Germany is the only country where both 2010 performance and growth rate are above average.
Among the other indicators of this component the Lack of care for children and other dependents is
the one showing the highest number (17) of above average performance.
Figure 35. Modern social security systems (reconciliation of work and private life): standardized (compound) changes between 2006-2010
The correlation of indicators from Reconciliation of work and private life shows that they are poorly
correlated among them with the exception of Childcare (Child_C) and Inactivity and part-time work
due to personal and family responsibilities (Inact_family) where the correlation is significant and with
the expected sign. This latter variable (overall indicator in this component) should also be negatively
correlated with Lack of care for children and other dependents (Lack_care) and with Employment
impact of parenthood (EMPL_imp_par) (indicators present in the EMCO list but not in the EMCO
modified list of indicators). While in the first case the sign is the correct one in the second it is not,
however those figures are not significant at 5% level (Table 12).
Principal Component Analysis shows a mixed situation with two latent dimensions (the third
however represents 21% of overall variance26), the first one grouping three indicators and the
second mainly loading Lack of care for children and other dependents which has an autonomous
explanatory power. The picture is partially improved adding the indicators on inactivity trap after
childcare costs (with 1 or 2 working parents). The relevant factors are again 3 but the overall
indicator of this dimension is now clearly loaded together with most of the other indicators (Table
13).
26 An eigenvalue higher that 1 (one of the criterion to choose the number of latent factors to retain) indicates that the related factor brings more information than the single variables composing it. In this case in spite of the fact that the eigenvalue is below 1 the percentage of variance accounted for by this factor is high (21%) pointing to a differentiated behaviour of the indicator on employment impact of parenthood principally loaded by this factor.
BE
BG CZ
DK
DEEE IE
ELES
FR
IT
CY
LV
LTLU
HUMTNL
AT PL
PT RO
SI
SKSE
UK
-1.5 -1 -0.5 0 0.5 1 1.5
Inactivity and part-time work due to personal and family responsibilitiesstandardised change 2006-2010
EU average
good performance
FI: 4.3
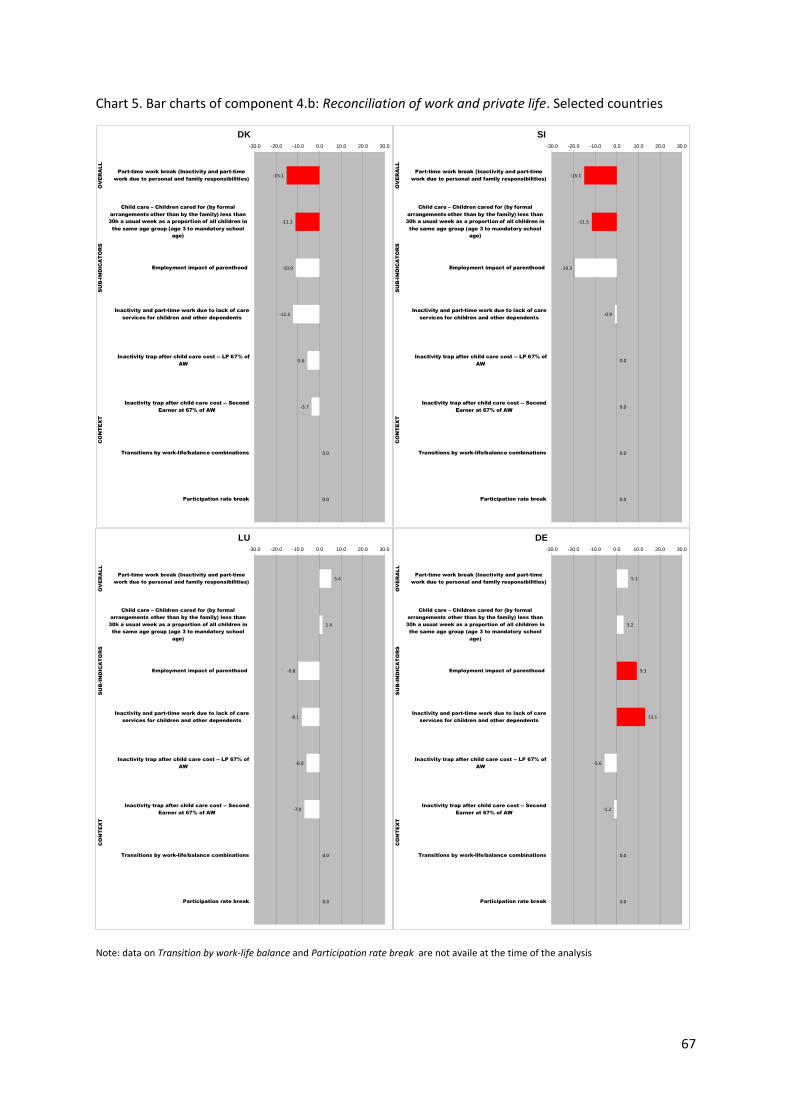
67
Chart 5. Bar charts of component 4.b: Reconciliation of work and private life. Selected countries
Note: data on Transition by work-life balance and Participation rate break are not availe at the time of the analysis
-15.1
-11.1
-10.9
-12.3
-5.6
-3.7
0.0
0.0
-30.0 -20.0 -10.0 0.0 10.0 20.0 30.0
Part-time work break (Inactivity and part-time
work due to personal and family responsibilities)
Child care – Children cared for (by formal
arrangements other than by the family) less than
30h a usual week as a proportion of all children in
the same age group (age 3 to mandatory school
age)
Employment impact of parenthood
Inactivity and part-time work due to lack of care
services for children and other dependents
Inactivity trap after child care cost -- LP 67% of
AW
Inactivity trap after child care cost -- Second
Earner at 67% of AW
Transitions by work-life/balance combinations
Participation rate break
OV
ER
ALL
SU
B-IN
DIC
AT
OR
SC
ON
TE
XT
DK
-15.1
-11.5
-19.3
-0.9
0.0
0.0
0.0
0.0
-30.0 -20.0 -10.0 0.0 10.0 20.0 30.0
Part-time work break (Inactivity and part-time
work due to personal and family responsibilities)
Child care – Children cared for (by formal
arrangements other than by the family) less than
30h a usual week as a proportion of all children in
the same age group (age 3 to mandatory school
age)
Employment impact of parenthood
Inactivity and part-time work due to lack of care
services for children and other dependents
Inactivity trap after child care cost -- LP 67% of
AW
Inactivity trap after child care cost -- Second
Earner at 67% of AW
Transitions by work-life/balance combinations
Participation rate break
OV
ER
ALL
SU
B-IN
DIC
AT
OR
SC
ON
TE
XT
SI
5.4
1.4
-9.8
-8.1
-6.0
-7.0
0.0
0.0
-30.0 -20.0 -10.0 0.0 10.0 20.0 30.0
Part-time work break (Inactivity and part-time
work due to personal and family responsibilities)
Child care – Children cared for (by formal
arrangements other than by the family) less than
30h a usual week as a proportion of all children in
the same age group (age 3 to mandatory school
age)
Employment impact of parenthood
Inactivity and part-time work due to lack of care
services for children and other dependents
Inactivity trap after child care cost -- LP 67% of
AW
Inactivity trap after child care cost -- Second
Earner at 67% of AW
Transitions by work-life/balance combinations
Participation rate break
OV
ER
AL
LS
UB
-IN
DIC
AT
OR
SC
ON
TE
XT
LU
5.1
3.2
9.3
13.1
-5.6
-1.2
0.0
0.0
-30.0 -20.0 -10.0 0.0 10.0 20.0 30.0
Part-time work break (Inactivity and part-time
work due to personal and family responsibilities)
Child care – Children cared for (by formal
arrangements other than by the family) less than
30h a usual week as a proportion of all children in
the same age group (age 3 to mandatory school
age)
Employment impact of parenthood
Inactivity and part-time work due to lack of care
services for children and other dependents
Inactivity trap after child care cost -- LP 67% of
AW
Inactivity trap after child care cost -- Second
Earner at 67% of AW
Transitions by work-life/balance combinations
Participation rate break
OV
ER
AL
LS
UB
-IN
DIC
AT
OR
SC
ON
TE
XT
DE
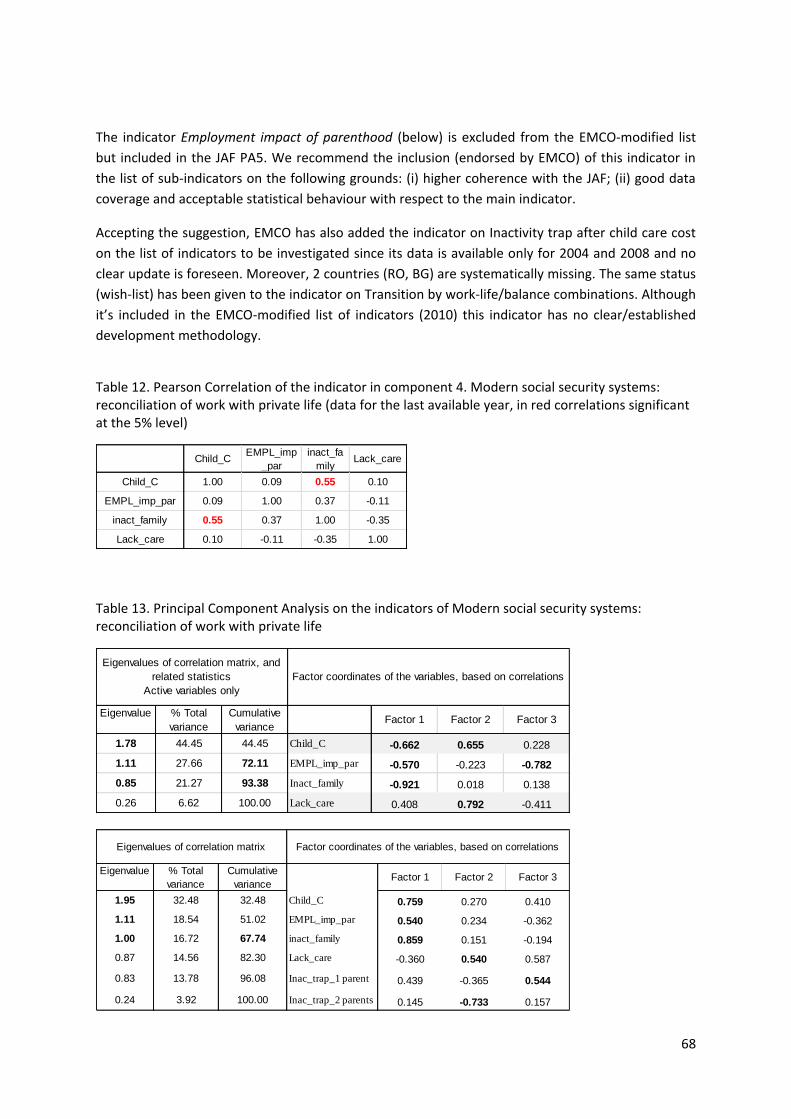
68
The indicator Employment impact of parenthood (below) is excluded from the EMCO-modified list
but included in the JAF PA5. We recommend the inclusion (endorsed by EMCO) of this indicator in
the list of sub-indicators on the following grounds: (i) higher coherence with the JAF; (ii) good data
coverage and acceptable statistical behaviour with respect to the main indicator.
Accepting the suggestion, EMCO has also added the indicator on Inactivity trap after child care cost
on the list of indicators to be investigated since its data is available only for 2004 and 2008 and no
clear update is foreseen. Moreover, 2 countries (RO, BG) are systematically missing. The same status
(wish-list) has been given to the indicator on Transition by work-life/balance combinations. Although
it’s included in the EMCO-modified list of indicators (2010) this indicator has no clear/established
development methodology.
Table 12. Pearson Correlation of the indicator in component 4. Modern social security systems: reconciliation of work with private life (data for the last available year, in red correlations significant at the 5% level)
Table 13. Principal Component Analysis on the indicators of Modern social security systems: reconciliation of work with private life
Child_CEMPL_imp
_par
inact_fa
milyLack_care
Child_C 1.00 0.09 0.55 0.10
EMPL_imp_par 0.09 1.00 0.37 -0.11
inact_family 0.55 0.37 1.00 -0.35
Lack_care 0.10 -0.11 -0.35 1.00
Eigenvalue % Total
variance
Cumulative
varianceFactor 1 Factor 2 Factor 3
1.78 44.45 44.45 Child_C -0.662 0.655 0.228
1.11 27.66 72.11 EMPL_imp_par -0.570 -0.223 -0.782
0.85 21.27 93.38 Inact_family -0.921 0.018 0.138
0.26 6.62 100.00 Lack_care 0.408 0.792 -0.411
Eigenvalues of correlation matrix, and
related statistics
Active variables only
Factor coordinates of the variables, based on correlations
Eigenvalue % Total
variance
Cumulative
varianceFactor 1 Factor 2 Factor 3
1.95 32.48 32.48 Child_C 0.759 0.270 0.410
1.11 18.54 51.02 EMPL_imp_par 0.540 0.234 -0.362
1.00 16.72 67.74 inact_family 0.859 0.151 -0.194
0.87 14.56 82.30 Lack_care -0.360 0.540 0.587
0.83 13.78 96.08 Inac_trap_1 parent 0.439 -0.365 0.544
0.24 3.92 100.00 Inac_trap_2 parents 0.145 -0.733 0.157
Eigenvalues of correlation matrix Factor coordinates of the variables, based on correlations

69
JAF Reclassification: Reconciliation of work and private life
Indicators
Overall Indicator
1. Inactivity and part-time work due to personal and family responsibilities Sub-indicators
2. Lack of care for children and other dependents
3. Child care
4. Employment impact of parenthood

70
5. Update of the joint EMPL-JRC project Flexicurity 1
At the end of 2010 the monitoring of the four Flexicurity components at the EU level was the object
of two lists of indicators: The so-called EMCO list (developed in 2007) and a revision of it dated 2010
and known as EMCO-modified list. Additionally, in 2010, the joint EMPL-JRC project Flexicurity 1 (AA
N° 30566-2007-03 A1CO ISP BE) produced from a set of indicators, only partially coinciding with the
two EMCO lists, five composite indicators: one for each of the four flexicurity dimensions and an
overall composite (Manca et al., 2010).
As three partially overlapping lists of indicators (the EMCO list, the EMCO-modified list and the list of
indicators used for the EMPL-JRC project) were available, in agreement with DG EMPL, we used
EMCO-modified list as the point of departure of the analysis and evaluated the additional indicators
of the EMCO list and of the joint EMPL-JRC project.
This section contains the comparison between the EMCO-modified list and the set of indicators used
in the joint EMPL-JRC project Flexicurity 1. The comparison between the EMCO and the EMCO-
modified list is contained in Section 4.
Table 14 presents the set of indicators of the joint EMPL-JRC project Flexicurity 1. Both the table and
the corresponding data are contained in the file Excel: Update_EMPL-JRC project. Data is updated at
the last available year (for most of the variables 2011).
As already mentioned, the list indicators of the joint EMPL-JRC project only partially coincides with
the EMCO-modified list. In some cases the EMPL-JRC list contains different indicators (as in the case
of Total employees in fixed-term only contracts as % of persons in employment or Share of employees
in part-time), in some other cases the EMPL-JRC list contains breakdown (by gender or by activity) of
an indicator contained in the EMCO-modified list. This is the case for:
- Employment Protection Legislation: the EMCO-modified list includes Ratio of EPL on
temporary vs. regular contracts, while the EMPL-JRC list contains two additional variables
(part of this composite indicator calculated by the OECD).
- Overtime work: included in the EMCO-modified list as total overtime work, the available
data comes from a special LFS module of 2004. LFS data available in ESTAT database only
supplies the breakdowns by type of overtime work (Saturdays, Sundays nights, etc.) but not
the total. The total cannot be inferred as sum of overtime work categories since double
counting could be present (for workers working both at night, during Sundays or Saturdays).
The EMPL-JRC lists both as total and with the different breakdowns by type of overtime work
(i.e. work on Saturdays, Sundays, nights, etc.).
- Participation in CVT and Lifelong Learning : included in the EMCO-modified as total, and
included in the EMPL-JRC only by gender breakdown.
- Labour Market Expenditures Expenditure as percentage of GDP and Labour Market Spending
per participant in millions euros: included in the EMCO-modified as total expenditures but
71
included in the EMPL-JRC list only with the breakdown by type of expenditures (training, job
sharing, job creation, etc.).
- Unemployment trap: included in the EMCO-modified as an overall indictor whereas the
EMPL-JRC list distinguishes it according to the type of household (single earner, couple with
or without children, etc.).
- Inactivity trap: the EMCO-modified list contains an overall indicator of Low wage trap,
whereas the EMPL-JRC contains three indicators of inactivity trap depending on the
household considered (single parent, one earner+2 children, and 2 earners+2 children). The
main difference between the two indicators is that the Inactivity trap is calculated for the
households at 67% of the Average Wage, while Low-wage gap is calculated for single
persons without children, 33% of AW. Data coverage is also a problem with the EMPL-JRC
list, where only three years (2005, 2006, and 2007) are available.
- Net replacement rate: the EMCO-modified list contains the net replacement rate after 6
months and 5 years for single persons, 67% of average wage. The EMPL-JRC list contains
more breakdowns but data is available only for 2005, 2006, and 2007.
- Childcare services: the EMCO-modified list contains an indicator of childcare services (1-29
hours) for families with children aged 3 years to compulsory school age. The EMPL-JRC list
contains more breakdowns both in terms of the age of the children and of the number of
hours dedicated to childcare.
Additional difference between the two lists of indicators is the breakdown in sub-dimensions, almost
absent in the EMCO-modified list (with the exception of the dimension Modern social security,
divided into Social security systems and Reconciliation of work and private life). Moreover a sub-
section of the EMPL-JRC dimension Flexible and reliable contractual arrangements (i.e. Flexibility of
work organization to help combine work and family responsibility) is moved to the dimension of
Modern social security system in the EMCO-modified list.
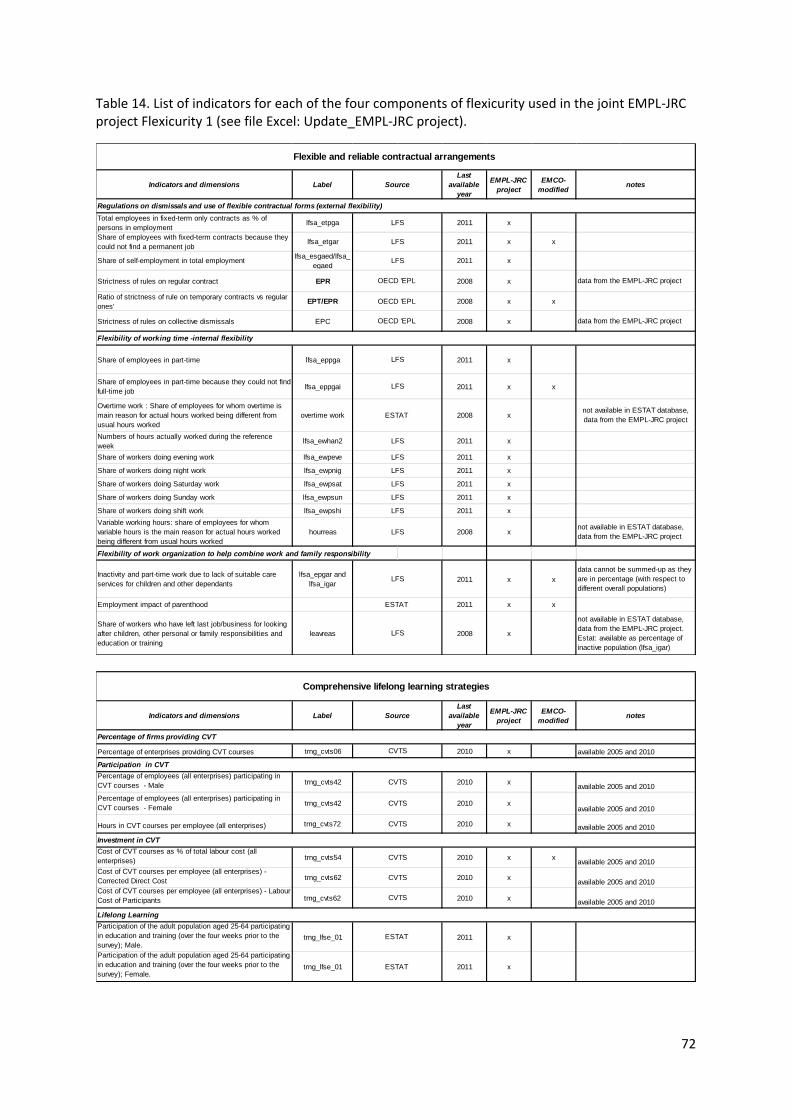
72
Table 14. List of indicators for each of the four components of flexicurity used in the joint EMPL-JRC project Flexicurity 1 (see file Excel: Update_EMPL-JRC project).
Indicators and dimensions Label
Last
available
year
EMPL-JRC
project
EMCO-
modified
Total employees in fixed-term only contracts as % of
persons in employmentlfsa_etpga 2011 x
Share of employees with fixed-term contracts because they
could not find a permanent job lfsa_etgar 2011 x x
Share of self-employment in total employment lfsa_esgaed/lfsa_
egaed2011 x
Strictness of rules on regular contract EPR 2008 x
Ratio of strictness of rule on temporary contracts vs regular
ones'EPT/EPR 2008 x x
Strictness of rules on collective dismissals EPC 2008 x
Share of employees in part-time lfsa_eppga 2011 x
Share of employees in part-time because they could not find
full-time job lfsa_eppgai 2011 x x
Overtime work : Share of employees for whom overtime is
main reason for actual hours worked being different from
usual hours worked
overtime work 2008 x
Numbers of hours actually worked during the reference
week lfsa_ewhan2 2011 x
Share of workers doing evening work lfsa_ewpeve 2011 x
Share of workers doing night work lfsa_ewpnig 2011 x
Share of workers doing Saturday work lfsa_ewpsat 2011 x
Share of workers doing Sunday work lfsa_ewpsun 2011 x
Share of workers doing shift work lfsa_ewpshi 2011 x
Variable working hours: share of employees for whom
variable hours is the main reason for actual hours worked
being different from usual hours worked
hourreas 2008 x
Flexibility of work organization to help combine work and family responsibility
Inactivity and part-time work due to lack of suitable care
services for children and other dependants
lfsa_epgar and
lfsa_igar2011 x x
Employment impact of parenthood 2011 x x
Share of workers who have left last job/business for looking
after children, other personal or family responsibilities and
education or training
leavreas 2008 x
LFS
LFS
LFS
LFS
ESTAT
LFS
notes
not available in ESTAT database,
data from the EMPL-JRC project.
Estat: available as percentage of
inactive population (lfsa_igar)
not available in ESTAT database,
data from the EMPL-JRC project
LFS
LFS
LFS
LFS
LFS
LFS
OECD 'EPL
OECD 'EPL
OECD 'EPL
LFS
LFS
ESTAT
Source
LFS
data cannot be summed-up as they
are in percentage (with respect to
different overall populations)
Flexible and reliable contractual arrangements
Regulations on dismissals and use of flexible contractual forms (external flexibility)
data from the EMPL-JRC project
data from the EMPL-JRC project
Flexibility of working time -internal flexibility
not available in ESTAT database,
data from the EMPL-JRC project
Indicators and dimensions Label
Last
available
year
EMPL-JRC
project
EMCO-
modified
Percentage of enterprises providing CVT courses trng_cvts06 2010 x
Percentage of employees (all enterprises) participating in
CVT courses - Male trng_cvts42 2010 x
Percentage of employees (all enterprises) participating in
CVT courses - Femaletrng_cvts42 2010 x
Hours in CVT courses per employee (all enterprises) trng_cvts72 2010 x
Cost of CVT courses as % of total labour cost (all
enterprises) trng_cvts54 2010 x x
Cost of CVT courses per employee (all enterprises) -
Corrected Direct Cost trng_cvts62 2010 x
Cost of CVT courses per employee (all enterprises) - Labour
Cost of Participants trng_cvts62 2010 x
Participation of the adult population aged 25-64 participating
in education and training (over the four weeks prior to the
survey); Male.trng_lfse_01 2011 x
Participation of the adult population aged 25-64 participating
in education and training (over the four weeks prior to the
survey); Female.trng_lfse_01 2011 x
Percentage of firms providing CVT
CVTS available 2005 and 2010
Comprehensive lifelong learning strategies
Source notes
Participation in CVT
CVTSavailable 2005 and 2010
Investment in CVT
CVTSavailable 2005 and 2010
CVTSavailable 2005 and 2010
CVTS available 2005 and 2010
ESTAT
CVTSavailable 2005 and 2010
CVTSavailable 2005 and 2010
Lifelong Learning
ESTAT
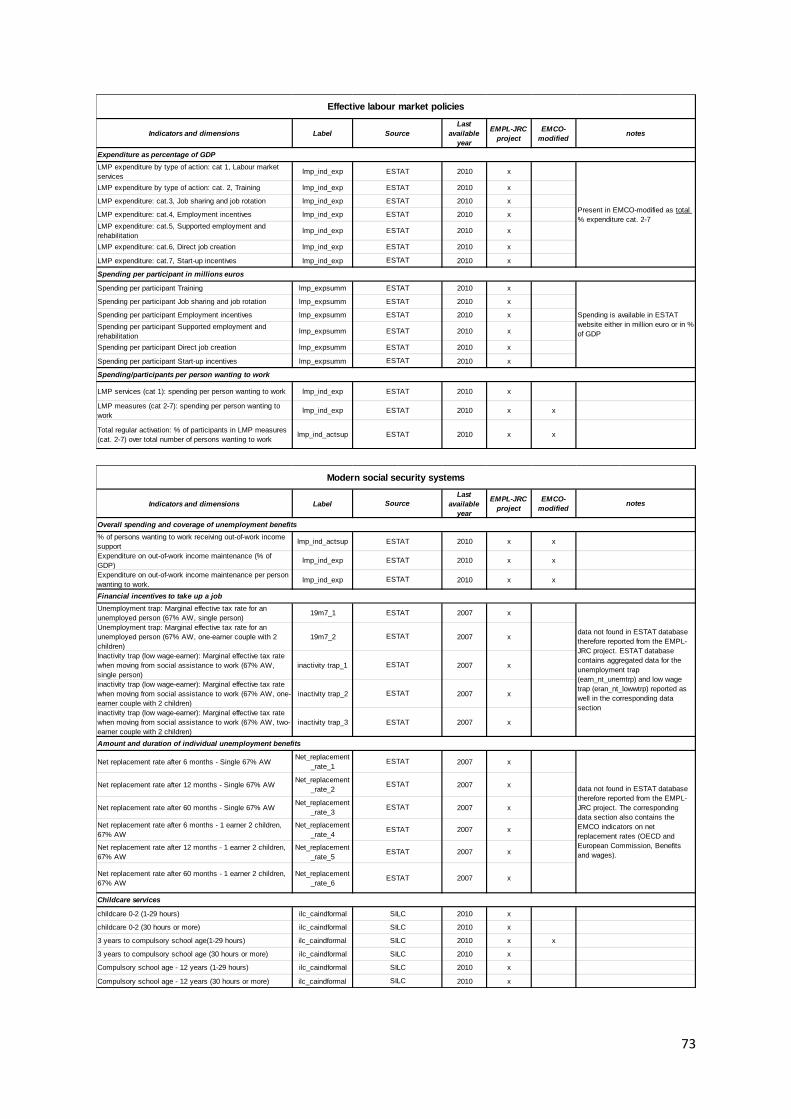
73
Indicators and dimensions Label
Last
available
year
EMPL-JRC
project
EMCO-
modified
LMP expenditure by type of action: cat 1, Labour market
serviceslmp_ind_exp 2010 x
LMP expenditure by type of action: cat. 2, Training lmp_ind_exp 2010 x
LMP expenditure: cat.3, Job sharing and job rotation lmp_ind_exp 2010 x
LMP expenditure: cat.4, Employment incentives lmp_ind_exp 2010 x
LMP expenditure: cat.5, Supported employment and
rehabilitationlmp_ind_exp 2010 x
LMP expenditure: cat.6, Direct job creation lmp_ind_exp 2010 x
LMP expenditure: cat.7, Start-up incentives lmp_ind_exp 2010 x
Spending per participant Training lmp_expsumm 2010 x
Spending per participant Job sharing and job rotation lmp_expsumm 2010 x
Spending per participant Employment incentives lmp_expsumm 2010 x
Spending per participant Supported employment and
rehabilitationlmp_expsumm 2010 x
Spending per participant Direct job creation lmp_expsumm 2010 x
Spending per participant Start-up incentives lmp_expsumm 2010 x
LMP services (cat 1): spending per person wanting to work lmp_ind_exp 2010 x
LMP measures (cat 2-7): spending per person wanting to
worklmp_ind_exp 2010 x x
Total regular activation: % of participants in LMP measures
(cat. 2-7) over total number of persons wanting to worklmp_ind_actsup 2010 x x
ESTAT
ESTAT
Effective labour market policies
Source notes
Expenditure as percentage of GDP
ESTAT
Present in EMCO-modified as total
% expenditure cat. 2-7
Spending is available in ESTAT
website either in million euro or in %
of GDP
ESTAT
Spending/participants per person wanting to work
ESTAT
ESTAT
ESTAT
ESTAT
ESTAT
ESTAT
Spending per participant in millions euros
ESTAT
ESTAT
ESTAT
ESTAT
ESTAT
ESTAT
Indicators and dimensions Label
Last
available
year
EMPL-JRC
project
EMCO-
modified
% of persons wanting to work receiving out-of-work income
supportlmp_ind_actsup 2010 x x
Expenditure on out-of-work income maintenance (% of
GDP) lmp_ind_exp 2010 x x
Expenditure on out-of-work income maintenance per person
wanting to work.lmp_ind_exp 2010 x x
Unemployment trap: Marginal effective tax rate for an
unemployed person (67% AW, single person)19m7_1 2007 x
Unemployment trap: Marginal effective tax rate for an
unemployed person (67% AW, one-earner couple with 2
children)
19m7_2 2007 x
Inactivity trap (low wage-earner): Marginal effective tax rate
when moving from social assistance to work (67% AW,
single person)
inactivity trap_1 2007 x
inactivity trap (low wage-earner): Marginal effective tax rate
when moving from social assistance to work (67% AW, one-
earner couple with 2 children)
inactivity trap_2 2007 x
inactivity trap (low wage-earner): Marginal effective tax rate
when moving from social assistance to work (67% AW, two-
earner couple with 2 children)
inactivity trap_3 2007 x
Net replacement rate after 6 months - Single 67% AWNet_replacement
_rate_12007 x
Net replacement rate after 12 months - Single 67% AWNet_replacement
_rate_22007 x
Net replacement rate after 60 months - Single 67% AWNet_replacement
_rate_32007 x
Net replacement rate after 6 months - 1 earner 2 children,
67% AW
Net_replacement
_rate_42007 x
Net replacement rate after 12 months - 1 earner 2 children,
67% AW
Net_replacement
_rate_52007 x
Net replacement rate after 60 months - 1 earner 2 children,
67% AW
Net_replacement
_rate_62007 x
childcare 0-2 (1-29 hours) ilc_caindformal 2010 x
childcare 0-2 (30 hours or more) ilc_caindformal 2010 x
3 years to compulsory school age(1-29 hours) ilc_caindformal 2010 x x
3 years to compulsory school age (30 hours or more) ilc_caindformal 2010 x
Compulsory school age - 12 years (1-29 hours) ilc_caindformal 2010 x
Compulsory school age - 12 years (30 hours or more) ilc_caindformal 2010 x
Modern social security systems
Source notes
Amount and duration of individual unemployment benefits
ESTAT
ESTAT
ESTAT
Overall spending and coverage of unemployment benefits
ESTAT
ESTAT
ESTAT
ESTAT
ESTAT
ESTAT
ESTAT
ESTAT
ESTAT
ESTAT
data not found in ESTAT database
therefore reported from the EMPL-
JRC project. ESTAT database
contains aggregated data for the
unemployment trap
(earn_nt_unemtrp) and low wage
trap (eran_nt_lowwtrp) reported as
well in the corresponding data
section
data not found in ESTAT database
therefore reported from the EMPL-
JRC project. The corresponding
data section also contains the
EMCO indicators on net
replacement rates (OECD and
European Commission, Benefits
and wages).
ESTAT
Childcare services
SILC
SILC
SILC
SILC
SILC
SILC
Financial incentives to take up a job
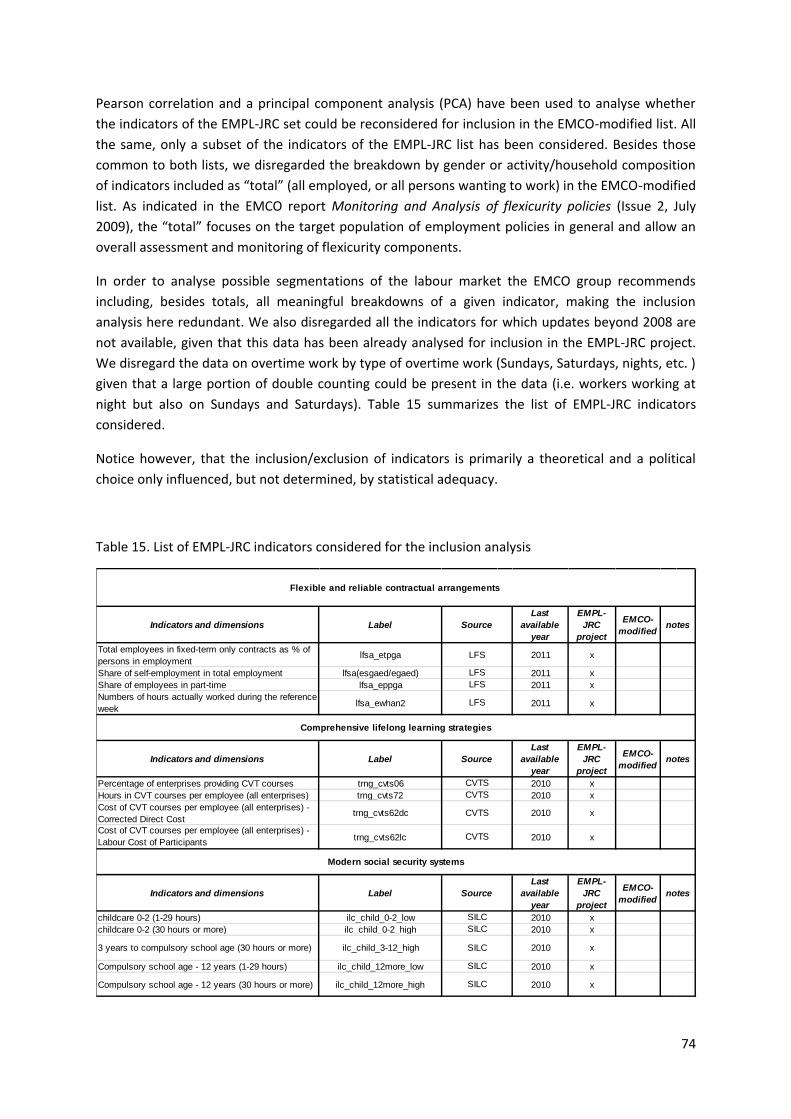
74
Pearson correlation and a principal component analysis (PCA) have been used to analyse whether
the indicators of the EMPL-JRC set could be reconsidered for inclusion in the EMCO-modified list. All
the same, only a subset of the indicators of the EMPL-JRC list has been considered. Besides those
common to both lists, we disregarded the breakdown by gender or activity/household composition
of indicators included as “total” (all employed, or all persons wanting to work) in the EMCO-modified
list. As indicated in the EMCO report Monitoring and Analysis of flexicurity policies (Issue 2, July
2009), the “total” focuses on the target population of employment policies in general and allow an
overall assessment and monitoring of flexicurity components.
In order to analyse possible segmentations of the labour market the EMCO group recommends
including, besides totals, all meaningful breakdowns of a given indicator, making the inclusion
analysis here redundant. We also disregarded all the indicators for which updates beyond 2008 are
not available, given that this data has been already analysed for inclusion in the EMPL-JRC project.
We disregard the data on overtime work by type of overtime work (Sundays, Saturdays, nights, etc. )
given that a large portion of double counting could be present in the data (i.e. workers working at
night but also on Sundays and Saturdays). Table 15 summarizes the list of EMPL-JRC indicators
considered.
Notice however, that the inclusion/exclusion of indicators is primarily a theoretical and a political
choice only influenced, but not determined, by statistical adequacy.
Table 15. List of EMPL-JRC indicators considered for the inclusion analysis
Indicators and dimensions Label
Last
available
year
EMPL-
JRC
project
EMCO-
modified
Total employees in fixed-term only contracts as % of
persons in employmentlfsa_etpga 2011 x
Share of self-employment in total employment lfsa(esgaed/egaed) 2011 x
Share of employees in part-time lfsa_eppga 2011 x
Numbers of hours actually worked during the reference
week lfsa_ewhan2 2011 x
Indicators and dimensions Label
Last
available
year
EMPL-
JRC
project
EMCO-
modified
Percentage of enterprises providing CVT courses trng_cvts06 2010 x
Hours in CVT courses per employee (all enterprises) trng_cvts72 2010 x
Cost of CVT courses per employee (all enterprises) -
Corrected Direct Costtrng_cvts62dc 2010 x
Cost of CVT courses per employee (all enterprises) -
Labour Cost of Participants trng_cvts62lc 2010 x
Indicators and dimensions Label
Last
available
year
EMPL-
JRC
project
EMCO-
modified
childcare 0-2 (1-29 hours) ilc_child_0-2_low 2010 x
childcare 0-2 (30 hours or more) ilc_child_0-2_high 2010 x
3 years to compulsory school age (30 hours or more) ilc_child_3-12_high 2010 x
Compulsory school age - 12 years (1-29 hours) ilc_child_12more_low 2010 x
Compulsory school age - 12 years (30 hours or more) ilc_child_12more_high 2010 x
SILC
SILC
SILC
SILC
SILC
CVTS
Modern social security systems
Source notes
CVTS
CVTS
CVTS
LFS
LFS
Comprehensive lifelong learning strategies
Source notes
Source notes
LFS
LFS
Flexible and reliable contractual arrangements
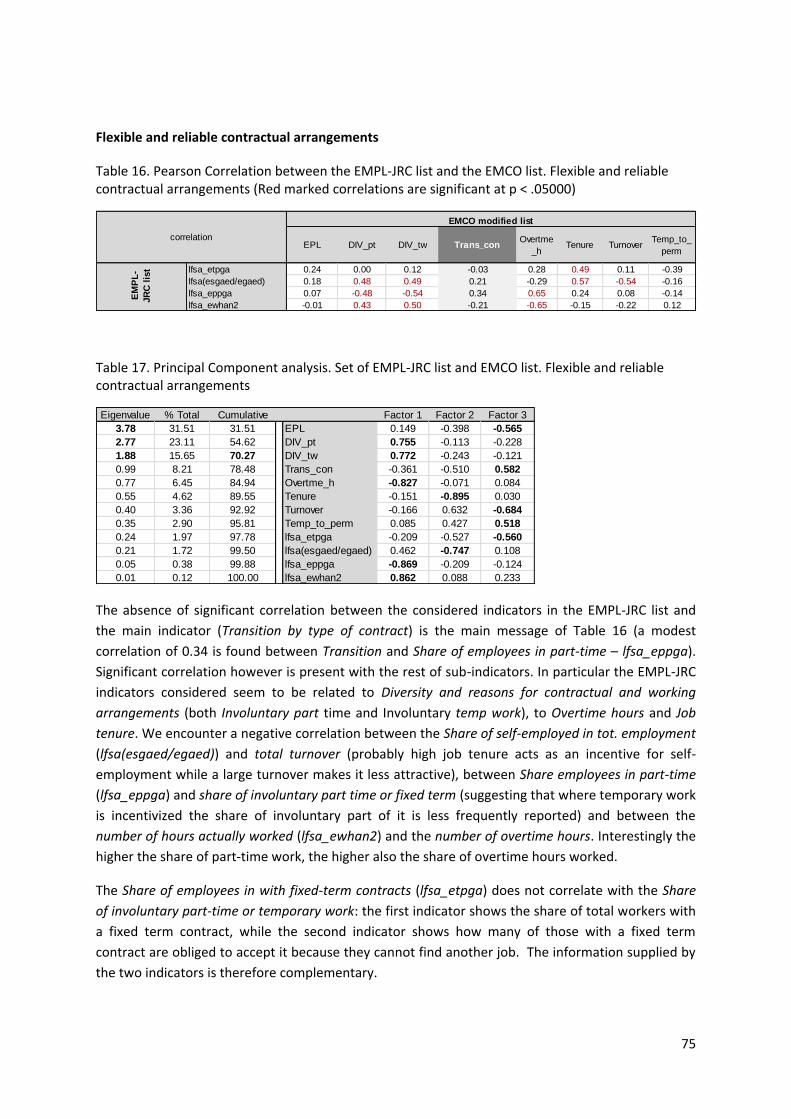
75
Flexible and reliable contractual arrangements
Table 16. Pearson Correlation between the EMPL-JRC list and the EMCO list. Flexible and reliable contractual arrangements (Red marked correlations are significant at p < .05000)
Table 17. Principal Component analysis. Set of EMPL-JRC list and EMCO list. Flexible and reliable contractual arrangements
The absence of significant correlation between the considered indicators in the EMPL-JRC list and
the main indicator (Transition by type of contract) is the main message of Table 16 (a modest
correlation of 0.34 is found between Transition and Share of employees in part-time – lfsa_eppga).
Significant correlation however is present with the rest of sub-indicators. In particular the EMPL-JRC
indicators considered seem to be related to Diversity and reasons for contractual and working
arrangements (both Involuntary part time and Involuntary temp work), to Overtime hours and Job
tenure. We encounter a negative correlation between the Share of self-employed in tot. employment
(lfsa(esgaed/egaed)) and total turnover (probably high job tenure acts as an incentive for self-
employment while a large turnover makes it less attractive), between Share employees in part-time
(lfsa_eppga) and share of involuntary part time or fixed term (suggesting that where temporary work
is incentivized the share of involuntary part of it is less frequently reported) and between the
number of hours actually worked (lfsa_ewhan2) and the number of overtime hours. Interestingly the
higher the share of part-time work, the higher also the share of overtime hours worked.
The Share of employees in with fixed-term contracts (lfsa_etpga) does not correlate with the Share
of involuntary part-time or temporary work: the first indicator shows the share of total workers with
a fixed term contract, while the second indicator shows how many of those with a fixed term
contract are obliged to accept it because they cannot find another job. The information supplied by
the two indicators is therefore complementary.
EPL DIV_pt DIV_tw Trans_conOvertme
_hTenure Turnover
Temp_to_
perm
lfsa_etpga 0.24 0.00 0.12 -0.03 0.28 0.49 0.11 -0.39
lfsa(esgaed/egaed) 0.18 0.48 0.49 0.21 -0.29 0.57 -0.54 -0.16
lfsa_eppga 0.07 -0.48 -0.54 0.34 0.65 0.24 0.08 -0.14
lfsa_ewhan2 -0.01 0.43 0.50 -0.21 -0.65 -0.15 -0.22 0.12
correlation
EMCO modified list
EM
PL
-
JR
C l
ist
Eigenvalue % Total Cumulative Factor 1 Factor 2 Factor 3
3.78 31.51 31.51 EPL 0.149 -0.398 -0.565
2.77 23.11 54.62 DIV_pt 0.755 -0.113 -0.228
1.88 15.65 70.27 DIV_tw 0.772 -0.243 -0.121
0.99 8.21 78.48 Trans_con -0.361 -0.510 0.582
0.77 6.45 84.94 Overtme_h -0.827 -0.071 0.084
0.55 4.62 89.55 Tenure -0.151 -0.895 0.030
0.40 3.36 92.92 Turnover -0.166 0.632 -0.684
0.35 2.90 95.81 Temp_to_perm 0.085 0.427 0.518
0.24 1.97 97.78 lfsa_etpga -0.209 -0.527 -0.560
0.21 1.72 99.50 lfsa(esgaed/egaed) 0.462 -0.747 0.108
0.05 0.38 99.88 lfsa_eppga -0.869 -0.209 -0.124
0.01 0.12 100.00 lfsa_ewhan2 0.862 0.088 0.233
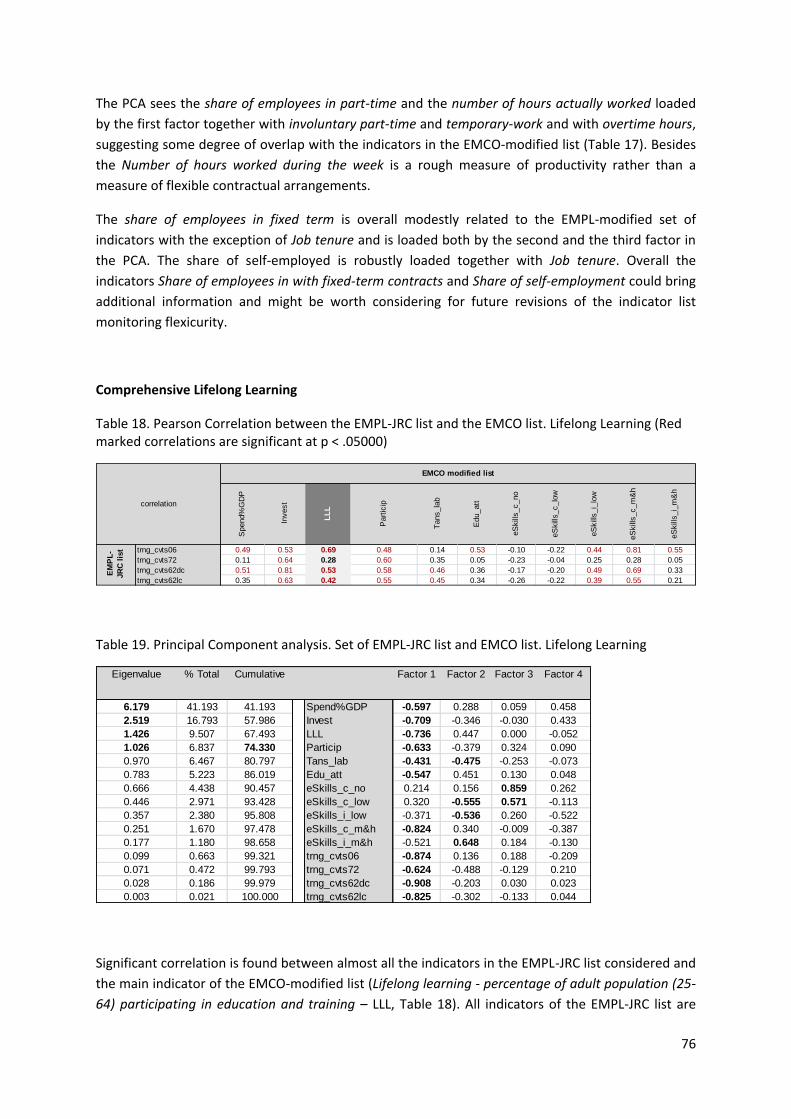
76
The PCA sees the share of employees in part-time and the number of hours actually worked loaded
by the first factor together with involuntary part-time and temporary-work and with overtime hours,
suggesting some degree of overlap with the indicators in the EMCO-modified list (Table 17). Besides
the Number of hours worked during the week is a rough measure of productivity rather than a
measure of flexible contractual arrangements.
The share of employees in fixed term is overall modestly related to the EMPL-modified set of
indicators with the exception of Job tenure and is loaded both by the second and the third factor in
the PCA. The share of self-employed is robustly loaded together with Job tenure. Overall the
indicators Share of employees in with fixed-term contracts and Share of self-employment could bring
additional information and might be worth considering for future revisions of the indicator list
monitoring flexicurity.
Comprehensive Lifelong Learning
Table 18. Pearson Correlation between the EMPL-JRC list and the EMCO list. Lifelong Learning (Red marked correlations are significant at p < .05000)
Table 19. Principal Component analysis. Set of EMPL-JRC list and EMCO list. Lifelong Learning
Significant correlation is found between almost all the indicators in the EMPL-JRC list considered and
the main indicator of the EMCO-modified list (Lifelong learning - percentage of adult population (25-
64) participating in education and training – LLL, Table 18). All indicators of the EMPL-JRC list are
Spend%
GD
P
Invest
LL
L
Part
icip
Tans_la
b
Edu_att
eS
kill
s_c_no
eS
kill
s_c_lo
w
eS
kill
s_i_
low
eS
kill
s_c_m
&h
eS
kill
s_i_
m&
h
trng_cvts06 0.49 0.53 0.69 0.48 0.14 0.53 -0.10 -0.22 0.44 0.81 0.55
trng_cvts72 0.11 0.64 0.28 0.60 0.35 0.05 -0.23 -0.04 0.25 0.28 0.05
trng_cvts62dc 0.51 0.81 0.53 0.58 0.46 0.36 -0.17 -0.20 0.49 0.69 0.33
trng_cvts62lc 0.35 0.63 0.42 0.55 0.45 0.34 -0.26 -0.22 0.39 0.55 0.21
correlation
EMCO modified list
EM
PL
-
JR
C l
ist
Eigenvalue % Total Cumulative Factor 1 Factor 2 Factor 3 Factor 4
6.179 41.193 41.193 Spend%GDP -0.597 0.288 0.059 0.458
2.519 16.793 57.986 Invest -0.709 -0.346 -0.030 0.433
1.426 9.507 67.493 LLL -0.736 0.447 0.000 -0.052
1.026 6.837 74.330 Particip -0.633 -0.379 0.324 0.090
0.970 6.467 80.797 Tans_lab -0.431 -0.475 -0.253 -0.073
0.783 5.223 86.019 Edu_att -0.547 0.451 0.130 0.048
0.666 4.438 90.457 eSkills_c_no 0.214 0.156 0.859 0.262
0.446 2.971 93.428 eSkills_c_low 0.320 -0.555 0.571 -0.113
0.357 2.380 95.808 eSkills_i_low -0.371 -0.536 0.260 -0.522
0.251 1.670 97.478 eSkills_c_m&h -0.824 0.340 -0.009 -0.387
0.177 1.180 98.658 eSkills_i_m&h -0.521 0.648 0.184 -0.130
0.099 0.663 99.321 trng_cvts06 -0.874 0.136 0.188 -0.209
0.071 0.472 99.793 trng_cvts72 -0.624 -0.488 -0.129 0.210
0.028 0.186 99.979 trng_cvts62dc -0.908 -0.203 0.030 0.023
0.003 0.021 100.000 trng_cvts62lc -0.825 -0.302 -0.133 0.044

77
loaded in the first factor of the PCA pointing to a common behaviour with most of the indicators in
the EMCO-modified list (Table 19). Interestingly the Percentage of enterprises providing CVT courses
(trng_cvts06) is highly correlated with Medium and high computer skills. The Direct cost of CVT
courses (Cost of CVT courses per employee – trng_cvts62dc) is obviously highly related to Firm
Investment (Cost of CVT courses as % of total labour cost, all enterprises), making it redundant
together with its complementary indicator Labour costs of CVT courses (trng_cvts62lc) with respect
to the indicator in the EMCO-modified list. Hours in CVT courses (trng_cvts72) is correlated to both
Investment and Share of employees participating to CVT courses.
Overall, while Direct cost and Labour costs of CVT courses are overlapping with the indicator of Firm
Investment in the EMCO modified list, the indicators on Hours in CVT courses per employee and
Percentage of enterprises offering CVT courses could be worth monitoring as contextual indicators in
the Comprehensive Lifelong Learning dimension of flexicurity.
Effective Labour Market Policies
For this dimension all relevant indicators considered in the EMPL-JRC list (divided according to the
breakdown per type of LMP provided) are included in the EMCO-modified set as totals over all LMP
policies. The only exception is Spending per participant in millions euros by breakdowns per type of
LMP provided, absent in the EMCO-modified list which includes spending as percentage of GDP and
per person willing to work.
Modern Social Security System
Table 20. Pearson Correlation between the EMPL-JRC list and the EMCO list. Modern social security (Red marked correlations are significant at p < .05000)
LM
P_exp
LM
P_exp%
GD
P Unem
p_tr
ap
Low
W_tr
ap
nrr
_6m
nrr
_5y
LM
P_supp
Po
v_u
nem
p
child
_3-1
2_lo
w
impact_
pare
nt
wb
reak_p
t
inac_pt_
child
ilc_child_0-2_low0.71 0.52 0.19 0.49 0.39 0.57 0.52 -0.45 0.77 -0.12 0.59 -0.13
ilc_child_0-2_high 0.23 0.21 0.42 0.26 0.46 0.35 0.16 -0.34 -0.28 -0.48 -0.40 -0.24
ilc_child_3-12_high -0.29 -0.14 0.16 -0.24 -0.12 -0.10 -0.16 0.16 -0.79 -0.11 -0.39 -0.28
ilc_child_12more_low 0.24 0.10 -0.28 0.05 -0.06 0.18 0.09 -0.03 0.34 -0.13 0.08 -0.02
ilc_child_12more_high -0.12 0.00 0.32 0.02 0.10 -0.07 -0.02 -0.09 -0.29 0.00 -0.04 -0.06EM
PL
-JR
C l
ist
correlation
EMCO modified list
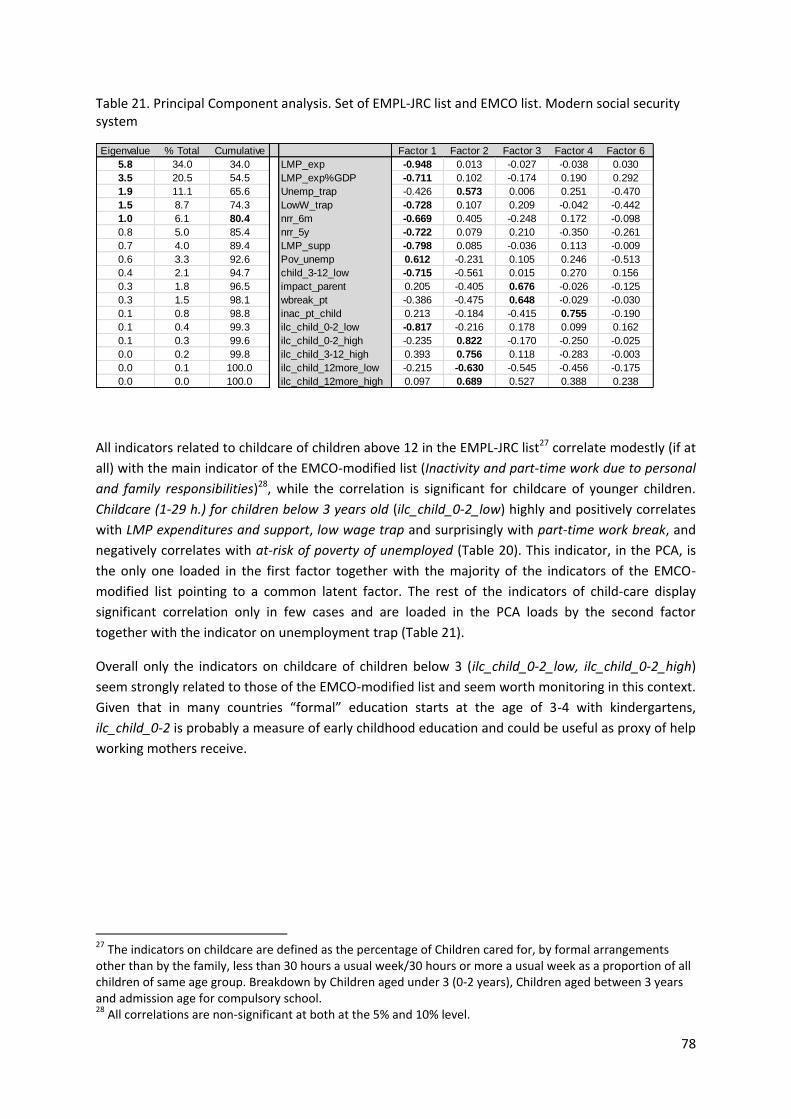
78
Table 21. Principal Component analysis. Set of EMPL-JRC list and EMCO list. Modern social security system
All indicators related to childcare of children above 12 in the EMPL-JRC list27 correlate modestly (if at
all) with the main indicator of the EMCO-modified list (Inactivity and part-time work due to personal
and family responsibilities)28, while the correlation is significant for childcare of younger children.
Childcare (1-29 h.) for children below 3 years old (ilc_child_0-2_low) highly and positively correlates
with LMP expenditures and support, low wage trap and surprisingly with part-time work break, and
negatively correlates with at-risk of poverty of unemployed (Table 20). This indicator, in the PCA, is
the only one loaded in the first factor together with the majority of the indicators of the EMCO-
modified list pointing to a common latent factor. The rest of the indicators of child-care display
significant correlation only in few cases and are loaded in the PCA loads by the second factor
together with the indicator on unemployment trap (Table 21).
Overall only the indicators on childcare of children below 3 (ilc_child_0-2_low, ilc_child_0-2_high)
seem strongly related to those of the EMCO-modified list and seem worth monitoring in this context.
Given that in many countries “formal” education starts at the age of 3-4 with kindergartens,
ilc_child_0-2 is probably a measure of early childhood education and could be useful as proxy of help
working mothers receive.
27 The indicators on childcare are defined as the percentage of Children cared for, by formal arrangements other than by the family, less than 30 hours a usual week/30 hours or more a usual week as a proportion of all children of same age group. Breakdown by Children aged under 3 (0-2 years), Children aged between 3 years and admission age for compulsory school. 28 All correlations are non-significant at both at the 5% and 10% level.
Eigenvalue % Total Cumulative Factor 1 Factor 2 Factor 3 Factor 4 Factor 6
5.8 34.0 34.0 LMP_exp -0.948 0.013 -0.027 -0.038 0.030
3.5 20.5 54.5 LMP_exp%GDP -0.711 0.102 -0.174 0.190 0.292
1.9 11.1 65.6 Unemp_trap -0.426 0.573 0.006 0.251 -0.470
1.5 8.7 74.3 LowW_trap -0.728 0.107 0.209 -0.042 -0.442
1.0 6.1 80.4 nrr_6m -0.669 0.405 -0.248 0.172 -0.098
0.8 5.0 85.4 nrr_5y -0.722 0.079 0.210 -0.350 -0.261
0.7 4.0 89.4 LMP_supp -0.798 0.085 -0.036 0.113 -0.009
0.6 3.3 92.6 Pov_unemp 0.612 -0.231 0.105 0.246 -0.513
0.4 2.1 94.7 child_3-12_low -0.715 -0.561 0.015 0.270 0.156
0.3 1.8 96.5 impact_parent 0.205 -0.405 0.676 -0.026 -0.125
0.3 1.5 98.1 wbreak_pt -0.386 -0.475 0.648 -0.029 -0.030
0.1 0.8 98.8 inac_pt_child 0.213 -0.184 -0.415 0.755 -0.190
0.1 0.4 99.3 ilc_child_0-2_low -0.817 -0.216 0.178 0.099 0.162
0.1 0.3 99.6 ilc_child_0-2_high -0.235 0.822 -0.170 -0.250 -0.025
0.0 0.2 99.8 ilc_child_3-12_high 0.393 0.756 0.118 -0.283 -0.003
0.0 0.1 100.0 ilc_child_12more_low -0.215 -0.630 -0.545 -0.456 -0.175
0.0 0.0 100.0 ilc_child_12more_high 0.097 0.689 0.527 0.388 0.238
79
References __________________________________________________________________________________
Andersen T.M., Svarer M., (2007), Flexicuirty – Labour Market Performance in Denmark, CESifo
Economic Studies, 53(3):389-429.
Andor L., (2011), The future of European Labour markets, in Challenge Europe. Growth wellbeing and
social policy in Europe: trade-offs or synergy? European Policy Centre, Issue 21:80-85.
Auer P., (2010), What’s in a Name? The Rise (and Fall?) of Flexicurity, Journal of Industrial Relations
52(3):371-386.
Bachmann R., Bechara P., Schaffner S., (2011), Paper on the Identification of the Flexicurity Profile of
Member States Using Micro-Economic Data. Final report, Research project for the European
Commission, Rheinisch-Westfälisches Institut für Wirtschaftsforschung.
Bekker S., and Chung H., (2009), Restructuring Organizations while striving for flexicurity: connecting
the European Level to national Contexts. In Moreau M.,A., (ed) Building anticipation of restructuring
in Europe, Brussels P.E. Lang Publishers.
Boeri T., (2011), Reducing Youth Unemployment and Dualism, paper presented at the thematic
review seminar on “The reduction of labour market segmentation: addressing the needs of young
people”, Brussels June 27, 2011.
Boeri T., and Brueckner H., (2011), Short-time Work Benefits Revised. Some Lessons from the Great
Recession, Discussion paper n. 5635, IZA.
Borghouts I., (2012), Securing job-to-job transitions in the labour market: a comparative study of
employment security systems in European Countries. Wolf Legal Publishers.
http://www.wolfpublishers.com/book.php?id=815
Castonguay J., (2009), Benchmarking Carrots and Sticks. Developing a model for the evaluation of
work-based employment progress. PhD dissertation Amsterdam, Amsterdam University Press.
Cazes S., and Nesporova A., (2001), Labour Market Flexibility in the Transition Countries: How Much
is Too Much, International Labour Review, 140:293-325.
Cazes S., and Nesporova A., (2003), Labour Markets in Transition: Balancing Flexibility and Security in
Central and Eastern Europe, International Labour Office, Geneva
Cazes S., and Nesporova A., (2007), Flexicurity. A Relevant Approach in central and Eastern Europe,
International Labour Office, Geneva.
Chung, H., (2012), Measuring Flexicuirty: Precautionary Notes, a New Framework, and an Empirical
Example, Social Indicator Research, 106:153-171.
Eurofound, (2010a), Extending flexicurity – The potential of short-time working schemes, European
Foundation for the Improvement of Living and Working Conditions, Dublin.
80
Eurofound, (2010b), Foundation Findings. Flexicurity: perspectives and practices, European
Foundation for the Improvement of Living and Working Conditions, Dublin.
Eurofound, (2012), The second phase of flexicurity: an analysis of practices and policies in the
Member States, European Foundation for the Improvement of Living and Working Conditions,
Dublin.
European Commission, (2006), Employment in Europe 2006, Luxembourg, Commission of the
European Communities.
European Commission, (2007a), Towards common principle of flexicurity: more and better jobs
through flexibility and security. Luxembourg, Commission of the European Communities.
European Commission (2007b), Employment in Europe 2007, Luxembourg, Commission of the
European Communities.
European Commission (2012), Labour Market Developments in Europe, 2012. Directorate General for
Economic and Financial Affairs, European Union 2012.
European Expert Group on Flexicurity, (2007), Flexicurity Pathways: Turning Hurdles into Stepping
Stones, Brussels, European Commission.
Ferrera M., Hemerijck A., Rhodes M., (2001), The future of Social Europe: Recasting Work and
Welfare in the New Economy. In Giddens A. (ed) The Global Third Way Debate, Cambridge Policy,
114-133.
Keune M., and Jepsen M., (2006), The rise of flexicurity in Europe. Why the Commission Adopted
Flexicurity and How it Understands the Concept, paper presented at the CARMA conference
Flexicurity and Beyond, Aalborg, October 11-14, 2006.
Jorgensen H., (2011), Danish flexicurity in crisis or just stress-tested by the crisis? Friedrich Ebert
Stiftung, Berlin.
Laporšek S., Dolenc P., (2011), The Analysis of Flexicurity in the EU Member States, Transylvanian
Review of Administrative Sciences 32E:125-145.
Letschke J., and Watt A., (2010), How do institutions affect the labour market adjustment to the
economic crisis in different EU Countries? European Trade Union Institute Working Paper 2010.04,
Brussels.
Madsen P.K., (2002), “Flexicurity” through Labour Market Policies and Institutions in Denmark. In
Auer P., and Cazes S (eds) Employment Stability in an Age of Flexibility, Geneva, International Labour
Office, 59-105.
Madsen P.K., (2004), The Danish model of flexicurity: Experiences and Lessons, Transfer, 10:187-
2007.
Madsen P.K., (2006), Flexicurity a new perspective on labour markets and welfare states in Europe,
Research Paper 2006:3, Center for Labour Market Research, Aalborg University.
81
Manca A., Governatori M., Mascherini M., (2010), Towards a set of Composite Indicators on
Flexicurity: a Comprehensive Approach, EUR 24329 EN, Publications Office of the European Union,
Luxemburg.
Maselli I., (2010), Beyond Flexibility and Security, a Composite Indicator of Flexicurity, Center for
European Policy studies, Working document n. 329.
Meardi G., (2011), Flexicurity and State Traditions: The Europeanization of Employment Policies
before and After the Economic Crisis, European Sociological Association’s Conference Geneva 7-10
September 2011.
Meardi, G. (2012), Industrial relations after European state traditions? In L. Burroni, M. Keune and G.
Meardi eds. Economy and Society in Europe, 100-123 Edward Elgar.
Muffels R., and Luijkx R., (2005), Job Mobility and Employment Patterns across European Welfare
States. Is there a ‘Trade-off’ or a ‘Double Bind’ between Flexibility and Security? TLM.NET Working
Paper, 2005-13, Amsterdam: SISWO/Social Policy Research.
Muffels R., and Luijkx R., (2008), The Relationship between Labour Market Mobility and Employment
Security for Male Employees: Trade-off of Flexicurity? Work Employment and Society, 22(2):221-242.
Muffels, R., Wilthagen, T., (2013), Flexicuirty: a New Paradigm for the Analysis of Labour Market and
Policies Challenging the Trade-Off Between Flexibility and Security, Sociology Compass 7(2):111-122.
Muffels, R., Wilthagen, T., Chung, H., (2010) The State of Affairs of Flexicurity: a Dynamic
Perspective. Paper delivered to the Commission, DG Employment.
Muffels, R., Wilthagen, T., Chung, H., Dekker, R., (2010), Towards a methodology to monitor and
analyse flexicurity and work-life balance policies in the member states of the EU, ReflecT Research
paper 11/003 Tilburg University, The Netherlands. http://ssrn.com/abstract=1962623
Sen A., (1993), Capability and Well-being, in Nussbaum M., Sen A.K., (eds) The Quality of Life, Oxford:
OUP.
Stiglitz J., Sen A., Fitoussi J.P., (2009), Report by the Commission on the Measurement of Economic
Performance and Social Progress, European Union, Brussels.
Tangian A., (2004), Liberal and trade unionist concept of Flexicurity: modeling in Application to 16
European Countries, WSI-Diskussionspapier, n. 131.
Tangian A., (2010), Not for Bad Weather: Macroanalysis of Flexicurity with Regard to the Crisis,
Working Paper, 2010.06 European Trade Union Institute.
Tros, F. (2012), Flexicurity in Europe: can it survive a double crisis? Mimeo. University of Amsterdam.
Van Oorschot W., (2004), Flexible Work and Flexicurity Policies in the Netherlands. Trends and
experiences, Transfer, 10:23-42
82
Vesan P., (2011), From the Lisbon ‘Growth and Jobs’ to the ‘Europe 2020” strategy: the emergence
and transformation of the European Agenda on Flexicurity. Working paper University of Valle
D’Aosta, presented to the ESPANET-Italia annual conference.
Viebrock, E. and Clasen, J. (2009), Flexicurity and welfare reform: a review, Socio-Economic Review
7(2):305-331.
Voss E., Dornelas A., Wild A., and Kwiatkiewicz A., (2011), European Social Dialogue 2009-1011:
Social Partners and Flexicurity in contemporary Labour Markets, Brussels March 2011.
Wilthagen, T., (1998), Flexicurity: A New Paradigm for Labour Market Policy Reform? Berlin: WZB
Discussion Paper FS I 98-202.
Wilthagen, T., (2007), Flexicurity Practices, European Commission Brussels.
Wilthagen T., (2012), Flexicurity Practices in the EU – Which Way is Up? Reflect Research Paper
12/002. Paper prepared for the ERA Annual Conference on European Labour Law 2012, Trier 22-23
March 2012.
Wilthagen T., and Rogowski R., (2002) The Legal Regulation of Transitional Labour Markets. In
Schmid G. and Grazier B. (eds). The Dynamics of Full Employment, Cheltenham, Edward Elgar 233-
273.
Wilthagen T., and Tros F., (2003), Dealing with the Flexibility-Security Nexus: Institutions, Strategies,
Opportunities and Barriers, AIAS Working Paper n. 10, Amsterdam, Amsterdam Institute for
Advanced Labor Studies.
Wilthagen T., and Tros F., (2004), The Concept of Flexicurity: a New Approach to Regulating
Employment and Labour Markets. Transfer 10:166-186.
Related Documents