Evaluation of faba beans (Vicia faba L. var. minuta) as a replacement for soybean meal in practical diets of juvenile Nile tilapia Oreochromis niloticus M.S. Azaza ⁎, K. Wassim, F. Mensi, A. Abdelmouleh, B. Brini, M.M. Kraϊem National Institute of Marine Sciences and Technologies, 28, Rue 2 mars 1934, 2025 Salammbô, Tunisia abstract article info Article history: Received 18 August 2008 Received in revised form 9 October 2008 Accepted 9 October 2008 Keywords: Faba bean Soybean meal Growth performance Feed utilization Digestibility Oreochromis niloticus We have studied the possible use of faba bean meal (FBM) in juvenile Nile tilapia-practical diets by progressively increasing its inclusion level at the expense of dehulled soybean meal (DSBM) in isonitrogenous (27.5%) and isoenergetic formulated (15.20 kJ g - 1 ) diets. DSBM was replaced by 12, 24 and 36% of FBM (diets 1, 2 and 3, respectively). A diet without FBM served as the control. Each diet was fed for 75 days to three replicate groups of 30 fish (17.64±0.04 g; mean±SE), arranged in a completely randomized design in an open circulation system. Survival did not differ among treatments (p N 0.05). The growth and feed conversion ratio (FCR) did not differ significantly (p b 0.05) between fish fed diets1, 2 and the control diet. By contrast fish fed diet 3 showed poorer growth and feed conversion ratio than the other groups. Apparent dry matter digestibility (ADMD) showed a progressive reduction with increasing FBM levels. Apparent protein digestibility (APD) decreases significantly in fish fed diet 3. No significant difference in carcass protein content was found among the treatments, but fish fed diet 3 had higher moisture and lower lipid content in carcass than fish fed in the other diets. Results showed that FBM could be incorporated up to 24% in diets of juvenile Nile tilapia which corresponds to a reduction of 20% DSBM in the control diet without compromising growth or feed conversion ratio. © 2008 Elsevier B.V. All rights reserved. 1. Introduction The rapid expansion of the livestock industry in many parts of the world is absorbing almost all feedstuffs produced, thus increasing the cost of certain feedstuffs used in aquaculture feeds (FAO, 2007). Soybean meal (SBM) is currently the most commonly used plant protein source in fish feeds and amounts to 50% of the diet of freshwater omnivorous fish species (Yue and Zhou, in press). Beside SBM, maize meal (MM) is now being used to meet the expected rise in demand, not only by the traditional food and feed sectors but also by the fast-growing biofuels industry to satisfy rising demand. This means prices for most oilseeds are likely to remain high in the coming years. In turn, the price of soybean meal (SBM), which is the main protein source for cultured animals, has increased sharply. According to FAO (2008), the May 2008 price of SBM increased to new record level of USD 460/tonne, an increase of 60% from early May 2007. Similarly, the price of United States maize averaged USD 247/ tonne in April 2008, a 45% increase from the corresponding period last year. Based on the current supply and demand forecasts for the coming years, prices can be expected to remain high. This phenom- enon has limited the expansion and profitability of aquaculture enterprises in most developing countries (Tacon, 2007). In many countries, SBM, MM and soybean oil used in feed formulation are imported, which increase feed costs. This is the case in Europe and many tropical countries, especially in sub-Saharan Africa where soybean production is fairly limited due mainly to climatic and geographical constraints. Soybean must be imported to cope with the needs of the animal feed industry. The high cost of protein sources, their restricted availability and the unpredictability of their markets, increase the need for alternative sources of protein in fish feed. Most published research on the use of plant protein and/or carbohydrate, as a substitute of SBM, in fish feeds has focused on the inclusion of roquette seed meal (Soliman, 2000), Azolla africana (Fasakin et al., 2001), Cassia fistula meal (Adebayo et al., 2004), alfalfa meal (Krichen, 2007) tomato by-product meal (Azaza et al., 2006), ulva meal (Azaza et al., 2008), cottonseed meal (Yue and Zhou, in press) and waste date meal (Azaza et al., in press) in diets for tilapia. For catfish diets, other products have been considered, including palm kernel meal (Ng and Chen, 2002), cottonseed meal (Barros et al., 2002) and roquette seed meal (Fagbenro, 2004). Faba beans (Vicia faba, L.) are widely cultivated and extensively grown in different parts of the world, in particular, in the Middle East and Mediterranean region (Gordillo, 1991; Chillo et al., 2008). It contains 25– 30% crude protein, 40–50% carbohydrate and 10–15% crude lipid (Macarulla et al., 2001). In addition, recent advances in the genetic improvement of faba bean varieties have led to the development of a high-yielding line and low tannin varieties of greater consideration for use in domestic animal feeds (Duc et al., 1999; Gutierrez et al., 2004). To our knowledge, little information is available on the use of faba bean meal (FBM) in fish diets (Grabner and Hofer, 1985; Gaber, 2006). Aquaculture 287 (2009) 174–179 ⁎ Corresponding author. Tel./fax: +216 75 272 511. E-mail address: [email protected] (M.S. Azaza). 0044-8486/$ – see front matter © 2008 Elsevier B.V. All rights reserved. doi:10.1016/j.aquaculture.2008.10.007 Contents lists available at ScienceDirect Aquaculture journal homepage: www.elsevier.com/locate/aqua-online

Welcome message from author
This document is posted to help you gain knowledge. Please leave a comment to let me know what you think about it! Share it to your friends and learn new things together.
Transcript
Aquaculture 287 (2009) 174–179
Contents lists available at ScienceDirect
Aquaculture
j ourna l homepage: www.e lsev ie r.com/ locate /aqua-on l ine
Evaluation of faba beans (Vicia faba L. var. minuta) as a replacement for soybean mealin practical diets of juvenile Nile tilapia Oreochromis niloticus
M.S. Azaza ⁎, K. Wassim, F. Mensi, A. Abdelmouleh, B. Brini, M.M. KraϊemNational Institute of Marine Sciences and Technologies, 28, Rue 2 mars 1934, 2025 Salammbô, Tunisia
⁎ Corresponding author. Tel./fax: +216 75 272 511.E-mail address: [email protected] (M.S. Azaz
0044-8486/$ – see front matter © 2008 Elsevier B.V. Adoi:10.1016/j.aquaculture.2008.10.007
a b s t r a c t
a r t i c l e i n f oArticle history:
We have studied the possible Received 18 August 2008Received in revised form 9 October 2008Accepted 9 October 2008Keywords:Faba beanSoybean mealGrowth performanceFeed utilizationDigestibilityOreochromis niloticus
use of faba beanmeal (FBM) in juvenile Nile tilapia-practical diets by progressivelyincreasing its inclusion level at the expense of dehulled soybean meal (DSBM) in isonitrogenous (27.5%) andisoenergetic formulated (15.20 kJ g−1) diets. DSBM was replaced by 12, 24 and 36% of FBM (diets 1, 2 and 3,respectively). A diet without FBM served as the control. Each diet was fed for 75 days to three replicate groups of30 fish (17.64±0.04 g; mean±SE), arranged in a completely randomized design in an open circulation system.Survival did not differ among treatments (pN0.05). The growth and feed conversion ratio (FCR) did not differsignificantly (pb0.05) between fish fed diets1, 2 and the control diet. By contrast fish fed diet 3 showed poorergrowth and feed conversion ratio than the other groups. Apparent dry matter digestibility (ADMD) showed aprogressive reduction with increasing FBM levels. Apparent protein digestibility (APD) decreases significantly infish fed diet 3. No significant difference in carcass protein content was found among the treatments, but fish feddiet 3 had highermoisture and lower lipid content in carcass than fish fed in the other diets. Results showed thatFBM could be incorporated up to 24% in diets of juvenile Nile tilapia which corresponds to a reduction of 20%DSBM in the control diet without compromising growth or feed conversion ratio.
© 2008 Elsevier B.V. All rights reserved.
1. Introduction
The rapid expansion of the livestock industry in many parts of theworld is absorbing almost all feedstuffs produced, thus increasing thecost of certain feedstuffs used in aquaculture feeds (FAO, 2007).Soybean meal (SBM) is currently the most commonly used plantprotein source in fish feeds and amounts to 50% of the diet offreshwater omnivorous fish species (Yue and Zhou, in press). BesideSBM, maize meal (MM) is now being used to meet the expected rise indemand, not only by the traditional food and feed sectors but also bythe fast-growing biofuels industry to satisfy rising demand. Thismeans prices for most oilseeds are likely to remain high in the comingyears. In turn, the price of soybean meal (SBM), which is the mainprotein source for cultured animals, has increased sharply.
According to FAO (2008), the May 2008 price of SBM increased tonew record level of USD 460/tonne, an increase of 60% from early May2007. Similarly, the price of United States maize averaged USD 247/tonne in April 2008, a 45% increase from the corresponding period lastyear. Based on the current supply and demand forecasts for thecoming years, prices can be expected to remain high. This phenom-enon has limited the expansion and profitability of aquacultureenterprises in most developing countries (Tacon, 2007). In manycountries, SBM, MM and soybean oil used in feed formulation are
a).
ll rights reserved.
imported, which increase feed costs. This is the case in Europe andmany tropical countries, especially in sub-Saharan Africa wheresoybean production is fairly limited due mainly to climatic andgeographical constraints. Soybean must be imported to cope with theneeds of the animal feed industry.
The high cost of protein sources, their restricted availability and theunpredictability of their markets, increase the need for alternativesources of protein in fish feed. Most published research on the use ofplant protein and/or carbohydrate, as a substitute of SBM, in fish feedshas focused on the inclusion of roquette seed meal (Soliman, 2000),Azolla africana (Fasakin et al., 2001), Cassia fistula meal (Adebayo et al.,2004), alfalfameal (Krichen, 2007) tomato by-productmeal (Azaza et al.,2006), ulvameal (Azaza et al., 2008), cottonseedmeal (Yue and Zhou, inpress) and waste date meal (Azaza et al., in press) in diets for tilapia. Forcatfish diets, other products have been considered, including palmkernel meal (Ng and Chen, 2002), cottonseed meal (Barros et al., 2002)and roquette seed meal (Fagbenro, 2004).
Faba beans (Vicia faba, L.) are widely cultivated and extensivelygrown indifferentparts of theworld, inparticular, in theMiddleEast andMediterranean region (Gordillo,1991; Chillo et al., 2008). It contains 25–30% crude protein, 40–50% carbohydrate and 10–15% crude lipid(Macarulla et al., 2001). In addition, recent advances in the geneticimprovement of faba bean varieties have led to the development of ahigh-yielding line and low tannin varieties of greater consideration foruse in domestic animal feeds (Duc et al., 1999; Gutierrez et al., 2004).
To our knowledge, little information is available on the use of fababean meal (FBM) in fish diets (Grabner and Hofer, 1985; Gaber, 2006).
Table 1Proximate composition (% dry weight) and gross energy (kJ g−1) of feed ingredientsincluded in test dietsa
FBM DSBM FM MM
Nutrient contentsDry matter (in original matter) 90.78 90.85 91.92 90.04Crude protein 29.12 42.86 47.63 7.58Crude lipid 2.56 1.38 3.58 1.72Crude fibre 11.31 6.60 1.86 7.13Ash 6.88 6.80 28.59 1.16NFEb 40.91 33.21 10.26 72.45Gross energy (kJg−1)c 14.69 16.08 14.08 14.83Calcium 0.39 0.31 6.62 0.03Phosphorus 0.53 0.68 4.29 0.26
EAAd
Lysine 2.12 2.62 4.63 0.14Valine 1.71 1.34 4.18 0.26Leucine 2.56 3.83 4.44 0.73Histidine 0.64 1.01 1.23 0.15Arginine 2.01 2.48 3.65 0.32Threonine 1.37 1.69 3.18 0.17Isoleucine 1.77 1.38 2.32 0.29Methionine 0.31 0.59 2.49 0.20Phenylalanine 1.49 1.85 2.29 0.47
FBM: faba bean meal; DSBM: dehulled soybean meal; FM: fish meal; MM: maize meal.aMeans of two replicate samples.bIn original matter.cNitrogen free extract.dEssential amino acids.
175M.S. Azaza et al. / Aquaculture 287 (2009) 174–179
Therefore, the aim of this work was to evaluate the effects of replacingDSBM by FBM in diets, on growth, nutrient utilization, carcass qualityand economic performance of juvenile Nile tilapia.
2. Materials and methods
2.1. Fish and experimental conditions
The nutrition trial was carried out at the National Institute ofMarine Sciences and Technologies (INSTM), Fish-Culture ResearchStation, Bechima-Gabes, Tunisia.
One week prior to the start of the feeding trial, Nile tilapia(Oreochromis niloticus), were sexed (examination of genital papilla) so asto selectmalefish exclusively. A total of 360fish (17.27±0.11 g;mean±SE),were randomly stocked in12, 400-L tanks inbatches of 30/tank. The tankswere part of an open circulating system previously described by Azazaet al. (2006, 2008). During the 1-week acclimation period, all fish wereoffered the same diet, whichwas prepared by grinding identical amountsof each of the four diets used in this study, thenpelleting themixture into2.5 mm particle. This protocol was preferred to offering pellets from thedifferent diets, which might have resulted in differential feed intake, andthus incomplete acclimation for one or several diets. In this period ofacclimation, all dead or apparently stressed fish were replaced withindividuals of similar sizes.
On the eve of the growth trial, the acclimated fish were deprived offeed for 24 h and individually weighed. Water flow-rates were checkedonce a day to insure similar water exchange in the tanks. Dissolvedoxygen level was controlled by adjustingwater flow into each tank at aninitial rate of about 3.5–5.0 L min−1 and increased up to about 5.0–6.0 Lmin−1 by the end of the study. Photoperiod was natural throughout theexperimental period and varied from 12 L:12 D (15 March 2006) to13 L:11 D (end of May 2006) and all tanks had similar light conditions.
Each of the four experimental diets was randomly assigned totriplicate groups of fish. During the 75-day experimental period, fishwere hand-fed to apparent satiety four times daily during the week(08:00, 11:00, 14:00 and 17:00 h) and twice daily on weekends (09:00,12:00 h). Apparent satiation was considered achieved when the fishwould no longer lunge to the pellets. There were no wasted pellets forany of the diets during the study, so feed rations represent feed intake.The tanks were inspected daily for mortalities, dead fish were removedand weighed for calculating the FCR. In addition, the tanks weresiphoned daily, before the first feeding, to remove faecal material. Every15 days, fish in each tank were anaesthetized (methane sulfonate;100 mg L−1) and individually weighed. When fish were removed forweighing, the tanks were cleaned thoroughly by scrubbing andsiphoning accumulated wastes. On weighing days, the fish were fedonly once in the afternoon.
For water quality monitoring, temperature and dissolved oxygenwere measured daily, total ammonium, nitrite, and pH levels, weremeasured weekly by standard methods (APHA, 1995). Water qualityparameters did not differ significantly among the experimental tanks,and ranged for temperature, 28.5–30.6 °C; pH, 7.3–7.9; dissolved oxygen,4.84–6.92 mg L−1; total alkalinity, 102.17–110.67 mg CaCO3 L−1; nitrite(NO2-N), 0.02–0.04 mg L−1 and total ammonia (NH3-N+NH4
+-N), 0.02–0.3 mg L−1. These characteristics are within the ideal range for rearingtilapia (Ballarin and Hatton, 1979).
2.2. Feed formulation and diet preparation
The diets contained local marine Sardinella sp fish meal (FM),dehulled soybean meal (DSBM), maize meal (MM) and faba bean meal,(Vicia faba L. var. minuta) (FBM). The feed ingredients used in this studywere obtained from local commercial suppliers. Locally availablecommercial fish meal was prepared by drying and powdering lowqualityfish. The resultingfishmeal is of poorqualityas it contained a lowamount of crude protein (47%) and a high level of ash. All ingredients
were used without any treatment (such as heat treatment, autoclaving,or cooking). Prior to use, all dry feed ingredients were ground (UltraCentrifugal Mill ZM 200 Retsch GmbH, Haan, Germany). Proximateanalyseswere conducted for each feed ingredient and the resulting datawere used in diet formulation (Table 1).
Based on the nutrient composition, four isonitrogenous andisoenergetic diets were formulated. FBM was included in the diets atlevels of 12, 24 and 36% (diet 1, diet 2 and diet 3, respectively), whichcorrespond to 10, 20 and 30% DSBM replacement. In parallel, maizemeal (MM) was reduced to adjust protein and carbohydrate contents.A practical feed (28% protein and 15.6 kJ g−1 gross energy) containing45% DSBM, which had previously been demonstrated to support goodgrowth performance (Azaza et al., 2005), was used as the control. Afixed quantity of fish meal (14%) was used in all diets to include a basiclevel of animal protein. All feeds were supplemented with 1%carboxymethylcellulose (CMC) as binder and 0.5% DL-methioninesince this amino acid was predicted to be the first limiting amino acid.
The test diets were prepared as described by Azaza et al. (2008). Inorder to minimise lipid oxidation during storage, all diets werepackaged in sealed plastic bags and stored in a freezer at −20 °C untiltheir use. Diet samples were subjected to proximate compositionanalysis, the results of which are presented in Table 2.
2.3. Sampling and chemical analyses
After the 75-day feeding trial, fishwere starved for 24 h prior to finalsampling for chemical analyses. At the beginning of the experiment, apooled sample of 20 fish was collected to serve as an initial carcasssample. For the final sampling, five fish were randomly sampled fromeach tank (15 fish/dietary treatment), killed by immersing in ice water,ground into a homogeneous mass, freeze-dried and stored at −20 °Cuntil analysis. Samples of diets, ingredients andfish carcasses before andafter the feeding trial were analyzed for dry matter (DM), crude protein,crude fat and ash according to AOAC (1990). Dry matter was measuredby drying samples at 105 °C to constantweight in anoven. Crude proteinwas measured using the Kjeldahl method. Crude lipid was quantifiedusing chloroform–methanol extraction (Folch et al., 1957). Ash contentwas determined gravimetrically following loss ofmass after combustionof a sample in a muffle furnace at 550 °C for 24 h. Crude fibre was
Table 2Formulation and proximate composition of the experimental diets (control diet free ofFBM; Diet 1, Diet 2 and Diet 3 containing 0, 12, 24 and 36% of FBM, respectively
Components Diets
control Diet 1 Diet 2 Diet 3
Ingredients (%)Fish meal 14 14 14 14Dehulled soybean meal 45 35 25 15Maize meal 33 31 29 27Faba bean meal 0 12 24 36Soybean oil 4.5 4.5 4.5 4.5Vit-mineral mixa 1.5 1.5 1.5 1.5L-methionine 0.5 0.5 0.5 0.5CMC 1 1 1 1Chromic oxideb 0.5 0.5 0.5 0.5
Proximate analysis (%)Dry matter (in original matter) 88.34 88.17 91.19 89.42Crude protein 27.85 27.58 27.09 26.76Crude lipid 6.12 6.06 6.21 6.34Crude fibre 6.24 6.78 7.52 7.96Ash 7.36 7.72 7.83 7.97NFEc 40.77 40.03 42.54 40.39Calcium 1.16 1.22 1.19 1.36Phosphorus 1.19 0.88 0.98 1.10Gross energy (kJg−1)d 15.27 15.06 15.44 15.05Diet cost (DT kg− 1)e 0.659 0.626 0.596 0.560
Antinutritional factors (%)Total phenolicsf 0.77 1.12 1.56 1.89Tanninsg 0.24 0.82 1.67 2.14Condensed tanninsh 0.42 0.74 1.23 2.04Phytic acid 0.52 0.96 1.65 1.97Saponinsi 1.02 1.10 1.07 1.15Trypsin inhibitor activityj 0.31 0.30 0.22 0.28
aVitamin premix and mineral premix were described in Azaza et al. (2008).bCr2O3; inert marker, used only for digestibility trial.cNitrogen-free extract: 1000 – (lipid (g kg−1)+moisture (g kg−1)+protein (g kg−1)+fibre(g kg−1)+ash (g kg−1)).dCalculated using the factors: carbohydrates, 4.1 kcal g−1; protein, 5.5 kcal g−1 and,lipids, 9.1 kcal g−1 (New, 1987), and transformed to kJ using the factor 4.184.ePrices in Tunisian pounds; 1 Eur=1.810 DT, based on 2008 exchange prices. Labour andprocessing costs were included by adding 20% of the ingredients costs (Azaza et al.,2006).f, gAs tannic acid equivalents.hAs leucocyanidin equivalents.iAs diosgenin equivalents.jmg pure trypsin inhibited per g of sample, trypsin units are defined as a decrease inabsorption of 0.01 at 400 nm.
176 M.S. Azaza et al. / Aquaculture 287 (2009) 174–179
determined based on loss of residue on ignition at 550 °C followinghydrolysis of a sample in H2SO4 and NaOH. Carbohydrate (as NFE) wascalculated as follows: NFE=100−(% protein+% lipids+% ash+% fibre).Gross energy (GE) was calculated based on the following conversionfactors: carbohydrate (as NFE) 4.1 kcal g−1, protein 5.5 kcal g−1 and fat9.1 kcal g−1 (New, 1987).
Amino acid analysis in ingredients and diets were undertakenaccording to the following protocol. Samples were treated with 6 Nhydrochloric acid in sealedbottles at 110 °C for 22h in order to hydrolyzeproteins. For the analysis of cysteine and methionine, the sample wasoxidizedwith performic acid at 4 °C for 12 h prior to acid hydrolysis. Theresulting hydrolyzate was diluted then filtered. An aliquot was thenadjusted to pH 2.2, and a known quantity of norleucinewas added as aninternal standard before making up to volume (Cohen and Strydom,1988). The extracted amino acids were then derivatised with 6-aminoquinolyl-N-hydroxysuccininimidyl carbamate prior to determi-nation by gradient HPLC with a fluorescence detection. Tryptophanwasnot quantified because of its destruction during acid hydrolysis.
Calcium and phosphorus were measured after ashing the samples.Calcium was determined using atomic absorption spectrophotometer(AAS), (Philips PU9200X Atomic Absorption Spectrophotometer) afteracid hydrolysis (1.4 N HNO3) (Wolf et al., 2003). Phosphorus was
determined by a spectrophotometric method, using molybdovanatereagent.
The total saponin content was determined using the method of Hiaiet al. (1976). Tannins and condensed tannins were determined by thespectrophotometric methods described by Aganda and Mosase (2001)after extraction with organic solvent. Phytic acid was determined by aspectrophotometric method described by March et al. (1995) after acidextraction (3% H2SO4) and enzymatic hydrolysis (phytase of Aspergillusficum, Sigma Aldrich P-9792, 1.1 unit mg−1). Trypsin inhibitor activity(TIA)wasmeasured by the enzymaticmethod of Bergmeyer (1965)withN-benzoylarginine-p-nitroanilide (BAPNA) as substrate. TIA wasexpressed as trypsin units inhibited per mg of dry sample. All analyseswere performed in triplicate.
2.4. Digestibility
For digestibility measurement, the fish were fed their respectivediets to apparent satiation once daily for 4 days prior to collection offaeces in order to adapt fish to the chromic-oxide diets. All dietscontained 0.5% chromic oxide (Cr2O3) as an inert marker. Faeces werecollected from all fish within each tank by hand stripping, centrifuged(4000 rpm, 15 min) and freeze-dried. Faeces were pooled by tank andstored at −20 °C until analyzed. Apparent digestibility coefficients (ADC)were determined for dry matter and protein.
Dry matter and protein of faeces were analysed using the samemethods as for diets, which has been briefly described in an earlierparagraph (AOAC, 1990). The chromium oxide content of the feed andfaecal samples, in triplicates, was estimated by themethod of Furukawaand Tsukahara (1966) using the acid digestion technique (nitric acid andperchloric acid). The ADCs were calculated with the following formula:
ADCDry matter %ð Þ = 100 1− % Cr2O3 in diet=%Cr2O3 in faecesð Þð
ADCNutrient %ð Þ = 100 1−ðð% Cr2O3 in dietð Þ %nutrient or energy in faecesð Þ÷ %Cr2O3 in faecesð Þ %nutrient or energy in dietð ÞÞ:
2.5. Data calculations and statistical analysis
The criteria used to determinate growth and feed conversion ratiowere:
SGR %day−1� �
= 100 LnðMean final bodyweightð Þ−Ln Mean initial body weightð ÞÞ=time daysð Þ;
BWG gday−1� �
= ð Mean final bodyweightð Þ−ðMean initial body weightÞÞ=time daysð Þ
RWG % IBWð Þ = 100 Mean final bodyweightð Þ= Mean initial bodyweightð Þ−1ð Þ
FCR gg−1� �
= dry feed intake gð Þ=ðfinal biomass gð Þ − initial biomass gð Þ+ biomass of thedead fish gð ÞÞ;
PER =wetweight gain gð Þ=protein intake gð Þ;
Survival %ð Þ = 100 final f ishnumber=initial f ishnumber;
HSI %ð Þ = 100 liverweight gð Þ=bodyweight gð Þ:ð
Taking into account that the feed cost depends on the FBM content,we calculated the cost of feed required to produce 1 kg of biomass. Theeconomic conversion ratio (ECR) was calculated with the followingequation: ECR=Feed cost×Feed Conversion Ratio (FCR). The cost of eachfeedwasdeterminedbymultiplying the respective contributionsof eachfeed ingredient by their respective costs per kg and summing the valuesobtained for all the ingredients in each of the formulated diets.
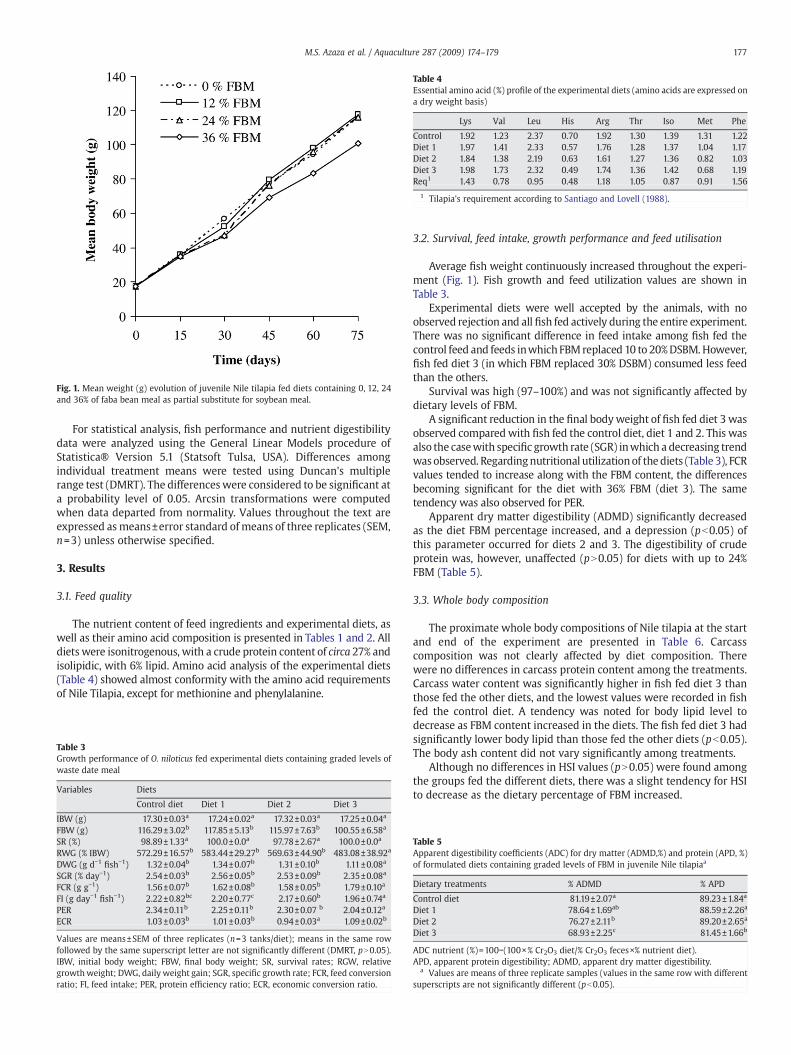
Fig. 1. Mean weight (g) evolution of juvenile Nile tilapia fed diets containing 0, 12, 24and 36% of faba bean meal as partial substitute for soybean meal.
Table 4Essential amino acid (%) profile of the experimental diets (amino acids are expressed ona dry weight basis)
Lys Val Leu His Arg Thr Iso Met Phe
Control 1.92 1.23 2.37 0.70 1.92 1.30 1.39 1.31 1.22Diet 1 1.97 1.41 2.33 0.57 1.76 1.28 1.37 1.04 1.17Diet 2 1.84 1.38 2.19 0.63 1.61 1.27 1.36 0.82 1.03Diet 3 1.98 1.73 2.32 0.49 1.74 1.36 1.42 0.68 1.19Req1 1.43 0.78 0.95 0.48 1.18 1.05 0.87 0.91 1.56
1 Tilapia's requirement according to Santiago and Lovell (1988).
177M.S. Azaza et al. / Aquaculture 287 (2009) 174–179
For statistical analysis, fish performance and nutrient digestibilitydata were analyzed using the General Linear Models procedure ofStatistica® Version 5.1 (Statsoft Tulsa, USA). Differences amongindividual treatment means were tested using Duncan's multiplerange test (DMRT). The differenceswere considered to be significant ata probability level of 0.05. Arcsin transformations were computedwhen data departed from normality. Values throughout the text areexpressed asmeans±error standard of means of three replicates (SEM,n=3) unless otherwise specified.
3. Results
3.1. Feed quality
The nutrient content of feed ingredients and experimental diets, aswell as their amino acid composition is presented in Tables 1 and 2. Alldiets were isonitrogenous, with a crude protein content of circa 27% andisolipidic, with 6% lipid. Amino acid analysis of the experimental diets(Table 4) showed almost conformity with the amino acid requirementsof Nile Tilapia, except for methionine and phenylalanine.
Table 3Growth performance of O. niloticus fed experimental diets containing graded levels ofwaste date meal
Variables Diets
Control diet Diet 1 Diet 2 Diet 3
IBW (g) 17.30±0.03a 17.24±0.02a 17.32±0.03a 17.25±0.04a
FBW (g) 116.29±3.02b 117.85±5.13b 115.97±7.63b 100.55±6.58a
SR (%) 98.89±1.33a 100.0±0.0a 97.78±2.67a 100.0±0.0a
RWG (% IBW) 572.29±16.57b 583.44±29.27b 569.63±44.90b 483.08±38.92a
DWG (g d−1fish−1) 1.32±0.04b 1.34±0.07b 1.31±0.10b 1.11±0.08a
SGR (% day−1) 2.54±0.03b 2.56±0.05b 2.53±0.09b 2.35±0.08a
FCR (g g−1) 1.56±0.07b 1.62±0.08b 1.58±0.05b 1.79±0.10a
FI (g day−1 fish−1) 2.22±0.82bc 2.20±0.77c 2.17±0.60b 1.96±0.74a
PER 2.34±0.11b 2.25±0.11b 2.30±0.07 b 2.04±0.12a
ECR 1.03±0.03b 1.01±0.03b 0.94±0.03a 1.09±0.02b
Values are means±SEM of three replicates (n=3 tanks/diet); means in the same rowfollowed by the same superscript letter are not significantly different (DMRT, pN0.05).IBW, initial body weight; FBW, final body weight; SR, survival rates; RGW, relativegrowthweight; DWG, daily weight gain; SGR, specific growth rate; FCR, feed conversionratio; FI, feed intake; PER, protein efficiency ratio; ECR, economic conversion ratio.
3.2. Survival, feed intake, growth performance and feed utilisation
Average fish weight continuously increased throughout the experi-ment (Fig. 1). Fish growth and feed utilization values are shown inTable 3.
Experimental diets were well accepted by the animals, with noobserved rejection and all fish fed actively during the entire experiment.There was no significant difference in feed intake among fish fed thecontrol feed and feeds inwhich FBMreplaced 10 to 20%DSBM.However,fish fed diet 3 (in which FBM replaced 30% DSBM) consumed less feedthan the others.
Survival was high (97–100%) and was not significantly affected bydietary levels of FBM.
A significant reduction in the final bodyweight of fish fed diet 3 wasobserved comparedwith fish fed the control diet, diet 1 and 2. This wasalso the casewith specific growth rate (SGR) inwhich a decreasing trendwasobserved. Regardingnutritional utilizationof thediets (Table 3), FCRvalues tended to increase along with the FBM content, the differencesbecoming significant for the diet with 36% FBM (diet 3). The sametendency was also observed for PER.
Apparent dry matter digestibility (ADMD) significantly decreasedas the diet FBM percentage increased, and a depression (pb0.05) ofthis parameter occurred for diets 2 and 3. The digestibility of crudeprotein was, however, unaffected (pN0.05) for diets with up to 24%FBM (Table 5).
3.3. Whole body composition
The proximate whole body compositions of Nile tilapia at the startand end of the experiment are presented in Table 6. Carcasscomposition was not clearly affected by diet composition. Therewere no differences in carcass protein content among the treatments.Carcass water content was significantly higher in fish fed diet 3 thanthose fed the other diets, and the lowest values were recorded in fishfed the control diet. A tendency was noted for body lipid level todecrease as FBM content increased in the diets. The fish fed diet 3 hadsignificantly lower body lipid than those fed the other diets (pb0.05).The body ash content did not vary significantly among treatments.
Although no differences in HSI values (pN0.05) were found amongthe groups fed the different diets, there was a slight tendency for HSIto decrease as the dietary percentage of FBM increased.
Table 5Apparent digestibility coefficients (ADC) for dry matter (ADMD,%) and protein (APD, %)of formulated diets containing graded levels of FBM in juvenile Nile tilapiaa
Dietary treatments % ADMD % APD
Control diet 81.19±2.07a 89.23±1.84a
Diet 1 78.64±1.69ab 88.59±2.26a
Diet 2 76.27±2.11b 89.20±2.65a
Diet 3 68.93±2.25c 81.45±1.66b
ADC nutrient (%)=100−(100×% Cr2O3 diet/% Cr2O3 feces×% nutrient diet).APD, apparent protein digestibility; ADMD, apparent dry matter digestibility.
a Values are means of three replicate samples (values in the same row with differentsuperscripts are not significantly different (pb0.05).
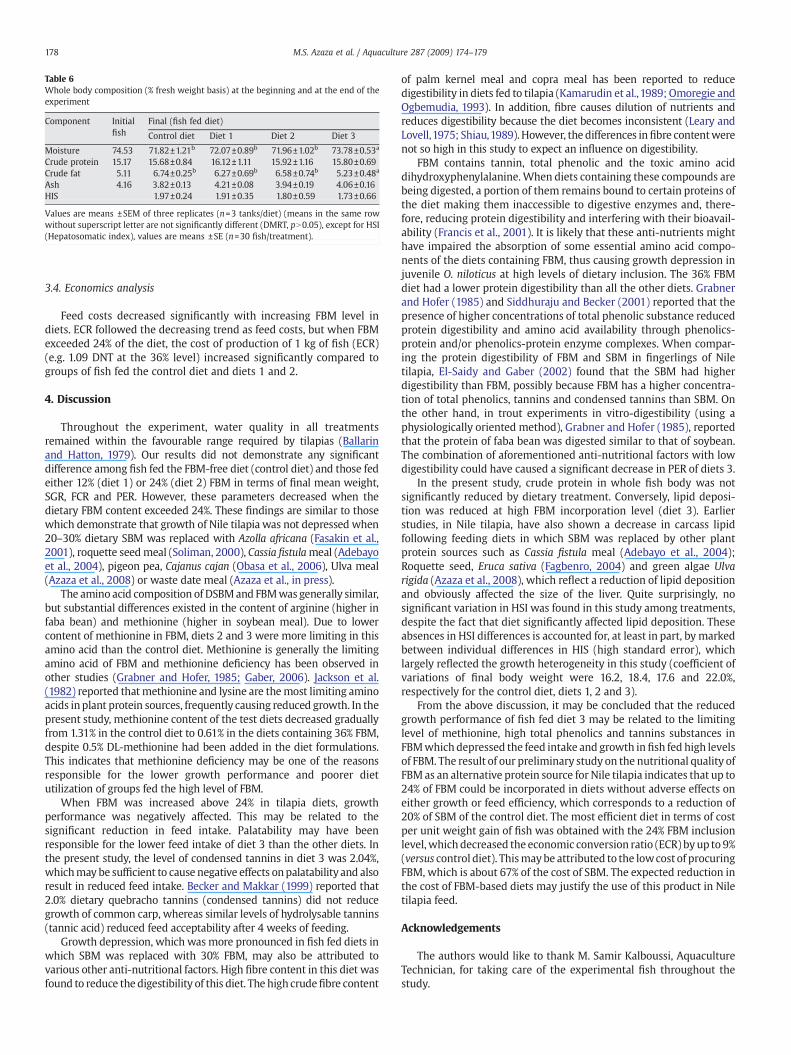
Table 6Whole body composition (% fresh weight basis) at the beginning and at the end of theexperiment
Component Initialfish
Final (fish fed diet)
Control diet Diet 1 Diet 2 Diet 3
Moisture 74.53 71.82±1.21b 72.07±0.89b 71.96±1.02b 73.78±0.53a
Crude protein 15.17 15.68±0.84 16.12±1.11 15.92±1.16 15.80±0.69Crude fat 5.11 6.74±0.25b 6.27±0.69b 6.58±0.74b 5.23±0.48a
Ash 4.16 3.82±0.13 4.21±0.08 3.94±0.19 4.06±0.16HIS 1.97±0.24 1.91±0.35 1.80±0.59 1.73±0.66
Values are means ±SEM of three replicates (n=3 tanks/diet) (means in the same rowwithout superscript letter are not significantly different (DMRT, pN0.05), except for HSI(Hepatosomatic index), values are means ±SE (n=30 fish/treatment).
178 M.S. Azaza et al. / Aquaculture 287 (2009) 174–179
3.4. Economics analysis
Feed costs decreased significantly with increasing FBM level indiets. ECR followed the decreasing trend as feed costs, but when FBMexceeded 24% of the diet, the cost of production of 1 kg of fish (ECR)(e.g. 1.09 DNT at the 36% level) increased significantly compared togroups of fish fed the control diet and diets 1 and 2.
4. Discussion
Throughout the experiment, water quality in all treatmentsremained within the favourable range required by tilapias (Ballarinand Hatton, 1979). Our results did not demonstrate any significantdifference among fish fed the FBM-free diet (control diet) and those fedeither 12% (diet 1) or 24% (diet 2) FBM in terms of final mean weight,SGR, FCR and PER. However, these parameters decreased when thedietary FBM content exceeded 24%. These findings are similar to thosewhich demonstrate that growth of Nile tilapia was not depressed when20–30% dietary SBM was replaced with Azolla africana (Fasakin et al.,2001), roquette seedmeal (Soliman, 2000), Cassia fistulameal (Adebayoet al., 2004), pigeon pea, Cajanus cajan (Obasa et al., 2006), Ulva meal(Azaza et al., 2008) or waste date meal (Azaza et al., in press).
The amino acid composition of DSBMand FBMwas generally similar,but substantial differences existed in the content of arginine (higher infaba bean) and methionine (higher in soybean meal). Due to lowercontent of methionine in FBM, diets 2 and 3 were more limiting in thisamino acid than the control diet. Methionine is generally the limitingamino acid of FBM and methionine deficiency has been observed inother studies (Grabner and Hofer, 1985; Gaber, 2006). Jackson et al.(1982) reported that methionine and lysine are themost limiting aminoacids inplant protein sources, frequently causing reduced growth. In thepresent study, methionine content of the test diets decreased graduallyfrom 1.31% in the control diet to 0.61% in the diets containing 36% FBM,despite 0.5% DL-methionine had been added in the diet formulations.This indicates that methionine deficiency may be one of the reasonsresponsible for the lower growth performance and poorer dietutilization of groups fed the high level of FBM.
When FBM was increased above 24% in tilapia diets, growthperformance was negatively affected. This may be related to thesignificant reduction in feed intake. Palatability may have beenresponsible for the lower feed intake of diet 3 than the other diets. Inthe present study, the level of condensed tannins in diet 3 was 2.04%,whichmay be sufficient to cause negative effects onpalatability and alsoresult in reduced feed intake. Becker and Makkar (1999) reported that2.0% dietary quebracho tannins (condensed tannins) did not reducegrowth of common carp, whereas similar levels of hydrolysable tannins(tannic acid) reduced feed acceptability after 4 weeks of feeding.
Growth depression, which was more pronounced in fish fed diets inwhich SBM was replaced with 30% FBM, may also be attributed tovarious other anti-nutritional factors. High fibre content in this diet wasfound to reduce the digestibility of this diet. The high crudefibre content
of palm kernel meal and copra meal has been reported to reducedigestibility in diets fed to tilapia (Kamarudin et al.,1989; Omoregie andOgbemudia, 1993). In addition, fibre causes dilution of nutrients andreduces digestibility because the diet becomes inconsistent (Leary andLovell,1975; Shiau,1989).However, the differences infibre contentwerenot so high in this study to expect an influence on digestibility.
FBM contains tannin, total phenolic and the toxic amino aciddihydroxyphenylalanine. When diets containing these compounds arebeing digested, a portion of them remains bound to certain proteins ofthe diet making them inaccessible to digestive enzymes and, there-fore, reducing protein digestibility and interfering with their bioavail-ability (Francis et al., 2001). It is likely that these anti-nutrients mighthave impaired the absorption of some essential amino acid compo-nents of the diets containing FBM, thus causing growth depression injuvenile O. niloticus at high levels of dietary inclusion. The 36% FBMdiet had a lower protein digestibility than all the other diets. Grabnerand Hofer (1985) and Siddhuraju and Becker (2001) reported that thepresence of higher concentrations of total phenolic substance reducedprotein digestibility and amino acid availability through phenolics-protein and/or phenolics-protein enzyme complexes. When compar-ing the protein digestibility of FBM and SBM in fingerlings of Niletilapia, El-Saidy and Gaber (2002) found that the SBM had higherdigestibility than FBM, possibly because FBM has a higher concentra-tion of total phenolics, tannins and condensed tannins than SBM. Onthe other hand, in trout experiments in vitro-digestibility (using aphysiologically oriented method), Grabner and Hofer (1985), reportedthat the protein of faba bean was digested similar to that of soybean.The combination of aforementioned anti-nutritional factors with lowdigestibility could have caused a significant decrease in PER of diets 3.
In the present study, crude protein in whole fish body was notsignificantly reduced by dietary treatment. Conversely, lipid deposi-tion was reduced at high FBM incorporation level (diet 3). Earlierstudies, in Nile tilapia, have also shown a decrease in carcass lipidfollowing feeding diets in which SBM was replaced by other plantprotein sources such as Cassia fistula meal (Adebayo et al., 2004);Roquette seed, Eruca sativa (Fagbenro, 2004) and green algae Ulvarigida (Azaza et al., 2008), which reflect a reduction of lipid depositionand obviously affected the size of the liver. Quite surprisingly, nosignificant variation in HSI was found in this study among treatments,despite the fact that diet significantly affected lipid deposition. Theseabsences in HSI differences is accounted for, at least in part, by markedbetween individual differences in HIS (high standard error), whichlargely reflected the growth heterogeneity in this study (coefficient ofvariations of final body weight were 16.2, 18.4, 17.6 and 22.0%,respectively for the control diet, diets 1, 2 and 3).
From the above discussion, it may be concluded that the reducedgrowth performance of fish fed diet 3 may be related to the limitinglevel of methionine, high total phenolics and tannins substances inFBMwhich depressed the feed intake and growth in fish fed high levelsof FBM. The result of our preliminary study on the nutritional quality ofFBMas an alternative protein source for Nile tilapia indicates that up to24% of FBM could be incorporated in diets without adverse effects oneither growth or feed efficiency, which corresponds to a reduction of20% of SBM of the control diet. The most efficient diet in terms of costper unit weight gain of fish was obtained with the 24% FBM inclusionlevel, which decreased the economic conversion ratio (ECR) byup to 9%(versus control diet). Thismaybe attributed to the lowcost of procuringFBM, which is about 67% of the cost of SBM. The expected reduction inthe cost of FBM-based diets may justify the use of this product in Niletilapia feed.
Acknowledgements
The authors would like to thank M. Samir Kalboussi, AquacultureTechnician, for taking care of the experimental fish throughout thestudy.
179M.S. Azaza et al. / Aquaculture 287 (2009) 174–179
References
Adebayo, O.T., Fagbenro, O.A., Jegede, T., 2004. Evaluation of Cassia fistula meal as areplacement for soybean meal in practical diets of Oreochromis niloticus fingerlings.Aquac. Nutr. 10, 99–104.
Aganda, A.A., Mosase, K.W., 2001. Tannin content, nutritive value and dry matterdigestibility of Lonchocarpus capassa, Zizyphus mucronata, Sclerocarya birrea, Kirkiaacuminata and Rhus lancea seeds. Anim. Feed Sci. Technol. 91, 107–113.
AOAC, 1990. Association of Official Analytical Chemists. Official Methods of Analysis ofthe Association of Official Analytical Chemists, 15th edition. AOAC, Arlington, VA,USA.
APHA,1995. AmericanPublicHealthAssociation, StandardMethods for the ExaminationofWaterandWasteWater,19th ed. AmericanPublicHealthAssociation,Washington, DC,USA.
Azaza, M.S., Mensi, F., Abdelmouleh, A., Kraϊem, M.M., 2005. Elaboration d'aliments secspour Tilapia du Nil Oreochromis niloticus (L., 1758) en élevage dans les eauxgéothermales du sud tunisien. Bull. Inst. Nat. Sci. Technol. Mer. 32, 23–30.
Azaza, M.S., Mensi, F., Imorou toko, I., Dhraief, M.N., Abdelmouleh, A., Brini, B., Kraϊem,M.M., 2006. Effets de l'incorporation de la farine de tomate dans l'alimentation dutilapia du Nil (Oreochromis niloticus, L., 1758) en élevage dans les eaux géothermalesdu sud tunisien. Bull. Inst. Nat. Sci. Technol. Mer. 33, 41–52.
Azaza, M.S., Mensi, F., Ksouri, J., Dhraïef, M.N., Abdelmouleh, A., Brini, B., Kraϊem, M.M.,2008. Growth of Nile tilapia (Oreochromis niloticus L.) fed with diets containinggraded levels of green algae ulva meal (Ulva rigida) reared in geothermal waters ofsouthern Tunisia. J. Appl. Ichthyol. 24, 202–207.
Azaza, M.S., Mensi, F., Wassim, K., Abdelmouleh, A., Brini, B., Kraϊem, M.M., in press.Nutritional Evaluation of Waste Date Fruit as Partial Substitute for Soybean Meal inPractical Diets of Juvenile Nile Tilapia,Oreochromis niloticus L. (Aquacult. Nutr. inpress;doi: 10.1111/j.1365-2095.2008.00591.x.).
Ballarin, J.D., Hatton, J.D., 1979. Tilapia: A Guide to their Biology and Culture in Africa.Stirling University, Stirling, UK. 174 pp.
Barros, M.M., Lim, C., Klesius, P.H., 2002. Effect of soybean meal replacement bycottonseed meal and iron supplementation on growth, immune response andresistance of channel catfish (Ictalurus punctatus) to Edwardsiella ictaluri) challenge.Aquaculture 207, 263–279.
Becker, K., Makkar, H.P.S., 1999. Effect of dietary tannic acid quebracho tannin on growthperformance andmetabolic rates of common carp (Cyprinus carpio L.). Aquaculture 175,327–335.
Bergmeyer, H.U., 1965. Methods of Enzymatic Analysis. Academic Press, New York, NY.555 pp.
Chillo, S., Laverse, J., Falcone, P.M., Del Nobile, M.A., 2008. Quality of spaghetti in baseamaranthus wholemeal flour added with quinoa, broad bean and chick pea. J. FoodEng. 84, 101–107.
Cohen, A.S., Strydom, D.J., 1988. Amino acid analysis utilizing phenylisothiocyanaatederivatives. Anal. Biochem. 174, 1–16.
Duc, G., Marget, P., Esnault, R., Le Guen, J., Bastianelli, D., 1999. Genetic variabiliy forfeeding value of faba bean seeds (Vicia faba): comparative chemical composition ofisogenics involving zero-tannin and zero-vicine genes. J. Agric. Sci. 133, 185–196.
El-Saidy, D.M.S., Gaber,M.M., 2002. Complete replacement offishmeal by soybeanwith thedietary L-lysine supplementation in Nile tilapia fingerlings. J. World Aquac. Soc. 33,297–306.
Fagbenro, O.A., 2004. Soybean meal replacement by roquette (Eruca sativa Miller) seedmeal as protein feedstuff in diets for African catfish, Clarias gariepinus (Burhell 1822),fingerlings. Aquac. Res. 35, 917–923.
FAO, 2007. Fisheries Department, Fishery Information, Data and Statistics Unit. FishstatPlus: Vers. 2. (available at www.fao.org/fi/statist/ FISOFT / FISHPLUS. asp).
FAO, 2008. Agricultural Department, Production Information, Data and Statistics Unit.Fish oilseed stat: www.fao.org/ag/statist.asp).
Fasakin, E.A., Balogun, A.M., Fagbenro, O.A., 2001. Evaluation of sun dried Azolla Africana,and duckweed, Spirodela polyrrhiza in practical diets for Nile tilapia, Oreochromisniloticus fingerlings. J. Appl. Aquac. 11, 83–92.
Folch, J., Lees, M., Stanley, G., 1957. A simple method of the isolation and purification oftotal lipids from animal tissues. J. Biol. Chem. 226, 497–509.
Francis, G., Makkar, H.P.S., Becker, K., 2001. Antinutritional factors present in plant-derivedalternate fish feed ingredients and their effects in fish. Aquaculture 199, 197–227.
Furukawa, A., Tsukahara, H., 1966. On the acid digestion of chromic oxide as an indexsubstance in the study of digestibility of fish feed. Bull. Jpn. Soc. Sci. Fish. 32, 502–506.
Gaber, M.M., 2006. Partial and complete replacement of fishmeal by broad beanmeal infeeds for Nile tilapia, Oreochromis niloticus, L., fry. Aquac. Res. 37, 986–993.
Gordillo, E.D.M., 1991. Una alternativa para el secano, Mundi-Prens, In: El Garbanzo (Ed.),Madrid, Spain. (add title of book and the publisher).
Grabner, M., Hofer, R., 1985. The digestibility of the proteins of broad bean (Vicia faba)and soybean (Glycine max) under in vitro conditions stimulating the alimentarytracts of rainbow trout (Salmo gairdneri) and carp (Cyprinus carpio). Aquaculture 48,111–122.
Gutierrez, N., Duc, G.,Marget, P., Avila, C.M., Suso,M.J., Cubero, J.I.,Moreno,M.T., Torres, A.M.,2004. Identification of molecular markers tightly linked to low tannin and vicine-convince content in faba beans. 4 InternationalWorkshop on Antinutritional Factors inLegumeSeeds andOilseeds. 08-10mars 2004, Toledo (Esp). EAAP, EuropeanAssociationfor Animal Production.
Hiai, S., Oura, H., Nakajima, T., 1976. Color reaction of some sapogenins and saponinswith vanillin sulphuric acid. Planta Med. 29, 116–122.
Jackson, A.J., Apper, R.S., Matty, A.S., 1982. Evaluation of some plant proteins in completediets for the tilapia Sarotherodon mossambicus. Aquaculture 27, 97–109.
Kamarudin, M.S., Kaliapan, K.M., Siraj, S.S., 1989. The digestibility of several feedstuffs inred tilapia. Fish nutritional research in Asia. In: De Silva, S.D. (Ed.), Proceedings ofthe Third Asian Fish Nutrition Network Meeting. Asian Fisheries Society, Manila,Philippines, pp. 118–122.
Krichen, S., 2007. Valorisation de la farine de Luzerne (Medicago sativa) dansl'alimentation du tilapia du Nil (Oreochromis niloticus L.). Master thesis, Institutsupérieur de Biotechnologies de Monastir, Univ. de centre, Tunisie, 89 p.
Leary, D.F., Lovell, R.T., 1975. Value of fibre in production type diets for channel catfish.Trans. Am. Fish. Soc. 104, 328–332.
Macarulla, M.T., Medina, C., De Diego, M.A., Chavarri, M., Zulet, A.M., Martınez, J.A., Noel-Suberville, C., Higueret, P., Portillo, M.P., 2001. Effects of the whole seed and a proteinisolate of faba bean (Vicia faba) on the cholesterol metabolism of hyper-cholesterolaemic rats. Br. J. Nutr. 85, 607–614.
March, J.G., Villacampa, A.I., Grases, F.,1995. Enzymatic-spectrophotometric determinationof phytic acid with phytase from Aspergillus ficuum. Anal. Chim. Acta 300, 269–272.
New, M.B., 1987. Feed and feeding of fish and shrimp. A Manual on the Preparation ofCompound Feeds for Shrimp and Fish in Aquaculture. FAO, Rome, Italy.
Ng, W.K., Chen, M.L., 2002. Replacement of soybean meal with palm kernel meal inpractical diets of hybrid Asian African catfish, Clarias macrocephalus X C. gariepinus.J. Appl. Aquac. 12, 67–76.
Obasa, S.O., Dada, A.A., Alegbeleye, W.O., 2006. Evaluation of pigeon pea (Cajanus cajan)as a substitute for soya bean meal in the diet of Nile tilapia (Oreochromis niloticus)fingerlings. Afr. J. Aquac. 23, 51–59.
Omoregie, E., Ogbemudia, F.I., 1993. Effect of substituting fishmeal with palm kernel mealon growth and food utilization of the Nile tilapia,Oreochromis niloticus. Isr. J. Aquacult.Bamidgeh 43, 113–119.
Santiago, C.B., Lovell, R.T., 1988. Amino acid requirements for growth of Nile tilapia. J.Nutr. 118, 1540–1546.
Shiau, S.Y., 1989. Role of fibre in fish feed. In: Shiau, S.Y. (Ed.), Progress in Fish Nutrition,Proceedings of the Fish Nutrition Symposium Marine Food Sciences Series No 98.National Taiwan Ocean University, Keelung, Taiwan, pp. 93–119.
Siddhuraju, P., Becker, K., 2001. Preliminary nutritional evaluation of mucuna seed meal(Mucuna pruriens var. utilis) in common carp (Cyprinus carpio L.): an assessment bygrowth performance and feed utilization. Aquaculture 196, 105–123.
Soliman, A.K., 2000. Partial and complete replacement of soybeanmeal by roquette (Erucasativa) seed meal in diets of Nile tilapia, Oreochromis niloticus. In: Fitzsimmons, K.K.,Filho, J.C. (Eds.), Proceedingof Fifth International SymposiumonTilapia inAquaculture(ISTA V), Rio de Janeiro, Brazil, pp. 209–214.
Tacon, A.G.J., 2007. Meeting the feed supply challenges. Paper Presented FAO GlobefishGlobal Trade Conference on Aquaculture, Qingdao, China, 29–31 May 2007.
Wolf, A., Watson, M., Wolf, N., 2003. Digestion and dissolution methods for P, K, Ca Mgand trace elements. In: Peters, J. (Ed.), Recommended Methods of Manure Analysis(A3769). University of Wisconsin-Madison, pp. 30–47.
Yue, Y., Zhou, Q., in press. Effect of Replacing Soybean Meal with Cottonseed Meal onGrowth, Feed Utilization, and Hematological Indexes for Juvenile Hybrid Tilapia,Oreochromis niloticus×O. aureus. doi:10.1016/j.aquaculture.2008.07.030.
Related Documents