EUR 24983 EN - 2011 Evaluation of EDXRF for the Determination of Elements in PM 10 Filters S. Yatkin, M. Gerboles, A. Borowiak, G. Tanet, V. Pedroni, R. Passarella and F. Lagler

Welcome message from author
This document is posted to help you gain knowledge. Please leave a comment to let me know what you think about it! Share it to your friends and learn new things together.
Transcript
EUR 24983 EN - 2011
Evaluation of EDXRF for the Determinationof Elements in PM10 Filters
S. Yatkin, M. Gerboles, A. Borowiak, G. Tanet, V.Pedroni, R. Passarella and F. Lagler
The mission of the JRC-IES is to provide scientific-technical support to the European Union’s policies for the protection and sustainable development of the European and global environment.
European Commission Joint Research Centre Institute for Environment and Sustainability Contact information Address: Joint Research Centre, Via E. Fermi, TP 442, I -21027 Ispra (VA) E-mail: [email protected] Tel.: +39 0332 785652 Fax: +39 0332 789931 http://ies.jrc.ec.europa.eu/ http://www.jrc.ec.europa.eu/ Legal Notice Neither the European Commission nor any person acting on behalf of the Commission is responsible for the use which might be made of this publication.
Europe Direct is a service to help you find answers to your questions about the European Union
Freephone number (*):
00 800 6 7 8 9 10 11 (*) Certain mobile telephone operators do not allow access to 00 800 numbers or these calls may be billed. A great deal of additional information on the European Union is available on the Internet. It can be accessed through the Europa server http://europa.eu/ JRC 66961 EUR 24983 EN ISBN 978-92-79-21641-1 ISSN 1831-9424 doi:10.2788/87284 Luxembourg: Publications Office of the European Union © European Union, 2011 Reproduction is authorised provided the source is acknowledged Printed in Italy
Summary The Joint Research Centre (JRC) has evaluated the potential of Energy Dispersive X-ray Fluorescence (EDXRF) to be equivalent to Graphite Furnace Atomic Absorption Spectrometers (GF-AAS) and Inductively Coupled Plasma Mass Spectrometer (ICP-MS) for the measurements of heavy metals in particulate matter (PM10). The elements that are regulated in the European Directives for Air Quality (lead (Pb), arsenic (As), nickel (Ni) and cadmium (Cd)) and the ones included in the EMEP (Cooperative program for monitoring and evaluation of long-range transmission of air pollutants in Europe) programme, namely copper (Cu), chromium (Cr) and zinc (Zn) were tested. Other elements such as aluminium (Al), calcium (Ca), iron (Fe), magnesium (Mg), silicon (Si), chloride (Cl), potassium (K), sulphur (S), manganese (Mn), molybdenum (Mo), cobalt (Co), strontium (Sr), bromide (Br), titanium (Ti), tin (Sn) and antimony (Sb), which are essential for source apportionment studies were also tested. PM10 samples collected at different sites on Teflon (Pall Teflon) and 2 types of quartz filters (QMA and PallFlex) were analyzed both by EDXRF and ICP-MS.
The first objective of this study was to assess the suitability of the linear calibration of X-ray intensities versus PM-loaded standards for determining PM10-bound elements on 3 types of filters loaded at several sampling sites. It was found that the linear calibration of EDXRF using loaded filters were found to be site and filter independent for Pb, Mn, Fe, Cu, Ti and Zn. Calcium was found to be site independent, but, filter type dependent. For Teflon filters, the linear calibration gave reasonably good results if calibration filters came from a similar site. The standardless EDXRF analysis was found to be more efficient than linear calibration for the quantification of most of the studied elements except As, V and Co. This calibration method is filter type and sampling site independent. Cd, Sn and Sb could not be analyzed, neither by the standardless EDXRF analysis nor the linear calibration in the studied samples.
The second objective was to check the ability of standardless EDXRF analysis to reach the Method Detection Limit (MDL) and Limit of Quantification (LOQ) requested in EN 14902 for monitoring As, Cd, Ni and Pb in PM10 loaded filters. It was found that MDLs of standardless EDXRF analysis were sufficiently low to measure Ni and Pb, but, not Cd and As, at the limit values of European Directives.
The third objective was to compare over a wide range of elemental masses and for several ambient air matrixes standardless EDXRF and ICP-MS analysis of PM10-bound elements loaded on 3 types of filters (Teflon and 2 type quartz) in order to evaluate how well the two methods agree. It was found that the agreement between ICP-MS and standardless EDXRF results for Teflon filters were higher than quartz ones.
The forth objective was to estimate the measurement uncertainties of standardless EDXRF analysis and its major contributors according to the Guide to the Expression of Uncertainty in Measurement (GUM) used laboratory experiments. The uncertainties according to the GUM were found to be about 30% for most of the elements except for Ca, Fe, K, Zn, Mn, Ni, Ti (QMA), Cu and Ti (PallFlex) and Mo (Teflon), which their UGUM at low concentrations sharply increased because of its poorer repeatability. The net intensities, initial calibration using thin film samples and sum of correlated variables, namely excited area, total deposition area and PM mass are the dominant contributors to measurement uncertainty. The uncertainties of Teflon filters were estimated lower than the others.
The fifth objective was to compare and confirm the GUM uncertainties with field measurements uncertainties estimated with the Guide to the Demonstration of Equivalence of Ambient Air Monitoring Method (Guide) using differences between co-located EDXRF and ICP-MS measurements. The field uncertainties decreased with elemental masses for almost all studied elements. The elemental mass threshold, which field uncertainty becomes equal to or less than GUM uncertainty, appeared for all elements except Cr, K, Mg and Ti for all types of filter. Hence, at higher
elemental masses than these thresholds, the proposed model equation for estimating the GUM uncertainty has demonstrated its validity and be used for whatever future filter analysis.
The last objective was to investigate the equivalence of standardless EDXRF analysis to ICP-MS for measuring As, Cd, Ni and Pb in PM10 according to the Guide and to demonstrate the ability of EDXRF to meet the Data Quality Objective (DQO) of the European Directives and EMEP manual (for As, Cd, Ni, Pb, Cr, Cu and Zn). It was found that The DQO of the EU Directive for Pb was met for all types of filter even at lower concentrations than the Limit Value. Only for Teflon, field uncertainty for Ni is likely to comply with the DQO. For As, the best results can be achieved by analyzing Teflon filter if using with linear calibration. It is likely that at the Limit Value the DQO can be met for As by linear calibration. Cd could not be quantified most probably due to low concentrations, and further tests at the Limit Value are required. The EMEP DQO was met for Cu (for Teflon) and Zn (for quartz filter), but, not for Cr.
As the overall result of this study, EDXRF can be considered as an alternative method to ICP-MS for measurements of PM-bound elements, particularly on Teflon filters. The European legislative requirements of Pb could be met for whatever filters type. The European legislative requirements of Ni and As are likely be met, but, it is unknown for Cd. The EMEP requirements can be met for Cu and Zn, but not for Cr. EDXRF can also be used to measure elements for source apportionment purposes. Calibrating the instrument by certified matrix matched standards on filter could produce better results, particularly for As, V and Co, even at low concentrations.
Content Summary ................................................................................................................................................................. 3
List of Tables .......................................................................................................................................................... 5
List of figures .......................................................................................................................................................... 6
Abbreviations .......................................................................................................................................................... 7
1 Introduction and Objectives ........................................................................................................................... 1
2 Experiments .................................................................................................................................................... 3
2.1 Sampling of PM10 ....................................................................................................................................... 3
2.2 EDXRF Set up ........................................................................................................................................... 4
2.3 ICP-MS ...................................................................................................................................................... 6
2.4 Data Evaluation .......................................................................................................................................... 7
2.4.1 Linear Calibration Using Standards Analyzed by ICP-MS .................................................. 7
2.4.2 Method Detection Limits (MDLs) and Limits of Quantification (LOQs) ........................... 8
2.4.3 Comparison of ICP-MS and Standardless EDXRF Analysis ............................................... 8
2.4.4 Measurement Uncertainty .................................................................................................... 8 3 Results and Discussion ................................................................................................................................. 10
3.1 Evaluation of Linear Calibration and Standardless EDXRF Analysis ..................................................... 10
3.2 Evaluation of Method Detection Limit and Quantification Limit ............................................................ 31
3.3 Evaluation of the Results of Standardless EDXRF Analysis and ICP-MS .............................................. 32
3.4 Evaluation and Comparison of Measurement Uncertainty of Standardless Analysis .............................. 41
3.4.1 Laboratory Uncertainty (UGUM) .......................................................................................... 41
3.4.2 Field Uncertainty (UDIR) and Data Quality Objectives ...................................................... 54 4 Conclusion .................................................................................................................................................... 76
List of Tables Table 1. Field site of PM10 sampling, model of low volume samplers, filter type and range of PM10 mass .......... 3
Table 2. Operational parameters of EDXRF. Primary beam filters are used to adjust X-Ray energy for the
elements of interest. Voltage is the potential difference applied. Live time is the excitation/analyzing
duration ........................................................................................................................................................... 4
Table 3: Method detection limits MDLs and quantification limits (in ng on each filter) of various filter types .. 32
Table 4: Slope and intercept of the orthogonal regression lines of EDXRF versus ICP-MS masses in ng for 3
types of filters. b1 represents the slope ± standard uncertainty whilst b0 is the intercept (divided by
arithmetic mean of ICP-MS, x ) ± standard uncertainty divided by the intercept. (n.a.: Not available due to
lack of the orthogonal regression) ................................................................................................................ 43
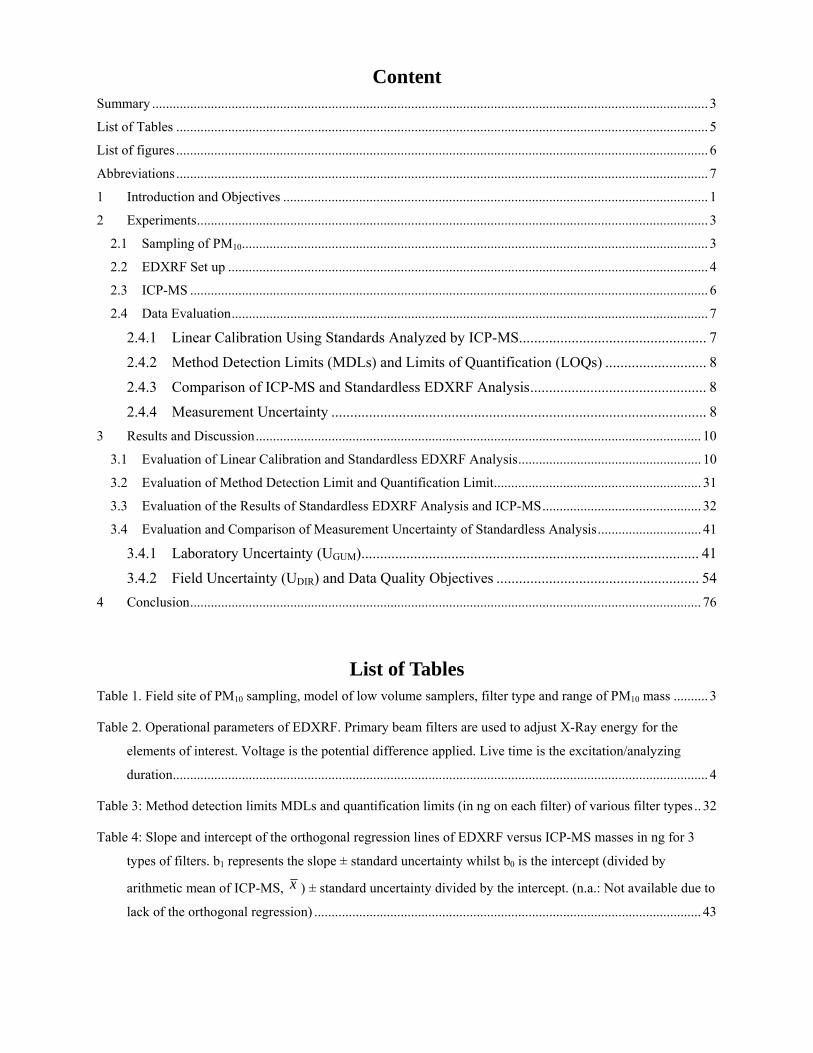
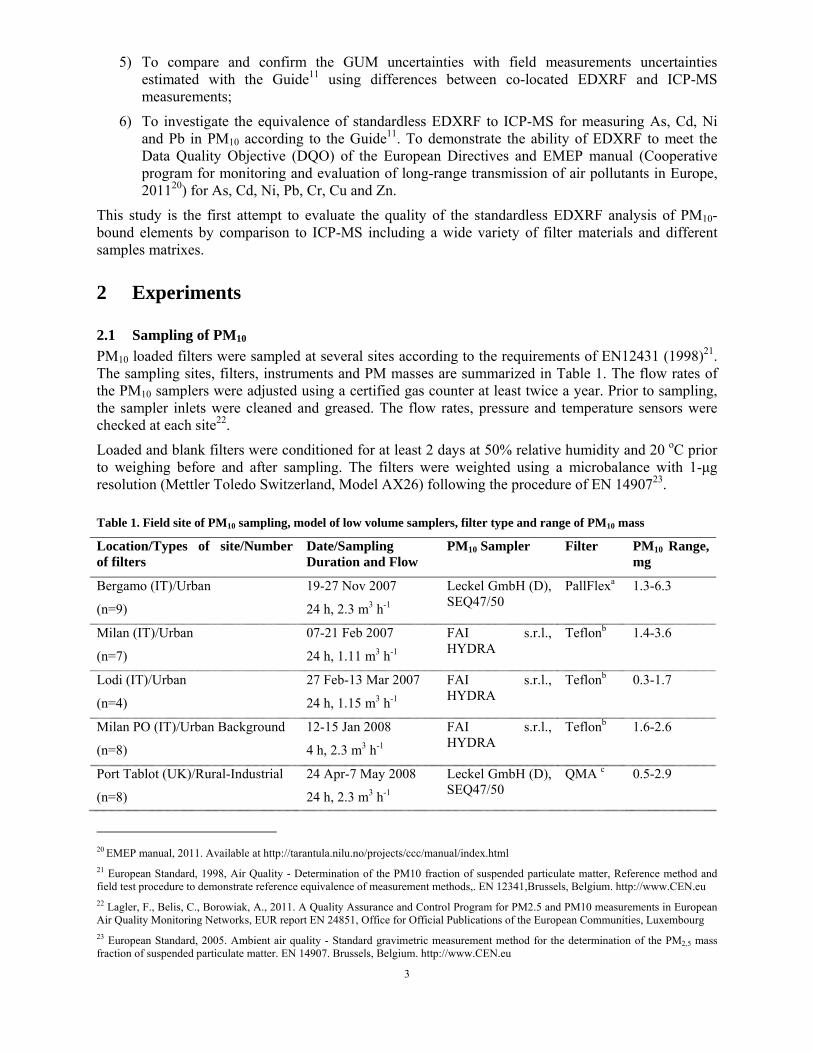
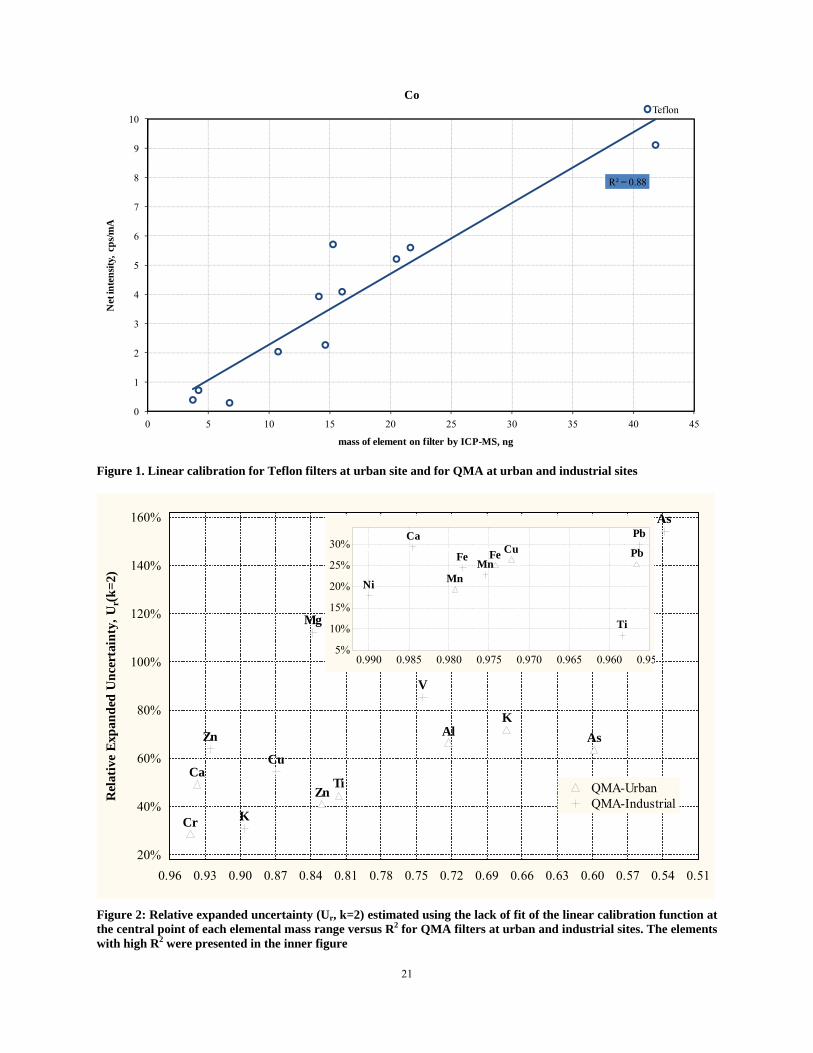
List of figures Figure 1. Linear calibration for Teflon filters at urban site and for QMA at urban and industrial sites ............... 21
Figure 2: Relative expanded uncertainty (Ur, k=2) estimated using the lack of fit of the linear calibration
function at the central point of each elemental mass range versus R2 for QMA filters at urban and
industrial sites. The elements with high R2 were presented in the inner figure ............................................ 21
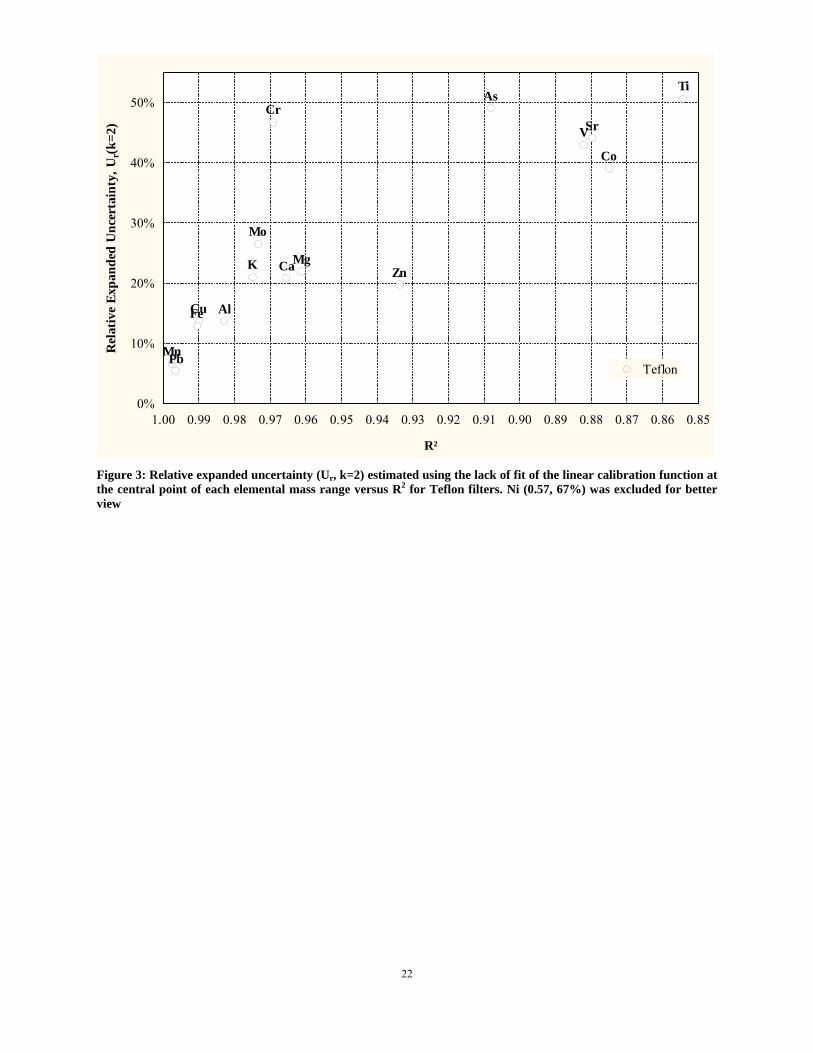
Figure 3: Relative expanded uncertainty (Ur, k=2) estimated using the lack of fit of the linear calibration
function at the central point of each elemental mass range versus R2 for Teflon filters. Ni (0.57, 67%) was
excluded for better view ............................................................................................................................... 22
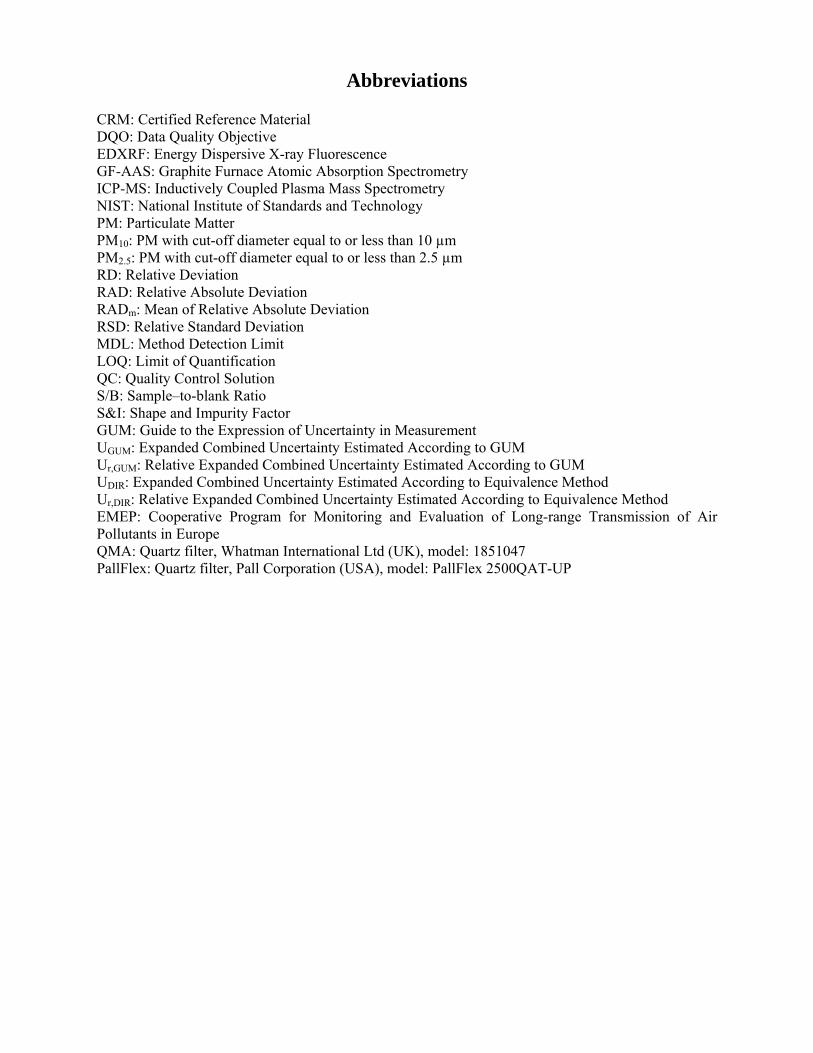
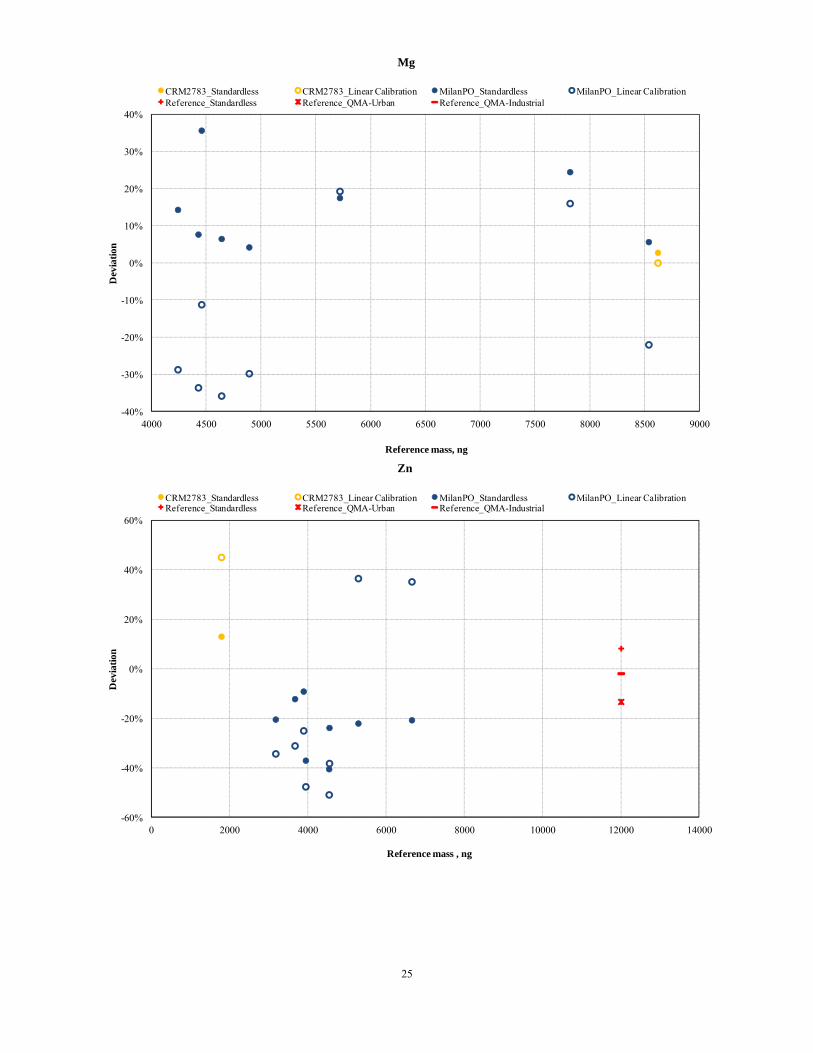
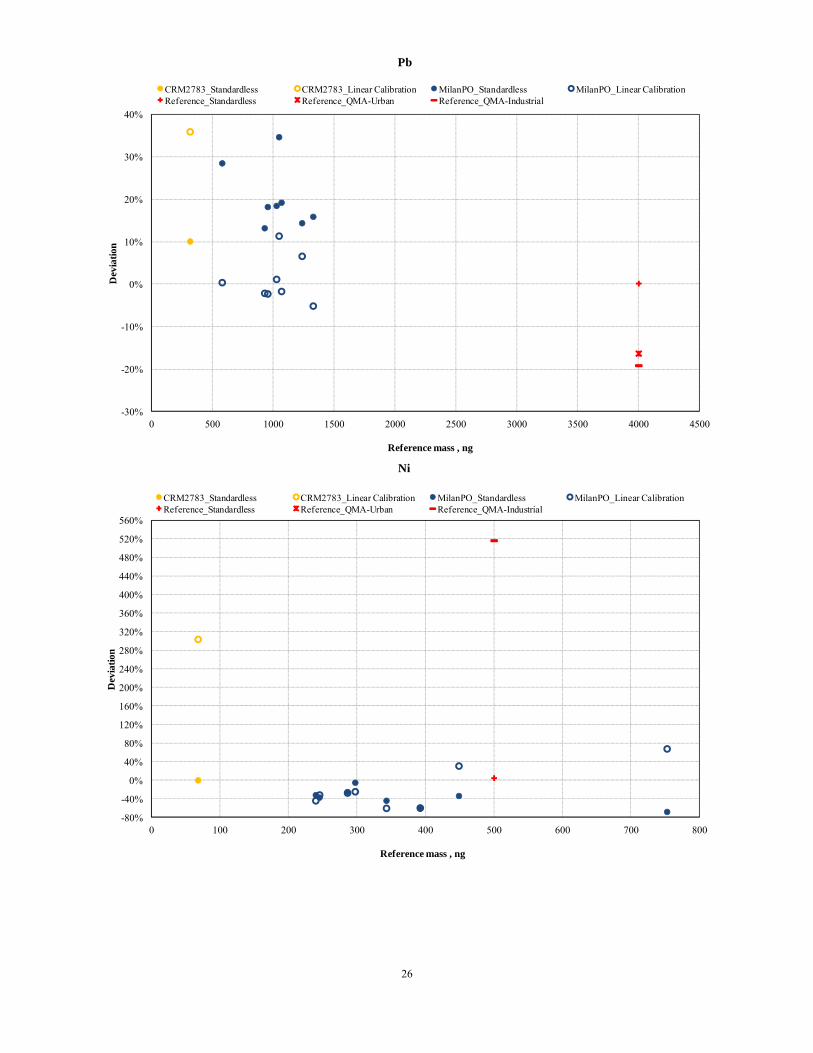
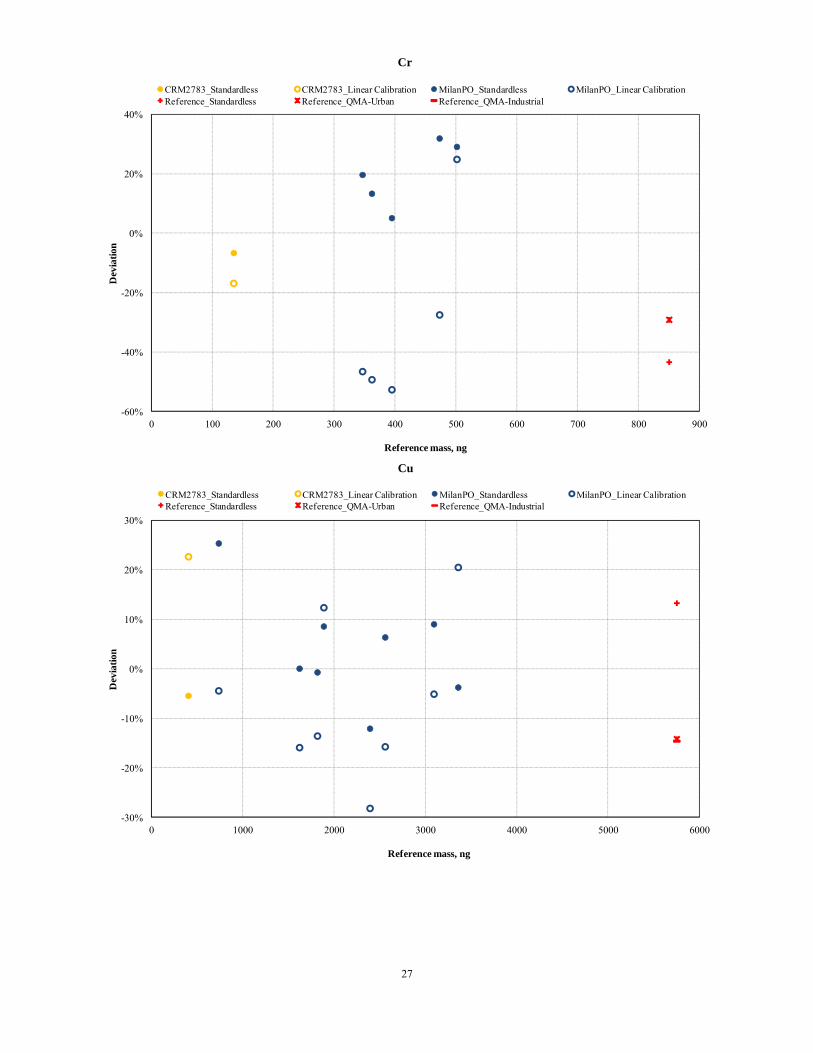
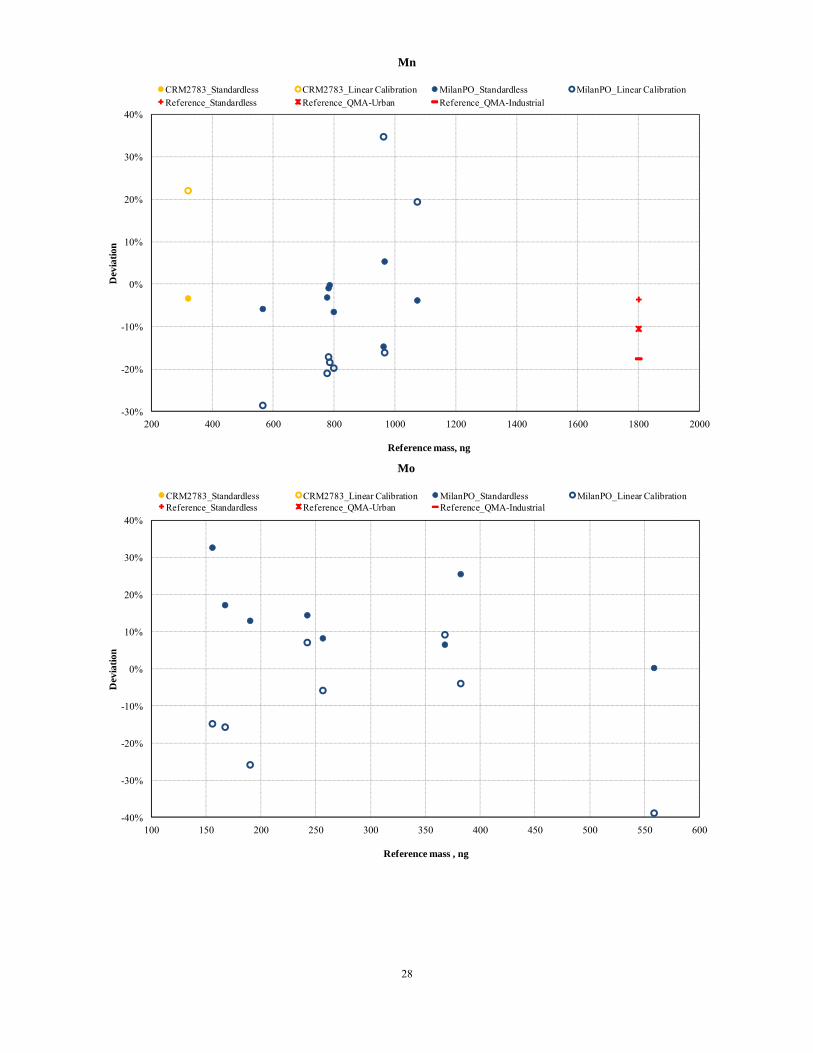
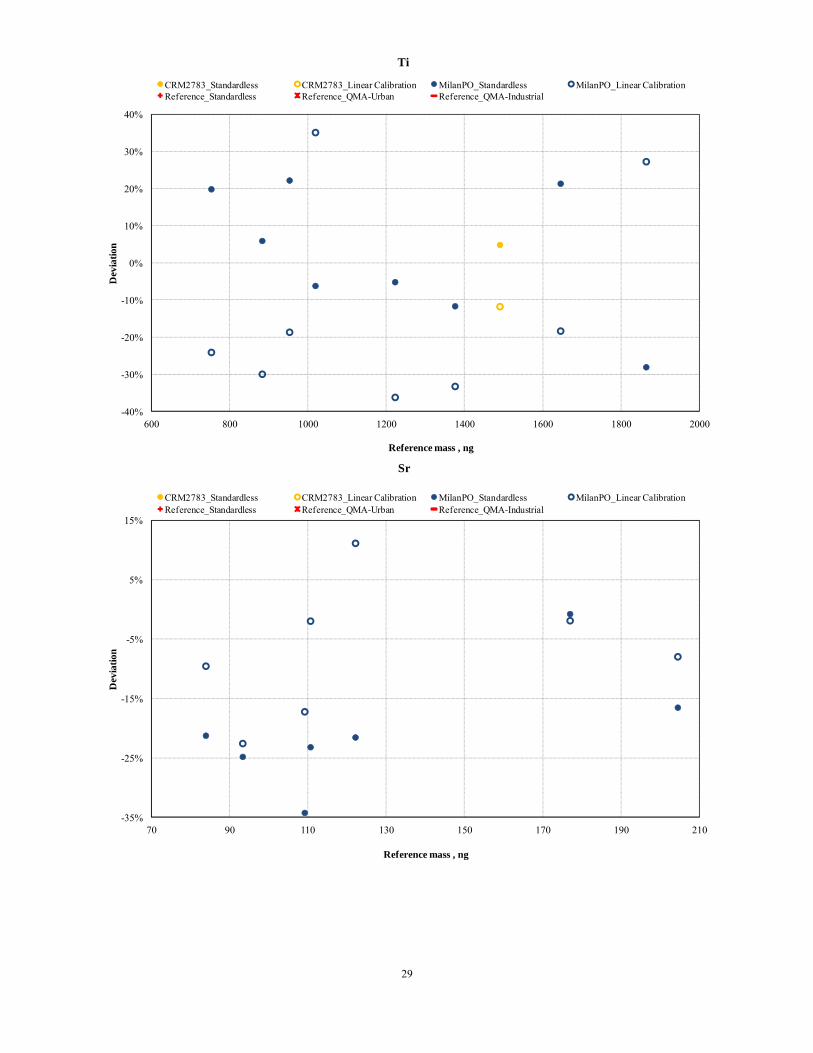
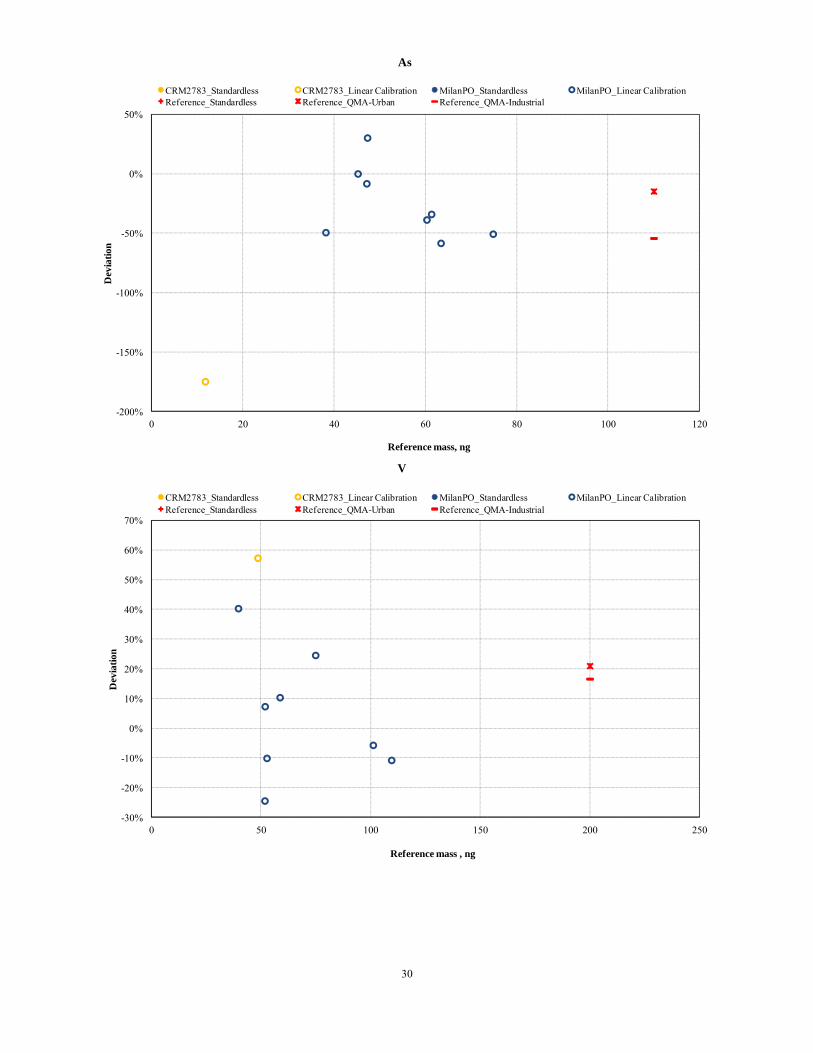
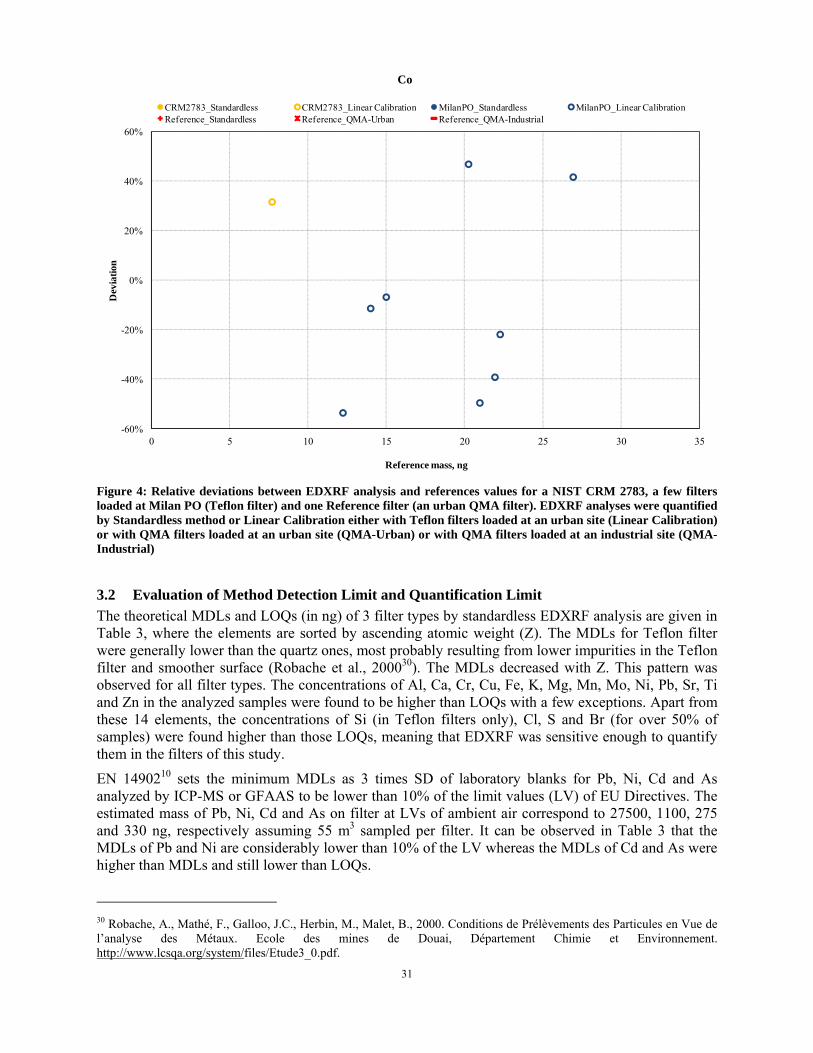
Figure 4: Relative deviations between EDXRF analysis and references values for a NIST CRM 2783, a few
filters loaded at Milan PO (Teflon filter) and one Reference filter (an urban QMA filter). EDXRF analyses
were quantified by Standardless method or Linear Calibration either with Teflon filters loaded at an urban
site (Linear Calibration) or with QMA filters loaded at an urban site (QMA-Urban) or with QMA filters
loaded at an industrial site (QMA-Industrial) .............................................................................................. 31
Figure 5: Relative deviation (RD, %) of EDXRF versus elemental masses measured by ICP-MS. For Al, 3
PallFlex samples (3140 ng-718%, 4050 ng-531%, 3995 ng-485%) and 1 QMA sample (5071 ng-594%),
for Pb, 2 PallFlex samples (170 ng-204%, 5358 ng-17%), for Ni, 1 PallFlex sample (108 ng-434%), for
Mn, 1 PallFlex sample (5017 ng, 13%) and 1 QMA sample (4678 ng, -10%), forTi, 2 PallFlex sample (191
ng-276%, 128 ng-506%) and for Zn, 1 PallFlex sample (29648 ng-14%) are out of scale for better wiev . 40
Figure 6: The mean relative absolute deviation (RADm, %) and standard deviation (Error bars) between EDXRF
and ICP-MS per filter type ........................................................................................................................... 41
Figure 7: Average contributions of parameters to Ur,GUM for 3 types of filter. Inet refers I-I0. r denotes the
contributions of the correlations between correlated variables, A is the excited area; Ad is the PM deposited
area, mPM is the mass of PM10; Ki is the ratio of counts to mass of element i determined by initial
calibration; µi is the mass absorption coefficient of element i ..................................................................... 44
Figure 8: The variation of contribution of Inet and elemental mass by standardless EDXRF analysis .................. 53
Figure 9: Comparison of Ur,GUM and Ur,DIR for PallFlex filters. mlim denotes the limit values of EU Directives and
calculated by assuming 55 m3 sampling air ................................................................................................. 62
Figure 10: Comparison of Ur,GUM and Ur,DIR for QMA filters. mlim denotes the limit values of EU Directives and
calculated by assuming 55 m3 sampling air ................................................................................................. 68
Figure 11: Comparison of Ur,GUM and Ur,DIR for Teflon filters. mlim denotes the limit values of EU Directives and
calculated by assuming 55 m3 sampling air ................................................................................................. 75
Abbreviations
CRM: Certified Reference Material DQO: Data Quality Objective EDXRF: Energy Dispersive X-ray Fluorescence GF-AAS: Graphite Furnace Atomic Absorption Spectrometry ICP-MS: Inductively Coupled Plasma Mass Spectrometry NIST: National Institute of Standards and Technology PM: Particulate Matter PM10: PM with cut-off diameter equal to or less than 10 µm PM2.5: PM with cut-off diameter equal to or less than 2.5 µm RD: Relative Deviation RAD: Relative Absolute Deviation RADm: Mean of Relative Absolute Deviation RSD: Relative Standard Deviation MDL: Method Detection Limit LOQ: Limit of Quantification QC: Quality Control Solution S/B: Sample–to-blank Ratio S&I: Shape and Impurity Factor GUM: Guide to the Expression of Uncertainty in Measurement UGUM: Expanded Combined Uncertainty Estimated According to GUM Ur,GUM: Relative Expanded Combined Uncertainty Estimated According to GUM UDIR: Expanded Combined Uncertainty Estimated According to Equivalence Method Ur,DIR: Relative Expanded Combined Uncertainty Estimated According to Equivalence Method EMEP: Cooperative Program for Monitoring and Evaluation of Long-range Transmission of Air Pollutants in Europe QMA: Quartz filter, Whatman International Ltd (UK), model: 1851047 PallFlex: Quartz filter, Pall Corporation (USA), model: PallFlex 2500QAT-UP
1
1 Introduction and Objectives Chemical content of particulate matter (PM) have been determined for a long time all around the world because of their toxicity (Schlesinger et al, 20061; Kampa and Castanas, 20082; Zhang et al, 20113) and for source apportionment purposes (Hopke et al, 20034; Liu et al, 20035; Kim et al, 20036; Viana et al, 20087). They are analysed using sensitive wet chemistry based methods such as, Graphite Furnace Atomic Absorption Spectrometers (GF-AAS) and Inductively Coupled Plasma Mass Spectrometer (ICP-MS). However, these methods require labour intensive and expensive sample pre-treatment/analysis, and well qualified operators. Besides, sample pre-treatment may also cause contamination of samples even when the maximum attention is taken. As a result of the shortcoming of ICP-MS and GF-AAS, many researchers explore alternative analytical techniques.
The European air quality Directives (2004/107/EC8 and 2008/50/EC9, hereafter called EU Directives) state that GF-AAS or ICP-MS operated according to EN 1490210 are the reference methods for the monitoring of As, Cd, Ni and Pb in PM10, in order to detect exceedances of the limit values (LV) defined in the Directives. However, European legislation allows using an alternative method provided that its equivalence to the reference methods (GFAAS or ICP-MS) can be demonstrated following the Guide to the Demonstration of Equivalence of Ambient Air Monitoring Method11 (hereafter called the Guide).
X-ray based analysis techniques have been intensively implemented for the determination of elements in several environmental matrixes such as air filters (Calzolai et al, 200812; Canepari et al, 200913; Niu et al, 201014; Brown et al, 201015; Ozturk et al, 201116), stack gases (Haupt et al, 199717) and soil 1 Schlesinger, R.B., Kunzli, N., Hidy, G.M., Gotschi, T., Jerrett, M., 2006. The health relevance of ambient particulate matter characteristics: Coherence of toxicological and epidemiological inferences. Inhalation Toxicology 18, 95-125. 2 Kampa, M., Castanas, E., 2008. Human health effects of air pollution. Environmental Pollution 151, 362-367. 3 Zhang, W., Lei, T., Lin, Z.-Q., Zhang, H.-S., Yang, D.-F., Xi, Z.-G., Chen, J.-H., Wang, W., 2011. Pulmonary toxicity study in rats with PM10 and PM2.5: Differential responses related to scale and composition. Atmospheric Environment 45, 1034-1041 4 Hopke, P.K., Ramadan, Z., Paatero, P., Norris, G.A., Landis, M.S., Williams, R.W., Lewis, C.W., 2003. Receptor modeling of ambient and personal exposure samples: 1998 Baltimore Particulate Matter Epidemiology-Exposure Study. Atmospheric Environment 37, 3289–3302. 5 Liu, W., Hopke, P.K., Han, Y.-ji, Yi, S.-M., Holsen, T.M., Cybart, S., Kozlowski, K., Milligan, M., 2003. Application of receptor modeling to atmospheric constituents at Potsdam and Stockton, NY. Atmospheric Environment 37, 4997-5007. 6 Kim, E., Hopke, P.K., Paatero, P., Edgerton, E.S., 2003. Incorporation of parametric factors into multilinear receptor model studies of Atlanta aerosol. Atmospheric Environment 37, 5009–5021. 7 Viana, M., Kuhlbusch, T.A.J., Querol, X., Alastuey, A., Harrison, R.M., Hopke, P.K, et al., 2008. Source apportionment of particulate matter in Europe: A review of methods and results. Journal of Aerosol science 39, 827–849. 8 Directive 2004/107/EC of the European Parliament and of the Council of 15 December 2004 relating to arsenic, cadmium, mercury, nickel and polycyclic aromatic hydrocarbons in ambient air. Official Journal L 23, 26/01/2005. http://eur-lex.europa.eu. 9 Directive 2008/50/EC of the European Parliament and the Council of 21 May 2008 on ambient air quality and cleaner air for Europe, Official Journal of the Euro-pean Union L 152/1 of 11.6.2008. http://eur-lex.europa.eu. 10 European Standard, 2005. Ambient air quality - standard method for the measurement of Pb, Cd, As and Ni in the PM10 fraction of suspended particulate matter. EN 14902. Brussels, Belgium. http://www.CEN.eu. 11 Guide to the Demonstration of Equivalence of Ambient Air Monitoring Method, 2010, http://ec.europa.eu/environment/air/quality/legislation/pdf/equivalence.pdf 12 Calzolai, G., Chiari, M., Lucarelli, F., Mazzei, F., Nava, S., Prati, P., Valli, G., Vecchi, R., 2008. PIXE and XRF analysis of particulate matter samples: an inter-laboratory comparison. Nuclear Instruments and Methods in Physics Research Section B: Beam Interactions with Materials and Atoms 266, 2401-2404 13 Canepari, S., Perrino, C., Astolfi, M.L., Catrambone, M., Perret, D., 2009. Determination of soluble ions and elements in ambient air suspended particulate matter: Inter-technique comparison of XRF, IC and ICP for sample-by-sample quality control. Talanta 77, 1821-1829. 14 Niu, J., Rasmussen, P.E., Wheeler, A., Williams, R., Chénier, M., 2010. Evaluation of airborne particulate matter and metals data in personal, indoor and outdoor environments using ED-XRF and ICP-MS and co-located duplicate samples. Atmospheric Environment 44, 235-245.

2
(Chimidza et al, 200118). X-ray analysis is faster and cheaper than ICP-MS and GF-AAS because it does not need any sample pre-treatment. Conversely to GF-AAS or ICP-MS, X-ray based techniques does not involve destruction of the samples being analyzed. This is a major advantage that makes further determinations of ions, organics and carbon still possible, which is essential for receptor models.
Typically, the determination of PM-bound elements using energy dispersive X-ray fluorescence (EDXRF) analysis includes establishing the relationship between X-Ray intensities and a set of calibration standards, in most cases, single element/compound thin films. However, these standards do not mimic the filter material and the PM matrix. Furthermore, the concentrations of single elements of those calibration standards are higher than their level in ambient air samples by orders of magnitude. The lack of commercially available matrix-matched standards for element in PM filters makes calibration the most challenging issue of EDXRF operation. Therefore, several researchers have been investigating an alternative calibration technique using the relationship between XRF intensities and elemental masses determined by a reliable analytical method such as ICP-MS. As demonstrated by several researchers13,16, this technique gave satisfying results if the same PM sampling instruments and XRF is used at the same site of calibration. However, no study was found in the literature about the evaluation of the alternative calibration technique at a site different from the site of calibration. Apart from the typical calibration technique using single pure element/compound thin films, EDXRF can also be operated in standardless mode, which is expected to be sample matrix and concentration independent. The standardless EDXRF analysis is based on the only initial calibration with single pure element/compound thin films and further deconvolution of spectra that allows the determination of all elements in whatever sample matrix.
The objectives of this study were:
1) To assess the suitability of the linear calibration of X-ray intensities versus PM-loaded standards for determining PM10-bound elements on 3 types of filters loaded at several sampling sites. The relationship between instrument responses and masses of elements determined by ICP-MS were used to establish the linear calibration;
2) To check the ability of standardless EDXRF analysis to reach the Method Detection Limit (MDL) and Limit of Quantification (LOQ) requested in EN 1490210 for monitoring As, Cd, Ni and Pb in PM10 loaded filters;
3) To compare over a wide range of elemental masses and for several ambient air matrixes standardless EDXRF and ICP-MS analysis of PM10-bound elements loaded on 3 types of filters (Teflon and 2 type quartz) in order to evaluate how well the two methods agree;
4) To estimate the measurement uncertainties of standardless EDXRF analysis and its major contributors according to the Guide to the Expression of Uncertainty in Measurement19 (hereafter called GUM) used laboratory experiments;
15 Brown, R.J.C., Jarvis, K.E., Disch, B.A., Goddard, S.L., Adriaenssens, E., Claeys, N., 2010. Comparison of ED-XRF and LA-ICP-MS with the European reference method of acid digestion-ICP-MS for the measurement of metals in ambient particulate matter. Accreditation and Quality Assurance 15, 493-502. 16 Oztürk, F., Zararsiz, A., Kirmaz, R., Tuncel, G., 2011. An approach to measure trace elements in particles collected on fiber filters using EDXRF. Talanta 83, 823-831. 17 Haupt, O., Linnow, K., Harmel, R., Schaefer, C., Dannecker, W., 1997. Qualitative X-Ray fluorescence analysis of emitted aerosol Particles from incineration plants sampled on quartz fibre filters. X-Ray Spectrometry 26, 79-84. 18 Chimidza, S., Viksna, A., Selin Lindgren, E., 2001. EDXRF and TXRF analysis of aerosol particles and the mobile fraction of soil in Botswana. X-Ray Spectrometry 30, 301-307. 19 Evaluation of measurement data-Guide to the expression of uncertainty in measurement, 2008. Joint Committee for Guides in Metrology, JCGM 100:2008. www.bipm.org
3
5) To compare and confirm the GUM uncertainties with field measurements uncertainties estimated with the Guide11 using differences between co-located EDXRF and ICP-MS measurements;
6) To investigate the equivalence of standardless EDXRF to ICP-MS for measuring As, Cd, Ni and Pb in PM10 according to the Guide11. To demonstrate the ability of EDXRF to meet the Data Quality Objective (DQO) of the European Directives and EMEP manual (Cooperative program for monitoring and evaluation of long-range transmission of air pollutants in Europe, 201120) for As, Cd, Ni, Pb, Cr, Cu and Zn.
This study is the first attempt to evaluate the quality of the standardless EDXRF analysis of PM10-bound elements by comparison to ICP-MS including a wide variety of filter materials and different samples matrixes.
2 Experiments
2.1 Sampling of PM10 PM10 loaded filters were sampled at several sites according to the requirements of EN12431 (1998)21. The sampling sites, filters, instruments and PM masses are summarized in Table 1. The flow rates of the PM10 samplers were adjusted using a certified gas counter at least twice a year. Prior to sampling, the sampler inlets were cleaned and greased. The flow rates, pressure and temperature sensors were checked at each site22.
Loaded and blank filters were conditioned for at least 2 days at 50% relative humidity and 20 oC prior to weighing before and after sampling. The filters were weighted using a microbalance with 1-μg resolution (Mettler Toledo Switzerland, Model AX26) following the procedure of EN 1490723.
Table 1. Field site of PM10 sampling, model of low volume samplers, filter type and range of PM10 mass
Location/Types of site/Number of filters
Date/Sampling Duration and Flow
PM10 Sampler Filter PM10 Range, mg
Bergamo (IT)/Urban
(n=9)
19-27 Nov 2007
24 h, 2.3 m3 h-1
Leckel GmbH (D), SEQ47/50
PallFlexa 1.3-6.3
Milan (IT)/Urban
(n=7)
07-21 Feb 2007
24 h, 1.11 m3 h-1
FAI s.r.l., HYDRA
Teflonb 1.4-3.6
Lodi (IT)/Urban
(n=4)
27 Feb-13 Mar 2007
24 h, 1.15 m3 h-1
FAI s.r.l., HYDRA
Teflonb 0.3-1.7
Milan PO (IT)/Urban Background
(n=8)
12-15 Jan 2008
4 h, 2.3 m3 h-1
FAI s.r.l., HYDRA
Teflonb 1.6-2.6
Port Tablot (UK)/Rural-Industrial
(n=8)
24 Apr-7 May 2008
24 h, 2.3 m3 h-1
Leckel GmbH (D), SEQ47/50
QMA c 0.5-2.9
20 EMEP manual, 2011. Available at http://tarantula.nilu.no/projects/ccc/manual/index.html 21 European Standard, 1998, Air Quality - Determination of the PM10 fraction of suspended particulate matter, Reference method and field test procedure to demonstrate reference equivalence of measurement methods,. EN 12341,Brussels, Belgium. http://www.CEN.eu 22 Lagler, F., Belis, C., Borowiak, A., 2011. A Quality Assurance and Control Program for PM2.5 and PM10 measurements in European Air Quality Monitoring Networks, EUR report EN 24851, Office for Official Publications of the European Communities, Luxembourg 23 European Standard, 2005. Ambient air quality - Standard gravimetric measurement method for the determination of the PM2,5 mass fraction of suspended particulate matter. EN 14907. Brussels, Belgium. http://www.CEN.eu
4
Graz (AT)/Urban Background
(n=5)
12-22 Oct 2006
24 h, 2.3 m3 h-1
Leckel GmbH (D), SEQ47/50
QMA c 1.8-4.1
Prague (CZ)/ Urban Background
(n=5)
05-10 Nov 2006
24 h, 2.3 m3 h-1
Leckel GmbH (D), SEQ47/50
QMA c 0.5-3.0
IT: Italy; UK: United Kingdom; AT: Austria; CZ: Czech Republic, D: Germany a: Pall Corporation (USA), model: PallFlex 2500QAT-UP, quartz b: Pall Corporation (USA), model: Teflo R2PJ047 c: Whatman International Ltd (UK), model: 1851047, quartz
2.2 EDXRF Set up All filters were analyzed using the ARL Quant’X (Thermo Scientific Inc, USA) EDXRF spectrometer according to the conditions given in Table 2. This spectrometer is equipped with an air cooled X-ray tube (Rh anode, 40 W maximum power, 4-50 kV voltage, 0.02-1.98 mA current), a peltier cooled Si(Li) drifted crystal detector (15 mm2 crystal area, 3.5 mm crystal depth and 155 eV resolution), and a pulse processor (32 bit digital type, 20 eV channels, 1-40 ms adjustable shaping time, up to 100000 cps live count rate and 400-40960 eV energy range. Primary beam filters are placed in front of the X-ray beam in order to decrease the X-Ray energy to the correct excitation bandwidth of the elements to be analyzed.
The instrument was calibrated using pure thin film standards (Micromatter– XRF Calibration standards, 50 µg/cm², N - Nuclepore® polycarbonate aerosol membranes, USA). Since the levels of concentration of elements in PM10 sampled in ambient air are rather low, live times were increased in order to reach sufficient counts detected when analyzing a NIST CRM 2783 (see Table 2).
Before analysis, the filter holders and chamber of the EDXRF spectrometer were cleaned using dry filtered air. An energy adjustment and instrumental drift check were also performed prior to analysis using pure Cu and 10 pure thin film standards, respectively. The instrumental drift was evaluated taking as reference the counts registered at the initial calibration of the spectrometer. In case of drift higher than 10%, the instrument was subjected to proper maintenance in order to diminish these deviations. The samples were analyzed under vacuum with 3 replicates. Table 2. Operational parameters of EDXRF. Primary beam filters are used to adjust X-Ray energy for the elements of interest. Voltage is the potential difference applied. Live time is the excitation/analyzing duration
Beam Filter Voltage (kV) Live Time, sec Element
Cu Thick 50 240 Sn, Sb
Cu Thin 50 800 Mo, Cd
Pd Thick 30 1600 As, Br, Sr, Pb
Pd Medium 20 960 Cu, Zn
Pd Thin 16 600 Fe, Co, Ni, Mn
Aluminum 12 1000 Ti, V, Cr
Cellulose 8 200 S, Cl, K, Ca
No Filter 4 100 Mg, Al, Si
The quantifications of elements in PM10 were carried out using UniQuant, a special software based on the solution of Sherman equation (Sherman, 195524) by the fundamental parameters method. The correctness of the solution was previously presented by Rousseau (200625). With the UniQuant’s 24 Sherman, J., 1955. The theoretical derivation of fluorescent X-ray intensities from mixtures. Spectrochimica Acta 7, 283–306 25 Rousseau, R.M., 2006. Corrections for matrix effects in X-ray fluorescence analysis-A tutorial. Spectrochimica Acta - Part B Atomic Spectroscopy 61, 759-777
5
concept, instead of instrumental calibration relying on calibration of XRF intensities according to the mass of standards, instrumental sensitivity is determined as the function of net intensity and mass (Intensity/mass) which is constant and sample independent leading to standardless operation. The details of the software can be found elsewhere (www.uniquant.com). Deconvolution is applied to calculate spectra, which is unknown to the authors, since UniQuant is a commercial product. The software enables calculation of elemental concentrations using insensitivities, matrix type, instrumental drifts, matrix chemistry and measuring atmosphere. In this study, UniQuant (version 6.09, 200826) was modified to measure elements in PM10 collected on filters. Will De Jongh slightly modified the Sherman equation giving the mass of element. In fact, elemental mass, ci (ng), is calculated using Equation 1 where Ii is the drift corrected fluorescence intensities (counts/sec, cps), I0 is the interference and drift corrected background modeled by UniQuant using filter type (cps). µi is the mass absorption coefficient of element i (cm2/g). Wi is the weight factor of oxides assuming that all elements exist at the highest oxidation states (calculated from stoichiometry) for element i. Ki is the ratio of counts to mass of element i (cps/g) determined using thin film standards samples of pure elements (Initial calibration). A is the excited area (cm2) of the filter to which the X-ray excitation is applied (No collimator used) whereas Ad is PM deposition area on filter (cm2). mPM is the excited PM mass in ng. The software calculates the interference for each measured elements, using a secret algorithm. The interfering elements and their masses are given by the software. The sum of interferences is subtracted to compute the concentrations of elements.
( )PM
d
ii
iiii m
AA
ceInterferenAKWII
c ⎥⎦
⎤⎢⎣
⎡−
−= ∑μ0
Equation 1
Actually, the first part in square brackets is the standard equation of the software to calculate the elemental mass ratio (mass of element/total mass). Subsequently, they are multiplied by Ad/A and mPM to be converted to the total mass of element loaded on each filter, assuming evenly distribution of the particulate matter on filters and the absence of PM evaporation in the measuring chamber. The filter-specific parameter obtained by blank filter measurement, the so-called Shape and Impurity factor (S&I), is used to construct the background during the analysis with employed excitation energy and efficiency of measurement channel. The software needs information about the constituents of PM which cannot be excited by X-ray, for instance, C, H and N contents (Hereafter called Rest). Hence, approximate knowledge of PM in samples is required in order to select most appropriate Rest option. Several measurements cases according to the physical/geometrical data of sample (i.e., known Rest, unknown excitation area, being mono/multilayer etc.) were introduced in the software, and one was developed for air filters analysis. Chemistry of sample (i.e., element, oxides, etc.) has to be introduced to the software.
The repeatability of the standardless EDXRF determinations was assessed analyzing at least 6 times one loaded filter of each type (high PM loaded Pall (PallFlex) and Whatman quartz (QMA) and low loaded Teflon) and a NIST CRM 2783 within the same run. The relative standard deviations (RSD) were less than 10% for all elements and filter types, except Co (57%), Cd (151%), Sn (34%) and Sb (48%) for QMA (V and As below detection limit), Cr (22%), Sn (14%) and Sb (78%) for Pall quartz, V (111%) and Sn (26%) for Teflon and Co (70%), Sr (23%) and Sn (54%) for CRM 2783, which can be attributed to the low concentration. The reproducibility of standardless EDXRF results was determined by analysis of variance using the analytical results obtained for the same filters on 2 different days. No significant differences were found (for all elements and filters types).
Blank filters, drawn from the box of filters used for sampling, were analyzed concurrently in order to establish S&I factors of each filter types. These S&I factors were then optimized for all elements of the 8 Primary beam filters (see Table 2). The background is modeled by the software based on S&I and instrumental conditions. The field blanks and other blank filters from the same boxes were measured 26 Software UniQuant, Version 6.09, 2008. Thermo Fisher Scientific, The Netherlands

6
as samples to check how well the background and blanks fit. Very low (close to 0) net intensities were found, meaning that the modeled backgrounds based on only one S&I correspond to the blanks of the filter used for sampling. The estimation of elements by standardless EDXRF analysis is based on the mass closure of PM sample, denoting that the non-excited elements lighter than Na have to be accounted for in the mass estimation. Hence, assumptions of the extent of the unaccounted constituent of PM have to be introduced into the software. It was also assumed that all elements in PM10 existed in oxide form and that the majority of PM10 was made of elemental and organic carbon. Oxides and C, H, N mixtures were selected for Teflon filters, as Chemistry and Rest, respectively. Given that, quartz filters contained a huge amount of Si, a new Rest material, mixture of C, H, N and Si was established to analyze these samples.
The minimum X-ray penetration depth for 4 kV was estimated to be 0.77 µm. This figure exceeds the maximum PM thickness on filter of 0.22 µm calculated assuming 2 g cm-3 of density (Pitz et al27 found 1.05 to 2.36 g cm-3 for PM2.5 in Germany). Thus, the X-rays could reach and excite all particles deposited on the filters.
2.3 ICP-MS The digestion of Teflon and PallFlex samples was carried out with 4 ml HNO3, 2 ml H2O2, 1 ml HCl and 1 ml HF (Ultra pure, Romil Ltd., UK) using Milestone Microwave Labstation Ethos 900 (Italy). Field blanks and certified urban dust (NIST 1648) were digested and analyzed along the samples. The ICP-MS (Agilent Technologies Inc, Japan, 7500c) was used to quantify Mg, Al, K, Ca, Ti, V, Cr, Fe, Co, Ni, Mn, Cu, Zn, As, Sr, Pb, Mo, Cd, Sn and Sb. ICP-MS was calibrated using certified multi-element standards (BDH, USA) and analyses were started only when its correlation coefficient, r, were higher than 0.999. Sc, In and Tl were added as internal standards to all calibration standards, quality control (QC) solutions and samples in order to evidence any drifts of the mass spectrometer. The instrumental drift was checked by analyzing a QC sample every 5 samples and the drifts were corrected linearly between 2 QCs. The average sample to blank ratios (S/B) varied between 1.4 (Zn) and 66 (Fe) for Teflon, and between 1.8(Al) and 45 (V) for PallFlex. The absolute average ICPMS biases of the NIST 1648 remained lower than 10%, except for Zn (19%), Fe (14%) and K (17%).
The QMA filters were digested using Milestone Microwave Labstation Ethos 900 (Italy) following the procedure given in EN 14902. Briefly, 8 ml ultrapure HNO3, 2 ml ultrapure H2O2 and 0.1 ml HF (Ultrex, JTBeaker) were added into Teflon vessels and then, they were placed in Milestone Microwave Labstation Ethos 900 (Italy). By addition of HF, it was aimed to enhance the recovery efficiencies.
The Teflon vessels were pre-cleaned using the same digestion program followed by 3 times rinsing with de-ionized water and dry in an oven at 150 ºC, prior to usage. The sample containers (PTFE flasks) were soaked at least over night with 10% HNO3, followed by3 times rinsing with the same acid, 3 times with de-ionized water and dry in an oven at 50 oC. The sample tubes of autosampler were cleaned with the same procedure, but, dried with filtered dry air jet.
The ICP-MS was calibrated using certified mono-element standard solutions (Romil Ltd, UK, PriAg-xtra Series). Calibration curves were established analyzing freshly prepared calibration solutions, and they were accepted only if correlation coefficients (r) were >0.999. The QC solution, prepared independently from calibration solutions, was analyzed just after the establishment of calibration curves, every 10 samples and at the end of sequence. The instrument was re-calibrated, if the drift exceeded 10%. The deviation during the analysis was corrected assuming the instrumental drift was linear. Sc, Y, In and Tl were added as internal standards.
27 Pitz, M., Schmid, O., Heinrich, J., Birmili, W., Maguhn, J., Zimmermann, R. et al., 2008. Seasonal and diurnal variation of PM2.5 apparent particle density in urban air in Augsburg, Germany. Environmental Science and Technology 42, 5087-5093
7
NIST 1648 samples were digested and analyzed following the same procedures of QMA. Adding HF improved the recoveries of Cr from 50% to 86%, of Al from 60% to 103%, of K from 55% to 99%, and of Ti from 51% to 93%, as average. All the other recoveries remained between 90-110 %.
Owing to high content in the filter materials, the S/B of terrestrial elements such as Al, K, Mg, Ca, Ti and Cr (not terrestrial) were found between 1-2 whereas those of the trace elements and Fe were generally >5 except As for Graz and Prague (1.5).
2.4 Data Evaluation Four types of data treatment were carried out:
• First, as an alternative to the calibration using certified thin film samples, the linear calibration with standards consisting of loaded filters analyzed by ICP-MS versus XRF intensities were plotted. The evaluation was carried out using the analytical results of a set of loaded filters that was also analyzed by ICP-MS and CRM 2783. For QMA filters, the possible influence of the choice of sampling site on the EDXRF calibration functions was assessed by comparing the agreement between 2 functions of calibrations using filters of at one urban and one industrial sites.
• Second, it was checked if standardless EDXRF analysis could reach the limits of detection and quantification that are requested in EN 14902.
• Third, the agreement between ICP-MS and standardless EDXRF analysis was evaluated.
• Finally, the standardless EDXRF measurement uncertainties and its main contributors were estimated using the GUM method. The GUM uncertainty (hereafter called UGUM) can be estimated for any sample. However, the reliability of this estimation strongly depends on the ability of Equation 1 to accurately describe the EDXRF measurement principle and on the accuracy of the estimation of each contributing parameter given in Equation 1. In order to demonstrate the UGUM validity, the measurements uncertainties were also estimated using based on the Guide for the Demonstration of Equivalence of Measuring Methods, actually the differences between ICP-MS and EDXRF analysis of filters loaded at co-located field sites. Differences between the two methods of uncertainty estimations were evidenced and the likely causes were discussed.
2.4.1 Linear Calibration Using Standards Analyzed by ICP-MS
EDXRF was calibrated by establishing a linear regression between elemental masses of loaded filters obtained by ICP-MS analysis (m, in ng) and XRF intensities (in counts per second divided to tube current, cps/mA of the X-ray tube) given in Equation 2. The expanded uncertainty of the EDXRF values, U (mEDXRF), is estimated using Equation 3 (Miller and Miller, 198628) at the central point of each mass ranges.
MSICPEDXRF mbbI −+= 10 Equation 2
( ) ( )( ) ( )( )
½
221
2
1
210 112 ⎥
⎥⎦
⎤
⎢⎢⎣
⎡
−−
++⎥⎥⎦
⎤
⎢⎢⎣
⎡
−
+−=
∑∑
−−
−
MSICPMSi,ICP
½
MSi,ICPiEDXRF mmb
II/n/bn
mbbIkmU Equation 3
where I is the XRF intensities (cps/mA) of the measured sample (middle point of the range), Ii is the intensities of standard i, I is the average intensities of all standards. m is the elemental masses determined by ICP-MS or EDXRF, MSICPm − is the average elemental masses of all standards, n is the number of standards used for calibration. The coverage factor, k, was set to 2. The relative expanded 28 Miller, J.C., Miller, J.N., 1986. Statistics for Analytical Chemistry, John Wiley and Sons, New York
8
uncertainty of EDXRF measurements, Ur. (mEDXRF), corresponds to the ratio of U(mEDXRF) out of mEDXRF of the measured sample.
Linear calibration lines were established using Teflon filters loaded in two urban sites (Milan and Lodi, n=11, hereafter called Teflon-Urban). Other filters loaded at an urban background site (Milan PO) were analyzed by ICP-MS and EDXRF both by linear calibration and standardless analysis. The differences between linear calibration and ICP-MS from one side and standardless EDXRF analysis and ICP-MS from another side were calculated. A CRM 2783 was also analyzed by linear calibration and standardless analysis. The differences between the analyses and certified values of CRM 2783 were computed.
Two linear calibrations were carried out for QMA filters, one using the filters of a rural-industrial site (Port Talbot-UK, n=8, hereafter called QMA-Industrial) and one with the filters of 2 urban sites (Graz, n=5 plus Prague, n=5, hereafter called QMA-Urban). One QMA filter loaded at an urban site, whose analysis by several laboratories (Gerboles et al, 201129) could be used as reference values, was analyzed using these two linear calibrations and standardless analysis. The differences between EDXRF determinations and reference values were calculated and compared. The linear calibration curves of PallFlex were established, however, due to lack of sample from another site or reference, the comparison with the standardless EDXRF analysis was not performed
2.4.2 Method Detection Limits (MDLs) and Limits of Quantification (LOQs)
The theoretical method detection limits (MDLs) and limits of quantification (LOQs) of EDXRF were calculated as 3 and 10 times of standard deviation of the underlying background (SD), respectively (Johansson et al, 1995). The masses equivalent to 3 and 10 times SD of each background were calculated using Equation 1 for MDLs and LOQs, respectively.
2.4.3 Comparison of ICP-MS and Standardless EDXRF Analysis
The results of ICP-MS and standardless EDXRF analysis were evaluated by relative deviation (RD) and relative absolute deviation (RAD) calculated by Equation 4 and Equation 5, respectively.
( ) 100% ⎟⎟⎠
⎞⎜⎜⎝
⎛ −=
−
−
MSICP
MSICPEDXRF
mmm
RD Equation 4
( ) 100% ⎟⎟⎠
⎞⎜⎜⎝
⎛ −=
−
−
MSICP
MSICPEDXRF
mmm
RAD Equation 5
where, m refers to the mass of elements (ng) determined by standardless EDXRF analysis or ICP-MS. The RD values were plotted against masses of ICP-MS in order to see the agreement between the two methods, and also to assess the relationship between elemental masses and deviations. All filters of the measuring campaigns (see Table 1) were divided in three groups according to their filter type. The RADs of each filter were calculated. Finally, the means of RAD (RADm) for each group and standard deviations s(RAD) of all RADs were computed to evaluate the extent of deviations between two methods over the whole range of elemental masses.
2.4.4 Measurement Uncertainty
Equation 1 contains variables whose estimation is unknown to the authors, e. g. µi and interference correction. The interferences are predefined by the software for each element and lines, and the list of
29 Gerboles, M., Buzica, D., Brown, R.J.C. , Yardley, R.E., Hanus-Illnar, A., Salfinger, M. et al., 2011. Interlaboratory comparison exercise for the determination of As, Cd, Ni and Pb in PM10 in Europe, Atmospheric Environment 45, 3488-3499
9
interfering elements with their concentrations (mass/mass) is given as output. The relative expanded uncertainties (Ur,GUM) for elements analyzed by EDXRF were estimated using Equation 6, obtained by the application of the GUM method. Equation 6 was set up assuming that the only significant correlations appear between Ad and mPM (r=-1) and A and mPM (r=1). In Equation 6, the nomenclature is the same as in Equation 1 whilst ∑int and Inet denote the sum of interfering elements and net intensity (Ii–Ii0), respectively. It is possible that other parameters of Equation 1 are correlated. However, these correlations cannot be quantified, due to unknown equations for calculations by the authors (for example between A, K and µ).
( )
⎥⎦
⎤⎢⎣
⎡+−
+⎟⎟⎠
⎞⎜⎜⎝
⎛+⎟⎟
⎠
⎞⎜⎜⎝
⎛+⎟
⎟⎠
⎞⎜⎜⎝
⎛
⎥⎥⎦
⎤
⎢⎢⎣
⎡+
⎟⎠⎞
⎜⎝⎛
⎥⎦
⎤⎢⎣
⎡++⎟⎟
⎠
⎞⎜⎜⎝
⎛⎥⎦
⎤⎢⎣
⎡+⎟⎟
⎠
⎞⎜⎜⎝
⎛⎥⎦
⎤⎢⎣
⎡+⎟⎟
⎠
⎞⎜⎜⎝
⎛⎥⎦
⎤⎢⎣
⎡
==∑∑∑
),()()(
),()()(22
)()(int
)int(int
)(1)()(
)(2222
%
22
%
22
%
22
%
22
%
,
PMdPM
PM
d
dPM
PM
PM
PM
PM
d
d
i
ii
neti
i
i
ii
neti
i
i
ii
neti
net
net
ii
neti
i
iGUMr
mArmmu
AAu
mArmmu
AAu
mmu
AAuu
c
AAu
AKcI
KKu
AKcIu
AKcI
IIu
AKcI
kc
cukU
μμμμμμ
Equation 6
The repeatability of Ii, Ii0 and instrumental drift were only taken into account, due to lack of the equation used to estimate Ii0. Ii0 is computed by the software on the basis of filter surface (S&I) and excitation energy and efficiency of measurement channel. Furthermore, Rest was thought to be able to affect the continuum of background spectra. Thus, apart from drift and repeatability, the manual optimization of S&I and selection Rest type were counted as uncertainty sources of Ii0. The standard uncertainty of Ii0 was evaluated by using different types of Rest (n=3), PM chemistry (Oxides and elemental state) and differently optimized S&I (n=3). S&I is a continuum where the cps/mass (and florescence energy are inversely proportional. The S&I is constructed using the measuring intensities in element specific channels. Manual optimization of S&I denotes making the continuum consistent with the neighboring channels, by removing spikes. The equation of µi is also unknown to the authors. Thus, the standard uncertainty of µi was evaluated as the quadratic sum of contributions from repeatability, different S&I, matrix chemistry and Rest. The effect of different S&I on µi was very limited, and only compatible Rest and Chemistry with PM constituents were selected. Ki was determined analyzing of thin film standards, and optimized manually. Ki is also a continuum as a function of cps/mass and florescence energy. Thus, the standard uncertainty of Ki was computed by quadratic summation of standard uncertainties of elemental density of thin film samples, manual optimization of continuum and excited area. The uncertainty of Wi was not considered, since this parameter was assumed to be a known and constant. The uncertainties of excited and deposited areas, A and Ad, were calculated assuming 1 mm of standard uncertainty on the diameter. The diameter of the X-ray excitation beam was found to be 16 mm on an X-ray excited plate of barium sulfate. The deposition areas of each filter type were measured using a caliper. The uncertainty of mPM was estimated as the quadratic summation of the balance’s standard uncertainty and repeatability. The repeatability of the sum of interferences in 3 replicates of measurements was used to estimate the standard uncertainty of this interference correction. The coverage factors, k, were estimated using the effective degree of freedom calculated by Welch-Starrethwaite formula presented in Annex G of the GUM, at the 95% confidence level.
The relative expanded uncertainty can also be estimated using the method described in the Guide that depends on the differences between co-located pairs of loaded filters analyzed by EDXRF and ICP-MS (Ur,DIR). This method assumes a linear relationship between the measurement results of candidate (mEDXRF) and reference (mICP-MS) methods as shown in Equation 7. The relative expanded uncertainty of EDXRF measurements UDIR (mEDXRF) is calculated using Equation 8, where RSS is the square sum of residuals resulting from the orthogonal regression, u(mICP-MS) is the random uncertainty of the ICP-MS method calculated using standard deviations of 10 repeated measurements. The last term gives the bias of the candidate method for the elemental mass determined by ICP-MS. Division by mEDXRF was preferred; because, when a sample will be analyzed using EDXRF, the reference/true value measured by ICP-MS will be unknown. The algorithm to estimate the values for b0 and b1 together with their
10
uncertainty is given in the Guide. It aimed at minimizing of the error function consisting of the sum of residuals between the linear line and the EDXRF masses plus the residuals between the linear line and the ICP-MS masses. In this study, since all the residuals were constant, the RSS could be calculated using the simple Equation 9. EDXRF and ICP-MS masses lower than MDLs were discarded from calculations.
MSICPEDXRF mbbm −+= 10 Equation 7
( ) [ ]2
210
2
,
)1()2/()()(
EDXRF
MSICPMSICPEDXRF
EDXRF
DIREDXRFDIRr m
mbbmunRSSkm
mu
kmU −− −++−−==
Equation 8
∑ −−−=n
iMSICPiEDXRF mbbmRSS 2
10 )( Equation 9
The relative contributions of RSS (r-RSS) and bias(r-Bias) defined in Equation 8 were computed to evaluate their contributions to Ur,DIR. To do that, the contribution from u (mICP-MS) was ignored and the r-RSS was calculated as the division of first term of Equation 8, namely (RSS/n-2)/(mEDXRF)2, to the square of Ur,DIR. Similarly, r-Bias was calculated using the last term of Equation 8 and the square of Ur,DIR.
Finally, Ur,DIR and Ur,GUM were compared. In fact, Ur,DIR lower or similar than Ur,GUM would indicate that Equation 6 can be applied to any standardless EDXRF measurement to correctly estimate Ur,GUM without the need for further field experiments. Conversely, if Ur,DIR would be higher than Ur,GUM, one would assume that Equation 6 does not cover all the sources of uncertainties, e. g. the interference correction through the Sherman equation. More field comparisons of ICP-MS and EDXRF analysis would be needed to estimate Ur,DIR at any type of sampling site that is not investigated in this study.
It was also checked if the measurement uncertainties of EDXRF, Ur,GUM and Ur,DIR, could reach the data quality objectives (DQO) at the limit values of Cd (40% at 5 ng m-3), As (40% at 6 ng m-3), Ni (40% at 20 ng m-3) and Pb (25% at 500 ng m-3) of the European Directives. However, no concentrations of this study were close enough to the limit values. Therefore, we decided to estimate Ur,DIR at limit values by extrapolation. Unfortunately, Cd and As could not be measured by standardless EDXRF analysis in this study, probably due to low concentrations found of our samples. The measurement uncertainties of Zn, Cu and Cr were also checked with respect to the EMEP DQO (25%).
3 Results and Discussion
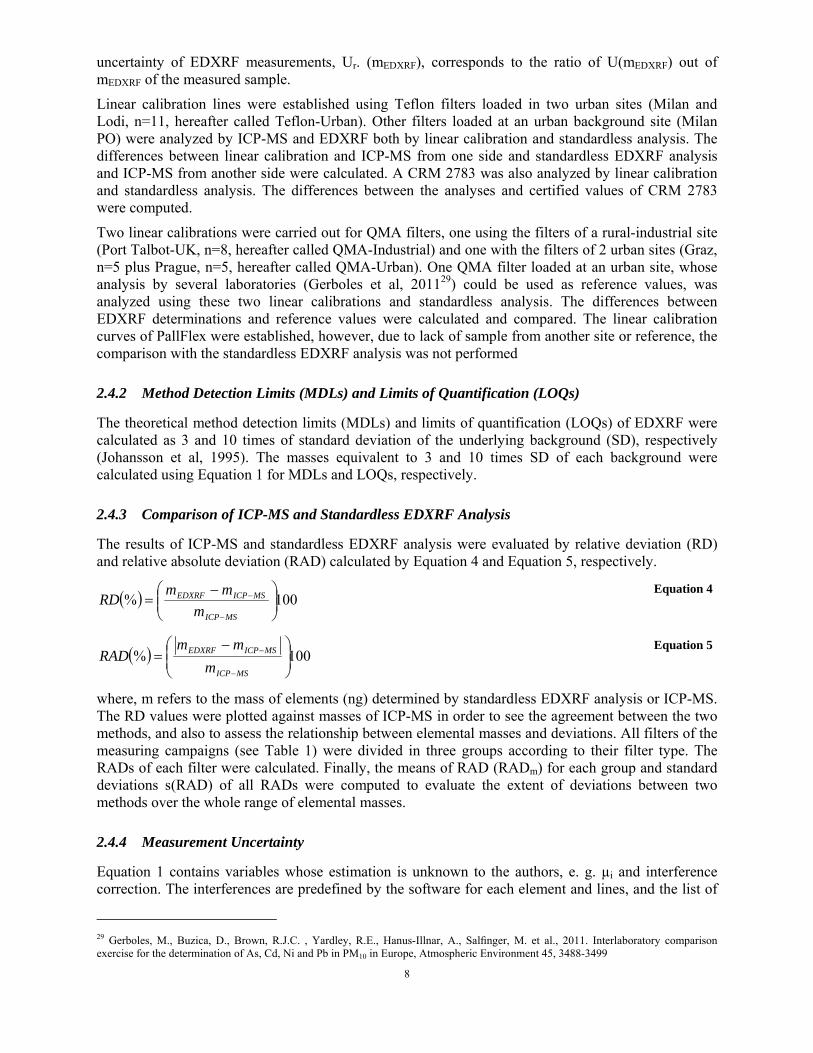
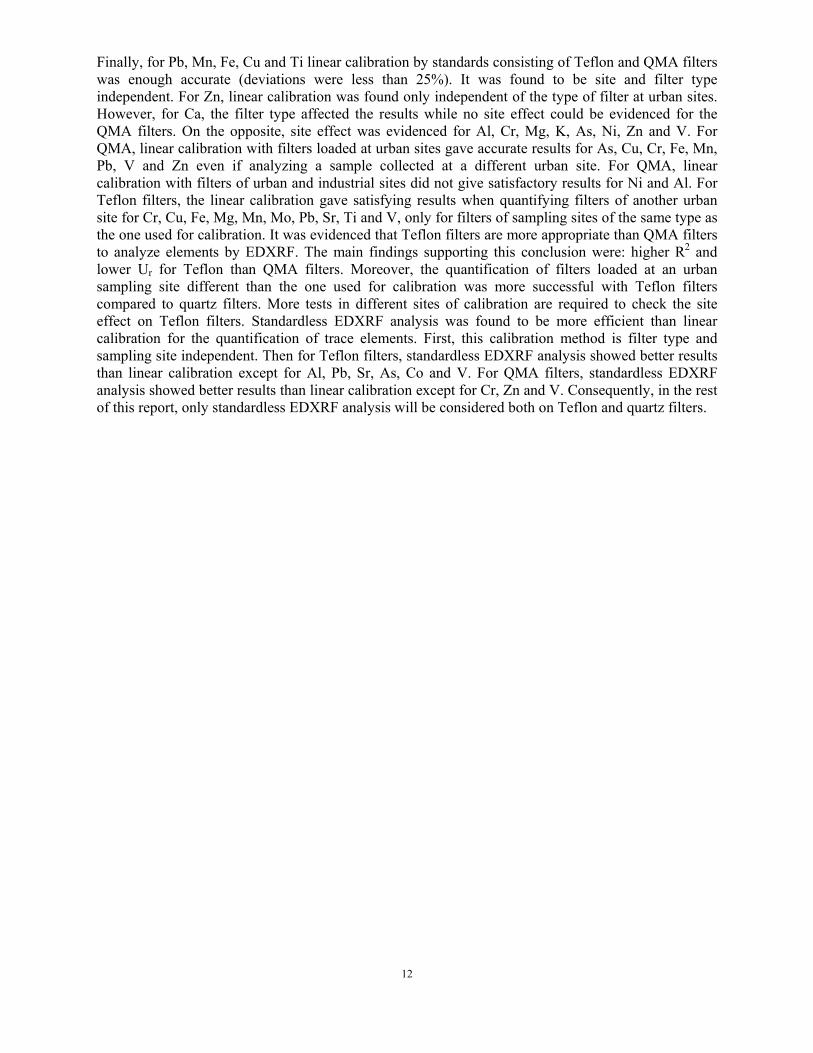
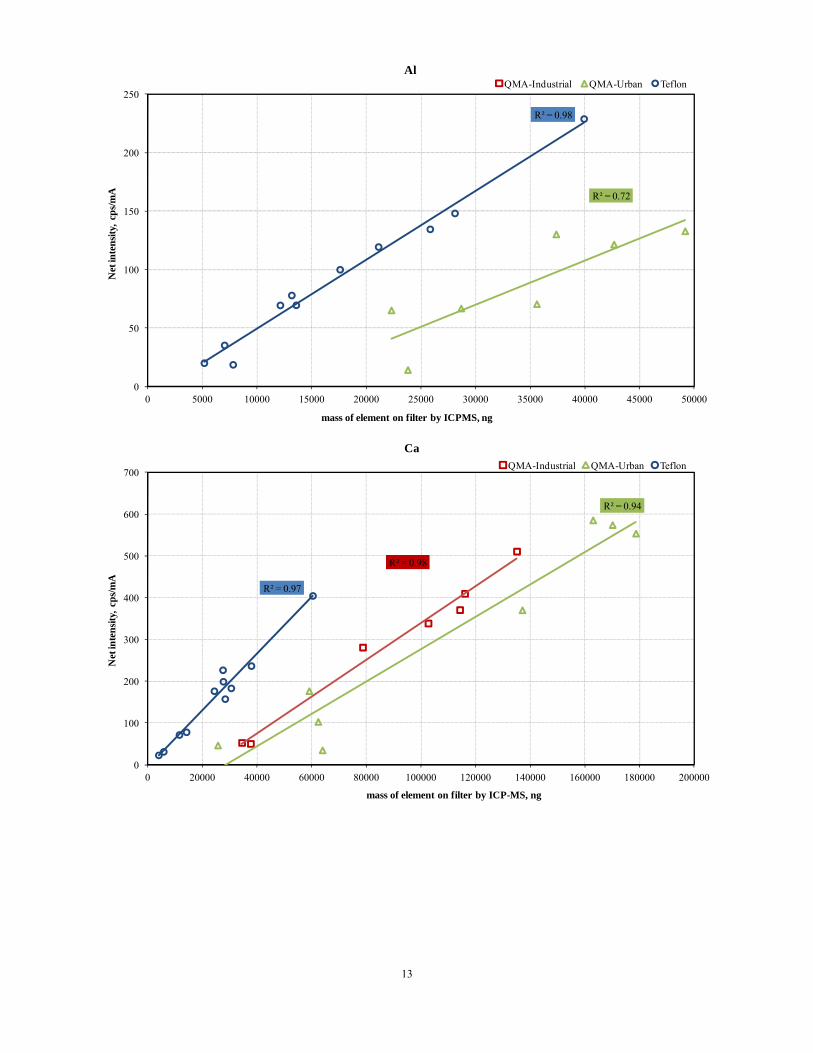
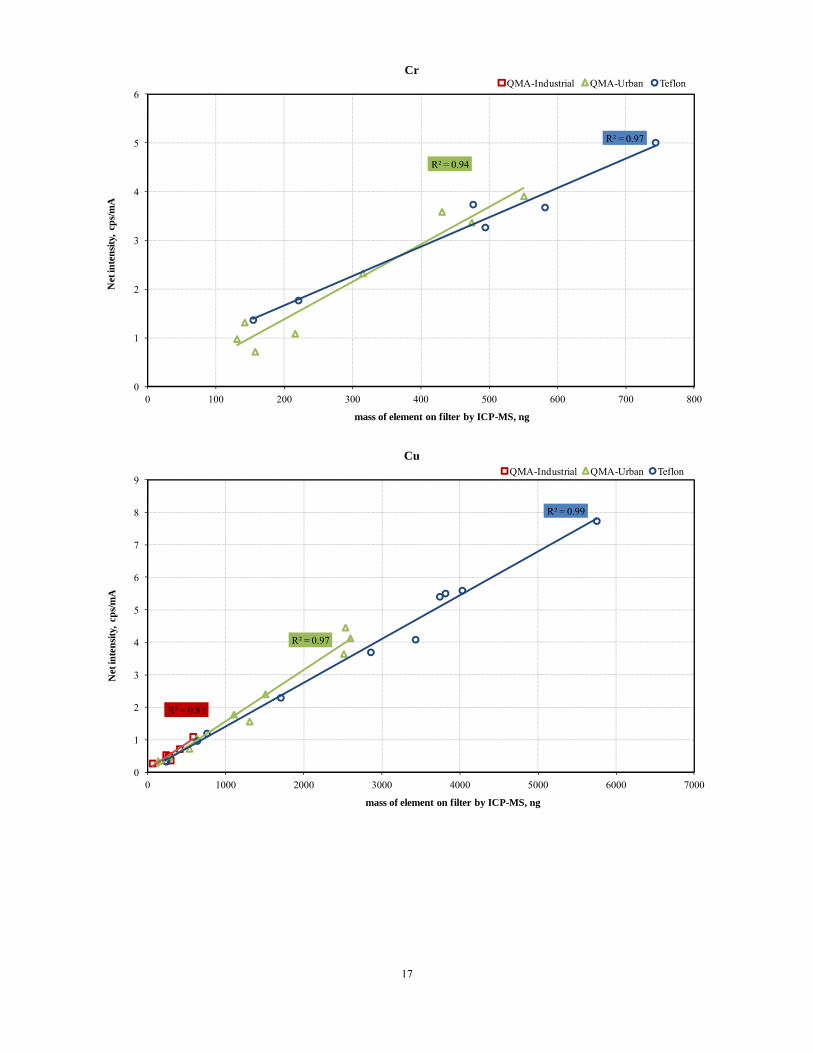
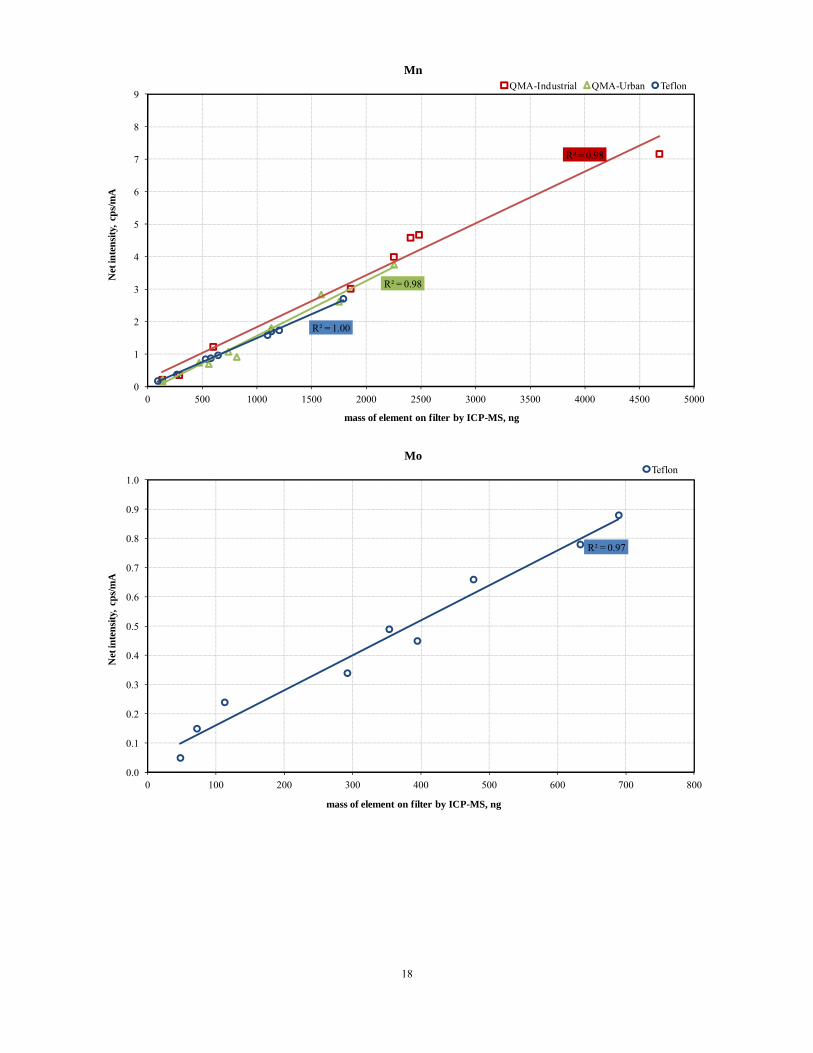
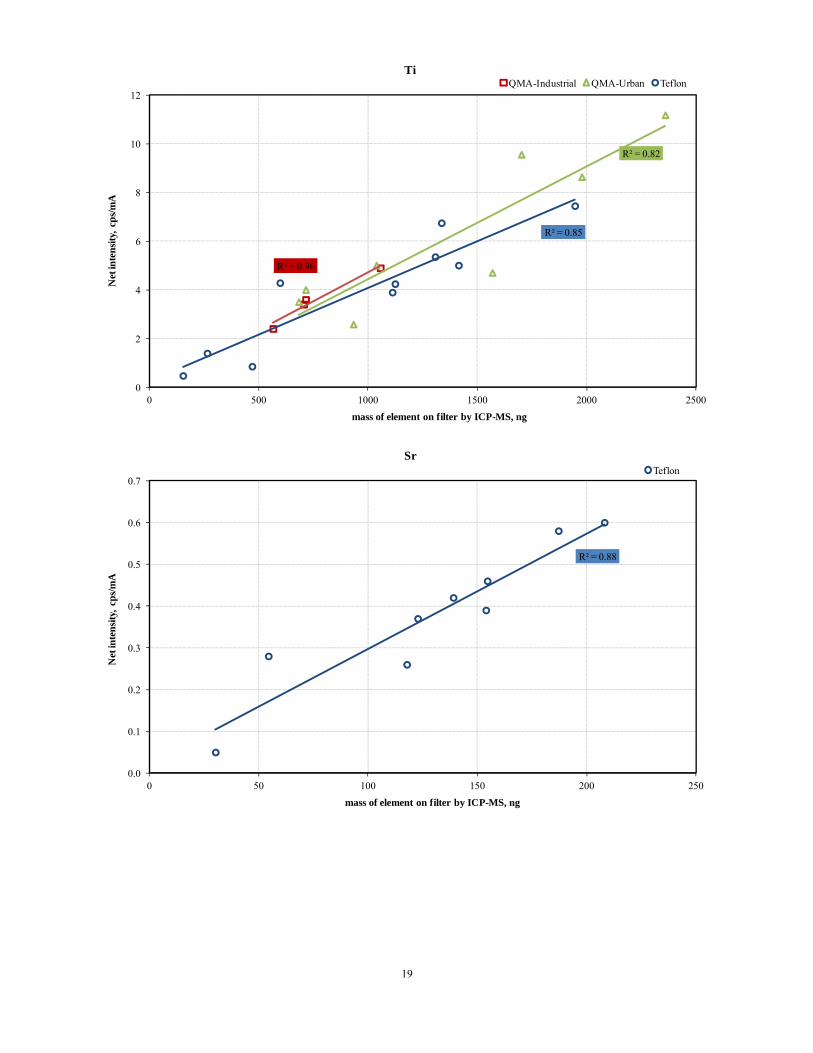
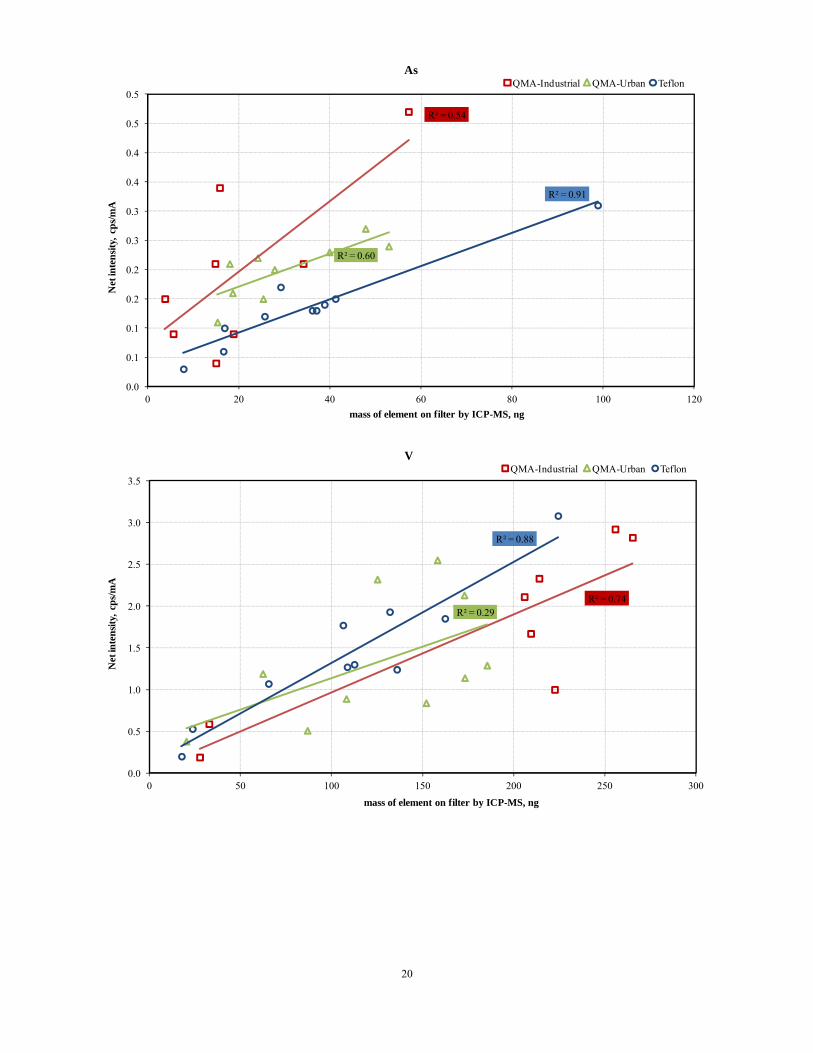
3.1 Evaluation of Linear Calibration and Standardless EDXRF Analysis The calibration lines established using the net XRF intensities and elemental masses determined by ICP-MS are plotted in Figure 1 for Teflon filters at urban site and for QMA filters at urban and industrial sites. No ICP-MS results of Si, Cl, S, Br (for all the filters), Mo and Sr (only for QMA) were available, and therefore, these elements could not be evaluated. Cd, Sn and Sb could not be analyzed, neither by the standardless EDXRF analysis nor the linear calibration in the studied samples. The coefficients of determination, R2, are also given in the figure. In most of the case, R2 values were higher for Teflon filters than for quartz filters.
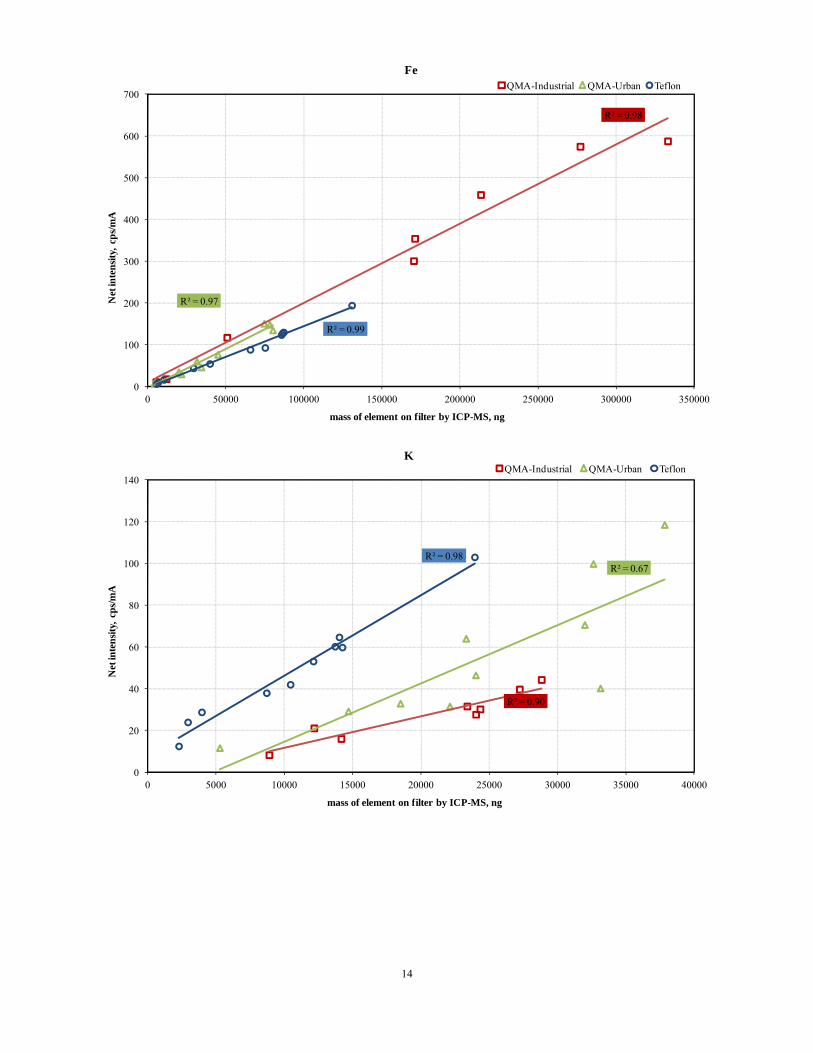
Four patterns were observed for the calibration lines of Teflon and QMA filters. First, for Fe, Pb, Cu, Mn and Ti, the slopes were similar (the differences between slopes are less than 40%) for whatever type of filter or sampling site. Second, for Ca, the slopes of QMA filters at the urban and industrial sites were similar, but, they were different than the ones of the Teflon filters (filter effect). Third, for Zn, the slopes of QMA filters and Teflon filters at urban sites were similar, but, they were different
11
from the ones at the Industrial site (QMA). This could be attributed to the lower concentration at the industrial site for Zn. Fourth, the slopes and intercepts of QMA at the urban and Industrial sites were different for K, As, V and Zn (site effect). Furthermore, no significant correlation could be evidenced between EDXRF and ICP-MS results for Mg and Ni at the urban sites and for Al and Cr at the industrial site. These constitute a clear sign for the dependence of the calibration on the sampling site likely caused by matrix effect that may prevent the linear calibration approach if samples of different origins have to be analyzed by EDXRF.
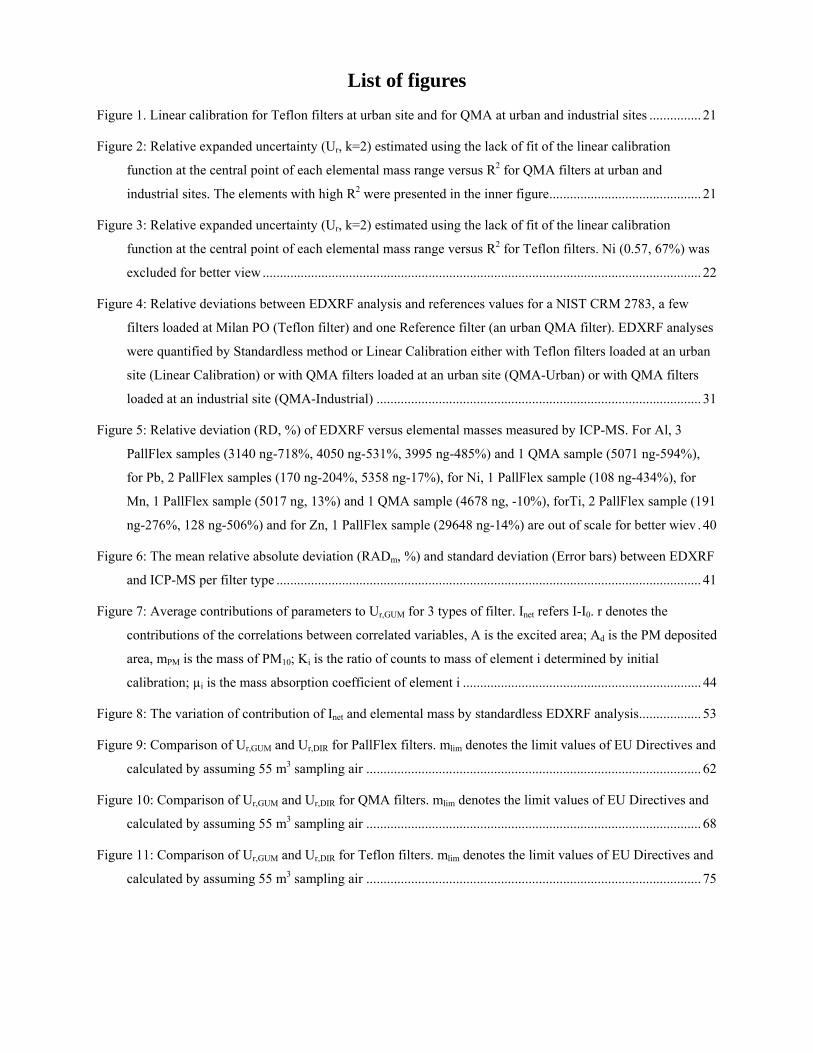
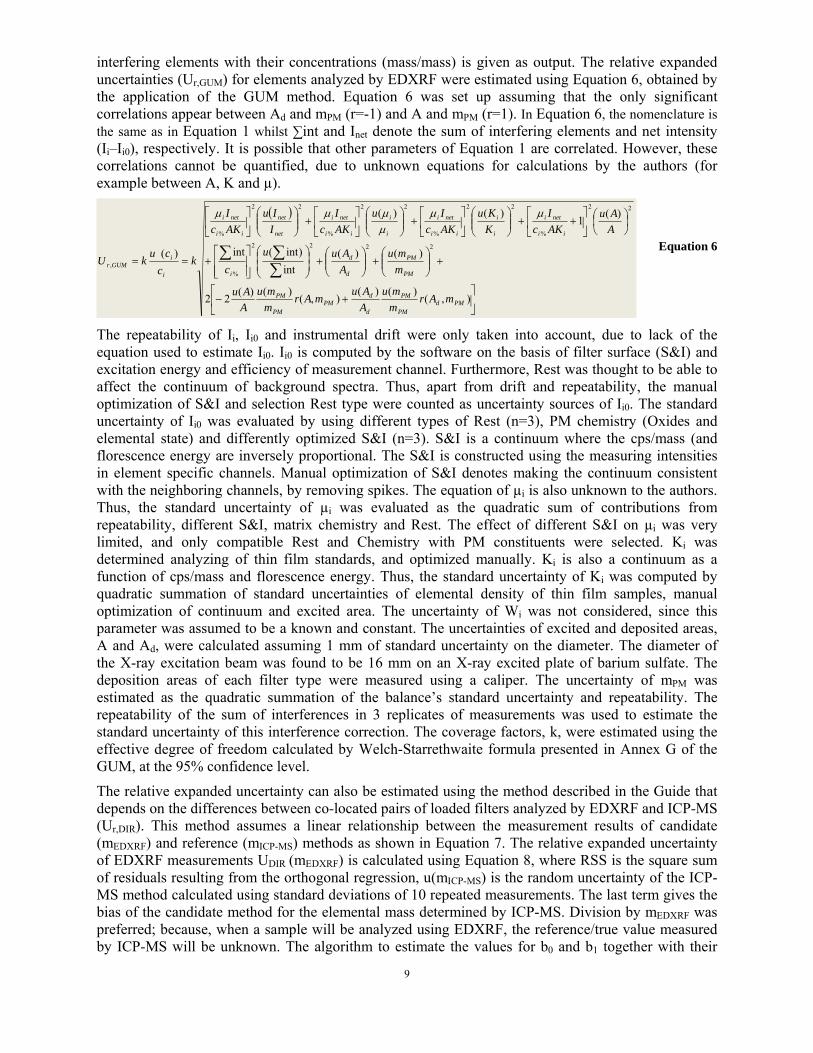
The relative expanded uncertainty, Ur (mEDXRF), estimated in the middle of the mass ranges are plotted against R2 in Figure 2 for QMA filters (loaded at 2 urban sites and at an industrial site) and in Figure 3 for Teflon filters. High R2 and low Ur (mEDXRF) were found for each type of filters for Pb, Fe, Mn and Cu (except for QMA at the industrial site). The Teflon filters results showed higher R2 and lower Ur values than the QMA ones for all elements except Ni-Industrial and Ti at the urban and industrial sites. These might be attributed the lower concentration levels on Teflon filters than on QMA ones. The mass of Ni on the Teflon filters ranged between 150-550 ng, whilst the Ni-masses on QMA at the industrial site were between 400 and 3300 ng. Ti-masses on the Teflon filters were 150-1400 ng, whilst Ti-masses on QMA at the urban and industrial sites were 600-2400 and 570-1820 ng, respectively.
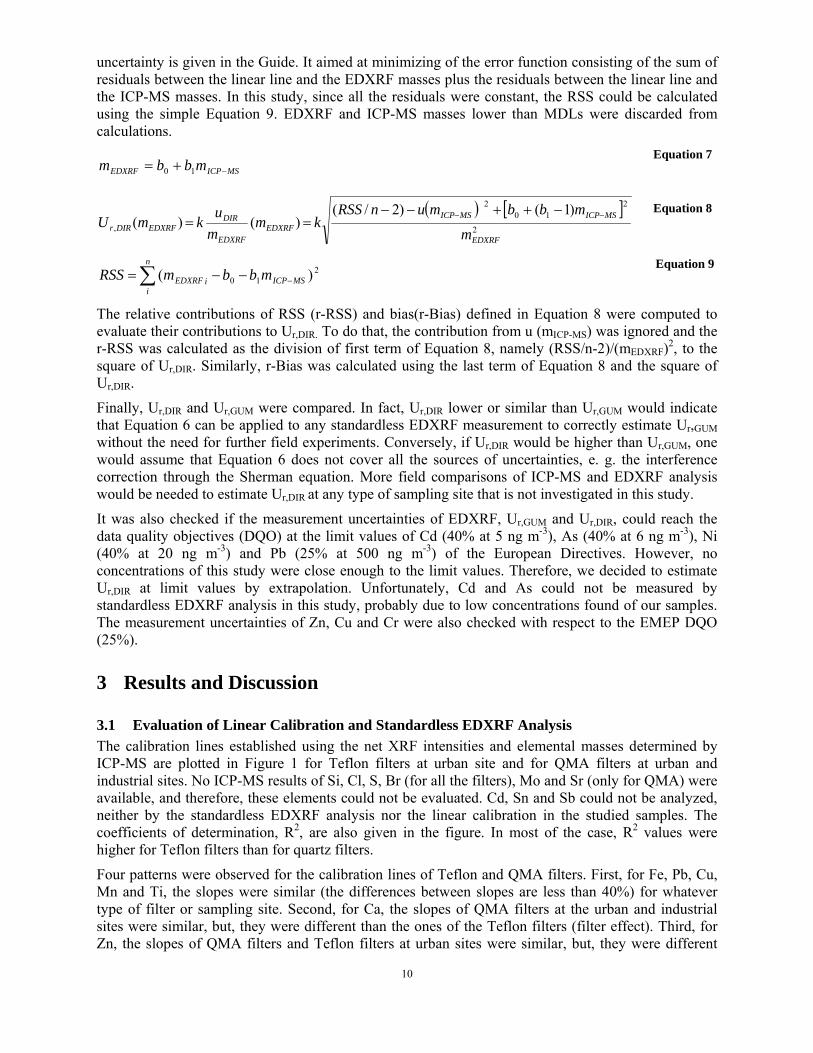
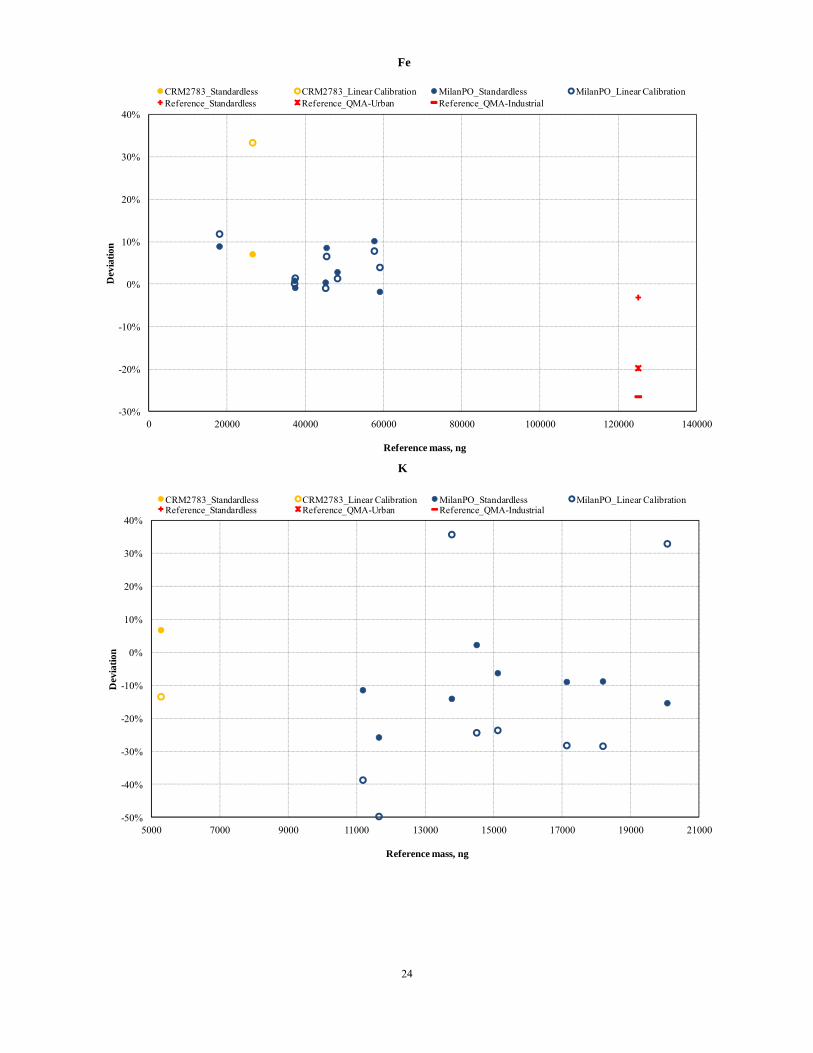
Differences between ICP-MS or reference values and EDXRF (quantified both by linear calibration and standardless EDXRF) were evaluated on the Teflon filters loaded at the Milan PO sampling site and on the NIST CRM 2783. The differences are plotted in Figure 4. The analysis of Milan PO Teflon filters by linear calibration resulted in mean absolute deviations lower than 30% for all elements except As (33±21%, mean±SD), Ca (38±25%), Co (34±18%), K (33±9%), Ni (43±17%) and Zn (37±8%). The mean absolute deviations of standardless EDXRF analysis on the same Milan PO filters were lower than 15% for Cr, Cu, Fe, K, Mg, Mn, Mo and Ti whereas they remained between 15-25% for the other elements except Ni (38%) (As, Co and V could not be quantified by the standardless EDXRF analysis). The mean absolute deviations of standardless EDXRF analysis for the Milan PO filters were lower than the ones using linear calibration except for Al, Pb and Sr. For the NIST CRM 2783, the deviations to certified values of standardless EDXRF analysis remained much lower than the ones the linear calibration of Teflon filters.
On Teflon filters, the R2 and Ur (mEDXRF) for As (see Figure 3) were found to be 0.91 and 49%, respectively, at the middle point of mass range (8-100 ng). The mean deviation of linear calibration of Milan PO was -33±21% (mass range: 40-75 ng), a reasonable result for As. However, the deviation of NIST CRM 2783 was found to be -175%, which might be attributed to low As-mass (11 ng) or to a matrix effects between the Teflon loaded filters used for calibration and the polycarbonate filter of NIST CRM 2783.
R2 and Ur (mEDXRF) for V on Teflon filters (see Figure 3) were found to be 0.88 and 43%, respectively, at the middle point of the mass range (20-224 ng). The mean deviation of linear calibration of Milan PO (mass range 40-110 ng) was 17±12% (see Figure 4). However, for the NIST CRM 2783, the deviation was up to 57%, even though the V mass (48 ng) was in the range of calibration.
For the reference QMA urban filter (QMA-Ref) tested in an intercomparison exercise (Gerboles et al., 2011)29, the deviations between standardless EDXRF analysis and the reference values for Fe, Mn, Ni and Pb were lower than the ones between QMA-Ref and EDXRF analysis with linear calibration. Standardless EDXRF analysis showed higher deviation than linear calibrations for Cr and Zn when standard filters were loaded at QMA-Urban and at QMA-Industrial, respectively. Using linear calibration with the QMA-Industrial filters, the absolute deviations for Mn, V, Pb, Zn and Cu on QMA-Ref were equal to or lower than 20%, while using linear calibration with the QMA-Urban filters, the absolute deviations for Mn, Fe, Pb, Cu, Zn, V and As were found to be equal to or lower than 20%. For Ni determination on QMA-Ref using linear calibration with the filters of QMA-Industrial, the deviation from reference value was found to be high (516%) (see Figure 4), showing the dependence of the calibration line on the type of sampling site (industrial vs urban) .
12
Finally, for Pb, Mn, Fe, Cu and Ti linear calibration by standards consisting of Teflon and QMA filters was enough accurate (deviations were less than 25%). It was found to be site and filter type independent. For Zn, linear calibration was found only independent of the type of filter at urban sites. However, for Ca, the filter type affected the results while no site effect could be evidenced for the QMA filters. On the opposite, site effect was evidenced for Al, Cr, Mg, K, As, Ni, Zn and V. For QMA, linear calibration with filters loaded at urban sites gave accurate results for As, Cu, Cr, Fe, Mn, Pb, V and Zn even if analyzing a sample collected at a different urban site. For QMA, linear calibration with filters of urban and industrial sites did not give satisfactory results for Ni and Al. For Teflon filters, the linear calibration gave satisfying results when quantifying filters of another urban site for Cr, Cu, Fe, Mg, Mn, Mo, Pb, Sr, Ti and V, only for filters of sampling sites of the same type as the one used for calibration. It was evidenced that Teflon filters are more appropriate than QMA filters to analyze elements by EDXRF. The main findings supporting this conclusion were: higher R2 and lower Ur for Teflon than QMA filters. Moreover, the quantification of filters loaded at an urban sampling site different than the one used for calibration was more successful with Teflon filters compared to quartz filters. More tests in different sites of calibration are required to check the site effect on Teflon filters. Standardless EDXRF analysis was found to be more efficient than linear calibration for the quantification of trace elements. First, this calibration method is filter type and sampling site independent. Then for Teflon filters, standardless EDXRF analysis showed better results than linear calibration except for Al, Pb, Sr, As, Co and V. For QMA filters, standardless EDXRF analysis showed better results than linear calibration except for Cr, Zn and V. Consequently, in the rest of this report, only standardless EDXRF analysis will be considered both on Teflon and quartz filters.
13
R² = 0.72
R² = 0.98
0
50
100
150
200
250
0 5000 10000 15000 20000 25000 30000 35000 40000 45000 50000
Net
inte
nsity
, cps
/mA
mass of element on filter by ICPMS, ng
AlQMA-Industrial QMA-Urban Teflon
R² = 0.98
R² = 0.94
R² = 0.97
0
100
200
300
400
500
600
700
0 20000 40000 60000 80000 100000 120000 140000 160000 180000 200000
Net
inte
nsity
, cps
/mA
mass of element on filter by ICP-MS, ng
CaQMA-Industrial QMA-Urban Teflon
14
R² = 0.98
R² = 0.97
R² = 0.99
0
100
200
300
400
500
600
700
0 50000 100000 150000 200000 250000 300000 350000
Net
inte
nsity
, cps
/mA
mass of element on filter by ICP-MS, ng
FeQMA-Industrial QMA-Urban Teflon
R² = 0.90
R² = 0.67R² = 0.98
0
20
40
60
80
100
120
140
0 5000 10000 15000 20000 25000 30000 35000 40000
Net
inte
nsity
, cps
/mA
mass of element on filter by ICP-MS, ng
KQMA-Industrial QMA-Urban Teflon
15
R² = 0.92
R² = 0.96
0
10
20
30
40
50
60
0 5000 10000 15000 20000 25000 30000 35000 40000 45000 50000
Net
inte
nsity
, cps
/mA
mass of element on filter by ICP-MS, ng
MgQMA-Industrial QMA-Urban Teflon
R² = 0.89
R² = 0.83R² = 0.93
0
2
4
6
8
10
12
0 1000 2000 3000 4000 5000 6000 7000
Net
inte
nsity
, cps
/mA
mass of element on filter by ICP-MS, ng
ZnQMA-Industrial QMA-Urban Teflon

16
R² = 0.96
R² = 0.96
R² = 1.00
0.0
0.5
1.0
1.5
2.0
2.5
3.0
3.5
4.0
0 500 1000 1500 2000 2500 3000 3500 4000
Net
inte
nsity
, cps
/mA
mass of element on filter by ICP-MS, ng
PbQMA-Industrial QMA-Urban Teflon
R² = 0.99
R² = 0.69
0
2
4
6
8
10
12
14
16
0 500 1000 1500 2000 2500 3000 3500
Net
inte
nsity
, cps
/mA
mass of element on filter by ICP-MS, ng
NiQMA-Industrial QMA-Urban Teflon
17
R² = 0.94
R² = 0.97
0
1
2
3
4
5
6
0 100 200 300 400 500 600 700 800
Net
inte
nsity
, cps
/mA
mass of element on filter by ICP-MS, ng
CrQMA-Industrial QMA-Urban Teflon
R² = 0.87
R² = 0.97
R² = 0.99
0
1
2
3
4
5
6
7
8
9
0 1000 2000 3000 4000 5000 6000 7000
Net
inte
nsity
, cps
/mA
mass of element on filter by ICP-MS, ng
CuQMA-Industrial QMA-Urban Teflon
18
R² = 0.98
R² = 0.98
R² = 1.00
0
1
2
3
4
5
6
7
8
9
0 500 1000 1500 2000 2500 3000 3500 4000 4500 5000
Net
inte
nsity
, cps
/mA
mass of element on filter by ICP-MS, ng
MnQMA-Industrial QMA-Urban Teflon
R² = 0.97
0.0
0.1
0.2
0.3
0.4
0.5
0.6
0.7
0.8
0.9
1.0
0 100 200 300 400 500 600 700 800
Net
inte
nsity
, cps
/mA
mass of element on filter by ICP-MS, ng
MoTeflon
19
R² = 0.96
R² = 0.82
R² = 0.85
0
2
4
6
8
10
12
0 500 1000 1500 2000 2500
Net
inte
nsity
, cps
/mA
mass of element on filter by ICP-MS, ng
TiQMA-Industrial QMA-Urban Teflon
R² = 0.88
0.0
0.1
0.2
0.3
0.4
0.5
0.6
0.7
0 50 100 150 200 250
Net
inte
nsity
, cps
/mA
mass of element on filter by ICP-MS, ng
SrTeflon
20
R² = 0.54
R² = 0.60
R² = 0.91
0.0
0.1
0.1
0.2
0.2
0.3
0.3
0.4
0.4
0.5
0.5
0 20 40 60 80 100 120
Net
inte
nsity
, cps
/mA
mass of element on filter by ICP-MS, ng
AsQMA-Industrial QMA-Urban Teflon
R² = 0.74R² = 0.29
R² = 0.88
0.0
0.5
1.0
1.5
2.0
2.5
3.0
3.5
0 50 100 150 200 250 300
Net
inte
nsity
, cps
/mA
mass of element on filter by ICP-MS, ng
VQMA-Industrial QMA-Urban Teflon
21
R² = 0.88
0
1
2
3
4
5
6
7
8
9
10
0 5 10 15 20 25 30 35 40 45
Net
inte
nsity
, cps
/mA
mass of element on filter by ICP-MS, ng
CoTeflon
Figure 1. Linear calibration for Teflon filters at urban site and for QMA at urban and industrial sites
Al As
Ca
Cr
K
TiZn
As
Cu
K
Mg
V
Zn
0.510.540.570.600.630.660.690.720.750.780.810.840.870.900.930.9620%
40%
60%
80%
100%
120%
140%
160%
Rel
ativ
e Ex
pand
ed U
ncer
tain
ty, U
r(k=2
)
QMA-Urban QMA-Industrial
CuFe
Mn
PbCa
Fe Mn
Ni
Pb
Ti
0.950.9600.9650.9700.9750.9800.9850.9905%
10%
15%
20%
25%
30%
Figure 2: Relative expanded uncertainty (Ur, k=2) estimated using the lack of fit of the linear calibration function at the central point of each elemental mass range versus R2 for QMA filters at urban and industrial sites. The elements with high R2 were presented in the inner figure
22
Al
As
Ca
Co
Cr
CuFe
K Mg
Mn
Mo
Pb
Sr
Ti
V
Zn
0.850.860.870.880.890.900.910.920.930.940.950.960.970.980.991.00
R²
0%
10%
20%
30%
40%
50%R
elat
ive
Expa
nded
Unc
erta
inty
, Ur(k
=2)
Teflon
Figure 3: Relative expanded uncertainty (Ur, k=2) estimated using the lack of fit of the linear calibration function at the central point of each elemental mass range versus R2 for Teflon filters. Ni (0.57, 67%) was excluded for better view
23
-50%
0%
50%
100%
150%
200%
5000 10000 15000 20000 25000
Dev
iatio
n
Reference mass, ng
Al
CRM2783_Standardless CRM2783_Linear Calibration MilanPO_Standardless MilanPO_Linear CalibrationReference_Standardless Reference_QMA-Urban Reference_QMA-Industrial
-80%
-60%
-40%
-20%
0%
20%
40%
60%
80%
100%
5000 10000 15000 20000 25000 30000
Dev
iatio
n
Reference mass, ng
Ca
CRM2783_Standardless CRM2783_Linear Calibration MilanPO_Standardless MilanPO_Linear CalibrationReference_Standardless Reference_QMA-Urban Reference_QMA-Industrial
24
-30%
-20%
-10%
0%
10%
20%
30%
40%
0 20000 40000 60000 80000 100000 120000 140000
Dev
iatio
n
Reference mass, ng
Fe
CRM2783_Standardless CRM2783_Linear Calibration MilanPO_Standardless MilanPO_Linear CalibrationReference_Standardless Reference_QMA-Urban Reference_QMA-Industrial
-50%
-40%
-30%
-20%
-10%
0%
10%
20%
30%
40%
5000 7000 9000 11000 13000 15000 17000 19000 21000
Dev
iatio
n
Reference mass, ng
K
CRM2783_Standardless CRM2783_Linear Calibration MilanPO_Standardless MilanPO_Linear CalibrationReference_Standardless Reference_QMA-Urban Reference_QMA-Industrial
25
-40%
-30%
-20%
-10%
0%
10%
20%
30%
40%
4000 4500 5000 5500 6000 6500 7000 7500 8000 8500 9000
Dev
iatio
n
Reference mass, ng
Mg
CRM2783_Standardless CRM2783_Linear Calibration MilanPO_Standardless MilanPO_Linear CalibrationReference_Standardless Reference_QMA-Urban Reference_QMA-Industrial
-60%
-40%
-20%
0%
20%
40%
60%
0 2000 4000 6000 8000 10000 12000 14000
Dev
iatio
n
Reference mass , ng
Zn
CRM2783_Standardless CRM2783_Linear Calibration MilanPO_Standardless MilanPO_Linear CalibrationReference_Standardless Reference_QMA-Urban Reference_QMA-Industrial
26
-30%
-20%
-10%
0%
10%
20%
30%
40%
0 500 1000 1500 2000 2500 3000 3500 4000 4500
Dev
iatio
n
Reference mass , ng
Pb
CRM2783_Standardless CRM2783_Linear Calibration MilanPO_Standardless MilanPO_Linear CalibrationReference_Standardless Reference_QMA-Urban Reference_QMA-Industrial
-80%
-40%
0%
40%
80%
120%
160%
200%
240%
280%
320%
360%
400%
440%
480%
520%
560%
0 100 200 300 400 500 600 700 800
Dev
iatio
n
Reference mass , ng
Ni
CRM2783_Standardless CRM2783_Linear Calibration MilanPO_Standardless MilanPO_Linear CalibrationReference_Standardless Reference_QMA-Urban Reference_QMA-Industrial
27
-60%
-40%
-20%
0%
20%
40%
0 100 200 300 400 500 600 700 800 900
Dev
iatio
n
Reference mass, ng
Cr
CRM2783_Standardless CRM2783_Linear Calibration MilanPO_Standardless MilanPO_Linear CalibrationReference_Standardless Reference_QMA-Urban Reference_QMA-Industrial
-30%
-20%
-10%
0%
10%
20%
30%
0 1000 2000 3000 4000 5000 6000
Dev
iatio
n
Reference mass, ng
Cu
CRM2783_Standardless CRM2783_Linear Calibration MilanPO_Standardless MilanPO_Linear CalibrationReference_Standardless Reference_QMA-Urban Reference_QMA-Industrial
28
-30%
-20%
-10%
0%
10%
20%
30%
40%
200 400 600 800 1000 1200 1400 1600 1800 2000
Dev
iatio
n
Reference mass, ng
Mn
CRM2783_Standardless CRM2783_Linear Calibration MilanPO_Standardless MilanPO_Linear CalibrationReference_Standardless Reference_QMA-Urban Reference_QMA-Industrial
-40%
-30%
-20%
-10%
0%
10%
20%
30%
40%
100 150 200 250 300 350 400 450 500 550 600
Dev
iatio
n
Reference mass , ng
Mo
CRM2783_Standardless CRM2783_Linear Calibration MilanPO_Standardless MilanPO_Linear CalibrationReference_Standardless Reference_QMA-Urban Reference_QMA-Industrial
29
-40%
-30%
-20%
-10%
0%
10%
20%
30%
40%
600 800 1000 1200 1400 1600 1800 2000
Dev
iatio
n
Reference mass , ng
Ti
CRM2783_Standardless CRM2783_Linear Calibration MilanPO_Standardless MilanPO_Linear CalibrationReference_Standardless Reference_QMA-Urban Reference_QMA-Industrial
-35%
-25%
-15%
-5%
5%
15%
70 90 110 130 150 170 190 210
Dev
iatio
n
Reference mass , ng
Sr
CRM2783_Standardless CRM2783_Linear Calibration MilanPO_Standardless MilanPO_Linear CalibrationReference_Standardless Reference_QMA-Urban Reference_QMA-Industrial
30
-200%
-150%
-100%
-50%
0%
50%
0 20 40 60 80 100 120
Dev
iatio
n
Reference mass, ng
As
CRM2783_Standardless CRM2783_Linear Calibration MilanPO_Standardless MilanPO_Linear CalibrationReference_Standardless Reference_QMA-Urban Reference_QMA-Industrial
-30%
-20%
-10%
0%
10%
20%
30%
40%
50%
60%
70%
0 50 100 150 200 250
Dev
iatio
n
Reference mass , ng
V
CRM2783_Standardless CRM2783_Linear Calibration MilanPO_Standardless MilanPO_Linear CalibrationReference_Standardless Reference_QMA-Urban Reference_QMA-Industrial
31
-60%
-40%
-20%
0%
20%
40%
60%
0 5 10 15 20 25 30 35
Dev
iatio
n
Reference mass, ng
Co
CRM2783_Standardless CRM2783_Linear Calibration MilanPO_Standardless MilanPO_Linear CalibrationReference_Standardless Reference_QMA-Urban Reference_QMA-Industrial
Figure 4: Relative deviations between EDXRF analysis and references values for a NIST CRM 2783, a few filters loaded at Milan PO (Teflon filter) and one Reference filter (an urban QMA filter). EDXRF analyses were quantified by Standardless method or Linear Calibration either with Teflon filters loaded at an urban site (Linear Calibration) or with QMA filters loaded at an urban site (QMA-Urban) or with QMA filters loaded at an industrial site (QMA-Industrial)
3.2 Evaluation of Method Detection Limit and Quantification Limit The theoretical MDLs and LOQs (in ng) of 3 filter types by standardless EDXRF analysis are given in Table 3, where the elements are sorted by ascending atomic weight (Z). The MDLs for Teflon filter were generally lower than the quartz ones, most probably resulting from lower impurities in the Teflon filter and smoother surface (Robache et al., 200030). The MDLs decreased with Z. This pattern was observed for all filter types. The concentrations of Al, Ca, Cr, Cu, Fe, K, Mg, Mn, Mo, Ni, Pb, Sr, Ti and Zn in the analyzed samples were found to be higher than LOQs with a few exceptions. Apart from these 14 elements, the concentrations of Si (in Teflon filters only), Cl, S and Br (for over 50% of samples) were found higher than those LOQs, meaning that EDXRF was sensitive enough to quantify them in the filters of this study.
EN 1490210 sets the minimum MDLs as 3 times SD of laboratory blanks for Pb, Ni, Cd and As analyzed by ICP-MS or GFAAS to be lower than 10% of the limit values (LV) of EU Directives. The estimated mass of Pb, Ni, Cd and As on filter at LVs of ambient air correspond to 27500, 1100, 275 and 330 ng, respectively assuming 55 m3 sampled per filter. It can be observed in Table 3 that the MDLs of Pb and Ni are considerably lower than 10% of the LV whereas the MDLs of Cd and As were higher than MDLs and still lower than LOQs.
30 Robache, A., Mathé, F., Galloo, J.C., Herbin, M., Malet, B., 2000. Conditions de Prélèvements des Particules en Vue de l’analyse des Métaux. Ecole des mines de Douai, Département Chimie et Environnement. http://www.lcsqa.org/system/files/Etude3_0.pdf.
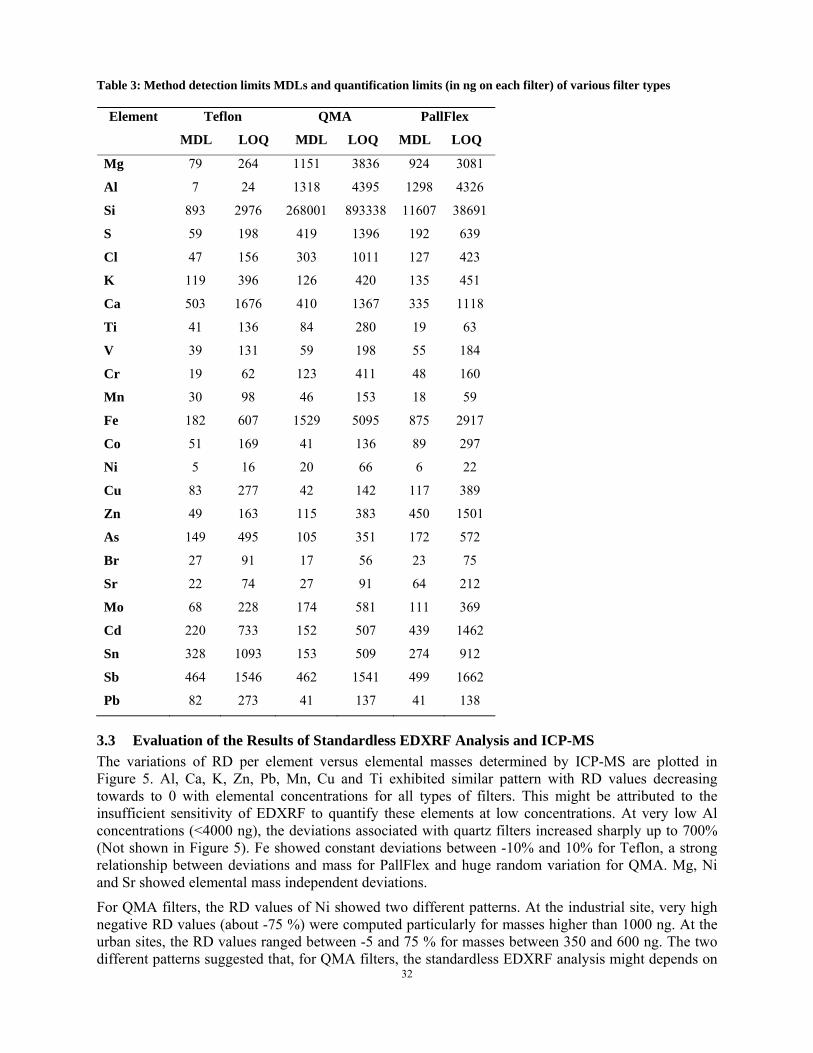
32
Table 3: Method detection limits MDLs and quantification limits (in ng on each filter) of various filter types
Element Teflon QMA PallFlex
MDL LOQ MDL LOQ MDL LOQ
Mg 79 264 1151 3836 924 3081
Al 7 24 1318 4395 1298 4326
Si 893 2976 268001 893338 11607 38691
S 59 198 419 1396 192 639
Cl 47 156 303 1011 127 423
K 119 396 126 420 135 451
Ca 503 1676 410 1367 335 1118
Ti 41 136 84 280 19 63
V 39 131 59 198 55 184
Cr 19 62 123 411 48 160
Mn 30 98 46 153 18 59
Fe 182 607 1529 5095 875 2917
Co 51 169 41 136 89 297
Ni 5 16 20 66 6 22
Cu 83 277 42 142 117 389
Zn 49 163 115 383 450 1501
As 149 495 105 351 172 572
Br 27 91 17 56 23 75
Sr 22 74 27 91 64 212
Mo 68 228 174 581 111 369
Cd 220 733 152 507 439 1462
Sn 328 1093 153 509 274 912
Sb 464 1546 462 1541 499 1662
Pb 82 273 41 137 41 138
3.3 Evaluation of the Results of Standardless EDXRF Analysis and ICP-MS The variations of RD per element versus elemental masses determined by ICP-MS are plotted in Figure 5. Al, Ca, K, Zn, Pb, Mn, Cu and Ti exhibited similar pattern with RD values decreasing towards to 0 with elemental concentrations for all types of filters. This might be attributed to the insufficient sensitivity of EDXRF to quantify these elements at low concentrations. At very low Al concentrations (<4000 ng), the deviations associated with quartz filters increased sharply up to 700% (Not shown in Figure 5). Fe showed constant deviations between -10% and 10% for Teflon, a strong relationship between deviations and mass for PallFlex and huge random variation for QMA. Mg, Ni and Sr showed elemental mass independent deviations.
For QMA filters, the RD values of Ni showed two different patterns. At the industrial site, very high negative RD values (about -75 %) were computed particularly for masses higher than 1000 ng. At the urban sites, the RD values ranged between -5 and 75 % for masses between 350 and 600 ng. The two different patterns suggested that, for QMA filters, the standardless EDXRF analysis might depends on
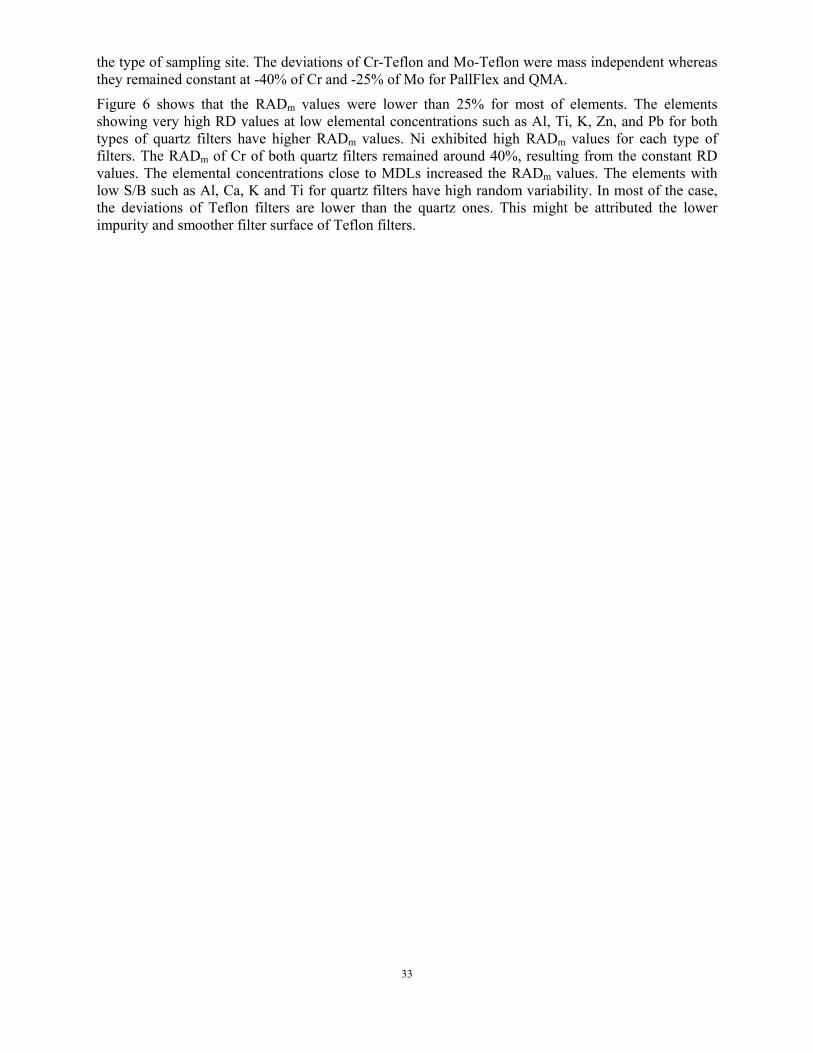
33
the type of sampling site. The deviations of Cr-Teflon and Mo-Teflon were mass independent whereas they remained constant at -40% of Cr and -25% of Mo for PallFlex and QMA.
Figure 6 shows that the RADm values were lower than 25% for most of elements. The elements showing very high RD values at low elemental concentrations such as Al, Ti, K, Zn, and Pb for both types of quartz filters have higher RADm values. Ni exhibited high RADm values for each type of filters. The RADm of Cr of both quartz filters remained around 40%, resulting from the constant RD values. The elemental concentrations close to MDLs increased the RADm values. The elements with low S/B such as Al, Ca, K and Ti for quartz filters have high random variability. In most of the case, the deviations of Teflon filters are lower than the quartz ones. This might be attributed the lower impurity and smoother filter surface of Teflon filters.
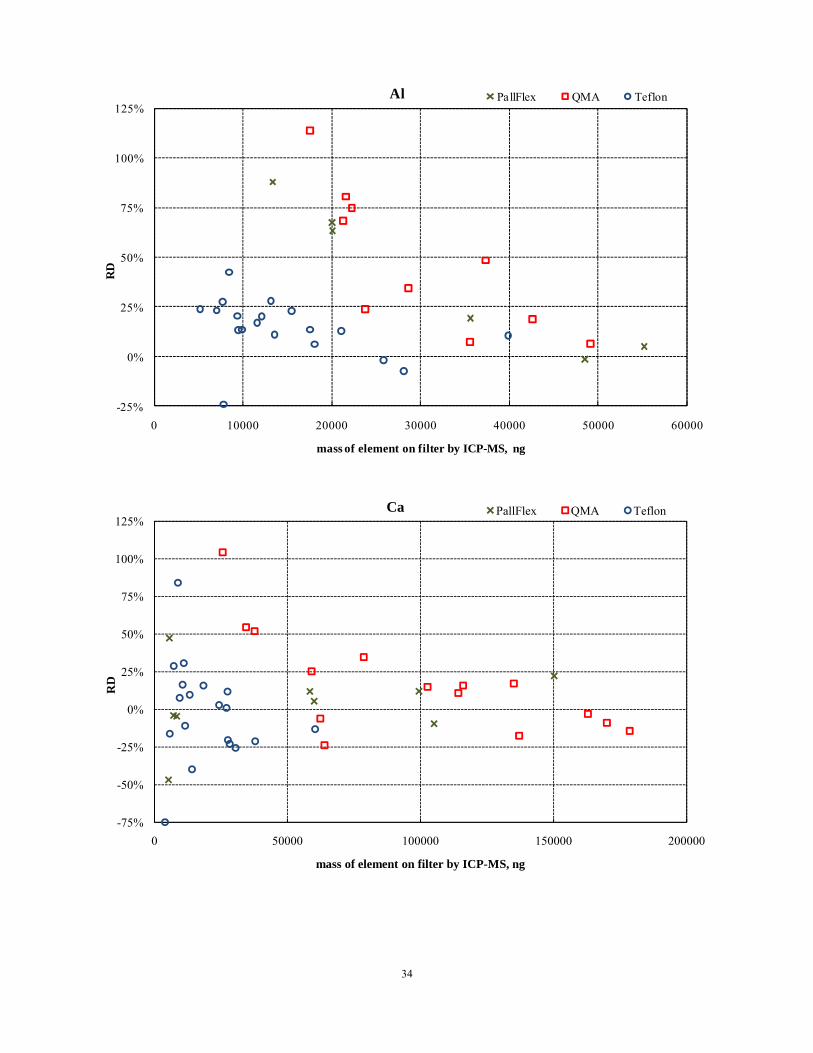
34
-25%
0%
25%
50%
75%
100%
125%
0 10000 20000 30000 40000 50000 60000
RD
mass of element on filter by ICP-MS, ng
Al PallFlex QMA Teflon
-75%
-50%
-25%
0%
25%
50%
75%
100%
125%
0 50000 100000 150000 200000
RD
mass of element on filter by ICP-MS, ng
Ca PallFlex QMA Teflon
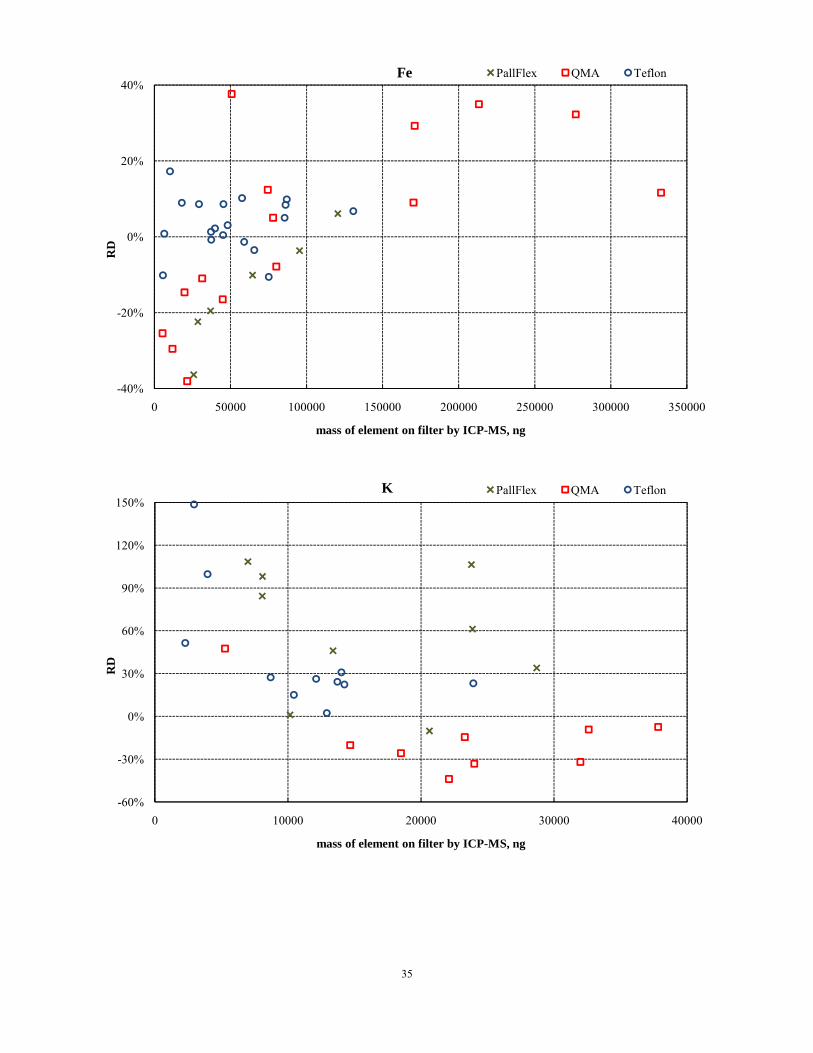
35
-40%
-20%
0%
20%
40%
0 50000 100000 150000 200000 250000 300000 350000
RD
mass of element on filter by ICP-MS, ng
Fe PallFlex QMA Teflon
-60%
-30%
0%
30%
60%
90%
120%
150%
0 10000 20000 30000 40000
RD
mass of element on filter by ICP-MS, ng
K PallFlex QMA Teflon
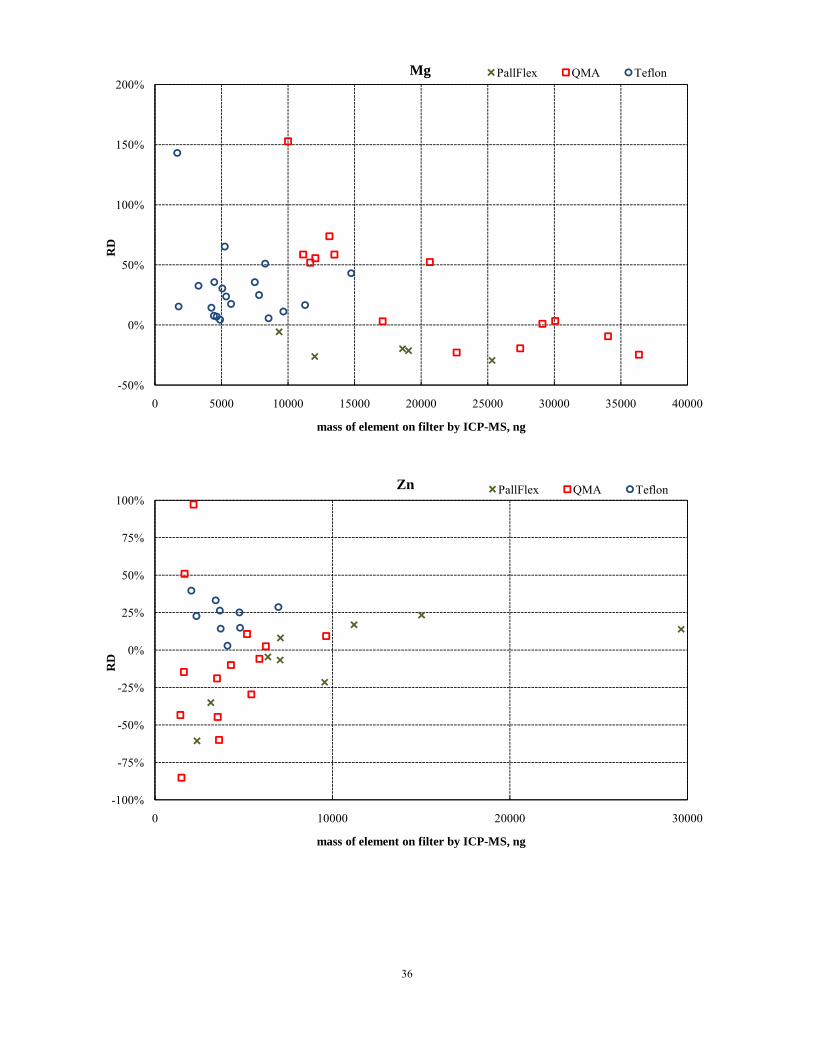
36
-50%
0%
50%
100%
150%
200%
0 5000 10000 15000 20000 25000 30000 35000 40000
RD
mass of element on filter by ICP-MS, ng
Mg PallFlex QMA Teflon
-100%
-75%
-50%
-25%
0%
25%
50%
75%
100%
0 10000 20000 30000
RD
mass of element on filter by ICP-MS, ng
Zn PallFlex QMA Teflon

37
-20%
0%
20%
40%
60%
80%
100%
0 1000 2000 3000 4000 5000 6000
RD
mass of element on filter by ICP-MS, ng
Pb PallFlex QMA Teflon
-100%
-75%
-50%
-25%
0%
25%
50%
75%
100%
0 500 1000 1500 2000 2500 3000 3500
RD
mass of element on filter by ICP-MS, ng
Ni PallFlex QMA Teflon
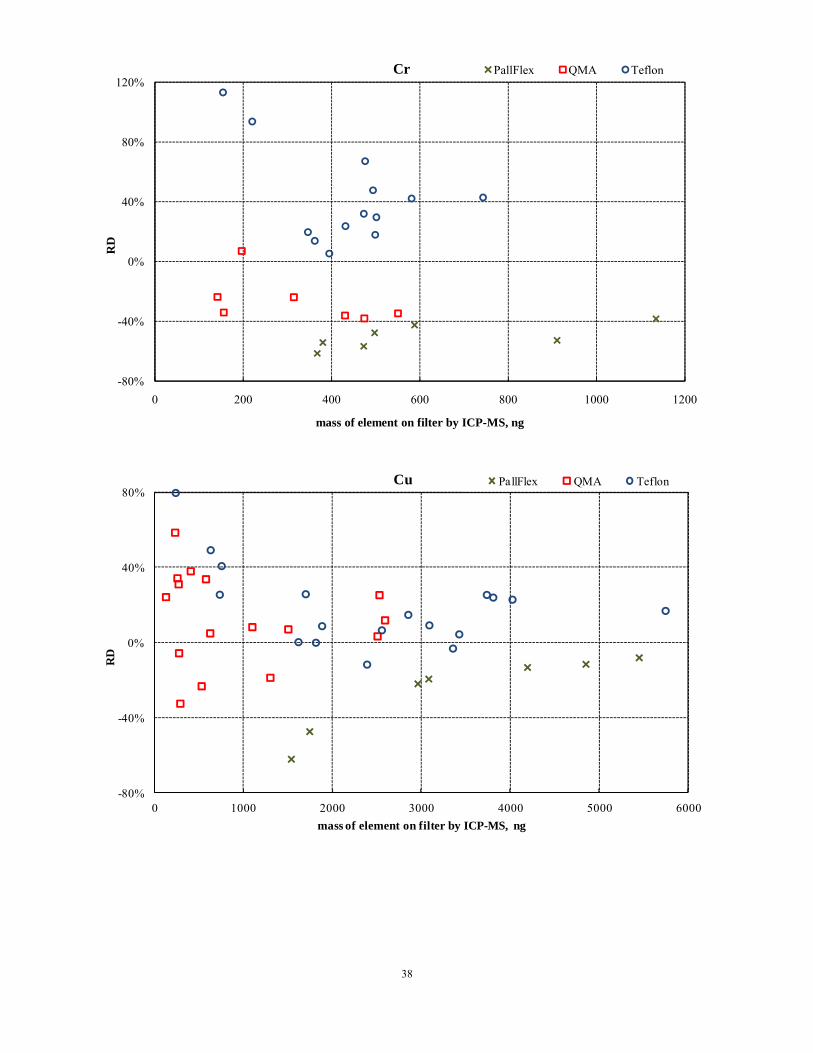
38
-80%
-40%
0%
40%
80%
120%
0 200 400 600 800 1000 1200
RD
mass of element on filter by ICP-MS, ng
Cr PallFlex QMA Teflon
-80%
-40%
0%
40%
80%
0 1000 2000 3000 4000 5000 6000
RD
mass of element on filter by ICP-MS, ng
Cu PallFlex QMA Teflon
39
-30%
0%
30%
60%
90%
120%
0 1000 2000 3000 4000 5000
RD
mass of element on filter by ICP-MS, ng
Mn PallFlex QMA Teflon
c
-50%
-25%
0%
25%
50%
75%
100%
125%
0 500 1000 1500 2000 2500 3000 3500 4000 4500
RD
mass of element on filter by ICP-MS, ng
Ti PallFlex QMA Teflon
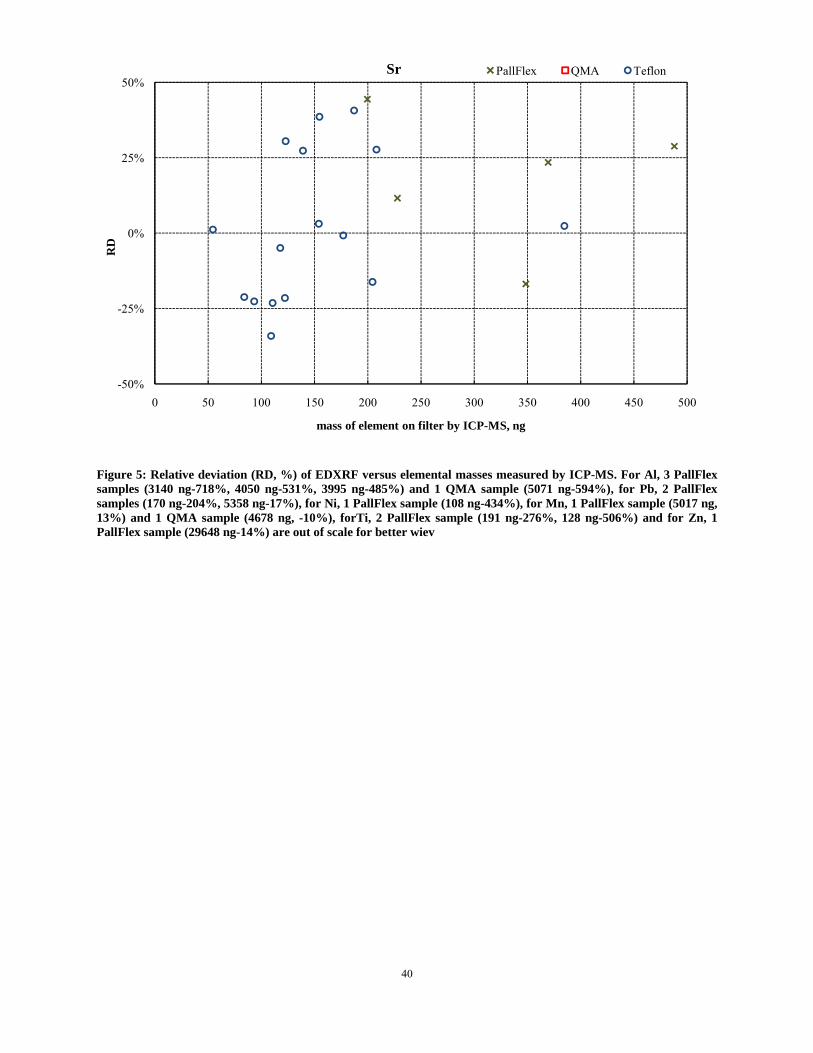
40
-50%
-25%
0%
25%
50%
0 50 100 150 200 250 300 350 400 450 500
RD
mass of element on filter by ICP-MS, ng
Sr PallFlex QMA Teflon
Figure 5: Relative deviation (RD, %) of EDXRF versus elemental masses measured by ICP-MS. For Al, 3 PallFlex samples (3140 ng-718%, 4050 ng-531%, 3995 ng-485%) and 1 QMA sample (5071 ng-594%), for Pb, 2 PallFlex samples (170 ng-204%, 5358 ng-17%), for Ni, 1 PallFlex sample (108 ng-434%), for Mn, 1 PallFlex sample (5017 ng, 13%) and 1 QMA sample (4678 ng, -10%), forTi, 2 PallFlex sample (191 ng-276%, 128 ng-506%) and for Zn, 1 PallFlex sample (29648 ng-14%) are out of scale for better wiev
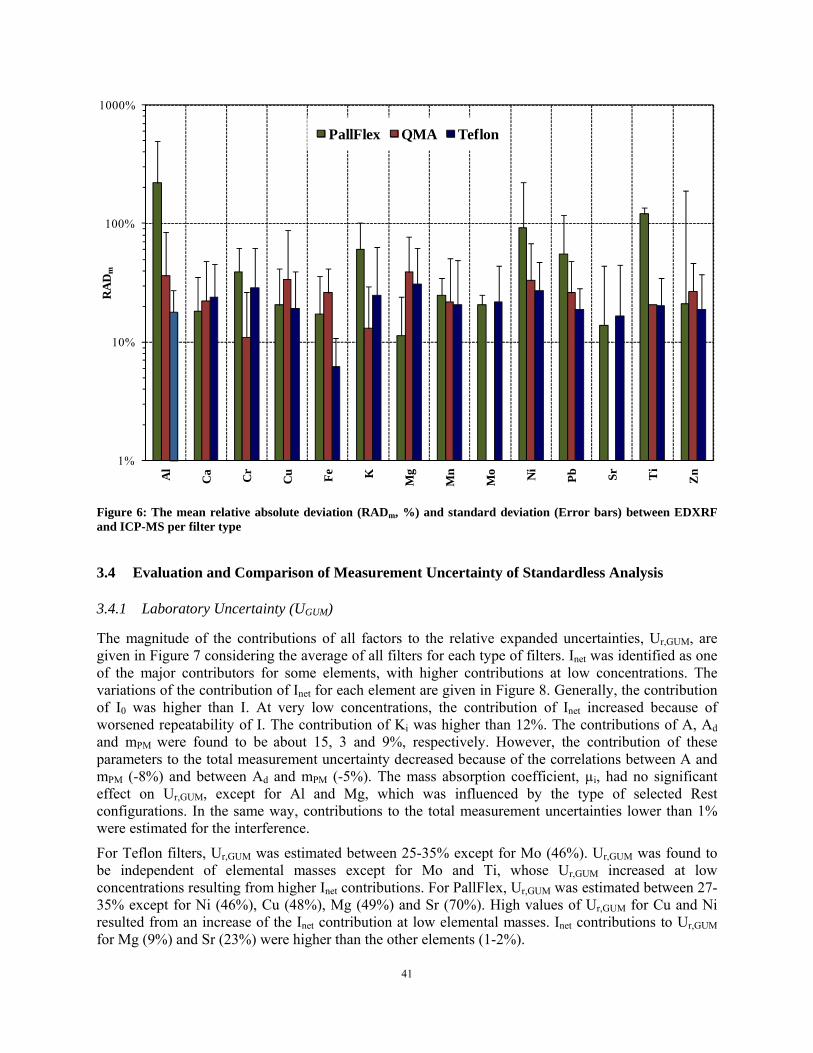
41
1%
10%
100%
1000%
Al
Ca Cr
Cu Fe K Mg
Mn
Mo Ni
Pb Sr Ti
Zn
RA
Dm
PallFlex QMA Teflon
Figure 6: The mean relative absolute deviation (RADm, %) and standard deviation (Error bars) between EDXRF and ICP-MS per filter type
3.4 Evaluation and Comparison of Measurement Uncertainty of Standardless Analysis
3.4.1 Laboratory Uncertainty (UGUM)
The magnitude of the contributions of all factors to the relative expanded uncertainties, Ur,GUM, are given in Figure 7 considering the average of all filters for each type of filters. Inet was identified as one of the major contributors for some elements, with higher contributions at low concentrations. The variations of the contribution of Inet for each element are given in Figure 8. Generally, the contribution of I0 was higher than I. At very low concentrations, the contribution of Inet increased because of worsened repeatability of I. The contribution of Ki was higher than 12%. The contributions of A, Ad and mPM were found to be about 15, 3 and 9%, respectively. However, the contribution of these parameters to the total measurement uncertainty decreased because of the correlations between A and mPM (-8%) and between Ad and mPM (-5%). The mass absorption coefficient, µi, had no significant effect on Ur,GUM, except for Al and Mg, which was influenced by the type of selected Rest configurations. In the same way, contributions to the total measurement uncertainties lower than 1% were estimated for the interference.
For Teflon filters, Ur,GUM was estimated between 25-35% except for Mo (46%). Ur,GUM was found to be independent of elemental masses except for Mo and Ti, whose Ur,GUM increased at low concentrations resulting from higher Inet contributions. For PallFlex, Ur,GUM was estimated between 27-35% except for Ni (46%), Cu (48%), Mg (49%) and Sr (70%). High values of Ur,GUM for Cu and Ni resulted from an increase of the Inet contribution at low elemental masses. Inet contributions to Ur,GUM for Mg (9%) and Sr (23%) were higher than the other elements (1-2%).
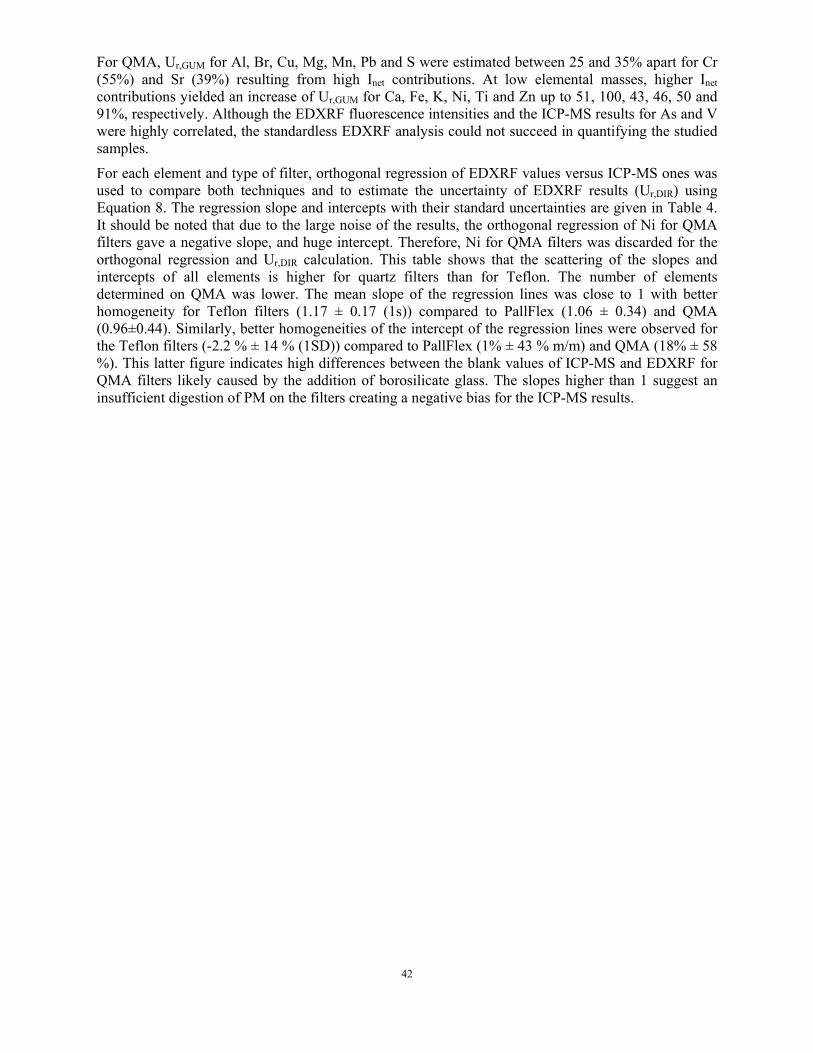
42
For QMA, Ur,GUM for Al, Br, Cu, Mg, Mn, Pb and S were estimated between 25 and 35% apart for Cr (55%) and Sr (39%) resulting from high Inet contributions. At low elemental masses, higher Inet contributions yielded an increase of Ur,GUM for Ca, Fe, K, Ni, Ti and Zn up to 51, 100, 43, 46, 50 and 91%, respectively. Although the EDXRF fluorescence intensities and the ICP-MS results for As and V were highly correlated, the standardless EDXRF analysis could not succeed in quantifying the studied samples.
For each element and type of filter, orthogonal regression of EDXRF values versus ICP-MS ones was used to compare both techniques and to estimate the uncertainty of EDXRF results (Ur,DIR) using Equation 8. The regression slope and intercepts with their standard uncertainties are given in Table 4. It should be noted that due to the large noise of the results, the orthogonal regression of Ni for QMA filters gave a negative slope, and huge intercept. Therefore, Ni for QMA filters was discarded for the orthogonal regression and Ur,DIR calculation. This table shows that the scattering of the slopes and intercepts of all elements is higher for quartz filters than for Teflon. The number of elements determined on QMA was lower. The mean slope of the regression lines was close to 1 with better homogeneity for Teflon filters (1.17 ± 0.17 (1s)) compared to PallFlex (1.06 ± 0.34) and QMA (0.96±0.44). Similarly, better homogeneities of the intercept of the regression lines were observed for the Teflon filters (-2.2 % ± 14 % (1SD)) compared to PallFlex (1% ± 43 % m/m) and QMA (18% ± 58 %). This latter figure indicates high differences between the blank values of ICP-MS and EDXRF for QMA filters likely caused by the addition of borosilicate glass. The slopes higher than 1 suggest an insufficient digestion of PM on the filters creating a negative bias for the ICP-MS results.
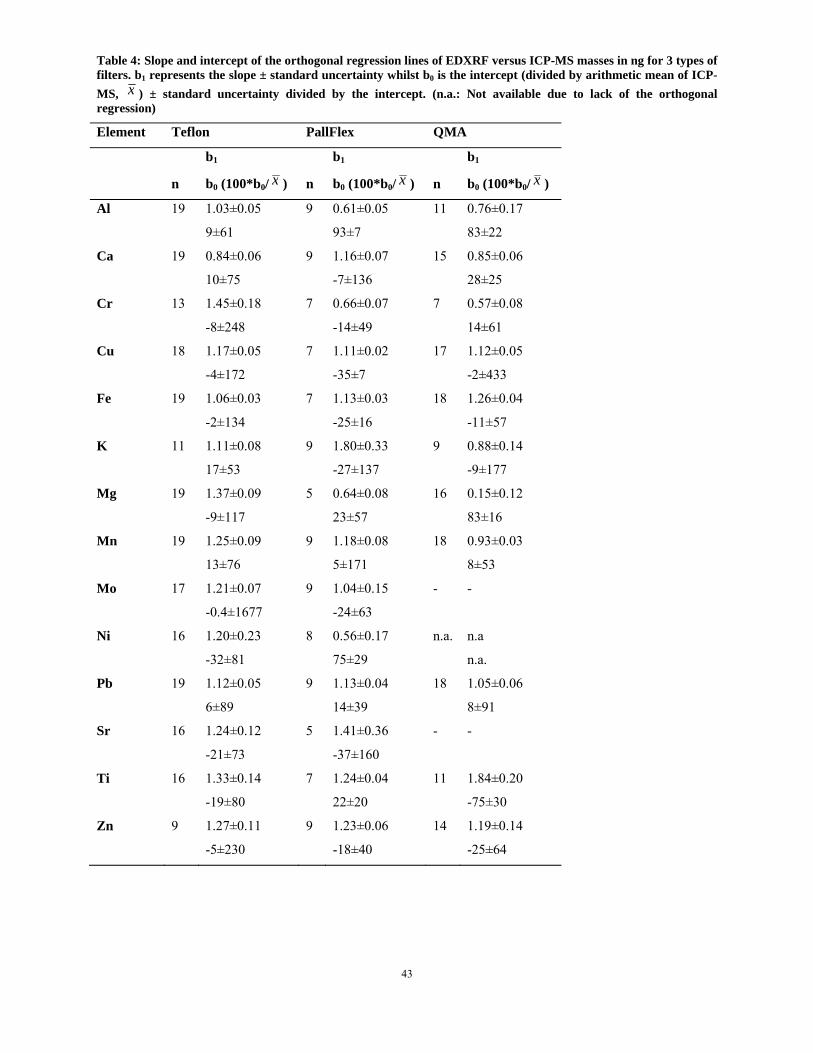
43
Table 4: Slope and intercept of the orthogonal regression lines of EDXRF versus ICP-MS masses in ng for 3 types of filters. b1 represents the slope ± standard uncertainty whilst b0 is the intercept (divided by arithmetic mean of ICP-MS, x ) ± standard uncertainty divided by the intercept. (n.a.: Not available due to lack of the orthogonal regression)
Element Teflon PallFlex QMA
n
b1
b0 (100*b0/ x ) n
b1
b0 (100*b0/ x ) n
b1
b0 (100*b0/ x )
Al 19 1.03±0.05
9±61
9 0.61±0.05
93±7
11 0.76±0.17
83±22
Ca 19 0.84±0.06
10±75
9 1.16±0.07
-7±136
15 0.85±0.06
28±25
Cr 13 1.45±0.18
-8±248
7 0.66±0.07
-14±49
7 0.57±0.08
14±61
Cu 18 1.17±0.05
-4±172
7 1.11±0.02
-35±7
17 1.12±0.05
-2±433
Fe 19 1.06±0.03
-2±134
7 1.13±0.03
-25±16
18 1.26±0.04
-11±57
K 11 1.11±0.08
17±53
9 1.80±0.33
-27±137
9 0.88±0.14
-9±177
Mg 19 1.37±0.09
-9±117
5 0.64±0.08
23±57
16 0.15±0.12
83±16
Mn 19 1.25±0.09
13±76
9 1.18±0.08
5±171
18 0.93±0.03
8±53
Mo 17 1.21±0.07
-0.4±1677
9 1.04±0.15
-24±63
- -
Ni 16 1.20±0.23
-32±81
8 0.56±0.17
75±29
n.a. n.a
n.a.
Pb 19 1.12±0.05
6±89
9 1.13±0.04
14±39
18 1.05±0.06
8±91
Sr 16 1.24±0.12
-21±73
5 1.41±0.36
-37±160
- -
Ti 16 1.33±0.14
-19±80
7 1.24±0.04
22±20
11 1.84±0.20
-75±30
Zn 9 1.27±0.11
-5±230
9 1.23±0.06
-18±40
14 1.19±0.14
-25±64

44
-20%
-10%
0%
10%
20%
30%
40%
50%
60%
70%
Al
Br
Ca Cl
Cr
Cu Fe K
Mg
Mn
Mo Ni
Pb S Si Sr Ti
Zn
Rel
ativ
e E
xpan
ded
Unc
erta
inty
, Ur,
GU
M
PallFlex Interference
r(A, mPM)
r(Ad, mPM)
mPM
Ad
A
Ki
µi
Inet
-20%
0%
20%
40%
60%
80%
100%
120%
Al
Br
Ca Cl
Cr
Cu Fe K
Mg
Mn
Mo Ni
Pb S Si Sr Ti
Zn
Rel
ativ
e E
xpan
ded
Unc
erta
inty
, Ur,
GU
M
QMA Interference
r(A, mPM)
r(Ad, mPM)
mPM
Ad
A
Ki
µi
Inet
-20%
0%
20%
40%
60%
Al
Br
Ca Cl
Cr
Cu Fe K Mg
Mn
Mo Ni
Pb S Si Sr Ti
Zn
Rel
ativ
e E
xpan
ded
Unc
erta
inty
, Ur,
GU
M
Teflon Interference
r(A, mPM)
r(Ad, mPM)
mPM
Ad
A
Ki
µi
Inet
Figure 7: Average contributions of parameters to Ur,GUM for 3 types of filter. Inet refers I-I0. r denotes the contributions of the correlations between correlated variables, A is the excited area; Ad is the PM deposited area, mPM is the mass of PM10; Ki is the ratio of counts to mass of element i determined by initial calibration; µi is the mass absorption coefficient of element i
45
R² = 0.53
R² = 0.77
R² = 0.950%
2%
4%
6%
8%
10%
12%
14%
0 10000 20000 30000 40000 50000 60000
u Ine
t/m
mass of elements on filter by EDXRF, ng
Al PallFlex QMA Teflon
R² = 0.81
R² = 1.00
R² = 0.31
0%
5%
10%
15%
20%
25%
30%
35%
0 20000 40000 60000 80000 100000 120000 140000 160000 180000 200000
u Ine
t/m
mass of elements on filter by EDXRF, ng
Ca PallFlex QMA Teflon

46
R² = 0.62
R² = 1.00
R² = 0.38
0%
1%
10%
100%
1000%
0 50000 100000 150000 200000 250000 300000 350000 400000
u Ine
t/m
mass of elements on filter by EDXRF, ng
Fe PallFlex QMA Teflon
R² = 0.68
R² = 1.00
R² = 0.08
0%
1%
10%
100%
0 5000 10000 15000 20000 25000 30000 35000 40000 45000 50000
u Ine
t/m
mass of elements on filter by EDXRF, ng
K PallFlex QMA Teflon
47
R² = 0.61
R² = 0.23
R² = 0.77
0%
1%
2%
3%
4%
5%
6%
7%
8%
0 5000 10000 15000 20000 25000 30000 35000
u Ine
t/m
mass of elements on filter by EDXRF, ng
Mg PallFlex QMA Teflon
R² = 0.78
R² = 1.00
R² = 0.04
0%
1%
10%
100%
1000%
0 5000 10000 15000 20000 25000 30000 35000
u Ine
t/m
mass of elements on filter by EDXRF, ng
Zn PallFlex QMA Teflon

48
R² = 0.66
R² = 0.55
R² = 0.26
0%
2%
4%
6%
8%
10%
12%
14%
16%
0 1000 2000 3000 4000 5000 6000 7000
u Ine
t/m
mass of elements on filter by EDXRF, ng
Pb PallFlex QMA Teflon
R² = 0.72
R² = 0.86
R² = 0.02
0%
5%
10%
15%
20%
25%
30%
0 200 400 600 800 1000 1200
u Ine
t/m
mass of elements on filter by EDXRF, ng
Ni PallFlex QMA Teflon
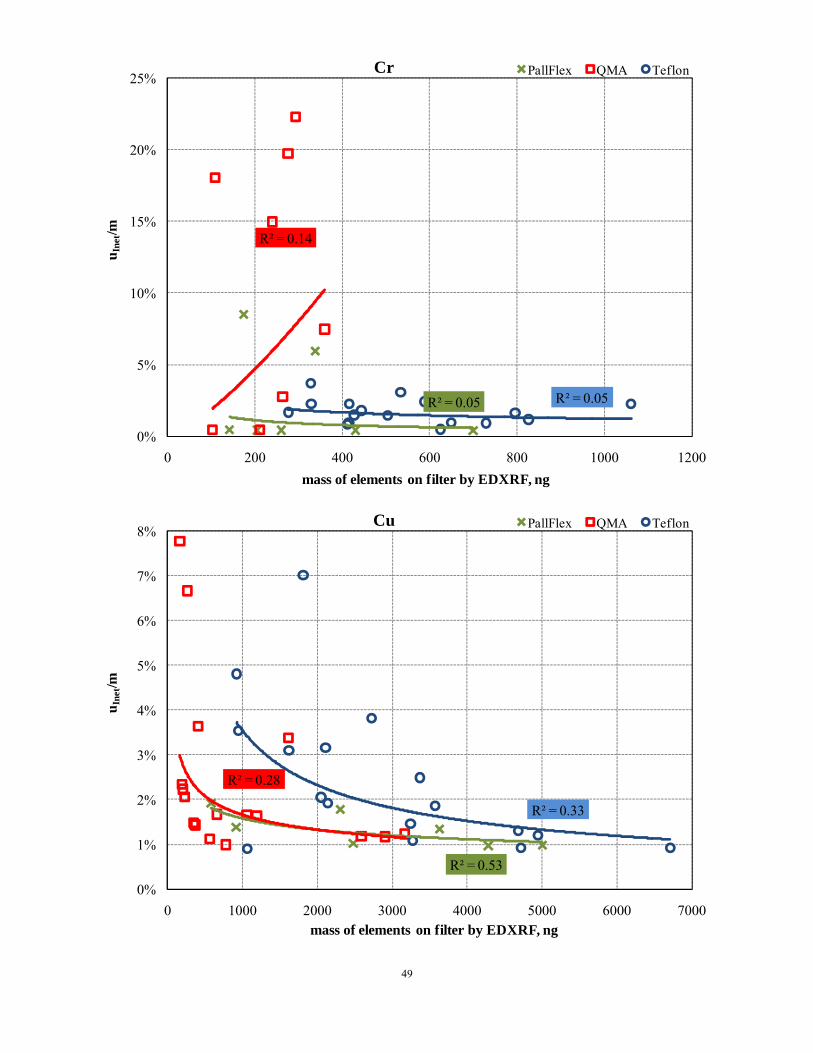
49
R² = 0.05
R² = 0.14
R² = 0.05
0%
5%
10%
15%
20%
25%
0 200 400 600 800 1000 1200
u Ine
t/m
mass of elements on filter by EDXRF, ng
Cr PallFlex QMA Teflon
R² = 0.53
R² = 0.28
R² = 0.33
0%
1%
2%
3%
4%
5%
6%
7%
8%
0 1000 2000 3000 4000 5000 6000 7000
u Ine
t/m
mass of elements on filter by EDXRF, ng
Cu PallFlex QMA Teflon

50
R² = 0.74
R² = 0.82
R² = 0.33
0%
2%
4%
6%
8%
10%
12%
14%
0 1000 2000 3000 4000 5000 6000
u Ine
t/m
mass of elements on filter by EDXRF, ng
Mn PallFlex QMA Teflon
R² = 0.98
R² = 0.75
R² = 0.36
0%
20%
40%
60%
80%
100%
120%
140%
0 500 1000 1500 2000 2500 3000
u Ine
t/m
mass of elements on filter by EDXRF, ng
Mo PallFlex QMA Teflon
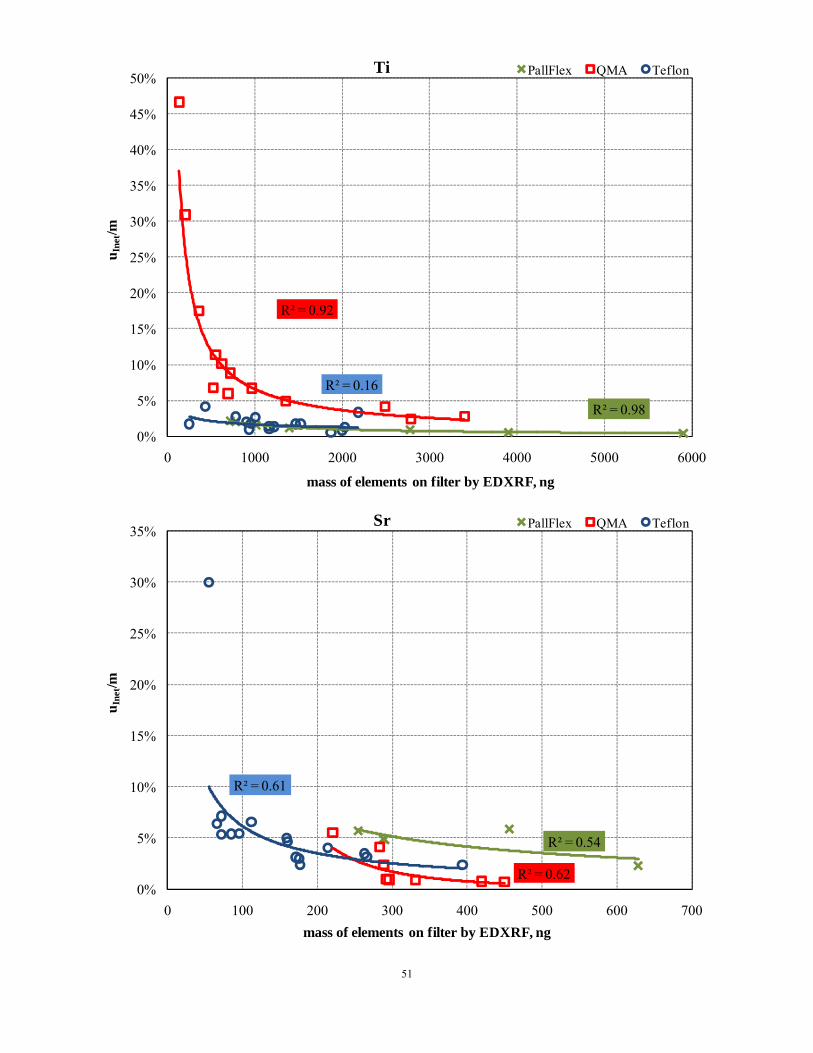
51
R² = 0.98
R² = 0.92
R² = 0.16
0%
5%
10%
15%
20%
25%
30%
35%
40%
45%
50%
0 1000 2000 3000 4000 5000 6000
u Ine
t/m
mass of elements on filter by EDXRF, ng
Ti PallFlex QMA Teflon
R² = 0.54
R² = 0.62
R² = 0.61
0%
5%
10%
15%
20%
25%
30%
35%
0 100 200 300 400 500 600 700
u Ine
t/m
mass of elements on filter by EDXRF, ng
Sr PallFlex QMA Teflon
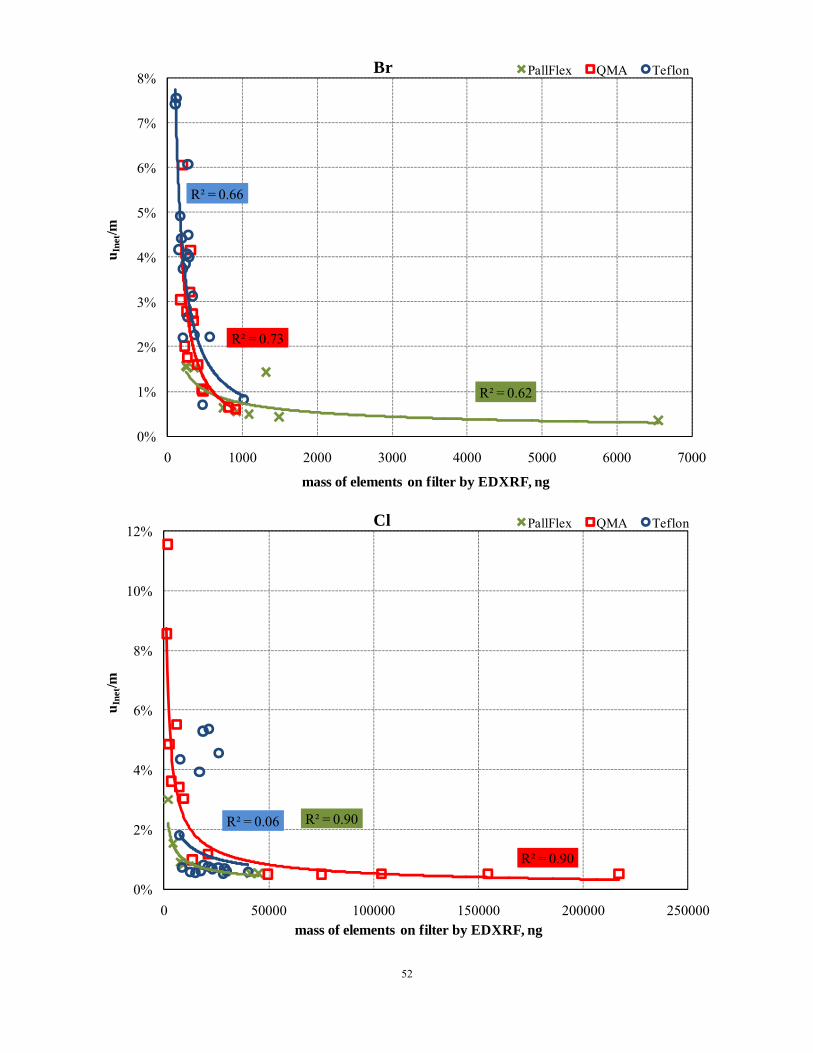
52
R² = 0.62
R² = 0.73
R² = 0.66
0%
1%
2%
3%
4%
5%
6%
7%
8%
0 1000 2000 3000 4000 5000 6000 7000
u Ine
t/m
mass of elements on filter by EDXRF, ng
Br PallFlex QMA Teflon
R² = 0.90
R² = 0.90
R² = 0.06
0%
2%
4%
6%
8%
10%
12%
0 50000 100000 150000 200000 250000
u Ine
t/m
mass of elements on filter by EDXRF, ng
Cl PallFlex QMA Teflon
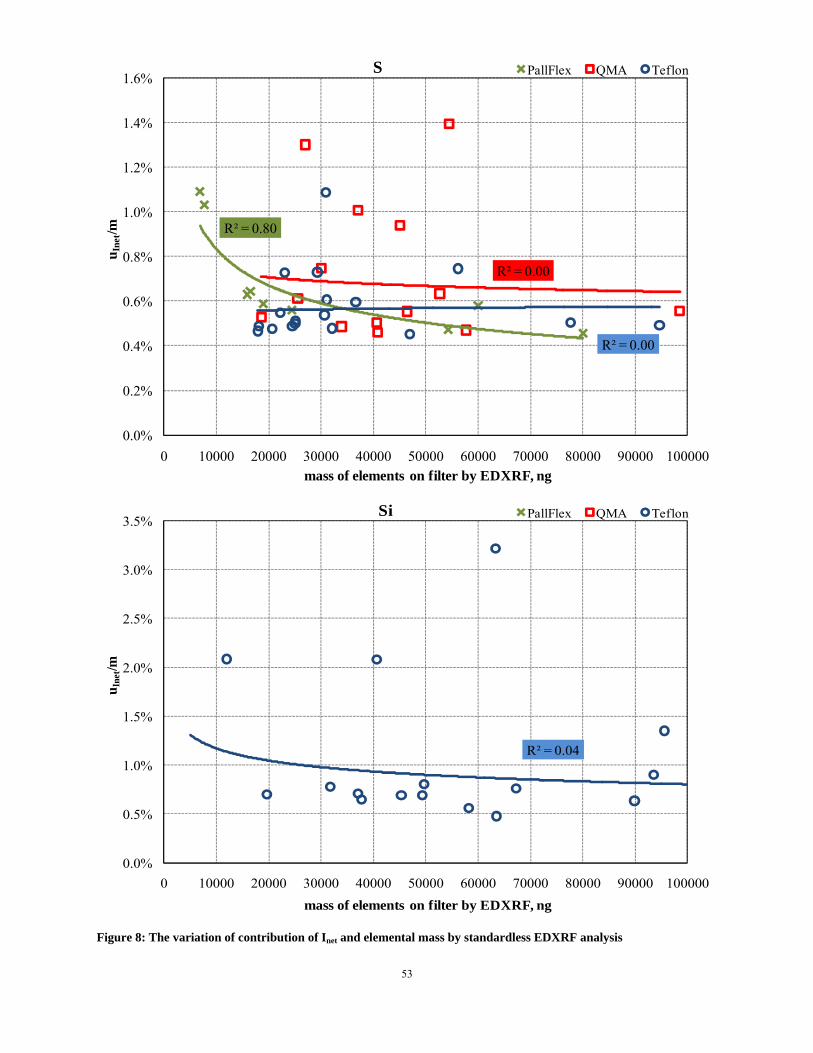
53
R² = 0.80
R² = 0.00
R² = 0.00
0.0%
0.2%
0.4%
0.6%
0.8%
1.0%
1.2%
1.4%
1.6%
0 10000 20000 30000 40000 50000 60000 70000 80000 90000 100000
u Ine
t/m
mass of elements on filter by EDXRF, ng
S PallFlex QMA Teflon
R² = 0.04
0.0%
0.5%
1.0%
1.5%
2.0%
2.5%
3.0%
3.5%
0 10000 20000 30000 40000 50000 60000 70000 80000 90000 100000
u Ine
t/m
mass of elements on filter by EDXRF, ng
Si PallFlex QMA Teflon
Figure 8: The variation of contribution of Inet and elemental mass by standardless EDXRF analysis
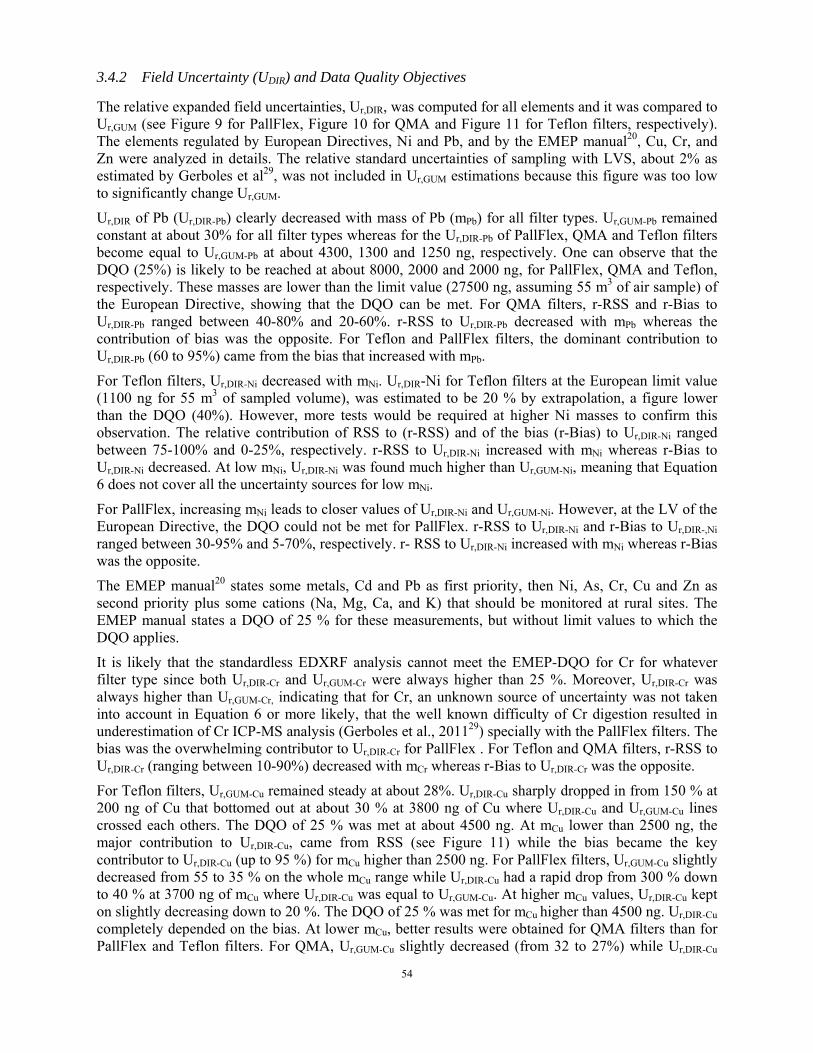
54
3.4.2 Field Uncertainty (UDIR) and Data Quality Objectives
The relative expanded field uncertainties, Ur,DIR, was computed for all elements and it was compared to Ur,GUM (see Figure 9 for PallFlex, Figure 10 for QMA and Figure 11 for Teflon filters, respectively). The elements regulated by European Directives, Ni and Pb, and by the EMEP manual20, Cu, Cr, and Zn were analyzed in details. The relative standard uncertainties of sampling with LVS, about 2% as estimated by Gerboles et al29, was not included in Ur,GUM estimations because this figure was too low to significantly change Ur,GUM.
Ur,DIR of Pb (Ur,DIR-Pb) clearly decreased with mass of Pb (mPb) for all filter types. Ur,GUM-Pb remained constant at about 30% for all filter types whereas for the Ur,DIR-Pb of PallFlex, QMA and Teflon filters become equal to Ur,GUM-Pb at about 4300, 1300 and 1250 ng, respectively. One can observe that the DQO (25%) is likely to be reached at about 8000, 2000 and 2000 ng, for PallFlex, QMA and Teflon, respectively. These masses are lower than the limit value (27500 ng, assuming 55 m3 of air sample) of the European Directive, showing that the DQO can be met. For QMA filters, r-RSS and r-Bias to Ur,DIR-Pb ranged between 40-80% and 20-60%. r-RSS to Ur,DIR-Pb decreased with mPb whereas the contribution of bias was the opposite. For Teflon and PallFlex filters, the dominant contribution to Ur,DIR-Pb (60 to 95%) came from the bias that increased with mPb.
For Teflon filters, Ur,DIR-Ni decreased with mNi. Ur,DIR-Ni for Teflon filters at the European limit value (1100 ng for 55 m3 of sampled volume), was estimated to be 20 % by extrapolation, a figure lower than the DQO (40%). However, more tests would be required at higher Ni masses to confirm this observation. The relative contribution of RSS to (r-RSS) and of the bias (r-Bias) to Ur,DIR-Ni ranged between 75-100% and 0-25%, respectively. r-RSS to Ur,DIR-Ni increased with mNi whereas r-Bias to Ur,DIR-Ni decreased. At low mNi, Ur,DIR-Ni was found much higher than Ur,GUM-Ni, meaning that Equation 6 does not cover all the uncertainty sources for low mNi.
For PallFlex, increasing mNi leads to closer values of Ur,DIR-Ni and Ur,GUM-Ni. However, at the LV of the European Directive, the DQO could not be met for PallFlex. r-RSS to Ur,DIR-Ni and r-Bias to Ur,DIR-,Ni ranged between 30-95% and 5-70%, respectively. r- RSS to Ur,DIR-Ni increased with mNi whereas r-Bias was the opposite.
The EMEP manual20 states some metals, Cd and Pb as first priority, then Ni, As, Cr, Cu and Zn as second priority plus some cations (Na, Mg, Ca, and K) that should be monitored at rural sites. The EMEP manual states a DQO of 25 % for these measurements, but without limit values to which the DQO applies.
It is likely that the standardless EDXRF analysis cannot meet the EMEP-DQO for Cr for whatever filter type since both Ur,DIR-Cr and Ur,GUM-Cr were always higher than 25 %. Moreover, Ur,DIR-Cr was always higher than Ur,GUM-Cr, indicating that for Cr, an unknown source of uncertainty was not taken into account in Equation 6 or more likely, that the well known difficulty of Cr digestion resulted in underestimation of Cr ICP-MS analysis (Gerboles et al., 201129) specially with the PallFlex filters. The bias was the overwhelming contributor to Ur,DIR-Cr for PallFlex . For Teflon and QMA filters, r-RSS to Ur,DIR-Cr (ranging between 10-90%) decreased with mCr whereas r-Bias to Ur,DIR-Cr was the opposite.
For Teflon filters, Ur,GUM-Cu remained steady at about 28%. Ur,DIR-Cu sharply dropped in from 150 % at 200 ng of Cu that bottomed out at about 30 % at 3800 ng of Cu where Ur,DIR-Cu and Ur,GUM-Cu lines crossed each others. The DQO of 25 % was met at about 4500 ng. At mCu lower than 2500 ng, the major contribution to Ur,DIR-Cu, came from RSS (see Figure 11) while the bias became the key contributor to Ur,DIR-Cu (up to 95 %) for mCu higher than 2500 ng. For PallFlex filters, Ur,GUM-Cu slightly decreased from 55 to 35 % on the whole mCu range while Ur,DIR-Cu had a rapid drop from 300 % down to 40 % at 3700 ng of mCu where Ur,DIR-Cu was equal to Ur,GUM-Cu. At higher mCu values, Ur,DIR-Cu kept on slightly decreasing down to 20 %. The DQO of 25 % was met for mCu higher than 4500 ng. Ur,DIR-Cu completely depended on the bias. At lower mCu, better results were obtained for QMA filters than for PallFlex and Teflon filters. For QMA, Ur,GUM-Cu slightly decreased (from 32 to 27%) while Ur,DIR-Cu
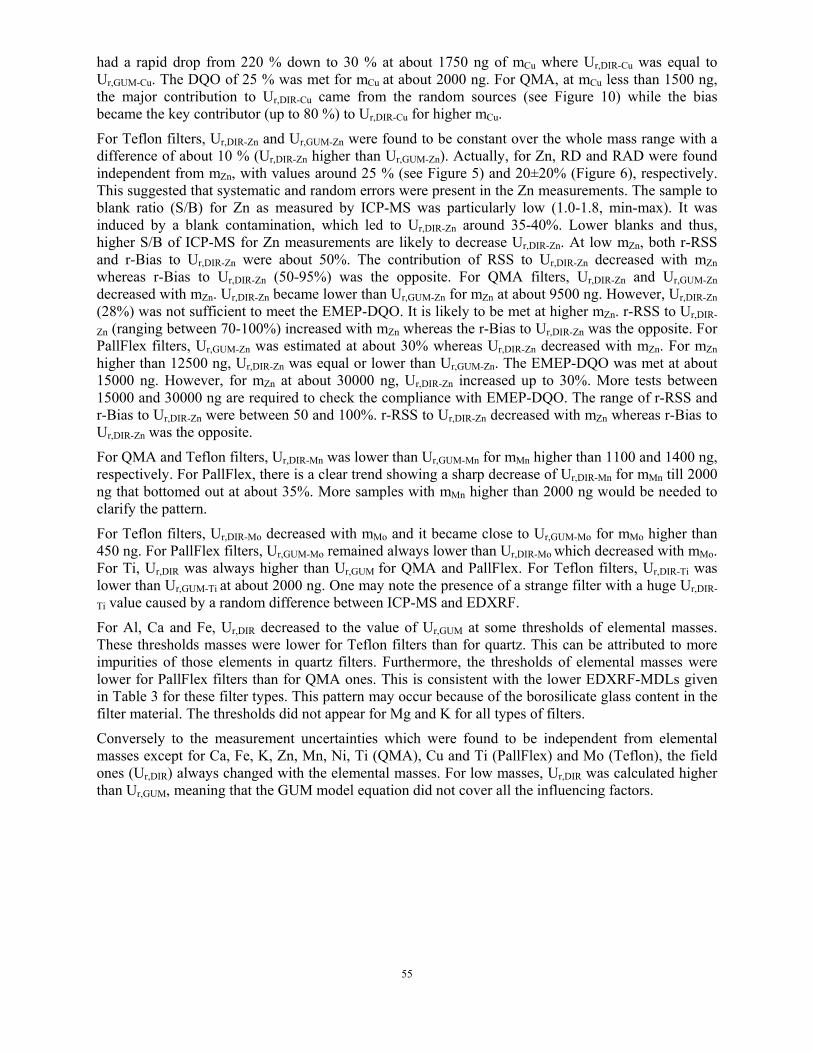
55
had a rapid drop from 220 % down to 30 % at about 1750 ng of mCu where Ur,DIR-Cu was equal to Ur,GUM-Cu. The DQO of 25 % was met for mCu at about 2000 ng. For QMA, at mCu less than 1500 ng, the major contribution to Ur,DIR-Cu came from the random sources (see Figure 10) while the bias became the key contributor (up to 80 %) to Ur,DIR-Cu for higher mCu.
For Teflon filters, Ur,DIR-Zn and Ur,GUM-Zn were found to be constant over the whole mass range with a difference of about 10 % (Ur,DIR-Zn higher than Ur,GUM-Zn). Actually, for Zn, RD and RAD were found independent from mZn, with values around 25 % (see Figure 5) and 20±20% (Figure 6), respectively. This suggested that systematic and random errors were present in the Zn measurements. The sample to blank ratio (S/B) for Zn as measured by ICP-MS was particularly low (1.0-1.8, min-max). It was induced by a blank contamination, which led to Ur,DIR-Zn around 35-40%. Lower blanks and thus, higher S/B of ICP-MS for Zn measurements are likely to decrease Ur,DIR-Zn. At low mZn, both r-RSS and r-Bias to Ur,DIR-Zn were about 50%. The contribution of RSS to Ur,DIR-Zn decreased with mZn whereas r-Bias to Ur,DIR-Zn (50-95%) was the opposite. For QMA filters, Ur,DIR-Zn and Ur,GUM-Zn decreased with mZn. Ur,DIR-Zn became lower than Ur,GUM-Zn for mZn at about 9500 ng. However, Ur,DIR-Zn (28%) was not sufficient to meet the EMEP-DQO. It is likely to be met at higher mZn. r-RSS to Ur,DIR-
Zn (ranging between 70-100%) increased with mZn whereas the r-Bias to Ur,DIR-Zn was the opposite. For PallFlex filters, Ur,GUM-Zn was estimated at about 30% whereas Ur,DIR-Zn decreased with mZn. For mZn higher than 12500 ng, Ur,DIR-Zn was equal or lower than Ur,GUM-Zn. The EMEP-DQO was met at about 15000 ng. However, for mZn at about 30000 ng, Ur,DIR-Zn increased up to 30%. More tests between 15000 and 30000 ng are required to check the compliance with EMEP-DQO. The range of r-RSS and r-Bias to Ur,DIR-Zn were between 50 and 100%. r-RSS to Ur,DIR-Zn decreased with mZn whereas r-Bias to Ur,DIR-Zn was the opposite.
For QMA and Teflon filters, Ur,DIR-Mn was lower than Ur,GUM-Mn for mMn higher than 1100 and 1400 ng, respectively. For PallFlex, there is a clear trend showing a sharp decrease of Ur,DIR-Mn for mMn till 2000 ng that bottomed out at about 35%. More samples with mMn higher than 2000 ng would be needed to clarify the pattern.
For Teflon filters, Ur,DIR-Mo decreased with mMo and it became close to Ur,GUM-Mo for mMo higher than 450 ng. For PallFlex filters, Ur,GUM-Mo remained always lower than Ur,DIR-Mo which decreased with mMo. For Ti, Ur,DIR was always higher than Ur,GUM for QMA and PallFlex. For Teflon filters, Ur,DIR-Ti was lower than Ur,GUM-Ti at about 2000 ng. One may note the presence of a strange filter with a huge Ur,DIR-
Ti value caused by a random difference between ICP-MS and EDXRF.
For Al, Ca and Fe, Ur,DIR decreased to the value of Ur,GUM at some thresholds of elemental masses. These thresholds masses were lower for Teflon filters than for quartz. This can be attributed to more impurities of those elements in quartz filters. Furthermore, the thresholds of elemental masses were lower for PallFlex filters than for QMA ones. This is consistent with the lower EDXRF-MDLs given in Table 3 for these filter types. This pattern may occur because of the borosilicate glass content in the filter material. The thresholds did not appear for Mg and K for all types of filters.
Conversely to the measurement uncertainties which were found to be independent from elemental masses except for Ca, Fe, K, Zn, Mn, Ni, Ti (QMA), Cu and Ti (PallFlex) and Mo (Teflon), the field ones (Ur,DIR) always changed with the elemental masses. For low masses, Ur,DIR was calculated higher than Ur,GUM, meaning that the GUM model equation did not cover all the influencing factors.
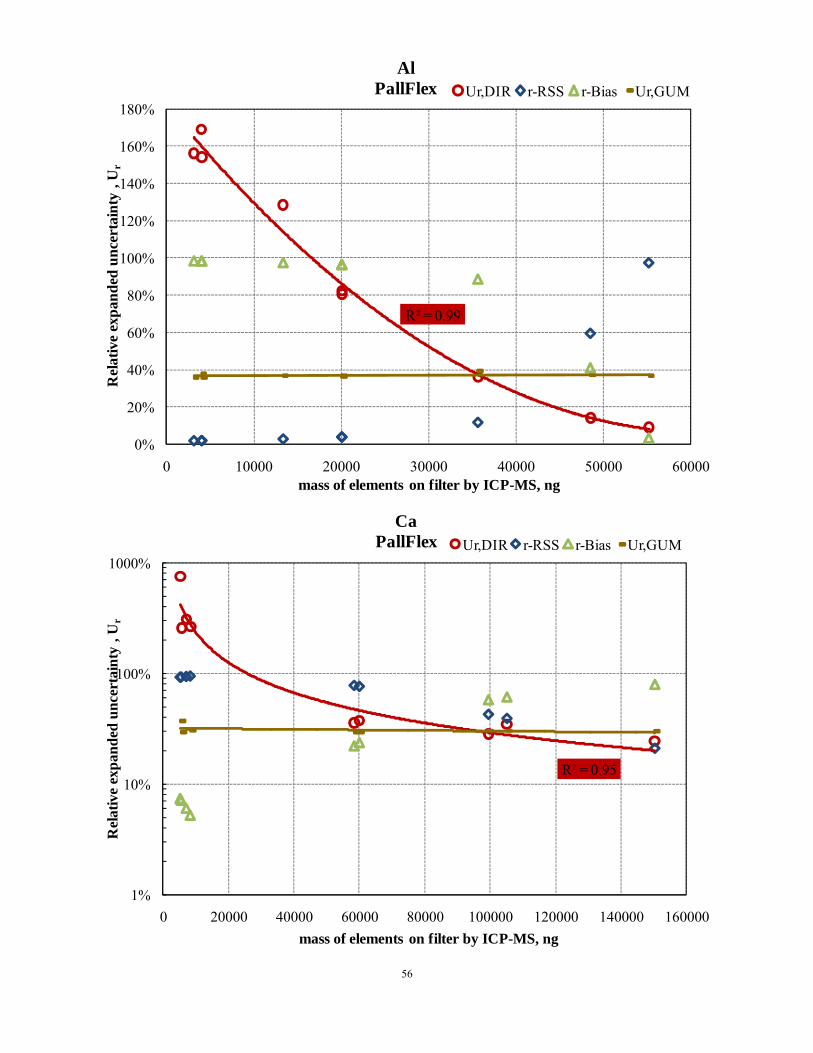
56
R² = 0.99
0%
20%
40%
60%
80%
100%
120%
140%
160%
180%
0 10000 20000 30000 40000 50000 60000
Rel
ativ
e ex
pand
ed u
ncer
tain
ty ,
Ur
mass of elements on filter by ICP-MS, ng
AlPallFlex Ur,DIR r-RSS r-Bias Ur,GUM
R² = 0.95
1%
10%
100%
1000%
0 20000 40000 60000 80000 100000 120000 140000 160000
Rel
ativ
e ex
pand
ed u
ncer
tain
ty ,
Ur
mass of elements on filter by ICP-MS, ng
CaPallFlex Ur,DIR r-RSS r-Bias Ur,GUM
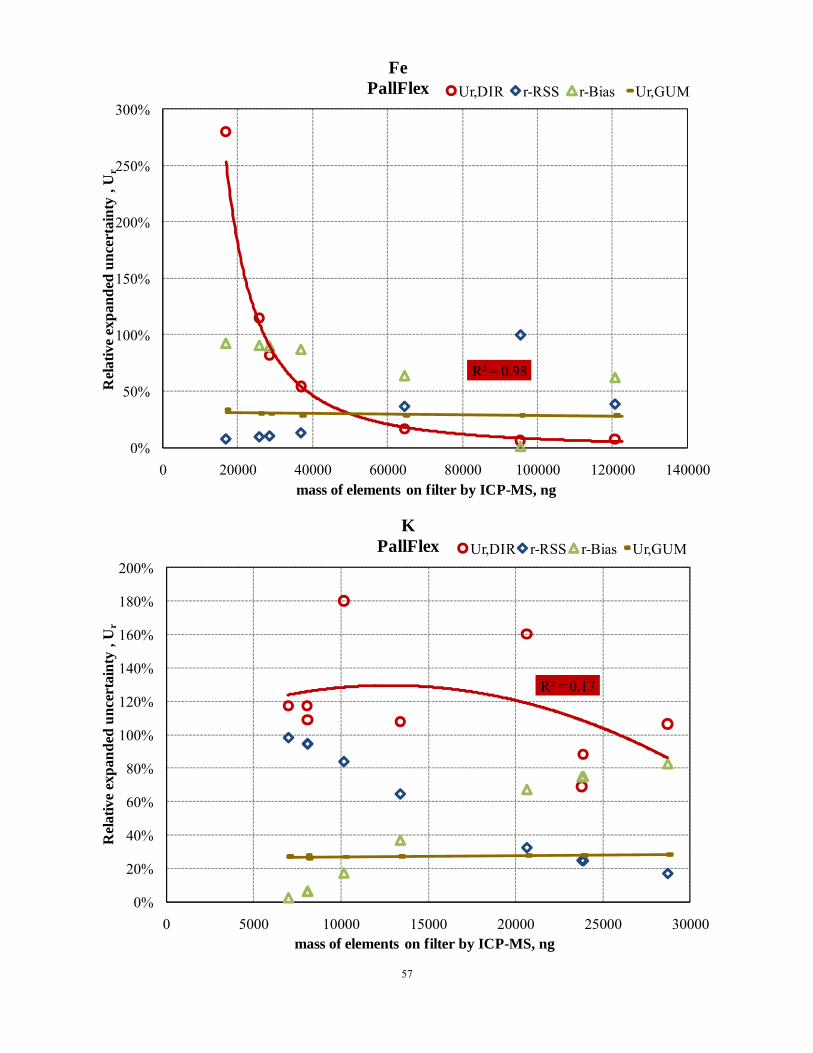
57
R² = 0.98
0%
50%
100%
150%
200%
250%
300%
0 20000 40000 60000 80000 100000 120000 140000
Rel
ativ
e ex
pand
ed u
ncer
tain
ty ,
Ur
mass of elements on filter by ICP-MS, ng
FePallFlex Ur,DIR r-RSS r-Bias Ur,GUM
R² = 0.17
0%
20%
40%
60%
80%
100%
120%
140%
160%
180%
200%
0 5000 10000 15000 20000 25000 30000
Rel
ativ
e ex
pand
ed u
ncer
tain
ty ,
Ur
mass of elements on filter by ICP-MS, ng
KPallFlex Ur,DIR r-RSS r-Bias Ur,GUM
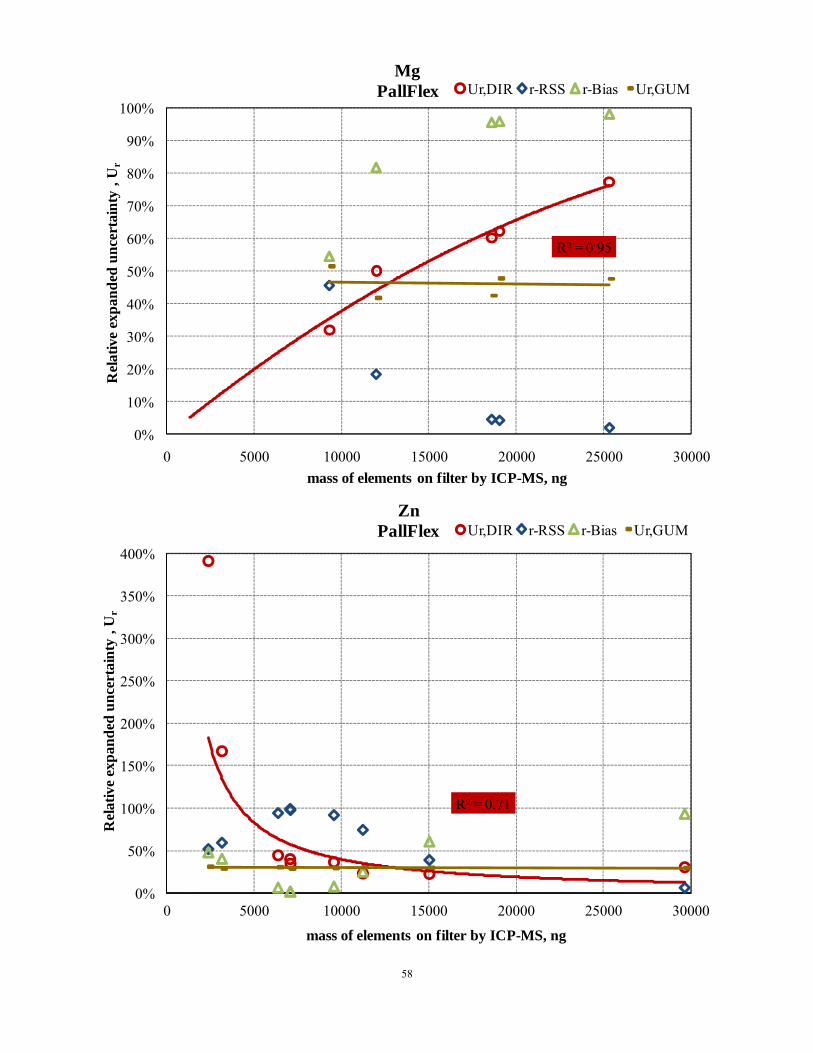
58
R² = 0.95
0%
10%
20%
30%
40%
50%
60%
70%
80%
90%
100%
0 5000 10000 15000 20000 25000 30000
Rel
ativ
e ex
pand
ed u
ncer
tain
ty ,
Ur
mass of elements on filter by ICP-MS, ng
MgPallFlex Ur,DIR r-RSS r-Bias Ur,GUM
R² = 0.71
0%
50%
100%
150%
200%
250%
300%
350%
400%
0 5000 10000 15000 20000 25000 30000
Rel
ativ
e ex
pand
ed u
ncer
tain
ty ,
Ur
mass of elements on filter by ICP-MS, ng
ZnPallFlex Ur,DIR r-RSS r-Bias Ur,GUM
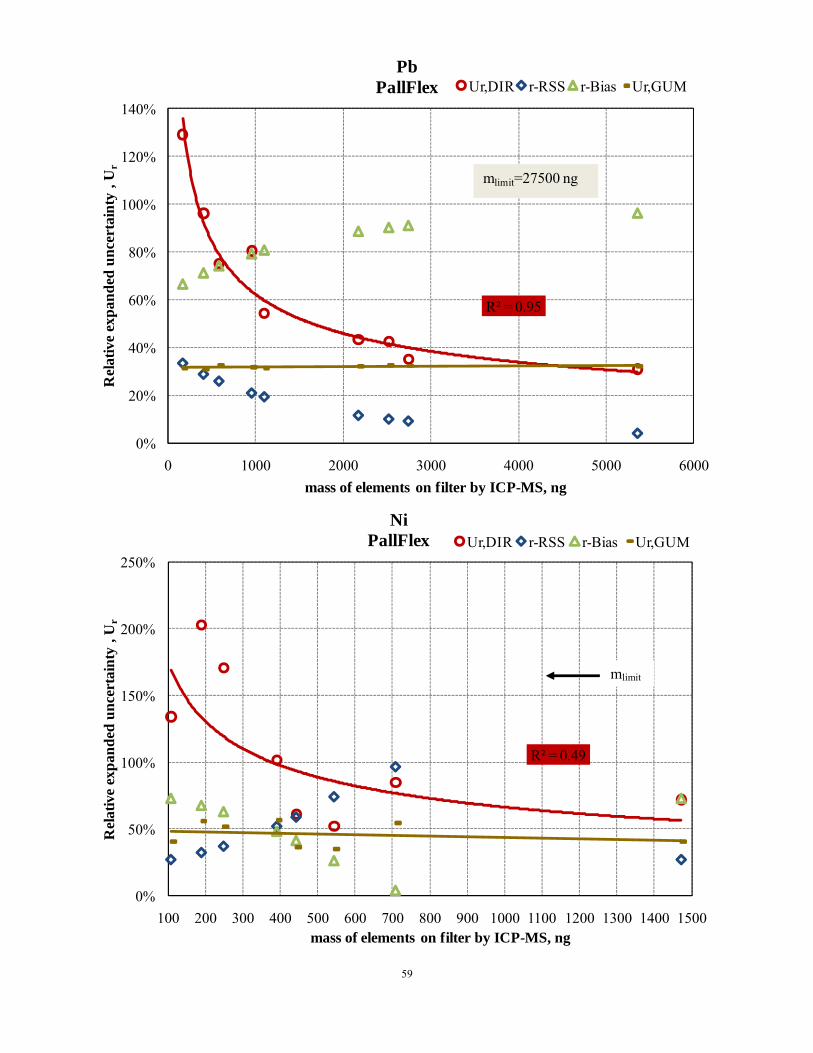
59
R² = 0.95
0%
20%
40%
60%
80%
100%
120%
140%
0 1000 2000 3000 4000 5000 6000
Rel
ativ
e ex
pand
ed u
ncer
tain
ty ,
Ur
mass of elements on filter by ICP-MS, ng
PbPallFlex Ur,DIR r-RSS r-Bias Ur,GUM
mlimit=27500 ng
R² = 0.49
0%
50%
100%
150%
200%
250%
100 200 300 400 500 600 700 800 900 1000 1100 1200 1300 1400 1500
Rel
ativ
e ex
pand
ed u
ncer
tain
ty ,
Ur
mass of elements on filter by ICP-MS, ng
NiPallFlex Ur,DIR r-RSS r-Bias Ur,GUM
mlimit
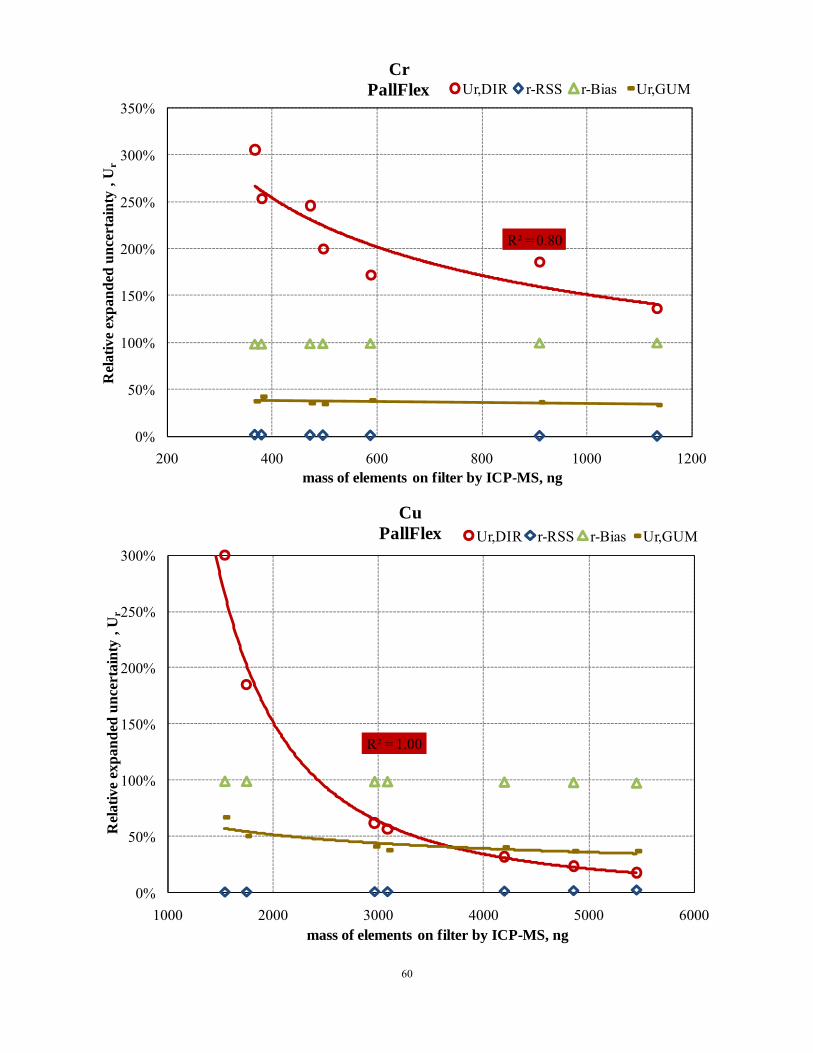
60
R² = 0.80
0%
50%
100%
150%
200%
250%
300%
350%
200 400 600 800 1000 1200
Rel
ativ
e ex
pand
ed u
ncer
tain
ty ,
Ur
mass of elements on filter by ICP-MS, ng
CrPallFlex Ur,DIR r-RSS r-Bias Ur,GUM
R² = 1.00
0%
50%
100%
150%
200%
250%
300%
1000 2000 3000 4000 5000 6000
Rel
ativ
e ex
pand
ed u
ncer
tain
ty ,
Ur
mass of elements on filter by ICP-MS, ng
CuPallFlex Ur,DIR r-RSS r-Bias Ur,GUM

61
R² = 0.93
0%
50%
100%
150%
200%
250%
0 1000 2000 3000 4000 5000 6000
Rel
ativ
e ex
pand
ed u
ncer
tain
ty ,
Ur
mass of elements on filter by ICP-MS, ng
MnPallFlex Ur,DIR r-RSS r-Bias Ur,GUM
R² = 0.88
0%
20%
40%
60%
80%
100%
2400 2600 2800 3000 3200 3400
Rel
ativ
e ex
pand
ed u
ncer
tain
ty ,
Ur
mass of elements on filter by ICP-MS, ng
MoPallFlex Ur,DIR r-RSS r-Bias Ur,GUM
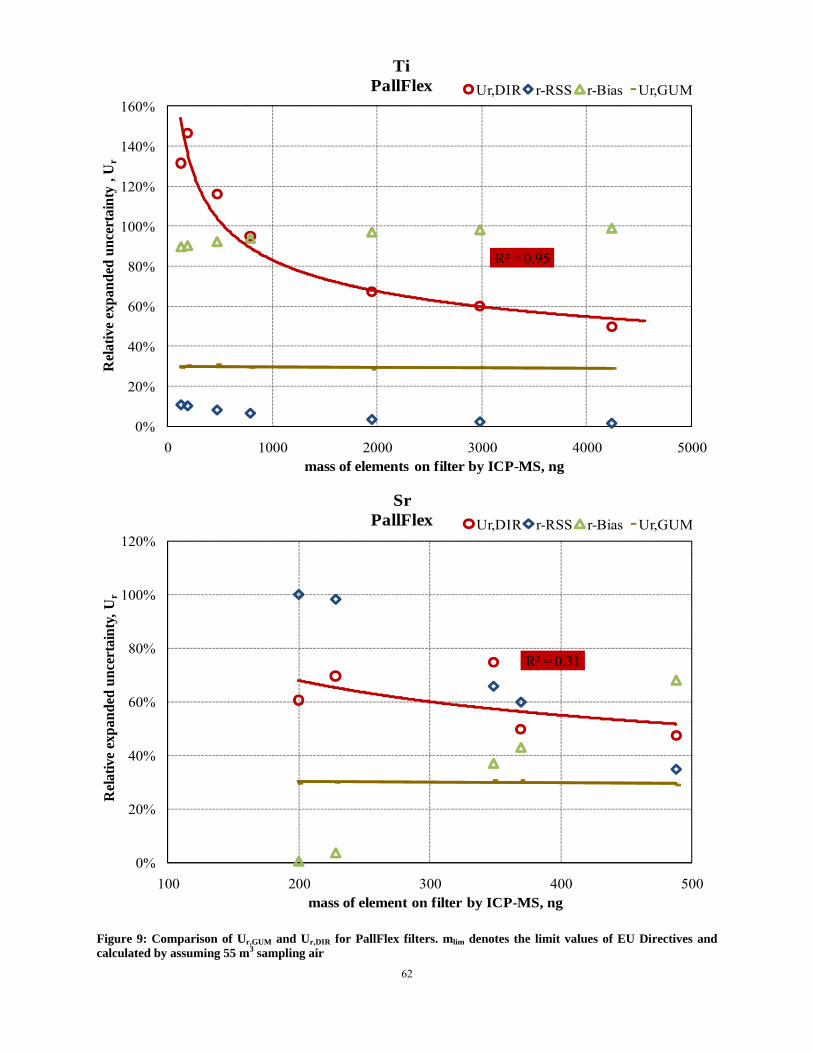
62
R² = 0.95
0%
20%
40%
60%
80%
100%
120%
140%
160%
0 1000 2000 3000 4000 5000
Rel
ativ
e ex
pand
ed u
ncer
tain
ty ,
Ur
mass of elements on filter by ICP-MS, ng
TiPallFlex Ur,DIR r-RSS r-Bias Ur,GUM
R² = 0.31
0%
20%
40%
60%
80%
100%
120%
100 200 300 400 500
Rel
ativ
e ex
pand
ed u
ncer
tain
ty, U
r
mass of element on filter by ICP-MS, ng
SrPallFlex Ur,DIR r-RSS r-Bias Ur,GUM
Figure 9: Comparison of Ur,GUM and Ur,DIR for PallFlex filters. mlim denotes the limit values of EU Directives and calculated by assuming 55 m3 sampling air

63
R² = 0.84
0%
20%
40%
60%
80%
100%
120%
10000 20000 30000 40000 50000
Rel
ativ
e ex
pand
ed u
ncer
tain
ty ,
Ur
mass of elements on filter by ICP-MS, ng
AlQMA Ur,DIR r-RSS r-Bias Ur,GUM
R² = 0.96
0%
20%
40%
60%
80%
100%
120%
0 20000 40000 60000 80000 100000 120000 140000 160000 180000
Rel
ativ
e ex
pand
ed u
ncer
tain
ty ,
Ur
mass of elements on filter by ICP-MS, ng
CaQMA Ur,DIR r-RSS r-Bias Ur,GUM

64
R² = 0.91
0%
50%
100%
150%
200%
250%
300%
0 50000 100000 150000 200000 250000 300000 350000
Rel
ativ
e ex
pand
ed u
ncer
tain
ty ,
Ur
mass of elements on filter by ICP-MS, ng
FeQMA Ur,DIR r-RSS r-Bias Ur,GUM
R² = 0.84
0%
20%
40%
60%
80%
100%
120%
0 5000 10000 15000 20000 25000 30000 35000 40000
Rel
ativ
e ex
pand
ed u
ncer
tain
ty ,
Ur
mass of elements on filter by ICP-MS, ng
KQMA Ur,DIR r-RSS r-Bias Ur,GUM
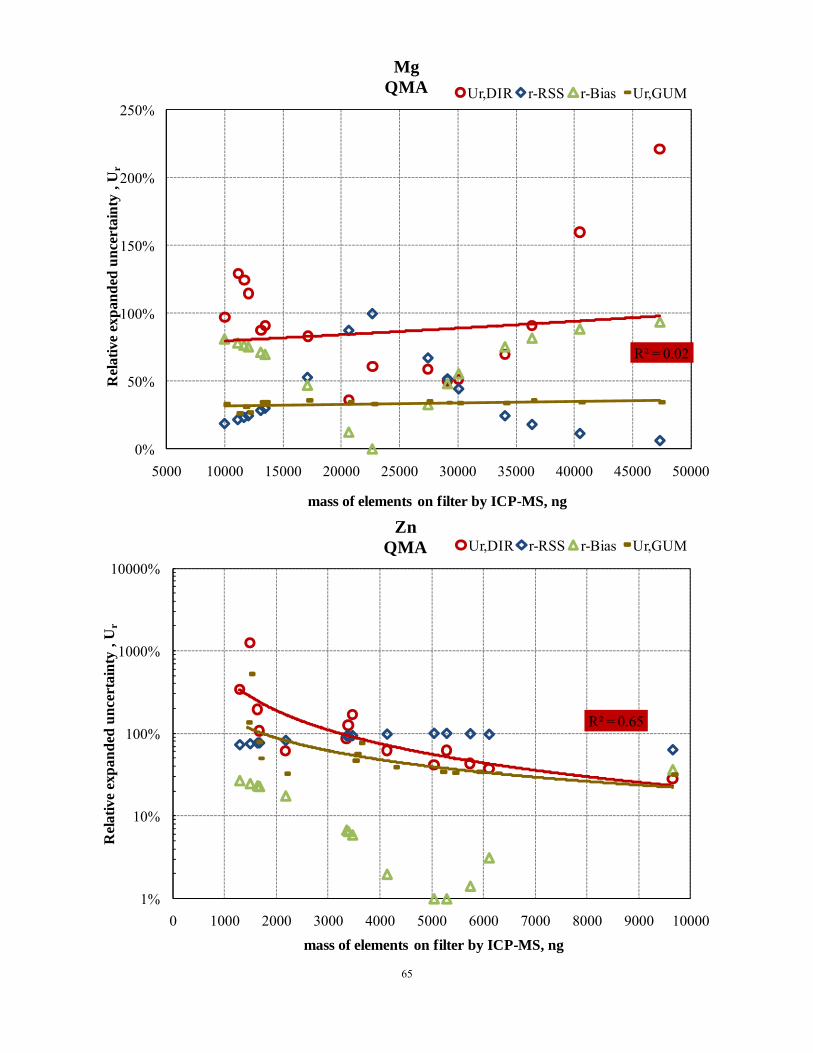
65
R² = 0.02
0%
50%
100%
150%
200%
250%
5000 10000 15000 20000 25000 30000 35000 40000 45000 50000
Rel
ativ
e ex
pand
ed u
ncer
tain
ty ,
Ur
mass of elements on filter by ICP-MS, ng
MgQMA Ur,DIR r-RSS r-Bias Ur,GUM
R² = 0.65
1%
10%
100%
1000%
10000%
0 1000 2000 3000 4000 5000 6000 7000 8000 9000 10000
Rel
ativ
e ex
pand
ed u
ncer
tain
ty ,
Ur
mass of elements on filter by ICP-MS, ng
ZnQMA Ur,DIR r-RSS r-Bias Ur,GUM
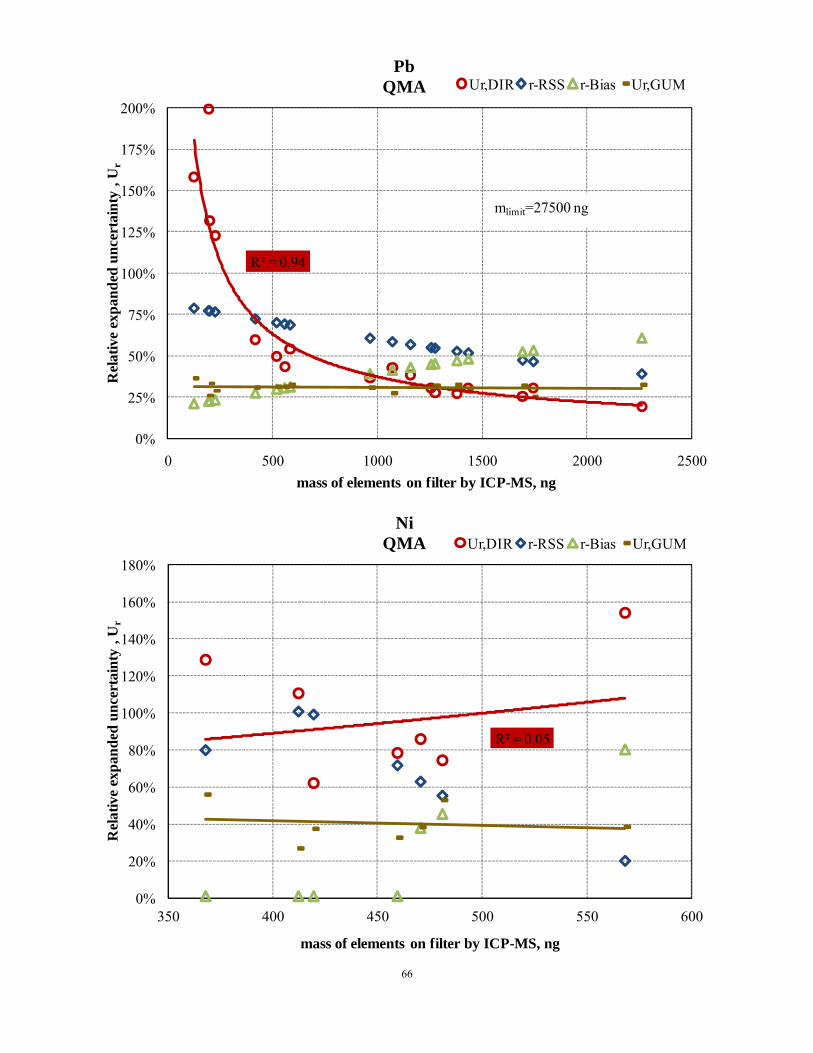
66
R² = 0.94
0%
25%
50%
75%
100%
125%
150%
175%
200%
0 500 1000 1500 2000 2500
Rel
ativ
e ex
pand
ed u
ncer
tain
ty ,
Ur
mass of elements on filter by ICP-MS, ng
PbQMA Ur,DIR r-RSS r-Bias Ur,GUM
mlimit=27500 ng
R² = 0.05
0%
20%
40%
60%
80%
100%
120%
140%
160%
180%
350 400 450 500 550 600
Rel
ativ
e ex
pand
ed u
ncer
tain
ty ,
Ur
mass of elements on filter by ICP-MS, ng
NiQMA Ur,DIR r-RSS r-Bias Ur,GUM

67
R² = 0.73
0%
20%
40%
60%
80%
100%
120%
100 200 300 400 500 600
Rel
ativ
e ex
pand
ed u
ncer
tain
ty ,
Ur
mass of elements on filter by ICP-MS, ng
CrQMA Ur,DIR r-RSS r-Bias Ur,GUM
R² = 0.88
0%
50%
100%
150%
200%
250%
0 500 1000 1500 2000 2500 3000
Rel
ativ
e ex
pand
ed u
ncer
tain
ty ,
Ur
mass of elements on filter by ICP-MS, ng
CuQMA Ur,DIR r-RSS r-Bias Ur,GUM
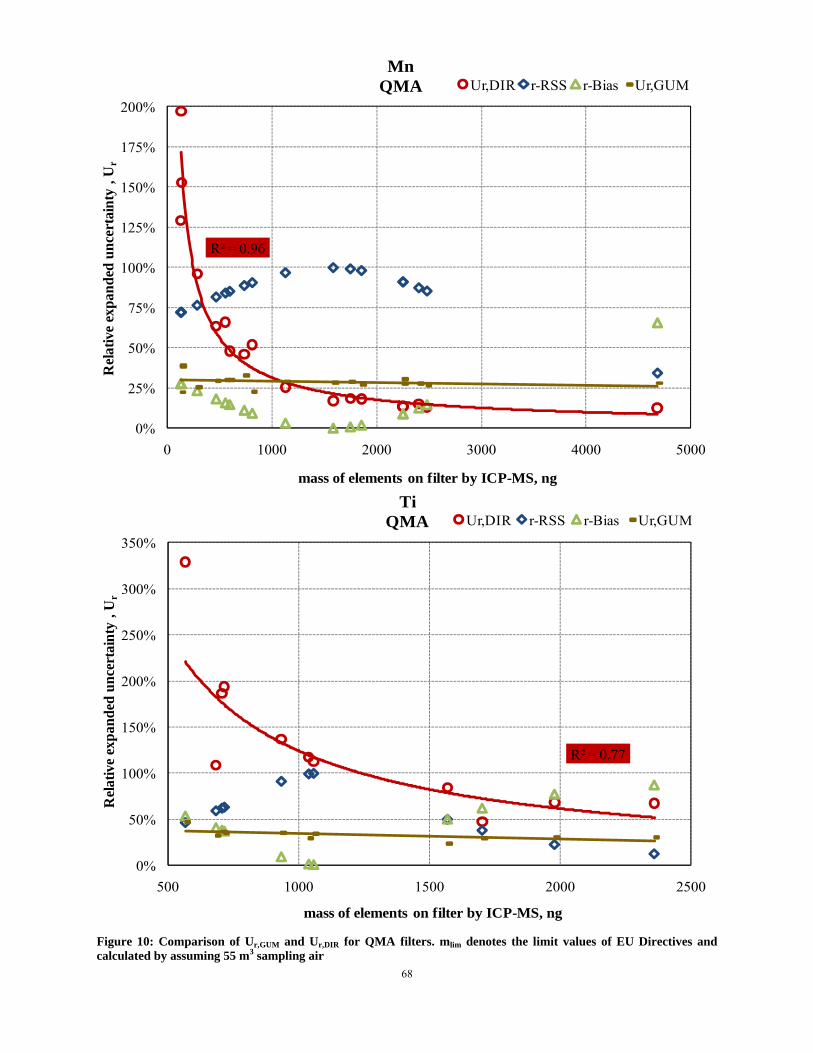
68
R² = 0.96
0%
25%
50%
75%
100%
125%
150%
175%
200%
0 1000 2000 3000 4000 5000
Rel
ativ
e ex
pand
ed u
ncer
tain
ty ,
Ur
mass of elements on filter by ICP-MS, ng
MnQMA Ur,DIR r-RSS r-Bias Ur,GUM
R² = 0.77
0%
50%
100%
150%
200%
250%
300%
350%
500 1000 1500 2000 2500
Rel
ativ
e ex
pand
ed u
ncer
tain
ty ,
Ur
mass of elements on filter by ICP-MS, ng
TiQMA Ur,DIR r-RSS r-Bias Ur,GUM
Figure 10: Comparison of Ur,GUM and Ur,DIR for QMA filters. mlim denotes the limit values of EU Directives and calculated by assuming 55 m3 sampling air
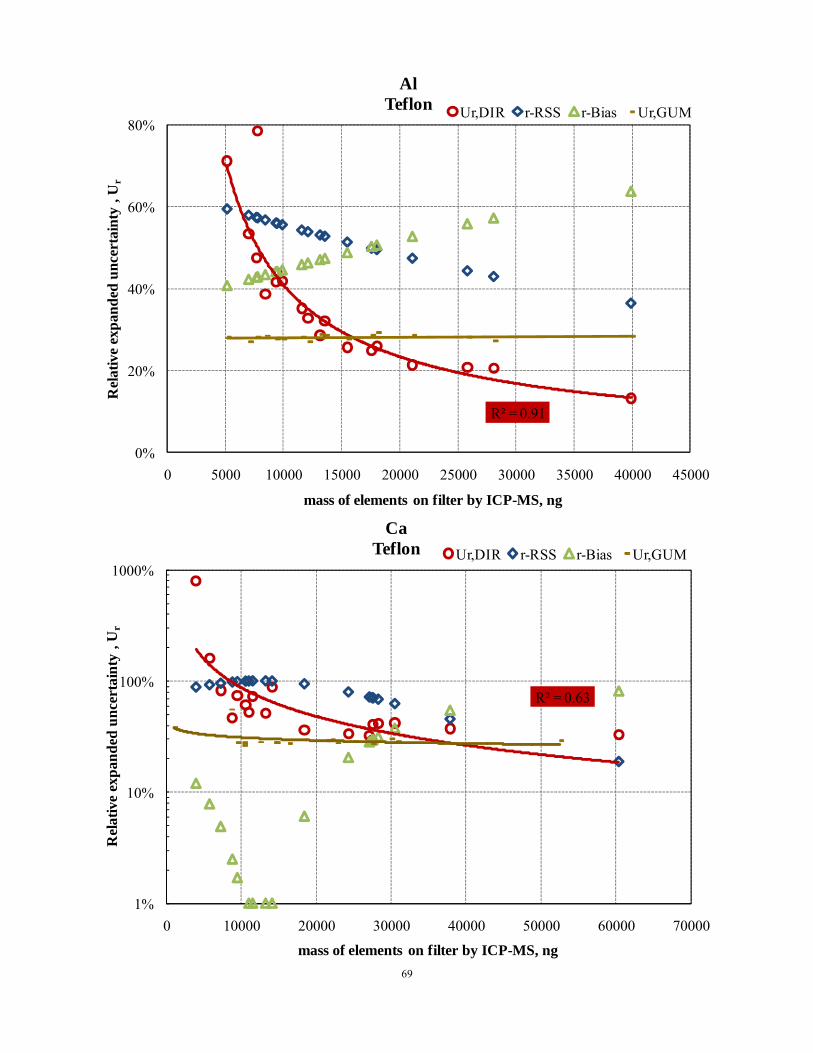
69
R² = 0.91
0%
20%
40%
60%
80%
0 5000 10000 15000 20000 25000 30000 35000 40000 45000
Rel
ativ
e ex
pand
ed u
ncer
tain
ty ,
Ur
mass of elements on filter by ICP-MS, ng
AlTeflon Ur,DIR r-RSS r-Bias Ur,GUM
R² = 0.63
1%
10%
100%
1000%
0 10000 20000 30000 40000 50000 60000 70000
Rel
ativ
e ex
pand
ed u
ncer
tain
ty ,
Ur
mass of elements on filter by ICP-MS, ng
CaTeflon Ur,DIR r-RSS r-Bias Ur,GUM
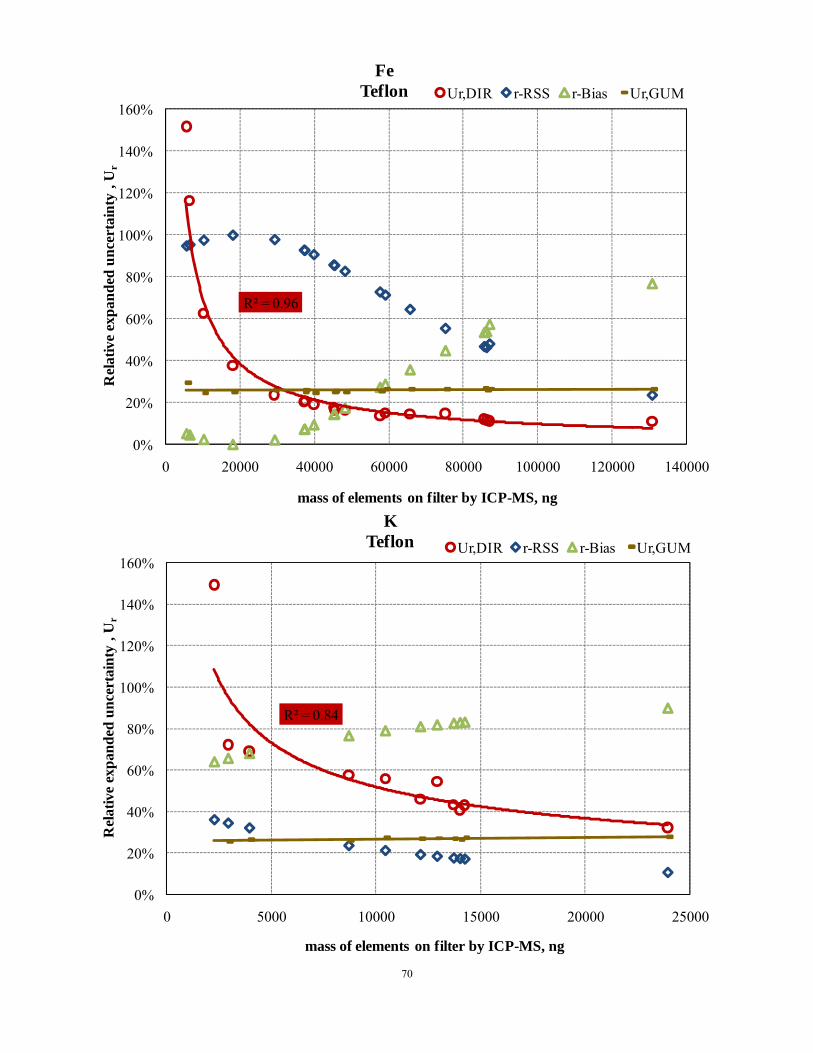
70
R² = 0.96
0%
20%
40%
60%
80%
100%
120%
140%
160%
0 20000 40000 60000 80000 100000 120000 140000
Rel
ativ
e ex
pand
ed u
ncer
tain
ty ,
Ur
mass of elements on filter by ICP-MS, ng
FeTeflon Ur,DIR r-RSS r-Bias Ur,GUM
R² = 0.84
0%
20%
40%
60%
80%
100%
120%
140%
160%
0 5000 10000 15000 20000 25000
Rel
ativ
e ex
pand
ed u
ncer
tain
ty ,
Ur
mass of elements on filter by ICP-MS, ng
KTeflon Ur,DIR r-RSS r-Bias Ur,GUM
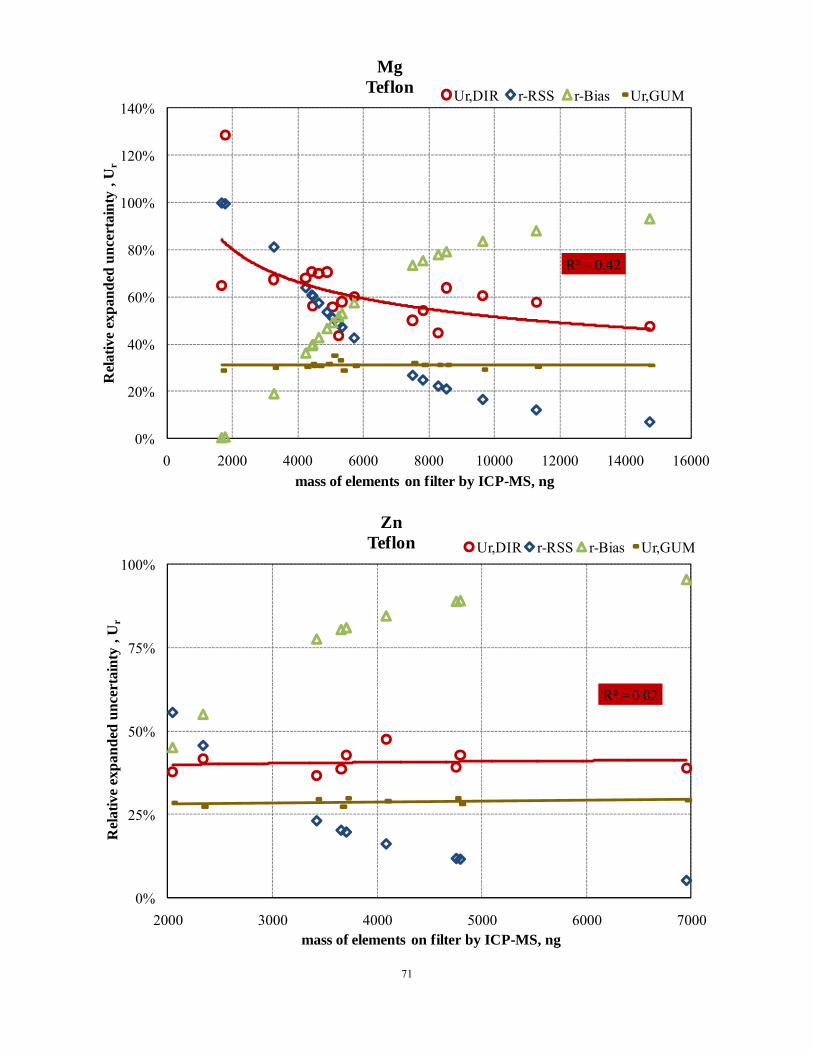
71
R² = 0.42
0%
20%
40%
60%
80%
100%
120%
140%
0 2000 4000 6000 8000 10000 12000 14000 16000
Rel
ativ
e ex
pand
ed u
ncer
tain
ty ,
Ur
mass of elements on filter by ICP-MS, ng
MgTeflon Ur,DIR r-RSS r-Bias Ur,GUM
R² = 0.02
0%
25%
50%
75%
100%
2000 3000 4000 5000 6000 7000
Rel
ativ
e ex
pand
ed u
ncer
tain
ty ,
Ur
mass of elements on filter by ICP-MS, ng
ZnTeflon Ur,DIR r-RSS r-Bias Ur,GUM
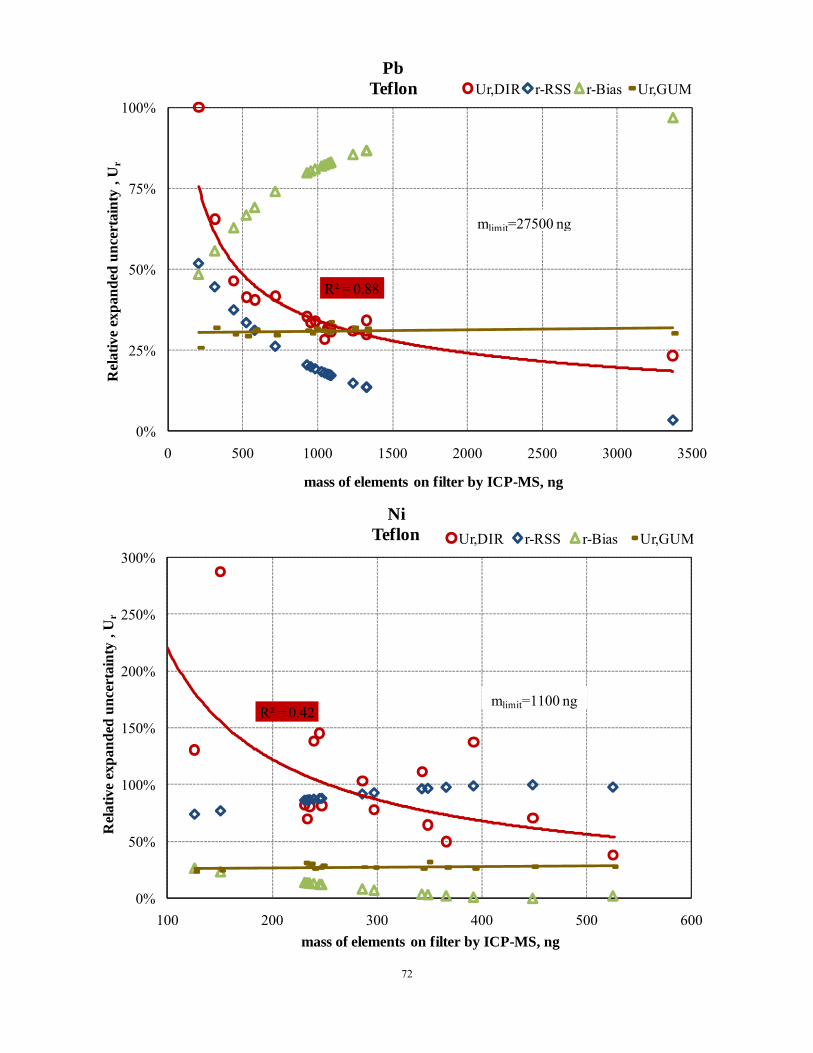
72
R² = 0.88
0%
25%
50%
75%
100%
0 500 1000 1500 2000 2500 3000 3500
Rel
ativ
e ex
pand
ed u
ncer
tain
ty ,
Ur
mass of elements on filter by ICP-MS, ng
PbTeflon Ur,DIR r-RSS r-Bias Ur,GUM
mlimit=27500 ng
R² = 0.42
0%
50%
100%
150%
200%
250%
300%
100 200 300 400 500 600
Rel
ativ
e ex
pand
ed u
ncer
tain
ty ,
Ur
mass of elements on filter by ICP-MS, ng
NiTeflon Ur,DIR r-RSS r-Bias Ur,GUM
mlimit=1100 ng
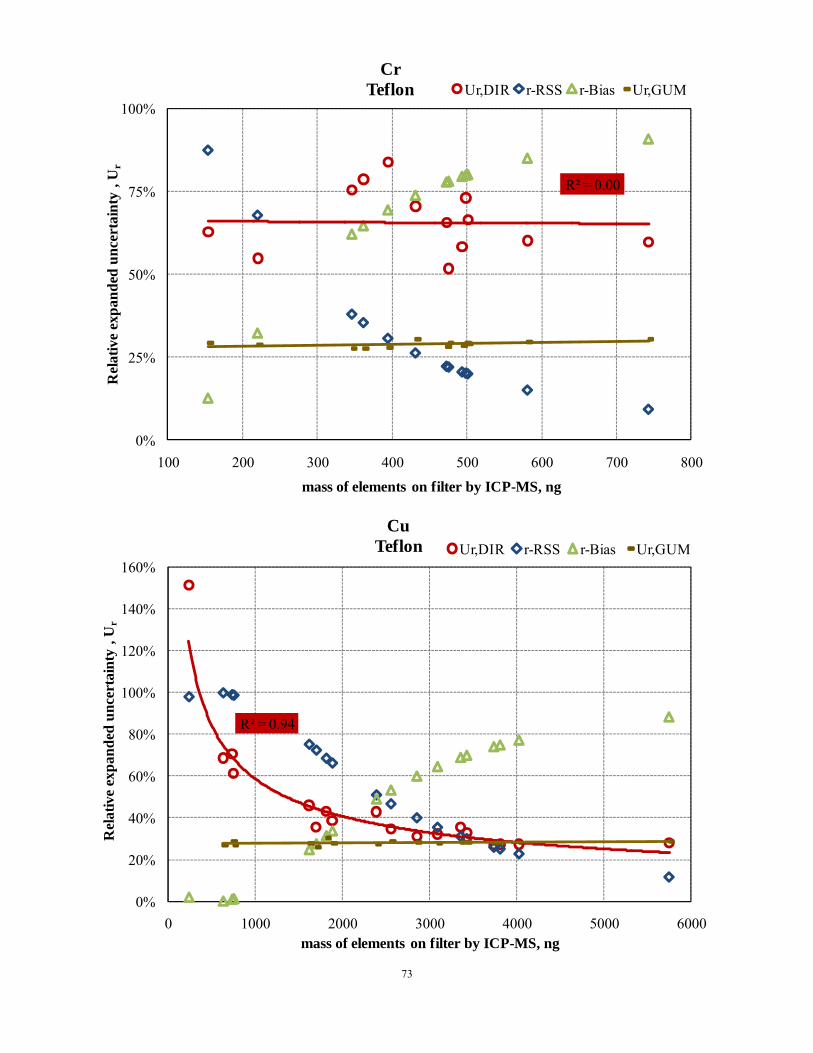
73
R² = 0.00
0%
25%
50%
75%
100%
100 200 300 400 500 600 700 800
Rel
ativ
e ex
pand
ed u
ncer
tain
ty ,
Ur
mass of elements on filter by ICP-MS, ng
CrTeflon Ur,DIR r-RSS r-Bias Ur,GUM
R² = 0.94
0%
20%
40%
60%
80%
100%
120%
140%
160%
0 1000 2000 3000 4000 5000 6000
Rel
ativ
e ex
pand
ed u
ncer
tain
ty ,
Ur
mass of elements on filter by ICP-MS, ng
CuTeflon Ur,DIR r-RSS r-Bias Ur,GUM
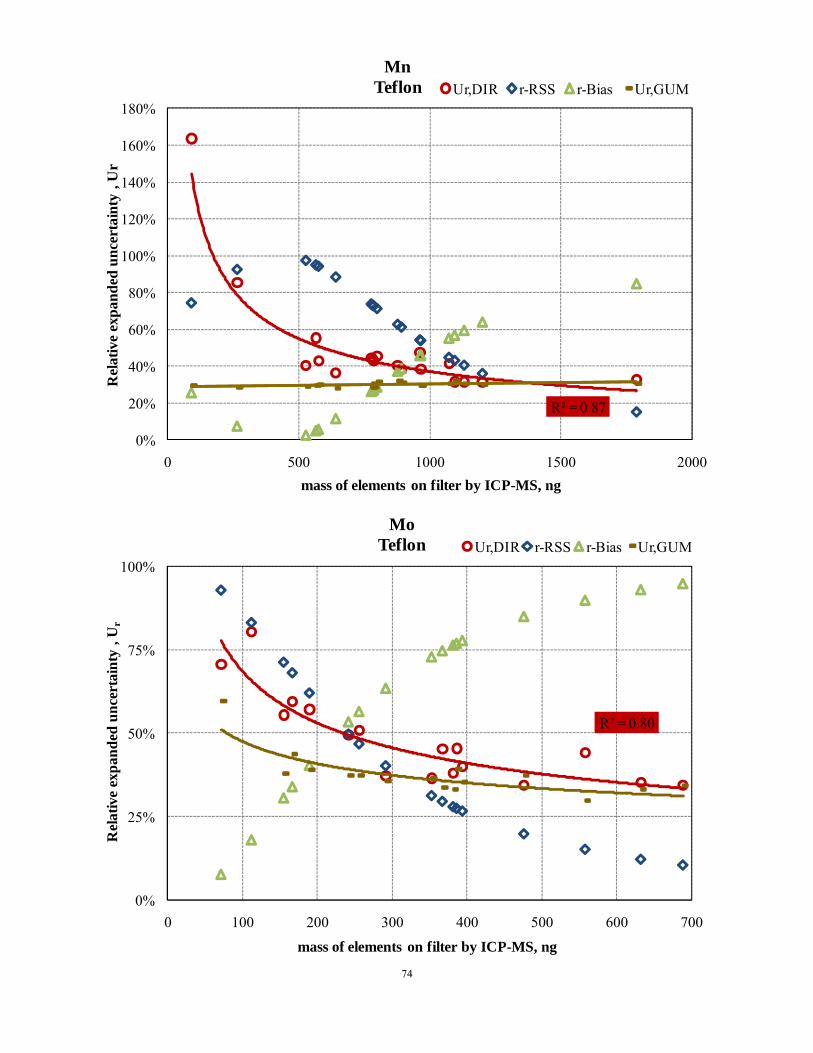
74
R² = 0.87
0%
20%
40%
60%
80%
100%
120%
140%
160%
180%
0 500 1000 1500 2000
Rel
ativ
e ex
pand
ed u
ncer
tain
ty ,
Ur
mass of elements on filter by ICP-MS, ng
MnTeflon Ur,DIR r-RSS r-Bias Ur,GUM
R² = 0.80
0%
25%
50%
75%
100%
0 100 200 300 400 500 600 700
Rel
ativ
e ex
pand
ed u
ncer
tain
ty ,
Ur
mass of elements on filter by ICP-MS, ng
MoTeflon Ur,DIR r-RSS r-Bias Ur,GUM
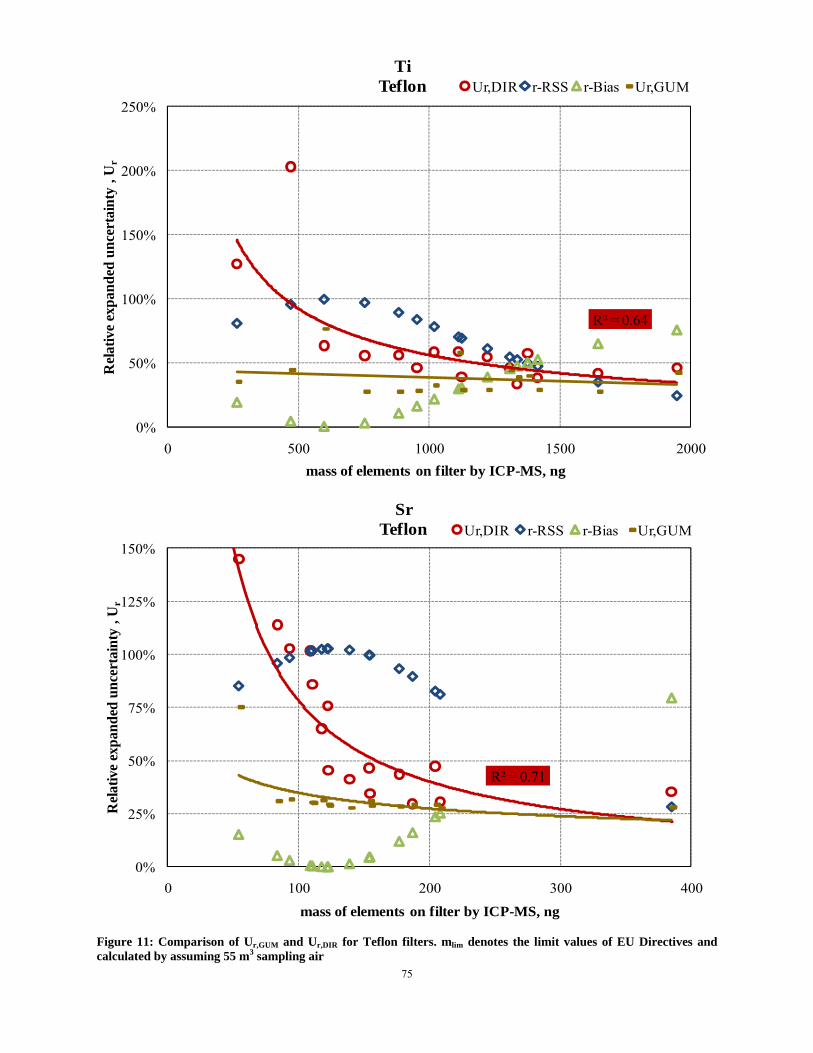
75
R² = 0.64
0%
50%
100%
150%
200%
250%
0 500 1000 1500 2000
Rel
ativ
e ex
pand
ed u
ncer
tain
ty ,
Ur
mass of elements on filter by ICP-MS, ng
TiTeflon Ur,DIR r-RSS r-Bias Ur,GUM
R² = 0.71
0%
25%
50%
75%
100%
125%
150%
0 100 200 300 400
Rel
ativ
e ex
pand
ed u
ncer
tain
ty ,
Ur
mass of elements on filter by ICP-MS, ng
SrTeflon Ur,DIR r-RSS r-Bias Ur,GUM
Figure 11: Comparison of Ur,GUM and Ur,DIR for Teflon filters. mlim denotes the limit values of EU Directives and calculated by assuming 55 m3 sampling air
4 Conclusion 1) The linear calibration of EDXRF using loaded filters were found to be site and filter
independent for Pb, Mn, Fe, Cu, Ti and Zn. Ca was found to be site independent, but, filter type dependent. For QMA filters, the site effect was evidenced for K, As, Ni, Ti, and V. Teflon filters are more appropriate than QMA filters to analyze elements by EDXRF. For Teflon filters, the linear calibration gave reasonably good results if calibration filters came from a similar site. However, high deviations from certified values of the NIST 2783 appeared by linear calibration for Teflon filters, which can be attributed to different PM composition, filter material or PM cut-off. The standardless EDXRF analysis was found to be more efficient than linear calibration for the quantification of trace elements. This calibration method is filter type and sampling site independent. For Teflon filters, the standardless EDXRF analysis showed better results than linear calibration except for As, Co and V. For QMA filters, the standardless EDXRF analysis showed better results than linear calibration except for Cr and V. Cd, Sn and Sb could not be analyzed, neither by the standardless EDXRF analysis nor the linear calibration in the studied samples. The linear calibration with loaded filters can be used to analyze filters collected in the same/similar sites for Teflon filters.
2) According to the evaluated detection limits, the standardless EDXRF analysis has been found capable to determine Ni and Pb, but not Cd and As, at concentrations close to the Limit Values of EU Directives (2004, 2008). Furthermore, the Teflon filters were found to have lower detection limits than quartz ones, probably resulting from less impurities and smoother filter surface.
3) The agreement between ICP-MS and standardless EDXRF results for Teflon filters were found to be higher than for quartz ones. The differences between standardless EDXRF values and ICP-MS values are lower for Teflon filters than for quartz filters. This result supports the previous finding. Conversely to linear calibration, As, V and Co could not be analyzed by standardless EDXRF analysis.
4) The GUM measurement uncertainties of standardless EDXRF analysis were found independent of elemental mass, generally around 30%. Net intensity, Inet, was identified as one of the major contributors, with higher contribution at low concentrations. The background contribution to Inet was higher than intensity of element, I. At very low concentrations, the contribution of Inet increased because of worsened repeatability of I. The ratio of counts to mass of element was found to be one of the main contributors (12%). The excited area, A, deposited area, Ad, and PM mass on filter, mPM, were found to be important contributors. However, these parameters also had negative contribution coming from the correlations between A and mPM and between Ad and mPM. The GUM uncertainties of Teflon filters were the lowest among all filters.
5) The field uncertainties of standardless EDXRF analysis decreased with elemental masses. Mass threshold for which GUM and field uncertainties were equal could be found for all elements except Cr, K, Mg for all types of filter and Ti for quartz filters. The elemental mass thresholds were lower for Teflon filters than for quartz ones. At higher elemental masses than these thresholds, the proposed model equation for estimating GUM uncertainty has demonstrated its validity and be used for whatever future filter analysis.
6) The DQO of the EU Directive for Pb was met for all types of filter even at lower concentrations (23 ng/m3) than the Limit Value. Only for Teflon, field uncertainty for Ni is likely to comply with the DQO. However, more tests need to be performed at concentration close to the Limit Value to confirm the result of this study. For As, the best results can be achieved by analyzing Teflon filter if using with linear calibration. The resulting relative expanded uncertainty was 45 % at lower concentration (1 ng/m3) than the Limit Value. It is likely that at the Limit Value the DQO can be met for As. Cd could not be quantified most probably due to low concentrations, and further tests at the Limit Value are required. The
77
EMEP DQO was met for Cu (82 ng/m3 for Teflon) and Zn (273 ng/m3 for quartz filter), but, not for Cr.
As the overall result of this study, EDXRF can be considered as an alternative method to ICP-MS for measurements of PM-bound elements, particularly on Teflon filters. The European legislative requirements of Pb could be met for whatever filters type. The European legislative requirements of Ni and As are likely be met, but, it is unknown for Cd. The EMEP requirements can be met for Cu and Zn, but not for Cr. EDXRF can also be used to measure elements for source apportionment purposes. Calibrating the instrument by certified matrix matched standards on filter could produce better results, particularly for As, V and Co, even at low concentrations.

78
Acknowledgements The authors want to thank:
- Will de Jongh of Thermo Fisher for its wide knowledge of XRF theory and his willingness to update the Uniquant software to the requirements of PM filter analysis,
- Lorenza Emblico (JRC-ITU) and Luisa Marelli (JRC-IE) for the sampling of PM10 at Port Talbot in the United Kingdom and at Bergamo in Italy.
European Commission
EUR 24983 EN – Joint Research Centre – Institute for Environment and Sustainability
Title: Evaluation of EDXRF for the Determination of Elements in PM10 Filters
Author(s): S. Yatkin, M. Gerboles, A. Borowiak, G. Tanet, V. Pedroni, R. Passarella and F. Lagler
Luxembourg: Publications Office of the European Union
2011 – 78 pp. – 29,7 x 21,0 cm
EUR – Scientific and Technical Research series – ISSN 1831-9424 (Online) ISSN 1018-5593 (Print)
ISBN 978-92-79-21641-1
doi:10.2788/87284
Abstract
Energy Dispersive X-ray Fluorescence (EDXRF) was compared to Inductively Coupled Plasma Mass Spectrometer (ICP-MS) for the measurements of elements in particulate matter (PM10). Lead (Pb), arsenic (As), nickel (Ni) and cadmium (Cd)) and the ones included in the EMEP programme, namely copper, chromium and zinc were tested. Other elements such as magnesium, aluminium, silicon, sulphur, chloride, potassium, calcium, titanium, vanadium, iron, cobalt, manganese, bromide, strontium, molybdenum, tin and antimony, which are essential for source apportionment studies, were also tested. PM10 samples collected at different sites on several types of filter were analyzed using both EDXRF and ICP-MS. As the overall result of this study, EDXRF can be considered as an alternative method to ICP-MS for measurements of PM-bound elements, particularly on Teflon filters. The European legislative requirements of Pb could be met for whatever filters type. The European legislative requirements of Ni and As are likely be met, but, it is unknown for Cd. The EMEP requirements can be met for Cu and Zn, but not for Cr. EDXRF can also be used to measure elements for source apportionment purposes.

How to obtain EU publications
Our priced publications are available from EU Bookshop (http://bookshop.europa.eu), where you can place an order with the sales agent of your choice.
The Publications Office has a worldwide network of sales agents. You can obtain their contact details by sending a fax to (352) 29 29-42758.
The mission of the JRC is to provide customer-driven scientific and technical supportfor the conception, development, implementation and monitoring of EU policies. As aservice of the European Commission, the JRC functions as a reference centre ofscience and technology for the Union. Close to the policy-making process, it serves the common interest of the Member States, while being independent of specialinterests, whether private or national.
LB-N
A-24983-EN
-N
Related Documents