open access SciTz Dentistry: Research & Therapy Received: October 31, 2017 Accepted: November 21, 2017 Published: November 29, 2017 *CORRESPONDING AUTHOR: Suresh Sajjan, Department of Prosthodontics, Vishnu Dental College, Bhimavaram, 534202, India, Email: [email protected] KEYWORDS Occlusion time; Disocclusion time; Complete denture; T- Scan. CITATION Santhosh Yanda and Suresh Sajjan*. (2017) Evaluation of Changes in Occlusal Force Distribution and Peak Ratio of Complete Denture Occlusion at Insertion and One Week of Post Insertion Phase Using T -Scan 8. SciTz Dent Res Ther. 2017 2(1) 1009. Research Article Evaluation of Changes in Occlusal Force Distribution and Peak Ratio of Complete Denture Occlusion at Insertion and One Week of Post Insertion Phase Using T -Scan 8 Santhosh Yanda and Suresh Sajjan* 1 Department of Prosthodontics, Vishnu Dental College, India Abstract Problem statement Occlusion plays an imperative role in maintaining stability of complete dentures. Stability of dentures influences the residual ridge resorption and masticatory efficiency. The advantage of using t-scan is not well documented in the field of complete denture. Objective To analyze occlusal contacts, occlusal force distribution and peak ratio of complete denture occlusion after clinical remounting. To compare changes in occlusal force distribution and peak ratio of complete denture occlusion using T-Scan after denture insertion and after one week of post insertion phase. Materials and methods Twenty patients receiving complete dentures were selected. Patients having moderately resorbed residual alveolar ridges (ACP II) with no signs of temporomandibular disorders were selected. Complete dentures were fabricated with necessary occlusal corrections by laboratory and clinical remounting procedures. Occlusal analysis was done using T-Scan. Data regarding time interval between initial contact to bilateral contacts, occlusal force distribution and peak ratio was recorded. Occlusal equilibration was done to achieve balanced force distribution. After one week follow up occlusal analysis was repeated to analyze change in time gap from initial contact to bilateral contacts, occlusal force distribution as well as peak ratio values in centric occlusion. Data attained from the T-Scan software was analyzed by McNamara’s

Welcome message from author
This document is posted to help you gain knowledge. Please leave a comment to let me know what you think about it! Share it to your friends and learn new things together.
Transcript
open access
SciTz Dentistry: Research & Therapy
Received: October 31, 2017
Accepted: November 21, 2017
Published: November 29, 2017
*CORRESPONDING AUTHOR:Suresh Sajjan, Department of Prosthodontics, Vishnu Dental College, Bhimavaram, 534202, India, Email:
KEYWORDSOcclusion time; Disocclusion time;
Complete denture; T- Scan.
CITATIONSanthosh Yanda and Suresh Sajjan*.
(2017) Evaluation of Changes in Occlusal
Force Distribution and Peak Ratio of
Complete Denture Occlusion at Insertion
and One Week of Post Insertion Phase
Using T -Scan 8. SciTz Dent Res Ther. 2017
2(1) 1009.
Research Article
Evaluation of Changes in Occlusal Force Distribution and Peak Ratio of Complete Denture Occlusion at Insertion and One Week of Post Insertion Phase
Using T -Scan 8
Santhosh Yanda and Suresh Sajjan*
1Department of Prosthodontics, Vishnu Dental College, India
Abstract
Problem statement
Occlusion plays an imperative role in maintaining stability of complete dentures. Stability of dentures influences the residual ridge resorption and masticatory efficiency. The advantage of using t-scan is not well documented in the field of complete denture.
Objective
To analyze occlusal contacts, occlusal force distribution and peak ratio of complete denture occlusion after clinical remounting. To compare changes in occlusal force distribution and peak ratio of complete denture occlusion using T-Scan after denture insertion and after one week of post insertion phase.
Materials and methods
Twenty patients receiving complete dentures were selected. Patients having moderately resorbed residual alveolar ridges (ACP II) with no signs of temporomandibular disorders were selected. Complete dentures were fabricated with necessary occlusal corrections by laboratory and clinical remounting procedures. Occlusal analysis was done using T-Scan. Data regarding time interval between initial contact to bilateral contacts, occlusal force distribution and peak ratio was recorded. Occlusal equilibration was done to achieve balanced force distribution. After one week follow up occlusal analysis was repeated to analyze change in time gap from initial contact to bilateral contacts, occlusal force distribution as well as peak ratio values in centric occlusion. Data attained from the T-Scan software was analyzed by McNamara’s
Page 2/9
Copyright Suresh Sajjan
Citation: Santhosh Yanda and Suresh Sajjan*. (2017) Evaluation of Changes in Occlusal Force Distribution and Peak Ratio of Complete Denture Occlusion at Insertion and One Week of Post Insertion Phase Using T -Scan 8. SciTz Dent Res Ther. 2017 2(1) 1009.
pair wise and ANOVA test.
Results
Initial contact after clinical remounting showed a significant difference in clinical evaluation with and without use of T-Scan. Differences in time gap were noticed from initial contact to bilateral contacts at various phases of occlusal adjustments. Occlusal force distribution of dentures after laboratory and clinical remounting analysis revealed only 10% of cases were within range of occlusal force distribution. One week post insertion follows up revealed only 5% of cases remained within acceptable range. Statistical analysis of force distribution of the dentures after one week of follow up compared to denture insertion appointment revealed (p = 0.001) statistically highly significant difference. Peak ratio values showed a gradual decline from denture insertion appointment after clinical remounting (1.80), after occlusal equilibration (1.08) to follow up period (0.854).
Conclusion
T-Scan analysis of complete dentures revealed the insufficiency of lab-remounting and clinical remounting for occlusal equilibration and the need for occlusal corrections after one week. Use of T-Scan can assist in eliminating the minor interferences for force finishing and achieving least peak ratio for complete dentures to enhance stability and preservation of the underlying tissues.
Introduction
Stability and retention are the qualities required for psychological and functional comfort of the patient. Lack of stability is one of the important factor in residual ridge resorption. Stability of complete denture is attained by bilateral balanced occlusal force distribution to the supporting tissues. Achieving this goal comes to reality by obtaining bilateral simultaneous occlusal contacts with
equal intensity and duration is essential [1]. Deflective or interceptive occlusal contacts may arise due to processing errors and differences in resiliency of tissues. Presence of deflective occlusal contacts, poor occlusal force summation and unseen collection of unbalanced forces can result in side to side torqueing and dislodgement of prosthesis affecting stability, comfort and acceptance of complete dentures by patients [2].
Articulating paper is most commonly used to identify occlusal interferences during occlusal adjustments. The corrective occlusal adjustments are done by selective grinding of articulating paper marks on the teeth. These markings are exclusively a subjective interpretation of the clinician in detecting the direction, sequence of occlusal contact and intensity of occlusal forces [3]. An articulating paper marking illustrate the occlusal contact surface width and does not indicate the intensity of occlusal force resulting in poor occlusal force equilibration during occlusal adjustments. The appropriateness of the occlusal contact has been relied upon experience and skill of dental professional.
T-Scan allows the dentist to record parameters such as bite length, distribution of occlusal load, and relative forces on the teeth [4]. Bite length is useful in evaluating the sequence of occlusal contacts from initial contact to maximal intercuspal position (MIP) as occlusion time while closing and from maximum intercuspation to total disocclusion as disocclusion time while opening [2]. Determinations of these occlusal timings are useful to achieve desired occlusion and disocclusion timing about 0.2sec and 0.4sec respectively [5].
Information regarding distribution of occlusal force from T-Scan is helpful to achieve centered and measurable occlusal force nearly 50% right – 50% left occlusal force balance improving the tissue adaptation of the dentures during mastication [6].
To determine the presence of premature occlusal contact
Page 3/9
Copyright Suresh Sajjan
Citation: Santhosh Yanda and Suresh Sajjan*. (2017) Evaluation of Changes in Occlusal Force Distribution and Peak Ratio of Complete Denture Occlusion at Insertion and One Week of Post Insertion Phase Using T -Scan 8. SciTz Dent Res Ther. 2017 2(1) 1009.
objectively, it is necessary to evaluate the occlusal contact sequence. The use of T-Scan would aid in making occlusal analysis and corrections more accurate and objectively demonstrable [7]. The denture bearing tissues are known to undergo minor changes in their contour as settling after insertion of complete denture within few days [8,9]. These changes might result in change in occlusal contacts of teeth.
To identify these changes, there is a need to evaluate the sequence of occlusal contact, center of force trajectory and percentage of force distribution on the complete denture occlusion.
Hence, the present study was formulated to evaluate the sequence of occlusal contacts, changes in occlusal force distribution and peak ratio of complete denture occlusion for attaining better retention and stability of complete dentures after insertion.
Materials and Methods
The present study included 20 patients referred to the Department of Prosthodontics and Implantology, Vishnu Dental College, Bhimavaram for replacement of missing teeth by complete dentures.
Inclusion criteria:
• Patients having moderately formed residual alveolar ridges ACP II.
Exclusion criteria:
• Patients with signs and symptoms of temporomandibular disorders.
• Patients with poor neuromuscular co-ordination.
Procedure
Detailed case history was recorded for all the 20 patients. Patient education and motivation was done regarding the
removable complete denture prosthesis and treatment planning and the number of appointments were explained to the patients. For every patient new conventional maxillary and mandibular complete denture were fabricated in balanced articulation.
For ease of understanding the procedure, the methodology is explained in six phases
Phase I – Fabrication of complete dentures following conventional procedure using semi adjustable articulator [Hanau wide view, Whipmix- USA].
Phase II – laboratory remounting of dentures was done to eliminate the processing errors and the dentures were finished and polished.
Phase III –Polished dentures were verified for retention, stability, support, vertical dimension, centric relation and esthetics. Cinical remounting was onto the same semi adjustable articulator (Whip Mix Corp, USA). The necessary occlusal corrections were done. Finally dentures were verified clinically to achieve bilateral simultaneous occlusal contact.
Phase IV – Evaluation of occlusion after clinical remounting using T-Scan 8 (Tekscan Inc, USA). The size of the sensor was selected in accordance to the size of arch form of dentures. Initially the patient was asked to bite on the sensor 2-4 times for adjusting the sensitivity of the sensor before recording. Patient was asked to firmly bite on the sensor and hold for about 1-3 seconds in centric relation. The information regarding first contact to bilateral contact timing, occlusal force distribution, occlusion time, disocclusion time were noted as baseline data.
Phase V - Occlusal forces were equilibrated by necessary occlusal adjustments on denture teeth using the guidance from T-Scan analysis. The heavier contacts were reduced following articulating paper mark corresponding to T-Scan
Page 4/9
Copyright Suresh Sajjan
Citation: Santhosh Yanda and Suresh Sajjan*. (2017) Evaluation of Changes in Occlusal Force Distribution and Peak Ratio of Complete Denture Occlusion at Insertion and One Week of Post Insertion Phase Using T -Scan 8. SciTz Dent Res Ther. 2017 2(1) 1009.
contacts on the monitor. An equal force distribution with occlusal force percentage about 50 ± 5% on right and left sides was achieved. At the time of final insertion T-Scan recording was done three times to capture the immediate post insertion data. An average of three recordings was considered for analysis.
The information regarding time interval from initial contact to bilateral contact, occlusion time, disocclusion time, and percentage of force distribution were noted from the 3 consecutive bite recordings. The mean values of the 3 recordings were noted. The patient was recalled after 1 week.
Phase VI – At recall after one week the patient was asked to occlude on the same sensor 3 times consecutively. The post insertion phase occlusal information was evaluated for change in time interval from initial contact to bilateral contacts, change in percentage of force distribution, occlusion time and disocclusion timing. The mean values of the parameters were noted from the 3 recordings.
The occlusal adjustments were done to re-equilibrate the occlusal contacts and patient was discharged.
All the participants were given detailed information about the investigation and obtained a written informed consent for their participation. The study protocol was reviewed and approved by the Institutional Ethical Committee.
Peek ratio was calculated by the ratio of occlusion time to disocclusion time [PR =OT/DT].
The mean values obtained from phase IV, V and VI i.e., time interval from initial contact to bilateral contacts, occlusion and disocclusion time, peak ratio and percentage of force distribution were subjected to statistical analysis.
Statistical analysis was done using SPSS version 21.0 software (IBM SPSS statistics for windows, version 21.0 Amonk, NY: IBM corp). McNemar’s test was used for pair wise comparison among the phases for percentage of
force distribution, and first contact. One way ANOVA test was used to compare variation in peak ratio and Post hoc LSD Bonferoni test to determine significant difference.
Results
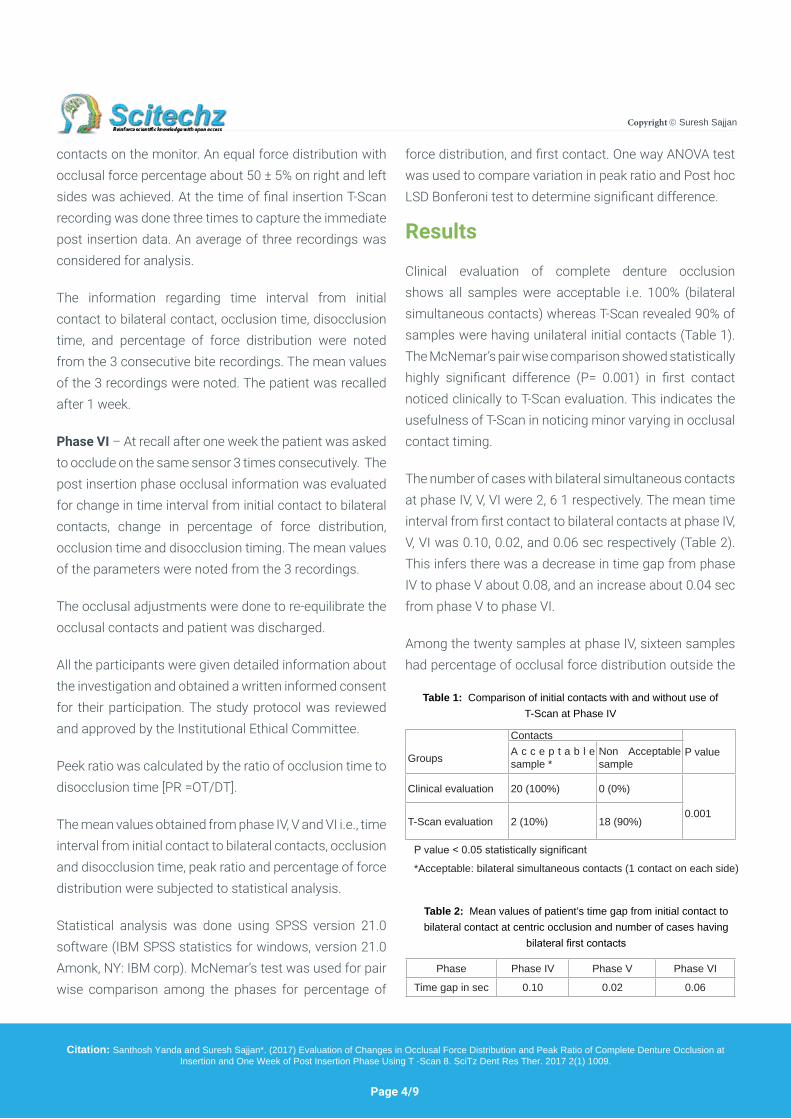
Clinical evaluation of complete denture occlusion shows all samples were acceptable i.e. 100% (bilateral simultaneous contacts) whereas T-Scan revealed 90% of samples were having unilateral initial contacts (Table 1). The McNemar’s pair wise comparison showed statistically highly significant difference (P= 0.001) in first contact noticed clinically to T-Scan evaluation. This indicates the usefulness of T-Scan in noticing minor varying in occlusal contact timing.
The number of cases with bilateral simultaneous contacts at phase IV, V, VI were 2, 6 1 respectively. The mean time interval from first contact to bilateral contacts at phase IV, V, VI was 0.10, 0.02, and 0.06 sec respectively (Table 2). This infers there was a decrease in time gap from phase IV to phase V about 0.08, and an increase about 0.04 sec from phase V to phase VI.
Among the twenty samples at phase IV, sixteen samples had percentage of occlusal force distribution outside the
Table 1: Comparison of initial contacts with and without use of T-Scan at Phase IV
Table 2: Mean values of patient’s time gap from initial contact to bilateral contact at centric occlusion and number of cases having
bilateral first contacts
P value < 0.05 statistically significant
*Acceptable: bilateral simultaneous contacts (1 contact on each side)
Groups
ContactsP valueA c c e p t a b l e
sample *Non Acceptable sample
Clinical evaluation 20 (100%) 0 (0%)
0.001T-Scan evaluation 2 (10%) 18 (90%)
Phase Phase IV Phase V Phase VI
Time gap in sec 0.10 0.02 0.06
Page 5/9
Copyright Suresh Sajjan
Citation: Santhosh Yanda and Suresh Sajjan*. (2017) Evaluation of Changes in Occlusal Force Distribution and Peak Ratio of Complete Denture Occlusion at Insertion and One Week of Post Insertion Phase Using T -Scan 8. SciTz Dent Res Ther. 2017 2(1) 1009.
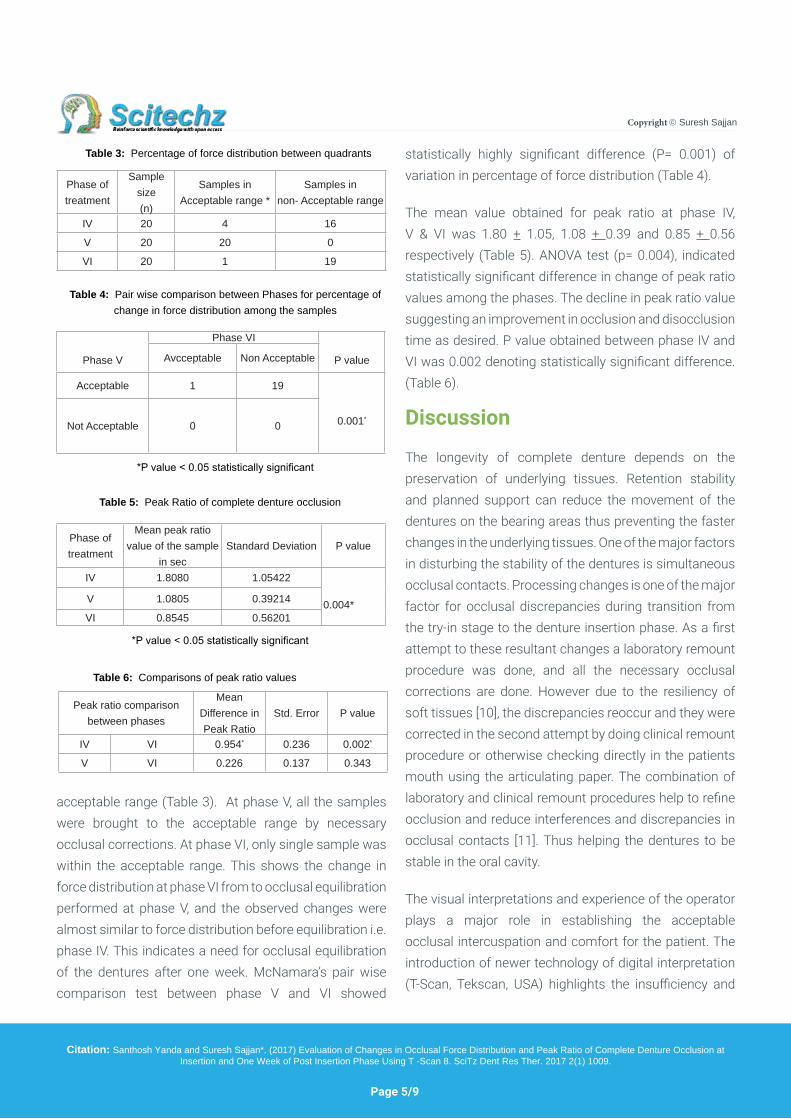
acceptable range (Table 3). At phase V, all the samples were brought to the acceptable range by necessary occlusal corrections. At phase VI, only single sample was within the acceptable range. This shows the change in force distribution at phase VI from to occlusal equilibration performed at phase V, and the observed changes were almost similar to force distribution before equilibration i.e. phase IV. This indicates a need for occlusal equilibration of the dentures after one week. McNamara’s pair wise comparison test between phase V and VI showed
statistically highly significant difference (P= 0.001) of variation in percentage of force distribution (Table 4).
The mean value obtained for peak ratio at phase IV, V & VI was 1.80 + 1.05, 1.08 + 0.39 and 0.85 + 0.56 respectively (Table 5). ANOVA test (p= 0.004), indicated statistically significant difference in change of peak ratio values among the phases. The decline in peak ratio value suggesting an improvement in occlusion and disocclusion time as desired. P value obtained between phase IV and VI was 0.002 denoting statistically significant difference. (Table 6).
Discussion
The longevity of complete denture depends on the preservation of underlying tissues. Retention stability and planned support can reduce the movement of the dentures on the bearing areas thus preventing the faster changes in the underlying tissues. One of the major factors in disturbing the stability of the dentures is simultaneous occlusal contacts. Processing changes is one of the major factor for occlusal discrepancies during transition from the try-in stage to the denture insertion phase. As a first attempt to these resultant changes a laboratory remount procedure was done, and all the necessary occlusal corrections are done. However due to the resiliency of soft tissues [10], the discrepancies reoccur and they were corrected in the second attempt by doing clinical remount procedure or otherwise checking directly in the patients mouth using the articulating paper. The combination of laboratory and clinical remount procedures help to refine occlusion and reduce interferences and discrepancies in occlusal contacts [11]. Thus helping the dentures to be stable in the oral cavity.
The visual interpretations and experience of the operator plays a major role in establishing the acceptable occlusal intercuspation and comfort for the patient. The introduction of newer technology of digital interpretation (T-Scan, Tekscan, USA) highlights the insufficiency and
Table 3: Percentage of force distribution between quadrants
Phase of treatment
Sample size(n)
Samples in Acceptable range *
Samples innon- Acceptable range
IV 20 4 16
V 20 20 0
VI 20 1 19
Table 5: Peak Ratio of complete denture occlusion
*P value < 0.05 statistically significant
Phase of treatment
Mean peak ratio value of the sample
in secStandard Deviation P value
IV 1.8080 1.05422
0.004*V 1.0805 0.39214
VI 0.8545 0.56201
Table 6: Comparisons of peak ratio values
Peak ratio comparison between phases
Mean Difference in Peak Ratio
Std. Error P value
IV VI 0.954* 0.236 0.002*
V VI 0.226 0.137 0.343
Table 4: Pair wise comparison between Phases for percentage of change in force distribution among the samples
*P value < 0.05 statistically significant
Phase V
Phase VI
P valueAvcceptable Non Acceptable
Acceptable 1 19
0.001*Not Acceptable 0 0
Page 6/9
Copyright Suresh Sajjan
Citation: Santhosh Yanda and Suresh Sajjan*. (2017) Evaluation of Changes in Occlusal Force Distribution and Peak Ratio of Complete Denture Occlusion at Insertion and One Week of Post Insertion Phase Using T -Scan 8. SciTz Dent Res Ther. 2017 2(1) 1009.
can aid in optimization of occlusal balance and harmony /equilibration.
Obtaining bilateral occlusal balance during chewing removable complete denture prostheses is the occlusal goal of the prosthodontist. Bilateral occlusal balance results from centralization of occlusal forces. Centralization of tooth contacts is essential for improving the tissue adaptation of the denture by ensuring that occlusal force summation onto the broadest and most supportive tissue available. This attains stability of removable complete dentures along with maintaining the health of underlying mucosa [6].The modern complete denture service is characterized by an integration of biological information with instrumentation materials and clinical techniques.
The reason for inaccurate occlusal force centralization in complete denture occlusion is due to arbitrary elimination of occlusal errors caused during laboratory and clinical procedures in complete denture fabrication.
The utilization of T-Scan in identifying various aspects of occlusal disturbances in natural dentition has been
shown to be prudential. However, the application of digitalized occlusal analysis for complete dentures is less explored. In the present study the T-Scan analysis was used to gather information to validate the existing occlusal discrepancies even after doing the clinical remount. Care was taken to standardize the sensitivity of the recording for each patient. The T-Scan analysis can provide the information on various aspects of occlusion. In the present study few of the information has been used to identify and perform occlusal equilibration of complete dentures after clinical remounting and verify its changes after one week of post insertion phase. The visual analysis of dentures clinically exhibited bilateral simultaneous contacts in centric relation in all the cases. The T-Scan analysis displayed that about 90% of dentures were having unilateral contacts in centric occlusion (P= 0.001) indicating high statistical significant difference (Table 7).
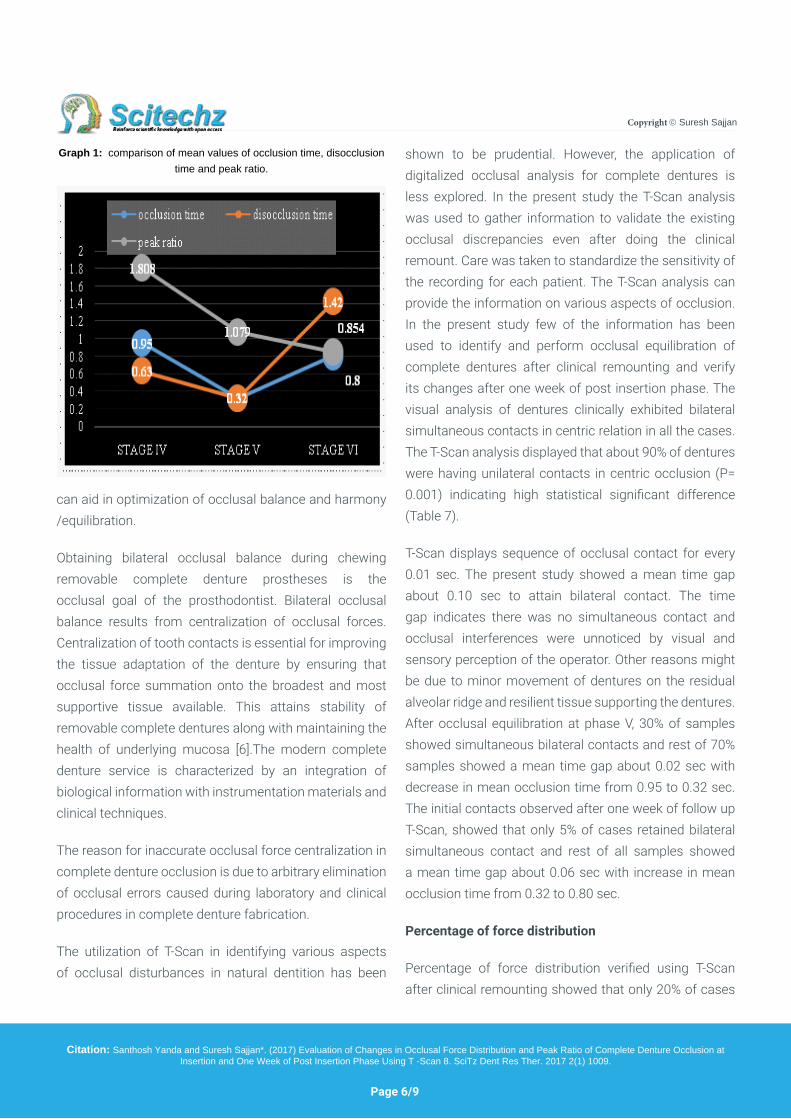
T-Scan displays sequence of occlusal contact for every 0.01 sec. The present study showed a mean time gap about 0.10 sec to attain bilateral contact. The time gap indicates there was no simultaneous contact and occlusal interferences were unnoticed by visual and sensory perception of the operator. Other reasons might be due to minor movement of dentures on the residual alveolar ridge and resilient tissue supporting the dentures. After occlusal equilibration at phase V, 30% of samples showed simultaneous bilateral contacts and rest of 70% samples showed a mean time gap about 0.02 sec with decrease in mean occlusion time from 0.95 to 0.32 sec. The initial contacts observed after one week of follow up T-Scan, showed that only 5% of cases retained bilateral simultaneous contact and rest of all samples showed a mean time gap about 0.06 sec with increase in mean occlusion time from 0.32 to 0.80 sec.
Percentage of force distribution
Percentage of force distribution verified using T-Scan after clinical remounting showed that only 20% of cases
Graph 1: comparison of mean values of occlusion time, disocclusion time and peak ratio.
Page 7/9
Copyright Suresh Sajjan
Citation: Santhosh Yanda and Suresh Sajjan*. (2017) Evaluation of Changes in Occlusal Force Distribution and Peak Ratio of Complete Denture Occlusion at Insertion and One Week of Post Insertion Phase Using T -Scan 8. SciTz Dent Res Ther. 2017 2(1) 1009.
were in acceptable range 50 ± 5 % between right side and left side and 80% of cases were in non-acceptable range percentage of force distribution. This is indicative of inadequacy of clinical remount to obtain a bilateral equal force distribution. All the cases were brought to be within the acceptable range in order to get centralization of occlusal force before insertion of dentures. The results obtained after 1 week of follow up revealed 95% of cases having varied force distribution ranging from 60-75% (Table 2), indicating a need for re-equilibration of complete denture occlusion for equal force distribution. This change in occlusal force distribution can be attributed to adaptation of mucosa in the denture bearing areas and functional load after denture insertion as the soft tissue is compressible and liable to change after a few days of function [8], called as settling of dentures.
Peak ratio
Peak ratio is the ratio between occlusion time (duration of onset of initial contact to maximum intercuspation) and disocclusion time (duration from initiation of disocclusion to complete disocclusion) [12]. Lesser peak ratio indicates better occlusal balance on the residual alveolar ridges [2]. The mean peak ratio values obtained in this study were 1.80, 1.07 and 0.85 was observed in phase IV, phase V and phase VI respectively (Graph 1). The decreasing trend in mean peak ratio values after one-week appointment is in accordance to the study done by Okuma k et al. However, in the present study the peak ratio attained at the time of denture insertion was 1.079, this was in contrast to his study which was achieved at 5th appointment (1.041). Author had initiated occlusal corrections directly in patient after laboratory remounting. This signifies the importance of laboratory and clinical remounting in achieving desired peak ratio at insertion appointment. The possible explanation of this decrease in peak ratio might be associated with adaptation of alveolar mucosa to the tissue surface of denture over a period of occlusal
force.
Center of force trajectory
Center of force target represents the mean location of distribution of occlusal contacts in maximum intercuspation. This is represented by ellipse in the 2D graph displayed on the monitor. In the present study all the patients occlusal force exhibited center of force target within the ellipse after clinical remounting. However most of the patients were in non-acceptable range of percentage of force distribution. After occlusal equilibration using T-Scan, the position of center of force target remained constant. After one week of follow up although the percentage of force distribution in between left and right quadrants got changed, the center of force target remained the same. This is in accordance of values observed by Maness WL et al. In his observations 68-95 % of subjects’ occlusal force was observed to be in ellipse (center of force zone) [13]. Another possible explanation for this varied occlusal force distribution is habituated and preferred side of chewing. Studies showed that mandibular movement pattern to the side of chewing doesn’t change even after extraction of all teeth. The complete denture patients indicate similar movements that are noticed in individuals with natural dentition. In this study most of the patients had a preferable left side chewing habit before extraction and after using dentures. Even after instructions given to the patient at time of insertion, to chew bilaterally most of the patients preferred to chew on their side of comfort.
An evaluation of patient’s satisfaction after a time gap of six months to one year period. It was observed that patients continued to chew on their pre extraction habitual side and 90% of the patients were comfortable with the prosthesis
The present study showed a significant change is sequence of tooth contacts, percentage of occlusal force distribution from the time of denture insertion after
Page 8/9
Copyright Suresh Sajjan
Citation: Santhosh Yanda and Suresh Sajjan*. (2017) Evaluation of Changes in Occlusal Force Distribution and Peak Ratio of Complete Denture Occlusion at Insertion and One Week of Post Insertion Phase Using T -Scan 8. SciTz Dent Res Ther. 2017 2(1) 1009.
occlusal equilibration using T-Scan and one week of post insertion phase. Although there had been decrease in peak ratio of complete denture occlusion noticed in a follow up period of 1week, after occlusal equilibration at denture insertion appointment, the statistical data obtained from this change in peak ratio was not significant. Hence, after 1 week of follow up, minor occlusal equilibration needed to be done to the dentures for achieving better stability and minimizing further appointments for occlusal corrections.
Limitations of the study
Short term follow-up of the patients. Lack of use of electromyographical data to correlate the changes in force distribution and peak ratio values to the muscle activity.
Conclusion
Within the limitations of the study the following conclusions were drawn
• T-Scan analysis revealed only 10% of cases exhibited bilateral contacts after clinical remounting, although visual perception exhibited bilateral contacts.
• After one week of post insertion phase, 95% of cases exhibited unilateral contacts despite occlusal equilibration at the time of insertion. Thus indicating the tissue settling after denture insertion causes occlusal changes.
• Analysis of the percentage of force distribution revealed significant change from the denture insertion appointment after occlusal equilibration to one week follow up period. The present study signifies the necessity to equilibrate the complete denture occlusion after one week for equal occlusal force distribution.
• The peak ratio of the complete denture occlusion
revealed a gradual decrease from clinical remounting and occlusal equilibration to occlusion evaluated after one week. This suggests an improvement in occlusion and disocclusion timing as desired.
The present study reveals the insufficiency of laboratory and clinical remounting alone for occlusal stabilization and emphasizes the use of T-Scan in eliminating minor interferences for force finishing and achieving least peak ratio for complete dentures to enhance stability and preservation of the underlying tissues and to minimize further appointments for occlusal adjustments.
References1. Olivieri F, Kang K, Hirayama H, Maness WL. New method for
analyzing complete denture occlusion using the center of force concept a clinical report. J Prosthet Dent. 1998; 80: 519-523.
2. Okuma K, Hirano S, Hayakawa I. Occlusal pressure pattern analysis of complete dentures for evaluation of occlusal adjustment. J Med Dent Sci. 2004; 51: 197-203.
3. Qadeer S, Kerstein R, Kim RJY, Huh JB, Shin SW. Relationship between articulation paper mark size and percentage of force measured with computerized occlusal analysis. J Adv Prosthodont. 2012; 47: 7-12.
4. Carey JP, Craig M, Kerstein RB, Radke J. Determining relationship between applied occlusal load and articulating paper mark area. Open Dent J. 2007; 1: 1-7.
5. Kerstein RB, Grundset K. Obtaining bilateral simultaneous occlusal contacts with computer analyzed and guided occlusal adjustments. Quintessence Int. 2001; 32: 7-18.
6. Kerstein RB, Thumati P, Padmaja S. Force finishing and centering to balance a removable complete denture prosthesis using the T- Scan III computerized occlusal analysis system. J Indian Prosthodont Soc. 2013; 13: 184-188.
7. Sidana V, Pasricha N, Makkar M, Banwait S. Computerized Occlusal Analysis. Ind J Dental Sci. 2013; 5.
8. Basker RM, Davenport JC. Prosthetic Treatment of the Edentulous Patient. 5th editon. Copenhagen, Denmark: Blakwell. 2011; 205-221.
9. Kydd, Daly. The biologic and mechanical effects of stress on oral
Page 9/9
Copyright Suresh Sajjan
Citation: Santhosh Yanda and Suresh Sajjan*. (2017) Evaluation of Changes in Occlusal Force Distribution and Peak Ratio of Complete Denture Occlusion at Insertion and One Week of Post Insertion Phase Using T -Scan 8. SciTz Dent Res Ther. 2017 2(1) 1009.
mucosa. J Prosthet Dent. 1982; 47: 317-329.
10. Jain R, Pamecha S, Jain GC. Realeff- relevance in complete dentures. Int J Engineering Technol. 2012; 1: 44-47.
11. Babu, Ramakrishna Rajan, and Sanjna Vibhu Nayar. Occlusion indicators: A review. J Indian Prosthodont Soc. 2007; 7: 56-60.
12. Kerstein RB. Handbook of research on computerized occlusal analysis technology applications in dental medicine. Hershey, USA: IGI Global. 2015; 94-151.
13. Boening KW, Walter MH. Computer-aided evaluation of occlusal load in complete dentures. J Prosthet Dent. 1992; 67: 339-344.
Related Documents