Evaluating Shielding Effectiveness for Reducing Space Radiation Cancer Risks Francis A. Cucinotta 1* , Myung-Hee Y. Kim 2 , and Lei Ren 3 NASA Lyndon B. Johnson Space Center, Houston, Texas 77058 Wyle Laboratories, Houston, Texas 77058 U.S.R.A., Division of Space Life Science Division, Houston, Texas 77058 * Corresponding author: Dr. Francis A. Cucinotta, Chief Scientist NASA Johnson Space Center Houston TX, 77058 [email protected] Phone: 281-483-0968 Fax: 291-483-3058 https://ntrs.nasa.gov/search.jsp?R=20070005030 2018-06-02T22:09:38+00:00Z

Welcome message from author
This document is posted to help you gain knowledge. Please leave a comment to let me know what you think about it! Share it to your friends and learn new things together.
Transcript
Evaluating Shielding Effectiveness for
Reducing Space Radiation Cancer Risks
Francis A. Cucinotta1*, Myung-Hee Y. Kim2, and Lei Ren3
NASA Lyndon B. Johnson Space Center, Houston, Texas 77058 Wyle Laboratories, Houston, Texas 77058
U.S.R.A., Division of Space Life Science Division, Houston, Texas 77058
* Corresponding author:
Dr. Francis A. Cucinotta, Chief Scientist
NASA Johnson Space Center
Houston TX, 77058
Phone: 281-483-0968
Fax: 291-483-3058
https://ntrs.nasa.gov/search.jsp?R=20070005030 2018-06-02T22:09:38+00:00Z
Abstract: We discuss calculations of probability distribution functions (PDF) representing
uncertainties in projecting fatal cancer risk from galactic cosmic rays (GCR) and solar particle
events (SPE). The PDF’s are used in significance tests of the effectiveness of potential radiation
shielding approaches. Uncertainties in risk coefficients determined from epidemiology data, dose
and dose-rate reduction factors, quality factors, and physics models of radiation environments are
considered in models of cancer risk PDF’s. Competing mortality risks and functional correlations
in radiation quality factor uncertainties are treated in the calculations. We show that the cancer
risk uncertainty, defined as the ratio of the 95% confidence level (CL) to the point estimate is
about 4-fold for lunar and Mars mission risk projections. For short-stay lunar missions (<180 d),
SPE’s present the most significant risk, however one that is mitigated effectively by shielding,
especially for carbon composites structures with high hydrogen content. In contrast, for long
duration lunar (>180 d) or Mars missions, GCR risks may exceed radiation risk limits, with 95%
CL’s exceeding 10% fatal risk for males and females on a Mars mission. For reducing GCR
cancer risks, shielding materials are marginally effective because of the penetrating nature of
GCR and secondary radiation produced in tissue by relativistic particles. At the present time,
polyethylene or carbon composite shielding can not be shown to significantly reduce risk
compared to aluminum shielding based on a significance test that accounts for radiobiology
uncertainties in GCR risk projection.
Keywords: Space radiation, cancer risks, HZE ions, Lunar exploration, Mars exploration
1. Introduction
Exposures to astronauts from galactic cosmic rays (GCR), made-up of high-energy
protons and heavy ions, and solar particle events (SPE), comprised largely of low to medium
energy protons, are important safety concerns for space exploration. Radiation risks include
carcinogenesis, degenerative tissue effects such as cataracts (Cucinotta et al., 2001a) or heart
diseases (Preston et al., 2003, Howe et al., 2004, Yang et al., 1982), and acute radiation
syndromes (NCRP, 2000). Other risks such as damage to the central nervous system (CNS) are a
potential concern for the GCR heavy ions (NAS, 1996). In the past, career radiation limits have
been based on fatal cancer risks. For low Earth orbit (LEO) programs, an excess fatal risk of 3%
is used as criteria for dose limits, which are applied using age and gender specific dose to risk
conversion factors. Radiation risk projection models serve several roles, which include setting
dose-to-risk conversion factors needed to set dose limits, projecting mission risks, and evaluating
the effectiveness of shielding or other countermeasures. For mission planning and operations,
NASA uses the model recommended in the NCRP Report No. 132 for estimating cancer risks
from space (NCRP, 2000). This model is similar to approaches described by other radiation risk
assessment committees or in the scientific literature, employing a life-table formalism,
epidemiological assessments of excess risk in exposed cohorts, such as the atomic-bomb
survivors, and estimates of dose and dose-rate reduction factors (DDREF) and linear energy
transfer (LET) dependent radiation quality factors.
Recently, NASA has recognized that projecting uncertainties in cancer risk estimates
along with point estimates should be a requirement for ensuring mission safety, because point
estimates alone have limited value when the uncertainties in the factors that enter into cancer risk
calculations are large. Estimates of 95% confidence intervals (CI) for various radiation protection
scenarios are meaningful additions to the traditional point estimates, and can be used to explore
the value of mitigation approaches, and of research that could narrow the various factors that
enter into risk calculations. Uncertainties for low linear energy transfer (LET) radiation, such as
gamma-rays, have been reviewed several times in recent years, and indicate that the major
uncertainty is the extrapolation of cancer effects data from high to low doses and dose-rates
(NCRP, 1997; BEIR, 1994). Other uncertainties include the transfer of risk across populations,
and sources of error in epidemiology data including dosimetry, bias, and statistical limitations.
For low LET radiation, probability distribution functions (PDF’s) were described previously
(NCRP, 1997). In estimating cancer risks for space radiation, additional uncertainties occur
related to estimating the biological effectiveness of protons and heavy ions, and predicting LET
spectra at tissue sites (Cucinotta et al., 2001b). The limited understanding of heavy ion
radiobiology has been estimated to be the largest contributor to the uncertainty for space radiation
effects (NAS, 1996), and radiation quality factors found to contribute the major portion of the
uncertainties in a previous study (Cucinotta et al., 2001b).
In this paper we discuss modifications to our methodology for projecting cancer risk
probability distributions for space missions, and apply the model to several space exploration
mission scenarios including the evaluation of potential shielding approaches: First, in our
previous work we had assumed the normal approximation for summing the additive contributions
of many radiation components at tissue sites behind spacecraft shielding. The fluence weighted
variance for each GCR charge and energy group was summed using the square root of the sum of
the squares to estimate the standard deviation and confidence intervals. In the present work, we
have used direct sampling over organ weighted LET distributions for the estimation of the 95%
CI’s, and show that a log-normal distribution results from the analysis. A second modification is
related to the uncertainties in the radiation quality factors. Previously, we had considered the
range of experimental data for appropriate endpoints in order to develop a subjective PDF for the
quality factor. In the present paper, we treat the quality factor, Q(L), and its uncertainties as a
functional relationship, which recognizes that values of Q(L) at different LET’s are in-fact
correlated by underlying biophysical processes. The final improvement made here is to
accumulate Monte-Carlo trials directly from the double-detriment life-table rather than the cancer
mortality rate. The life-table approach is used because in our previous estimates of cancer risk for
the Mars mission (Cucinotta et al., 2001b), the upper level of the 95% C.I. exceeded 10%
mortality risk, and for we expect that competing causes of death may significantly compress the
higher values in the distribution.
Shielding is one approach that can be considered for mitigating radiation risks.
Theoretical and computational efforts in the 1980’s and 1990’s have provided the basic
understanding needed to design effective shielding approaches (Wilson et al., 1991, 1995,
Cucinotta et al., 1998a). Materials of low atomic mass, especially hydrogen are expected to be
optimal as radiation shields because they reduce the occurrence of secondary particles (neutrons,
protons, and other recoils) and are more effective per unit mass of material in slowing down or
stopping ions in atomic collisions, and fragmenting HZE ions. However, because relativistic ions
in the GCR are not appreciably slowed down by appreciable amounts of any material, and are the
largest inducer of secondary radiation produced in tissues, the role of shielding material selection
for GCR is not clear. We show here that shielding materials can not be shown to have an
important role in reducing GCR risks, because of their poor attenuation properties in any material
combined with large risk model uncertainties. In contrast, exposures to SPE’s are effectively
mitigated by most shielding materials and there is a substantial reduction in mass that occurs
when lower mass materials are selected for spacecraft structures.
2. Life-Table Methodology
We use the double detriment life-table to estimate radiation cancer mortality risks. In this
approach the age-specific mortality of a population is followed over their entire lifespan with
competing risks from radiation and all other causes of death described (Bunger et al., 1981). For a
homogeneous population receiving an effective dose E, at age aE, the probability of dying in the
age-interval from a to a+1 is described by the background mortality-rate for all causes of death,
M(a), and the radiation cancer mortality rate, m(E,aE,a), as
)],,()([211
),,()(),,()1(aaEmaM
aaEmaMaaEqE
EE
++
+=
The survival probability to live to age, a, following an exposure, E, at age, aE, is
∏−
=
−=1
)],,(1[),,()2(a
auEE
E
uaEqaaES
The excess lifetime risk (ELR) is the increased probability that an exposed individual will
die from cancer and is defined by the difference in the conditional survival probabilities for the
exposed and unexposed groups as
∑ ∑∞
=
∞
=
−+=E Eaa aa
EEE aaSaMaaESaaEmaMELR ),,0()(),,()],,()([)3(
We use a finite cut-off of 101-years for the upper limit in Eq.(3) and expressions below. A
minimum latency-time of 10-years is often used for low LET radiation (NCRP, 2000), however
we will consider alternative assumptions for high-LET radiation. The risk of exposure induced
death (REID) is the lifetime risk that an individual in the population will die from a cancer caused
by his or her radiation exposure, defined by
∑∞
=
=Eaa
EE aaESaaEmREID ),,(),,()4(
In general, the value of the REID exceeds that of the ELR by about 10-20%. Vaeth and Pierce
(1990) have discussed special cases where the ELR is ill-defined and suggested that the REID is
the preferred quantity for radiation protection. Radiation risk calculations are based on population
data, however are used to estimate risks for individuals. Population data reflect gender
differences, however also change with calendar year and often used for projections far into the
future. For the astronaut population, the appropriateness of using the US average population can
be questioned, because the so-called “healthy worker” effect is expected for astronauts.
For projecting lifetime cancer fatality risks, an age- and gender-dependent mortality rate
per unit dose, estimated for acute gamma-ray exposures, is multiplied by the radiation quality
factor and reduced by the dose- and dose-rate reduction factor (DDREF) (NCRP, 2000).
Additivity of effects of each component in a radiation field is assumed. Radiation mortality rates
are largely modeled using the Japanese atomic-bomb survivor data. For transferring risks from
the Japanese to US population two models are often considered. A multiplicative transfer model
assumes radiation risks are proportional to spontaneous or background cancer risks. The additive
transfer model assumes radiation acts independently of other cancer risks. However, the NCRP
recommends (NCRP, 2000) a mixture model with fractional contributions from the multiplicative
risk model or additive risk model. The radiation mortality rate is:
DDREF
LLFLQaaEARvaMaavERRaaEm L
EcEE
)()()],()1()(),([),,()5(
∑−+=
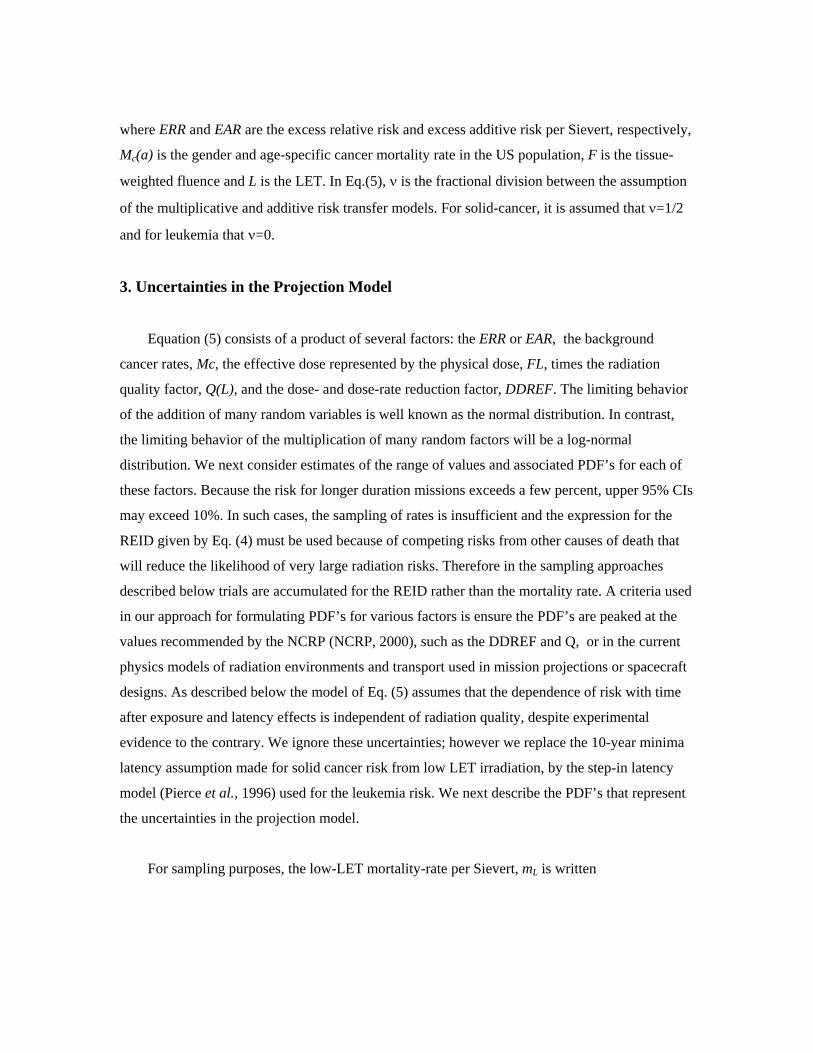
where ERR and EAR are the excess relative risk and excess additive risk per Sievert, respectively,
Mc(a) is the gender and age-specific cancer mortality rate in the US population, F is the tissue-
weighted fluence and L is the LET. In Eq.(5), ν is the fractional division between the assumption
of the multiplicative and additive risk transfer models. For solid-cancer, it is assumed that ν=1/2
and for leukemia that ν=0.
3. Uncertainties in the Projection Model
Equation (5) consists of a product of several factors: the ERR or EAR, the background
cancer rates, Mc, the effective dose represented by the physical dose, FL, times the radiation
quality factor, Q(L), and the dose- and dose-rate reduction factor, DDREF. The limiting behavior
of the addition of many random variables is well known as the normal distribution. In contrast,
the limiting behavior of the multiplication of many random factors will be a log-normal
distribution. We next consider estimates of the range of values and associated PDF’s for each of
these factors. Because the risk for longer duration missions exceeds a few percent, upper 95% CIs
may exceed 10%. In such cases, the sampling of rates is insufficient and the expression for the
REID given by Eq. (4) must be used because of competing risks from other causes of death that
will reduce the likelihood of very large radiation risks. Therefore in the sampling approaches
described below trials are accumulated for the REID rather than the mortality rate. A criteria used
in our approach for formulating PDF’s for various factors is ensure the PDF’s are peaked at the
values recommended by the NCRP (NCRP, 2000), such as the DDREF and Q, or in the current
physics models of radiation environments and transport used in mission projections or spacecraft
designs. As described below the model of Eq. (5) assumes that the dependence of risk with time
after exposure and latency effects is independent of radiation quality, despite experimental
evidence to the contrary. We ignore these uncertainties; however we replace the 10-year minima
latency assumption made for solid cancer risk from low LET irradiation, by the step-in latency
model (Pierce et al., 1996) used for the leukemia risk. We next describe the PDF’s that represent
the uncertainties in the projection model.
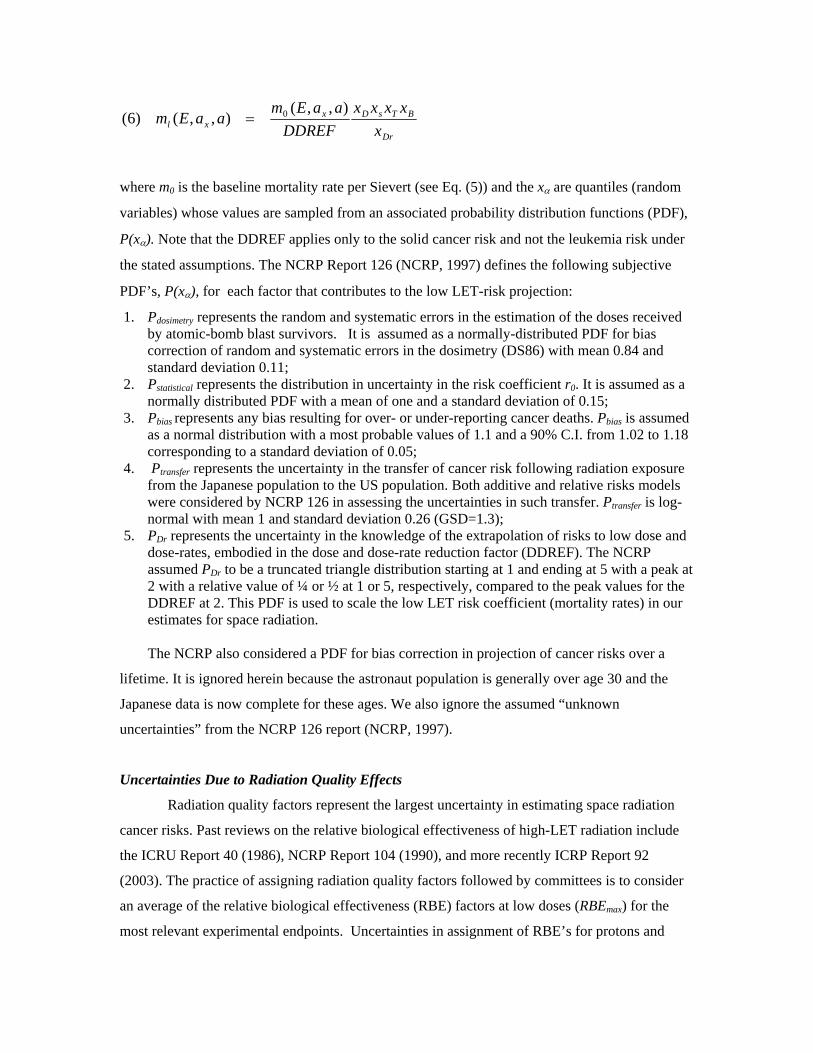
For sampling purposes, the low-LET mortality-rate per Sievert, mL is written
Dr
BTsDxxl x
xxxxDDREF
aaEmaaEm
),,(),,()6( 0=
where m0 is the baseline mortality rate per Sievert (see Eq. (5)) and the xα are quantiles (random
variables) whose values are sampled from an associated probability distribution functions (PDF),
P(xα). Note that the DDREF applies only to the solid cancer risk and not the leukemia risk under
the stated assumptions. The NCRP Report 126 (NCRP, 1997) defines the following subjective
PDF’s, P(xα), for each factor that contributes to the low LET-risk projection:
1. Pdosimetry represents the random and systematic errors in the estimation of the doses received by atomic-bomb blast survivors. It is assumed as a normally-distributed PDF for bias correction of random and systematic errors in the dosimetry (DS86) with mean 0.84 and standard deviation 0.11;
2. Pstatistical represents the distribution in uncertainty in the risk coefficient r0. It is assumed as a normally distributed PDF with a mean of one and a standard deviation of 0.15;
3. Pbias represents any bias resulting for over- or under-reporting cancer deaths. Pbias is assumed as a normal distribution with a most probable values of 1.1 and a 90% C.I. from 1.02 to 1.18 corresponding to a standard deviation of 0.05;
4. Ptransfer represents the uncertainty in the transfer of cancer risk following radiation exposure from the Japanese population to the US population. Both additive and relative risks models were considered by NCRP 126 in assessing the uncertainties in such transfer. Ptransfer is log-normal with mean 1 and standard deviation 0.26 (GSD=1.3);
5. PDr represents the uncertainty in the knowledge of the extrapolation of risks to low dose and dose-rates, embodied in the dose and dose-rate reduction factor (DDREF). The NCRP assumed PDr to be a truncated triangle distribution starting at 1 and ending at 5 with a peak at 2 with a relative value of ¼ or ½ at 1 or 5, respectively, compared to the peak values for the DDREF at 2. This PDF is used to scale the low LET risk coefficient (mortality rates) in our estimates for space radiation.
The NCRP also considered a PDF for bias correction in projection of cancer risks over a
lifetime. It is ignored herein because the astronaut population is generally over age 30 and the
Japanese data is now complete for these ages. We also ignore the assumed “unknown
uncertainties” from the NCRP 126 report (NCRP, 1997).
Uncertainties Due to Radiation Quality Effects
Radiation quality factors represent the largest uncertainty in estimating space radiation
cancer risks. Past reviews on the relative biological effectiveness of high-LET radiation include
the ICRU Report 40 (1986), NCRP Report 104 (1990), and more recently ICRP Report 92
(2003). The practice of assigning radiation quality factors followed by committees is to consider
an average of the relative biological effectiveness (RBE) factors at low doses (RBEmax) for the
most relevant experimental endpoints. Uncertainties in assignment of RBE’s for protons and
heavy ions arise for several reasons including sparseness of data for tumorigenesis in animal
models or surrogate tissue or cellular endpoints, variability in reference radiation and doses and
dose-rates employed, and lack of data over the LET range of interest. Also, linearity at low dose
or dose-rates for the reference radiation or ions is often not sufficiently established in
experiments. Statistical limitations often hinder studies at the low dose-rates of interest for space
radiation protection. For high-LET radiation, a turn-over or bending found in the dose response
for tumor induction and neoplastic transformation is observed at moderate doses, presenting
further uncertainties in estimating the effectiveness of high-LET radiation at low dose-rates.
Figure 1 shows representative examples of the ratio of RBEmax to Q for mouse tumors,
cell transformation or mutations, or cytogenetic endpoints. The ratio is often 2- to 3-fold times
higher or lower than unity, which indicates the expected deviation from Q in available data.
Table 1 shows LET values at the maximum RBE found in past studies, selected from
experiments with more than 5 ions studied. Large deviations from the Q peak at 100 keV/µm are
observed in these experiments with a range from about 50 to 190 keV/µm for the peak. The
number of past studies and endpoints used are limited if viewed as surrogate endpoints for human
carcinogenesis. Track structure models suggest that each ion species would have distinct RBE
curves of similar shape, however with curves for lower charge ions peaking at a lower LET than
higher charged ions (Katz et al., 1971; Cucinotta et al., 1996; Nikjoo et al., 1999). Furthermore,
above about 1-MeV/u, lower charged ions have a higher biological effectiveness than higher
charged ions of identical LET. Based on track structure models, we expect that data sets that
consider only a few ions are insufficient for defining the radiation quality dependence of Q. LET
response curves also are predicted to depend on the target size (for e.g. gene or chromosome
region), and intrinsic radiation sensitivity, which includes the competition with cell death. These
factors likely vary between tissues.
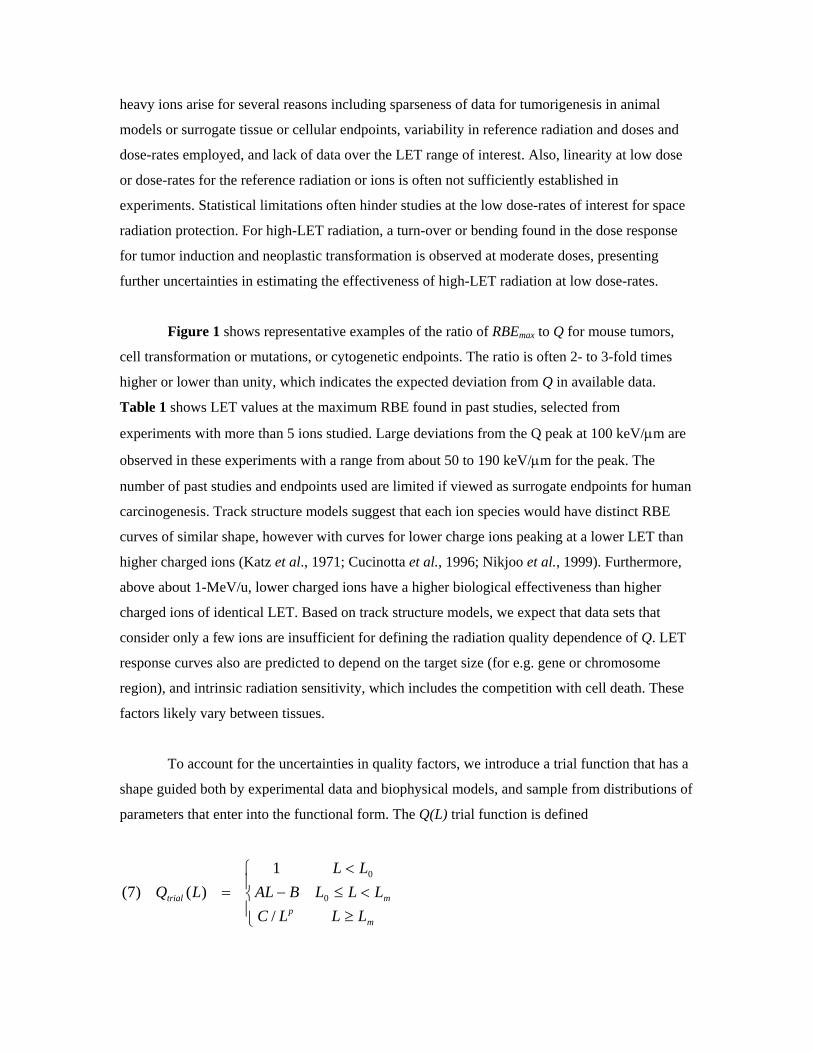
To account for the uncertainties in quality factors, we introduce a trial function that has a
shape guided both by experimental data and biophysical models, and sample from distributions of
parameters that enter into the functional form. The Q(L) trial function is defined
m
mp
trial
LLLLL
LL
LCBALLQ
≥<≤
<
⎪⎩
⎪⎨
⎧−= 0
0
/
1)()7(
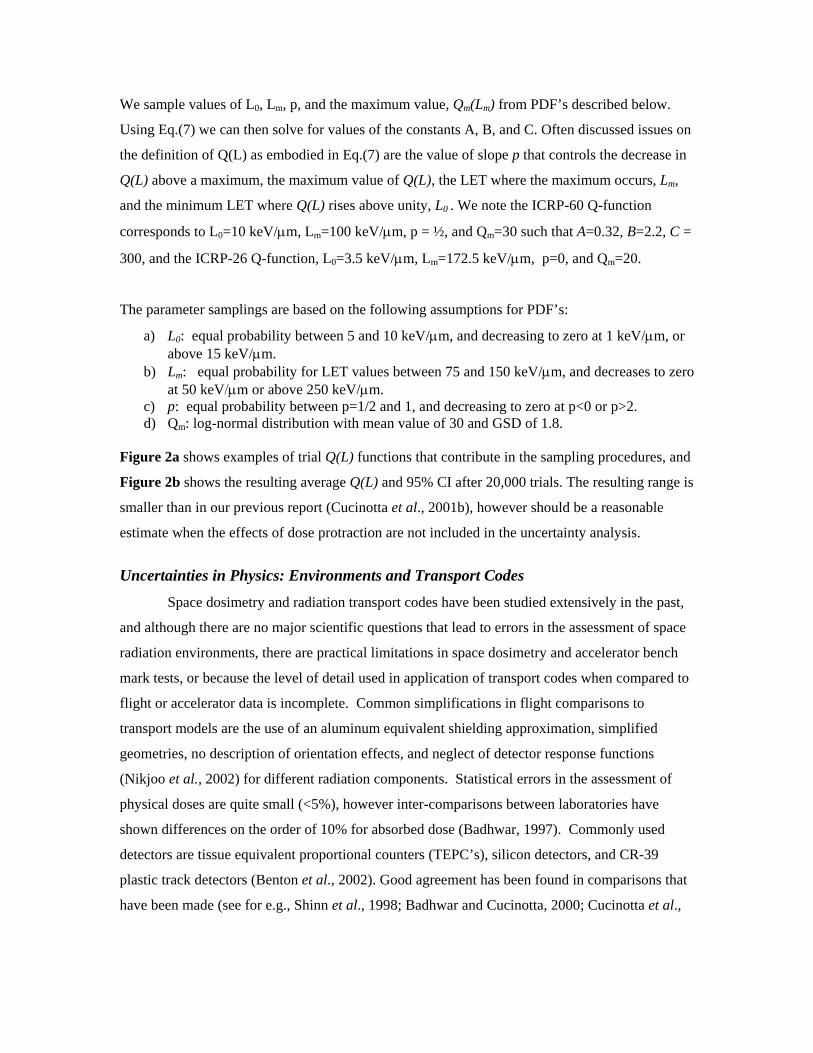
We sample values of L0, Lm, p, and the maximum value, Qm(Lm) from PDF’s described below.
Using Eq.(7) we can then solve for values of the constants A, B, and C. Often discussed issues on
the definition of Q(L) as embodied in Eq.(7) are the value of slope p that controls the decrease in
Q(L) above a maximum, the maximum value of Q(L), the LET where the maximum occurs, Lm,
and the minimum LET where Q(L) rises above unity, L0 . We note the ICRP-60 Q-function
corresponds to L0=10 keV/µm, Lm=100 keV/µm, p = ½, and Qm=30 such that A=0.32, B=2.2, C =
300, and the ICRP-26 Q-function, L0=3.5 keV/µm, Lm=172.5 keV/µm, p=0, and Qm=20.
The parameter samplings are based on the following assumptions for PDF’s:
a) L0: equal probability between 5 and 10 keV/µm, and decreasing to zero at 1 keV/µm, or above 15 keV/µm.
b) Lm: equal probability for LET values between 75 and 150 keV/µm, and decreases to zero at 50 keV/µm or above 250 keV/µm.
c) p: equal probability between p=1/2 and 1, and decreasing to zero at p<0 or p>2. d) Qm: log-normal distribution with mean value of 30 and GSD of 1.8.
Figure 2a shows examples of trial Q(L) functions that contribute in the sampling procedures, and
Figure 2b shows the resulting average Q(L) and 95% CI after 20,000 trials. The resulting range is
smaller than in our previous report (Cucinotta et al., 2001b), however should be a reasonable
estimate when the effects of dose protraction are not included in the uncertainty analysis. Uncertainties in Physics: Environments and Transport Codes
Space dosimetry and radiation transport codes have been studied extensively in the past,
and although there are no major scientific questions that lead to errors in the assessment of space
radiation environments, there are practical limitations in space dosimetry and accelerator bench
mark tests, or because the level of detail used in application of transport codes when compared to
flight or accelerator data is incomplete. Common simplifications in flight comparisons to
transport models are the use of an aluminum equivalent shielding approximation, simplified
geometries, no description of orientation effects, and neglect of detector response functions
(Nikjoo et al., 2002) for different radiation components. Statistical errors in the assessment of
physical doses are quite small (<5%), however inter-comparisons between laboratories have
shown differences on the order of 10% for absorbed dose (Badhwar, 1997). Commonly used
detectors are tissue equivalent proportional counters (TEPC’s), silicon detectors, and CR-39
plastic track detectors (Benton et al., 2002). Good agreement has been found in comparisons that
have been made (see for e.g., Shinn et al., 1998; Badhwar and Cucinotta, 2000; Cucinotta et al.,
2000; Kim et al., 2003), especially when detector response functions are represented in the
comparisons, however the number and nature of the comparisons is limited.
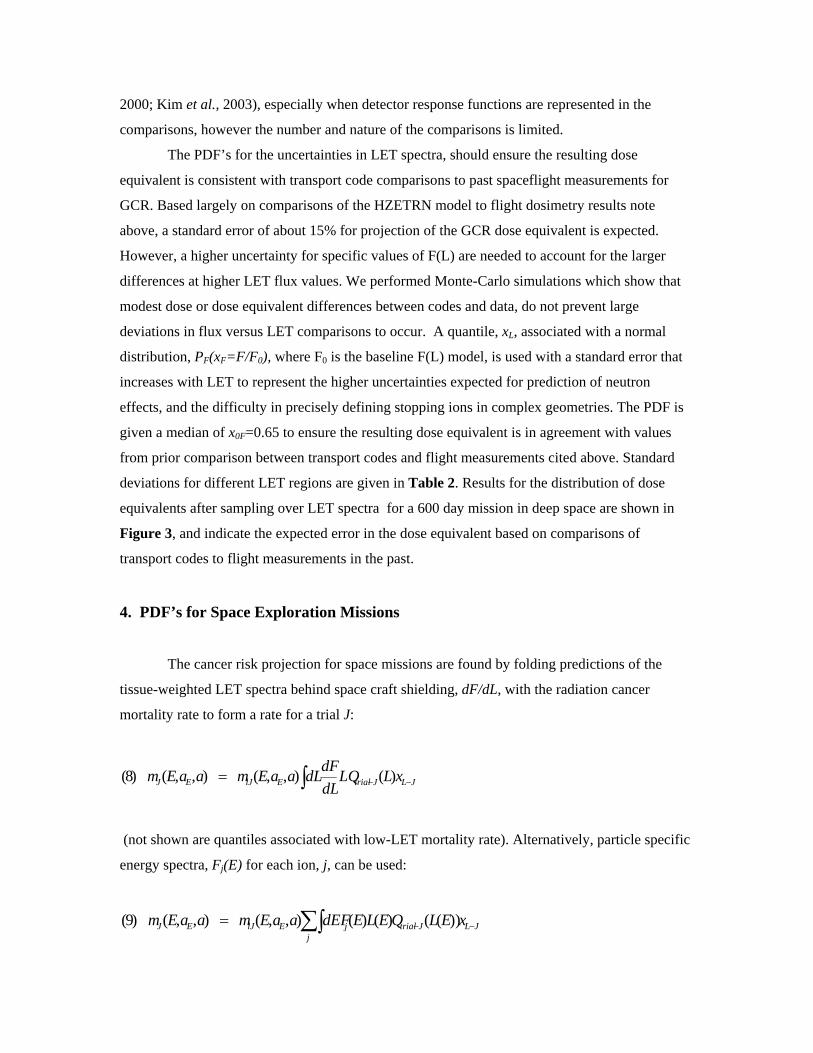
The PDF’s for the uncertainties in LET spectra, should ensure the resulting dose
equivalent is consistent with transport code comparisons to past spaceflight measurements for
GCR. Based largely on comparisons of the HZETRN model to flight dosimetry results note
above, a standard error of about 15% for projection of the GCR dose equivalent is expected.
However, a higher uncertainty for specific values of F(L) are needed to account for the larger
differences at higher LET flux values. We performed Monte-Carlo simulations which show that
modest dose or dose equivalent differences between codes and data, do not prevent large
deviations in flux versus LET comparisons to occur. A quantile, xL, associated with a normal
distribution, PF(xF=F/F0), where F0 is the baseline F(L) model, is used with a standard error that
increases with LET to represent the higher uncertainties expected for prediction of neutron
effects, and the difficulty in precisely defining stopping ions in complex geometries. The PDF is
given a median of x0F=0.65 to ensure the resulting dose equivalent is in agreement with values
from prior comparison between transport codes and flight measurements cited above. Standard
deviations for different LET regions are given in Table 2. Results for the distribution of dose
equivalents after sampling over LET spectra for a 600 day mission in deep space are shown in
Figure 3, and indicate the expected error in the dose equivalent based on comparisons of
transport codes to flight measurements in the past.
4. PDF’s for Space Exploration Missions
The cancer risk projection for space missions are found by folding predictions of the
tissue-weighted LET spectra behind space craft shielding, dF/dL, with the radiation cancer
mortality rate to form a rate for a trial J:
∫ −−= JLJtrialElJEJ xLLQdLdFdLaaEmaaEm )(),,(),,()8(
(not shown are quantiles associated with low-LET mortality rate). Alternatively, particle specific
energy spectra, Fj(E) for each ion, j, can be used:
∑∫ −−=j
JLJtrialjElJEJ xELQELEdEFaaEmaaEm ))(()()(),,(),,()9(
The result of equation (8) or (9) is then inserted into the expression for the REID of equation (4).
In implementing a numerical procedure, we group the PDF’s related to the risk coefficient of the
normal form, which consist of the dosimetry, bias, and statistical uncertainties into a combined
PDF, Pcmb(x). After accumulating sufficient trials (~105), the results for the REID estimates are
binned and the median values and confidence intervals found.
We use the χ2 test for determining if PDF’s for two distinct shielding configurations or
materials are significantly different. We denote the calculated PDF’s for a REID of Ri for two
configurations or materials as p1(Ri) and p2(Ri), respectively. Each p(Ri) follows a Poisson
distribution with variance, )( iRp . The chi-squared, χ2 test for characterizing the dispersion
between the two distributions is then,
∑+
−=
n nn
nn
RpRp
RpRp
)()(
)]()([)10(
22
21
2212χ
Once χ2 is determined, the probability P(n,χ2) that the two distributions are the same is
calculated. If χ2 is sufficiently large such that P(n,χ2) is less than about 20%, is an indication that
we can conclude that the two distributions lead to distinct cancer risks from GCR and/or SPE’s,
with the material with the lowest mean and upper 95% CL values preferred for radiation
protection. However, the opposite result indicates that the either the materials are approximately
the same, or that the uncertainties in risk models prevents us from concluding that either
configuration or material is superior for radiation protection properties. We evaluate χ2 for the
LET dependent parts of the uncertainties (quality factors and physics) separately, since only these
contributions explicitly depend on the modification of radiation fields by shielding.
5. Results
In the results described next we use values of ERR and EAR for solid cancers from the
Japanese Longitudinal Lifespan Study Report No. 13 (Preston et al., 2003). Note that these values
for females were found to about 15% lower than the prior Report No. 12 (Pierce et al., 1996) used
by NCRP Report No. 132 (NCRP, 2000) and values for males nearly the same in Reports 12 and
13. Values for ERR and EAR for leukemia were not updated in the latest report and we use the
values from Pierce et al. (1996). We use life-tables (CDC, 2000) and background cancer
mortality rates (SEER, 2000) for the average US population for the year 2000. For models we use
the GCR free space environment of Badhwar et al. (1994b), the HZETRN transport code (Wilson
et al., 1991, 1995), and the QMSFRG model of nuclear fragmentation cross-sections (Cucinotta
et al., 2003). The CAMERA model (Billings and Yucker, 1973) is used for organ shielding with
tissue weighting coefficients (NCRP, 2000). Figure 4 shows calculations of the point dose
equivalent and the effective dose (tissue averaged organ dose equivalent) for various shielding
materials calculated by the HZETRN/BRYNTRN codes for the solar minimum GCR
environment and the August of 1972 SPE. Calculations predict that the effects of SPE are readily
mitigated by shielding, the effects of GCR are not, and tissue shielding reduces the differences
expected when comparing materials. For hydrogen shielding, the GCR effective dose is larger
than the point dose because target fragments in tissue contribute about 50% of the effective dose,
even though very little secondary radiation is produced directly in the hydrogen shield. Clearly,
calculations or measurements of point dose equivalents mis-represent the effectiveness of
shielding because of the role of secondary radiation produced in tissue. For calculations, we use
5, 10, and 20 g/cm2 as representative of minimal or average shields.
Figure 5 shows calculations for the point estimate and 95% CI’s for risk versus LET for
males exposed at age 40 y. The top panel shows risks at an absorbed dose of 0.01 Gy and the
bottom panel at 0.1 Gy. The solid squares are the resulting “fold-uncertainty” defined as the ratio
of the 95% CL to the point estimate. At high LET, a 5-fold uncertainty occurs at low absorbed
dose, however at higher absorbed dose and near the peak LET effectiveness, the uncertainties are
reduced to about 3-fold due to competing causes of death limiting the upper levels of risk from
radiation.
The variation of GCR and SPE over the solar cycle would be difficult to use as a trade
variable in long-term planning and we therefore discuss calculations at solar minimum and near
solar maximum. For solar maximum calculations, we assume the large solar particle event (SPE)
of August, 1972 to occur during the inter-planetary part of the mission, and use a solar
modulation parameter (Badhwar et al., 1994) of 1100 MV, typical of about two years past solar
maximum, however when large SPE’s often occur. We use a 16 g/cm2 vertical height for the
Mars CO2 atmosphere in our calculations. Table 3 shows fatal cancer risk projections at solar
minimum for males and females of age 40 at the time of the mission. Cancer morbidity risks are
about 50% higher than mortality risks described here. Calculations are made for minimally
shielded spacecraft of 5 g/cm2 aluminum, and a heavily shielded one of 20 g/cm2. Similar
calculations near solar maximum are shown in Table 4 with an SPE fluence equivalent to the
August of 1972 SPE is assumed to have occurred. At solar minimum, it is seen that a four-fold
addition of mass reduces the cancer risk by only about 15%. Results are different at solar
maximum. Here a four-fold increase in shielding mass leads to more than two-fold reduction in
cancer risk; solar protons are less penetrating than GCR and effectively mitigated by shielding.
However for heavy shielding ( g/cm2), GCR dominates over SPE’s and further addition of
shielding provides marginal reductions. Each SPE is unique and has distinct fluence and energy
spectra, and dose rates, therefore the shielding thickness where GCR doses exceed SPE doses
vary from event to event.
20≥
An alternative to a shielding approach that adds mass is to optimize materials used in
spacecraft structures or planetary habitats to reduce radiation risk. Figure 6 shows PDF’s for the
GCR as solar minimum for aluminum, polyethylene, and liquid hydrogen shielding with areal
density of 20 g/cm2. Table 5 shows results for the χ2 statistic comparing polyethylene and
hydrogen shielding effectiveness to aluminum. For calculations that ignore the low LET risk
coefficient uncertainties, near solar maximum with a large SPE, significant results (P<0.01) are
found for liquid hydrogen, and for the GCR at solar minimum (with P<0.15). We conclude that
because of the modest differences between polyethylene and aluminum as GCR absorbers, and
the large radiobiological uncertainties in cancer risk projection models, the benefits of
polyethylene compared to aluminum shielding for GCR can not be proven at this time. A key
factor in these results is that although aluminum is a greater producer of secondary radiation
compared to polyethylene, tissue shielding “equalizes” much of these differences.
The formalism can be applied to estimate the number of days a mission is ensured to be
below an exposure limit at a given confidence level. Because we use the REID quantity, and the
newer LSS Report 13 (Preston et al., 2003) values for ELR and EAR compared to the NCRP
Report 132 (NCRP, 2000), and consider limits for single missions rather than 10-year careers, we
first calculated dose limits that result for the present model corresponding to 3% and 5% fatal
cancer risk for missions of length < 3 yr. These are listed in Table 6, which also shows
calculations of loss of life-expectancy (LLE) from radiation cancer induced cancers. In an earlier
report (Cucinotta, et al. 2000b) we estimated the maximum number of days in deep space
astronauts could spend with a 95% CL to remain below a 3% fatal cancer risk. Table 7 updates
these calculations and compares to the earlier report. The results show a significant increase in the
number of “safe” days with 95% CL to remain below acceptable levels or risk that result from our
improved methodology. However, the results are well short of that needed for a Mars mission.
6. Discussion
The building of PDF’s that propagate errors from individual factors that contribute to
uncertainties in projection models is a powerful tool for managing radiation risks, including
evaluating benefits of research and mitigation approaches and implementing the radiation
protection principle of as low as reasonable achievable (ALARA). The uncertainties estimated
here are reduced compared to our previous estimates (Cucinotta et al., 2001b, 2002, 2004) for the
following reasons:
1. Use of the REID rather than radiation cancer rates (decreases upper uncertainty level
because of role of competing risks)
2. Use of trial Q(L) functions rather than uncorrelated uncertainties as a function of LET
(overall decrease in uncertainties)
3. Neglect of NCRP “unknown” uncertainties (decrease in uncertainties)
4. Re-defining LET-spectra uncertainties (modest increase in uncertainties).
However, these estimates should be viewed as preliminary because of the need to assess
additional uncertainties that have not been included in the analysis, including protraction effects,
scaling of ERR’s or EAR’s estimated from low LET data to high LET’s, and the potential impact
of a healthy worker effect. These factors will need to be considered in future work. Low-LET
epidemiology data and physics models uncertainties have a smaller role in the present evaluation.
As noted in our earlier report (Cucinotta et al., 2001b), other uncertainties exist in the
representation of radiation shielding composition and predicting future solar cycle effects or the
characteristics of SPE’s; however these are more practical in nature and will be considered
elsewhere.
The methodologies used for risk assessment ultimately play a large role in the estimates
of uncertainties and shielding effectiveness. The use of the linear-additivity model is a key
assumption in the current methodology. This model has a strong basis in mouse carcinogenesis
studies with low dose neutron irradiations (Storer and Fry, 1995), and for neutron exposures, a
mixed low and high-LET field is present due to the gamma-rays produced by neutrons. Possible
deviations from the linear-additivity model for the GCR spectrum along with correlations in
estimates of DDREF, protraction effects and quality factors need to be considered in future work.
Experiments that simulate the constant high-energy proton background with interspersed heavy
nuclei irradiation such as iron would be a first-step in testing these effects. Further investigation
of alternative methodologies that could possibly reduce uncertainty estimates should also be
considered. However, the need for new biological data and understanding is the most important
approach to reducing uncertainties.
We have not made an estimate of the uncertainties based on radiation quality
effects related to latency, time after exposure, or exposure protraction. The model of
Eq.’s (1)-(5) assumes implicitly that these factors are independent of radiation quality.
For low dose-rate and protracted proton and HZE radiation exposure of more than a few
months, new biological factors may influence risk assessments including redistribution in
the cell cycle, repopulation, or promotional effects, especially when particle fluences are
large enough to lead to multiple hits of target cells or surrounding cells and tissue
environments. Also, not only is there no human data for protons and HZE ions, there is
very little experimental data at low dose-rates for these particles. Experimental data for
protracted proton or heavy ion irradiation in experimental models of carcinogenesis is
almost non-existent. Burns et al. (1994) found split doses of argon ions separated by a
few hours up to one-day increased the risk of skin cancer in rats. Alpen et al. (1994)
found using seven two-week fractions of 0.07 Gy of iron an increase in risk of 50%
compared to a single acute dose of 0.4 Gy for Harderian gland tumors in mice. A study
of chromosomal aberrations in human lymphocytes (George et al., 2001) for acute and
low dose-rates (0.08 Gy/hr) with 250 MeV protons, showed less sparring than found for
gamma-rays. The Skyhook study of Ainsworth et al. (1986) considered life-shortening in
mice comparing single acute with weekly fractions of several ions, however the results
were unclear with regards to any increase or decrease in risk. For gamma-rays and
neutrons, a good number of studies for cancer induction or life-shortening in mice exists,
showing sparring effects for gamma-rays, and that neutron effects may be increased due
to protraction under certain conditions in some tissues (Ullrich, 1984; NCRP, 1990).
Important questions related to the differences in life-span, cell turn-over rates, or
mechanisms of initiation or promotion in humans and mice, make estimates of the effects
of protraction on risk difficult. Data on tumors or genomic instability in mice with
neutrons (Ullrich et al., 1984; 1998; NCRP, 1990) and the studies of rat or mammary
carcinogenesis with HZE nuclei (Burns, et al., 1994; Dicello et al., 2004), suggest that
the latency time is appreciably reduced for high LET compared to low LET radiation. In
the model described above, a radiation quality dependent latency is more important in the
additive transfer model than the multiplicative transfer model, especially at younger ages
of exposure.
Career radiation limits and shielding requirements could also be impacted by new
knowledge of fatal non-cancer risks from radiation exposure such as heart disease (Preston et al.,
2003; Howe et al., 2004; Yang et al., 1982) or damage to the central nervous system (CNS).
Based on the Japanese survivor data (Preston et al., 2003), non-cancer risks are estimated to be
small for the shorter lunar missions, but could lead to a significant risk for the Mars mission. The
risk of heart disease for ions is largely unknown because only one report (considered a pilot study
by the authors of the report) has been made on the effects of HZE ions on heart disease (Yang et
al., 1982), and human data for low LET radiation at low dose-rates is inconclusive on the level of
risk to be expected (Howe et al., 2004; Cardis et al., 1995). CNS risks have the potential to
impact both short-term and career radiation limits and mitigation approaches (NRC, 1996).
We have shown that with regard to the GCR, the optimization of material selection and
mass can not be put on a sound scientific basis because the reductions estimated from point
estimates alone are only on the order of a 10-30% for most shielding materials, and when
combined with the uncertainties in projection models non-significant results for risk reduction are
found. It still may be reasonable to assume that risk is reduced when comparing hydro-carbon
shields to aluminum or other metals, however application of ALARA is problematic since cost-
benefit analysis can not be properly performed under these conditions. In contrast, for acute risks,
which are largely an absorbed dose and dose-rate effect, SPE’s are the major concern and the role
of minimizing mass requirements through hyrdo-carbon shielding materials is easier to prove.
The ALARA principle is an important aspect of radiation safety. Our estimate of 95%
CL’s to stay below limits can be used as criteria for a minimal ALARA requirement for the
design of lunar missions including transfer vehicle or surface habitat designs. For example about
a 4-fold margin can be used for GCR exposures and about a 2.5 fold margin for SPE’s. Detailed
cost-benefit analysis should be used for measures that would provide even lower risks. Future
work should consider a worst-case SPE environment including the possibility of multiple SPE’s
as a function of mission duration. Based on the results of Table 7 and the above margins, we
conclude that “blind selection” of astronauts for lunar missions can be made for missions with
duration less than 120 days for male or female astronauts above the age of 35-yrs, if sufficient
protection against SPE’s is provided. Because of the higher GCR risks for the longer Mars
missions or perhaps long-term lunar missions, and the likely impacts of non-cancer risks, no
conclusions on ALARA goals for these missions or the possibility of “blind selection” can be
made at this time. The inherent uncertainties in population based risk models and the higher risks;
point to the likelihood that individual based risk assessments will be needed for Mars exploration
missions.
Acknowledgement
We note our appreciation for useful discussions with Dr. Walter Schimmerling
References Ainsworth, E.J., 1986. Early and Late Mammalian Responses to Heavy Charged Particles. Adv. in Space Res. 6, 153-162. Alpen, E.L., Powers-Risius, P, Curtis, S.B., and DeGuzman, R., 1993. Tumorigenic Potential of High-Z, High-LET Charged Particle Radiations. Radiat. Res. 88, 132-143. Alpen, E.L., Powers-Risius, P., Curtis, S.B., DeGuzman, R., and Fry, R.J.M., 1994. Fluence-Based Relative Biological Effectiveness for Charged Particle Carcinogenesis in Mouse Harderian Gland. Adv. Space. Res. 14(10), 573-581. Badhwar, G.D., and O’Neill, P.M., 1994a. Long-term Modulation of Galactic Cosmic Radiation and Its Model for Space Exploration. Adv. Space. Res. 14(10), 749-757. Badhwar, G.D., Cucinotta, F.A., and O'Neill, P.M., 1994b. An Analysis of Interplanetary Space Radiation Exposure for Various Solar Cycles. Radiat. Res. 138, 201-208. Badhwar, G.D, 1997. Spaceflight Validation of Material Shielding Properties. In: NASA Workshop on Shielding Strategies for Human Space Exploration. Eds. Wilson, J.W., Miller, J., Konradi, A., and Cucinotta, F.A. NASA-CP-1997-3360. Badhwar, G.D., Cucinotta, F.A., 2000. A Comparison of Depth Dependence of Dose and Linear Energy Transfer Spectra in Aluminum and Polyethylene. Radiat. Res. 153, 1-8. Belli M., Cera F., Cherubini, R., Haque, A.M.I., Ianzini, F., Moschini, G., Sapora, O., Simone, G. Tabocchini, M.A., Tiverton, P., 1993. Inactivation and Mutation Induction In V79 Cells by Low Energy Protons: Re-evaluation of the results at the LNL facility. Int. J. Radiat. Biol. 63, 331-337. Benton E.R., Benton, E.V., and Frank, A.L., 2002. Passive Dosimetry Aboard the Mir Orbital Station: Internal Measurements. Radiat. Meas. 35, 439-456.
Billings, M.P., Yucker, W.R., and Heckman, B.R., 1973. Body Self-Shielding Data Analysis, McDonald Douglas Astronautics Company West, MDC-G4131. Bunger, B.M., Cook, J.R., and Barrick, M.K., 1981. Life Table Methodology for Evaluating Radiation Risk: An Application Based On Occupational Exposures. Health Phys. 40, 439-455. Burns F., Yin Y., Garte, S.J., and Hosselet, S., 1994. Estimation of Risk Based on Multiple Events in Radiation Carcinogenesis of Rat Skin. Adv. Space Res. 14, 507-519. Cardis, E., Gilbert, E.S., Carpenter, L. Howe, G. Kato, I., Armstrong, B.K. Beral, V. Cowper, G. Douglas, A. Fix, J. Fry, S.A., Kaldor, J., Lavé, C. Salmon, L., Smith, P.G. Voelz, G.L. and Wiggs, L.D., 1995. Effects of Low Doses and Dose-Rates of External Ionizing Radiation: Cancer Mortality Among Nuclear Industry Workers In Three Countries. Radiat. Res. 142, 117-132. Center for Disease Control (CDC) National Vital Statistics Report, Vol. 51, No. 3, US Life Tables, 2000, 2002. Committee on the Biological Effect of Ionizing Radiation (BEIR) BEIR V, 1994. Cox, R., and Masson, W.K., 1979. Mutation and Inactivation of Cultured Mammalian Cells Exposed To Beams of Accelerated Heavy Ions. Int. J. Radiat. Biol. 36, 149-160. Cucinotta, F.A., Wilson J.W., Shavers M.R., and Katz, R., 1996. Effects of Track Structure and Cell Inactivation on the Calculation of Heavy Ion Mutation Rates in Mammalian Cells. Int. J. Radiat. Biol. 69, 593-600. Cucinotta, F.A., Wilson, J.W., Shinn, J.L., and Tripathi, R.K., 1998a. Assessment and Requirements of Nuclear Reaction Data Bases for GCR Transport in the Atmosphere and Structures. Adv. in Space. Res. 21, 1753-1762. Cucinotta, F.A., Nikjoo, H., and Goodhead, D.T., 1998b. The Effects of Delta Rays on The Number of Particle-Track Traversals per Cell in Laboratory and Space Exposures. Radiat. Res. 150, 115-119. Cucinotta, F.A., Wilson, J.W., Williams, J.R., and Dicello, J.F., 2000. Analysis Of Mir-18 Results for Physical And Biological Dosimetry: Radiation Shielding Effectiveness In LEO. Radiat. Meas. 31.
Cucinotta, F.A., Manuel, F., Jones, J., Izsard G., Murray, J., Djojonegoro B., and Wear M., 2001a. Space Radiation and Cataracts in Astronauts. Radiat. Res. 156, 460-466.
Cucinotta, F.A., Schimmerling, W., Wilson, J.W., Peterson, L.E., Saganti, P., Badhwar, G.D., and Dicello, J.F., 2001b. Space Radiation Cancer Risks and Uncertainties for Mars Missions. Radiat. Res. 156, 682-688. Cucinotta, F.A., Badhwar, G.D., Saganti, P., Schimmerling, W., Wilson, J.W., Peterson, L., and Dicello, J., 2002. Space Radiation Cancer Risk Projections for Exploration Missions, Uncertainty Reduction and Mitigation. NASA TP-2002-210777. Cucinotta, F.A., Saganti, P.B., Hu, X., Kim, M-H. Y., Cleghorn, T.F., Wilson, J.W., Tripathi,
R.K., and Zeitlin, C.J., 2003. Physics of the Isotopic Dependence of Galactic Cosmic Ray Fluence Behind Shielding. NASA TP-2003-210792. Cucinotta, F.A., Schimmerling, W., Wilson, J.W., Peterson, L.E., and Saganti, P.B., 2004. Uncertainties In Estimates Of The Risks of Late Effects From Space Radiation. Adv. Space Res. 32, 1383-1389. Dicello, J.F., Cucinotta, F.A., Gridley, D., Mann, J., Moyers, M. F., Novak, G. R., Piantadosi, S., Ricart-Arbona, R., Simonson, D. M., Strandberg, J.D., Vazquez, M., Williams, J.R., Zhang, Y., Zhou, H., and Huso, D., 2004. In vivo Mammary Tumorigenesis in the Sprague–Dawley Rat and Microdosimetric Correlates. Phys. Med. Biol. 49, 3817–3830. Fry, R.J.M., Powers-Risius, P., Alpen, E.L., Ainsworth, E.J., 1985. High LET Radiation Carcinogenesis. Radiat. Res. 104, S188-195. George, K., Willingham, V., Wu, H., Gridley, D., Nelson, G., and Cucinotta, F.A., 2002. Chromosome Aberrations in Human Lymphocytes Induced By 250 MeV Protons: Effects of Dose, Dose Rate and Shielding. Adv. Space Res. 30, 891-899. George, K., Durante, M., Willingham, V., Wu, H., Yang, T., and Cucinotta, F.A., 2003. Biological Effectiveness of Accelerated Particles for the Induction of Chromosome Damage Measured in Metaphase and Interphase Human Lymphocytes. Radiat. Res. 160, 425-435. Howe, G.R., Zablotska, L.B., Fix, J.J., Egel, J, Buchanan, J., 2004. Analysis of the Mortality Experience amongst U.S. Nuclear Power Industry Workers after Chronic Low-Dose Exposure to Ionizing Radiation. Radiat. Res. 162, 517–526. International Commission on Radiation Protection, 2003. ICRR Publication 92, Relative Biological Effectiveness (RBE), Quality Factor (Q), and Radiation Weighting Factor (wR), Pergamon. International Commission on Radiation Units, 1986. The Quality Factor in Radiation Protection, ICRU Report 40, ICRU Publications, Bethesda MD. Katz, R., Ackerson, B., Homayoonfar, M., and Scharma, S.C., 1971. Inactivation of Cells by Heavy Ion Bombardment. Radiat. Res. 47, 402-425. Kawata, T., Durante, M., Furusawa, Y., George, K., Takai, N., Wu, H., and Cucinotta, F.A., 2001. Dose Response of Initial G2-Chromosomal Damage Induced in Normal Human Fibroblasts by High-LET Particles. Int. J. Radiat. Biol. 77, 165-174. Kiefer, J., Stoll, U., Schneider, E., 1994. Mutation Induction by Heavy Ions. Adv. Space Res. 14(10), 257-265. Kim, M.Y., Barber, R.E., Shavers, M.R., Nikjoo, H., and Cucinotta, F.A., 2003. TEPCs Overestimate the Average Quality Factor for Trapped Protons and Underestimate the Average Quality Factor for GCR. Presented at the 14th Annual Space Radiation Health Investigators Workshop. Kronenberg, A., 1994. Mutation Induction in Human Lymphoid Cells by Energetic Heavy Ions. Adv. Space Res. 14(10), 339-346.
Martin, S.G., Miller, R.C., Geard, C.R., Hall, E.J., 1995. The Biological Effectiveness Of Radon-Progeny Alpha Particles. IV. Morphological Transformation of Syrian Hamster Embryo Cells at Low Dose. Radiat. Res. 142, 70-77. Miller, R.C., Marino, S.A., Brenner, D.J., Martin, S.G., Richards, M., Randers-Pehrson, G., Hall, E.J., 1995. The Biological Effectiveness of Radon-Progeny Alpha Particles III. Quality Factors. Radiat. Res. 142, 61-69. National Academy of Sciences, NAS. National Academy of Sciences Space Science Board, Report of the Task Group on the Biological Effects of Space Radiation. Radiation Hazards to Crews on Interplanetary Mission National Academy of Sciences, Washington, D.C., 1996. National Council of Radiation Protection and Measurements, NCRP. Relative Biological Effectiveness of Radiations of Different Quality, NCRP Report 104, Bethesda MD, 1990. National Council on Radiation Protection and Measurements, NCRP. Uncertainties in Fatal Cancer Risk Estimates Used in Radiation Protection, NCRP Report 126, Bethesda MD, 1997. National Council on Radiation Protection and Measurements, NCRP. Recommendations of Dose Limits for Low Earth Orbit. NCRP Report 132, Bethesda MD, 2000. Nelson, G.A., Schubert, W.W., Marshall, T.M., Benton, E.R., Benton, E.V., 1989. Radiation effects in Caenorhabditis Elegans, Mutagenesis by High and Low LET Ionizing Radiation. Mut. Res. 212, 181-192. Nikjoo, H., O’Neill, P., Terrissol, M., and Goodhead, D.T., 1999. Quantitative Modeling of DNA Damage Using Monte Carlo Track Structure Method. Radiat. Envir. Biophys. 38, 31-38.
Nikjoo, H., Khvostunov, I.K., and Cucinotta, F.A., 2002. The Response of (TEPC) Proportional Counters to Heavy Ions. Radiat. Res. 157, 435-445. O’Neill, P., Badhwar, G.D., 2005. Galactic Cosmic Ray Model Update Based on Advanced Composition Explorer (ACE) Spectra from 1997 to Present. Adv. Space Res (in press). Parker, E.N., 1965. The Passage of Energetic Charged Particles Through Interplanetary Space. Planet. Space Sci. 13, 9-49. Pierce, D.A., Shimizu, Y., Preston, D.L., Vaeth, M., and Mabuchi, K., 1996. Studies of the Mortality of The Atomic-Bomb Survivors, Report 12, Part I. Cancer: 1950-1990. Radiat. Res. 146, 1-27. Preston, D.L., Shimizu, Y., Pierce, D.A., Suyumac, A., and Mabuchi, K., 2003. Studies of Mortality of Atomic Bomb Survivors. Report 13: Solid Cancer and Noncancer Disease Mortality: 1950–1997. Radiat. Res. 160, 381-407. SEER, Surveillance, Epidemiology, and End Results: Cancer Statistics Review, 1973-2000. Cancer Surveillance Research Program, National Cancer Institute, Bethesda MD, 2000. Shinn, J.L., Cucinotta, F.A., Simonsen, L.C., Wilson, J.W., Badavi, F.F., Badhwar, G.D.,
Miller, J., Zeitlin, C. R.K., Clowdsley, M.S., Heinbockel, J.H., and Xapsos, M.A., 1998. Validation of a Comprehensive Space Radiation Transport Code. IEEE Nuclear Sci. 45, 2711-2719. Storer, J.B., and Fry, R.J.M., 1995. Limiting Values of RBE of Fission Neutrons at Low Doses for Life-Shortening in Mice. Radiat. Environ. Biophys. 34, 21-27. Ullrich, R.L., 1984. Tumor Induction in BAL/c Mice after Fractionated Neutron or Gamma Irradiation. Radiat. Res. 93, 506-512. Ullrich, R.L., and Ponnaiya B., 1998. Radiation-Induced Instability and Its Relation to Radiation Carcinogenesis. Inter. J. Radiat. Biol. 74, 747-754. Vaeth, M., and Pierce, D.A., 1990. Calculating Excess Lifetime Risk in Relative Risk Models. Environ. Health Per. 87, 83-94. Wilson J.W., Townsend, L.W., Schimmerling, W., Khandelwal, G.S., Khan, F., Nealy, J.E., Cucinotta, F.A., Simonsen, L.C., and Norbury, J.W., 1991. Transport Methods and Interactions for Space Radiations. RP1257, NASA, Washington D.C. Wilson, J. W., Kim, M., Schimmerling, W., Badavi, F. F., Thibeault, S. A., Cucinotta, F. A., Shinn, J. L., and Kiefer, R., 1995. Issues in Space Radiation Protection. Health Phys. 68, 50-58. Yang, V.V., and Ainsworth, E.J., 1982. Late Effects of Heavy Charged Particles on the Fine Structure of the Mouse Coronary Artery. Radiat. Res. 91, 135-144. Yang, T.C., Craise, L.M., Mei, M., and Tobias, C.A., 1989. Neoplastic Transformation by High LET Radiation: Molecular Mechanisms. Adv. Space. Res. 9, 131-140.
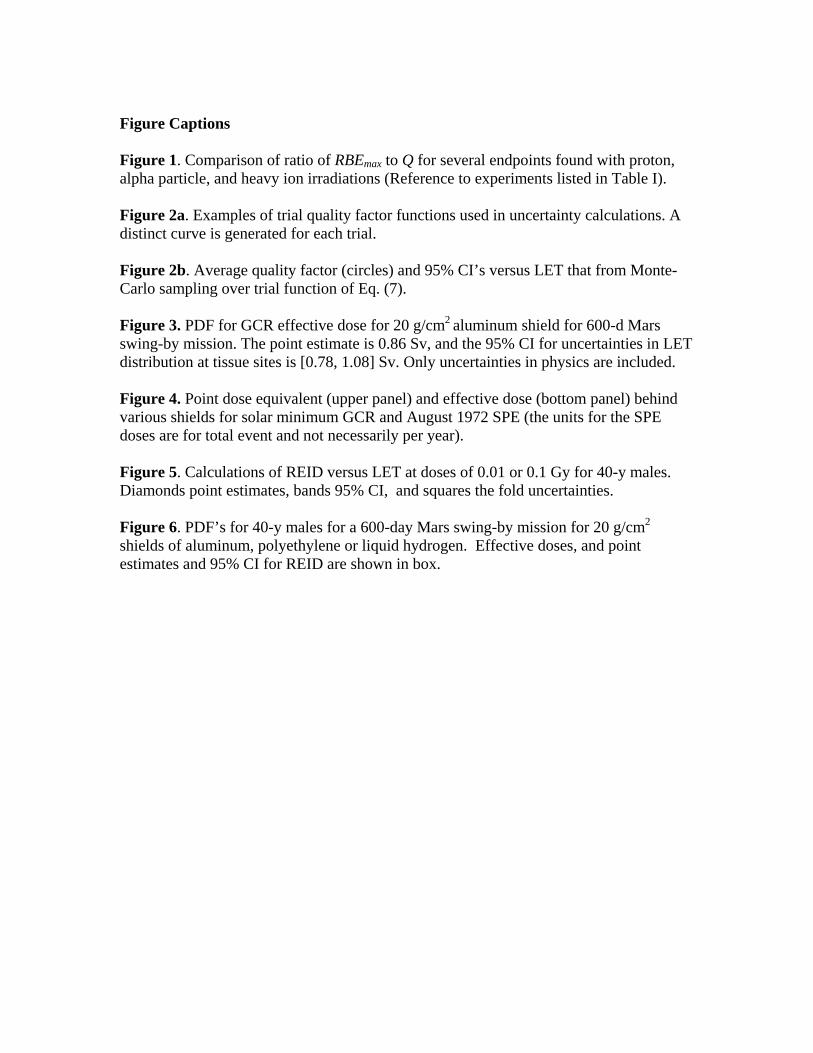
Figure Captions Figure 1. Comparison of ratio of RBEmax to Q for several endpoints found with proton, alpha particle, and heavy ion irradiations (Reference to experiments listed in Table I). Figure 2a. Examples of trial quality factor functions used in uncertainty calculations. A distinct curve is generated for each trial. Figure 2b. Average quality factor (circles) and 95% CI’s versus LET that from Monte-Carlo sampling over trial function of Eq. (7). Figure 3. PDF for GCR effective dose for 20 g/cm2 aluminum shield for 600-d Mars swing-by mission. The point estimate is 0.86 Sv, and the 95% CI for uncertainties in LET distribution at tissue sites is [0.78, 1.08] Sv. Only uncertainties in physics are included. Figure 4. Point dose equivalent (upper panel) and effective dose (bottom panel) behind various shields for solar minimum GCR and August 1972 SPE (the units for the SPE doses are for total event and not necessarily per year). Figure 5. Calculations of REID versus LET at doses of 0.01 or 0.1 Gy for 40-y males. Diamonds point estimates, bands 95% CI, and squares the fold uncertainties. Figure 6. PDF’s for 40-y males for a 600-day Mars swing-by mission for 20 g/cm2 shields of aluminum, polyethylene or liquid hydrogen. Effective doses, and point estimates and 95% CI for REID are shown in box.
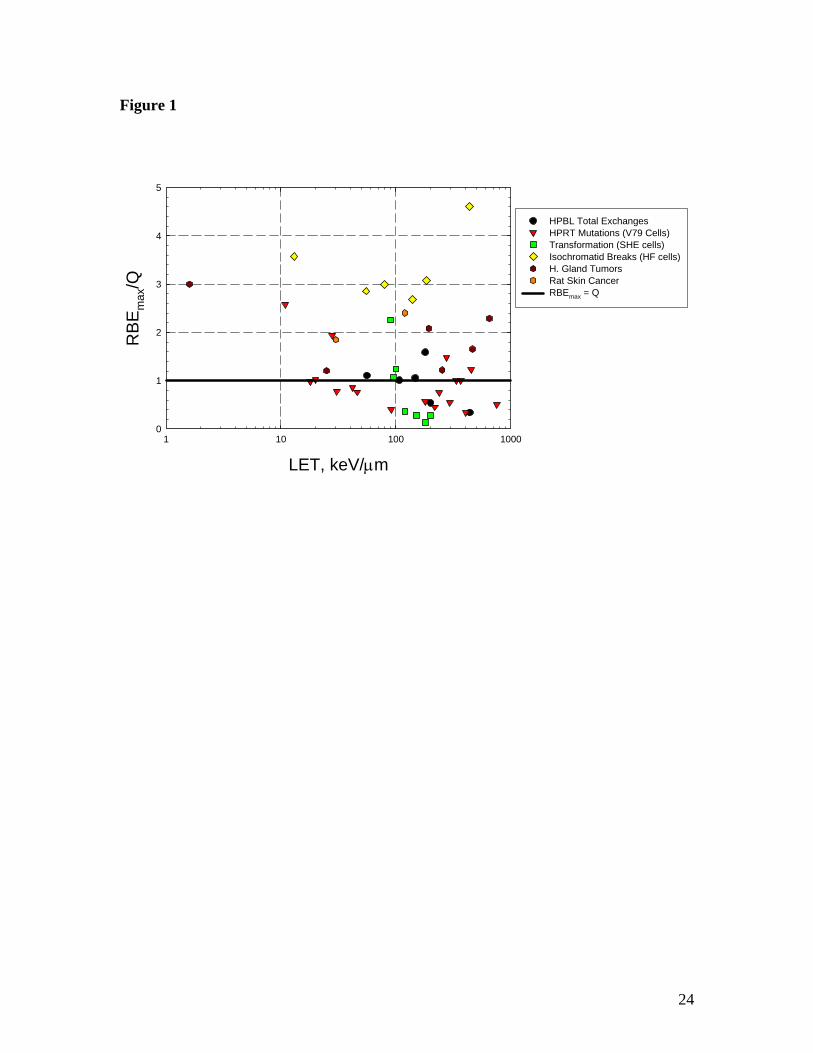
Figure 1
LET, keV/µm1 10 100 1000
RB
Em
ax/Q
0
1
2
3
4
5
HPBL Total ExchangesHPRT Mutations (V79 Cells)Transformation (SHE cells)Isochromatid Breaks (HF cells)H. Gland TumorsRat Skin CancerRBEmax = Q
24
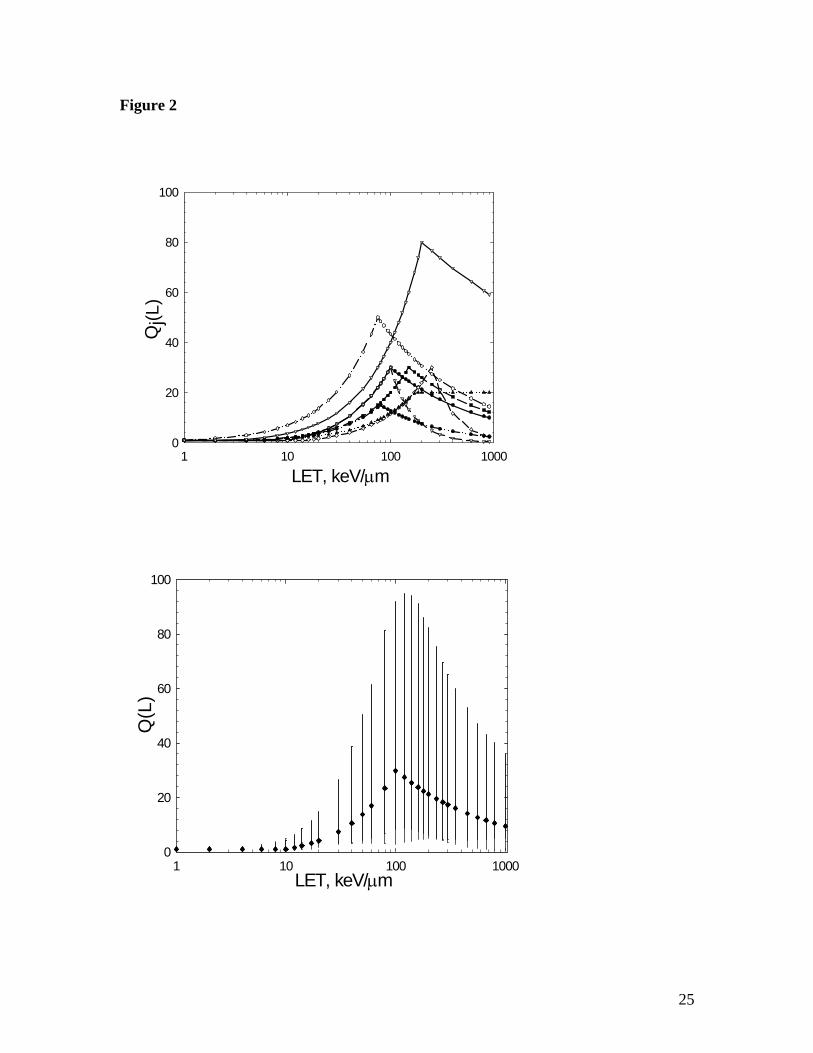
Figure 2
LET, keV/µm1 10 100 1000
Qj(L
)
0
20
40
60
80
100
LET, keV/µm1 10 100 1000
Q(L
)
0
20
40
60
80
100
25
Figure 3
Effective Dose, Sv0.50 0.75 1.00 1.25 1.50
PD
F(E
)
0.000
0.003
0.006
0.009
0.012
0.015
0.018
Monte-Carlo results
26
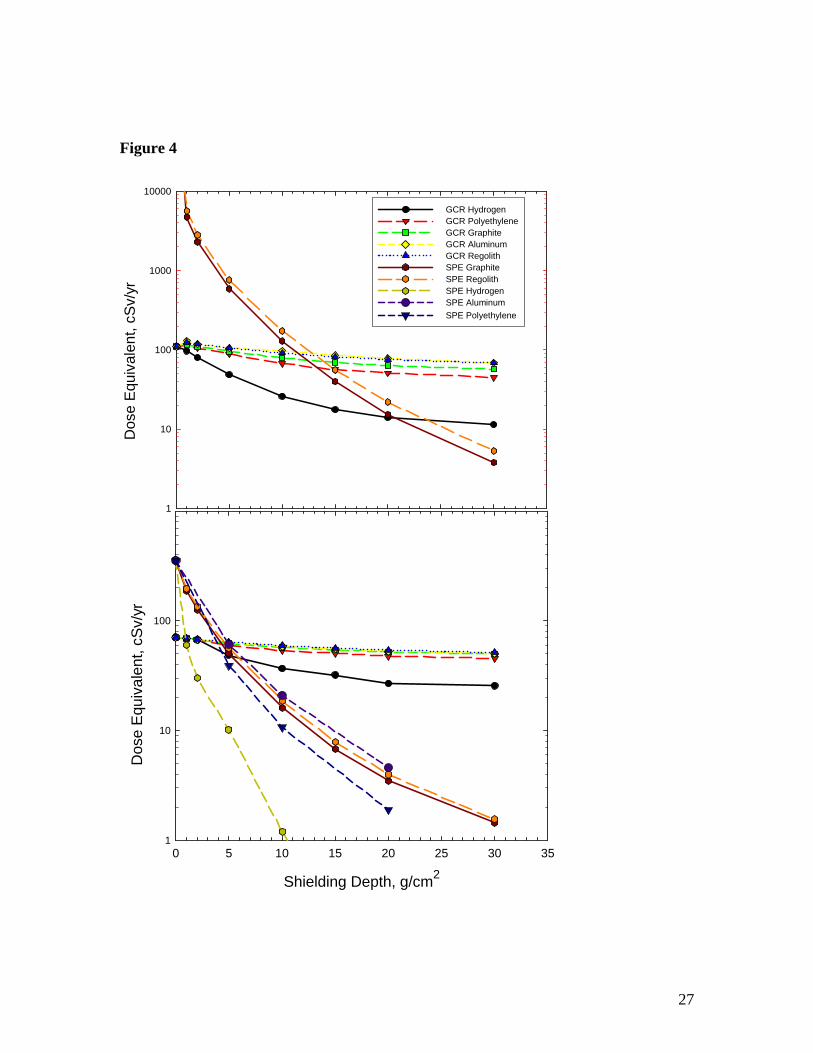
Figure 4
Dos
e E
quiv
alen
t, cS
v/yr
1
10
100
1000
10000
Shielding Depth, g/cm2
0 5 10 15 20 25 30 35
Dos
e E
quiv
alen
t, cS
v/yr
1
10
100
GCR HydrogenGCR PolyethyleneGCR GraphiteGCR AluminumGCR RegolithSPE GraphiteSPE RegolithSPE HydrogenSPE AluminumSPE Polyethylene
27
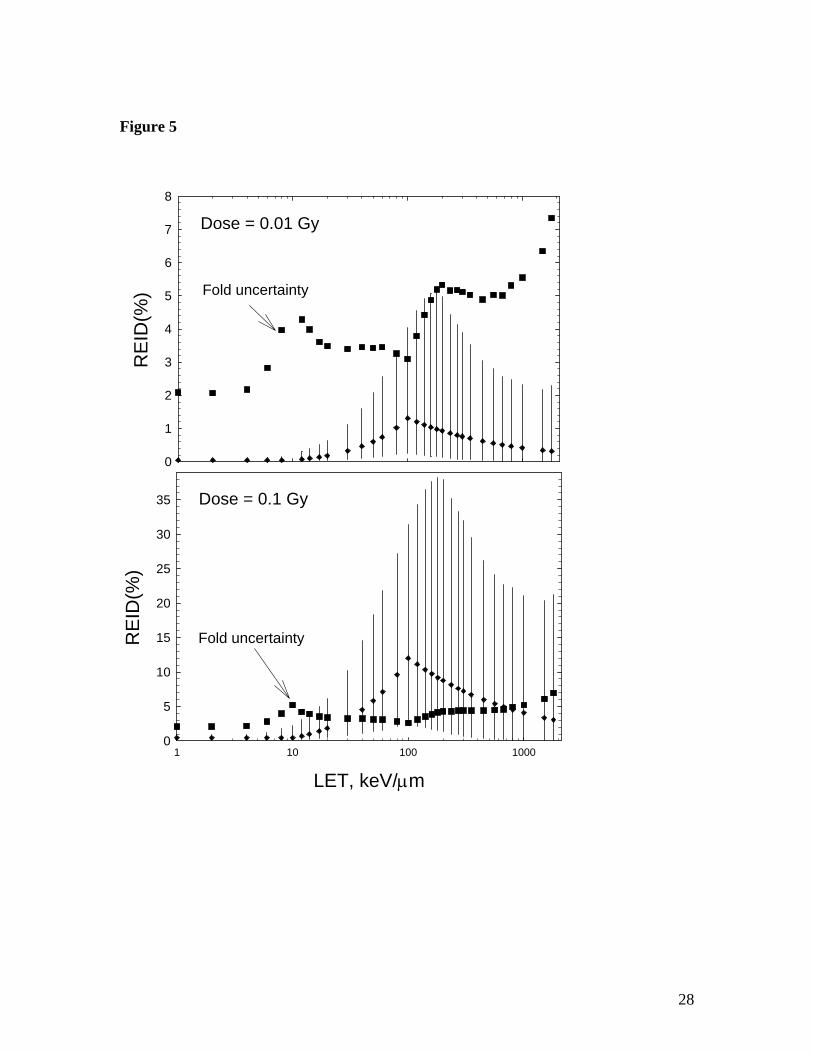
Figure 5
RE
ID(%
)
0
1
2
3
4
5
6
7
8
Fold uncertainty
Dose = 0.01 Gy
LET, keV/µm1 10 100 1000
RE
ID(%
)
0
5
10
15
20
25
30
35
Fold uncertainty
Dose = 0.1 Gy
28
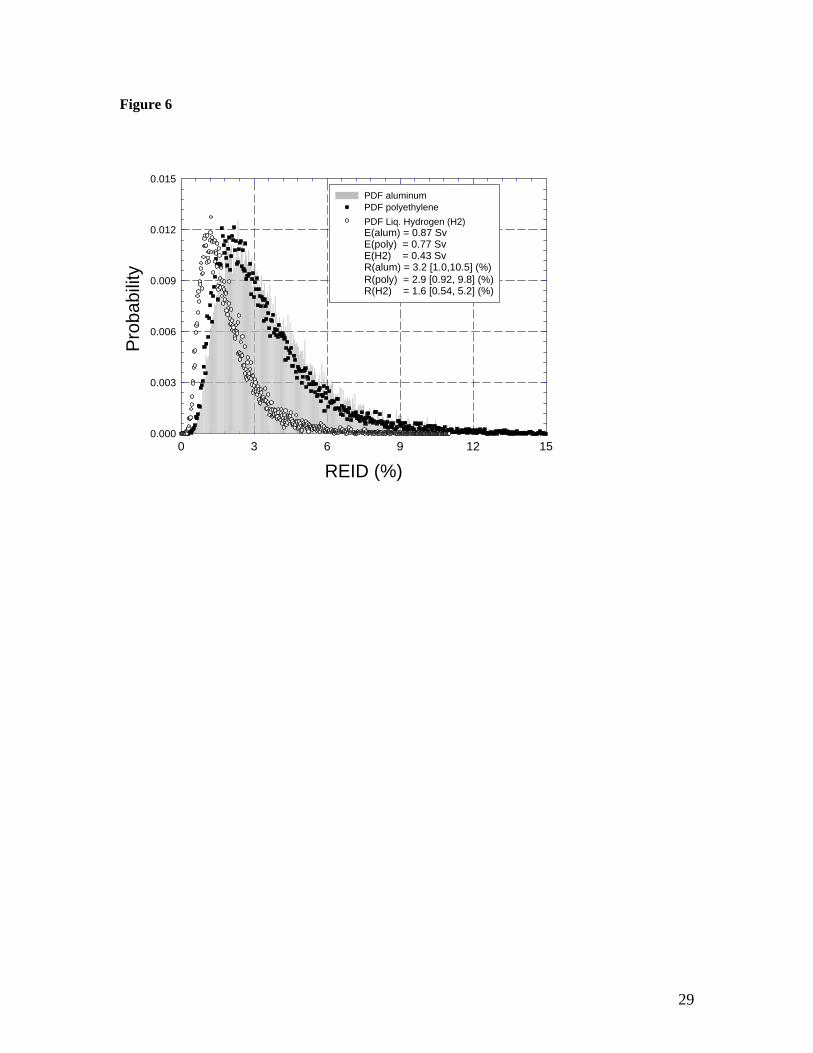
Figure 6
REID (%)0 3 6 9 12 15
Pro
babi
lity
0.000
0.003
0.006
0.009
0.012
0.015PDF aluminumPDF polyethylenePDF Liq. Hydrogen (H2) E(alum) = 0.87 Sv E(poly) = 0.77 SvE(H2) = 0.43 SvR(alum) = 3.2 [1.0,10.5] (%)R(poly) = 2.9 [0.92, 9.8] (%)R(H2) = 1.6 [0.54, 5.2] (%)
29
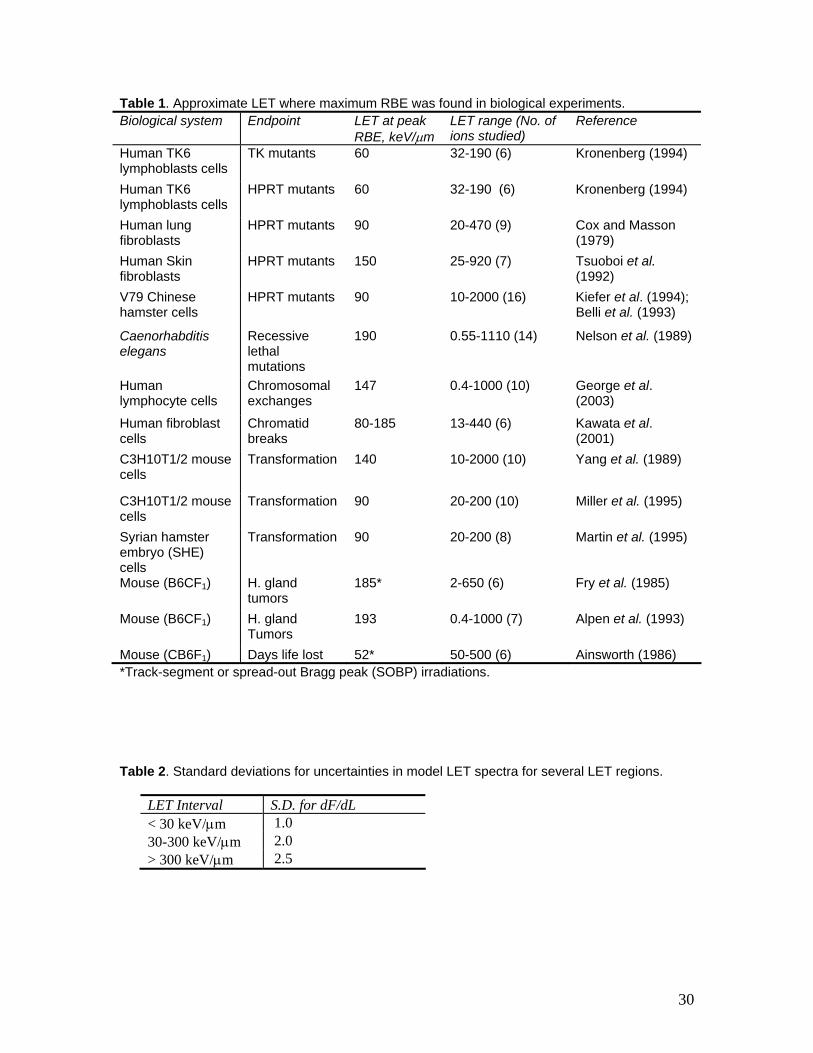
Table 1. Approximate LET where maximum RBE was found in biological experiments. Biological system Endpoint LET at peak
RBE, keV/µm LET range (No. of ions studied)
Reference
Human TK6 lymphoblasts cells
TK mutants 60 32-190 (6) Kronenberg (1994)
Human TK6 lymphoblasts cells
HPRT mutants 60 32-190 (6) Kronenberg (1994)
Human lung fibroblasts
HPRT mutants 90 20-470 (9) Cox and Masson (1979)
Human Skin fibroblasts
HPRT mutants 150 25-920 (7) Tsuoboi et al. (1992)
V79 Chinese hamster cells
HPRT mutants 90 10-2000 (16) Kiefer et al. (1994); Belli et al. (1993)
Caenorhabditis elegans
Recessive lethal mutations
190 0.55-1110 (14) Nelson et al. (1989)
Human lymphocyte cells
Chromosomal exchanges
147 0.4-1000 (10) George et al. (2003)
Human fibroblast cells
Chromatid breaks
80-185 13-440 (6) Kawata et al. (2001)
C3H10T1/2 mouse cells
Transformation 140 10-2000 (10) Yang et al. (1989)
C3H10T1/2 mouse cells
Transformation 90 20-200 (10) Miller et al. (1995)
Syrian hamster embryo (SHE) cells
Transformation 90 20-200 (8) Martin et al. (1995)
Mouse (B6CF1) H. gland tumors
185* 2-650 (6) Fry et al. (1985)
Mouse (B6CF1) H. gland Tumors
193 0.4-1000 (7) Alpen et al. (1993)
Mouse (CB6F1) Days life lost 52* 50-500 (6) Ainsworth (1986) *Track-segment or spread-out Bragg peak (SOBP) irradiations. Table 2. Standard deviations for uncertainties in model LET spectra for several LET regions.
LET Interval S.D. for dF/dL < 30 keV/µm 1.0 30-300 keV/µm 2.0 > 300 keV/µm 2.5
30
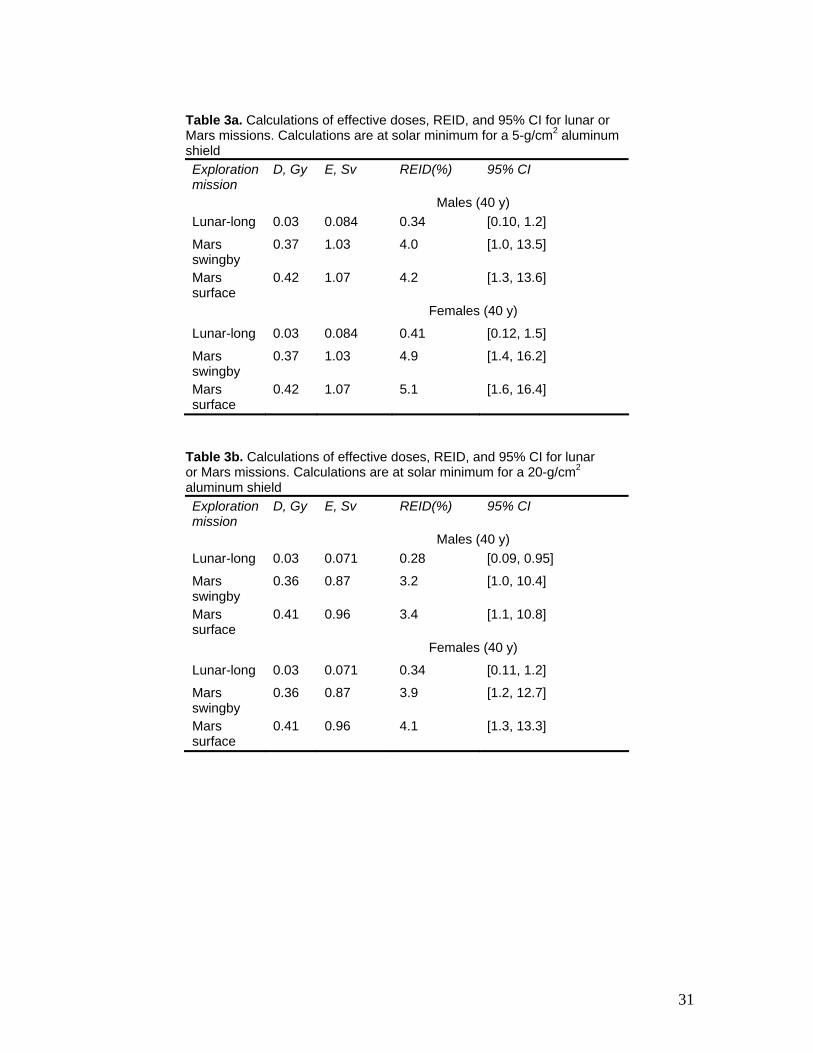
Table 3a. Calculations of effective doses, REID, and 95% CI for lunar or Mars missions. Calculations are at solar minimum for a 5-g/cm2 aluminum shield Exploration mission
D, Gy E, Sv REID(%) 95% CI
Males (40 y) Lunar-long 0.03 0.084 0.34 [0.10, 1.2]
Mars swingby
0.37 1.03 4.0 [1.0, 13.5]
Mars surface
0.42 1.07 4.2 [1.3, 13.6]
Females (40 y)
Lunar-long 0.03 0.084 0.41 [0.12, 1.5]
Mars swingby
0.37 1.03 4.9 [1.4, 16.2]
Mars surface
0.42 1.07 5.1 [1.6, 16.4]
Table 3b. Calculations of effective doses, REID, and 95% CI for lunar or Mars missions. Calculations are at solar minimum for a 20-g/cm2 aluminum shield Exploration mission
D, Gy E, Sv REID(%) 95% CI
Males (40 y) Lunar-long 0.03 0.071 0.28 [0.09, 0.95]
Mars swingby
0.36 0.87 3.2 [1.0, 10.4]
Mars surface
0.41 0.96 3.4 [1.1, 10.8]
Females (40 y)
Lunar-long 0.03 0.071 0.34 [0.11, 1.2]
Mars swingby
0.36 0.87 3.9 [1.2, 12.7]
Mars surface
0.41 0.96 4.1 [1.3, 13.3]
31
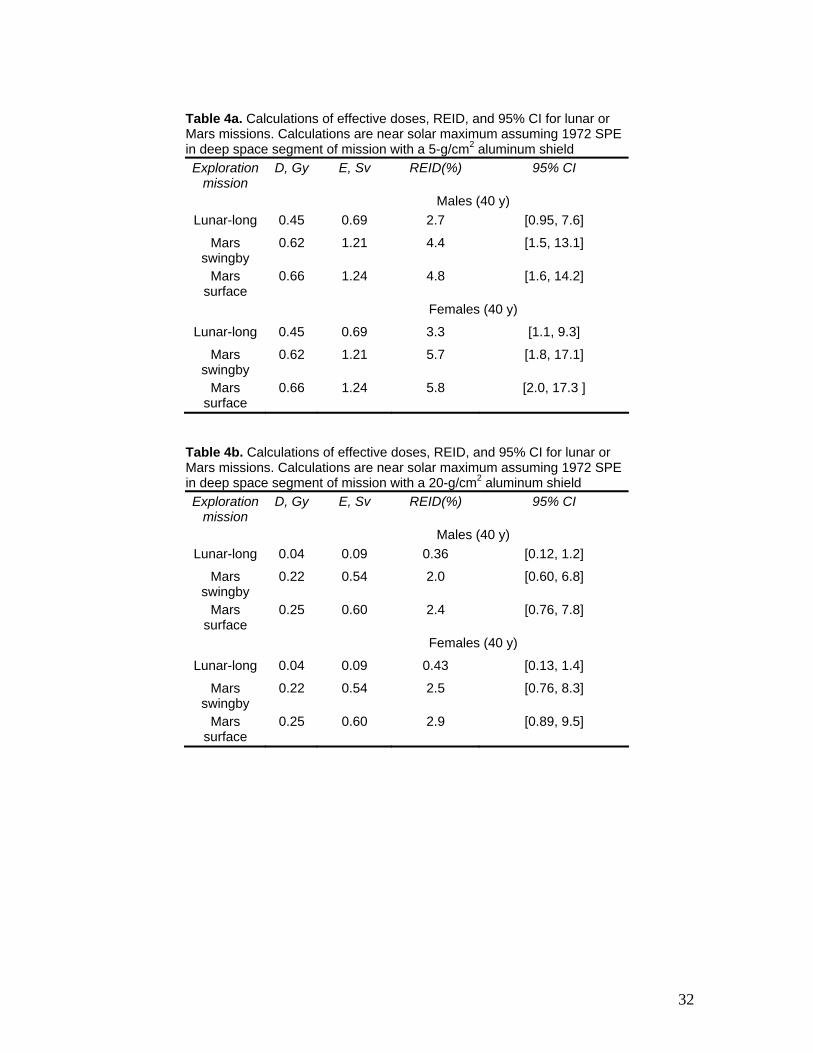
Table 4a. Calculations of effective doses, REID, and 95% CI for lunar or Mars missions. Calculations are near solar maximum assuming 1972 SPE in deep space segment of mission with a 5-g/cm2 aluminum shield Exploration
mission D, Gy E, Sv REID(%) 95% CI
Males (40 y) Lunar-long 0.45 0.69 2.7 [0.95, 7.6]
Mars swingby
0.62 1.21 4.4 [1.5, 13.1]
Mars surface
0.66 1.24 4.8 [1.6, 14.2]
Females (40 y)
Lunar-long 0.45 0.69 3.3 [1.1, 9.3]
Mars swingby
0.62 1.21 5.7 [1.8, 17.1]
Mars surface
0.66 1.24 5.8 [2.0, 17.3 ]
Table 4b. Calculations of effective doses, REID, and 95% CI for lunar or Mars missions. Calculations are near solar maximum assuming 1972 SPE in deep space segment of mission with a 20-g/cm2 aluminum shield Exploration
mission D, Gy E, Sv REID(%) 95% CI
Males (40 y) Lunar-long 0.04 0.09 0.36 [0.12, 1.2]
Mars swingby
0.22 0.54 2.0 [0.60, 6.8]
Mars surface
0.25 0.60 2.4 [0.76, 7.8]
Females (40 y)
Lunar-long 0.04 0.09 0.43 [0.13, 1.4]
Mars swingby
0.22 0.54 2.5 [0.76, 8.3]
Mars surface
0.25 0.60 2.9 [0.89, 9.5]
32
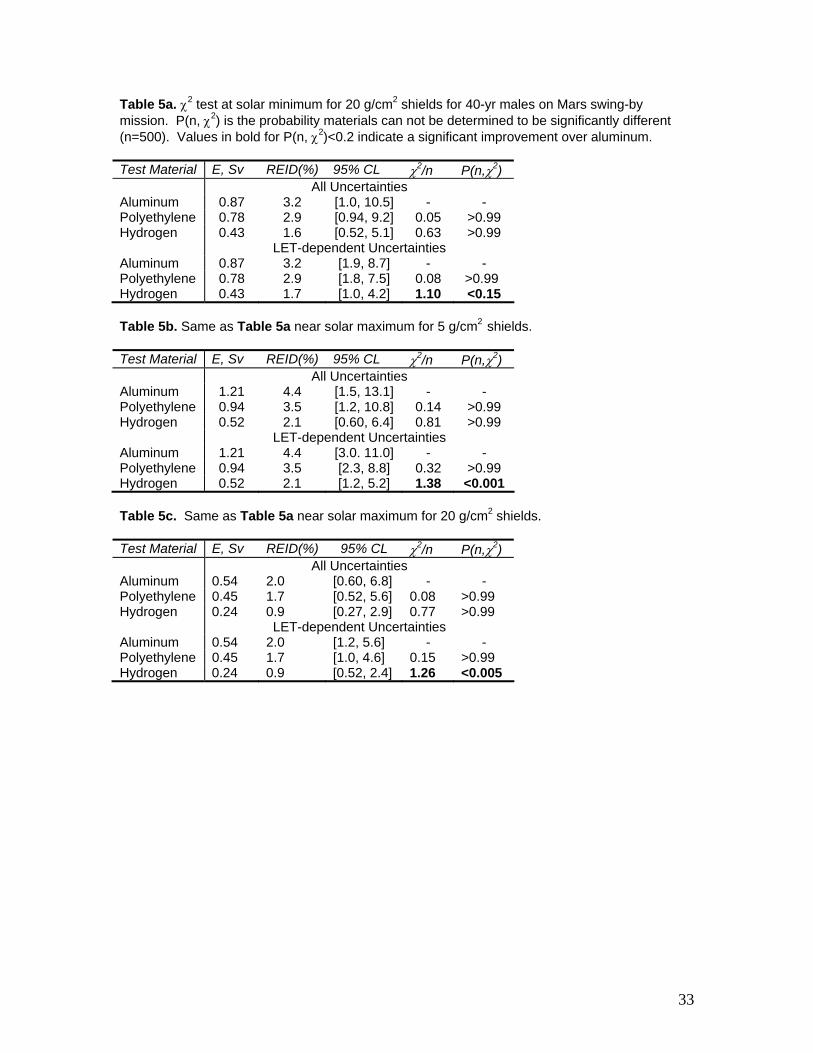
Table 5a. χ2 test at solar minimum for 20 g/cm2 shields for 40-yr males on Mars swing-by mission. P(n, χ2) is the probability materials can not be determined to be significantly different (n=500). Values in bold for P(n, χ2)<0.2 indicate a significant improvement over aluminum. Test Material E, Sv REID(%) 95% CL χ2/n P(n,χ2) All Uncertainties Aluminum 0.87 3.2 [1.0, 10.5] - - Polyethylene 0.78 2.9 [0.94, 9.2] 0.05 >0.99 Hydrogen 0.43 1.6 [0.52, 5.1] 0.63 >0.99 LET-dependent Uncertainties Aluminum 0.87 3.2 [1.9, 8.7] - - Polyethylene 0.78 2.9 [1.8, 7.5] 0.08 >0.99 Hydrogen 0.43 1.7 [1.0, 4.2] 1.10 <0.15 Table 5b. Same as Table 5a near solar maximum for 5 g/cm2 shields. Test Material E, Sv REID(%) 95% CL χ2/n P(n,χ2) All Uncertainties Aluminum 1.21 4.4 [1.5, 13.1] - - Polyethylene 0.94 3.5 [1.2, 10.8] 0.14 >0.99 Hydrogen 0.52 2.1 [0.60, 6.4] 0.81 >0.99 LET-dependent Uncertainties Aluminum 1.21 4.4 [3.0. 11.0] - - Polyethylene 0.94 3.5 [2.3, 8.8] 0.32 >0.99 Hydrogen 0.52 2.1 [1.2, 5.2] 1.38 <0.001 Table 5c. Same as Table 5a near solar maximum for 20 g/cm2 shields. Test Material E, Sv REID(%) 95% CL χ2/n P(n,χ2) All Uncertainties Aluminum 0.54 2.0 [0.60, 6.8] - - Polyethylene 0.45 1.7 [0.52, 5.6] 0.08 >0.99 Hydrogen 0.24 0.9 [0.27, 2.9] 0.77 >0.99 LET-dependent Uncertainties Aluminum 0.54 2.0 [1.2, 5.6] - - Polyethylene 0.45 1.7 [1.0, 4.6] 0.15 >0.99 Hydrogen 0.24 0.9 [0.52, 2.4] 1.26 <0.005
33
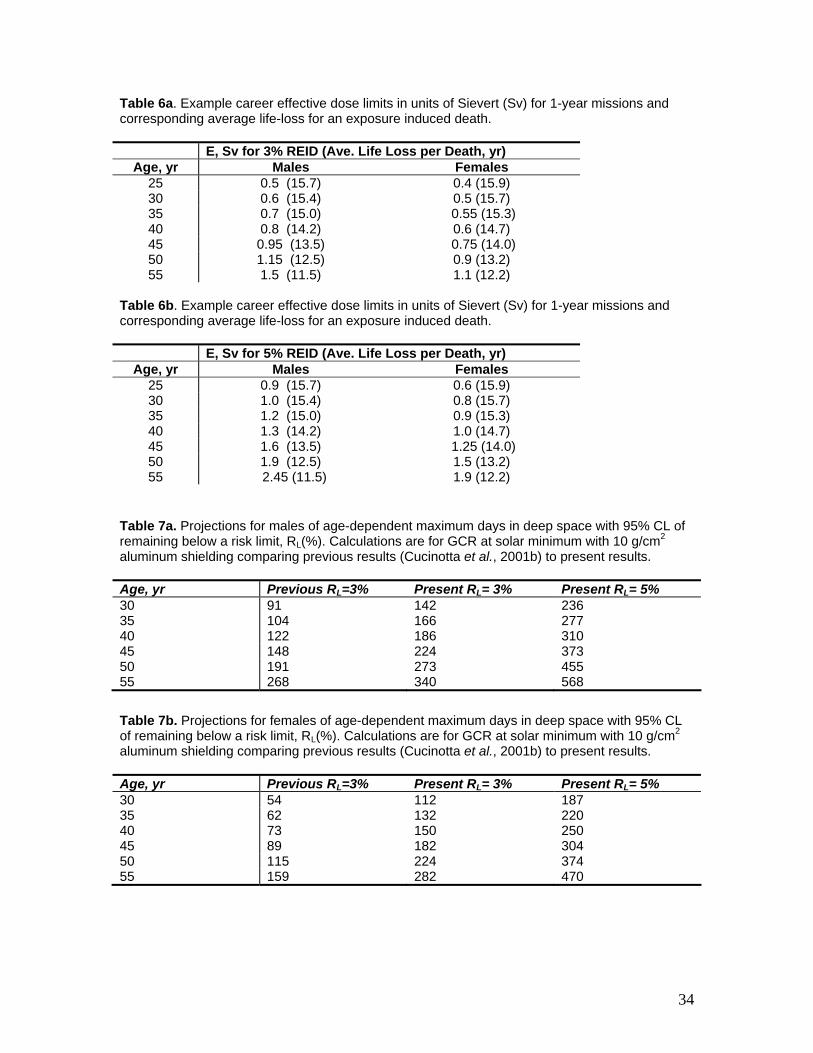
Table 6a. Example career effective dose limits in units of Sievert (Sv) for 1-year missions and corresponding average life-loss for an exposure induced death. E, Sv for 3% REID (Ave. Life Loss per Death, yr)
Age, yr Males Females 25 0.5 (15.7) 0.4 (15.9) 30 0.6 (15.4) 0.5 (15.7) 35 0.7 (15.0) 0.55 (15.3) 40 0.8 (14.2) 0.6 (14.7) 45 0.95 (13.5) 0.75 (14.0) 50 1.15 (12.5) 0.9 (13.2) 55 1.5 (11.5) 1.1 (12.2)
Table 6b. Example career effective dose limits in units of Sievert (Sv) for 1-year missions and corresponding average life-loss for an exposure induced death. E, Sv for 5% REID (Ave. Life Loss per Death, yr)
Age, yr Males Females 25 0.9 (15.7) 0.6 (15.9) 30 1.0 (15.4) 0.8 (15.7) 35 1.2 (15.0) 0.9 (15.3) 40 1.3 (14.2) 1.0 (14.7) 45 1.6 (13.5) 1.25 (14.0) 50 1.9 (12.5) 1.5 (13.2) 55 2.45 (11.5) 1.9 (12.2)
Table 7a. Projections for males of age-dependent maximum days in deep space with 95% CL of remaining below a risk limit, RL(%). Calculations are for GCR at solar minimum with 10 g/cm2 aluminum shielding comparing previous results (Cucinotta et al., 2001b) to present results. Age, yr Previous RL=3% Present RL= 3% Present RL= 5% 30 91 142 236 35 104 166 277 40 122 186 310 45 148 224 373 50 191 273 455 55 268 340 568
Table 7b. Projections for females of age-dependent maximum days in deep space with 95% CL of remaining below a risk limit, RL(%). Calculations are for GCR at solar minimum with 10 g/cm2 aluminum shielding comparing previous results (Cucinotta et al., 2001b) to present results. Age, yr Previous RL=3% Present RL= 3% Present RL= 5% 30 54 112 187 35 62 132 220 40 73 150 250 45 89 182 304 50 115 224 374 55 159 282 470
34
Related Documents